 Noelline Tsafack
 Paulo A. V. Borges
 Yingzhong Xie1
 Xinpu Wang
- 1School of Agriculture, Ningxia University, Yinchuan, China
- 2cE3c-Centre for Ecology, Evolution and Environmental Changes/Azorean Biodiversity Group, Faculdade de Ciências e Engenharia do Ambiente, Universidade dos Açores, Angra do Heroísmo, Portugal
- 3Department of Life, Health and Environmental Sciences, University of L’Aquila, L’Aquila, Italy
Species abundance distributions (SADs) are increasingly used to investigate how species community structure changes in response to environmental variations. SAD models depict the relative abundance of species recorded in a community and express fundamental aspects of the community structure, namely patterns of commonness and rarity. However, the influence of differences in environmental conditions on SAD characteristics is still poorly understood. In this study we used SAD models of carabid beetles (Coleoptera: Carabidae) in three grassland ecosystems (desert, typical, and meadow steppes) in China. These ecosystems are characterized by different aridity conditions, thus offering an opportunity to investigate how SADs are influenced by differences in environmental conditions (mainly aridity and vegetation cover, and hence productivity). We used various SAD models, including the meta-community zero sum multinomial (mZSM), the lognormal (PLN) and Fisher’s logseries (LS), and uni- and multimodal gambin models. Analyses were done at the level of steppe type (coarse scale) and for different sectors within the same steppe (fine scale). We found that the mZSM model provided, in general, the best fit at both analysis scales. Model parameters were influenced by the scale of analysis. Moreover, the LS was the best fit in desert steppe SAD. If abundances are rarefied to the smallest sample, results are similar to those without rarefaction, but differences in models estimates become more evident. Gambin unimodal provided the best fit with the lowest α-value observed in desert steppe and higher values in typical and meadow steppes, with results which were strongly affected by the scale of analysis and the use of rarefaction. Our results indicate that all investigated communities are adequately modeled by two similar distributions, the mZSM and the LS, at both scales of analyses. This indicates (1) that all communities are characterized by a relatively small number of species, most of which are rare, and (2) that the meta-communities at the large scale maintain the basic SAD shape of the local communities. The gambin multimodal models produced exaggerated α-values, which indicates that they overfit simple communities. Overall, Fisher’s α, mZSM θ, and gambin α-values were substantially lower in the desert steppe and higher in the typical and meadow steppes, which implies a decreasing influence of environmental harshness (aridity) from the desert steppe to the typical and meadow steppes.
Introduction
Biodiversity loss is the most common consequence of the increasing environmental degradation due to anthropogenic changes (Barnosky et al., 2011; Redford et al., 2015; Kehoe et al., 2017). The current biodiversity crisis is not limited to the increasing rates of species extinctions, but involves all levels of biodiversity (Western, 1992; Borges et al., 2019). Local extinctions or even changes in species’ relative abundance lead to alterations in community structure and hence in ecosystem functioning (McCann, 2000; Balvanera et al., 2006). Thus, studies that model variations in community structure in response to changes in environmental characteristics may provide important information to predict how biodiversity will be affected by alterations in the balance of rare versus dominant species (Tsafack et al., 2019a; Ibanez et al., 2020).
Although the study of species abundance distributions (SADs) has a long tradition in ecology (Raunkiaer, 1909; Preston, 1948), the recent development of new statistical tools have led to an increasing interest in the use of SAD models to investigate patterns of species commonness and rarity in biotic communities (Matthews and Whittaker, 2014a, 2015; Fattorini et al., 2016; Picanço et al., 2017; Haddad et al., 2019; Matthews et al., 2019; Pennino et al., 2019). Also, SAD models may be used in conservation studies to predict species extinction risk (Kitzes and Harte, 2015) and ecosystem health (related to disturbance) (Dornelas et al., 2009) and, hence, to inform management actions (Kim et al., 2013; Miliči̇ć et al., 2017).
Several models have been proposed to describe the SADs (see Matthews and Whittaker, 2014a, b, 2015; Baldridge et al., 2016; Fattorini et al., 2018). One of the most commonly used models is the so-called log-normal (McGill, 2003). This model has been derived as a null form of the distribution resulting from the central limit theorem (May, 1975), and it is classified among the purely statistical models (McGill et al., 2007), but can be the limit of population dynamics (Engen and Lande, 1996), or niche partitioning (Bulmer, 1974; Sugihara, 1980). The lognormal, however, is problematic because it is a continuous distribution, thus allowing fractional abundances, and does not have an associated sampling theory. To address these problems, it has been proposed to use a Poisson sampling of individuals from a standard lognormal distribution (Matthews and Whittaker, 2014a). Thus, the resulting Poisson lognormal distribution describes the abundances of species in a Poisson sample of a community that follows a lognormal SAD. A SAD model frequently used in opposition to the lognormal is the Fisher log-series, which was initially derived as a purely statistical distribution (Fisher et al., 1943) and subsequently interpreted in relation with ecological processes (Hubbell, 2001; Volkov et al., 2003; Pueyo et al., 2007; Harte et al., 2008). The lognormal distribution is generally considered to best describe SADs of undisturbed and species rich communities, whereas SADs of disturbed communities tend to follow the Fisher logseries (May, 1975; Matthews and Whittaker, 2015; Ulrich et al., 2016). For example, Haddad et al. (2019) found that the log-series best fitted spider abundance distributions in riparian woodlands and grasslands which represent disturbed environments in the study area, while the Poisson log-normal best fitted spider abundance distribution in the hillside, the less disturbed environment.
Another popular SAD model is the metacommunity zero-sum multinomial (mZSM) distribution, which describes the SAD of a sample taken from a neutral metacommunity under random drift (Alonso and McKane, 2004). The mZSM follows one of the three assumptions of the neutral theory, that is, the zero-sum assumption [the two others are the neutrality assumption and the point mutation assumption: see Hubbell (2001) and Etienne et al. (2007)]. The zero-sum assumption states that the resources in the environment limit the individual abundance of the community species to a constant total number, because of zero-sum stochastic processes of birth, death and immigration. Therefore, resources are fully saturated at all times and a community following the mZSM model may be considered like a stable community. The neutral theory predicts that species abundance distribution in a local community is the mZSM distribution rather than the log-normal distribution. Compared to the log-normal distribution, the mZSM distribution has a long tail at the end of rare species, and its length depends on the community size and migration from the metacommunity (Zhou and Zhang, 2008).
As the log-series distribution is a limiting case of the mZSM, and the θ parameter of the mZSM tends to Fisher’s α as the number of individuals in the sample increases, the two models typically provide similar fits to SADs (Prado et al., 2018).
A recently proposed model that is gaining increasing popularity in the last years is the so-called gambin model (Ugland et al., 2007; Matthews and Whittaker, 2014a; Ibanez et al., 2020). The gambin model has been proposed as a very flexible model able to fit a wide ranges of distributions (Ugland et al., 2007; Matthews et al., 2014). The gambin model is a combination of a gamma distribution and a binomial sampling method. The gambin model is considered to date as the most parsimonious general model (Ugland et al., 2007; Matthews et al., 2019) as it has one parameter α which describes the shape of the species abundance curve. The gambin model may be uni- or multimodal. Multimodal gambin models have multiple α-values (i.e., one α per mode) (Matthews et al., 2019), and their interpretation is more complex. Gambin has been shown to provide good fits to a wide variety of empirical datasets, with low α-values indicating logseries-distributions (and hence communities where most species are rare) and higher values indicating more lognormal-distributions (and hence communities where most species are dominant) (Matthews and Whittaker, 2014a; Matthews et al., 2019). It has been also suggested that gambin α could be considered as a diversity index based on species equitability within the community (Ugland et al., 2007; Fattorini et al., 2016).
Use of these models to fit SADs of communities experiencing different environmental conditions may help understanding how habitat changes influence community structure (Fattorini et al., 2016; Picanço et al., 2017; Haddad et al., 2019; Matthews et al., 2019; Pennino et al., 2019). In the present study, we used the carabid beetles (Coleoptera Carabidae) of Chinese grassland ecosystems to investigate how SAD shapes are influenced by differences in environmental conditions, mainly aridity and vegetation cover, and hence productivity.
In China, there is a great variety of steppes, which are classified into four major types on the basis of the main differences in their vegetation, fauna, resource uses and management processes: desert, typical, meadow and alpine (Sun, 2005; Kang et al., 2007). Chinese steppes are undergoing degradation due to climate change and land-use intensification (mainly overgrazing with the increasing of livestock) (Lü et al., 2011; Werger and van Staalduinen, 2012; Tsafack et al., 2019a). These anthropic impacts are changing highly productive grasslands, such as the so-called meadow steppes, into arid areas with sparse vegetation, such as the so-called desert steppe. To slow down the degradation, several measures for grassland diagnosis have been suggested and among them are the unveiling of indicator species (Akiyama and Kawamura, 2007). However, there are no studies that use SAD models to investigate how species abundances vary among different types of steppes. Here, we used SAD models to depict the commonness and rarity of carabid species of three steppes characterized by different climatic conditions: the desert steppe (which is the most arid ecosystem), the typical steppe (which has intermediate conditions) and the meadow steppe (which is the less arid ecosystem). These different climatic regimes are associated with different forms of vegetation and hence productivity. The desert steppe, because of the highest aridity and lowest vegetation cover, is the less productive ecosystem, and it has been already shown that aridity and these parameters influence total carabid abundances (Tsafack et al., 2020).
Carabids are a prominent component of the ground dwelling fauna worldwide (Dajoz, 2002) and one of the most frequently used insect groups as model organisms in ecological and conservation studies (Koivula, 2011; Kotze et al., 2011; Roume et al., 2011; Cardarelli and Bogliani, 2014; Duan et al., 2016; Labruyere et al., 2016; Gobbi et al., 2017; Jouveau et al., 2019). Despite the recognized importance of carabids as indicators of environmental conditions, variations of carabid SADs in response to environmental changes remain poorly explored. However, a study on carabids of coniferous boreal forests revealed that SADs vary according to the forest maturity: mature forests are characterized by a distinct pattern with almost no intermediate species between the scarce ones and the very few abundant ones; interestingly, this “gap” is filled in recently cut forests, but emerges again when trees reach the age of 20–30 years, possibly because mature forests are less favorable to carabids (Niemelä, 1993). A study on the changes occurred in carabid community structure of Alpine environments between the years 1980 and 2009, showed that SADs changed from the lognormal model (or other models expressing good equitability) to the geometric series (a SAD model characteristic of simple and highly dominated communities), thus suggesting a regression toward the first stages of the ecological succession, probably because of habitat changes mainly due to global warming (Pizzolotto et al., 2014).
In this study, we predict that the carabid SAD in the desert steppe, which is the ecosystem with the most challenging environmental conditions, should deviate from log-normal model and should be closer to the log-series. By contrast, in the meadow steppe, which represents the less arid grassland, carabid SAD should deviate from log-series models, while SAD in the typical steppe might converge to either that of the desert steppe or that of the meadow steppe.
After assessing which distribution best captures the SAD of each community, we also applied the gambin model, to explore its feasibility in capturing these SADs and the use of the indicator α-value to compare steppes.
Because the landscape within steppes may be not homogeneous, we conducted the analyses also by subdividing steppes into more homogeneous sectors each occupied by a different form of vegetation. Community delimitation is always problematic; thus, it is difficult to say whether the communities at the steppe level are true local communities, or if they are an aggregation of different local communities associated with the various sectors. This may have profound impacts on SAD shapes at a broad scale. If different local communities are merged into a single pooled community, the SAD may show a large number of species with few individuals, which, in fact, belong to different local communities: the resulting SAD might therefore follow, for example, a log-series, whereas the SADs of the different local communities might be better approximated by log-normal distributions (Borda-de-Água et al., 2012). With coarse (steppe level) and fine (sector level) analyses, we used SAD modeling to see how the scale of analysis influences the associated SADs.
The very different values of total abundance recorded in the various steppes or steppe sectors pose the problem of comparing SADs parameters obtained with samples of different size (Stier et al., 2016; Borges et al., 2020). To explore this problem, we applied two different procedures of rarefaction, using as alternative references the desert steppe (which was the less sampled ecosystem) and the smallest sample in each steppe separately (Table 1).
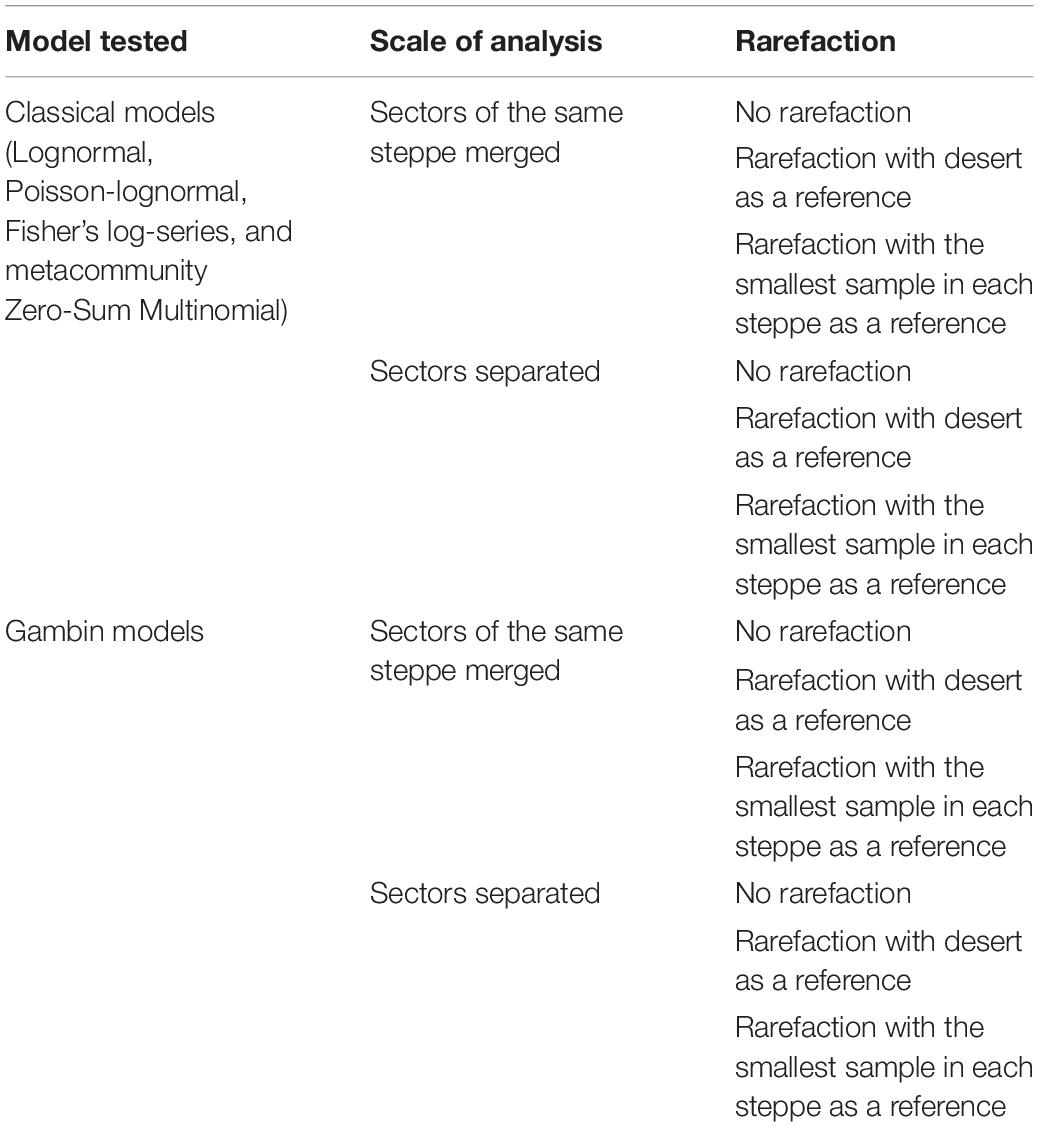
Table 1. Schematic description of the various forms of analyses developed in this article.
Materials and Methods
Study Sites and Data Collection
Our study was carried out in a mountain area in the Ningxia Hui Autonomous region (northern China). Three types of steppes (desert, typical, and meadow steppes) are present in this region. The desert steppe is characterized by a semi-arid continental monsoonal climate typical of desert environments, shows a low and discontinuous vegetation cover, and is the most arid of the three types of steppe considered in this study. The typical steppe is characterized by a continental monsoon climate. This steppe represents an intermediate state between the desert steppe and the meadow steppe. The meadow steppe is characterized by a dense ground level vegetation and by a semi-humid climate. To reflect within-ecosystem variability of the typical and meadow steppes, on the basis on vegetation characteristics, we identified three habitat types within the typical steppe (ts1, ts2, and ts3), and two habitat types within the meadow steppe (called ms1 and ms2). The ts1 and ts2 sectors were located at the top of the mountain, in natural patches of grass vegetation and in fire belts, respectively; the sector ts3 was selected at the bottom of the mountain occupied by crop fields and natural vegetation. The ms1 and ms2 sectors were located at the south-west side and at the bottom of the mountain peak, respectively. Data were gathered from 90 sampling sites distributed as follows: 15 sites in the desert steppe, 45 sites in the typical steppe (15 sites in each sector) and 30 sites in the meadow steppe (again 15 sites in each sector). Sites were selected haphazardly (i.e., without any regular spatial arrangement) and separated by at least 150 m to avoid, or at least reduce, possible autocorrelation.
At each sampling site, five pitfall traps (separated by at least five meters from each other) were installed. Pitfall traps consisted of 7.15-cm diameter plastic cups, sunk in the ground with the cup-lip level with the soil surface, and filled with 60 ml of a mixture of tap water and vinegar (8%), sugar (4%) and 70% alcohol (4%). Sampling was done from May to September 2017. During the sampling period, pitfall traps were placed in the sites once a month in mid-month, and left in the field for ca. 72 h prior to collection. Traps were composed of two buckets, with the smaller inserted into the larger. At each sampling session, the smallest were extracted to collect the trapped beetles and then placed again in the largest, which were left dug into the soil. This ensured that trap position remained exactly the same over the sampling period and disturbance reduced to minimum. Specimens were identified by trained people lead by the expert taxonomist Professor Liang Hongbin. Further details about study area have been published in a companion paper (Tsafack et al., 2019b). Original data are provided in Tsafack (2018) (see section “Data Availability Statement”).
Data Analysis
Comparing Models of Species Abundance Distributions
We modeled carabid species abundance distributions (SADs) with the most commonly used fitting models to identify which distribution best approximated each community. Specifically, we modeled each community using the lognormal (LN), the Poisson-lognormal (PLN; zero-truncated version), the Fisher log-series (LS), and the metacommunity Zero-Sum Multinomial (mZSM) distributions with the function “fitsad” in the library “sads” (Prado et al., 2018) of the software R version 3.5.
Following current best practices in the study of species abundance distributions (Connolly et al., 2014; Matthews and Whittaker, 2014a), we used chi-square tests to assess deviations of the observed distributions from the expected ones, and likelihood-based model selection to compare competitive models (Burnham and Anderson, 2002). For this, we used Akaike’s information criterion corrected for the small sample size (AICc) (Baldridge et al., 2016) and selected the model with the lowest AICc value as the best one, but alternative models with ΔAIC values ≤ 2 were also considered as receiving equal support (Burnham and Anderson, 2002).
We performed the analyses at two spatial scales. A first set of analyses was performed at the steppe type scale (coarse scale analyses). In this case, data from different sectors of the same type of steppe were merged, to highlight between-steppe differences. In a second set of analyses (fine scale analyses), we considered each sector separately, to better highlight possible differences between different sectors of the same type of steppe (within-steppe differences). Aim of these sets of analyses was to assess if different steppes, and sectors within them, followed different types of SADs, and hence to infer the possible underlaying mechanisms.
Fitting Species Abundance Distributions With the Gambin Model
In addition to the aforementioned methods, we fitted our data also using the gambin model with the following two aims: (1) to identify possible multimodal patterns (which cannot be modeled with the aforementioned types of distributions: LN, PLN, LS, and mZSM) and (2) to have a parameter (gambin α) that can be compared across models. Using the model selection procedure described above to identify which type of distribution best describes a certain SAD, we tested whether the various communities followed the same type of distribution, or if different communities followed different models, possibly as a result of different processes. Of course, communities that follow different models cannot be compared in terms of model parameters. With the use of the gambin model, all communities are fitted with the same model (the gambin), which is sufficiently flexible to approximate various shapes. In this case, the objective is not that of finding which type of distribution is best followed by a given community, but to use the same distribution (the gambin) to fit all communities and to see how, given this distribution, its parameter α changes between communities. Thus, the gambin model is not a competitive model to be contrasted with the LN, PLN, LS, and mZSM distributions. Rather, the simultaneous use of the gambin model and the aforementioned distribution models allows a deeper understanding of the studied SADs through the identification of the best fitting distribution (which may vary from a model to another) and the use of the same model (the gambin) whose parameter α can be compared. We used unimodal, bimodal and trimodal gambin models to fit the species abundance distribution of carabid beetles in each type of steppe and in each sector of three steppes separately. To fit gambin models, we used the function “fit_abundances” in the “gambin” library (Matthews et al., 2014) of the software R version 3.5.
Rarefaction
Given that SAD model parameters are sensitive to variations in sample size (Maurer and McGill, 2011) and that we were interested in comparing model parameters across communities that are best fitted by the same models, we used a rarefaction procedure where, for each sample, we subsampled 338 individuals (which corresponded to the number of individuals collected in the desert steppe, the least abundant sample) and fitted the models to this subsample for a coarse-scale (between-steppe) approach.
Using the number of individuals collected in the desert steppe as a reference is appropriate for comparing the three types of steppes with sectors aggregated, because the typical and the meadow steppes have more sectors, and hence were subject to a higher sampling effort (more pitfall traps), than the desert one. However, how conducting rarefaction for a fine-scale (within steppe) approach is less obvious. Using desert sample as a reference has the advantage of allowing comparisons among sectors belonging to different steppes; but to compare different sectors of the same steppe, it might be more appropriate selecting the sector with the lowest total abundance as the reference sample for that given steppe. This might be ecologically sounder, because it uses as a reference the smallest sample of the ecosystem under study, not that of a different ecosystem. For this reason, we conducted analyses using both approaches, i.e., using as a reference sample both the desert steppe sample for all samples, and the smallest sample within each steppe for the various steppes separately.
Rarefaction, however, poses also another problem. If, one hand, rarefaction can be important to obtain comparable model parameters, on the other hand it may change considerably the shape of the distribution. Thus, use of rarefaction in a model selection procedure can be questionable. The aim of our model selection procedure was that of finding the model that best described each community; but, if data are rarefied, the consequent reduction in the number of species due to the exclusion of the rarest ones (because their rarefied abundance becomes zero), might artificially transform a certain original SAD, characteristic of a species rich-community, into a spurious one, characteristic of a species-poor community. When the objective is not that of testing how the parameters of a certain model change across communities, but is that of contrasting models with possibly completely different parameters to find which model best performs in each case, rarefaction might be not only unnecessary, but also inappropriate. Thus, to explore the effect of rarefaction on the model selection procedures, we conducted the analyses by using both original and rarefied data, and compared the results. A summary of all forms of analyses conducted in this study is given in Table 1.
Results
Overall Abundances
Overall, we collected 6,873 individuals belonging to 25 carabid species: 19 species were collected in the meadow steppe, of which 12 in the first sector (ms1) and 19 in the second sector (ms2); 18 species in the typical steppe, of which 16 in the first sector (ts1), 15 in the second sector (ts2), and 12 in the third sector (ts3); and, finally, 12 species in the sole sector of the desert steppe.
Globally, the most abundant species was Carabus vladimirskyi, accounting for about 25% of all collected carabids. However, dominant species varied according to the steppe type. In the desert steppe, the most abundant species was Carabus glyptoterus, which accounted for about 75% of the carabid individuals sampled in this steppe type. In the typical steppe, the most dominant species were Carabus glyptoterus (29%) and Carabus vladimirskyi (27%). Namely, Carabus vladimirskyi was the most dominant species in the typical steppe sector ts1, where it accounted for 40% of sampled individuals, followed by Poecilus gebleri (24%). Similarly, in the typical steppe sector ts2, Carabus vladimirskyi accounted for 33% of all sampled individuals, and Poecilus gebleri for 31%, respectively. In the typical steppe sector ts3, the most dominant species was Carabus glyptoterus (53%), followed by Poecilus gebleri (22%). Carabus vladimirskyi was the dominant species in the meadow steppe (35%). This species accounted for 42% of total sampled individuals in the meadow steppe sector ms1.
Best Fitting Distributions
Steppe-Level Analysis
The comparative analyses of SADs for the different types of steppes highlighted some differences between ground beetle communities (Figures 1–3). For the desert steppe (Figure 1), the best model for the carabid SAD was, in terms of AICc value, the LS distribution, although also the mZSM and the PLN gave similarly supported models. Both the typical and the meadow steppe communities were best modeled by the mZSM and the LS distributions. Fisher’s α increased in the order: typical steppe < desert steppe < meadow steppe, whereas mZSM θ increased in the order: desert steppe < typical steppe < meadow steppe (Table 2).
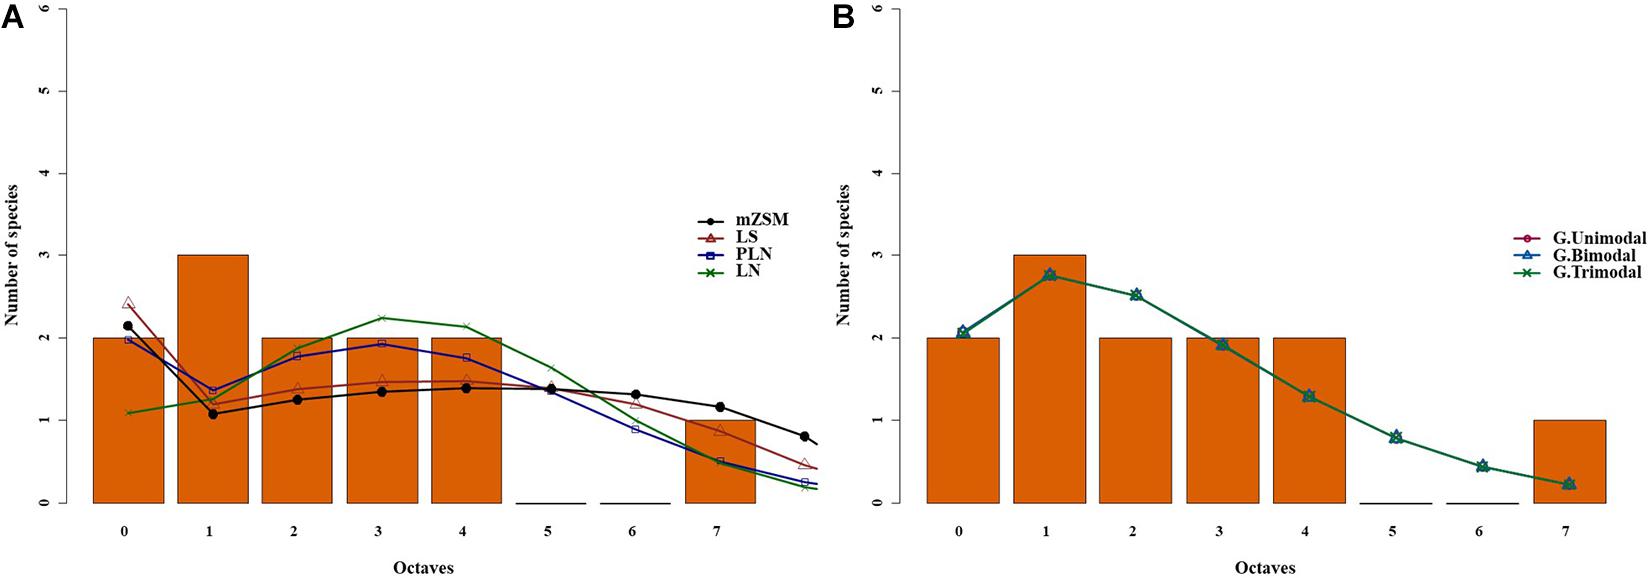
Figure 1. Species abundance distribution (SAD) of carabid beetles in a Chinese desert steppe. SAD was modeled using the lognormal (LN), the Poisson-lognormal (PLN; zero-truncated version), the Fisher log-series (LS), and the metacommunity Zero-Sum Multinomial (mZSM) distributions (A) and unimodal, bimodal and trimodal gambin models (B). LN, PLN, LS, and mZSM distributions were fitted to the raw abundance data (i.e., not binned). The data were binned for graphical comparison with gambin models, which require binning.
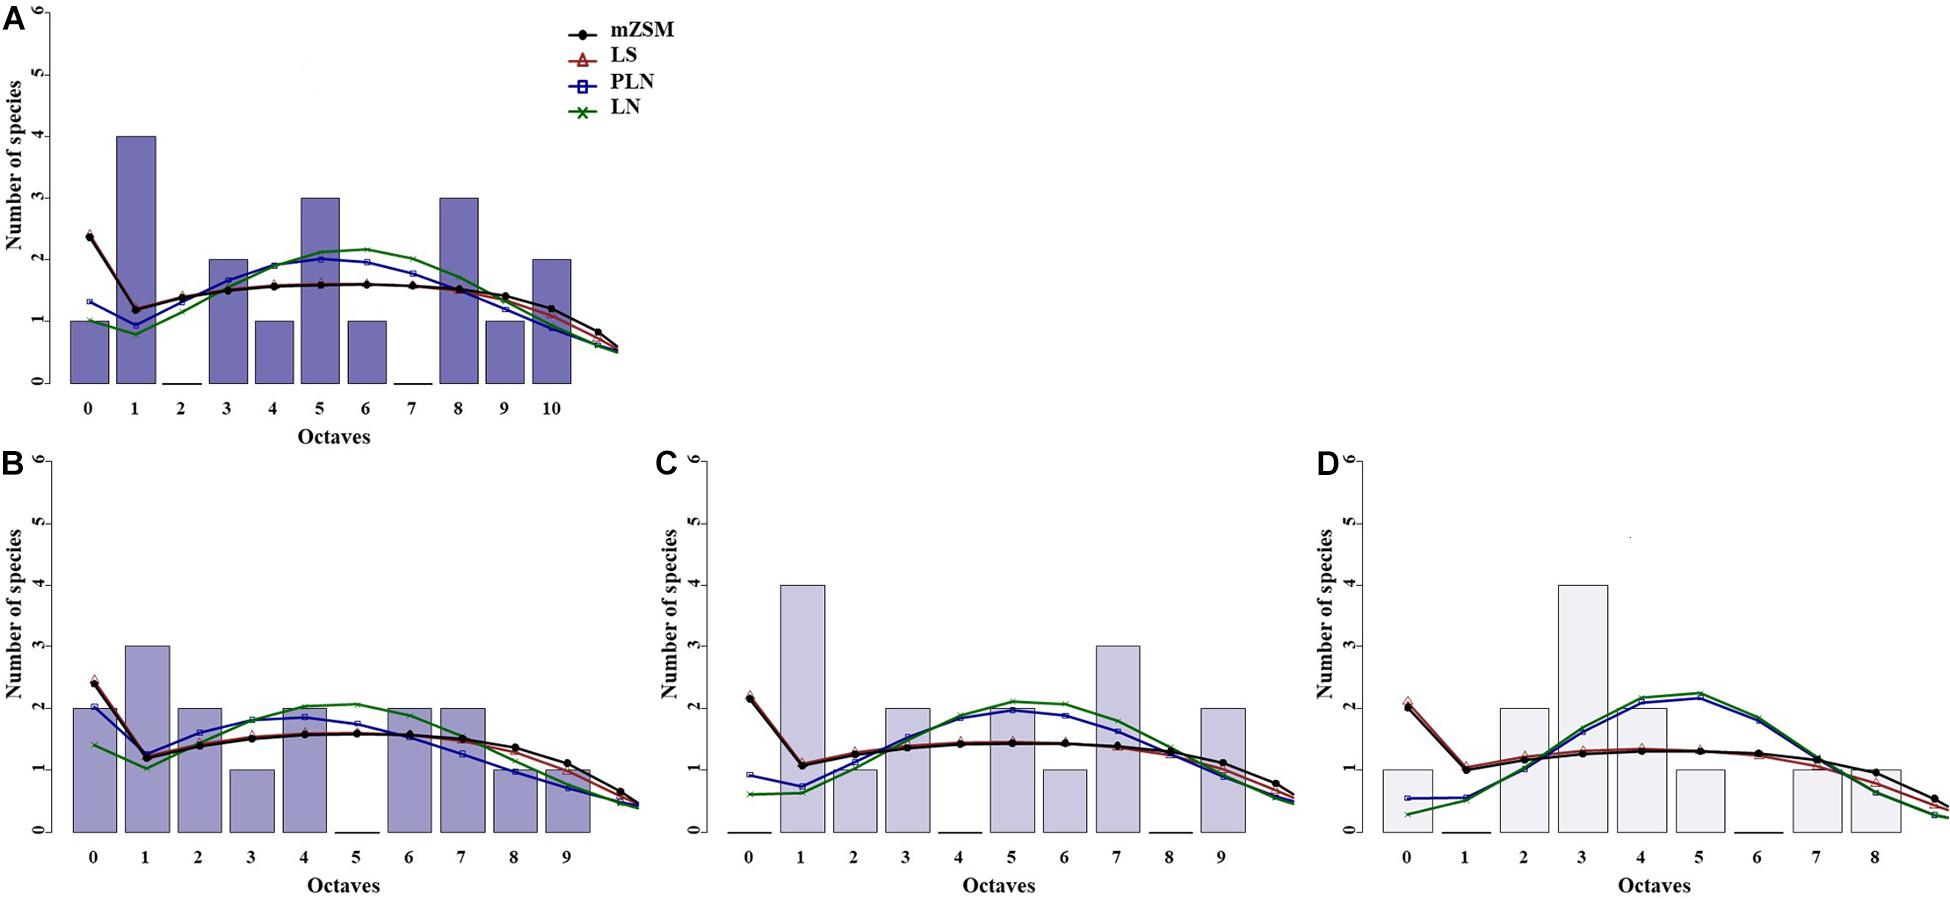
Figure 2. Species abundance distribution (SADs) of carabid beetles in a Chinese typical steppe. SADs were modeled using the lognormal (LN), the Poisson-lognormal (PLN; zero-truncated version), the Fisher log-series (LS), and the metacommunity Zero-Sum Multinomial (mZSM) distributions. Analyses were done for the whole steppe (A) and three different sectors separately [(B): ts1 sector, (C): ts2 sector, (D): ts3 sector]. Distributions were fitted to the raw abundance data (i.e., not binned). The data were binned for graphical comparison with gambin models, which require binning.
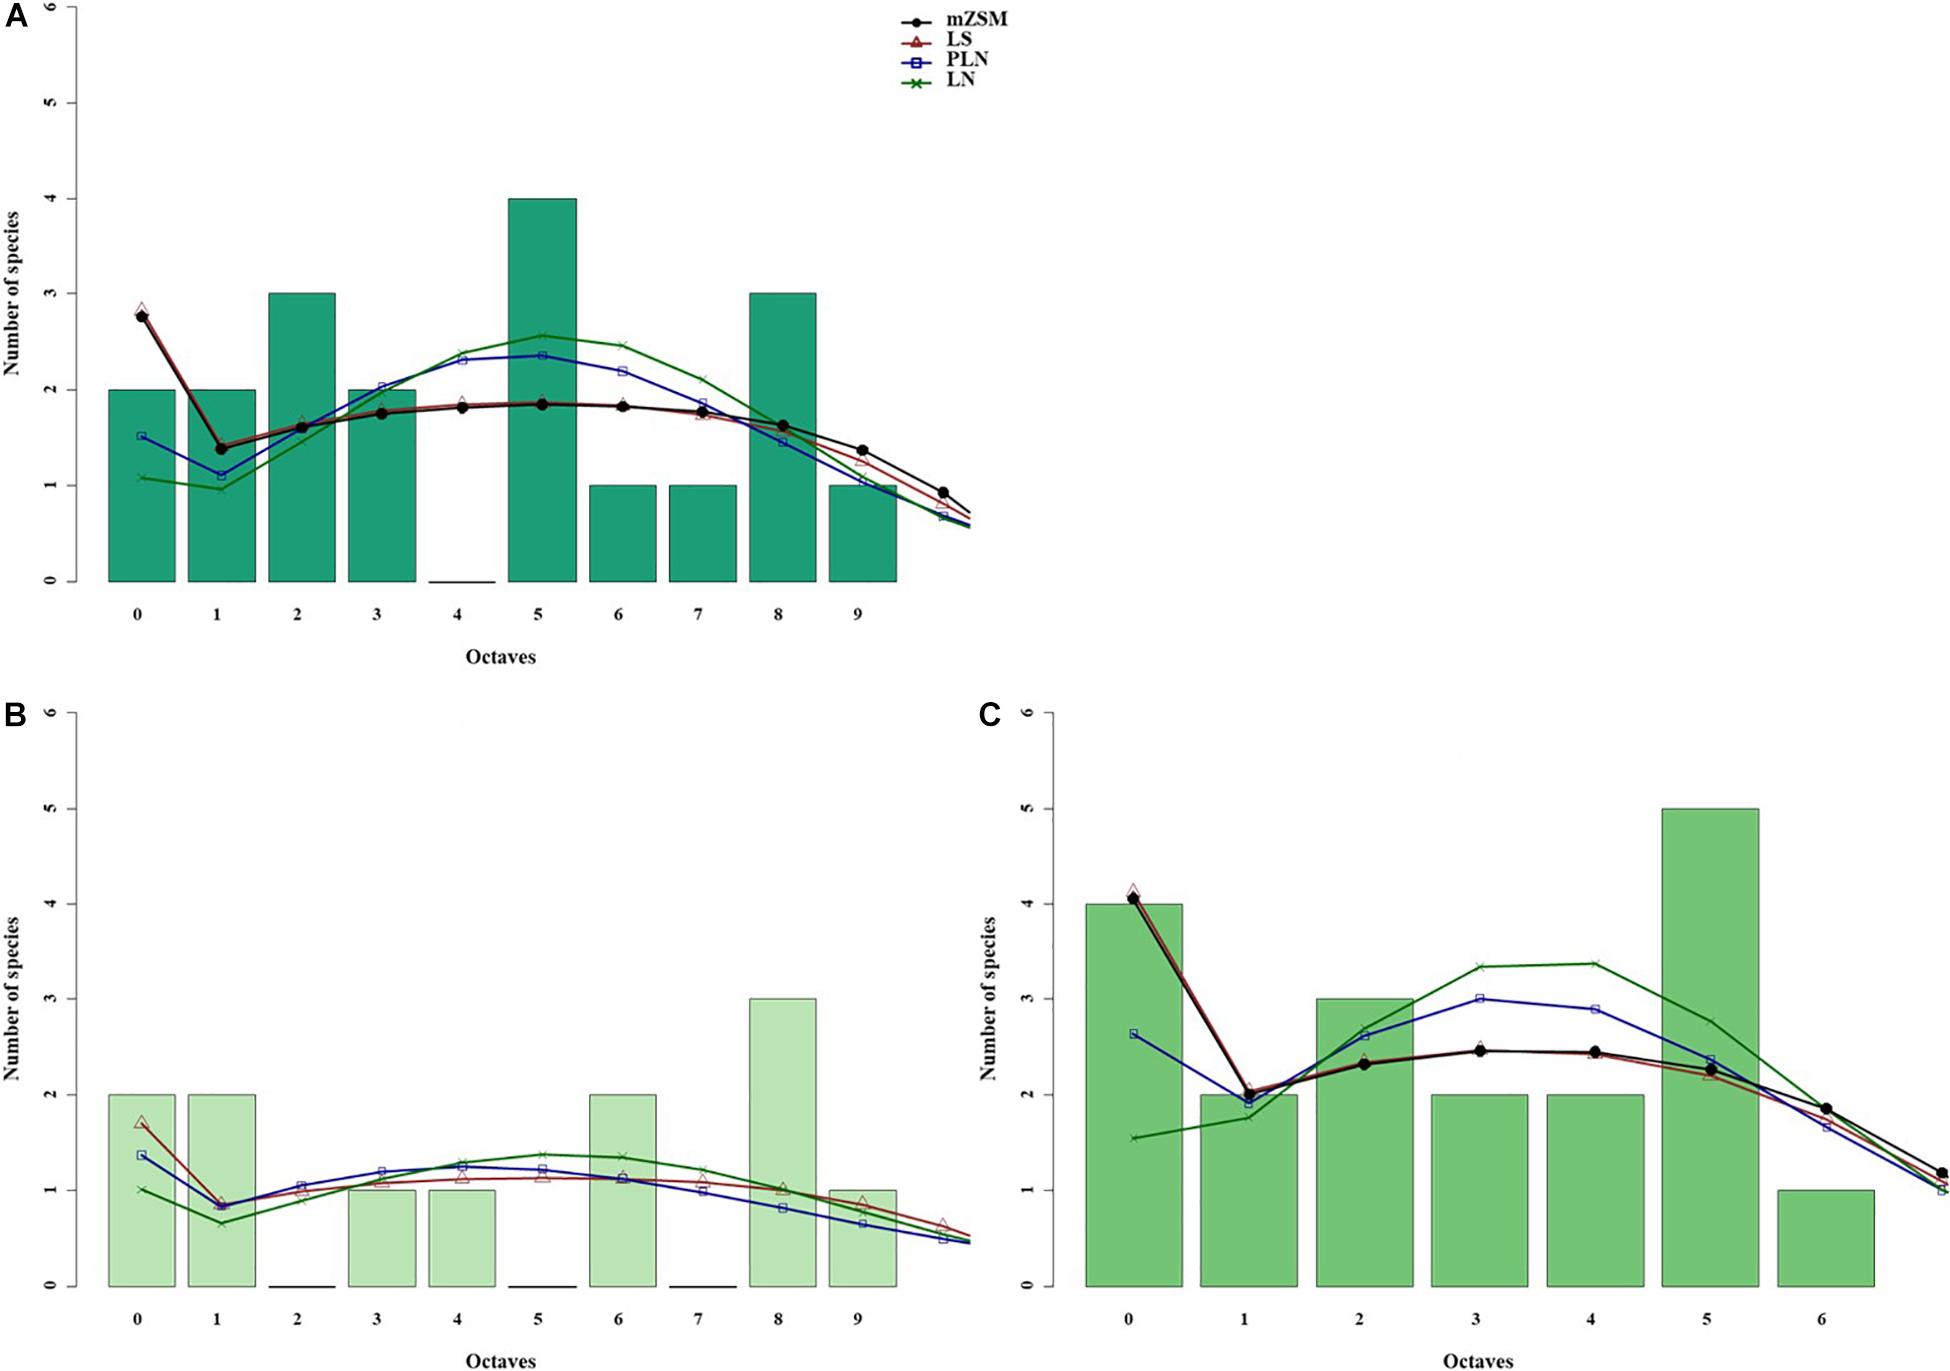
Figure 3. Species abundance distribution (SADs) of carabid beetles in a Chinese meadow steppe. SADs were modeled using the lognormal (LN), the Poisson-lognormal (PLN; zero-truncated version), the Fisher log-series (LS), and the metacommunity Zero-Sum Multinomial (mZSM) distributions. Analyses were done for the whole steppe (A) and two different sectors separately [(B) ms1 sector, (C) ms2 sector]. Distributions were fitted to the raw abundance data (i.e., not binned). The data were binned for graphical comparison with gambin models, which require binning.
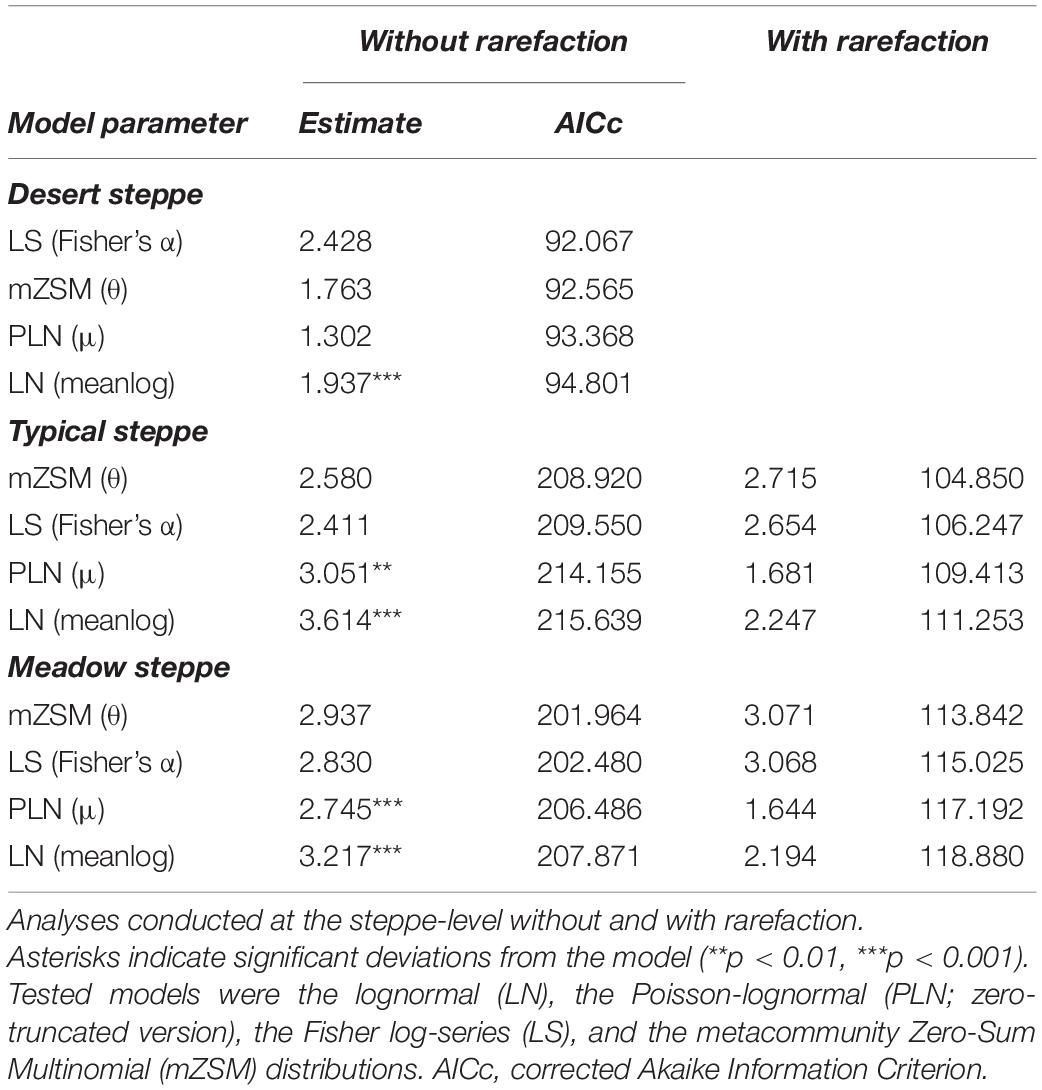
Table 2. Model selection results for the species abundance distributions of carabid beetles in various types of Chinese steppes.
When samples were rarefied to the number of individuals collected in the desert steppe, both the typical and the meadow steppe communities were best modeled by the mZSM and the LS distributions, and both mZSM θ and Fisher’s α increased in the order: desert steppe < typical steppe < meadow steppe, with differences slightly more marked compared to non-rarefied samples (Table 2). Using the smallest within-steppe sample as a reference for rarefaction, results remained virtually identical (Supplementary Table 1).
Sector-Level Analysis
The three sectors of the typical steppe were best modeled by the mZSM and the LS distributions (Figure 2), showing similar values of mZSM θ and Fisher’s α. The third sector was best modeled by the PLN distribution regarding the AICc value, but carabid distribution was significantly different from the PLN distribution (Table 3). Both sectors of the meadow steppe were best modeled by the mZSM and the LS distributions (Figure 3); the second was in fact best modeled only by PLN distribution, but the distribution deviates significantly from this model. In addition, the two meadow sectors had very different values of θ and Fisher’s α (Table 3).
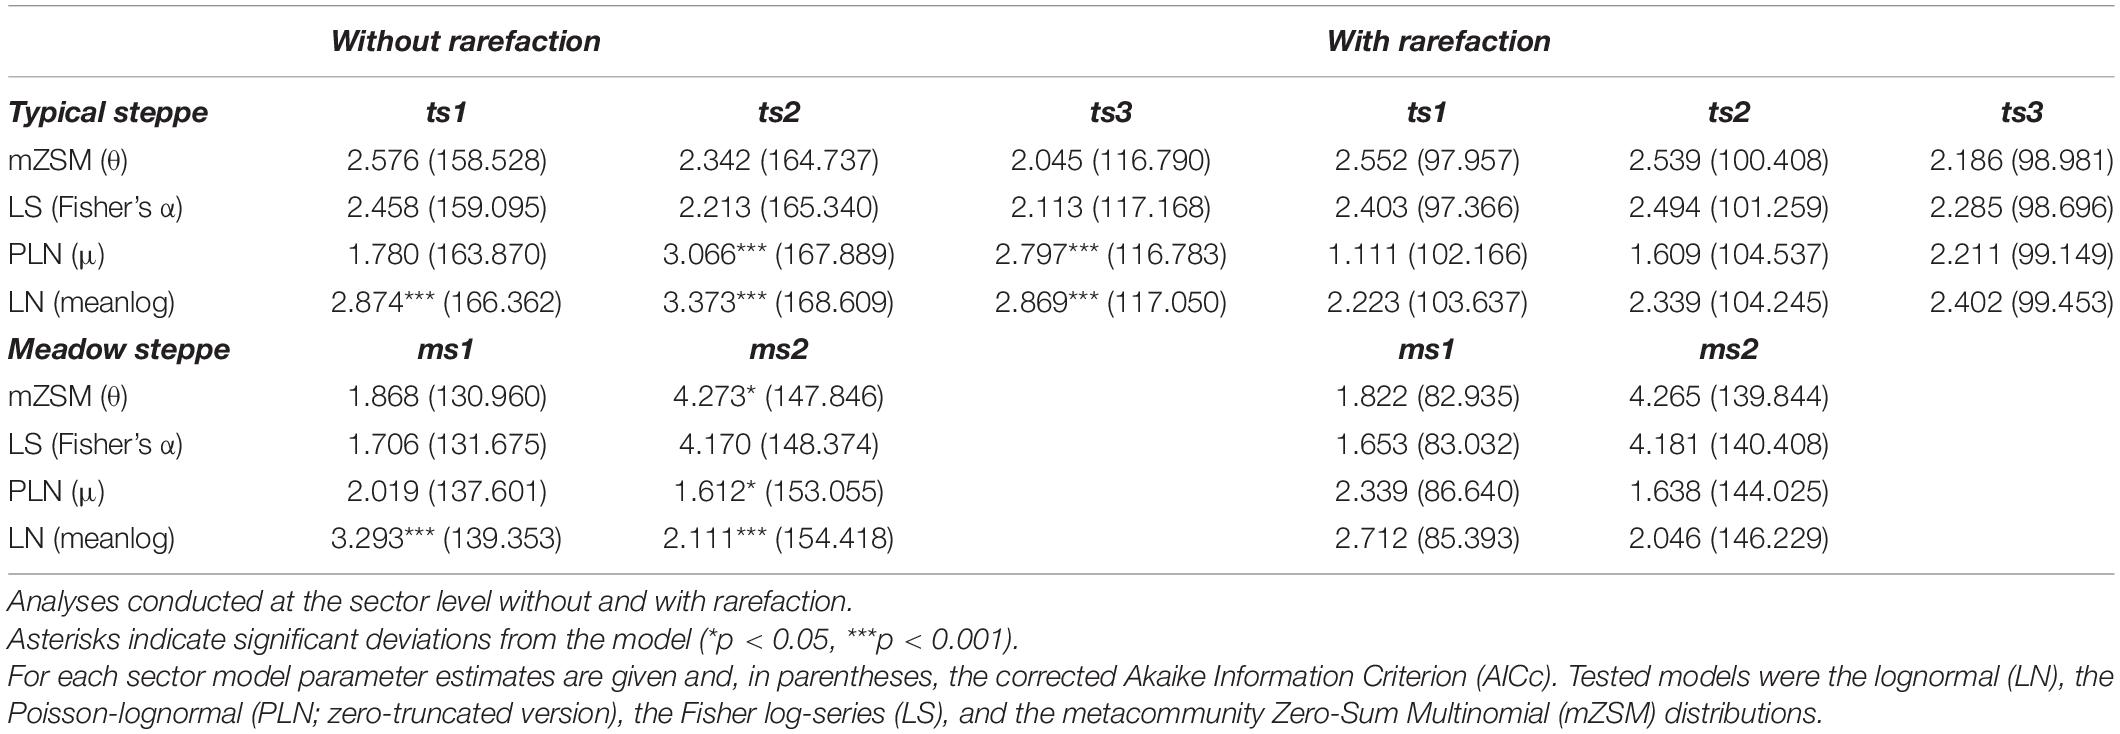
Table 3. Model selection results for the species abundance distributions of carabid beetles in various types of Chinese steppes.
When samples were rarefied to the numbers of individuals collected in the desert steppe, all sectors were best modeled by the mZSM and the LS distributions, with ts3 showing lower estimates of θ and Fisher’s α than ts1 and ts2. All other models received equal support (Table 3). Both sectors of the meadow steppe were best modeled by the mZSM and the LS distributions. Values of θ and Fisher’s α were virtually identical to those obtained without rarefaction (Table 3). Using the smallest within-steppe sample as a reference for rarefaction, results remained virtually identical (Supplementary Table 2).
Gambin Models
Steppe-Level Analysis
The gambin unimodal model provided the best fit for the three types of steppe (Figures 1, 4, 5) regarding the AICc values. However, we found that the observed values deviated significantly from the expected values calculated with the gambin unimodal model. As regards α-values for the unimodal models, the typical and meadow steppes had similar values, much higher than that recorded in the desert steppe. The α-values were consistent between the three modes in desert steppe. In contrast, the α-value for the second mode of bimodal gambin in typical and meadow steppes appeared particularly high (Table 4).
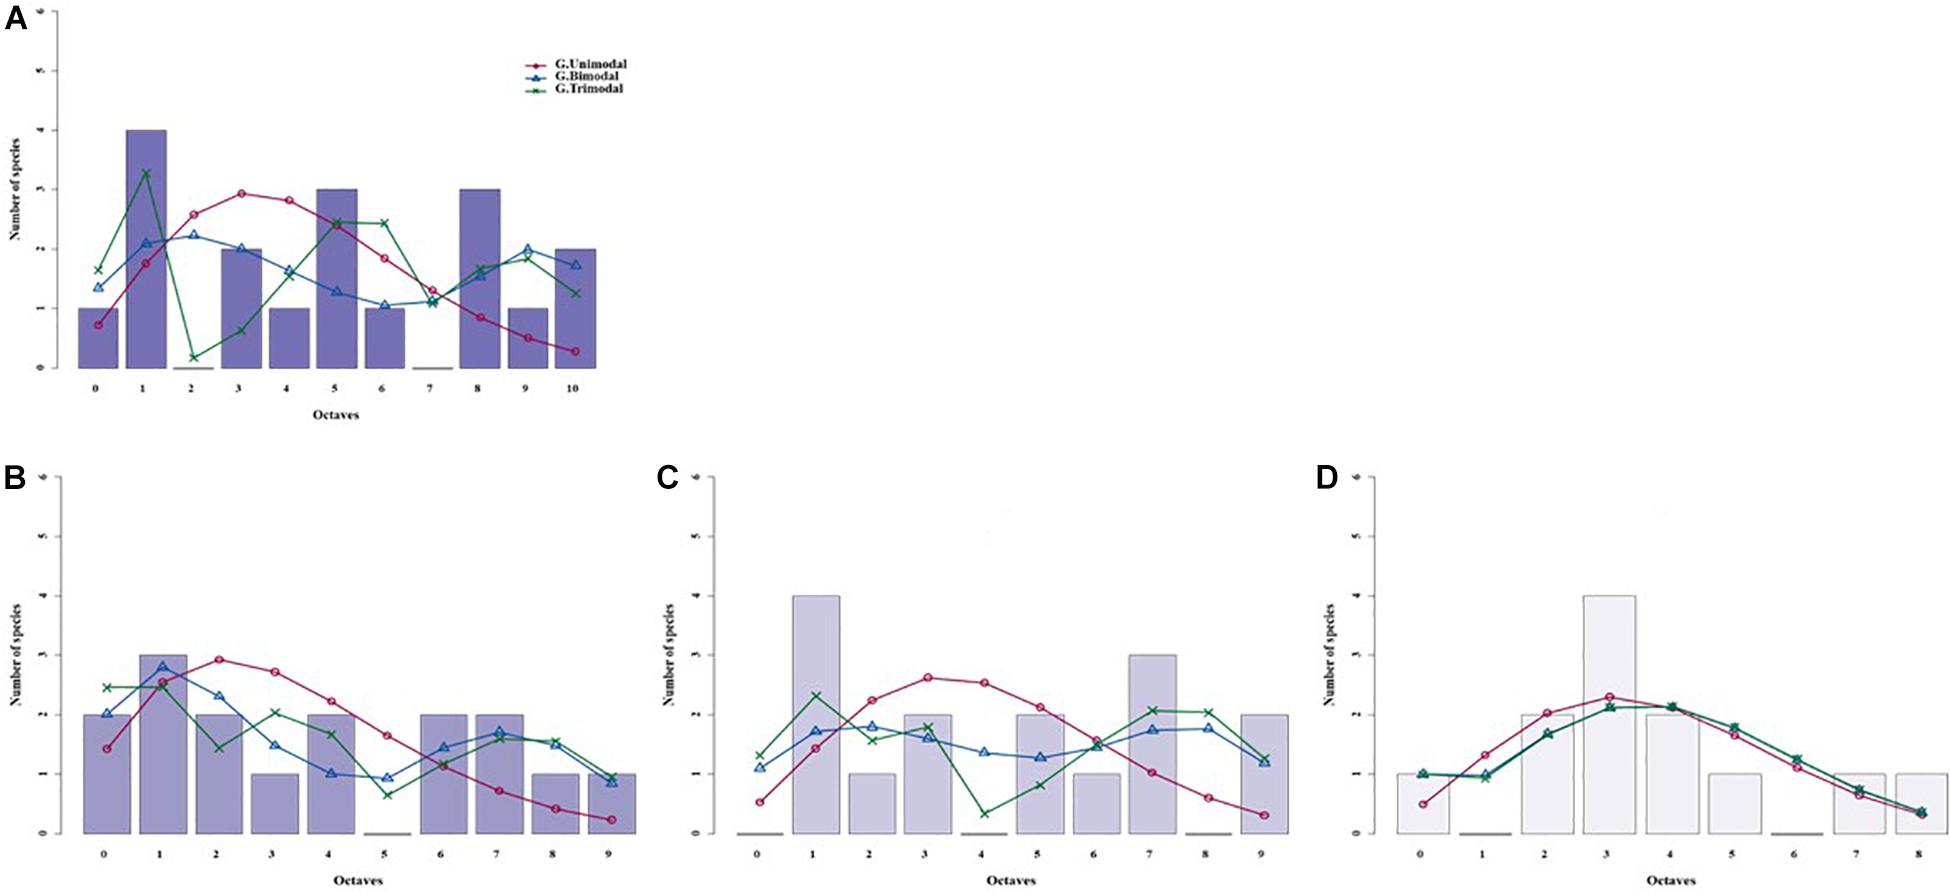
Figure 4. Species abundance distributions (SADs) of carabid beetles in a Chinese typical steppe fitted with unimodal, bimodal and trimodal gambin models. Analyses were done for the whole steppe (A) and three different sectors separately [(B) ts1 sector, (C) ts2 sector, (D) ts3 sector].
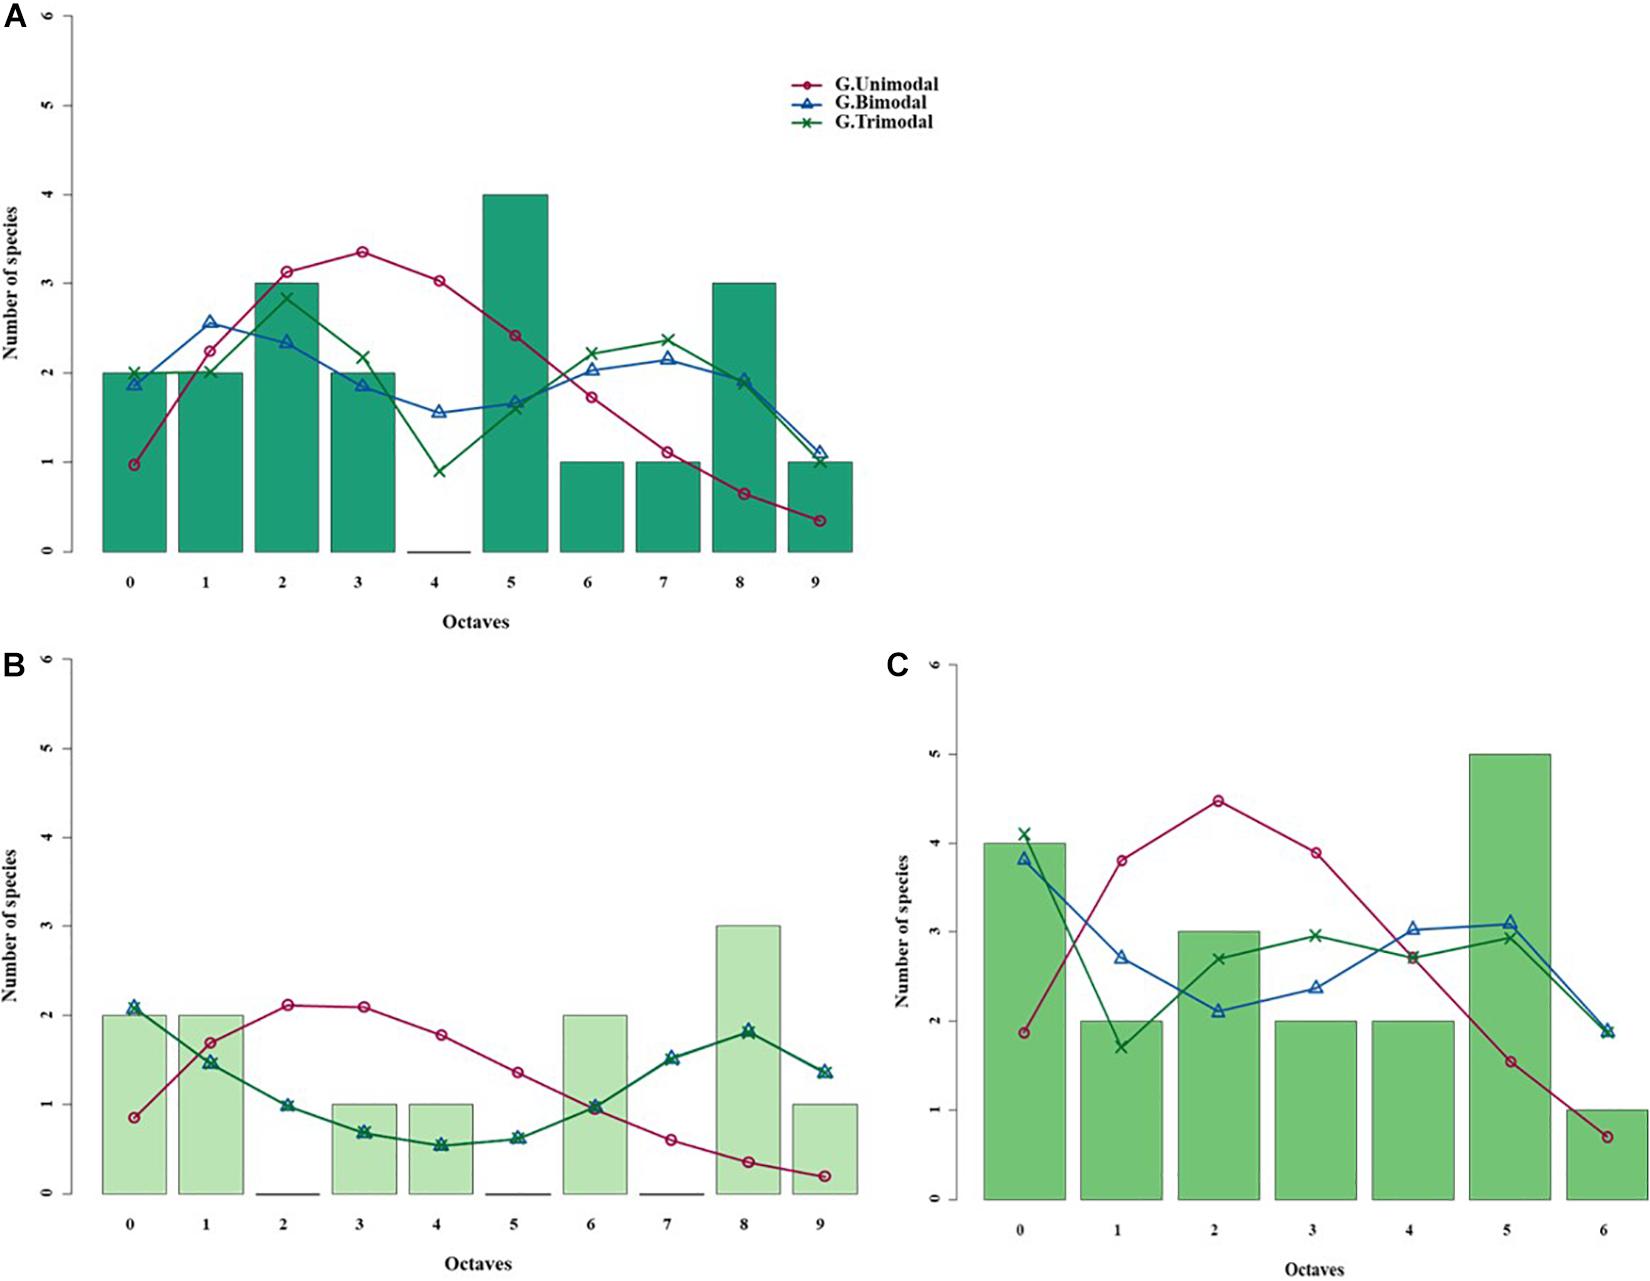
Figure 5. Species abundance distributions (SADs) of carabid beetles in a Chinese meadow steppe fitted with unimodal, bimodal and trimodal gambin models. Analyses were done for the whole steppe (A) and two different sectors separately [(B) ms1 sector, (C) ms2 sector].
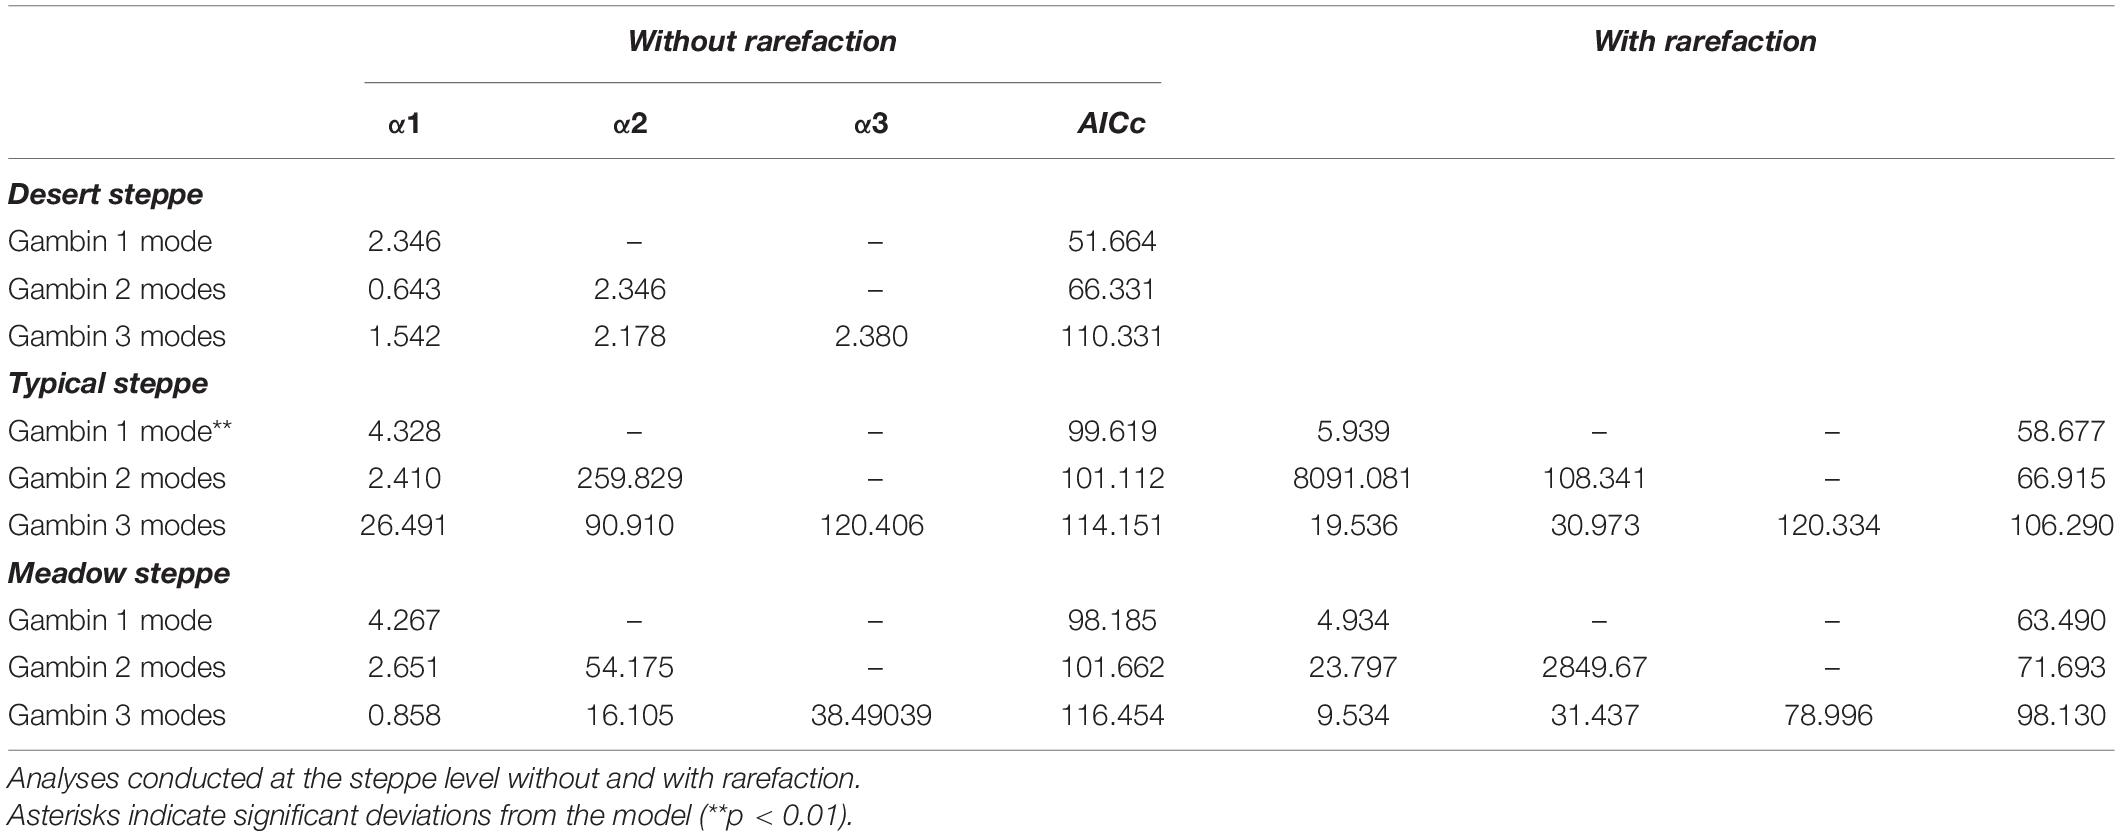
Table 4. Values of gambin α and model’s corrected Akaike Information Criterion (AICc) for species abundance distributions of carabid beetles in various types of Chinese steppes.
Using rarefaction with the desert steppe as reference, the Gambin uni- and bimodal models provided similar fits for both the typical and the meadow steppes, but the α-values for the bimodal models appeared extremely high. As regards α-values for the unimodal models, the typical steppe had a higher value than the meadow steppe (Table 4). Using the smallest within-steppe sample as a reference for rarefaction, results remained virtually identical, although α-values for the unimodal model decreased (Supplementary Table 3).
Sector-Level Analysis
For the typical steppe sectors (Figure 4), the bimodal and trimodal gambin models provided equally supported best fits for the first sector (ts1), but the α-values for the second mode of the bimodal model and for the second and third modes of the trimodal model were extremely high (Table 5). For another sector (ts2), the gambin unimodal model provided the best fit regarding the AICc value, but this model showed a significant deviation from observed data. The α-values for the first mode of the bimodal model and for the second and third modes of the trimodal model were extremely high (Table 5). Finally, in the third sector (ts3) the gambin unimodal model provided the best fit (Table 5).
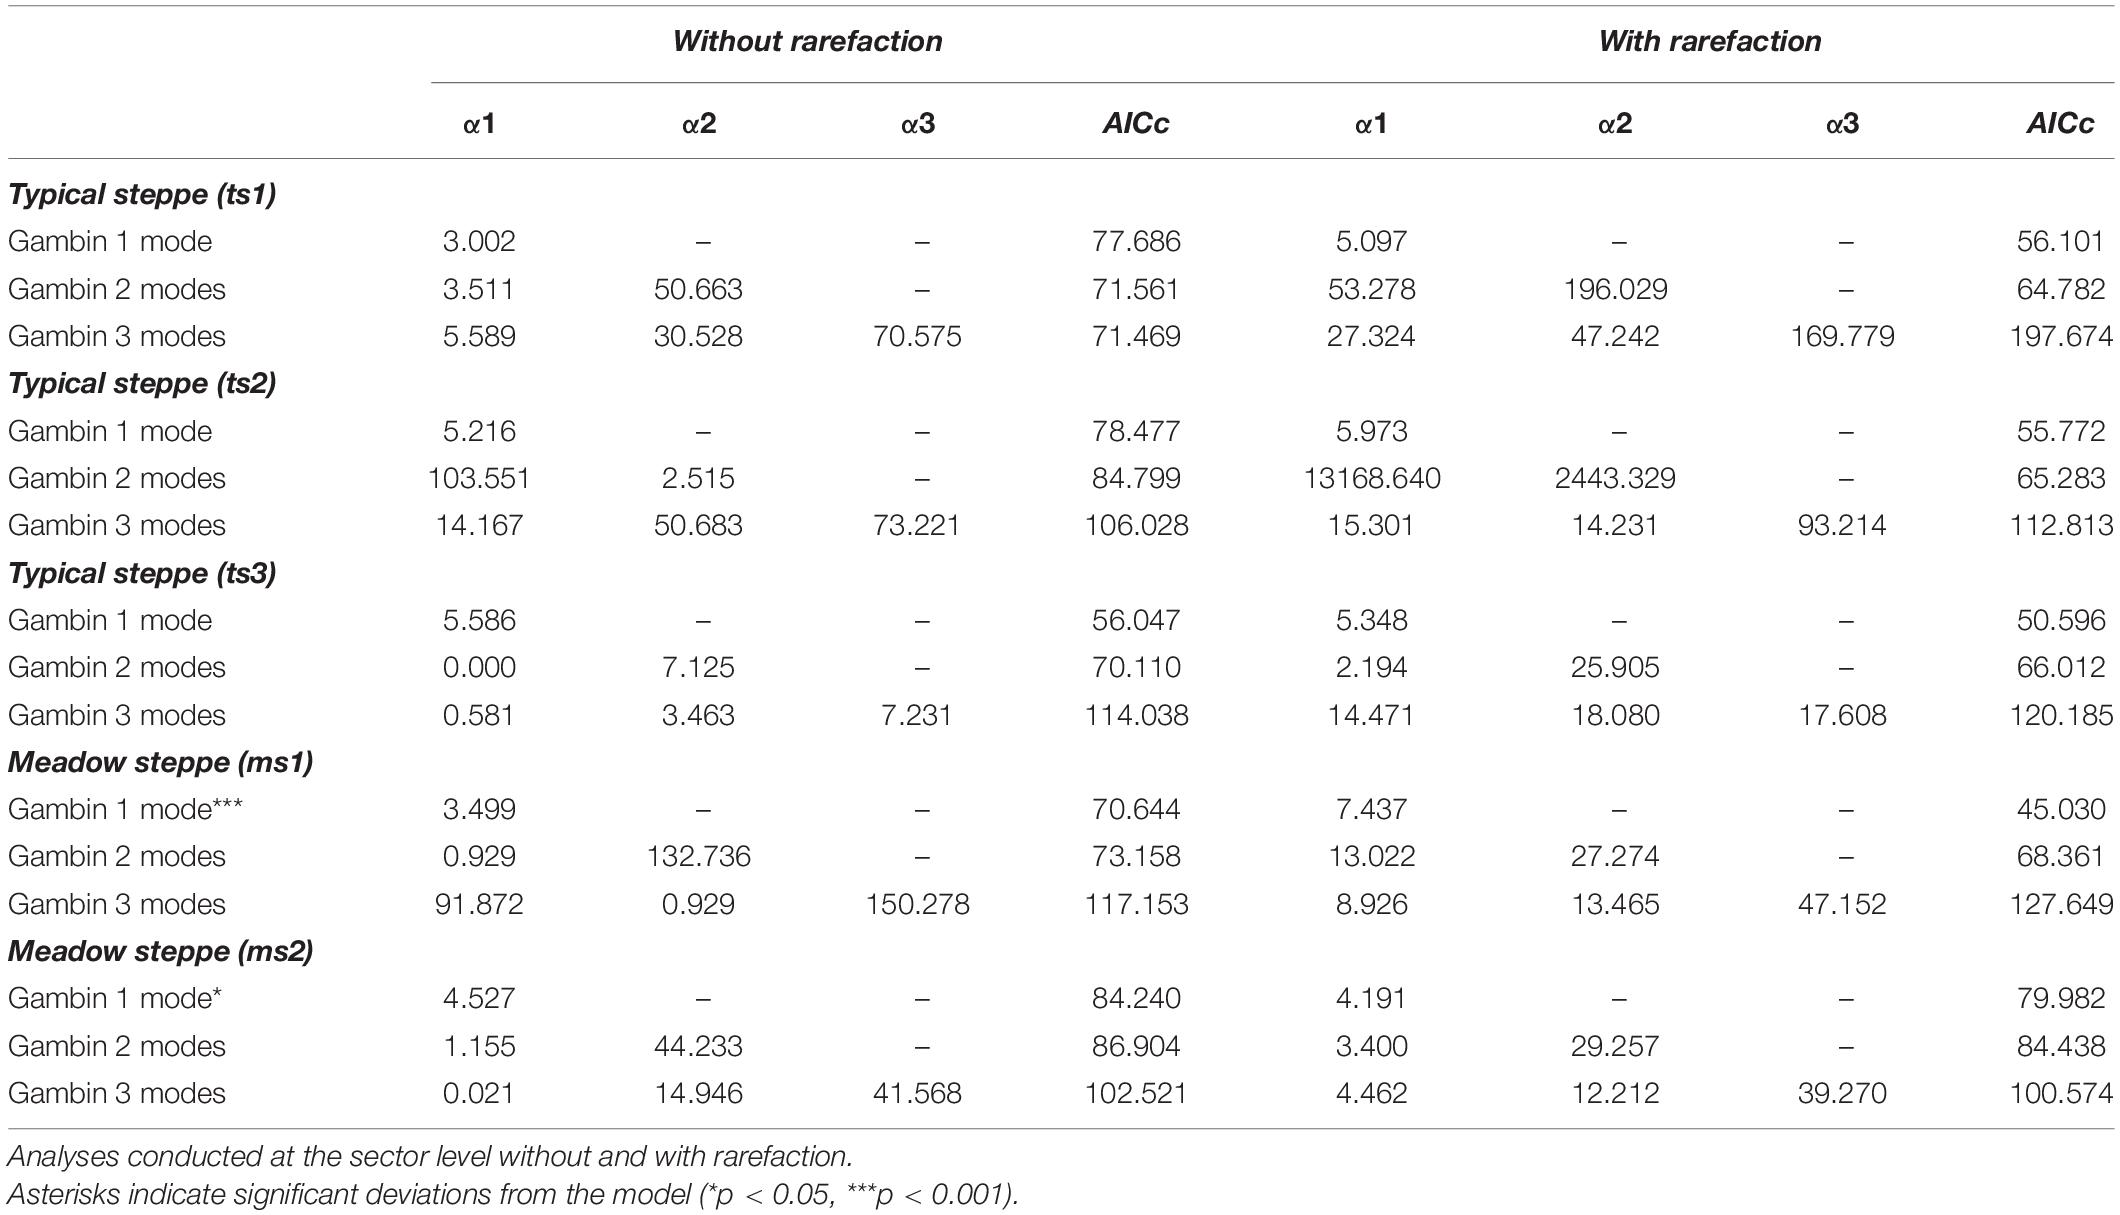
Table 5. Values of gambin α and model’s corrected Akaike Information Criterion (AICc) for species abundance distributions of carabid beetles in various types of Chinese steppes.
When the two sectors of the meadow steppe were considered separately, gambin unimodal models provided similar best fit for both sectors. However, p-values were significant in both sectors for the unimodal model. In addition, the α-values of the second modes of the bimodal model of both sectors appeared particularly high. The trimodal gambin model seems to be preferable for both sectors, but α-values for the first and third modes in ms1 and for the third mode in ms2 were extremely high. Thus, at the sector level, the gambin models did not provide an acceptable fit of the data (Table 5 and Figure 5).
Using the desert steppe as a reference for rarefaction, the unimodal gambin model provided the best fit for the three sectors of the typical steppe, with similar α-values. Regarding the AICc values, the bimodal model was the best model for the three sectors; however, this bimodal model provided extremely high values in ts2 and relatively high values in ts1 and ts3 (Table 5). When the two sectors of the meadow steppe were considered separately, gambin unimodal models provided the best fit for sectors ms1 and ms2 (Table 5). Using the smallest within-steppe sample as a reference for rarefaction, for the typical steppe sectors, the unimodal gambin models provided the best fit for the two sectors ts1 and ts2 (Supplementary Table 4).
Discussion
We constructed SADs for carabid beetles of three types of Central Asian steppes at different scales, i.e., for different habitats within each steppe type and for each steppe type as a whole. We found that the basic results (i.e., SAD shape) of the analyses conducted at the smaller scale (sectors within steppe types) mirrored those obtained at the larger (steppe type) scale. This finding suggests that the various sectors within the same steppe type are relatively homogeneous, at least for the SADs of carabid communities. Thus, the hypothetical communities that can be delimited on a sector basis actually overlap each to other and the resulting single pooled community arising at the steppe type level maintains the basic SAD shape of the constituting local communities. This is very interesting since in general SAD shapes tend to change with the addition of sub-communities, i.e., with increasing sampling effort (Borda-de-Água et al., 2012).
In all cases, SADs were best modeled by the Fisher log-series (LS) and the metacommunity Zero-Sum Multinomial (mZSM) distributions. This contrasts with our expectation that the best fitting models were different among steppes. In particular, the fact that the LS distribution fitted well also the meadow steppe community was an unexpected result. The LS distribution is known to fit a wide range of communities, particularly those that have a high frequency of rare species and that are not particularly species rich (Kempton and Taylor, 1974; May, 1975; Magurran and Henderson, 2003; Magurran, 2004; McGill et al., 2007), which is exactly the case of carabids inhabiting arid and semiarid environments. The LS has been criticized as it might result for inadequate sampling (Borda-de-Água et al., 2012; Chen and Shen, 2017). With increasing sampling, the number of collected species also increases, as well as the abundance of species that seem rare at low sampling intensity (Magurran and Henderson, 2003; Green and Plotkin, 2007). As sample size increases, and Preston’s “veil line” (Preston, 1948) is pulled back to reveal the mode of the distribution, the log-series turns into log-normal (LN) distribution (Ulrich et al., 2010). However, and at very large sampling efforts (scales) the LS can be recovered again due to the addition of many specialist species or spatially rare species (Borda-de-Água et al., 2012). We can exclude that our data are affected by these sampling problems, not only because of the intensity of our sampling, but also because carabid communities of Asian arid and semiarid environments are always characterized by a low number of species and a high dominance (see, for example, Li et al., 2016; Liu et al., 2016; Khurelpurev and Pfeiffer, 2017). The good fit provided by the LS distribution also for the carabid community of the meadow steppe indicates that even this ecosystem, which is the less arid of the three investigated here, still hosts a relatively simple and highly dominated community.
The mZSM distribution is strictly related to the LS (the log-series distribution is a limiting case of the mZSM) and so it is not surprising that they provided similar fits. The α parameter of Fisher’s LS is a measure of diversity, and reflects the number of singleton species in the community (Kempton and Taylor, 1974; Magurran and Henderson, 2003). The θ parameter of the mZSM tends to Fisher’s α as the number of individuals in the sample increases, and this is clearly reflected in our study, with differences between α- and θ-values being very small in the meadow and typical steppes, compared with the desert steppe, from which much fewer individuals were collected.
In our study, Fisher’s α increased in the order: typical steppe < desert steppe < meadow steppe, whereas θ increased in the order: desert steppe < typical steppe < meadow steppe. These contrasting results can be a consequence of unequal sampling efforts. As both the overall shape of an empirical SAD (and hence its best fitting model), as well its parameter value(s), are influenced by the overall number of collected individuals (which, in turn, may depend on the sampling effort), it has been proposed of using rarefaction techniques to compare SADs of communities with different total abundances (Stier et al., 2016; Chen and Shen, 2017; Borges et al., 2020). At first glance, this sounds perfectly logical, but one should consider whether different sample sizes are the result of different sampling efforts or reflect true differences in community structure. While in the first case rarefaction is correct, in the second one it can turn a true SAD into a spurious one by unjustifiably wiping out the species with the lowest abundances from a community where they are present. In our case, rarefaction applied to the steppe level appeared justified, because of the different sampling effort (sampling effort in the typical and meadow steppes was two and three times that of the desert steppe). With the use of rarefaction, both Fisher’s α-values and θ-values increased in the order: desert steppe < typical steppe < meadow steppe, which indicates an increasing diversity from the most to the least arid type of steppe, which can be in turn related to the increasing vegetation cover, as it seems that communities of ground-dwelling arthropod predators and detritivores are mainly determined by vegetation cover and aboveground plant biomass (Pan et al., 2018; Niu et al., 2020). These results are also consistent with our findings in a previous study (Tsafack et al., 2020), where the desert steppe showed lower Brillouin and Shannon-Wiener diversity indices, while typical and meadow steppes showed equally higher species diversity values; the species richness indices Chao and Margalef showed the same results, increasing in the order: desert steppe < typical steppe < meadow steppe. In a simulation study, Beck and Schwanghart (2010) found that Fisher’s α distribution values lose their stability when approaching full completeness sampling, so they recommend to prefer Shannon index or biased-controlled indices to assess biodiversity in full sampled communities. The present study confirms that Fisher’s α can be as reliable as Shannon-Wiener index to measure diversity in quite completely sampled sites (as it seems the case in this study) when distributions are correctly rarefied. Regarding the similar increasing values of α- and θ-values, this equivalence have been also described by Hubbell et al. (2008) and Matthews and Whittaker (2014b). In addition, He and Hu (2005) found an analytical relationship between the parameter θ and Simpson’s diversity index.
At the sector level, without rarefaction, results were less clear. Fisher’s α-values for the typical steppe sectors were similar to that of the desert steppe sector (slightly higher in one case, and slightly lower in two cases), whereas those for the meadow steppe sectors were substantially lower in one case and higher in the other. θ-values for the typical steppe sectors were higher than that of the desert steppe sectors in all three cases, whereas in the meadow steppe one sector had a θ larger than the typical steppe sectors, but the other was lower. Thus, for θ-values, the pattern desert steppe < typical steppe < meadow steppe was confirmed, with the exception of one meadow sector.
These results indicate that, although the basic SAD shape is not influenced by the scale, parameter values are, and α-values were more influenced than θ-values. We also found that, if data are subject to rarefaction, the overall change was a decrease in α- and θ-values. This indicates that the exclusion of the rarest species following rarefaction reduces diversity. As at the sector level sampling effort was homogeneous (same number of traps and same number of days of sampling), rarefaction altered diversity estimates unduly.
The use of gambin model allowed the possibility of investigating how its parameter α (which should not be confused with Fisher’s α) varies across carabid communities. Although gambin multimodal models provided an apparently good fit in some cases, their α-values appeared exaggeratedly high, which suggests that the multimodal models actually overfitted the data. The multimodal pattern may indicate that communities are composed by different guilds (Marquet et al., 2004) or groups of species with different dispersal abilities (Borda-de-Água et al., 2017).
At the steppe type level (large scale), the desert steppe was characterized by a gambin α-value much lower than those of the typical and meadow steppes, whereas the typical steppe had a value slightly higher than the meadow steppe. When data were rarefied, the difference between the typical and the meadow steppes became more evident, and gambin α-values followed the same pattern of θ-values for non-rarefied data. At sector level, results were complex and variable. The typical and meadow sectors had gambin α-values always higher than the desert steppe. However, two sectors of the typical steppe had gambin α-values larger than the meadow steppe sectors, but one was lower. Using a rarefaction based on desert steppe sample size, one sector of the meadow steppe had a gambin α-value distinctly higher than those of the typical steppe sectors, and the other lower. Finally, using rarefactions based on within steppe smallest samples, one sector of the meadow steppe had the highest gambin α-value, and the other a value which felt within the range of the typical steppe sectors. Thus, the gambin α parameter resulted efficient in indicating a strong difference between the most challenging environment (desert steppe) on one hand and the other two steppes on the other hand, but did not provide a clear distinction between the typical and the meadow steppe. On this regard, Fisher’s α and mZSM θ values provided a clearer response. However, Fisher’s α, mZSM θ, and gambin α values are all substantially lower in the desert steppe and higher in the typical and meadow steppes, which implies a decreasing gradient of environmental harshness from the desert steppe to the typical and the meadow steppes. Possibly Carabus glyptoterus, which accounted for about 75% of the carabid individuals sampled in desert steppe, is a generalist species able to cope with severe climatic conditions, but the ecology and biology of this species is still poorly known.
Conclusion
In line with previous studies on SADs, the present study contributes to highlight the multiple uses of these models. We compared the SADs of carabid communities of three types of steppes with different aridity conditions (desert, typical and meadow steppes) in China to identify how SADs change between these ecosystems. Contrary to our expectation, all species distributions, including that of the meadow steppe, were best fitted by the LS and the mZSM distributions. However, parameters values (α and θ) were different between the three environments.
Using rarefied data to account for the unequal sampling effort, we found that both Fisher’s α- and mZSM θ-values increased in the order: desert steppe < typical steppe < meadow steppe, which indicates an increasing diversity from the most to least arid type of steppe. Regarding gambin models, contrary to our expectations, they were not always efficient in modeling all distributions, although the α-value of the unimodal model clearly indicates a lower diversity of the desert steppe compared to the typical and meadow steppes. In some cases, gambin multimodal models provided good fit, which indicates that communities are composed by different guilds, but we found exaggeratedly high gambin α-values. In conclusion we found that (1) rarefaction emphasized the differences observed between parameters (Fisher’s α, mZSM θ, and gambin α) and (2) SAD shapes were not influenced by the scale, but parameter values are, and Fisher’s α- and gambin α-values were more influenced than θ-values.
Data Availability Statement
The datasets presented in this study can be found in online repositories. The names of the repository/repositories and accession number(s) can be found below: Tsafack, 2018, “Data_Carabidae in China Grasslands,” DOI: 10.7910/DVN/FKBCRQ, Harvard Dataverse, V1.
Author Contributions
NT collected the data, conceived and designed the analyses, analyzed the data, prepared the figures and/or tables, and authored and reviewed the drafts of the manuscript. PB conceived and designed the analyses and authored and reviewed the drafts of the manuscript. YX and XW conceived and designed the field experiments, performed the data collection, contributed materials, authored or reviewed the drafts of the manuscript, and approved the final draft. SF conceived and designed the analyses, led manuscript writing, and authored and reviewed the drafts of the manuscript. All authors contributed to content and editing of the manuscript.
Funding
The research was funded by the China Postdoctoral Science Foundation (2018M643770) granted to NT; by the first-class discipline of Practaculture Science of Ningxia University (No. NXYLXK2017A01) and the National Natural Science Foundation of China (No. 31660630) granted to XW; by the Fundação para a Ciência e a Tecnologia, project FCT-UIDB/00329/2020-2024 and Fundação Gaspar Fructuoso granted to PB.
Conflict of Interest
The authors declare that the research was conducted in the absence of any commercial or financial relationships that could be construed as a potential conflict of interest.
Acknowledgments
We thank the private landowners for allowing us to place the pitfall traps on their lands. We are grateful to Prof. Hongbin Liang (Institute of Zoology, CAS) for identifying the collected specimens and Master students, particularly to Hui Wang of the School of Agriculture Ningxia University, promotion 2017–2018, for their technical support during field and laboratory work. We also thank Thomas J. Matthews, François Rigal, and Pedro Cardoso for their helpful comments on data analysis.
Supplementary Material
The Supplementary Material for this article can be found online at: https://www.frontiersin.org/articles/10.3389/fevo.2021.603436/full#supplementary-material
References
Akiyama, T., and Kawamura, K. (2007). Grassland degradation in China: methods of monitoring, management and restoration. Grassl. Sci. 53, 1–17. doi: 10.1111/j.1744-697X.2007.00073.x
Alonso, D., and McKane, A. J. (2004). Sampling Hubbell’s neutral theory of biodiversity. Ecol. Lett. 7, 901–910. doi: 10.1111/j.1461-0248.2004.00640.x
Baldridge, E., Harris, D. J., Xiao, X., and White, E. P. (2016). An extensive comparison of species-abundance distribution models. PeerJ 4:e2823. doi: 10.7717/peerj.2823
Balvanera, P., Pfisterer, A. B., Buchmann, N., He, J.-S., Nakashizuka, T., Raffaelli, D., et al. (2006). Quantifying the evidence for biodiversity effects on ecosystem functioning and services. Ecol. Lett. 9, 1146–1156. doi: 10.1111/j.1461-0248.2006.00963.x
Barnosky, A. D., Matzke, N., Tomiya, S., Wogan, G. O. U., Swartz, B., Quental, T. B., et al. (2011). Has the Earth’s sixth mass extinction already arrived? Nature 471, 51–57. doi: 10.1038/nature09678
Beck, J., and Schwanghart, W. (2010). Comparing measures of species diversity from incomplete inventories: an update. Methods Ecol. Evol. 1, 38–44. doi: 10.1111/j.2041-210X.2009.00003.x
Borda-de-Água, L., Borges, P. A. V., Hubbell, S. P., and Pereira, H. M. (2012). Spatial scaling of species abundance distributions. Ecography 35, 549–556. doi: 10.1111/j.1600-0587.2011.07128.x
Borda-de-Água, L., Whittaker, R. J., Cardoso, P., Rigal, F., Santos, A. M. C., Amorim, I. R., et al. (2017). Dispersal ability determines the scaling properties of species abundance distributions: a case study using arthropods from the Azores. Sci. Rep. 7:3899. doi: 10.1038/s41598-017-04126-5
Borges, P. A. V., Gabriel, R., and Fattorini, S. (2019). “Biodiversity erosion: causes and consequences,” in Life on Land, eds W. Leal Filho, A. M. Azul, L. Brandli, P. G. Özuyar, and T. Wall (Cham: Springer International Publishing), 1–10.
Borges, P. A. V., Rigal, F., Ros-Prieto, A., and Cardoso, P. (2020). Increase of insular exotic arthropod diversity is a fundamental dimension of the current biodiversity crisis. Insect Conserv. Divers. 13, 508–518. doi: 10.1111/icad.12431
Bulmer, M. G. (1974). On fitting the poisson lognormal distribution to species-abundance data. Biometrics 30, 101–110. doi: 10.2307/2529621
Burnham, K. P., and Anderson, D. R. (2002). Model Selection and Multimodel Inference: A Practical Information-Theoretic Approach, 2nd Edn. New York: Springer-Verlag.
Cardarelli, E., and Bogliani, G. (2014). Effects of grass management intensity on ground beetle assemblages in rice field banks. Agric. Ecosyst. Environ. 195, 120–126. doi: 10.1016/j.agee.2014.05.004
Chen, Y., and Shen, T.-J. (2017). Rarefaction and extrapolation of species richness using an area-based Fisher’s logseries. Ecol. Evol. 7, 10066–10078. doi: 10.1002/ece3.3509
Connolly, S. R., MacNeil, M. A., Caley, M. J., Knowlton, N., Cripps, E., Hisano, M., et al. (2014). Commonness and rarity in the marine biosphere. Proc. Natl. Acad. Sci. U.S.A. 111:8524. doi: 10.1073/pnas.1406664111
Dornelas, M., Moonen, A. C., Magurran, A. E., and Bàrberi, P. (2009). Species abundance distributions reveal environmental heterogeneity in modified landscapes. J. Appl. Ecol. 46, 666–672. doi: 10.1111/j.1365-2664.2009.01640.x
Duan, M., Liu, Y., Yu, Z., Baudry, J., Li, L., Wang, C., et al. (2016). Disentangling effects of abiotic factors and biotic interactions on cross-taxon congruence in species turnover patterns of plants, moths and beetles. Sci. Rep. 6:23511.
Engen, S., and Lande, R. (1996). Population dynamic models generating species abundance distributions of the gamma type. J. Theor. Biol. 178, 325–331. doi: 10.1006/jtbi.1996.0028
Etienne, R. S., Alonso, D., and McKane, A. J. (2007). The zero-sum assumption in neutral biodiversity theory. J. Theor. Biol. 248, 522–536. doi: 10.1016/j.jtbi.2007.06.010
Fattorini, S., Di Lorenzo, T., and Galassi, D. M. P. (2018). Earthquake impacts on microcrustacean communities inhabiting groundwater-fed springs alter species-abundance distribution patterns. Sci. Rep. 8:1501. doi: 10.1038/s41598-018-20011-1
Fattorini, S., Rigal, F., Cardoso, P., and Borges, P. A. V. (2016). Using species abundance distribution models and diversity indices for biogeographical analyses. Acta Oecol. 70, 21–28. doi: 10.1016/j.actao.2015.11.003
Fisher, R. A., Corbet, A. S., and Williams, C. B. (1943). The relation between the number of species and the number of individuals in a random sample of an animal population. J. Anim. Ecol. 12, 42–58. doi: 10.2307/1411
Gobbi, M., Ballarin, F., Brambilla, M., Compostella, C., Isaia, M., Losapio, G., et al. (2017). Life in harsh environments: carabid and spider trait types and functional diversity on a debris-covered glacier and along its foreland. Ecol. Entomol. 42, 838–848. doi: 10.1111/een.12456
Green, J. L., and Plotkin, J. B. (2007). A statistical theory for sampling species abundances. Ecol. Lett. 10, 1037–1045. doi: 10.1111/j.1461-0248.2007.01101.x
Haddad, C. R., de Jager, L. J. C., and Foord, S. H. (2019). Habitats and cardinal directions are key variables structuring spider leaf litter assemblages under Searsia lancea. Pedobiologia 73, 10–19. doi: 10.1016/j.pedobi.2019.01.002
Harte, J., Zillio, T., Conlisk, E., and Smith, A. B. (2008). Maximum entropy and the state-variable approach to macroecology. Ecology 89, 2700–2711.
He, F., and Hu, X.-S. (2005). Hubbell’s fundamental biodiversity parameter and the Simpson diversity index. Ecol. Lett. 8, 386–390. doi: 10.1111/j.1461-0248.2005.00729.x
Hubbell, S. (2001). The Unified Neutral Theory of Biodiversity and Biogeography. Princeton, NJ: Princeton University Press.
Hubbell, S. P., He, F., Condit, R., Borda-de-Água, L., Kellner, J., and ter Steege, H. (2008). How many tree species are there in the Amazon and how many of them will go extinct? Proc. Natl. Acad. Sci. U.S.A. 105(Suppl. 1):11498. doi: 10.1073/pnas.0801915105
Ibanez, T., Keppel, G., Baider, C., Birkinshaw, C., Florens, F. B. V., Laidlaw, M., et al. (2020). Tropical cyclones and island area shape species abundance distributions of local tree communities. Oikos 129, 1856–1866. doi: 10.1111/oik.07501
Jouveau, S., Toïgo, M., Giffard, B., Castagneyrol, B., van Halder, I., Vétillard, F., et al. (2019). Carabid activity-density increases with forest vegetation diversity at different spatial scales. Insect Conserv. Divers. 13, 36–46. doi: 10.1111/icad.12372
Kang, L., Han, X., Zhang, Z., and Sun, O. J. (2007). Grassland ecosystems in China: review of current knowledge and research advancement. Philos. Trans. R. Soc. B Biol. Sci. 362, 997–1008. doi: 10.1098/rstb.2007.2029
Kehoe, L., Romero-Muñoz, A., Polaina, E., Estes, L., Kreft, H., and Kuemmerle, T. (2017). Biodiversity at risk under future cropland expansion and intensification. Nat. Ecol. Evol. 1, 1129–1135. doi: 10.1038/s41559-017-0234-3
Kempton, R. A., and Taylor, L. R. (1974). Log-series and log-normal parameters as diversity discriminants for the lepidoptera. J. Anim. Ecol. 43, 381–399. doi: 10.2307/3371
Khurelpurev, O., and Pfeiffer, M. (2017). Coleoptera in the Altai Mountains (Mongolia): species richness and community patterns along an ecological gradient. J. Asia Pacific Biodivers. 10, 362–370. doi: 10.1016/j.japb.2017.06.007
Kim, D.-H., Cho, W.-S., and Chon, T.-S. (2013). Self-organizing map and species abundance distribution of stream benthic macroinvertebrates in revealing community patterns in different seasons. Ecol. Inform. 17, 14–29. doi: 10.1016/j.ecoinf.2013.06.006
Kitzes, J., and Harte, J. (2015). Predicting extinction debt from community patterns. Ecology 96, 2127–2136. doi: 10.1890/14-1594.1
Koivula, M. (2011). Useful model organisms, indicators, or both? Ground beetles (Coleoptera, Carabidae) reflecting environmental conditions. ZooKeys 100, 287–317. doi: 10.3897/zookeys.100.1533
Kotze, D. J., Brandmayr, P., Casale, A., Dauffy-Richard, E., Dekoninck, W., Koivula, M., et al. (2011). Forty years of carabid beetle research in Europe – from taxonomy, biology, ecology and population studies to bioindication, habitat assessment and conservation. ZooKeys 100, 55–148. doi: 10.3897/zookeys.100.1523
Labruyere, S., Bohan, D. A., Biju-Duval, L., Ricci, B., and Petit, S. (2016). Local, neighbor and landscape effects on the abundance of weed seed-eating carabids in arable fields: a nationwide analysis. Basic Appl. Ecol. 17, 230–239. doi: 10.1016/j.baae.2015.10.008
Li, F.-R., Liu, J.-L., Sun, T.-S., Ma, L.-F., Liu, L.-L., and Yang, K. (2016). Impact of established shrub shelterbelts around oases on the diversity of ground beetles in arid ecosystems of Northwestern China. Insect Conserv. Divers. 9, 135–148. doi: 10.1111/icad.12152
Liu, J.-L., Li, F.-R., Sun, T.-S., Ma, L.-F., Liu, L.-L., and Yang, K. (2016). Interactive effects of vegetation and soil determine the composition and diversity of carabid and tenebrionid functional groups in an arid ecosystem. J. Arid Environ. 128, 80–90. doi: 10.1016/j.jaridenv.2016.01.009
Lü, Y., Fu, B., Wei, W., Yu, X., and Sun, R. (2011). Major ecosystems in China: dynamics and challenges for sustainable management. Environ. Manag. 48, 13–27. doi: 10.1007/s00267-011-9684-6
Magurran, A. E., and Henderson, P. A. (2003). Explaining the excess of rare species in natural species abundance distributions. Nature 422, 714–716. doi: 10.1038/nature01547
Marquet, P. A., Fernandez, M., Navarrete, S. A., and Valdovinos, C. (2004). “Diversity emerging: toward a deconstruction of biodiversity patterns,” in Frontiers of Biogeography?: New Directions in the Geography of Nature, eds M. V. Lomolino and L. R. Heaney (Sunderland, MA: Sinauer Associates), 191–209.
Matthews, T. J., and Whittaker, R. J. (2014a). Fitting and comparing competing models of the species abundance distribution: assessment and prospect. Front. Biogeogr. 6:2. doi: 10.21425/F5FBG20607
Matthews, T. J., and Whittaker, R. J. (2014b). Neutral theory and the species abundance distribution: recent developments and prospects for unifying niche and neutral perspectives. Ecol. Evol. 4, 2263–2277. doi: 10.1002/ece3.1092
Matthews, T. J., and Whittaker, R. J. (2015). REVIEW: on the species abundance distribution in applied ecology and biodiversity management. J. Appl. Ecol. 52, 443–454. doi: 10.1111/1365-2664.12380
Matthews, T. J., Borregaard, M. K., Gillespie, C. S., Rigal, F., Ugland, K. I., Krüger, R. F., et al. (2019). Extension of the gambin model to multimodal species abundance distributions. Methods Ecol. Evol. 10, 432–437. doi: 10.1111/2041-210X.13122
Matthews, T. J., Borregaard, M. K., Ugland, K. I., Borges, P. A. V., Rigal, F., Cardoso, P., et al. (2014). The gambin model provides a superior fit to species abundance distributions with a single free parameter: evidence, implementation and interpretation. Ecography 37, 1002–1011. doi: 10.1111/ecog.00861
Maurer, B. A., and McGill, B. J. (2011). “Measurement of species diversity,” in Biological Diversity: Frontiers in Measurement and Assessment, eds A. E. Magurran and B. J. McGill (Oxford: Oxford University Press), 55–64.
May, R. (1975). “Patterns of species abundance and diversity,” in Ecology and Evolution of Communities, eds M. L. D. Cody and J. M. Diamond (Cambridge, MA: Harvard University Press), 81–120.
McGill, B. J. (2003). A test of the unified neutral theory of biodiversity. Nature 422, 881–885. doi: 10.1038/nature01583
McGill, B. J., Etienne, R. S., Gray, J. S., Alonso, D., Anderson, M. J., Benecha, H. K., et al. (2007). Species abundance distributions: moving beyond single prediction theories to integration within an ecological framework. Ecol. Lett. 10, 995–1015. doi: 10.1111/j.1461-0248.2007.01094.x
Miliči̇ć, M., Vujiæ, A., Jurca, T., and Cardoso, P. (2017). Designating conservation priorities for Southeast European hoverflies (Diptera: Syrphidae) based on species distribution models and species vulnerability. Insect Conserv. Divers. 10, 354–366. doi: 10.1111/icad.12232
Niemelä, J. (1993). Mystery of the missing species: species-abundance distribution of boreal ground beetles. Ann. Zool. Fennici 30, 169–172.
Niu, Y., Ren, G., Lin, G., Di Biase, L., and Fattorini, S. (2020). Fine-scale vegetation characteristics drive insect ensemble structures in a desert ecosystem: the tenebrionid beetles (Coleoptera: Tenebrionidae) inhabiting the Ulan Buh Desert (Inner Mongolia, China). Insects 11:410. doi: 10.3390/insects11070410
Pan, C., Feng, Q., Liu, J., Li, Y., Li, Y., and Yu, X. (2018). Community structure of grassland ground-dwelling arthropods along increasing soil salinities. Environ. Sci. Pollut. Res. 25, 7479–7486. doi: 10.1007/s11356-017-1011-1
Pennino, M. G., Paradinas, I., Illian, J. B., Muñoz, F., Bellido, J. M., López-Quílez, A., et al. (2019). Accounting for preferential sampling in species distribution models. Ecol. Evol. 9, 653–663. doi: 10.1002/ece3.4789
Picanço, A., Rigal, F., Matthews, T. J., Cardoso, P., and Borges, P. A. V. (2017). Impact of land-use change on flower-visiting insect communities on an oceanic island. Insect Conserv. Divers. 10, 211–223. doi: 10.1111/icad.12216
Pizzolotto, R., Gobbi, M., and Brandmayr, P. (2014). Changes in ground beetle assemblages above and below the treeline of the Dolomites after almost 30 years (1980/2009). Ecol. Evol. 4, 1284–1294. doi: 10.1002/ece3.927
Prado, P., Miranda, M., and Chalom, A. (2018). sads: Maximum Likelihood Models for Species Abundance Distributions. [R Package. version 3.5]. Available online at: https://cran.r-project.org/web/packages/sads/index.html
Preston, F. W. (1948). The commonness, and rarity, of species. Ecology 29, 254–283. doi: 10.2307/1930989
Pueyo, S., He, F., and Zillio, T. (2007). The maximum entropy formalism and the idiosyncratic theory of biodiversity. Ecol. Lett. 10, 1017–1028. doi: 10.1111/j.1461-0248.2007.01096.x
Redford, K. H., Huntley, B. J., Roe, D., Hammond, T., Zimsky, M., Lovejoy, T. E., et al. (2015). Mainstreaming biodiversity: conservation for the twenty-first century. Front. Ecol. Evol. 3:137. doi: 10.3389/fevo.2015.00137
Roume, A., Ouin, A., Raison, L., and Deconchat, M. (2011). Abundance and species richness of overwintering ground beetles (Coleoptera: Carabidae) are higher in the edge than in the centre of a woodlot. Eur. J. Entomol. 108, 615–622.
Stier, A. C., Bolker, B. M., and Osenberg, C. W. (2016). Using rarefaction to isolate the effects of patch size and sampling effort on beta diversity. Ecosphere 7:e01612. doi: 10.1002/ecs2.1612
Sugihara, G. (1980). Minimal community structure: an explanation of species abundance patterns. Am. Nat. 116, 770–787.
Tsafack, N., Di Biase, L., Xie, Y., Wang, X., and Fattorini, S. (2019a). Carabid community stability is enhanced by carabid diversity but reduced by aridity in Chinese steppes. Acta Oecol. 99:103450. doi: 10.1016/j.actao.2019.103450
Tsafack, N., Rebaudo, F., Wang, H., Nagy, D. D., Xie, Y., Wang, X., et al. (2019b). Carabid community structure in northern China grassland ecosystems: effects of local habitat on species richness, species composition and functional diversity. PeerJ 6:e6197. doi: 10.7717/peerj.6197
Tsafack, N., Xie, Y., Wang, X., and Fattorini, S. (2020). Influence of climate and local habitat characteristics on carabid beetle abundance and diversity in Northern Chinese Steppes. Insects 11:19. doi: 10.3390/insects11010019
Ugland, K. I., Lambshead, P. J. D., McGill, B. J., Gray, J. S., O’Dea, N., Ladle, R. J., et al. (2007). Modelling dimensionality in species abundance distributions: description and evaluation of the Gambin model. Evolutionary Ecol. Res. 9, 313–324.
Ulrich, W., Ollik, M., and Ugland, K. I. (2010). A meta-analysis of species–abundance distributions. Oikos 119, 1149–1155. doi: 10.1111/j.1600-0706.2009.18236.x
Ulrich, W., Soliveres, S., Thomas, A. D., Dougill, A. J., and Maestre, F. T. (2016). Environmental correlates of species rank – abundance distributions in global drylands. Perspect. Plant Ecol. Evol. Syst. 20, 56–64. doi: 10.1016/j.ppees.2016.04.004
Volkov, I., Banavar, J. R., Hubbell, S. P., and Maritan, A. (2003). Neutral theory and relative species abundance in ecology. Nature 424, 1035–1037. doi: 10.1038/nature01883
Werger, M. J. A., and van Staalduinen, M. A. (2012). Eurasian Steppes. Ecological Problems and Livelihoods in a Changing World. Dordrecht: Springer.
Western, D. (1992). The biodiversity crisis: a challenge for biology. Oikos 63, 29–38. doi: 10.2307/3545513
Keywords: species abundance models, gambin models, Carabidae, ground beetles, Asia, arid environments, grasslands
Citation: Tsafack N, Borges PAV, Xie Y, Wang X and Fattorini S (2021) Emergent Rarity Properties in Carabid Communities From Chinese Steppes With Different Climatic Conditions. Front. Ecol. Evol. 9:603436. doi: 10.3389/fevo.2021.603436
Received: 06 September 2020; Accepted: 06 April 2021;
Published: 23 April 2021.
Edited by:
Bradley S. Case, Auckland University of Technology, New ZealandReviewed by:
Raisa Sukhodolskaya, Tatarstan Academy of Sciences, RussiaJulien Pétillon, University of Rennes 1, France
Agnieszka Kosewska, University of Warmia and Mazury in Olsztyn, Poland
Copyright © 2021 Tsafack, Borges, Xie, Wang and Fattorini. This is an open-access article distributed under the terms of the Creative Commons Attribution License (CC BY). The use, distribution or reproduction in other forums is permitted, provided the original author(s) and the copyright owner(s) are credited and that the original publication in this journal is cited, in accordance with accepted academic practice. No use, distribution or reproduction is permitted which does not comply with these terms.
*Correspondence: Noelline Tsafack, bm9lbGxpbmUudHNhZmFja0BnbWFpbC5jb20=