 Eulogio Chacón-Moreno1,2*
 Mayanín Rodríguez-Morales1
 Daniela Paredes3Patricia Suárez del Moral4
 Anderson Albarrán3
- 1Institute of Environmental and Ecological Sciences, Faculty of Sciences, University of Los Andes, Merida, Venezuela
- 2Department of Crop and Forest Sciences, Universitat de Lleida, Lleida, Spain
- 3Department of Geography, Faculty of Forestry and Environmental Sciences, University of Los Andes, Merida, Venezuela
- 4Department of Biology, Faculty of Sciences, University of Los Andes, Merida, Venezuela
The treeline in the Andes is considered an essential ecotone between the Montane forest and Páramo. This treeline in the Venezuelan Andes corresponds with a transitional ecosystem defined as the Páramo forest. In this work, we identify and analyze the impact of climate warming and land transformation as agents altering the Páramo forest ecosystem’s spatial dynamics along the Venezuelan Andes’ altitudinal gradient. We carry out multitemporal studies of 57 years of the land transformation at different landscapes of the Cordillera de Mérida and made a detailed analysis to understand the replacement of the ecosystems potential distribution. We found that the main ecosystem transition is from Páramo to the Páramo forest and from Páramo to the Montane forest. Based on the difference between the current lower Páramo limit and the Forest upper limit for 1952, the treeline border’s displacement is 72.7 m in the 57 years of study, representing ∼12.8 m per decade. These changes are mainly driven by climate warming and are carried out through an ecological process of densification of the woody composition instead of the shrubland structure. We found that Páramo forest ecosystems practically have been replaced by the Pastures and fallow vegetation, and the Crops. We present a synthesis of the transition and displacement of the different ecosystems and vegetation types in the treeline zone. The impact of climate warming and deforestation on the Páramo forest as a representative ecosystem of the treeline shows us that this study is necessary for an integrated global change adaptation plan.
Introduction
Global change impacts biodiversity by different drivers acting at the global and regional scales (Sage, 2020). Two of these drivers are climate warming and the alteration of precipitation operating on a worldwide scale. The land transformation works at a regional scale but with consequences globally (Sage, 2020). In the Andes mountains, forest loss is the main change observed at lower elevations, caused by increased pastures and croplands. In contrast, a shrub encroachment into highland grasslands, and an increase in woody vegetation, is probably due to a climate change, explicitly the increment of temperature, between other explanations (Aide et al., 2019). In the Venezuelan Andes case, where shrubs and rosettes dominate the Páramo ecosystem, this encroachment is facilitated by a progressive shrub density change. Some isolated forest patches occurring up to 4,000 m are Polylepis spp. communities, with adaptative traits associated with these environments (Azócar et al., 2007). In general, species can respond to the climate warming through four responses: acclimate, adapt, shift their geographic distributions (migrate or dispersion), or eventual extinction (Holt, 1990; Huntley, 1992; Guisan et al., 1995; Bazzaz, 1996; Feeley et al., 2012; Vale and Araújo, 2018; Vinicius et al., 2018). In mountain landscapes, species can respond to climate change, with a vertical migration in a short distance (e.g., 500 m to counteract an increase of 3°C) (Peñuelas et al., 2002); the acceleration in the rate of increase in plant species richness (Steinbauer et al., 2018), with the local difference concerning to conditions as topography (Pauli and Halloy, 2019), and diversity of different spatial patterns for treeline dynamics (Bader et al., 2020). Most of these researches are focused on temperate alpine regions, but few on subtropical-tropical alpine regions (Pauli and Halloy, 2019).
How can forest migration occur in the Venezuelan Andes? Most of the works about the upward of treeline are for temperate or boreal systems, and little information is available about the impact of climate change on this migration in the tropical mountain (Fadrique et al., 2018). Tropical Andes have unique characteristics and very different from alpine zones. The Cordillera de Mérida in the Venezuelan Andes is a high and narrow mountain range located in the tropical belt with an extensive climatic variability (Andressen, 2007; Silva, 2010). Three particular determinants express this climatic variability (Andressen and Ponte, 1973; Monasterio and Reyes, 1980; Sarmiento, 1986; Vivas, 1992; Andressen, 2007; Silva, 2010; Llambí and Rada, 2019; Chacón-Moreno and Suárez del Moral, 2020): (a) the thermic gradient, (b) the configuration of the Cordillera de Mérida in two long mountain ranges and two long customary intermontane valleys, and (c) the latitudinal location of the Cordillera de Mérida, which confers it to be between two different climatic patterns in terms of the distribution of rainfall. These factors and the tropical localization are the central responsible higher diversity of ecosystems present in the region (Chacón-Moreno et al., 2013). As a result of this climate variability, vegetational belts are clearly defined along the altitudinal gradient (Monasterio, 1980a; Ataroff and Sarmiento, 2004; Costa et al., 2007; Josse et al., 2009; Chacón-Moreno et al., 2013; Llambí and Rada, 2019; Chacón-Moreno and Suárez del Moral, 2020).
One clear vegetation belt limit is the treeline, separating the Montane forest from the Páramo at the high Andes. In the high tropical mountains, the low temperatures, together with the steep slopes, the high radiation, water stress, and the considerable cloudiness, are the main adverse characteristics for the establishment of the arboreal vegetation, thus giving rise to what is known as the altitude limit of the forest or treeline (Tranquillini, 1979; Körner, 1998; Camarero and Gutiérrez, 2004; Cavieres and Piper, 2004; Körner and Paulsen, 2004; Bader et al., 2007; Wesche et al., 2008). Other environmental factors such as snow duration and elevation are also considered to influence the size and vulnerability of shrubs to freezing (Wheeler et al., 2014) and carbon limitation, although carbon was likely not limiting across the entire gradient (Wheeler et al., 2016). This limit, far from being a well-defined transition, is a gradual transition zone that is abrupt when observed on a small scale (Körner and Paulsen, 2004).
This treeline has been moving during the Andes geological history. The Andes ecosystems diversity has been changed dramatically in the Pleistocene and Holocene. Several palynological studies in the Andes support and indicate the forward and backward dynamics of the Andean vegetation belts due to climatic instability during the Pleistocene and Holocene, complemented by the high average net diversification rates of Páramo plant lineages (Van Der Hammen, 1974; Weingarten et al., 1990; Schubert and Vivas, 1993; Graf, 1996; Mahaney et al., 1997; Lachniet and Vazquéz-Selem, 2005; Rull et al., 2005; Stansell et al., 2005, 2007; Ni et al., 2006; Madriñán et al., 2013; Valencia et al., 2020). Specifically, higher temperatures brought about the advance of the Andean forest line over the Páramo, and lower temperatures caused the passage of the Páramo to lower altitudes. This process has been defined as the “flickering connectivity system” and works as an engine for ecological change and biodiversity in the Andean mountains (Flantua et al., 2019).
Between these two larges and contrasting ecosystems: Forest and Páramo exist an ecotone, considered an essential ecosystem that we defined as the Páramo forest. This ecosystem is a more open and smaller type of forest with three differentiable strata: tree canopy, bush, and intricated shrub strata (Arzac, 2008; Arzac et al., 2011), with the coexistence of floristic elements typical of higher elevations such as the Libanothamnus sp. and floristic aspects of lower altitudes characteristic of cloud forest or dry forest depending on the wet or dry slope, respectively, also finding the presence of elements typical of the transition between one ecosystem and another. This forest was called and defined by Monasterio (1980a) as a pre-páramo forest or páramo forest (Bosque Preparamero, Bosque Paramero). Like any transition between ecosystems, it is not abrupt. Still, gradual, presenting fluctuations in the altitude at which that transition zone is located, characterized by offering Páramo intrusions into the forest and vice versa as tongues of vegetation (Ramírez et al., 2009; Llambí et al., 2014; Llambí, 2015). The Páramo forest is considered a High-elevation Andean ecosystem, defined as an Under páramo ecosystem and Upper treeline forest, find between 3,000 and 3,500 m, and comprised of grasslands intermixed with isolated thickets of shrubs and dwarf trees (Arroyo and Cavieres, 2013; Malizia et al., 2020). For the treeline zone in the Cordillera de Los Andes in Venezuela, some studies describing species and growth form abundance patterns along the Páramo forest have been carried out (Ramírez et al., 2009; Arzac et al., 2011, 2019; Rodríguez et al., 2011; Llambí and Rada, 2019), and some others analyze the adaptive responses to environmental conditions to understand the restrictions to the establishment above the Páramo forest (Dulhoste, 2010; Puentes, 2010; Cáceres and Rada, 2011). Bader et al. (2007) made a comparative study of the spatial pattern for a wide range of tropical treelines, were found an abrupt change between the Páramo areas and the Mountain forest, that calls “fringed,” which usually consists of tall shrubs, tall grass, or trees with canopies down to ground level. Llambí (2015) presents a complete review of the vegetation structure, plant diversity, and dynamics of the Páramo forest ecosystem in the Venezuelan Andes.
Studies of tropical deforestation have traditionally focused on montane cloud forests but have disregarded the Páramo ecosystem; however, cattle grazing might alter a treeline (Bader et al., 2007). The Páramo forest ecosystem is one of the most fragile. Its disappearance could be due to the agricultural frontier’s advance, so only small remnants of what was once dense forest remain. There are no quantitative measurement studies of the treeline’s migration rate over the Páramo in the Venezuelan Andes. In this work, we identify and analyze the impact of climate change (climate warming and rainfall pattern distribution) and land transformation as primary change agents altering the cover and distribution of the Páramo forest ecosystem along an altitudinal gradient of the Venezuelan Andes.
Suppose that the temperature increases with elevation by climate change effects, and the rainfall distribution pattern is modified. In that case, we expect that the treeline’s spatial dynamics could be affected in its distribution and structure. Forest ecosystems could migrate upward about the warming and precipitation changes. As responses mechanisms to migrate, it could be associate with changes in the density of woody vegetation.
In the actual High Andes’ agricultural landscape, the transition between Mountain forest and Páramo ecosystems is interrupted with crops derived from the colonial time. We assume that the main agriculture uses were established over the Páramo forest ecosystem. Comparing the Páramo forest ecosystem’s potential distribution with the actual distribution, we will understand the impact of land transformation.
We use multitemporal studies of the last five decades to determine the landscape transformation of the Cordillera de Mérida in the treeline area. We made a detailed analysis to understand the replacement of the ecosystems potential distribution.
Materials and Methods
Study Area
The Cordillera de Mérida, as a representative area of the Venezuelan Andes, is a mountain range located between 7° 30′ and 10° 10′ north latitude and 69° 20′ and 72° 50′ west longitude (Schubert and Vivas, 1993; Figure 1), whose uplift began toward the end of the Eocene until reaching an elevation similar to the present one during the late Pliocene, and its current height at the end of the Pleistocene just before the Quaternary. We present three studies about landscape transformation and ecosystem distribution modeling for the Cordillera de Mérida. In Figure 1, we show the study areas in the context of the Venezuelan Andes Ecoregion (Chacón-Moreno et al., 2013). For each area, we consider a different landscape ecology approach. The first study is the Capaz river watershed, focused on the treeline zone, and where we detail the main transformation results and rate of change of the Páramo forest in almost six decades. The second area corresponds to the National Park Sierra Nevada’s treeline zone, where we develop a study of the densification of the woody vegetation, comparing aerial photography from 1952 to 1998. In the third study, the Alto Chama area, we analyze and compare the ecosystem’s potential distribution concerning the actual ecosystem cover, mostly focused on the high Andean mountain.
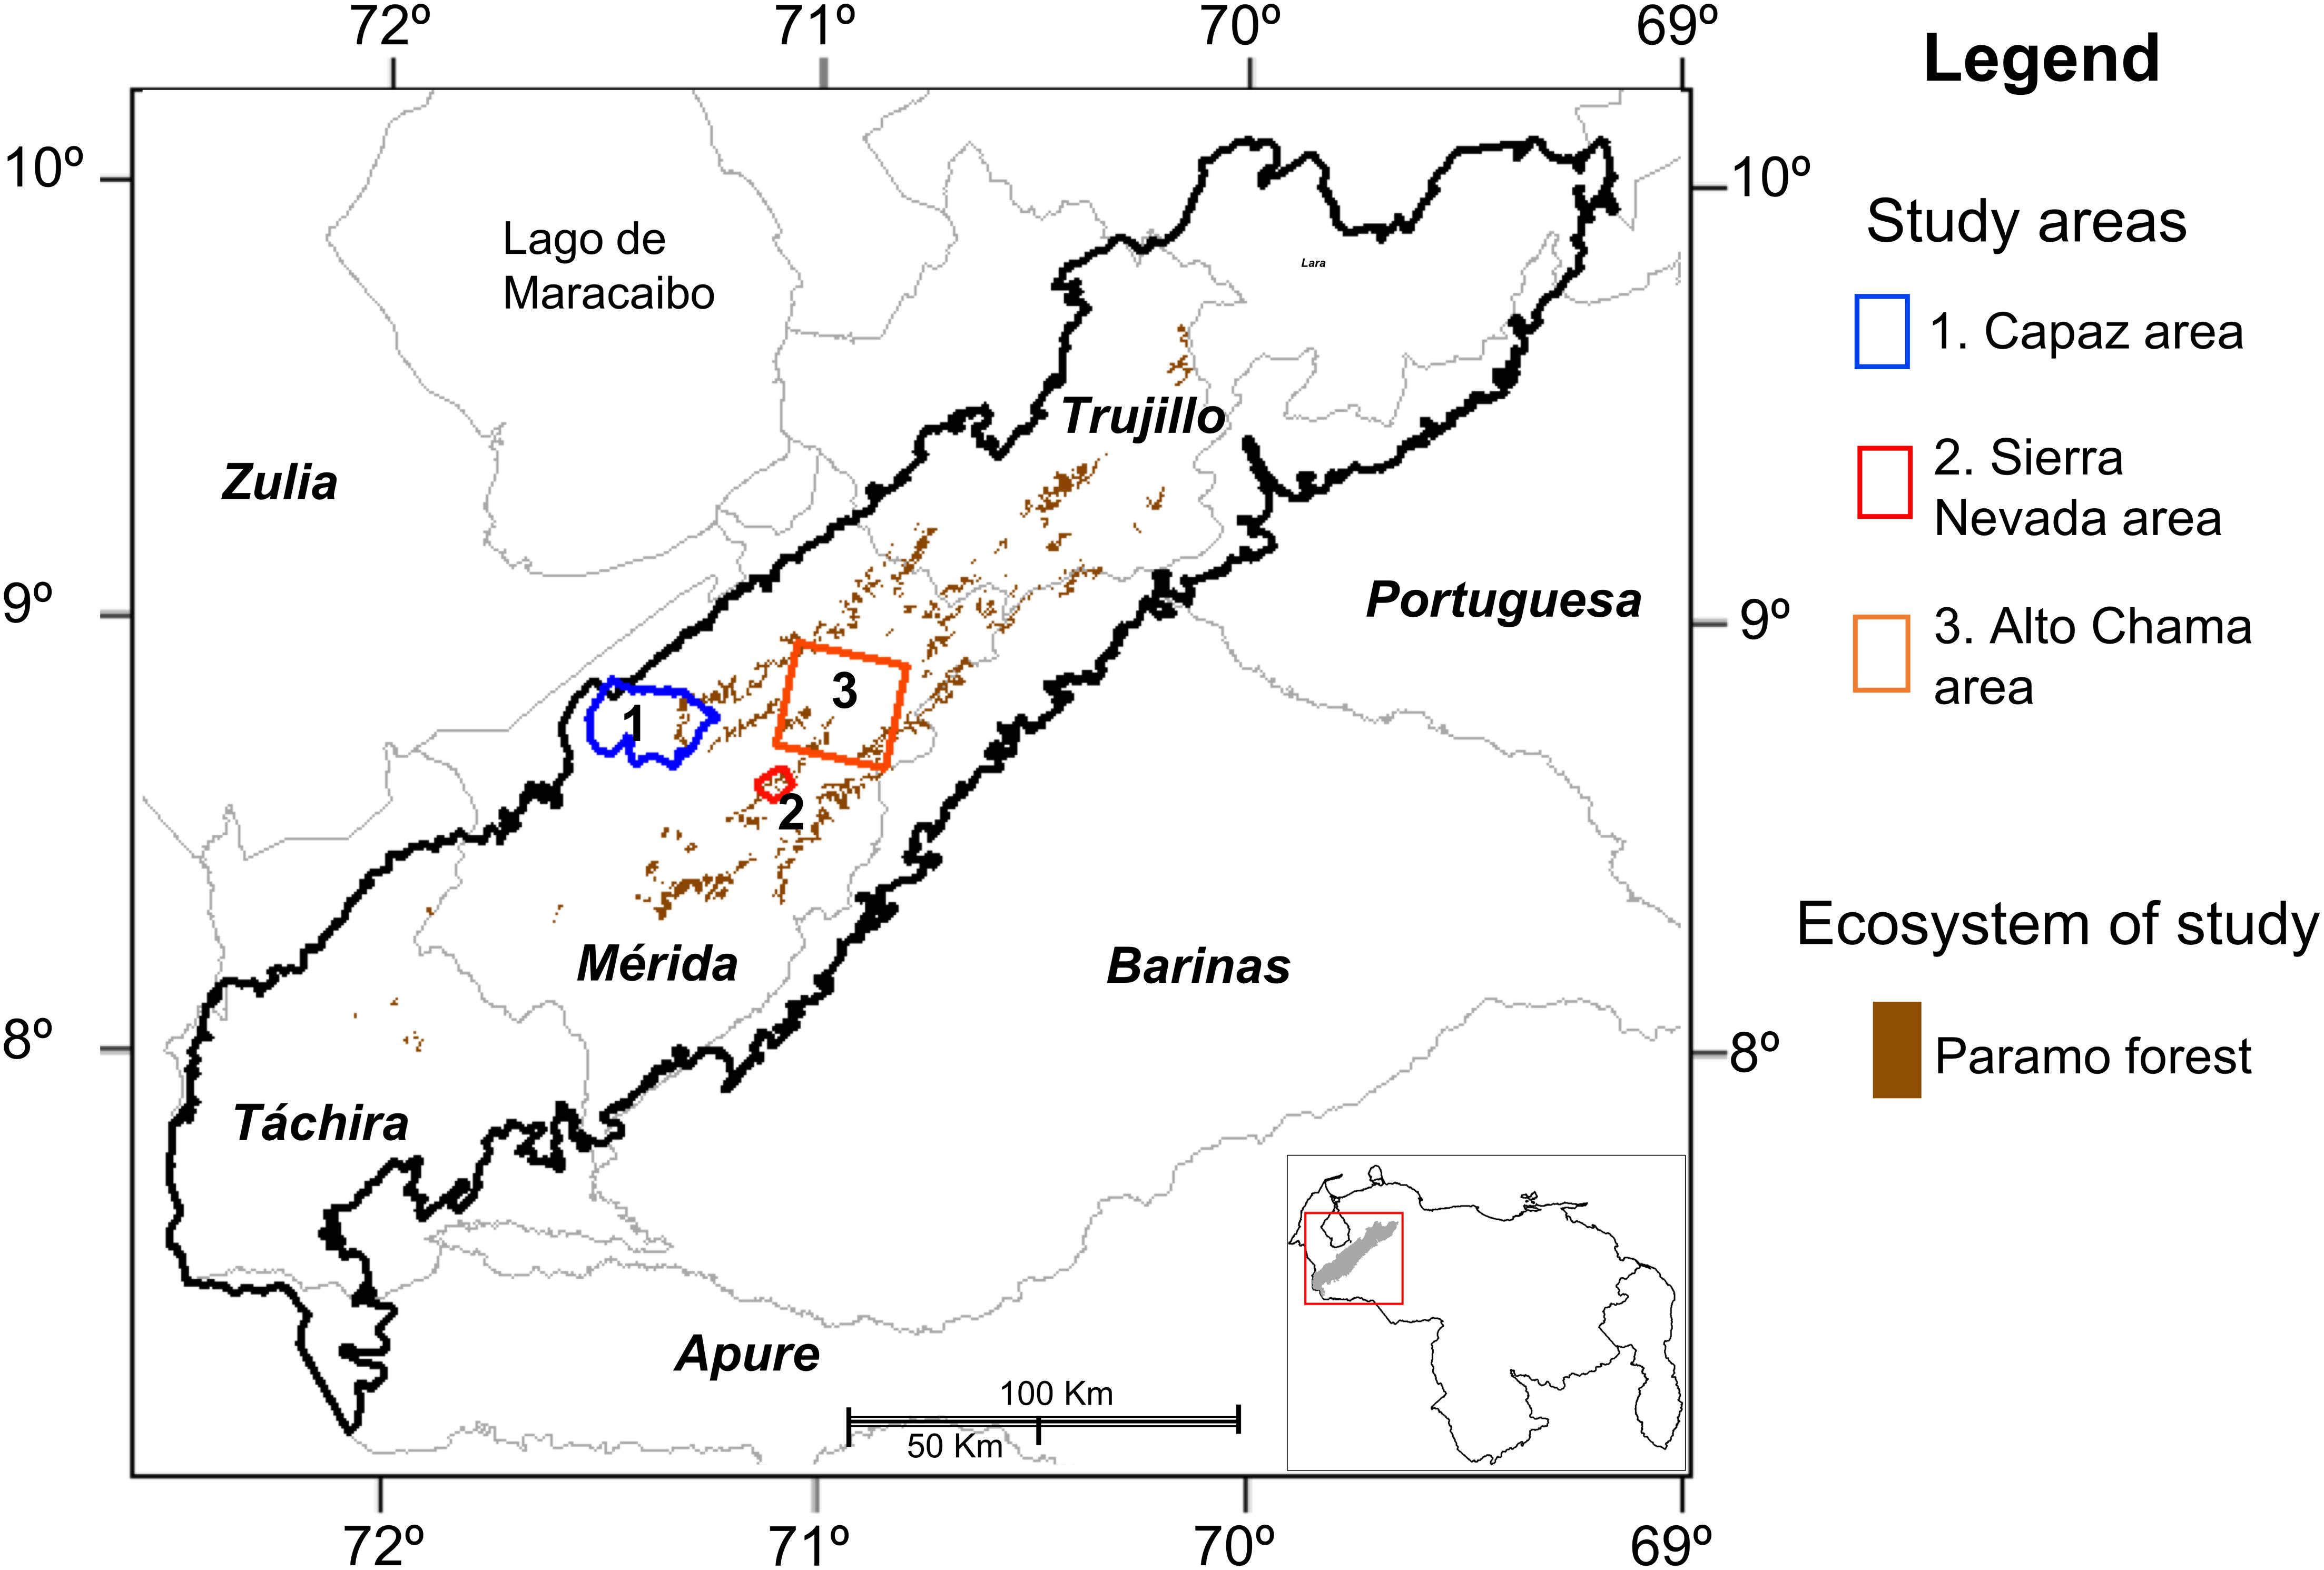
Figure 1. Map of the Venezuelan Andes Ecoregion (Cordillera de Mérida) into the national context. State political divisions and names are presented. The three study areas are shown as well as the main ecosystem of study in this work.
Capaz Study Case: Páramo Forest Migration
We made a detailed multitemporal landscape transformation analysis, considering four consuetudinary periods from 1952 to 2009 (57 years). This analysis was based on the interpretation of aerial photography and satellite imagery in the treeline area of Capaz watershed (Figure 1, area 1). The Capaz river basin extends from 100 to 4,200 m of altitude approximately in the Páramo of La Atravesada.
Ecosystems Maps
Following the methodology described by Pernía (1989), we interpreted the next aerial photographs covering the study area: (a) Mission A34 from 1952, scale 1: 40,000; (b) Mission 010380, the year 1973–1974, scale 1: 50,000; and (c) Mission 010493, the year 1997–1998, scale 1: 65,000. The interpretations were georeferenced, and we create ecological unit maps (Years: 1952, 1972, and 1998) following the approaches of Ataroff and Sarmiento (2004) and Chacón-Moreno (2004). The maps were processed using ILWIS Geographical Information System (Nijmeijer et al., 2001). Further description of the enterally work is presented in Rodríguez (2005) and Rodríguez-Morales et al. (2009). Based on the methods and approach of Chacón-Moreno (2007) and Chacón-Moreno et al. (2013), we processed and classified a Spot 5 image of January 2009 (Spot scene ID: 5 651-333 09/01/11 15:06:26 2 J; four spectral bands: Blue, Green, Red, and NIR; processing level 2A; pixel size 20 m) and a Landsat 7 image of June 2001 (Landsat scene ID: p006r54_7t20010616_z19, using five spectral bands: Blue, Green, Red, NIR, and SWIR 1; processing level 2A; pixel size 30 m), to obtain ecosystems maps of the Capaz study area for the years 2001 and 2009. We verify the Capaz ecosystem maps in eight field trips to the whole study area, with GPS and direct observation. The five maps previously elaborated were processed and analyzed to correct the georeference and coordinate system, to prepare maps in image raster format of 10 m pixel size, and create a detailed area at the treeline zone, where all the maps have the maximum coincidence (Figure 2). Georeference errors were calculated for each data processing.
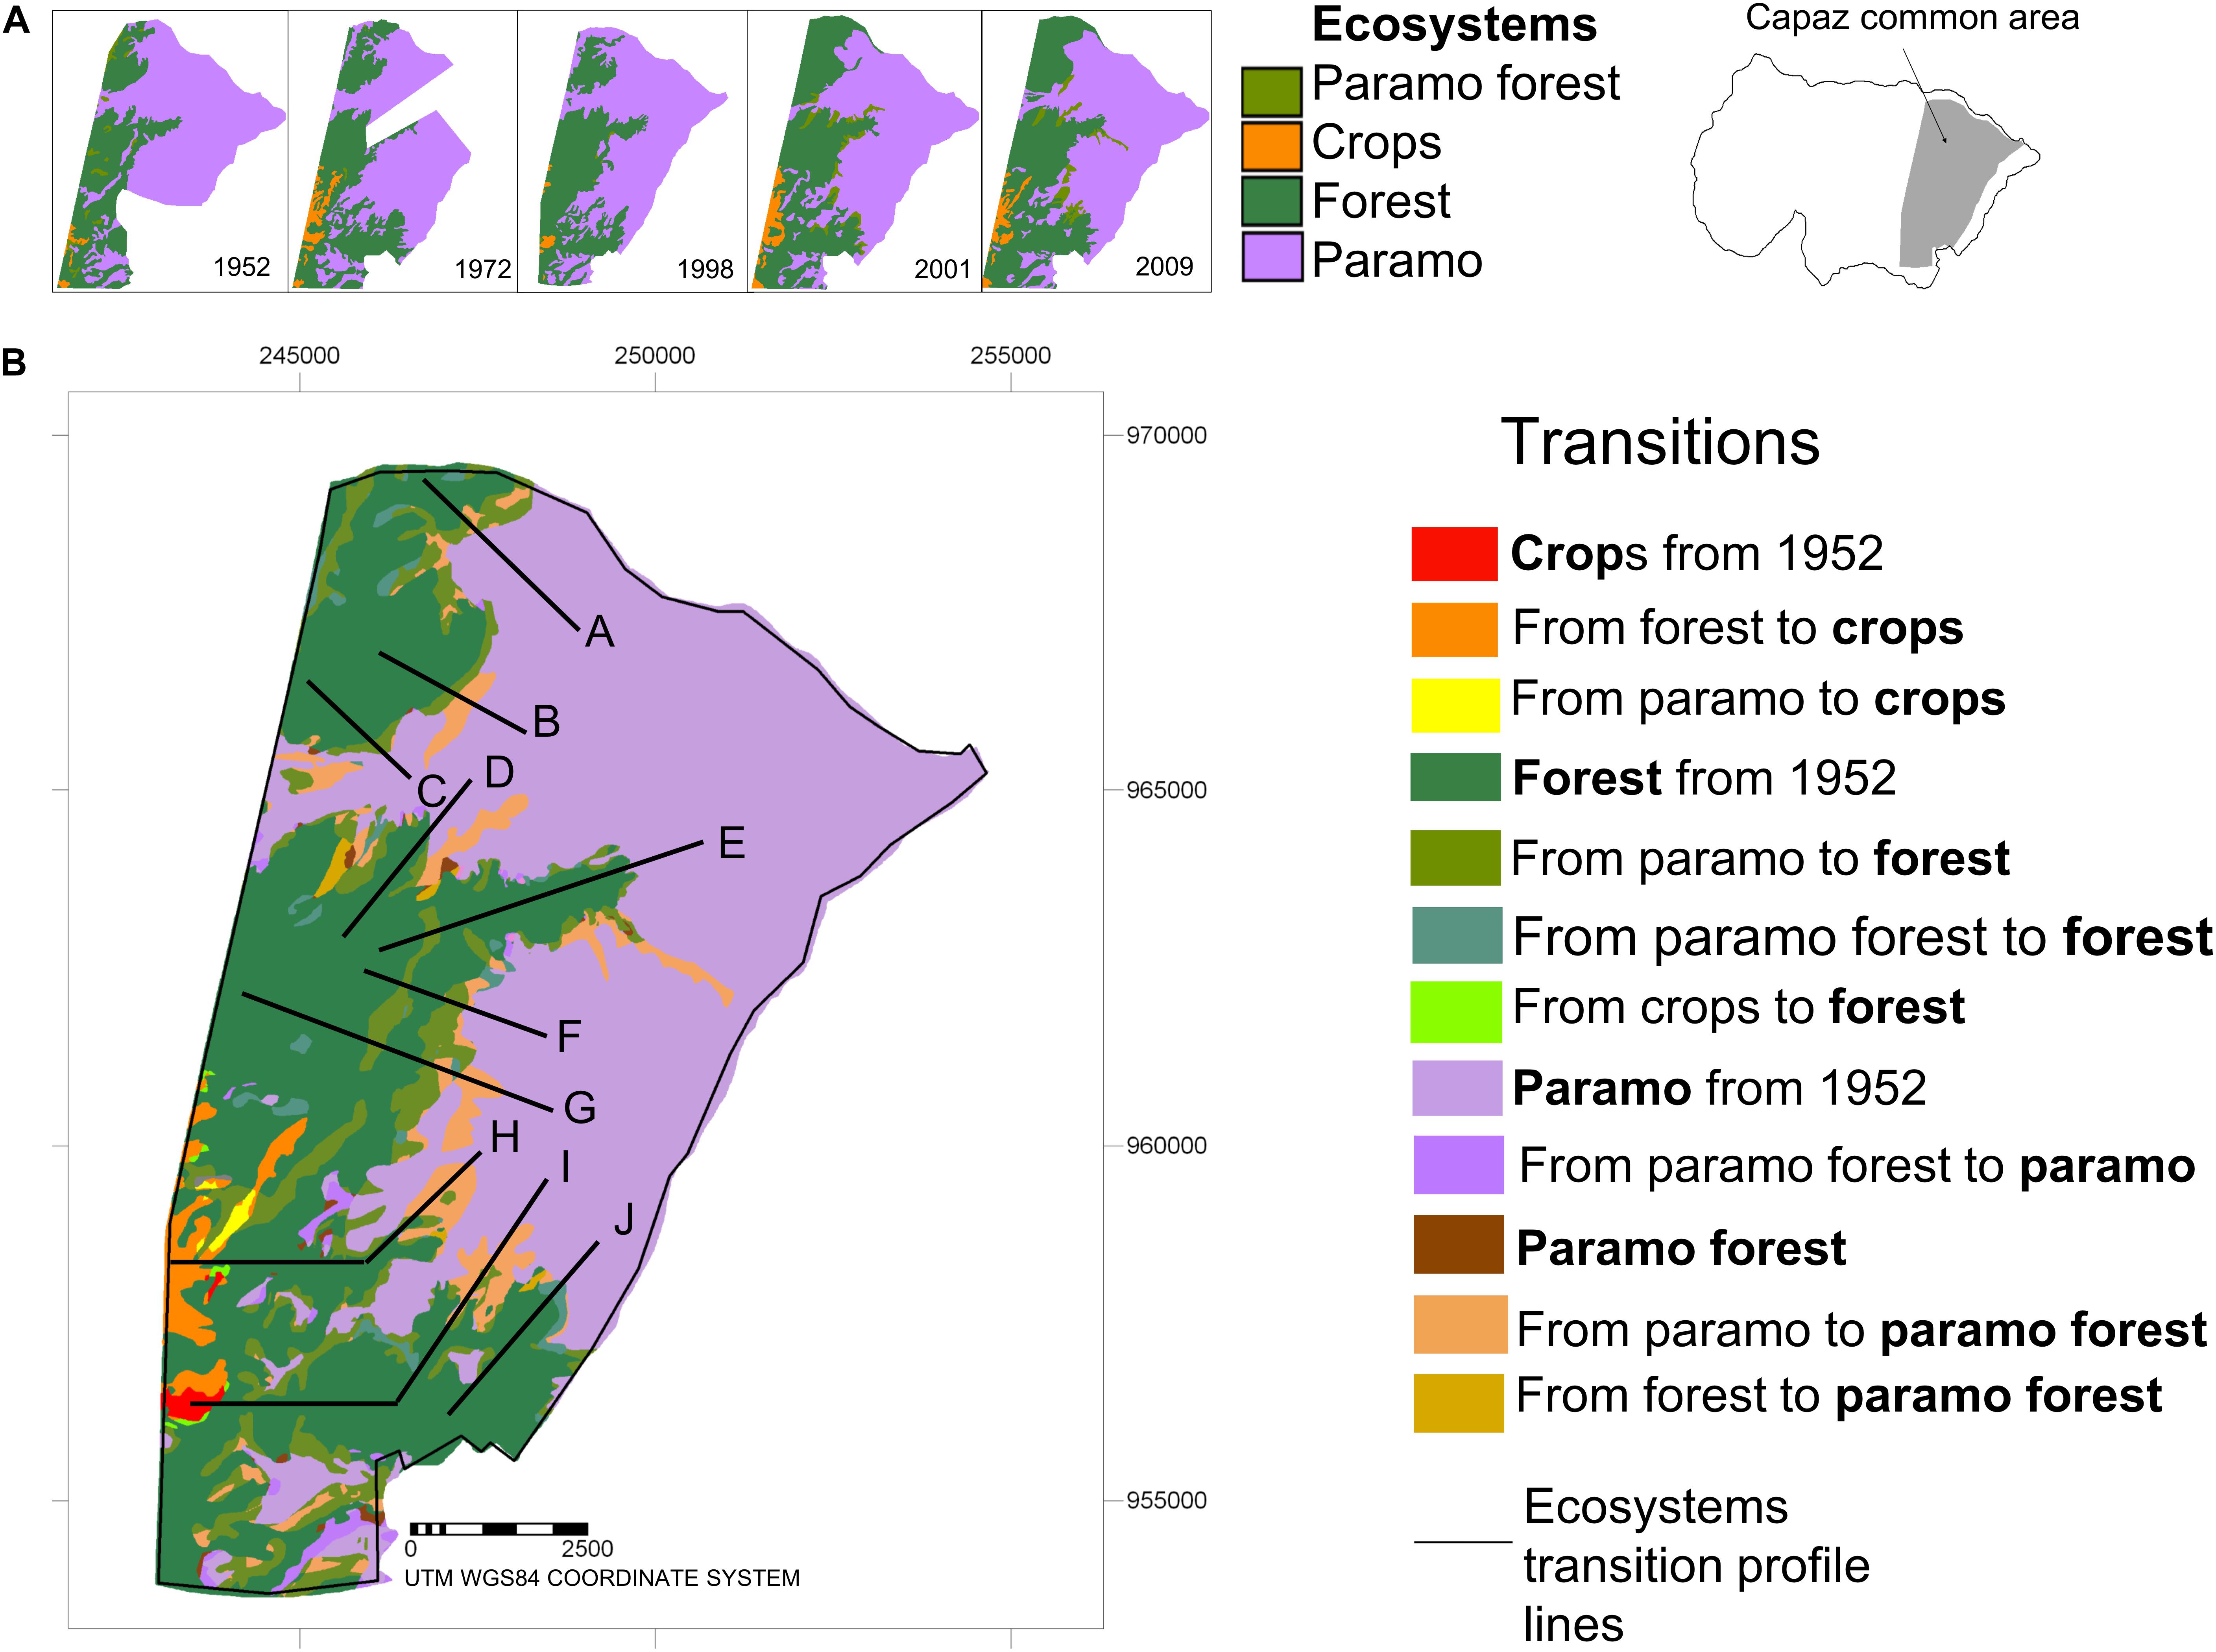
Figure 2. Ecosystem and transitions maps of the Capaz study area, Cordillera de Mérida, Venezuela. (A) Ecosystem maps for the 5 years of study (years are indicated for each map). The treeline zone’s detailed area was all the ecosystems maps have the maximum coincidence is presented (Capaz common area). (B) Ecosystem transitional/change map. The major transitions are indicated. Ten lines for the different transitional sequences of change are showed.
Transitional Ecosystem Map
The five maps were crossed one by one in sequential order to obtain an ecosystem transitional matrix and map. The analysis was simplified, considering the unit of transition’s predominance and size and the transition ecosystem’s existence at the beginning of the study. From the transitional matrix, we elaborate on the main change trajectories for the ecosystems and replacement systems. We create the ecosystem transition model, including a time sequence and percentages values of the rate change and accumulated area for each period.
Vertical Ecosystems Rate Displacement
We select on the map ten lines for the different transitional sequences of change (Figure 2). We create a profile diagram of the ecosystems sequence in line with the horizontal and vertical distances for each transect. The altitude data was recorded from a Digital Elevation Model (DEM) of the study area (Chacón-Moreno and Suárez del Moral, 2020). The range-limit average for the Páramo, Páramo forest, and Forest, for 2009 and 1952, was calculated. Based on the profile diagrams, we make measurements of the vertical and horizontal displacement to transition to Forest from the Páramo and the Páramo forest and create an index of change between ecosystems’ horizontal and vertical displacement. We calculate the displacement dividend index as the vertical displacement between the horizontal displacement, multiplied by 100 m, and divided between the change period’s years. We calculate the index’s average for the transition from Páramo to Forest, and Páramo forest to Forest.
Sierra Nevada National Park Study Case: Páramo Forest Densification
The second study is a temporal comparison of Forest and Páramo forest densification between 1952 and 1998 on the treeline zone into the Sierra Nevada National Park, without human intervention. The study area has 44,169 ha and is located within the National Park (UTM coordinates 942984-951037 N and 266982-276012 E), and corresponds to the La Aguada sector with an altitude range from 2,500 to 4,000 m (Figure 1). The Sierra Nevada National Park is a broad legal protected area of the Andes, founded in 1952. From this date, the study area does not have any human intervention, and some small agriculture areas from 1952 have recovery in a successional process.
Vegetation Maps
The three main ecosystems: Mountain forest, Páramo Forest, and Páramo, were classified and described in detail based on the vegetation types of each one. Therefore, vegetation types are the principal spatial unit considered in this study case. We interpreted aerial photographs from 1952 to 1998 to obtain vegetation maps with detailed forest density in the transitional zone (treeline) following the methods described in Santaella (2007). A sequence of aerial photographs of the mission A-34, scale 1:40,000, the year 1952, and mission 010493 scale 1:65,000, the year 1998, were used. Aerial photographs were georeferenced using 92 geographic points, of which 40 were taken from topographic maps, and 52 points got hold of in the field. We create a digital elevation model (DEM) based on a map of level curves and the geographical points taken in the field. This DEM was used to correct the preliminary georeferencing of both images and created ortho-photomaps with an error of 8.7 m. We interpreted the ortho-photomaps of both dates and define and characterize the vegetation units based on the differentiation of the main photo-elements (tone, texture, and geometry of the photos) (Pernía, 1989). We carried out field trips to the whole study area to check and confirm the vegetation units’ descriptions previously identified in the aerial images. Two vegetation maps were obtained, showing the areas corresponding to each vegetation unit in both periods 1952–1998.
Matrix of Change
We compare, between both periods, the areas and percentages of each vegetation unit for the study area, as well as the spatial changes that occurred concerning the original surfaces (1952) of each vegetation unit and the area comprehensive study. An overlap was made with the vegetation units corresponding to both periods to analyze the map generated with the vegetation units replaced between 1952 and 1998.
Alto Chama Study Case: Páramo Forest Land Use Impact
The third study evaluated Andean ecosystems’ potential distribution in the Chama River’s upper basin (Alto Chama) in the Venezuelan Andes. We focused on the human impact on the Páramo forest ecosystem. The study area responds to the totality of a Miranda satellite image (Figure 1). It was taken in 2014 for the Venezuelan Andes and occupied approximately 77,792.4 ha. The altitude range between 2,500 and 4,200 m. The study area covers the municipalities Justo Briceño, Miranda, Cardenal Quintero, Rangel, Santos Marquina, Libertador, and Caracciolo Parra y Olmedo.
Ecosystems Map
We elaborate on an ecosystem map of the area following the approach and methods described in Josse et al. (2009); Chacón-Moreno et al. (2013), and Paredes (2018). The preliminary map of ecosystems was made using a supervised digital classification (Chacón-Moreno et al., 2013) based on a Miranda satellite image (Four bands: red, blue, green, and infrared) spatial resolution of 10 m, dated January 22, 2014. The image’s possible ecosystems were defined by analyzing the combination of bands and colors and expert knowledge to determine the possible types of vegetation (coverage). The spectral signatures of the different ecosystems identified in the satellite image were created, starting from at least 30-pixel samples for each one. The spectral signatures were evaluated and statistically verified. A supervised parametric classification was generated using the maximum probability algorithm. Subsequently, the classified image was filtered and homogenized (Paredes, 2018). The map uses the ecosystem class definition derived from Josse et al. (2009) and Chacón-Moreno et al. (2013). The preliminary map of the ecosystems was checked in fieldwork, using corroboration of the information and establishing control points for greater precision. In this study case, we made a differentiation between Upper montane páramo shrublands and rosettes, and High-Andean páramo rosettes and cushion vegetation, but in the two previous study cases were included in the Páramo ecosystem or Páramo vegetation class. That is because the 10 m image resolution gives us the possibility to define in detail these ecosystems.
Ecosystems Potential Map
We created a map of ecosystems potential distribution for the study area based on the climate envelope model following the methods described in Chacón-Moreno (2007); Suárez del Moral and Chacón-Moreno (2011), and Paredes (2018). From the ecosystem map, the spatial coordinate points of the presence of each ecosystem were extracted as sampling points to correlate with the environmental variables (calibration phase): Temperature (T), Precipitation (Pp), and Ombrothermal Index (Io), which were spatialized for the Andes (Chacón-Moreno and Suárez del Moral, 2020). The spatial information was crossed to generate a data or attribute table that shows the information of these three elements in each of the selected ecosystems. Box plots were constructed to define the ranges of distribution of ecosystems concerning each variable (Envelope method). The box plot represents the minimum and maximum data values on a rectangle (box), aligned horizontally or vertically. Each of the axes corresponds to an environmental variable on which the hypothesis of its correlation with ecosystems’ distribution is hypothesized. From these graphs, the predictive equation of the model is determined. We elaborate on the map of the potential distribution of ecosystems based on the maps of environmental variables and the equations of the predictive models of the distribution of ecosystems (climate envelope model). We replace the environmental variables described in the equations with the environmental maps using logical operators of geographic information system (Chacón-Moreno et al., 2007). The ecological definitions and description of the statistical and mathematical procedures are presented in Ter Braak and Prentice (1988), Jongman et al. (1995), Ter Braak and Looman (1995), and Chacón-Moreno et al. (2013). We create an error matrix to compare the quality and sensitivity of the model, using a new data set of points (20 per ecosystem) in the same way as those obtained in the calibration phase (Congalton et al., 1983; Congalton, 1991; Janssen and van del Wel, 1994; Jenness and Wynne, 2007). We elaborate on a comparison map and matrix of change of the ecosystems potential distribution concerning the actual ecosystems distribution.
Results
The landscape ecology approach used in the research allowed us to obtain maps of vegetation and ecosystems, with different time scales, to evidence the impacts of global change in the treeline’s spatial dynamics in the Venezuelan Andes. The results address the processes of treeline migrations through change and transformation in a longtime sequence, and to know and understand the densification process as a driver of the treeline upward, all these under a climate change framework. Finally, we present the impacts of land use on the Páramo forest.
Capaz Study Case: Páramo Forest Migration
We present a sequence of ecosystem distribution maps for the Capaz study area’s five dates (Figure 2A). The area corresponds with the five maps’ coincidence zone at the treeline zone, ranging altitude gradient from 2,500 m (at the west side) to more than 4,000 m (at the east side). Maps from 1952 to 1972 have areas where data (aerial photographs) is missing for that zone. Following the sequence, we can observe that the Forest area is increasing over the Páramo area, and the Páramo forest is the smallest strip between the two large mentioned ecosystems.
We show a summary map of the landscape changes along the 57 years from 1952 (Figure 2B), where remark two main landscape transformation processes. The first one corresponds with the migration or displacement of the Forest ecosystem along the altitudinal gradient (from west to east), where areas than were Páramo ecosystem at the beginning of the study period (1952) change to Páramo forest or Forest ecosystems. Areas observed in the contact o transitional zone between “Páramo from 1952” and “Forest from 1952” in the map are showed as “from Páramo to Páramo forest” and “from Páramo to Forest.” It is clear that the sequence of change from Páramo to Forest is gradual and includes the pass for the Páramo forest ecosystem. The second landscape transformation is replacing the Forest ecosystem with a Crops system, observed on the map’s southwest side. Even some small Páramo areas change to the Crops system. Few and small areas back Forest ecosystem from Crop.
The crossing of the maps of Figure 2A results in a matrix of change. We present, in a simplified way, the main differences from ecosystems and replacement systems established in 1952 to the transition ecosystems along the period (57 years) (Table 1). This table complements the map (Figure 2B), where each ecosystem or replacement system increases or decreases the area. The area for crops is very few; however, the more significant transition comes from the Forest at the lowest altitude. The Forest ecosystem’s principal transformation comes from converting Páramo to Forest with more than 5% of the area in the first 45 years. The shift from the Páramo forest to Forest in each period is less than 0.6%. Páramo ecosystem increases the area very little, just less than 0.5% in two periods, and less than this quantity in other periods; mainly derived from Forest. Forest downward migration representing less than10% of the total rate of change in each period. Páramo forest is the ecosystem that increases, mainly from Páramo, in the last two periods. Pastures are a new ecosystem in the ended period.
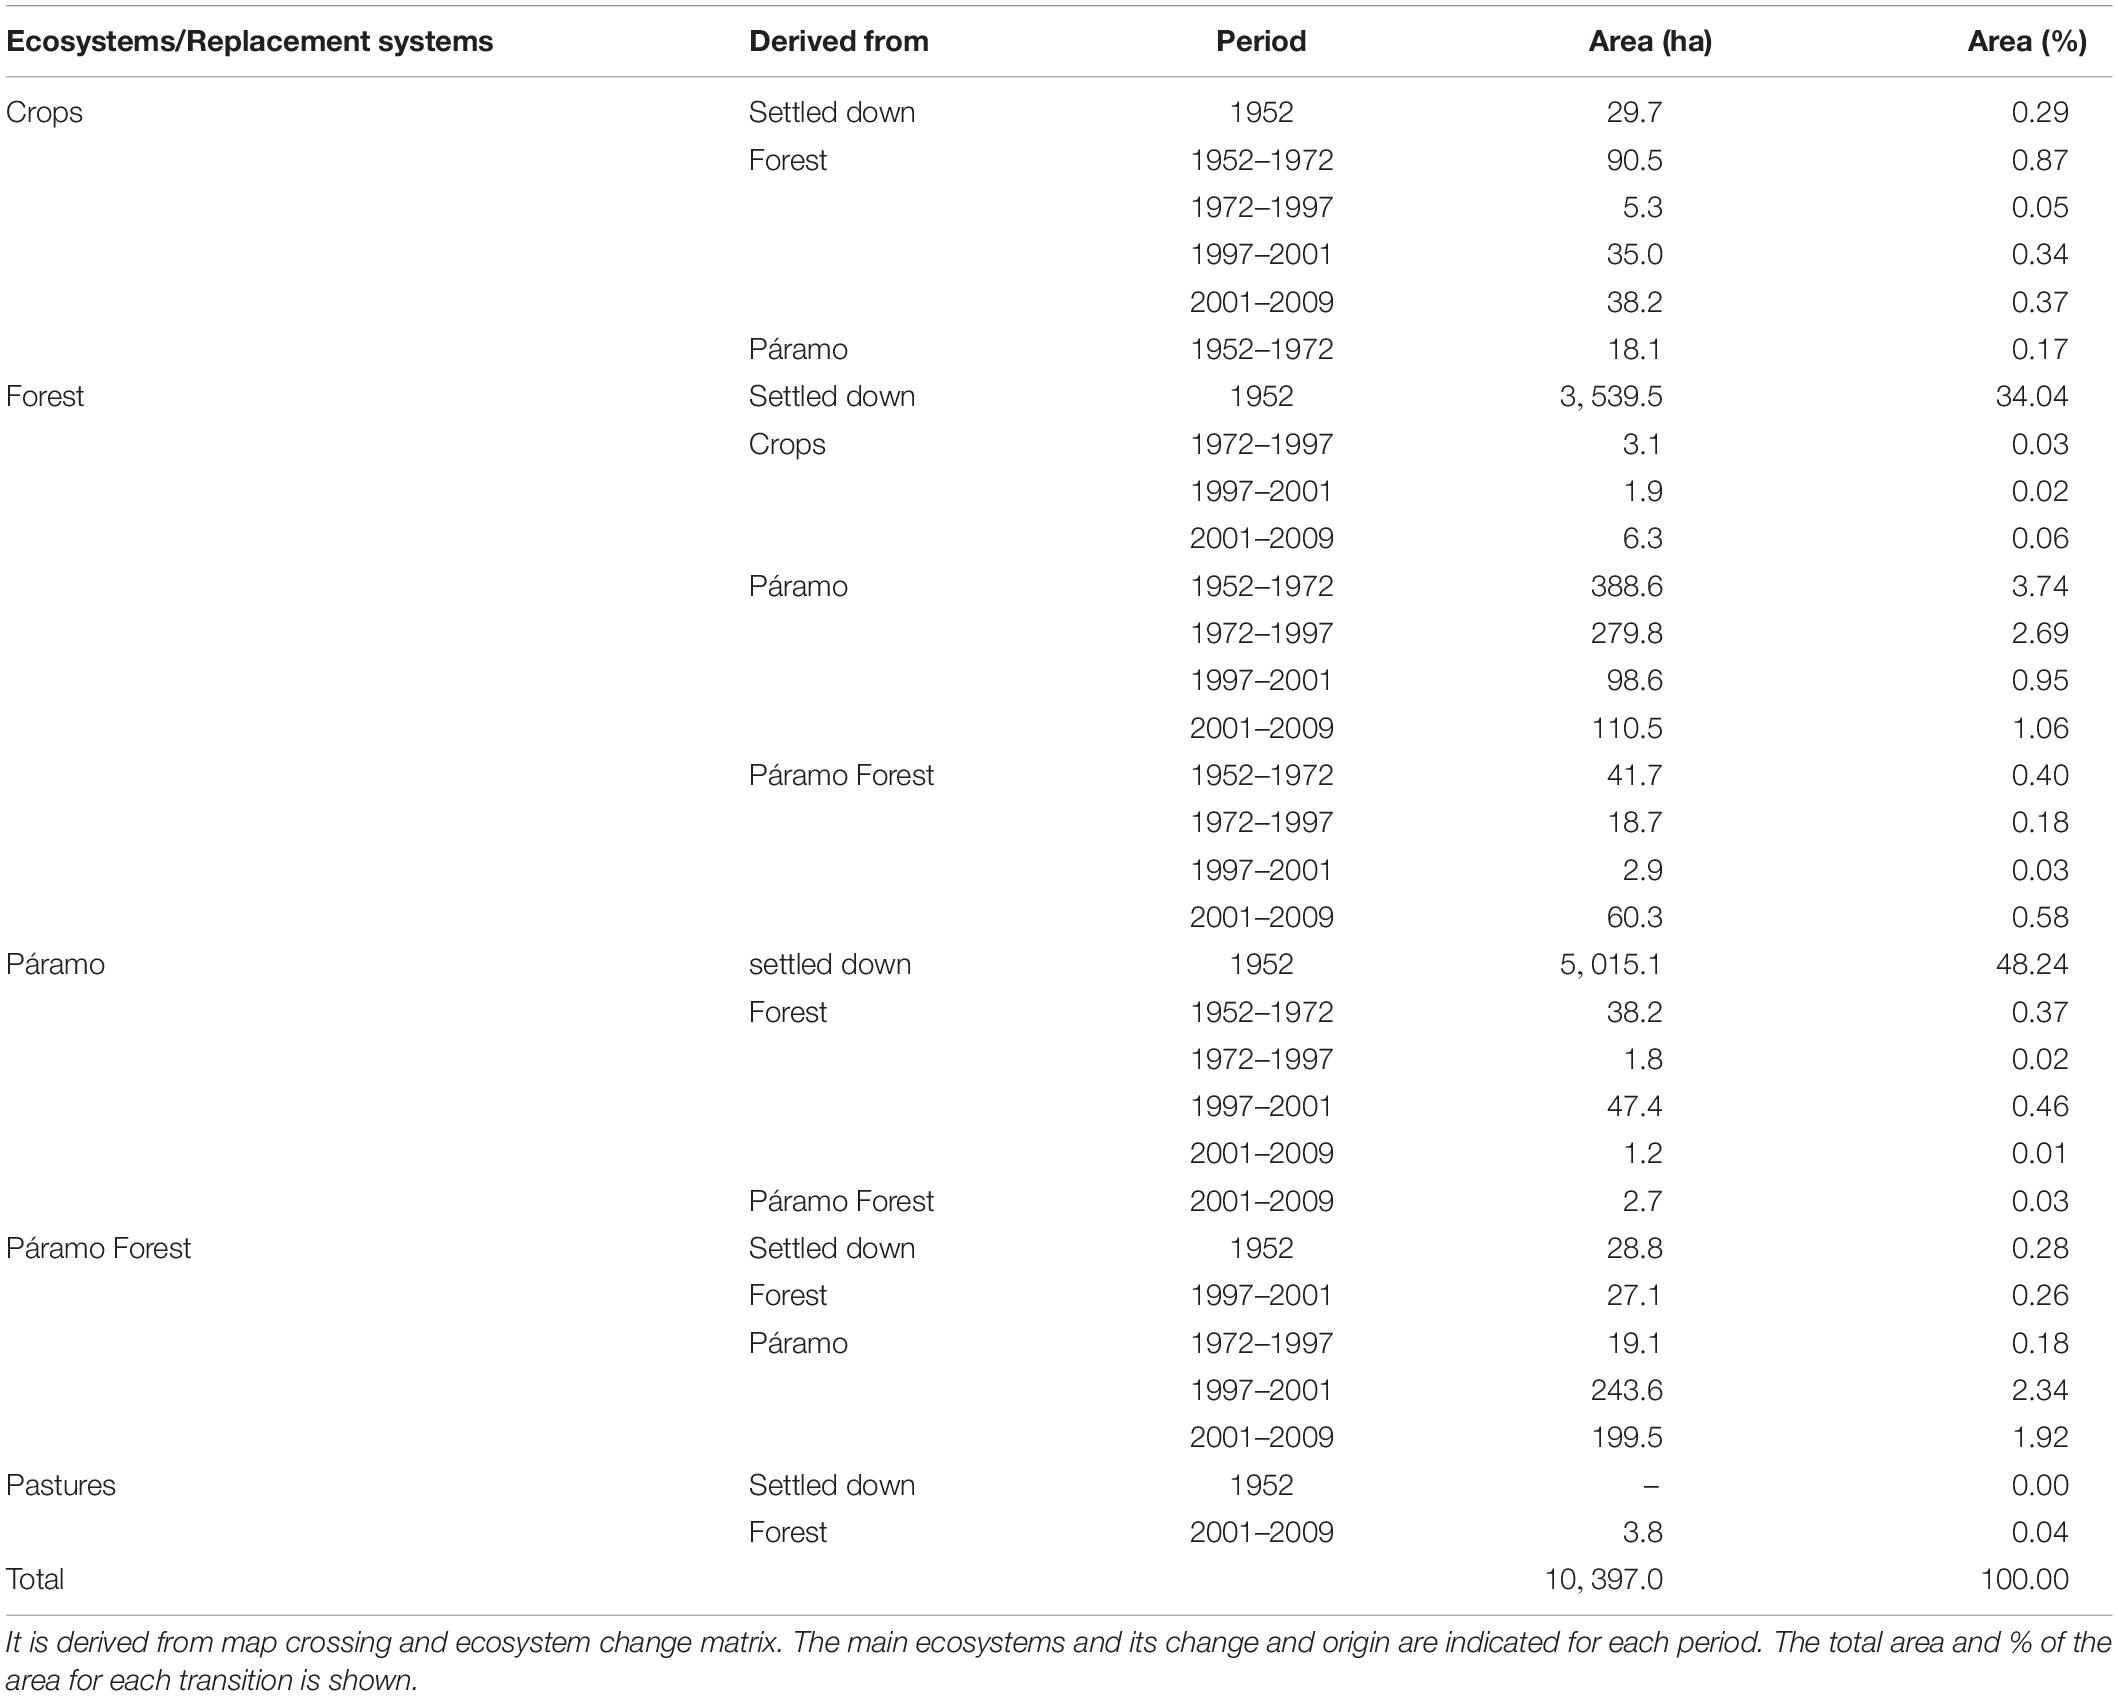
Table 1. Ecosystems transitions at the Capaz area, Cordillera de Mérida.
We summarize the total changes in the landscape transformation for the whole period (Table 2). The Crops system increases its area in a small percentage related to the entire study area, with a transformation rate of 3.1 ha per year. Forest is the ecosystem that more gain superficies, with more than 1,000 ha (9.7%) and a positive change rate of 12.7 ha per year. On the other hand, the Páramo ecosystem reduces its superficies by 12.1%, with a negative rate of 22.2 ha per year.
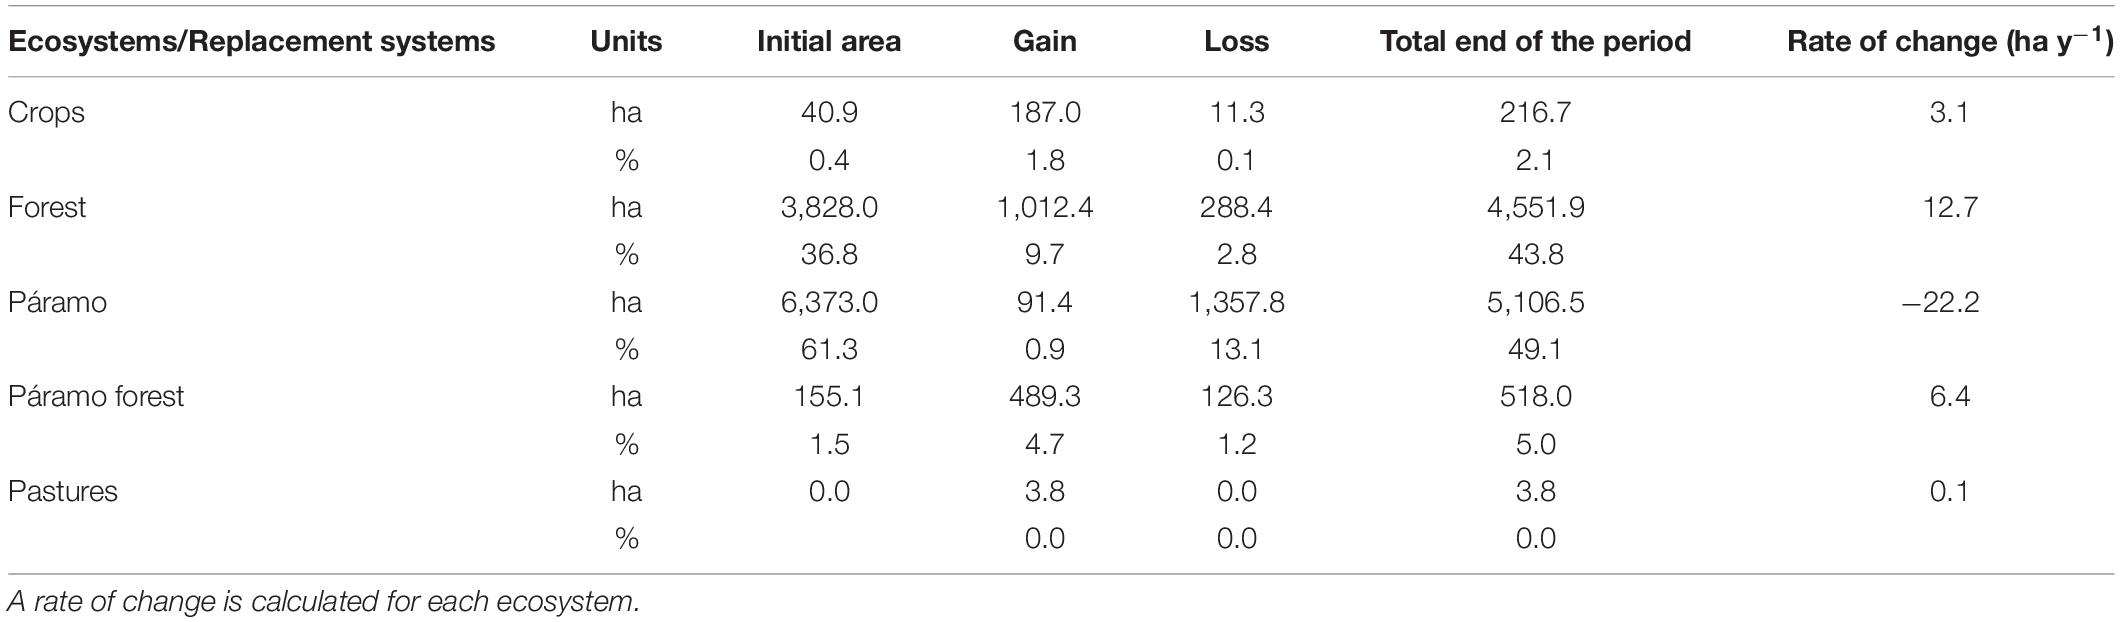
Table 2. Total area and % gain and loss for each ecosystem at the Capaz study area during the whole period (57 years from 1952 to 2009).
We elaborate on a model of the principal transitional states for the Capaz study area’s ecosystems and trajectories of change for the different periods (Figure 3), based on the landscape change represented in the map and transition results (Figure 2 and Tables 1, 2). The magnitude and % rate of transformation is indicated. We observe that the many ecosystem transitions are from Páramo to Páramo forest and Forest. In the last two periods, the change from Páramo to Páramo Forest is larger than the shift from Páramo to Forest. In this transition model, we present the initial and final Forest area (total area in ha and %). The Forest ecosystem increases from 34 to 41% (7%), mainly from the transition from the Páramo. The transition from the Páramo forest to Forest is essential in the last period, with a change of 0.58%. The decreasing or losses in the Forest area are small; only the difference from Forest to Crops in the first period is essential (0.87%).
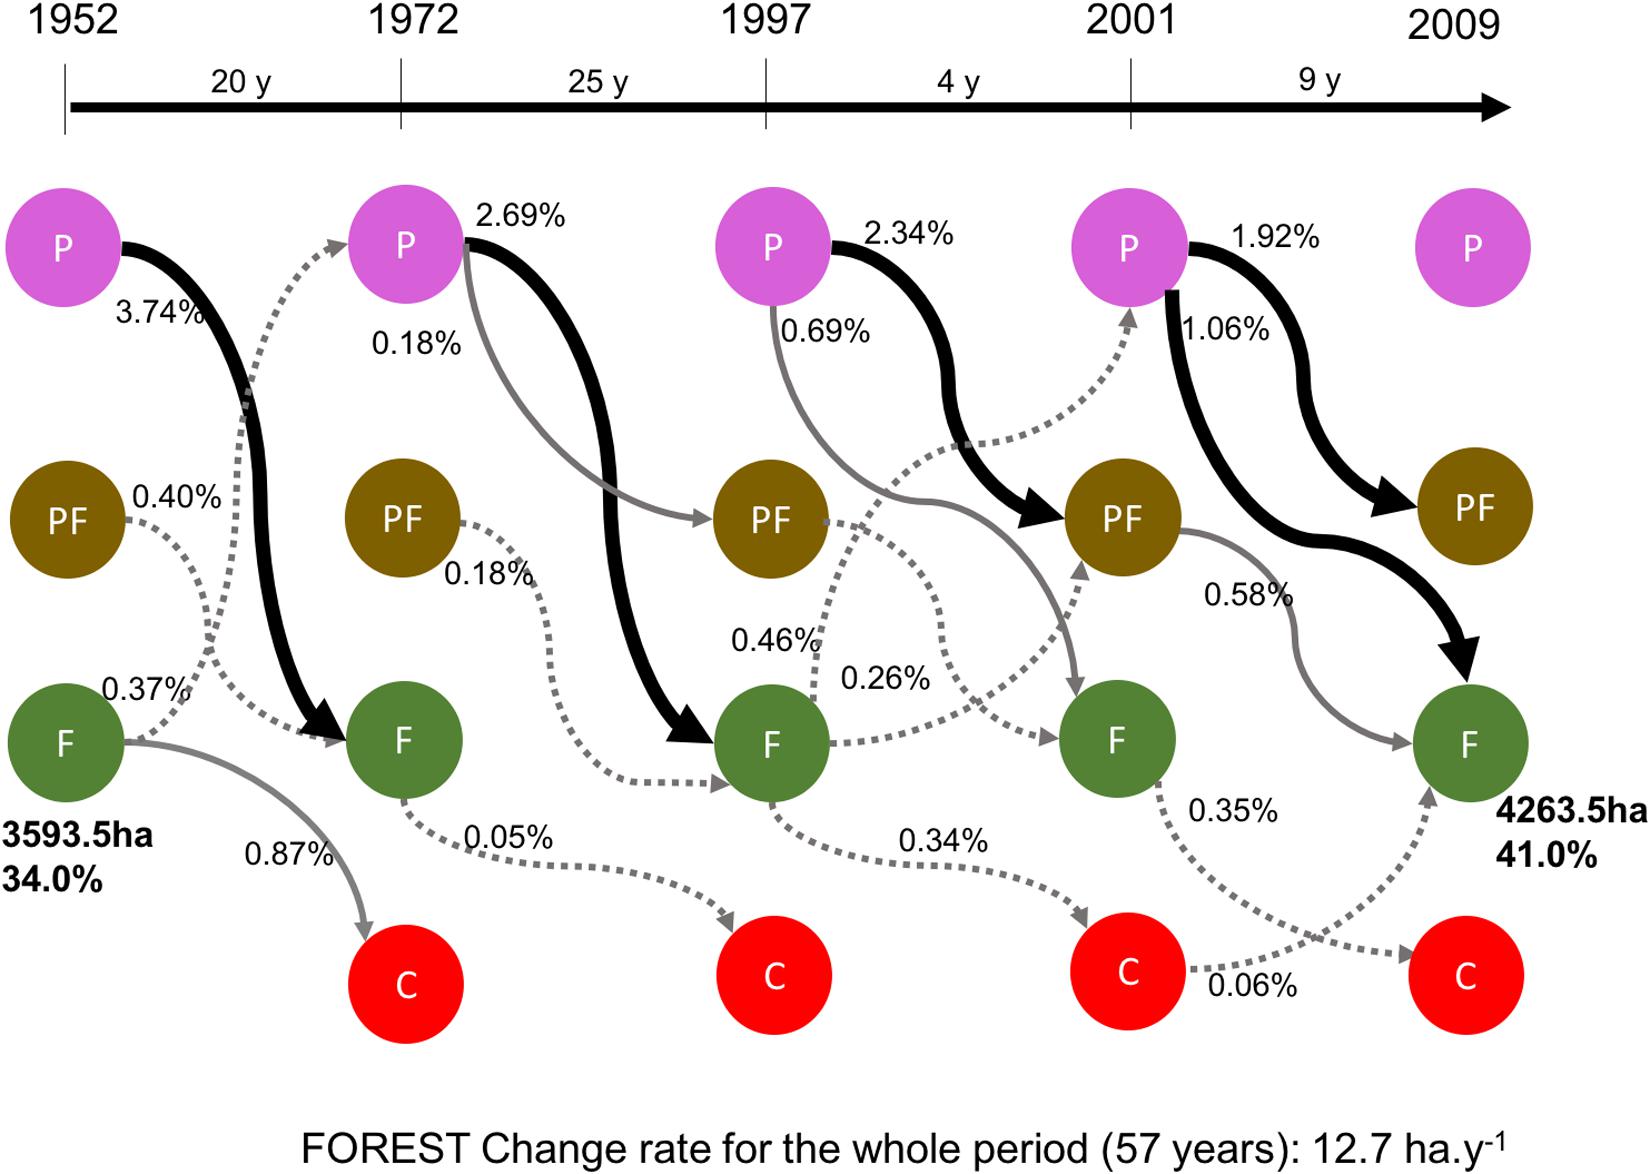
Figure 3. Model of main ecosystems transition of the Capaz study area (P: Páramo, F: Forest, PF: Páramo forest, and C: Crops) and trajectories of change (arrows) of the different period of study for ecosystem and replacement systems (thick continuous black arrow % change >1, continuous thin gray arrow % change <1 and >0.5, thin dotted gray arrow % change <0.5 and >0.05, % <0.05 is not indicated). Accumulated % of change is indicated for each arrow and the total and % area for forest ecosystem at the beginning and the end of the whole period.
We show the profile diagrams of the main ecosystems sequence and the horizontal and altitude distance for the ten lines indicated in Figure 2 (Figure 4). All the profiles have the same scale in altitude and horizontal axles, except for line J. We clearly can observe that all transects show a transitional sequence of ecosystems along the altitudinal gradient. In seven of the lines, the transition to Forest from Páramo is directly, and in three of the lines, this transition occurs through the Páramo forest. There is no transition in two lines (Line D and Line E); it means that the contact between Forest and Páramo reflects neutral changes in these two of ten lines (20%). We observe the occurrence of Crops at the lowest altitude of the transects. All the lines present a different slope; however, lines A, D, E, G, H, I, and J show a slope of around ∼20%. Lines B and F show a higher slope with a change of ∼30%. The average for the current lower limit for the Páramo ecosystem is 3352 ± 68 m (α = 0.1), and the upper limit for the Forest registered for 1952 was 3280 ± 61 m (α = 0.1). We found that the displacement of the treeline border, based on the difference between the current lower Páramo limit and the Forest upper limit for 1952, is 72.7 m in the 57 years of study, representing ∼12.8 m per decade.
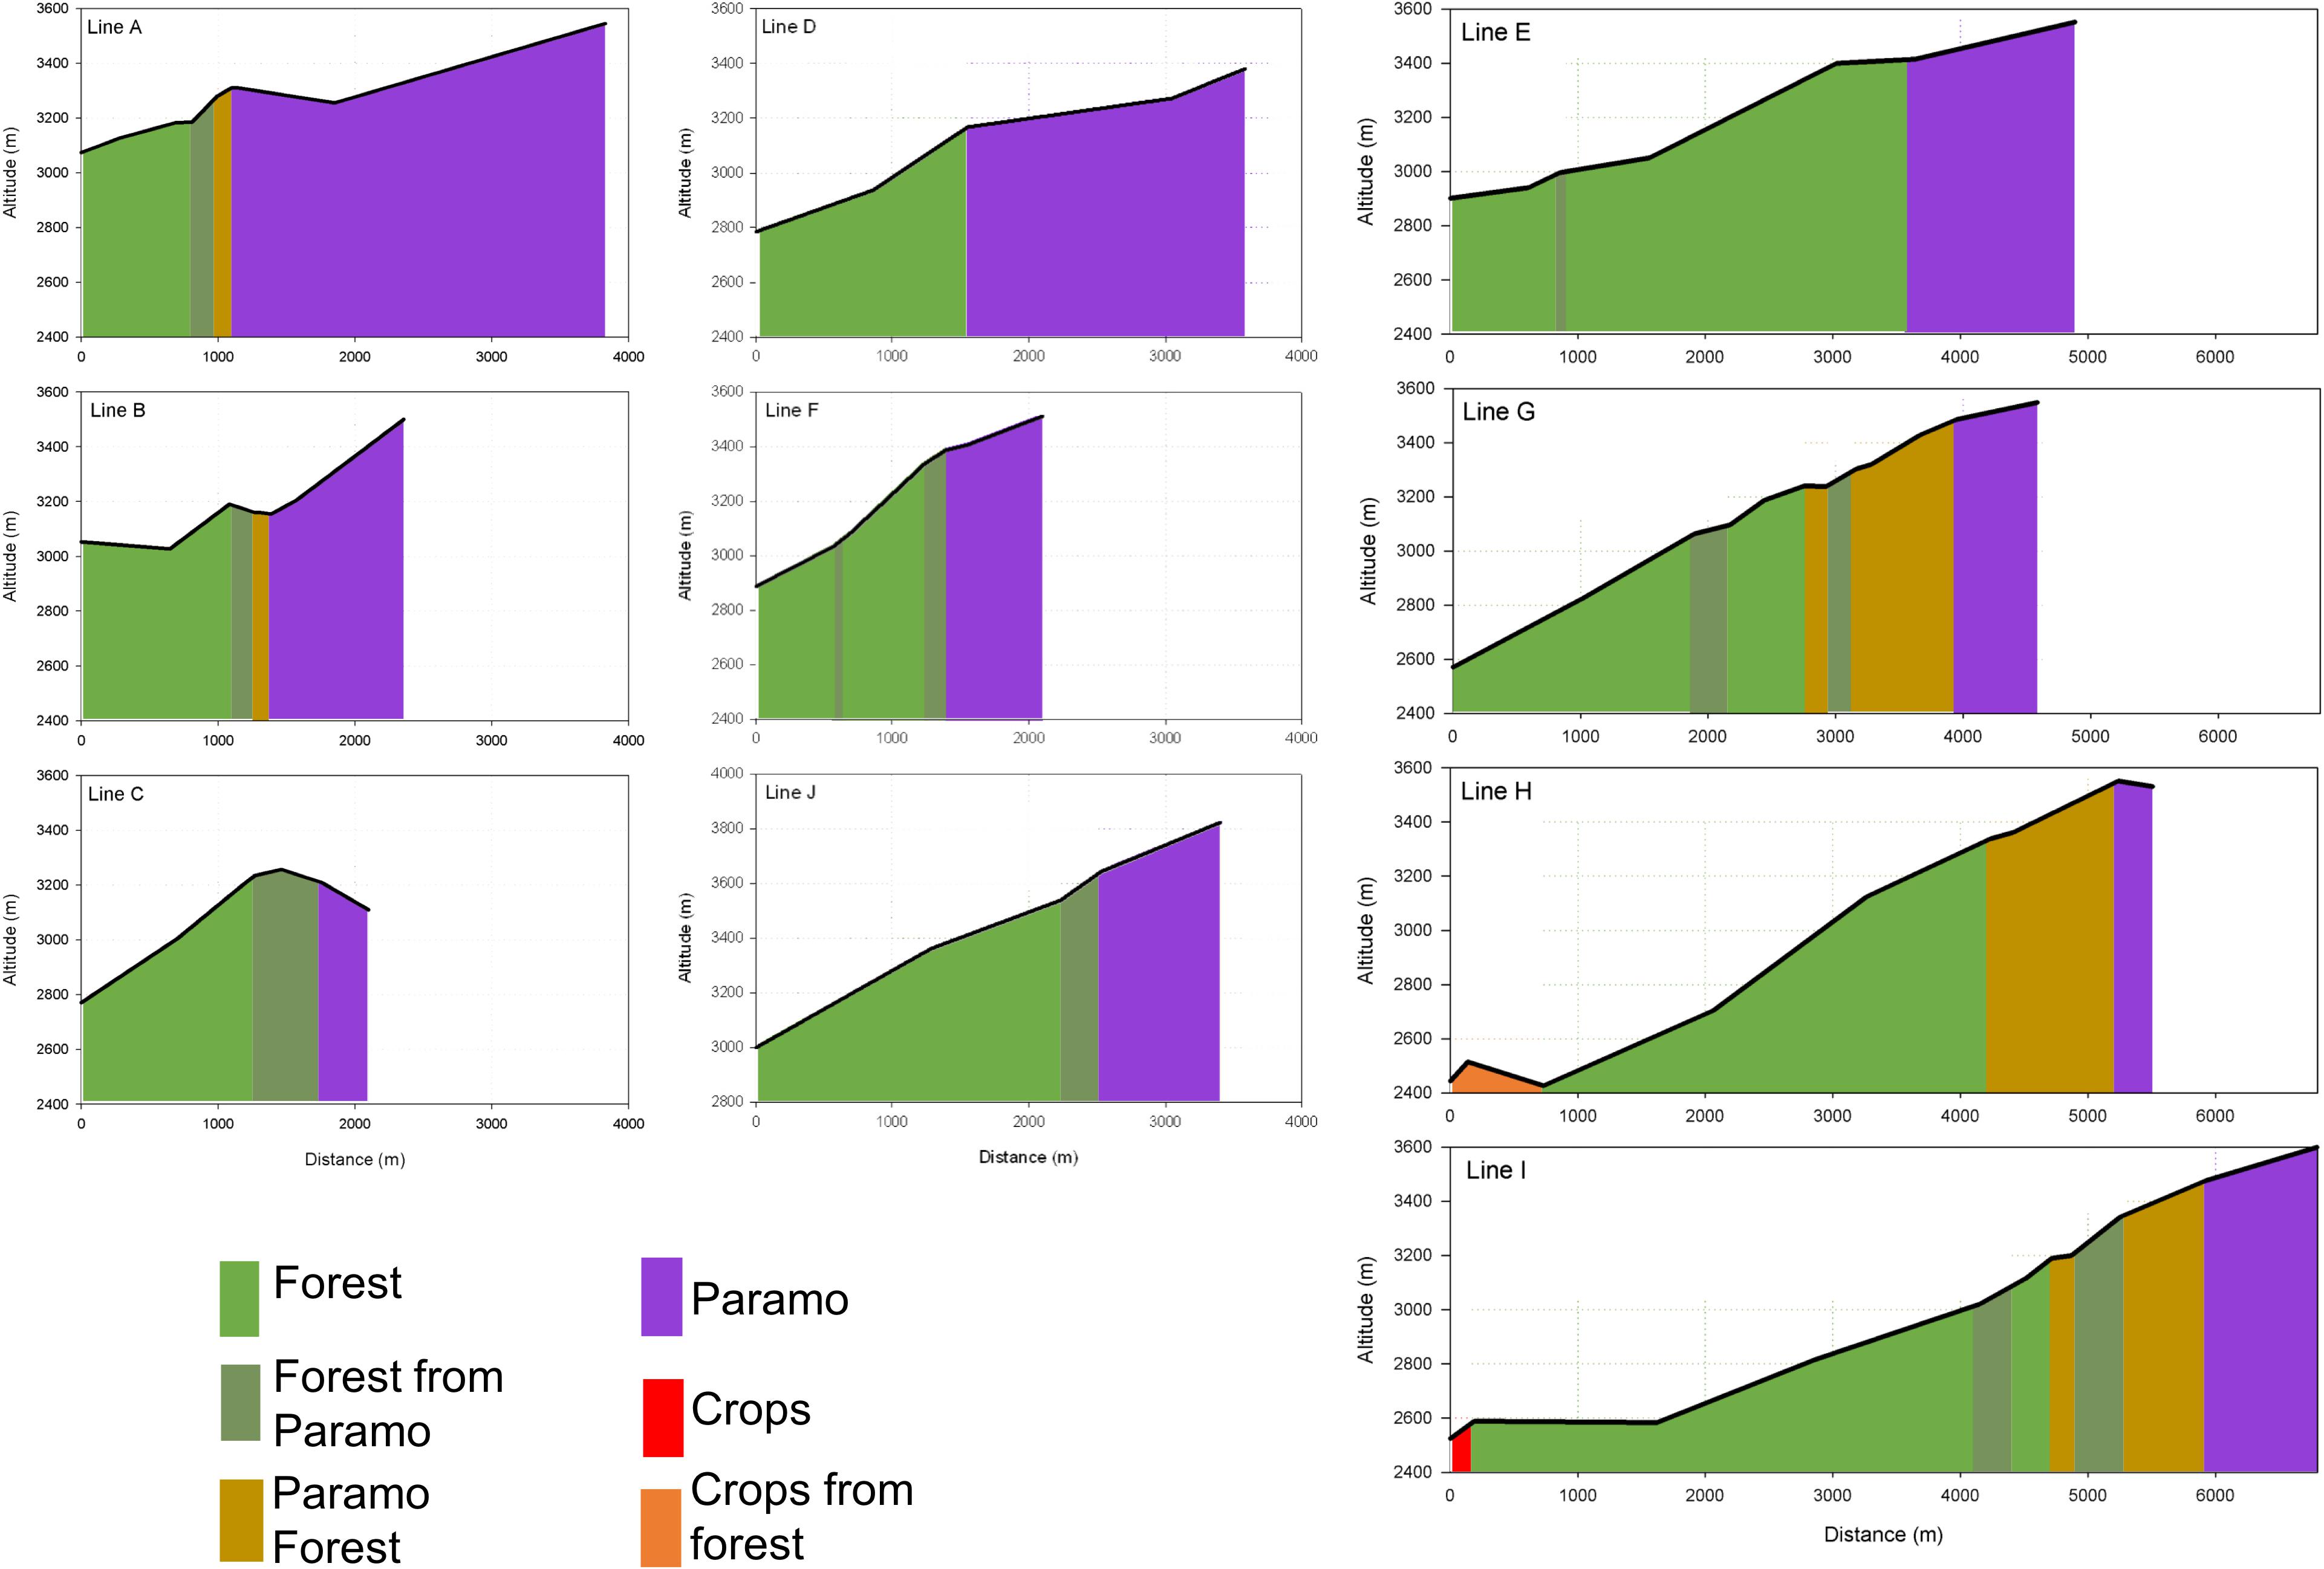
Figure 4. Profile diagrams of the main ecosystems sequence along with the horizontal distance and altitude for the Capaz study area. Letter identification corresponds with the ten lines indicated in Figure 2.
The local features as slope and exposition and the microhabitat characteristics condition Forest’s vertical displacement (Sedlacek et al., 2015, 2016). Therefore, we calculate the Forest and Páramo forest ecosystems’ vertical displacement rate per 100 m of horizontal advance. The lines B and C have the transition in lower altitude related to the gradient, then these lines were not considered for calculations. We evaluate only 13 shifts (Five to Forest from Páramo; two to Forest from Páramo forest, and six to Páramo forest from Páramo). We found that the Forest ecosystem’s vertical displacement derived from the Páramo ecosystem is 22.71 ± 9.75 m per decade per every 100 m of horizontal distance. For Páramo forest ecosystem derived from the Páramo ecosystem is 19.38 ± 8.91 m per decade per every 100 m of horizontal distance. For Forest ecosystem derived from the Páramo forest ecosystem is 31.81 ± 25.07 m per decade per every 100 m of horizontal distance. The transitions differences are not significant; consequently, we calculate the average for all 13 transitions evaluated. The vertical displacement is 22.57 ± 6.42 m per decade per every 100 m of horizontal distance.
Sierra Nevada National Park Study Case: Páramo Forest Densification
We present the vegetation maps for the Sierra Nevada National Park study area of 1952 and 1998 (Figure 5). We identified seven vegetation types in natural conditions, representing the three significant ecosystems in the study area. For the Páramo ecosystem, the vegetation types specified were Páramo vegetation and Polylepis forest (Josse et al., 2009; Chacón-Moreno et al., 2013). For the montane forest ecosystem, we define the Mountain cloud forest vegetation type. For the Páramo forest ecosystem, we differentiated four vegetation types, based on density and life form predominant: Low and dense Pre-páramo shrubland, Low and sparse Pre-páramo shrubland, High and dense Páramo forest, and High and sparse Páramo forest. In Table 3, we present a brief description of the vegetation types. Additional, seven secondary or replacement systems were recognized, associated with the main vegetation types: Low and secondary Pre-páramo shrubland, Low and secondary Pre-páramo shrubland in regeneration, Secondary Páramo, Secondary mountain cloud forest, High and secondary Páramo forest, High and secondary Páramo forest in regeneration, and Crops or fallow vegetation. These units correspond with areas used or replaced by human activities before the National Park establishment in 1952. The secondary vegetation has some degree of deterioration due to natural or anthropic causes. Abandoned areas do not have any management type; thus, it is in an early succession stage.
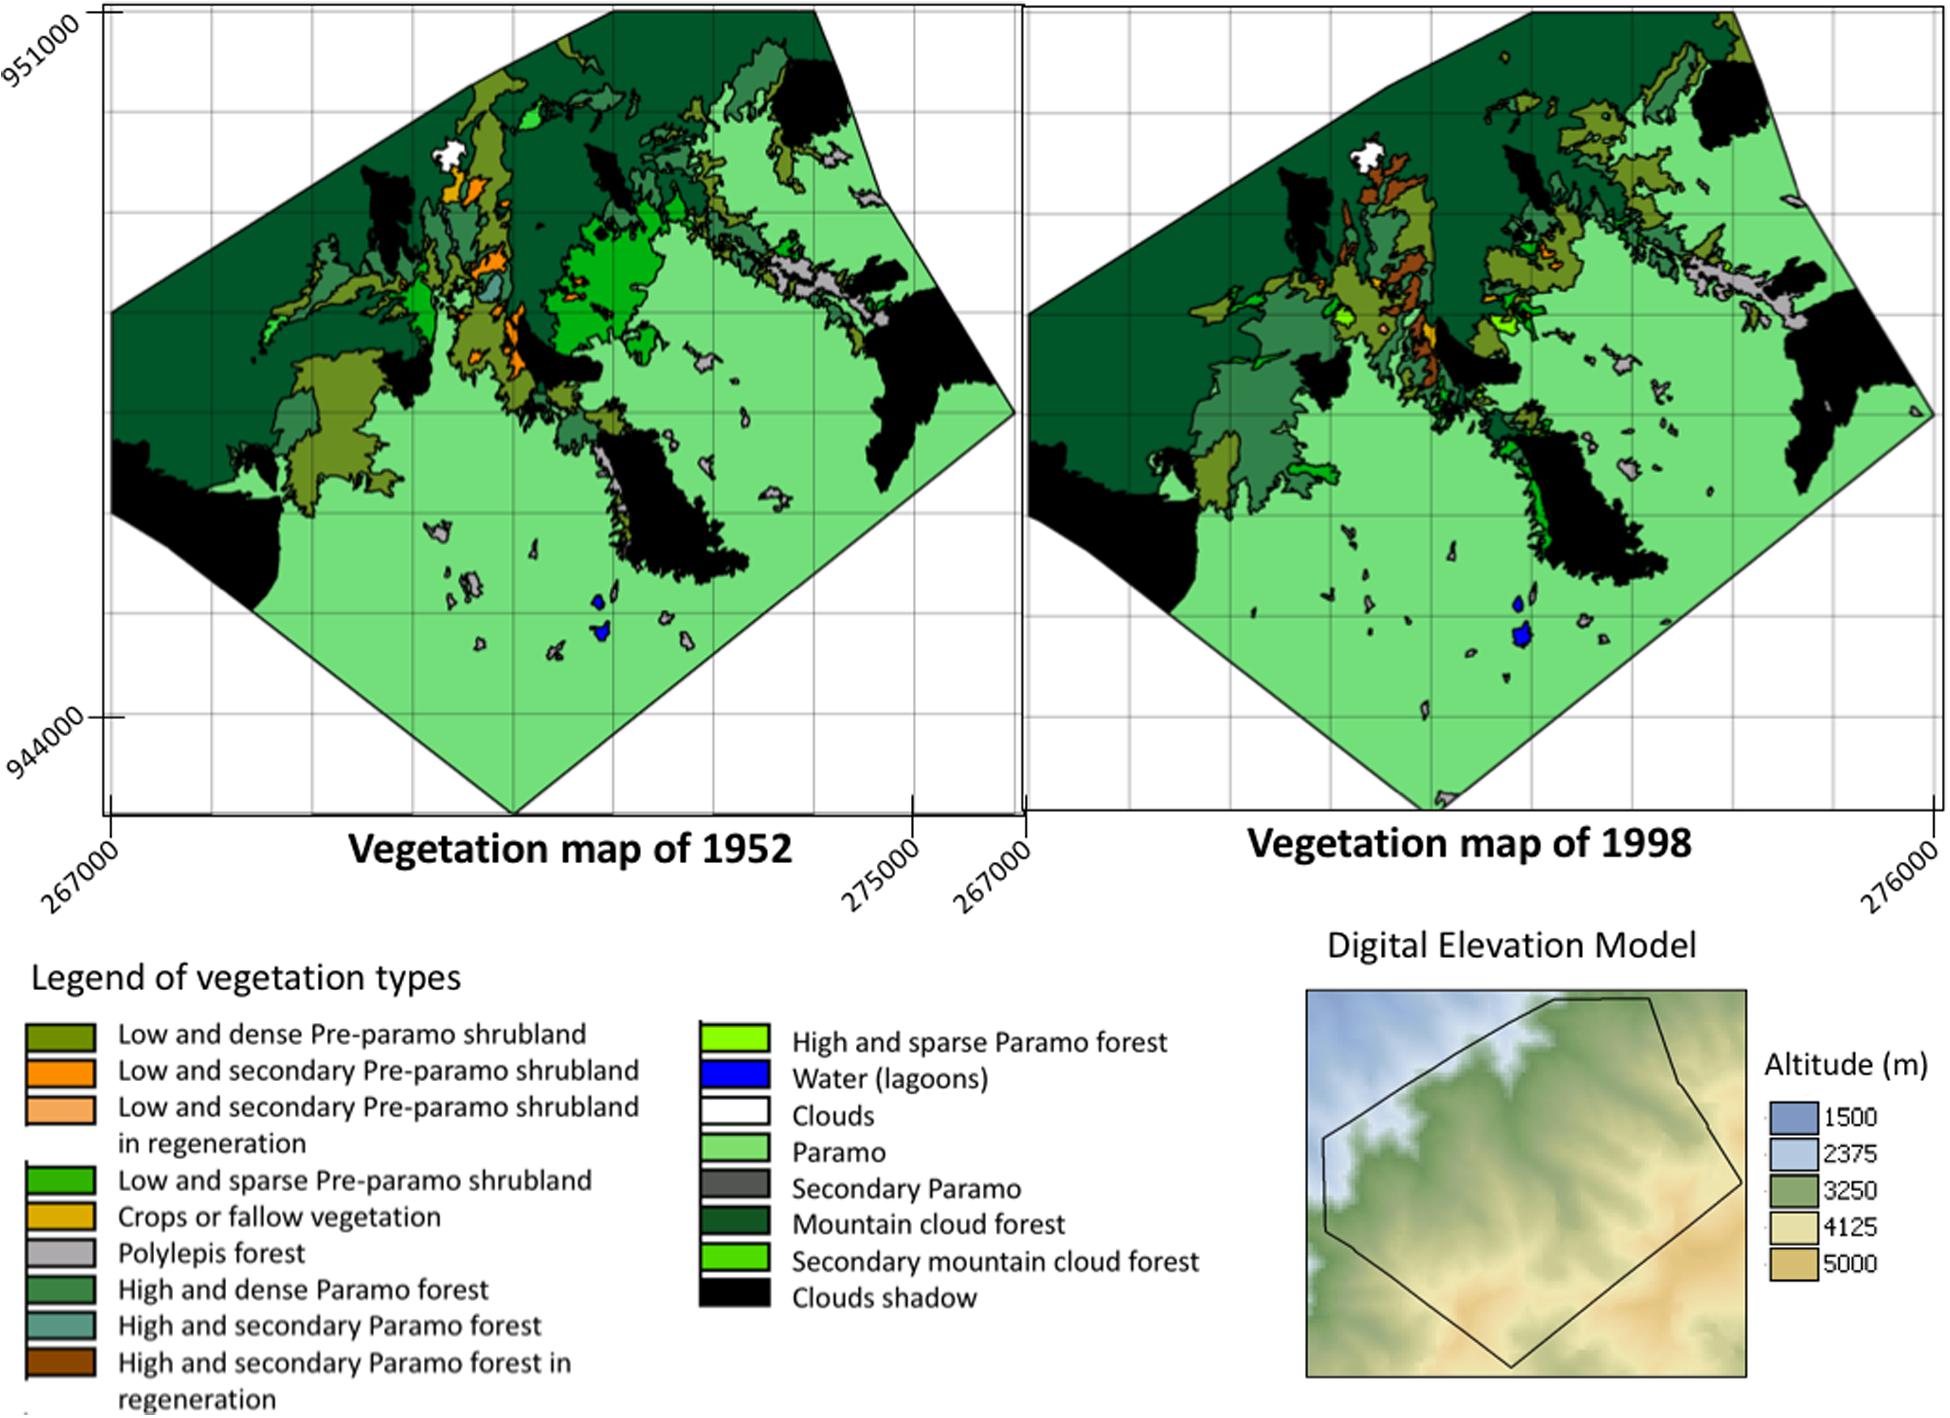
Figure 5. Vegetation maps of Sierra Nevada National Park study area, for 1952 and 1998, Cordillera de Mérida, Venezuela. Legend of vegetation types is presented. The Digital Elevation Model (DEM) of the study area is shown, as well, the elevation gradient. Coordinates in the UTM system are indicated.
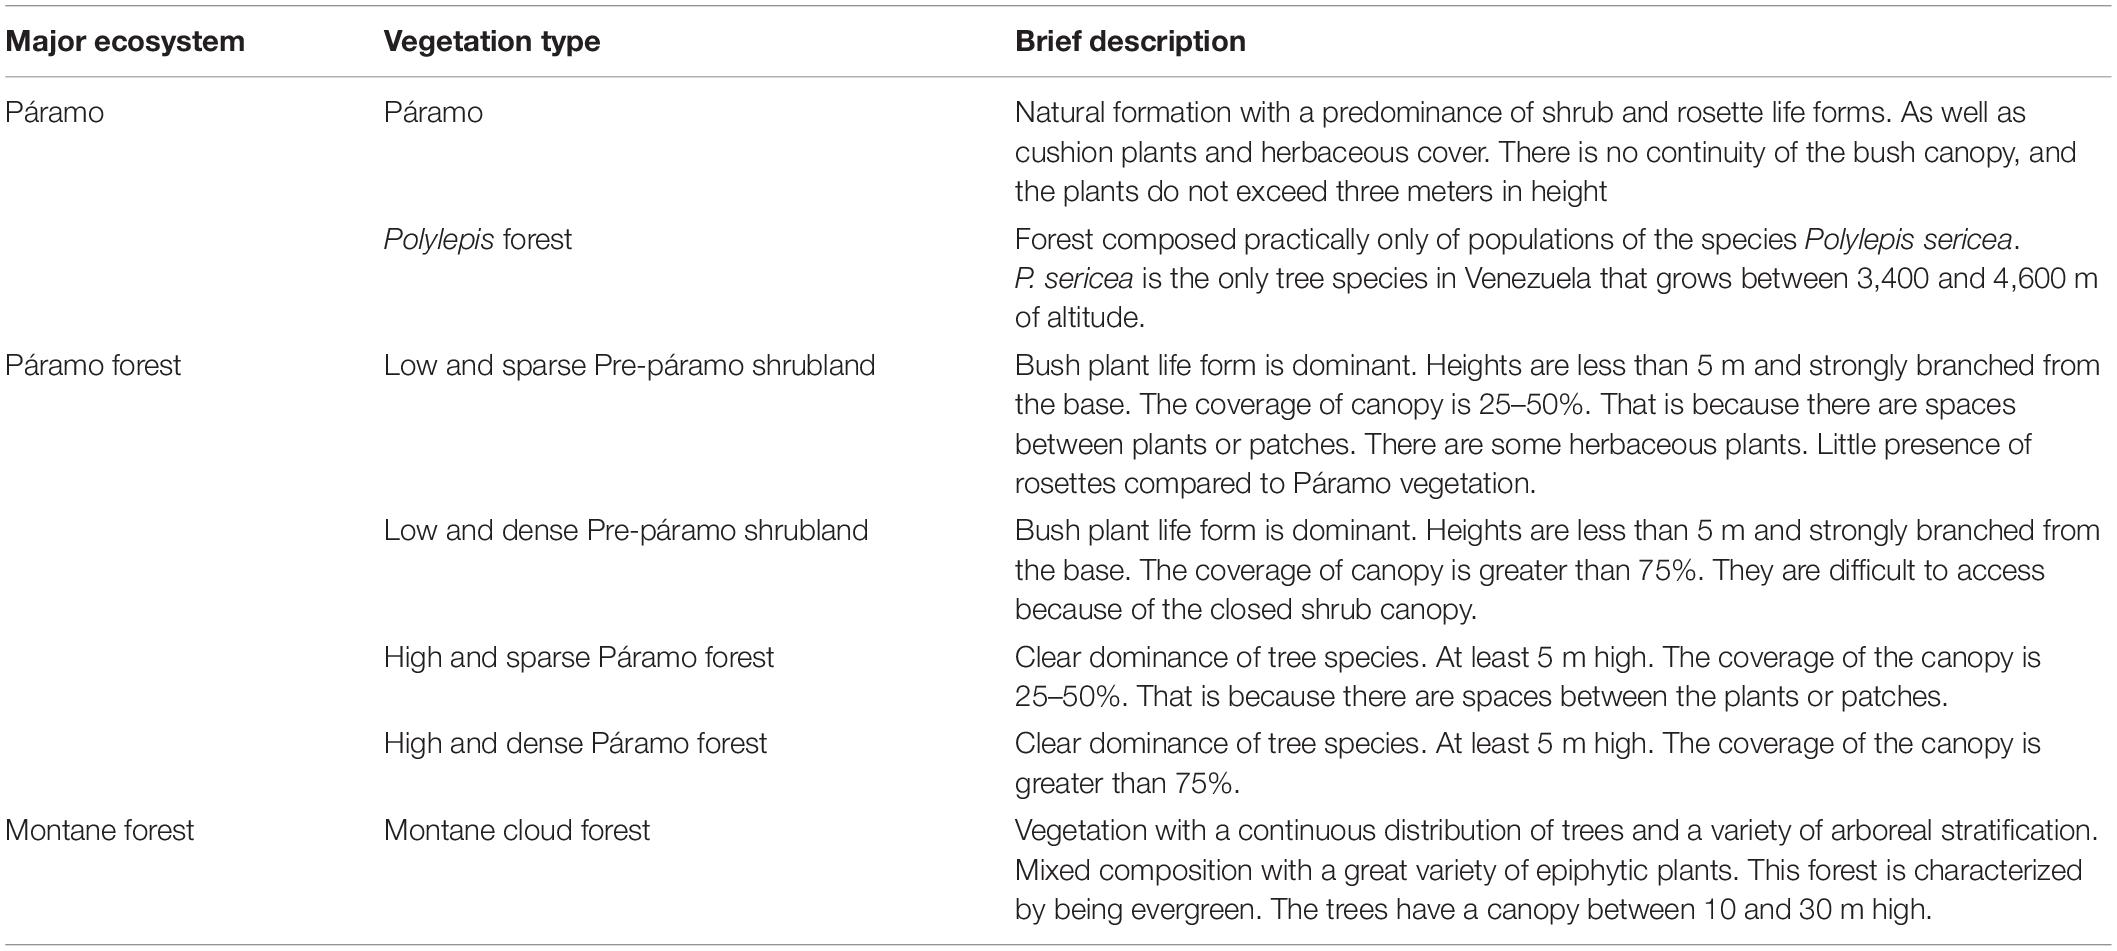
Table 3. Description of vegetation types for the Sierra Nevada National Park area, based on the vegetation maps for 1952 and 1998, Cordillera de Mérida, Venezuela.
In both vegetation maps, 1952 and 1998, we observe the vegetation types’ distribution along the altitudinal gradient (From northwest to southeast). We see the vegetation’s variation, from the Forest to the Páramo, through the Páramo forest vegetation types. This variation goes from north to south, locating the cloud forest vegetation from northeast to the northwest of the study area. As one progresses further in a southeast and southwest direction, the vegetation types of dense and sparse high Páramo forest appear. Even more toward the south, the dense and sparse low Pre-páramo shrubland vegetation appears. Continuing in this direction emerges the Páramo vegetation, which is the predominant within the area. Together with the Páramo vegetation, the Polylepis forest comes into view.
In a comparison between the two maps, we observe a variation in the low and dense Pre-páramo shrubland vegetation type in the northwest of the study area, which has changed to high and dense Páramo forest. To the northwest of the study area, we can observe an evident displacement in the high and dense Páramo forest’s altitude distribution limits, from 3,280 m in 1952 to 3,480 m in 1998. In the same way, we can notice a similar change toward the north and northwest. In a northeast direction, we can see how the dense Pre-páramo shrubland vegetation type is advancing on the Páramo. We observe the change in the south of the area from Low and Dense Pre-páramo shrubland and High and Dense Páramo forest vegetation types toward the Polylepis forest. Based on the results from Table 4, we found that the Páramo vegetation presented a variation of 0.5% concerning the area that this unit occupied in 1952, which is not a representative change in the total study area (0.2%). The cloud forest presented an increase of 5.3%, which implies an advance of this vegetation over other types, and at the level of the entire study area, it represents an increase of more than 1%. The secondary cloud forest size decreased by 90% compared to 1952, although the total area proportion is very low (0.2%). The Páramo forest vegetation presented an essential increase in its size, with more than 50% compared to 1952, and that represents 2.2% of the study area. While the shrub’s vegetation types showed a decrease in their area for Low and dense Pre-páramo shrubland, Low and secondary Pre-páramo shrubland, and Low and sparse Pre-páramo shrubland of 23, 85, and 68%, respectively, related to presented in 1952. In Low and sparse Pre-páramo shrubland, this represents more than 2% of the study’s total surface area. Secondary vegetation decreases the size in favor of the vegetation types in regeneration.
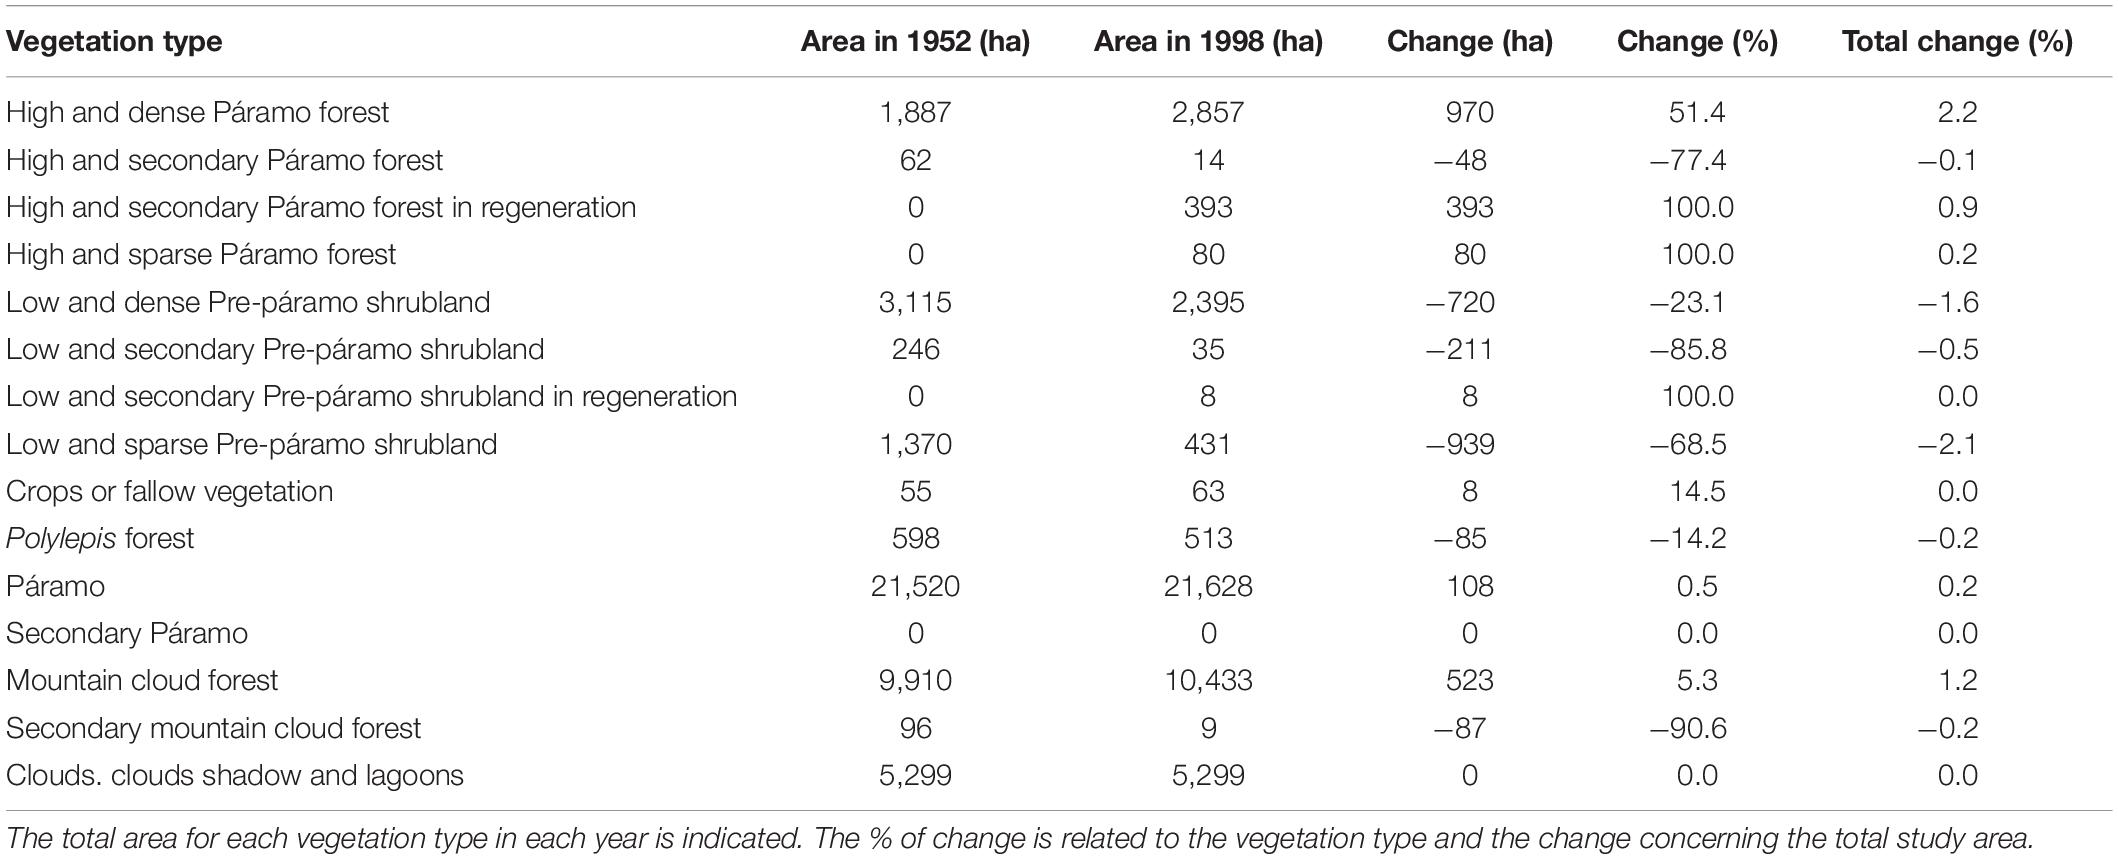
Table 4. Vegetation types change in the Sierra Nevada National Park between 1952 and 1998.
Related to the Páramo vegetation, this changed to the forest vegetation in 48 ha. Another 146 ha of this unit was occupied by the high and dense Páramo forest, which indicates another advance in successional stages and colonization of shrub species that could reach Forest’s climax state. Besides, 398 ha of Low and dense Pre-páramo shrubland occupy the previous Páramo vegetation.
Alto Chama Study Case: Páramo Forest Land Use Impact
We present the ecosystems map for the Alto Chama study area (Figure 6A). We recognize and define seven ecosystems: Upper montane páramo shrublands and rosettes, High-Andean páramo rosettes and cushion vegetation, Páramo forest, Montane cloud forest, Polylepis forest, Evergreen dry Páramo forest, and Pre-páramo shrubland. These ecosystems’ classification considers rosette diversity, which results from an adaptation process to this tropical high-altitude landscape (Madriñán et al., 2013; Cortés et al., 2018; Pouchon et al., 2018). Also, three replacement systems: Pine plantation, Pastures and fallow vegetation, and Crops. Paredes (2018) presents a further description of the ecosystems and the replacement systems. There is a high correlation between the distribution of ecosystems and the primary environmental variables. For all cases, the first is the relationship with the temperature (altitudinal gradient, Figure 6C), which determines in the first instance the development of each ecosystem; precipitation is another determining factor in the location of ecosystems. In the narrow area between the two National Parks, it is noticeable that Pastures and fallow vegetation, and Crops (replacement systems) occupy this space in the middle of the map following the Chama River course.
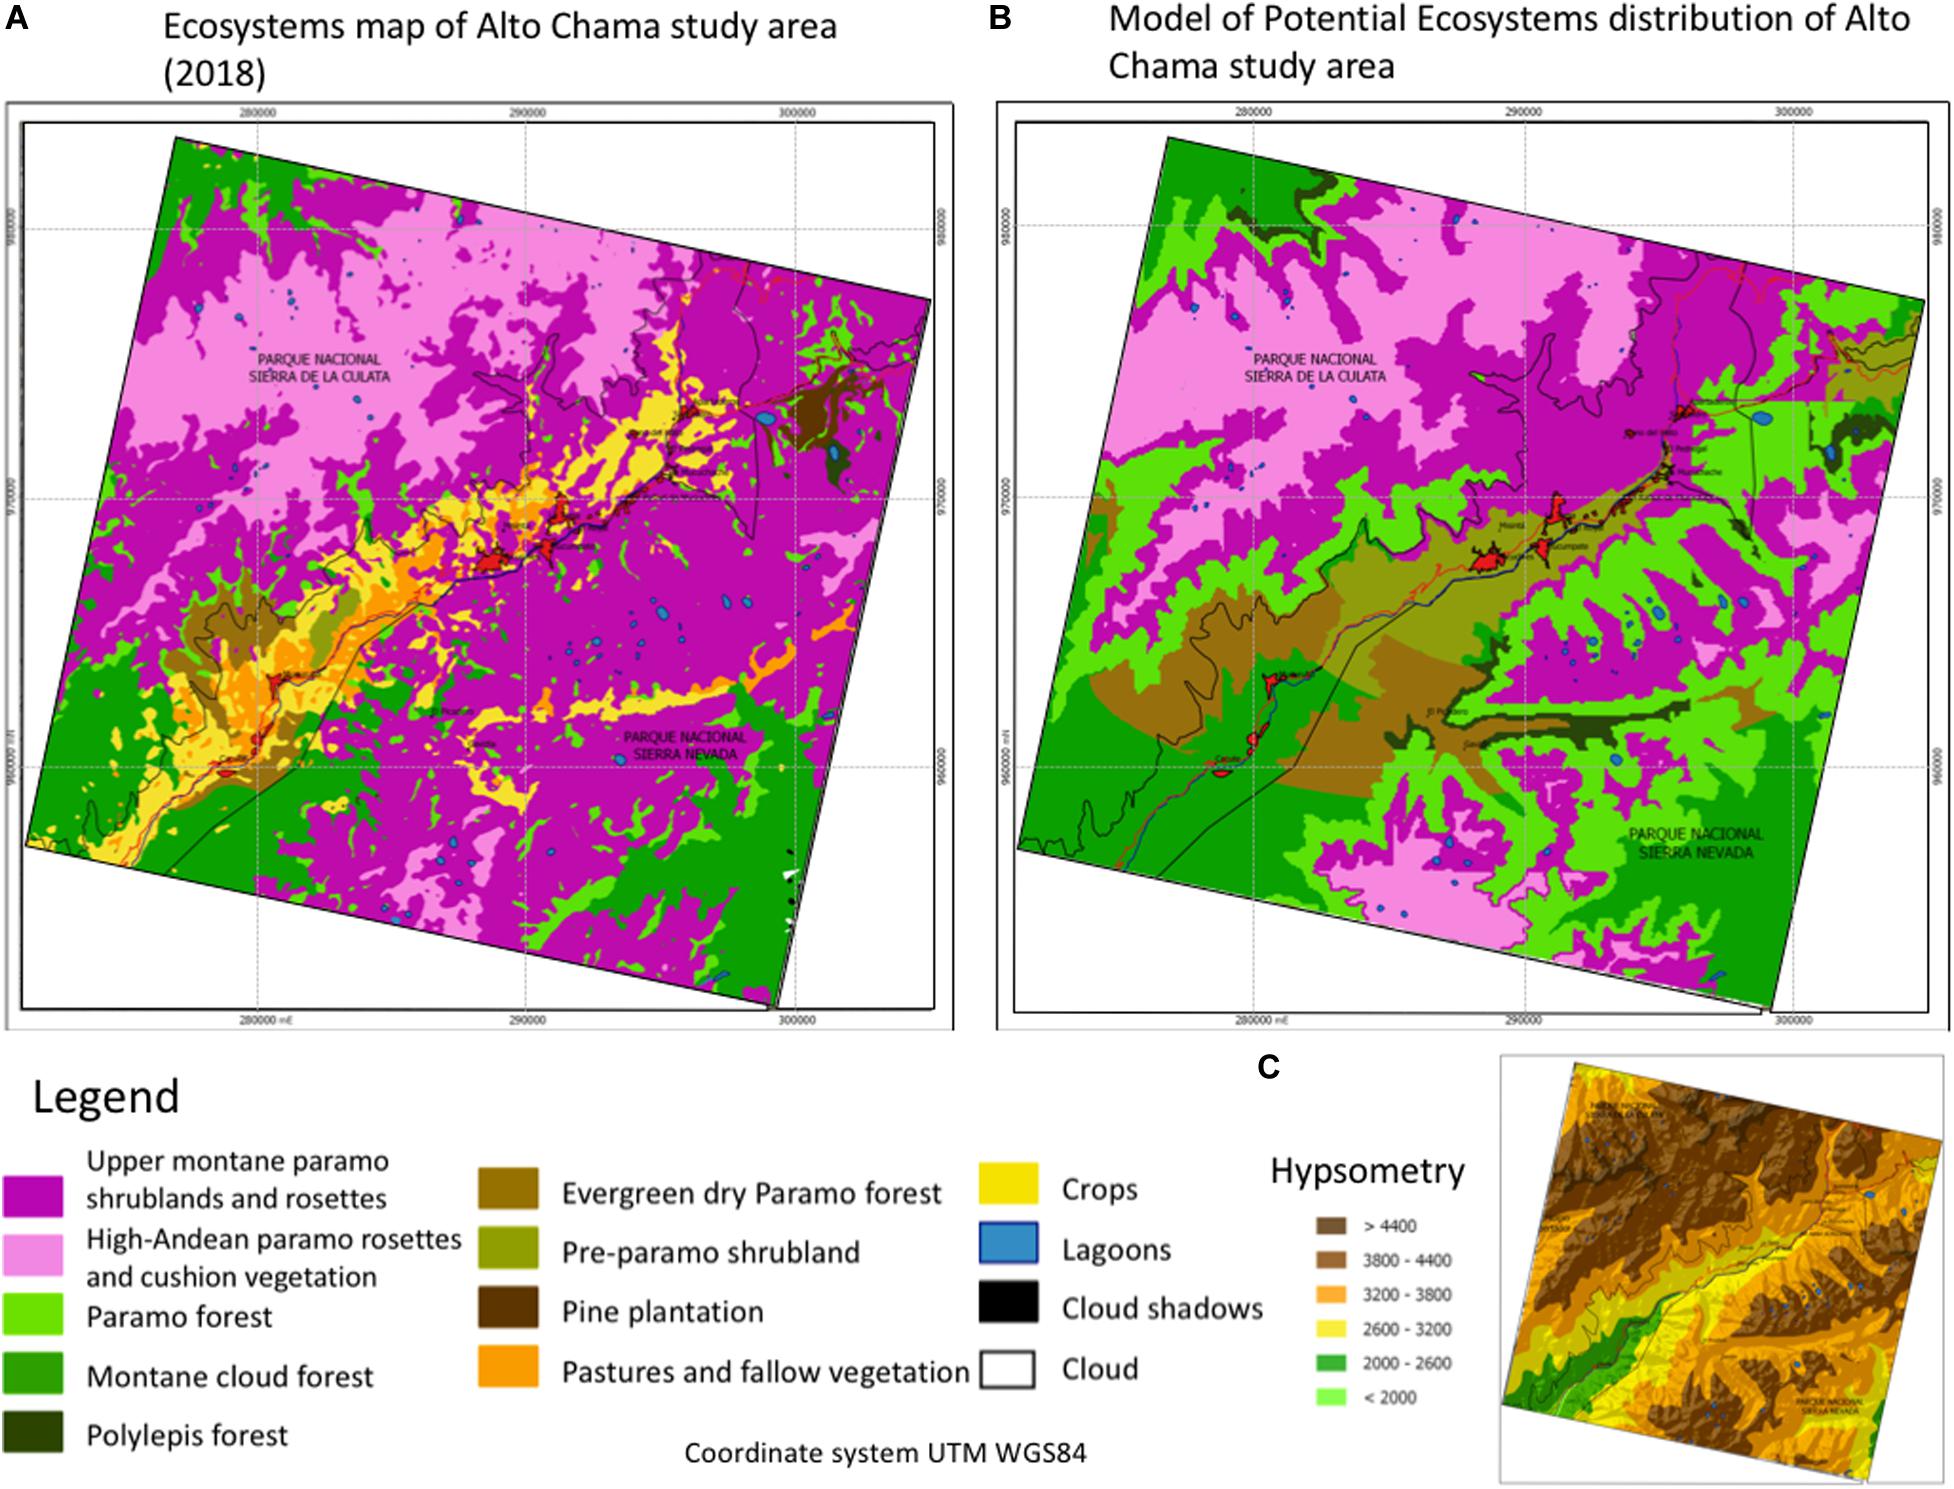
Figure 6. (A) Ecosystems map, (B) Map of ecosystems potential distribution, and (C) Hypsometry map, for the Alto Chama study area, Cordillera de Mérida, Venezuela. The ecosystem types legend and of the study area are showed. Coordinates in the UTM system are indicated.
We show the map of ecosystems potential distribution of the Alto Chama study area (Figure 6B). The potential ecosystem follows similar distribution to the observed for the ecosystems map; however, it shows a significant difference, especially about the extension of the ecosystems related to the ecotone between Upper montane páramo shrublands and rosettes and Montane cloud forest. We observe that the gradient extremes’ ecosystems: High-Andean páramo rosettes and cushion vegetation, and Montane cloud forest, present a high similitude with the ecosystems map. To the left side of the Chama River (Southwest area), the forest and woody ecosystems offer more extension on the Upper montane páramo shrublands and rosettes ecosystem. It is essential to emphasize the large extension of the shrublands and páramo forest ecosystem, where today, the Crops and Pastures and fallow vegetation replacement systems are present.
Comparing both maps (Figures 6A,B), we found for the Upper montane páramo shrublands and rosettes, that Crops occupy the potential distribution in 7.18%. It can be considered moderate change due to the rapidity with which this activity is occurring. Páramo forest is the ecosystem that presents a significant shift from potential to actual distribution. Currently, only 14.63% coincides with the potential total, showing an evident difference in its coverage, which is being occupied, mainly, by the Upper montane páramo shrublands and rosettes (72.53% of the potential area). The Montane cloud forest maintains 62.85% of the total potential; however, the main change is for replacement systems of Crops (13.20%) and Pastures and fallow vegetation (5.74%). Both replacement system sums a total substitution of 18.94% over forest cover. The Evergreen dry Páramo forest ecosystem maintains 13.50% of its potential coverage. Still, the rest of this ecosystem’s potential area is mainly occupied by the Montane cloud forest (35.06%) and by the Upper montane páramo shrublands and rosettes (24.15%). The Pre-páramo shrubland ecosystem only conserves 1.58% of the total potential. The main changes of this ecosystem are to Upper montane páramo shrublands and rosettes (46.20%), to the Crops (16.47%), and Pastures and fallow vegetation (17.01%).
Discussion
In this work, we have related and analyzed different study areas to give a comprehensive response to global change, limited by two of the significant impacts: climate change and deforestation. The first, showing a change in the increase in temperature, but without a clear tendency to rainfall distribution, with future continuity and uncertain consequences on vegetation migration. The other, deforestation, which shows a possible complete disappearance of the Páramo forest ecosystem by human action. Using the landscape ecology approach, we have been able to integrate and detail the processes of change and future transformations in the line of contact between the montane forest and the Páramo (treeline) in the Venezuelan Andes.
Páramo Forest Transition and Displacement
The temporal window of more than five decades and the possibility of combination aerial photographs and satellite images under the landscape ecological approach for the Capaz area permit a detailed analysis of the woody vegetation movement along the altitudinal gradient. The displacement of the Montane cloud forest and Páramo forest ecosystems over the Páramo ecosystem is evident. Also, the localization of the study areas in protecting zones (National Parks) indicates that these changes have not direct human influence from almost the beginning of the study period.
Our results confirm that the treeline is a zone where the transition between the Montane cloud forest to Páramo is abrupt (Körner and Paulsen, 2004). However, the Páramo forest’s spatial dynamics contribute to establishing a gradual change at a large spatial scale, with a diversity of spatial patterns (Bader et al., 2020). The difference (Figure 2B) involves the Páramo forest ecosystem presence in different vegetation structures and compositions. This sequence of transition state makes possible the advance of the forest to more elevated positions.
The rate of change in forest growth is less than the speed of loss of Páramo, and this is due in no small part to the development of the transition stages that include the Páramo forest (Table 2). This change rate further evidence the diversity of vegetation types associated with the Páramo forest (Figure 5 and Table 3).
During the five decades of study, the woody component’s movement showed in both Capaz and Sierra Nevada areas that the successional process is key in this displacement. The forest’s increase is best evidenced near the river’s margin, where humidity and possibly temperature conditions are more favorable for the forest movement to higher altitudes. We determine that the densification process occurs when shrubland areas in 1952 change to dense Páramo forest, and this dense Páramo forest of 1952 change to the montane cloud forest in 1998. In these successional stages, we defined four different vegetation types (Low and dense Pre-páramo shrubland, Low and sparse Pre-páramo shrubland, High and dense Páramo forest, and High and sparse Páramo forest), which can be assemblage in a transitional model (Figure 7). Works describing forest distribution patterns at the treeline show that tree density decreases with altitude due to reduced forest cover (Ramírez et al., 2009; Schwarzkopf et al., 2010; Llambí et al., 2014). These authors suggest that the forest tongues and islands function as nuclei of advancing woody pioneers of the forest toward the Páramo. Arzac et al. (2011) detected clear patterns of change in the abundance of life forms regarding altitude and aspect. Trees and ferns decreased in abundance abruptly with the increase in altitude and distance to the continuous forests. Besides, this can lead to shrubification that generates a change in ecosystems’ structure and functioning. A large-scale increase in shrub cover will change ecosystems’ structure and alter the flows of energy, regional climate, the exchange of water, carbon, and nutrients between the soil and the atmosphere, and ecological interactions between species. Increases in shrub are classified into three categories: (a) infill, an increase in shrub cover through the growth of currently existing shrubs; (b) increased growth potential; and (c) advanced shrub line, or colonization of areas beyond the previous distribution boundary (Myers-Smith et al., 2011).
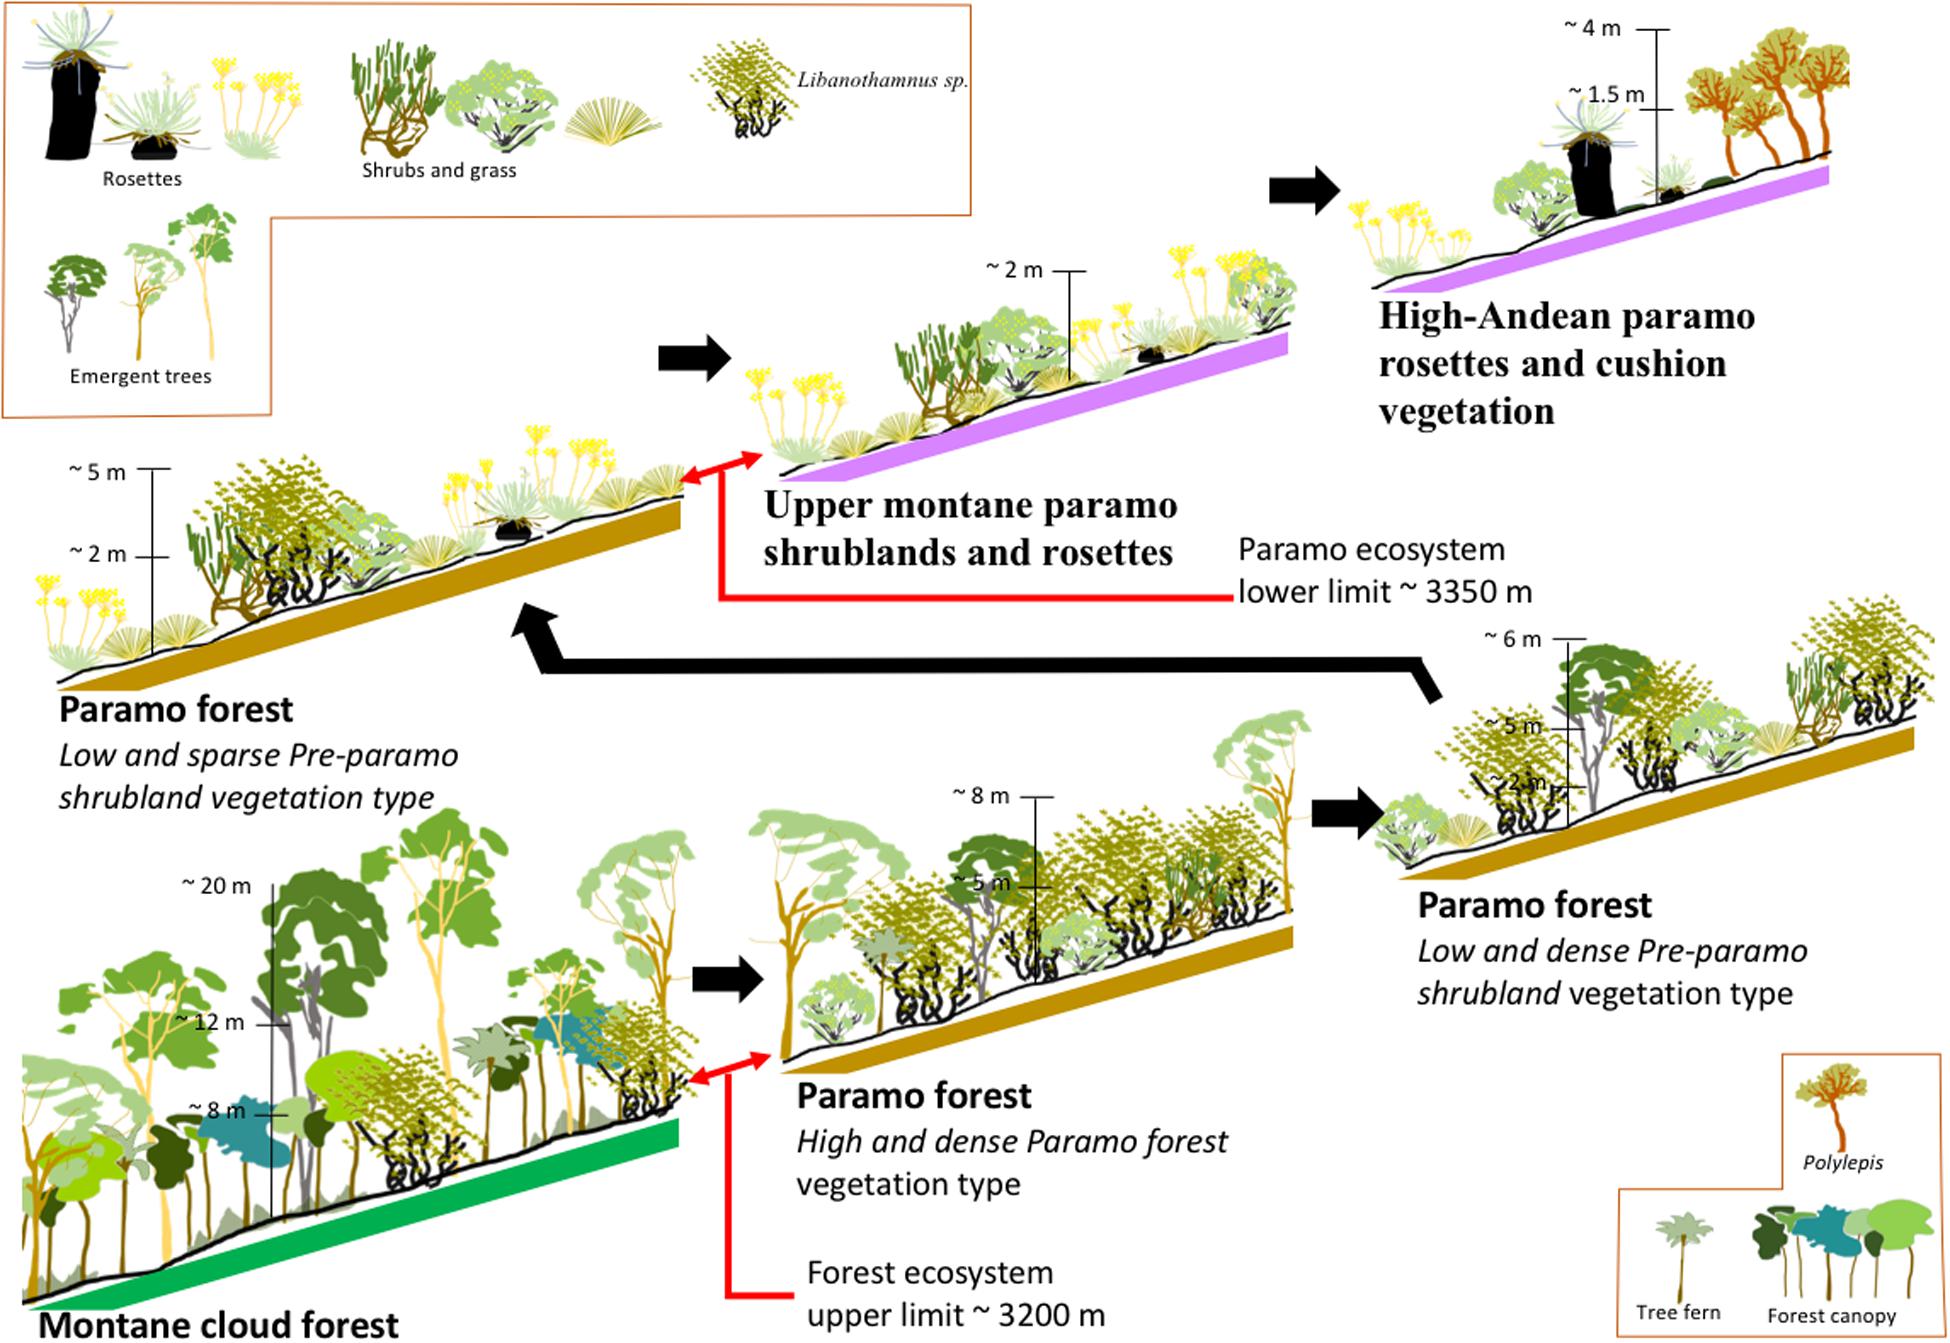
Figure 7. Synthesis of the transition and displacement of the different ecosystems and vegetation types for the treeline zone in Cordillera de Mérida, Venezuela. It presents six profiles representing the four main ecosystems and three vegetation types for the Páramo forest ecosystem. Each profile shows the vegetation structure-based on the primary plant life forms, height of the canopy, and representative plants. Slope ∼ 30% is indicated.
Our results show that there is a matching between the forest upward shift and densification processes, and probably these processes are related to the highest plants diversity in the Andes mountain (Llambí et al., 2014; Llambí, 2015), and the number of plant life forms present in the treeline (Arzac et al., 2011, 2019). A similar observation is found for alpine treeline ecotone’s spatial dynamics in the French Pyrenean (mainly of Pinus uncinata) (Feuillet et al., 2020), where an upward shift of the tree line and significant tree densification was observed. Still, they found a mismatch between these two ecological processes in 40% of the studied sites. They propose some hypotheses based on their results, mainly associated with the environmental factors (slope, soil, altitude) and the anthropogenic disturbances in the past. Bader et al. (2007) observed that the temperature fluctuations were much more extensive for the tropical alpine treeline. The average temperature was higher in alpine vegetation than in forests, and most treelines were abrupt. They explain that abruptness could result from positive feedback processes mediated by the microclimate differences between forest and Páramo. Recently, Bader et al. (2020) propose a framework for describing alpine treeline ecotones, where a diversity of spatial patterns contain information about the processes that control treeline dynamics. Therefore, our results show a spatial way that could drive the treeline dynamics. Some hypotheses have proposed to try to explain the treeline limit: – factors such as stress and mechanical damage could be affecting reproductive capacity, growth, and the acquisition of carbon (Körner, 1998); – low temperatures limit cell division as well as tissue differentiation during growth (Körner, 1998; Jobbágy and Jackson, 2000); – the temperature is the main factor associated with this disruption of tree vegetation (Körner, 1998; Jobbágy and Jackson, 2000; Hoch and Körner, 2003; Körner and Paulsen, 2004); – the high radiation leads to high evapotranspiration rates that are not necessarily compensated by the availability of water in the soil (Mayr et al., 2003; Smith et al., 2003). Accordingly, based on our results, we can say that climatic warming plus other indirect causes associated with this are principal factors driving forest migration. These associated factors revert those that controlling the treeline limit.
The newly colonized areas by the forest displacement and densities changes modify the microclimatic factors in the understory. These new microclimatic conditions permit to improve the physical and environmental features for a subsequent occupation of species that previously did not occupy these spaces (Sedlacek et al., 2016; Gentili et al., 2020; Zellweger et al., 2020). This increase in the density of woody vegetation increases the air’s relative humidity by modifying radiation exposure in the air and soil. Similarly, the interception capacity of horizontal precipitation (fog) is rising since the contact surface increases, possibly allowing species with a higher water requirement to colonize these spaces (Correa et al., 2020). The soil organic matter may also increase since the types of vegetation such as the shrubland, Páramo forest, and the Montane cloud forest produce a more significant amount of necro-mass and organic matter (Little et al., 2016). This decomposition process increases the availability of nutrients and allows species with a higher nutrient requirement to colonize Páramo spaces that could not occupy previously because of nutrient stress. Open areas give opportunities and conditions for tree regeneration through adaptation traits. Cierjacks et al. (2008) found that important regeneration traits in Polylepis species in the tropical tree line of Ecuador might contribute to the formation of the upper tree line.
Profiles lines (Figure 4) are no similar. That gives us a vision of heterogeneity; it means that the displacement of woody vegetation is not regular and linear; instead, topography, slope, and exposition make a difference in the area. Slopes of 20–30% in the Capaz area are considerably higher than the average for Sierra de la Culata with ∼11%. This higher slope could harm the tree establishment; however, the montane forest’s upward migration still occurs.
We elaborate the transition and displacement synthesis scheme of the different ecosystems and vegetation types, using and combining the further studies’ results (Figure 7). It contains six profiles representing the four main ecosystems and three vegetation types for the Páramo forest ecosystem. Each profile shows the vegetation structure based on the principal plant life forms and the canopy and representative plants’ height. Also, each profile is drawing with a slope of about 30%. The change from one profile to another is gradual; however, we can observe the difference in the composition of the life forms and the spaces open when the tree form is replaced by shrubs and grasses, increasing the presence. Montane cloud forest has a predominance of tree forms, with many emergent trees. The altitude ∼ 3,200 m is the upper limit of the Montane cloud forest and the Páramo forest ecosystem’s starting area, represented by three previously described vegetation types, similar to the border defined for Josse et al. (2009) for these ecosystems. The sequence in these three profiles shows how the tree life form decreases in predominance instead of Libanothamnus sp. and other shrub species. At the third Páramo forest profile, the woody plant density decreases, and some Páramo characteristic species appear. At the end of the highest Páramo Forest ecosystem profile, the altitude is ∼3,350 m of altitude; it is mean that the wide belt for the Páramo forest is about 150 m vertically. The last two profiles in this sequence characterize the structure and predominance of plant life form for Páramo. Rosettes and shrubs represent the Upper montane páramo as a predominant life form, and the High-Anden páramo, with tall rosettes (Coespeletia timotensis), cushion vegetation, and Polylepis forest. Llambí (2015) define and describe similar structure pattern, and make a distinction about the Páramo forest with three different vegetation structure: (a) continuous Páramo forest; (b) the languages and islands of forest and their edges of contact with the Páramo; and (c) the Upper montane páramo, which is represented by rosettes, grasses, and shrubs at different altitudes.
We observe that the treeline downward migration occurs with rates of change less than 10%, and ∼20% of the areas in the treeline area do not present changes, which it means is a neutral change. These results are coincident to the review about species migration of Lenoir et al. (2010). They founded that ∼65% of the species had shifted their mid-range positions upslope, 10% have not changed, and 25% had shifted downslope. Lenoir et al. (2010) suggest that downward range shifts of species primarily occur by a release from competition independently of climate warming.
Páramo Forest and Climate Change
One of the global change anthropogenic drivers that impact the biosphere is climate warming, which can alter the competitive dynamics, especially following the relaxation of lethal cold that suppresses cold-intolerant species as in the tree line disturb the timing of migration (Sage, 2020). Climate warming for the decade 2006–2015 has been of 0.87 (0.75–0.99) °C average about the period 1850–1900, with an increasing estimated anthropogenic global warming at 0.2°C per decade from the period 2006 to 2015 (IPCC, 2018). Minimum temperatures in Venezuela have increased by 0.37°C per decade, and precipitation has decreased from 1940 to 2002 (MARN, 2005). For the six decades of the study period (1950–2010), the temperature based on the global climate warming data (GCW) has increase 0.45°C (∼0.08°C per decade) (IPCC, 2013). However, considering the Coordinated Modeling Intercomparison Project Phase 5 (CMIP5) output for Venezuela, climatic warming (VCW) has a rate of 0.06°C per decade (IPCC, 2013). For the Mérida-airport meteorological station (the only station with a large number of records in the study area), the temperature data shows an increment between 1951 and 1990 (40 years) of 0.18°C per decade (MCW), which is higher compared with Venezuelan (VCW) and global data (GCW). Still, this data presents a higher interannual variability. Quesada-Román et al. (2020) indicate that climate-vegetation relationships in alpine systems play a fundamental role in the growth of dominant shrub species in Central America’s Páramo ecosystems due to precipitation changes, temperature, and El Niño-Southern Oscillation (ENSO). The primary source of climate variability in the northern Andes is the ENSO phenomenon, characterized by hot (ENSO) and cold phases (La Niña or ANTI/ENSO). Both phases affect the temporal and spatial distribution of precipitation in a large part of South America. They have been the cause of extreme droughts and extraordinary rainfall in different geographical regions of the planet. In the northern Andes, hot phase events are associated with below-normal precipitation levels, while the opposite occurs during cold phases (Herzog et al., 2010).
If we considering the relation temperature – altitude for the montane areas in Venezuela of −0.564°C for 100 m of elevation (Chacón-Moreno and Suárez del Moral, 2020) and the climatic warming of 0.08°C per decade; it represents an altitudinal displacement of temperature during the period between 1950 and 2010 of 14 m per decade. However, if we use the Mérida-airport rate of warming of 0.18°C per decade, the displacement will be 32 m per decade. Our results show an increment of forest migration of about 13 m per decade, which has good concordance with the expected change due to the GCW data. Nevertheless, comparing with the MCW rate, forest migration has less than half of the possible displacement. The inter-annual variation of rainfall during the period study (Mérida-airport meteorological station) is more considerable than predicting climate change scenarios. The three study areas present a similar precipitation pattern, ranging between 1,800 and 2,100 mm per year at the treeline zone, and similar bioclimate (Pluvial Hyperhumid and Pluvial Ultrahyperhumid) (Chacón-Moreno and Suárez del Moral, 2020). Therefore, our results for the three areas are comparable for these parameters.
For our data derived from all 13 evaluated transitions, the value is more realistic because it considered the possibility of advance in 100 horizontal meters. It takes into account the slope (20–30%) and other local environmental conditions. The range of vertical displacement found of 16.15–28.99 m per decade per every 100 m of horizontal distance is slightly higher than the potential displacement considering the GCW rate. However, it is less than the possible displacement for the MCW rate.
If we considered an intermediate potential range of climatic warming and the correspondence potential vertical displacement between the GCW and MCW ∼23 m per decade, our results from the transect’s detailed study are very similar: 22.6 m per decade. It means that the forest ecosystems migrate a little faster than climatic warming, only considering that the forest can horizontally displace 100 m. Nevertheless, if we considered only the whole forest ecosystems vertical displacement (14 m per decade), the rate of forest migration is lower than the potential of warming. This rate is realistic because we include the successional processes for forest ecosystems, explained in Figure 7.
Morecroft and Keith (2016) review and summarize the observed changes in treeline by climate change. They proposed that regardless of the migration mechanism, natural tree lines are determined primarily by the climate’s warming. The IPCC (2014, 2018) remark, based on field observations over the past century in numerous locations in boreal, temperate, and tropical ecosystems, that biomes shifts, that this movement is due by the replacement at a place of one suite of species by another. This effect is usually of biomes moving upward in elevation and to higher latitudes.
Several studies present results about the treeline migration in the temperate zones, especially in Alpine areas, with evidence of changes in plants’ altitudinal distribution (Walther, 2003; Walther et al., 2005). Peñuelas and Boada (2003), based on historical records, vegetation maps, and aerial photographs, found a progressive replacement of cold-temperate ecosystems by Mediterranean ecosystems; this upward shift of vegetation belts has upward by ∼70 m, with a rising annual temperature of 1.2–1.4°C during 50 years. However, the tree line shifts are subject to time lags in their response to environmental change because of their long generation time (Morecroft and Keith, 2016). Lenoir et al. (2008) found a significant upward shift in species optimum, averaging 29 m per decade. From plant surveys in 1954–1958 and 2003–2005, in the alpine to nival ecosystems in Italy, Parolo and Graziano (2008) register a median migration rate of 23.9 m per decade. This migration rate appears to be related to an estimated shift of the permafrost limit by +240 m during the last 50 years; they considered the climate warming a primary cause of the observed upward migration of high mountain plants. In a study of the treeline dynamics in response to climate warming in the Mediterranean region of Cehennemdere, Turkey, Arekhi et al. (2018) found the geographical expansion of the treeline, with a migration rate of 20–40 m each decade, and the treeline altitude increased to 2,442 m from 2,335 m. In a study based on the supervised classification of historical (1953) and current (2015) aerial photographs on the spatial dynamics of the ecotone of alpine trees in the French Pyrenees, Feuillet et al. (2020) observed an upward displacement of the tree line by ∼ 45 m on average, with at an overall rate of 0.73 m year–1. Furthermore, during the study period, the minimum mean air temperatures increased by 0.6°C, and the maximum mean air temperatures increased very slightly by 0.14°C.
Telwala et al. (2013) surveyed historical (1849–1850) and the recent (2007–2010) data on temperature and endemic species in elevational ranges at the alpine Sikkim Himalaya region and recorded a mean upward displacement rate of 27.53 ± 22.04 m per decade, which make to the montane floras, in particular, highly sensitive to climate change.
There are few studies about the Andes’ forest migrations in response to climate change. Lutz et al. (2013) measured Peruvian Puna’s treeline migration (Manu National Park) between 1963 and 2005. They found a rate of the treeline migration in protected areas of 2.4 m per decade, which is almost ten times lower than our results, showing a grassland-forest ecotone remarkable stable over the 42 years study period. Fadrique et al. (2018) use a community temperature index (CTI) to characterize communities and test the species migration prediction. The thermophilization, a progressive decline of cold mountain habitats and their biota (Gottfried et al., 2012) as the transition from cloud forest to open alpine grasslands (Páramo) at high elevations, show the thermophilization rates across elevations are affected by ecotones’ presence. This study indicates that climate warming is causing rapid shifts in many tropical trees (Fadrique et al., 2018). In another study focused on the treeline of Cordillera de Mérida, Arzac et al. (2019) evaluate the response of plant life form to environmental conditions above the upper montane forest in the Venezuelan Andes and model their potential distribution under warming scenarios. They found that tree cover will sharply increase with increasing elevation, while shrub and caulescent rosette distribution will differ depending on their traits.
These studies about treeline in alpine temperate regions show similar migration patterns, and our results for tropical alpine treeline are not much different from this. However, it is essential to remark that the tropical treeline’s spatial migration patterns could differ. The mechanism of densification of woody vegetation could explain the vegetation adaptation to the impact of global warming. The switch between the woody and non-woody component of the treeline is abrupt for most of the contact edges between the Páramo forest and the Páramo, and the rapid climate warming leads to a fast densification process. Therefore, we face a possible disappearance or narrowing of the Páramo forest ecosystem that serves as an ecotone between the Mountain forest and the Páramo.
Venezuela will expect an increase of 5°C and a decrease in rainfall on scenarios of greenhouse gas emissions and intermediate climate models (MPPEA, 2017). ACFIMAN (2018) indicates a possible increase in Venezuela’s temperature in an unfavorable scenario (RCP8.5) of a maximum of 5°C and a decrease of 23.5% precipitation. The country is currently not prepared to mitigate or face any climate variability because the country’s vulnerability to climate change is too high. Based on integrated climate models within the framework of the fifth phase of the Coordinated Modeling Intercomparison Project Phase 5: CMIP5 (IPCC, 2013), it elaborates on the possible climate change scenarios for the Venezuelan Andes. These scenarios show that for a moderately optimistic scenario (RCP 4.5), we could have, by the end of the century, temperatures 2–3°C above the average of the reference period (1986–2005) and decreased nearby rainfall to 0.1 mm day–1.
Suárez del Moral and Chacón-Moreno (2011) determine at a regional scale the distribution model for Páramo forest in climate change scenarios based on the UKTR models developed by the United Kingdom Meteorological Office (UKMO) and the CCC from the Canadian Centre for Climate Modelling and Analysis (CCCMA). The climatic change CCCMA scenario found that it predicts more significant impacts on the Páramo forest distribution, with more considerable fragmentation in the forest continuum around the mountain range. The UKTR scenario, on the other hand, presents fewer impacts on the distribution of the forest and predicts displacement toward higher elevations without loss of forest toward the upper limit; in comparison with the CCCMA model, which predicts forest displacement toward lower elevations with the disappearance of areas toward the upper limit.
Páramo Forest Deforestation
The deforestation processes in the world are a well-documented problem; however, it has focused on lowland areas, where the forest’s extensions are significant (Verburg et al., 2015; Aide et al., 2019). Andes forest (woody component) has been analyzed by many works at the regional and local levels, focusing on the montane forest ecosystem. Aide et al. (2019) evaluated the change in the distribution of woody vegetation in the tropical Andes of South America for 2001–2014. They found that the extensive loss of forest occurred in areas with less than 1,500 m of altitude. However, it increased the forest vegetation more than losses when the altitude was superior to 2,000 m. Also, Pérez-Escobar et al. (2018) report that mining is a potential threat to the Páramo forest, in some cases disproportionately excluded from Colombia’s protected areas; this activity involves the involuntary displacement of human settlements and large-scale fragmentation and loss of habitat, thus threatening the extinction of endemic flora and fauna.
As we see in our results, we have two different processes of landscape change by deforestation. The first one corresponds with the agricultural advance over the montane cloud forest found in the Capaz study area to elevation under 2,500 m. The demographic growth, which translates into increased social pressure, is the more critical deforestation factor. Comparing the transformation rates of mountain forests reported in the bibliography with those calculated, our results with loss of forests in the basin between 1 and 1.3%, have very similar speeds to other countries as Vietnam 0.63%, Mexico 0.7%, and Bolivia 1.3%, and similar to the national average of deforestation (1.2%) (Rodríguez-Morales et al., 2009).
The second deforestation process is associated with treeline ecosystems. We found that the Evergreen dry páramo forest, the Pre-páramo shrubland, and the Páramo forest ecosystems, practically have been replaced by the Pastures and fallow vegetation, and the Crops (Figure 6B). This deforestation or landscape change is very few documented, probably, because the range and cover of these páramo forest ecosystems are very narrow. On the other hand, there are no multitemporal comparison studies due to these ecosystems’ land use from ancient times. Monasterio (1980b) describes that for the climatic zone where we find the potential distribution of treeline ecosystems between 2,800 and 3,800 m of altitude, land use was based on potato and wheat crops from pre-hispanic and colonial times, respectively. The wheat was expanded in many areas with similar conditions of the potential treeline (mainly climate conditions) during the 16th and 17th centuries in the Cordillera de Mérida. Isolated areas remain current with the same peasant agricultural practices for wheat (De Robert and Monasterio, 1993, 1995; Monasterio, 2002). Since the middle of the 20th century, these areas have been used mainly for potato and vegetable crops, including irrigation and high mechanical technology (Velázquez, 2001). This modern technology allows the increase of agricultural activities with greater intensity.
In some cases, it gives the possibility of advancing the farming frontier on new lands for a human disturbance. Vásquez et al. (2015) show that the effect of human disturbances on plant species composition was determined by accessibility and significantly affects plant diversity by agricultural advance. However, the creation of the National Parks Sierra Nevada in 1952 and Sierra de La Culata in 1989 has slowed these agricultural frontier advances at higher altitudes.
Based on the potential distribution of ecosystems, our results show a historical transformation process of the Páramo forest, masked by not having recent spatial data on these forests’ distribution. Also, it allows us to infer from a transformation process of the Andean landscape by understanding the distribution of crops such as wheat throughout the region.
Study Limitations and Future Recommendations
This work’s primary limitations and methodological caveats are related to the combination of aerial photographs from the different missions and scales and satellite images, which makes the homogeneity of criteria very difficult, and some spatial data do not match. The three studies considered in this work have differences related to the vegetation and ecosystem definition; then, the homogenization and standardization of descriptions and names were hard work. The few financial resources to do fieldwork, reduce the number of collecting data, and the possibility to detail the environmental and social variables took into the field. The lack of meteorological stations with long data records and many stations’ dismantling in the 21st century prevent a better interpretation of Andes’ climatic data. Venezuela’s current and terrible economic, social, and political situation makes difficult the fieldwork and data collecting, and the research in the country universities. However, we integrated these results in a coherent approach.
This work makes it possible to visualize an ecosystem’s transformation that often goes unnoticed at the global, subcontinental, or even national scale due to its extension in the spatial context. Hence, it is necessary to implement collaborative international projects to monitor the landscape transformation at a regional and local level.
New trends and tools have to be incorporated into the research to understand the forest migration affected by climate change. The first is to consider the natural variation of abiotic and biotic factors along mountain elevation gradients. In this case, Tito et al. (2020) propose to take advantage of natural gradients to help us gain a complete understanding of the potential impacts of climate change on species, communities, and biodiversity. Second, to Include modern ecological modeling (Fulton et al., 2019), which is a crucial tool to understand vegetation and ecosystems’ migration in climate change scenarios. Models of plant species distribution for the Páramo ecosystem have been made (Peyre et al., 2019, 2020), which need complete and adequate databases. Therefore, monitoring vegetation (Peyre et al., 2015; Cuesta et al., 2017) and landscape transformation studies are significant in implementing those models. Third, the use of new remote sensing classification techniques to know the distribution of species at a large scale, based on drones and hyperspectral images (Garzón-López and Lasso, 2020). The potential of this technology will help research in the tropical high-altitude ecosystems, to improve treeline prediction, expand existing databases (Peyre et al., 2015), make changes of scale and models (Fulton et al., 2019) improve, monitor, and detect threats to for these ecosystems. A fourth aspect to consider is the microscale studies, which allow us to understand the colonization process of plant species in confined spaces where the microclimatic characteristics are highly variable. Studies such as those carried out by Cortés et al. (2014); Ramírez et al. (2015), Sedlacek et al. (2016); Hupp et al. (2017), Gentili et al. (2020); Llambí et al. (2020), Zellweger et al. (2020), and Llambí et al., submitted allow the analysis of migration processes of mountain forest and High-Andean vegetation at microscales.
The impact of climate warming and deforestation on the Páramo forest as a representative ecosystem of the treeline shows us that this study is necessary for an integrated global change adaptation approach. This approach has to include nature-based solutions at regional and local scales to conserve the biodiversity of the High Mountain Ecosystems of the Andes region.
Data Availability Statement
The raw data supporting the conclusions of this article will be made available by the authors, without undue reservation.
Author Contributions
EC-M study conception, design, critical revision, and drafting of the manuscript. EC-M, MR-M, PS, DP, and AA acquisition of data, analysis, and interpretation of the data. All authors contributed to the article and approved the submitted version.
Funding
EC-M was supported by an academic scholarship from the Institute of International Education’s Scholar Rescue Fund (IIE-SRF). This work was partly supported by the Catalan Government (Project 2017784 SGR 1518).
Conflict of Interest
The authors declare that the research was conducted in the absence of any commercial or financial relationships that could be construed as a potential conflict of interest.
Acknowledgments
We would like to thank the following institutions for their financial support: Consejo de Desarrollo Científico, Humanístico, Tecnológico y de las Artes, Universidad de los Andes (CDCHTA-ULA) through projects C-1591-08-01-F, C-1238-04-01-F, and C-1259-04-09-A; the Inter-American Institute for Global Change Research (IAI) through the project LEAF CRNII 005, and the Fondo Nacional de Ciencia, Técnología e Innovación, Venezuela through the project ECOMAP_CC (FONACIT 2011000350). We would also like to thank reviewers for their constructive input, which greatly contributed to improving the manuscript.
References
ACFIMAN (2018). Primer Reporte Académico de Cambio Climático (PRACC): Contribución de los Grupos de Trabajo I, II y III al Primer Reporte Académico. Secretaría Académica de Cambio Climático. Caracas: Academia de Ciencias, Físicas, Matemáticas y Naturales.
Aide, T. M., Grau, R. H., Graesser, J., Andrade-Nuñez, M. J., Aráoz, E., Barros, A. P., et al. (2019). Woody vegetation dynamics in the tropical and subtropical Andes from 2001 to 2014: Satellite image interpretation and expert validation. Glob. Change Biol. 25, 2112–2126. doi: 10.1111/gcb.14618
Andressen, R. (2007). Circulación Atmosférica y Tipos de Climas. En Fundación Empresas Polar. GeoVenezuela, Tomo 2: Medio Físico y Recursos Ambientales. Caracas: Fundación Empresas Polar, 238–328.
Andressen, R., and Ponte, R. (1973). Estudio Integral de las Cuencas de los Ríos Chama y Capazón. Mérida: Universidad de Los Andes Facultad de Ciencias Forestales.
Arekhi, M., Yesil, A., Ozkan, U. Y., and Sanli, F. B. (2018). Detecting treeline dynamics in response to climate warming using forest stand maps and Landsat data in a temperate forest. For. Ecosyst. 5:23. doi: 10.1186/s40663-018-0141-3
Arroyo, M. T. K., and Cavieres, L. A. (2013). “High-elevation andean ecosystems,” in Encyclopedia of Biodiversity, Vol. 4, ed. S. A. Levin (Amsterdam: Elsevier), 36–110.
Arzac, A. (2008). Distribución Espacial de Formas de Vida de Plantas en un Gradiente Altotérmico en los Andes Tropicales. Ph. D. Thesis, Universidad de los Andes, Mérida.
Arzac, A., Chacón-Moreno, E., Llambí, L. D., and Dulhoste, R. (2011). Distribucion de formas de vida de plantas en el limite superior del ecotono Bosque Páramo en los Andes Tropicales. Ecotropicos 24, 26–46.
Arzac, A., Llambí, L. D., Dulhoste, R., Olano, J. M., and Chacón-Moreno, E. (2019). Modelling the effect of temperature changes on plant life-form distribution in a treeline ecotone of the tropical Andes. Plant Ecol. Divers. 12, 1–13. doi: 10.1080/17550874.2019.1655108
Ataroff, M., and Sarmiento, L. (2004). “Las unidades ecológicas de los Andes de Venezuela,” in Reptiles de los Andes de Venezuela, eds E. La Marca and P. Soriano (Mérida: BIOGEOS), 11–26.
Azócar, A., Rada, F., and García-Núñez, C. (2007). Functional characteristics of the arborescent genus Polylepis along a latitudinal gradient in the High Andes. Interciencia 32, 663–668.
Bader, M. Y., Llambí, L. D., Case, B. S., Buckley, H. L., Toivonen, J. M., Camarero, J. J., et al. (2020). A global framework for linking alpine-treeline ecotone patterns to underlying processes. Ecography 43, 1–24. doi: 10.1111/ecog.05285
Bader, M. Y., Rietkerk, M., and Bregt, A. K. (2007). Vegetation structure and temperature regimes of tropical alpine treelines. Arctic Antarctic Alp. Res. 39, 353–364. doi: 10.1657/1523-0430(06-055)[bader]2.0.co;2
Bazzaz, F. (1996). Plant in Changing Environments: Linking Physiological Population and Community Ecology. Cambridge: Cambridge University Press.
Cáceres, Y., and Rada, F. (2011). ¿Cómo responde la especie leñosa Vaccinium meridionale a la temperatura en su límite altitudinal de distribución en los Andes tropicales? Ecotropicos 24, 80–91.
Camarero, J., and Gutiérrez, E. (2004). Pace and pattern of recent treeline dynamics: response of ecotones to climatic variability in the Spanish Pyrenees. Clim. Change 63, 181–200. doi: 10.1023/b:clim.0000018507.71343.46
Cavieres, L., and Piper, F. (2004). “Determinantes ecofisiológicos del límite altitudinal de los árboles,” in Fisiología Ecológica en Plantas, ed. H. M. Cabrera (Valparaíso: Ediciones Universitarias de Valaparaíso), 221–234.
Chacón-Moreno, E. (2004). Mapping savanna ecosystems of the Llanos del Orinoco using multitemporal NOAA satellite imagery. Int. J. Appl. Earth Observ. Geoinform. 5, 41–53. doi: 10.1016/j.jag.2003.08.003
Chacón-Moreno, E. (2007). Ecological and Spatial Modelling: Mapping Ecosystems, Landscape Changes, and Plant Species Distribution in Llanos del Orinoco, Venezuela. Ph.D. Thesis. International Institute for Geo-Information Science and Earth Observation, and Wageningen University, Enschede.
Chacón-Moreno, E., Smith, J. K., Skidmore, A. K., Prins, H. H. T., and Toxopeus, A. G. (2007). Modeling spatial patterns of plant distribution as a consequence of hydrological dynamic processes in a Venezuelan flooding savanna. Ecotropicos 20, 55–73.
Chacón-Moreno, E., and Suárez del Moral, P. (2020). Mapa bioclimático de la Cordillera de Mérida. Ecotrópicos 32:e0010.
Chacón-Moreno, E., Ulloa, A., Tovar, W., Márquez, T. C., Sulbarán-Romero, E., and Rodríguez-Morales, M. (2013). Sistema de clasificación ecológico y mapas de ecosistemas: enfoque conceptual-metodológico para Venezuela. Ecotropicos 26, 1–27.
Cierjacks, A., Rühr, N. K., Wesche, K., and Hensen, I. (2008). Effects of altitude and livestock on the regeneration of two tree line forming Polylepis species in Ecuador. Plant Ecol. 194, 207–221. doi: 10.1007/s11258-007-9285-x
Congalton, R. (1991). A review of assessing the accuracy of classifications of remotely sensed data. Rem. Sens. Environ. 37, 35–46. doi: 10.1016/0034-4257(91)90048-b
Congalton, R., Oderwald, R. Y., and Mead, R. (1983). Assessing Landsat classification accuracy using discrete multivariate statistical techniques. Photogram. Eng. Rem. Sens. 49, 1671–1678.
Correa, A., Ochoa-Tocachi, B. F., Birkel, C., Ochoa-Sánchez, A., Zogheib, C., Tovar, C., et al. (2020). A concerted research effort to advance the hydrological understanding of tropical páramos. Hydrol. Process. 34, 4609–4627. doi: 10.1002/hyp.13904
Cortés, A. J., Garzón, L. N., Valencia, J. B., and Madriñán, S. (2018). On the causes of rapid diversification in the páramos: isolation by ecology and genomic divergence in espeletia. Front. Plant Sci. 871:1700. doi: 10.3389/fpls.2018.01700
Cortés, A. J., Waeber, S., Lexer, C., Sedlacek, J., Wheeler, J. A., Van Kleunen, M., et al. (2014). Small-scale patterns in snowmelt timing affect gene flow and the distribution of genetic diversity in the alpine dwarf shrub Salix herbacea. Heredity 113, 233–239. doi: 10.1038/hdy.2014.19
Costa, M., Cegarra, A., Lugo, L., Lozada, J., Guevara, J., and Soriano, P. (2007). The bioclimatic belts of the Venezuelan Andes in the State of Mérida. Phytocoenologia 37, 711–738. doi: 10.1127/0340-269X/2007/0037-0711
Cuesta, F., Muriel, P., Llambí, L. D., Halloy, S., Aguirre, N., Beck, S., et al. (2017). Latitudinal and altitudinal patterns of plant community diversity on mountain summits across the tropical Andes. Ecography 40, 1381–1394. doi: 10.1111/ecog.02567
De Robert, P., and Monasterio, M. (1993). “Prácticas agrícolas campesinas en el Páramo de Apure, Sierra Nevada de Mérida, Venezuela,” in El Uso de Recursos Naturales en las Montañas: Tradición y Transformación, ed. M. Rabey (Paris: MAB-UNESCO Uruguay), 37–54.
De Robert, P., and Monasterio, M. (1995). Cambios y continuidades en el sistema triguero de la cordillera de Mérida, Venezuela. Sci. Guaianae 5, 269–296.
Dulhoste, R. (2010). Respuestas Ecofisiológica de Plantas del Límite Arbóreo (Selva nublada-Páramo) al Estrés Térmico, Hídrico, y Lumínico en los Andes Venezolanos. Tesis Doctoral, Ecológicas Universidad de los Andes, Mérida.
Fadrique, B., Báez, S., Duque, A., Malizia, A., Blundo, C., Carilla, J., et al. (2018). Widespread but heterogeneous changes in the tree species composition of Andean forests under rising temperatures. Nature 564, 207–212. doi: 10.1038/s41586-018-0715-9
Feeley, K. J., Rehm, E. M., and Machovina, B. (2012). The responses of tropical forest species to global climate change: acclimate, adapt, migrate, or go extinct? Front. Biogeogr. 4:69–82. doi: 10.21425/F54212621
Feuillet, T., Birre, D., Milian, J., Godard, V., Clauzel, C., and Serrano-Notivoli, R. (2020). Spatial dynamics of alpine tree lines under global warming: what explains the mismatch between tree densification and elevational upward shifts at the tree line ecotone? J. Biogeogr. 47, 1056–1068. doi: 10.1111/jbi.13779
Flantua, S., Onstein, R., Leipzig, H. J., O’Dea, A., Hooghiemstra, H., and Giraldo-Pastrana, C. (2019). “The elevational dance of the Andean high mountain biome in the Pleistocene arena,” in International Biogeography Society Abstract BooK - 2019 Humboldt Meeting, eds E. Bonaccorso, J. M. Guayasamin, C. Hoorn, K. Faller, and M. Ortega (Quito: IBS).
Fulton, E. A., Blanchard, J. L., Melbourne-Thomas, J., and Plaganyi-Lloyd, E. E. (2019). Where the ecological gaps remain, A modellers’ perspective. Front. Ecol. Evol. 7:424. doi: 10.3389/fevo.2019.00424
Garzón-López, C. X., and Lasso, E. (2020). Species classification in a tropical alpine ecosystem using UAV-Borne RGB and hyperspectral imagery. Drones 4:69. doi: 10.3390/drones4040069
Gentili, R., Baroni, C., Panigada, C., Rossini, M., Tagliabue, G., Armiraglio, S., et al. (2020). Glacier shrinkage and slope processes create habitat at high elevation and microrefugia across treeline for alpine plants during warm stages. Catena 193:104626. doi: 10.1016/j.catena.2020.104626
Gottfried, M., Pauli, H., Futschik, A., Akhalkatsi, M., Barančok, P., Benito Alonso, J. L., et al. (2012). Continent-wide response of mountain vegetation to climate change. Nat. Clim. Change 2, 111–115. doi: 10.1038/nclimate1329
Graf, K. (1996). Algunos apuntes sobre el paleoclima en los Andes venezolanos hace 13.000 años. Plántula 1, 95–106.
Guisan, A., Holten, J., Spichier, R., and Tessier, L. (1995). Potential Ecological Impacts of Climate Change in the Alps and Fennoscandian Mountains. Genčve: Conservatoire et Jardin botaniques, 194.
Herzog, S. K., Jørgensen, P. M., Martínez Güingla, R., Martius, C., Anderson, E. P., Hole, D. G., et al. (2010). Efectos del Cambio Climático en la Biodiversidad de los Andes Tropicales: El Estado de Conocimiento Científìco. Resumen Para Tomadores de Decisiones y Responsables de Formulación de Políticas Públicas. São José dos Campos: Instituto Interamericano para la Investigación del Cambio Global (IAI).
Hoch, G., and Körner, C. (2003). The carbon charging of pines at the climatic treeline: a global comparison. Oecologia 135, 10–21. doi: 10.1007/s00442-002-1154-7
Holt, R. D. (1990). The microevolutionary consequences of climate change. Trends Ecol. Evol. 5, 311–315. doi: 10.1016/0169-5347(90)90088-u
Huntley, B. (1992). How plants respond to climate Change: migration rates, individualism and the consequences for plant communities. Ann. Bot. 67 (Suppl. 1), 15–22. doi: 10.1093/oxfordjournals.aob.a088205
Hupp, N., Llambí, L. D., Ramírez, L., and Callaway, R. M. (2017). Alpine cushion plants have species–specific effects on microhabitat and community structure in the tropical Andes. J. Veg. Sci. 28, 1–11. doi: 10.1111/jvs.12553
IPCC (2013). “Climate change 2013: the physical science basis,” in Contribution of Working Group I to the Fifth Assessment Report of the Intergovernmental Panel on Climate Change, eds T. F. Stocker, D. Qin, G.-K. Plattner, M. Tignor, S. K. Allen, J. Boschung, et al. (Cambridge: Cambridge University Press), 1535.
IPCC (2014). “Climate change 2014: impacts, adaptation, and vulnerability. Part A: global and sectoral aspects,” in Contribution of Working Group II to the Fifth Assessment Report of the Intergovernmental Panel on Climate Change, eds C. B. Field, V. R. Barros, D. J. Dokken, K. J. Mach, M. D. Mastrandrea, T. E. Bilir, et al. (Cambridge: Cambridge University Press), 1132.
IPCC (2018). “Global warming of 1.5°C,” in An IPCC Special Report on the Impacts of Global Warming of 1.5°C Above Pre-Industrial Levels and Related Global Greenhouse Gas Emission Pathways, In the Context of Strengthening the Global Response to the Threat of Climate Change, Sustainable Development, and Efforts to Eradicate Poverty, eds V. Masson-Delmotte, P. Zhai, H.-O. Pörtner, D. Roberts, J. Skea, P. R. Shukla, et al. (Geneva: IPCC).
Janssen, L. L. F., and van del Wel, F. J. M. (1994). Accuracy assessment of satellite derived land-cover data: a review. Photogramm. Eng. Rem. Sens. 60, 419–426.
Jenness, J., and Wynne, J. J. (2007). Kappa Analysis (kappa_stats.avx) Extension for ArcView 3.x. Flagstaff, AZ: Jenness Enterprises.
Jobbágy, E., and Jackson, R. (2000). Global controls of forest line elevation in the northern and southern hemispheres. Glob. Ecol. Biogeogr. 9, 253–268. doi: 10.1046/j.1365-2699.2000.00162.x
Jongman, R. H. G., Ter Braak, C. J. F., and Van Tongeren, O. F. R. (1995). Data Analysis in Community and Landscape Ecology. Cambridge: Cambridge university press.
Josse, C., Cuesta, F., Navarro, G., Barrena, V., Cabrera, E., Chacón-Moreno, E., et al. (2009). Ecosistemas de los Andes del Norte y Centrales. Bolivia, Colombia, Ecuador, Peru y Venezuela. Lima: Programa Regional ECOBONA.
Körner, C. (1998). A re-assessment of high elevation treeline positions and their explanation. Oecologica 115, 445–459. doi: 10.1007/s004420050540
Körner, C., and Paulsen, J. (2004). A worldwide study of high altitude treeline temperatures. J. Biogeogr. 31, 713–732. doi: 10.1111/j.1365-2699.2003.01043.x
Lachniet, M. S., and Vazquéz-Selem, L. (2005). Last Glacial Maximum equilibrium line altitudes in the circum-Caribbean (Mexico, Guatemala, Costa Rica, Colombia, and Venezuela). Quat. Int. 138-139C, 129–144. doi: 10.1016/j.quaint.2005.02.010
Lenoir, J., Gégout, J.-C., Guisan, A., Vittoz, P., Wohlgemuth, T., Zimmermann, N. E., et al. (2010). Going against the flow: potential mechanisms for unexpected downslope range shifts in a warming climate. Ecography 33, 295–303. doi: 10.1111/j.1600-0587.2010.06279.x
Lenoir, J., Gégout, J. C., Marquet, P. A., de Ruffray, P., and Brisse, H. (2008). A significant upward shift in plant species optimum elevation during the 20th century. Science 320, 1768–1777. doi: 10.1126/science.1156831
Little, C. J., Wheeler, J. A., Sedlacek, J., Cortés, A. J., and Rixen, C. (2016). Small-scale drivers: the importance of nutrient availability and snowmelt timing on performance of the alpine shrub Salix herbacea. Oecologia 180, 1015–1024. doi: 10.1007/s00442-015-3394-3
Llambí, L. D. (2015). Estructura, diversidad y dinámica de la vegetación en el ecotono bosque-páramo: revisión de la evidencia en la Cordillera de Mérida. Acta Biol. Colomb. 20, 5–20. doi: 10.15446/abc.v20n3.46721
Llambí, L. D., Durbecq, A., Cáceres-Mago, K., Cáceres, A., Ramírez, L., Torres, E., et al. (2020). Interactions between nurse-plants and an exotic invader along a tropical alpine elevation gradient: growth-form matters. Alp. Bot. 130, 59–73. doi: 10.1007/s00035-020-00235-6
Llambí, L. D., and Rada, F. (2019). Ecological research in the tropical alpine ecosystems of the Venezuelan páramo: past, present and future. Plant Ecol. Diver. 12, 1–20. doi: 10.1080/17550874.2019.1680762
Llambí, L. D., Ramírez, L., and Schwarzkopf, T. (2014). “Patrones de distribución de plantas leñosas en el ecotono bosque-páramo de la Sierra Nevada de Mérida: ¿Qué nos sugieren sobre la dinámica del límite del bosque?,” in Avances en Investigación Para la Conservación de los Páramos Andinos, eds F. Cuesta, J. Sevink, L. D. Llambí, B. De Bičvre, and J. Posner (Lima: CONDESAN).
Lutz, D. A., Powel, R. L., and Silman, M. R. (2013). Four decades of andean timberline migration and implications for biodiversity loss with climate change. PLoS One 8:e74496. doi: 10.1371/journal.pone.0074496
Madriñán, S., Cortés, A., and Richardson, J. (2013). Páramo is the world’s fastest evolving and coolest biodiversity hotspot. Front. Genet. 4:192. doi: 10.3389/fgene.2013.00192
Mahaney, W., Kalm, V., and Bezada, M. (1997). “Estratigrafía del cuaternario tardío de un ambiente periglacial en el área de Mucubají, Mucuchaché, El Pedregal. Andes centrales venezolanos,” in Memorias del I Congreso Latinoamericano de Sedimentologia, Vol. 1, ed. S. V. de Geología (Mérida: Venezuelan Society of Geology), 417–424.
Malizia, A., Blundo, C., Carilla, J., Osinaga Acosta, O., Cuesta, F., Duque, A., et al. (2020). Elevation and latitude drives structure and tree species composition in Andean forests: Results from a large-scale plot network. PLoS One 15:e0231553. doi: 10.1371/journal.pone.0231553
MARN (2005). Primera Comunicación Nacional en Cambio Climático de Venezuela. Ministerio del Ambiente y de los Recursos Naturales Proyecto MARN-PNUD VEN/00/G31. Caracas: MARN.
Mayr, S., Schwienbacher, F., and Bauer, H. (2003). Winter at the alpine timberline. Why does embolism occur in norway spruce but not in stone pine? Plant Physiol. 131, 780–792.
Monasterio, M. (1980a). “Las formaciones vegetales de los Páramos de Venezuela,” in Estudios Ecológicos en los Páramos Andinos, ed. M. Monasterio (Mérida: Editorial de la Universidad de Los Andes), 47–91.
Monasterio, M. (1980b). “Poblamiento humano y uso de la tierra en los altos Andes de Venezuela,” in Estudios Ecológicos en los Páramos Andinos, ed. M. Monasterio (Mérida: Editorial de la Universidad de Los Andes), 170–198.
Monasterio, M. (2002). “Evolución y transformación de los páramos en la Cordillera de Mérida: paisajes naturales y culturales en Venezuela,” in Paisajes Culturales en los Andes, ed. E. Mujica (Lima: UNESCO), 99–109.
Monasterio, M., and Reyes, S. (1980). “Diversidad ambiental y variación de la vegetación en los páramos de los Andes Venezolanos,” in Estudios Ecológicos en los Páramos Andinos, ed. M. Monasterio (Mérida: Editorial de la Universidad de Los Andes), 47–91.
Morecroft, M. D., and Keith, S. A. (2016). “Plant ecology,” in Climate Change. Observed Impacts on Planet Earth. Second Edition, ed. T. Letcher (Amsterdam: Elsevier).
MPPEA (2017). Segunda Comunicación Nacional ante la Convención Marco de las Naciones Unidas sobre Cambio Climático. Caracas: Ministerio del Poder Popular para el Ecosocialismo y Agua.
Myers-Smith, I. H., Forbes, B. C., Wilmking, M., Hallinger, M., Lantz, T., Blok, D., et al. (2011). Shrub expansion in tundra ecosystems: dynamics, impacts and research priorities. Environ. Res. Lett. 6:045509. doi: 10.1088/1748-9326/6/4/045509
Ni, J., Harrison, S., Colin, I., Kutzbach, J., and Stich, S. (2006). Impact of climate variability on present Holocene vegetation: a model-based study. Ecol. Model. 191, 469–486.
Nijmeijer, R., de Haas, A., Dost, R. J. J., and Budde, P. E. (2001). ILWIS 3.0 Academic User’s Guide. Enschede: International Institute for Aerospace Survey and Earth Sciences.
Paredes, M. D. (2018). Ecosistemas en una sección de los Parques Nacionales Sierra Nevada y Sierra de La Culata: de lo potencial a lo transformado. Trabajo de Investigación Título de Geógrafo. Escuela de Geografía. Facultad de Ciencias Forestales y Ambientales. Mérida: Universidad de Los Andes.
Parolo, G., and Graziano, R. (2008). Upward migration of vascular plants following a climate warming trend in the Alps. Basic Appl. Ecol. 9, 100–107. doi: 10.1016/j.baae.2007.01.005
Pauli, H., and Halloy, S. (2019). High Mountain Ecosystems Under Climate Change. Oxford Research Encyclopedia of Climate Science. Oxford: Oxford University Press. doi: 10.1093/acrefore/9780190228620.013.764
Peñuelas, J., and Boada, M. (2003). A global change-induced biome shift in the Montseny mountains (NE Spain). Glob. Change Biol. 9, 131–140. doi: 10.1046/j.1365-2486.2003.00566.x
Peñuelas, J., Filella, I., and Comas, P. E. (2002). Changed plant and animal life cycles from 1952 to 2000 in the Mediterranean region. Glob. Change Biol. 8, 531–544. doi: 10.1046/j.1365-2486.2002.00489.x
Pérez-Escobar, O. A., Cámara-Leret, R., Antonelli, A., Bateman, R., Bellot, S., Chomicki, G., et al. (2018). Mining threatens Colombian ecosystems. Science 359:1475. doi: 10.1126/science.aat4849
Pernía, E. (1989). Guía Practica de Fotointerpretación. Facultad de Ciencias Forestales. Mérida: Universidades de los Andes.
Peyre, G., Balslev, H., Font, X., and Tello, J. S. (2019). Fine-scale plant richness mapping of the andean páramo according to macroclimate. Front. Ecol. Evol. 7:377. doi: 10.3389/fevo.2019.00377
Peyre, G., Balslev, H., Martí, D., Sklenář, P., Ramsay, P., Lozano, P., et al. (2015). VegPáramo, a flora and vegetation database for the Andean páramo. Phytocoenologia 45, 195–201. doi: 10.1127/phyto/2015/0045
Peyre, G., Lenoir, J., Karger, D. N., Gomez, M., Gonzalez, A., Broennimann, O., et al. (2020). The fate of páramo plant assemblages in the sky islands of the northern Andes. J. Veg. Sci. 00, 1–14. doi: 10.1111/jvs.12898
Pouchon, C., Fernández, A., Nassar, J. M., Boyer, F., Aubert, S., Lavergne, S., et al. (2018). Phylogenomic analysis of the explosive adaptive radiation of the espeletia complex (Asteraceae) in the tropical Andes. Syst. Biol. 67, 1041–1060. doi: 10.1093/sysbio/syy022
Puentes, J. (2010). Patrones y Mecanismos de Establecimiento de dos Especies Leñosas en la Zona de Transición entre el Bosque Paramero y el Páramo en los Andes Tropicales (tesis de maestría). Mérida: Universidad de los Andes en Venezuela, 130.
Quesada-Román, A., Ballesteros-Cánovas, J. A., Guillet, S., Madrigal-González, J., and Stoffel, M. (2020). Neotropical Hypericum irazuense shrubs reveal recent ENSO variability in Costa Rican páramo. Dendrochronologia 61:125704. doi: 10.1016/j.dendro.2020.125704
Ramírez, L., Llambí, L. D., Schwarzkopf, T., Gámez, L. E., and Márquez, N. J. (2009). Vegetation structure along the forestpáramo transition belt in the Sierra Nevada de Mérida: implications for understanding treeline dynamics. Ecotrópicos 22, 83–98.
Ramírez, L., Rada, F., and LLambí, L. D. (2015). Linking patterns and processes through ecosystem engineering: effects of shrubs on microhabitat and water status of associated plants in the high tropical Andes. Plant Ecol. 216, 213–225. doi: 10.1007/s11258-014-0429-5
Rodríguez, E., Schwarzkopf, T., Gámez, L. E., Dugarte, W., and Dulhoste, R. (2011). Canopy structure and Woody species composition at the upper treeline in the Venezuelan Andes. Ecotrópicos 24, 47–59.
Rodríguez, M. (2005). Cambio del paisaje en la cuenca del río Capaz. Trabajo Especial de Grado de Licenciatura en Biología. Mérida: Universidad de Los Andés.
Rodríguez-Morales, M., Chacón-Moreno, E., and Ataroff, M. (2009). Transformación del paisaje de selvas de montaña en la cuenca del río Capaz, Andes venezolanos. Ecotropicos 22, 64–82.
Rull, V., Abbott, M., Polissar, P., Wolfe, A., Bezada, M., and Bradley, R. (2005). 15,000-yr pollen record of vegetation change in the high altitude tropical Andes at Laguna Verde Alta, Venezuela. Quat. Res. 64, 308–317. doi: 10.1016/j.yqres.2005.08.014
Sage, R. F. (2020). Global change biology: a primer. Glob. Change Biol. 26, 3–30. doi: 10.1111/gcb.14893
Santaella, W. (2007). Análisis del Cambio del Paisaje en la Línea de Selva Nublada – páramo, La Aguada, Mérida. Trabajo de Grado Licenciatura en Estudios Ambientales. Lara, VIC: Universidad de Yacambú.
Sarmiento, G. (1986). “Ecological features of climate in high tropical mountains,” in High Altitude Tropical Biogeography, eds F. Vuilleumier and M. Monasterio (Oxford: Oxford University Press).
Schubert, C., and Vivas, L. (1993). Morfología periglacial: El páramo. El Cuaternario de la Cordillera de Mérida, Andes Venezolanos. Mérida: Universidad de Los Andes.
Schwarzkopf, T., Ramírez, L., Rodríguez, E., Llambí, L. D., and Dulhoste, R. (2010). A characterization of the Woody Vegetation at the Treeline in the Venezuelan Andes. Perth: Extended of Global Change and the World’s Mountains.
Sedlacek, J., Cortés, A. J., Wheeler, J., Bossdorf, O., Hoch, G., Klápště, J., et al. (2016). Evolutionary potential in the Alpine: trait heritabilities and performance variation of the dwarf willow Salix herbacea from different elevations and microhabitats. Ecol. Evol. 6, 3940–3952. doi: 10.1002/ece3.2171
Sedlacek, J., Wheeler, J. A., Cortés, A. J., Bossdorf, O., Hoch, G., Lexer, C., et al. (2015). The response of the alpine dwarf shrub Salix herbacea to altered snowmelt timing: Lessons from a multi-site transplant experiment. PLoS One 10:e0122395. doi: 10.1371/journal.pone.0122395
Silva, G. A. (2010). Tipos y Subtipos climáticos de Venezuela. Trabajo de Ascenso a la Categoría de Titular. Facultad de Ciencias Forestales y Ambientales. Mérida: Universidad de Los Andes.
Smith, W., Germino, M., Hancock, T., and Johnson, D. (2003). Another perspective on altitudinal limits of alpine timberlines. Tree Physiol. 23, 1101–1112. doi: 10.1093/treephys/23.16.1101
Stansell, N., Abbot, M., Polissar, P., Wolfe, A., Bezada, M., and Rull, V. (2005). Late quaternary deglacial history of the Merida Andes, Venezuela. J. Quat. Sci. 20, 801–812. doi: 10.1002/jqs.973
Stansell, N., Polissar, P., and Abbot, M. (2007). Last maximum equilibrium-line altitude and paleo-temperature reconstructions for the Cordillera de Merida, Venezuelan Andes. Quat. Res. 67, 115–127. doi: 10.1016/j.yqres.2006.07.005
Steinbauer, M. J., Grytnes, J. A., Jurasinski, G., Kulonen, A., Lenoir, J., Pauli, H., et al. (2018). Accelerated increase in plant species richness on mountain summits is linked to warming. Nature 556, 231–234. doi: 10.1038/s41586-018-0005-6
Suárez del Moral, P., and Chacón-Moreno, E. (2011). Modelo espacial de distribución del ecotono bosque-páramo en escenarios de Cambio Climático. Ecotropicos 24, 3–25.
Telwala, Y., Brook, B. W., Manish, K., and Pandit, M. K. (2013). Climate-induced elevational range shifts and increase in plant species richness in a himalayan biodiversity Epicentre. PLoS One 8:e57103. doi: 10.1371/journal.pone.0057103
Ter Braak, C., and Looman, C. (1995). “Regression,” in Data Analysis in Community and Landscape Ecology, eds R. Jongman, C. Ter Braak, and O. F. R. Van Tongeren (New York, NY: Cambridge University Press), 29–77. doi: 10.1017/CBO9780511525575.005
Ter Braak, C., and Prentice, I. (1988). A theory of gradient analysis. Adv. Ecol. Res. 18, 271–317. doi: 10.1016/S0065-2504(08)60183-X
Tito, R., Vasconcelos, H. L., and Feeley, K. J. (2020). Mountain ecosystems as natural laboratories for climate change experiments. Front. For. Glob. Change 3:38. doi: 10.3389/ffgc.2020.00038
Tranquillini, W. (1979). Physiological Ecology of the Alpine Timberline. Berlin: Springer-Verlag. doi: 10.1007/978-3-642-67107-4
Vale, M. M., and Araújo, M. (2018). “Cambios climáticos y distribución geográfica de las especies,” in Cambio Global. Una Mirada Desde Iberoamérica, eds P. A. Marquet, F. Valladares, S. Magro, A. Gaxiola, and A. Enrich-Prast (Madrid: Editado por ACCI), 243–259.
Valencia, J. B., Mesa, J., León, J. G., Madriñán, S., and Cortés, A. J. (2020). Climate vulnerability assessment of the espeletia complex on páramo sky islands in the northern andes. Front. Ecol. Evol. 8:309. doi: 10.3389/fevo.2020.565708
Van Der Hammen, T. (1974). The Pleistocene changes of vegetation and climate in tropical South America. J. Biogeogr. 1, 3–26. doi: 10.2307/3038066
Vásquez, D. L. A., Balslev, H., and Sklenář, P. (2015). Human impact on tropical-alpine plant diversity in the northern Andes. Biodiver. Conserv. 24, 2673–2683. doi: 10.1007/s10531-015-0954-0
Velázquez, N. (2001). Dinámica Socio-Ambiental y Modernización Agrícola en los Valles Altos Andinos: Mucuchíes y Timotes (1930-1999). 302. Ph. D. Thesis, Universidad de Los Andes, Mérida.
Verburg, P. H., Crossman, N., Ellis, E. C., Heinimann, A., Hostert, P., Mertz, O., et al. (2015). Land system science and sustainable development of the earth system: a global land project perspective. Anthropocene 12, 29–41. doi: 10.1016/j.ancene.2015.09.004
Vinicius, F., Farjalla, R., Coutinho, L., Gómez-Aparicio, S. A., Navarrete, A. P. F., Pires, M. L. G., et al. (2018). “Pérdida de biodiversidad: causas y consecuencias para la humanidad,” in Cambio Global. Una Mirada Desde Iberoamérica, eds P. A. Marquet, F. Valladares, S. Magro, A. Gaxiola, and A. Enrich-Prast (Madrid: Editado por ACCI), 89–110.
Walther, G.-R. (2003). Plants in a warmer world. Perspect. Plant Ecol. Evol. Syst. 6, 169–185. doi: 10.1078/1433-8319-00076
Walther, G. -R., Beißner, S., and Burga, C. A. (2005). Trends in the upward shift of alpine plants. J. Veg. Sci. 16, 541–548. doi: 10.1111/j.1654-1103.2005.tb02394.x
Weingarten, B., Yuretich, R., Bradley, R., and Salgado-Laboriau, M. (1990). Characteristics of sediments in an altitudinal sequence of lakes in the Venezuelan Andes: climatic implications. J. South Am. Earth Sci. 3, 113–124. doi: 10.1016/0895-9811(90)90024-U
Wesche, K., Cierjacks, A., Assefa, Y., Wagner, S., Fetene, M., and Hensen, I. (2008). Recruitment of trees at tropical alpine treelines: erica in Africa versus Polylepis in South America. Plant Ecol. Diver. 1, 35–46. doi: 10.1080/17550870802262166
Wheeler, J. A., Cortés, A. J., Sedlacek, J., Karrenberg, S., van Kleunen, M., Wipf, S., et al. (2016). The snow and the willows: earlier spring snowmelt reduces performance in the low-lying alpine shrubSalix herbacea. J. Ecol. 104, 1041–1050. doi: 10.1111/1365-2745.12579
Wheeler, J. A., Hoch, G., Cortés, A. J., Sedlacek, J., Wipf, S., and Rixen, C. (2014). Increased spring freezing vulnerability for alpine shrubs under early snowmelt. Oecologia 175, 219–229. doi: 10.1007/s00442-013-2872-8
Keywords: climate warming, treeline, land use, woody densification, páramo forest ecosystem, landscape transformation
Citation: Chacón-Moreno E, Rodríguez-Morales M, Paredes D, Suárez del Moral P and Albarrán A (2021) Impacts of Global Change on the Spatial Dynamics of Treeline in Venezuelan Andes. Front. Ecol. Evol. 9:615223. doi: 10.3389/fevo.2021.615223
Received: 08 October 2020; Accepted: 29 January 2021;
Published: 25 February 2021.
Edited by:
Domenico Gargano, University of Calabria, ItalyReviewed by:
Andrés J. Cortés, Colombian Corporation for Agricultural Research (AGROSAVIA), ColombiaGwendolyn Peyre, University of the Andes, Colombia
Giuseppe Fenu, University of Cagliari, Italy
Copyright © 2021 Chacón-Moreno, Rodríguez-Morales, Paredes, Suárez del Moral and Albarrán. This is an open-access article distributed under the terms of the Creative Commons Attribution License (CC BY). The use, distribution or reproduction in other forums is permitted, provided the original author(s) and the copyright owner(s) are credited and that the original publication in this journal is cited, in accordance with accepted academic practice. No use, distribution or reproduction is permitted which does not comply with these terms.
*Correspondence: Eulogio Chacón-Moreno, ZXVsb2dpby5jaGFjb25AdWRsLmNhdA==; ZXVsb2dpby5jaGFjb25AZ21haWwuY29t