 Heather A. Fischer
 Leah R. Gerber
 Elizabeth A. Wentz3
- 1STEM Research Center, Oregon State University, Corvallis, OR, United States
- 2Center for Biodiversity Outcomes, Arizona State University, Tempe, AZ, United States
- 3School of Geographical Sciences and Urban Planning, Arizona State University, Tempe, AZ, United States
Contributory citizen science programs focused on ecological monitoring can produce fine-grained and expansive data sets across spatial and temporal scales. With this data collection potential, citizen scientists can significantly impact the ability to monitor ecological patterns. However, scientists still harbor skepticism about using citizen science data in their work, generally due to doubts about data quality. Numerous peer-reviewed articles have addressed data quality in citizen science. Yet, many of these methods are not useable by third-party scientists (scientists who are not directly involved in the citizen science program). In addition, these methods generally capture internal data quality rather than a dataset’s potential to be used for a specific purpose. Assessing data fitness for use represents a promising approach to evaluating data accuracy and quality for different applications and contexts. In this article, we employ a Spatial, Temporal, Aptness, and Application (STAAq) assessment approach to assess data fitness for use of citizen science datasets. We tested the STAAq assessment approach through a case study examining the distribution of caribou in Denali National Park and Preserve. Three different datasets were used in the test, Map of Life data (a global scale citizen science mobile application for recording species observations), Ride Observe and Record data (a program sponsored by the park staff where incentivized volunteers observe species in the park), and conventionally collected radio collar data. The STAAq assessment showed that the Map of Life and Ride Observe and Record program data are fit for monitoring caribou distribution in the park. This data fitness for use approach is a promising way to assess the external quality of a dataset and its fitness to address particular research or monitoring questions. This type of assessment may help citizen science skeptics see the value and potential of citizen science collected data and encourage the use of citizen science data by more scientists.
Introduction
Contributory citizen science programs focused on ecological monitoring are generally initiated by scientists, researchers, or resource managers. In these types of citizen science programs, volunteers typically assist scientists with data collection or analysis (see Shirk et al., 2012 for a typology framework of citizen science projects). Ecological monitoring focused citizen science programs can collectively produce finer grained and more expansive data sets over regional and global scales and collect data more frequently, covering long temporal extents (Theobald et al., 2015). With these data collection abilities, citizen scientists can significantly impact the ability to monitor ecological patterns (Dickinson et al., 2010; Magurran et al., 2010; Andelman, 2011; Jetz et al., 2012; Ballard et al., 2017; Kress et al., 2018). These more temporally and spatially expansive datasets can support longitudinal surveys and help identify climate change signals, particularly species distribution changes (Champion et al., 2018; Pecl et al., 2019). Nevertheless, scientists still harbor skepticism about using citizen science data in their work, generally due to doubts about data quality (Bonter and Cooper, 2012; Riesch and Potter, 2014; Burgess et al., 2017; Golumbic et al., 2017). They are concerned that individuals from the public lack the necessary skills to identify species or collect data in a rigorous manner (Burgess et al., 2017).
Despite concerns over citizen science data quality, the number of contributory citizen science programs focused on collecting data for ecological modeling is growing. This is due in part to advances in mobile technology. Smartphones as data collection devices have helped increase the number of volunteers contributing to a diverse range of citizen science initiatives at various spatial scales (Roy et al., 2012; Luna et al., 2018). Some app-based programs have a global focus and amass large observation datasets for any researcher to use for monitoring purposes; these apps. include iNaturalist, eBird, and Map of Life, among others. eBird, in particular, is a prominent data source for monitoring the effects of climate change on birds (Hurlbert and Liang, 2012; Cooper et al., 2014; Callaghan and Gawlik, 2015; Walker and Taylor, 2017). eBird, developed by the Cornell Lab of Ornithology, serves as a birding guide and citizen science data collection tool; over 1 billion bird sightings have been contributed as of 20211. The Map of Life (MOL) mobile application developed at Yale University is a citizen science offshoot of the online species distribution platform of the same name (Jetz et al., 2012). The app serves as a simple field guide for tens of thousands of species (flora and fauna) worldwide. It also allows users to record species observations and contribute important data for research and conservation, and it has over 50,000 downloads since its launch in 20162
The managers of these global scale app-based programs would like to see more third-party scientists (those who are not directly affiliated with the program) taking advantage of these data to address their own research and monitoring objectives. Scientists, however, have various concerns with using citizen science collected data in their work; Burgess et al. (2017) provides a comprehensive overview of these concerns over data quality, including accuracy and reliability. A common concern found by Burgess et al. (2017) is data accuracy, specifically concerns about how a program accounts for the volunteers’ data collection skills and the adequacy of volunteer training- or lack thereof. Furthermore, much of the data collected through app-based citizen science programs are considered opportunistic data- “observations of species collected without standardized field protocol and explicit sampling design” (Van Strien et al., 2013). While logistically opportunistic data is more manageable for volunteers to collect than strategic sampling, opportunistic citizen science data may not be reliable for monitoring distribution trends over time. This is because opportunistic citizen science data may suffer from changes in observation bias, reporting bias, and geographical bias. However, Van Strien et al. (2013) compared opportunistic citizen science data to strategic samples monitoring data and found similar distribution trends.
Numerous peer-reviewed articles have looked at the quality of citizen science data. Some have adapted or developed frameworks and methods for validating data, assessing data quality, and accounting for bias (Cohn, 2008; Wiggins et al., 2011; Toogood, 2013). Wiggins et al. (2011) provides a review of data validation methods. The authors surveyed 52 citizen science projects about how they validate data. Many of them reported using a combination of methods, including expert review and additional documentation of observations. Expert review means project team members or other subject matter experts validating data before it is accepted into the database. Further documentation of observations could include asking citizen scientists to provide photos, filling out article datasets, submitting observations digitally, or filling out additional dataset fields about how the observation was made.
Other methods found in the literature include increasing the number of participants contributing data (such as Linus’ Law) and data quality assessments based on data quality indicators (Haklay, 2010; Comber et al., 2013; Senaratne et al., 2016). Linus’ Law originated in open-source software development and refers to the process of measuring the quality of the citizen science data, in particular citizen science data that includes spatial information (also called volunteered geographic information (Goodchild, 2009). Linus’ Law considers the number of peers who have reviewed or edited its content (Elwood et al., 2012). In the case of citizen science data, Linus’ Law refers to the notion that with a large number of data contributors, the biases or inaccuracies made by a few of those contributors will be quieted.
A thorough assessment of citizen science data, based on quality indicators, is also used to improve and examine data quality. Senaratne et al. (2016) identified 17 quality measures and indicators for spatial citizen science data (also called Volunteer Geographic Information or VGI). These indicators include standard measures of quality, position accuracy, topological consistency, thematic accuracy, completeness, and temporal accuracy. They found that these standard data quality measures alone are not enough to assess VGI quality. Thus, additional indicators like reputation, trust, credibility, vagueness, experience, and local knowledge are also used in the VGI literature (Senaratne et al., 2016).
Many of these methods are meant to be done for internal quality checks. Internal quality, generally reported in the metadata (data about the data), is the intrinsic characteristics of the data as determined by the producer of the data (Gervais et al., 2009). External data quality looks at how data fit the user’s needs (Juran et al., 1974; Devillers and Bédard, 2007; Gervais et al., 2009). More externally focused data assessments that third-party scientists can use may make more of them amiable to using citizen science data in their work.
An analysis of data fitness for use offers a way to address these ongoing concerns of data quality by providing a way for scientists and researchers to do a data quality assessment for their specific research needs after they obtain data (Dickinson et al., 2010; Parker et al., 2012; Crall et al., 2015). A data fitness for use assessment does not provide a blanket assessment of data quality; however, it assesses whether these data could be used for a specific application within a given area (Juran et al., 1974; Chrisman, 1991; Veregin, 1999; Devillers and Bédard, 2007). Providing scientists with the ability to test the fitness of the data for their specific research needs offers the potential to standardize the use of citizen science data in knowledge production.
Additionally, using data fitness as a metric for data quality is a way to reduce the uncertainty of using a specific dataset. These data are not only judged on what it can be fit for but also the limitations and uncertainty (Veregin, 1999). While the citizen science data quality literature does not explicitly showcase a data fitness for use approach, some articles discussing data quality suggest that assessing citizen science data for specific use cases will increase the utility of the data (Dickinson et al., 2010).
Senaratne et al. (2016) concluded that a systematic framework needed to be developed that provides methods and measures to evaluate the fitness volunteer collected data. Furthermore, Haklay (2013) also indicates that something like a data fitness approach for citizen science data would ensure collected data can answer the scientific questions being posed. Kosmala et al. (2016) also determines that each citizen-science dataset should be judged individually, based on the project design and application, and not assumed to be substandard simply because volunteers generated it. The authors also note that data fitness allows scientists to assess if a possible bias in a particular dataset is an issue for their specific research question.
There are various models of a data fitness assessment. Some depend on metadata to assess data fitness, and others run datasets through a series of fitness indicator checks. Pôças et al. (2014) created an assessment called EQDaM, external quality of spatial data from metadata. The metadata for each dataset was used to compare different quality indicators, where the users choose these indicators. The indicators include: spatial, temporal, topology, lineage, precision, accessibility, and legitimacy. A metadata-focused assessment may not be appropriate for citizen science data. The lack of incompleteness of metadata is a known issue in citizen science. While programs are improving their efforts with the help of resources like the Citizen Science Associations Data and Metadata Working Groups PPSR Core Standards3, many citizen datasets do not have reliable metadata for a fitness assessment (Grira et al., 2010).
Another way to assess data fitness is through different indicator checks. Wentz and Shimizu (2018) compared data sets through a framework based on quality indicators with the DaFFU assessment. The DaFFU assessment compares fitness based on the accuracy, agreement, and aptness of the datasets. Instead of relying on metadata like Pôças et al. (2014) and Wentz and Shimizu (2018) identified specific data characteristics that were compared through spatial analysis created a fitness assessment based on the mathematical framework of multiple criteria decision making. The DaFFU method selects “the best data set from multiple options using a select set of user criteria.” The DaFFU assessment is robust and can easily be modified for other applications. The assessment is applicable to any modeling with a statistical performance output. This type of assessment allows users to compare datasets (collected conventionally or by volunteers) to determine which datasets (or combination of datasets) may be best for the specific research or objective. This ability to compare volunteer collected data to conventionally collected data is suggested as a more comprehensive way to assess citizen science data (Kremen et al., 2011; Holt et al., 2013; Cooper et al., 2014; Theobald et al., 2015).
The comparison of datasets allows scientists to see how citizen science data may be integrated (or mashed-up) with other data they use. Hybrid/mash-up datasets are another method to assess and improve citizen science data quality. Hybrid datasets involve integrating the citizen science data with conventionally collected data (Elwood et al., 2012; Parker et al., 2012; Upton et al., 2015). Combined datasets (e.g., data mash-ups, hybrid datasets, or cross-validation) allow researchers to test out the accuracy or combine the datasets to fill in gaps (Batty et al., 2010; Connors et al., 2012; Parker et al., 2012; Abdulkarim et al., 2014; Bruce et al., 2014; Upton et al., 2015).
Wentz and Shimizu (2018) suggest that an adaption of their assessment would be appropriate for citizen science/VGI data. The use of user criteria instead of metadata makes this type of data fitness assessment more amiable to citizen science collected data. This article presents an application of the DaFFU assessment presented in Wentz and Shimizu (2018) called, The Spatial, Temporal, Aptness, and Application (STAAq) assessment. This assessment was developed to address data fitness of ecological monitoring citizen science data specifically but can be used for other data types. The STAAq assessment adapts the DaFFU assessment by adding a temporal component and additional elements of assessing spatial resolution. Understanding the temporal and spatial resolution of species observation data set is important for examining bias in the data and its fitness to monitor species that may have seasonal distribution changes or varying spatial ranges. The spatial resolution may also affect the performance of different ecological models (Guisan et al., 2007).
To test the STAAq assessment, we used it for a case study with various datasets collected in Denali National Park and Preserve. We used the assessment to compare the fitness of data from a global app-based citizen science program (Map of Life) with two other species occurrence datasets managed by the park service. We wanted to determine if these datasets are fit to monitor caribou (Rangifer tarandus) distribution in the park. After running each dataset through the STAAq assessment components, we ranked the results to compare the datasets and how well each performed in assessing spatial scale, temporal scale, aptness, and application. The results of this assessment quantify how fit each dataset is for monitoring caribou distribution in the park. More broadly, this assessment shows how quantifying the fitness of citizen science data can make volunteer collected data more usable and trustworthy for researchers monitoring ecosystems for climate change signs.
Methods
The Spatial, Temporal, Aptness, and Application Assessment
The STAAq assessment modifies and adds additional assessment components to Wentz and Shimizu’s (2018) DaFFU assessment, including spatial and temporal scale; these additions make the idea of data fitness more applicable to citizen science data. Like similar assessments, the STAAq assessment ranks each dataset according to its performance in the Spatial, Temporal, Aptness, and Application components. These rankings are averaged to create an overall ranking of the datasets (q). Table 1 shows each of the four components in the STAAq assessment. The number of elements (j) that is assessed by the particular component. The datasets (q) are evaluated through STAAq, and then these rankings can be weighted individually then are averaged to give the overall ranking for each dataset in each component. Weighting the ranking from each component allows the assessment to account for components that may be more important than others for specific research questions. In Table 1, weights are represented by the symbol (w).
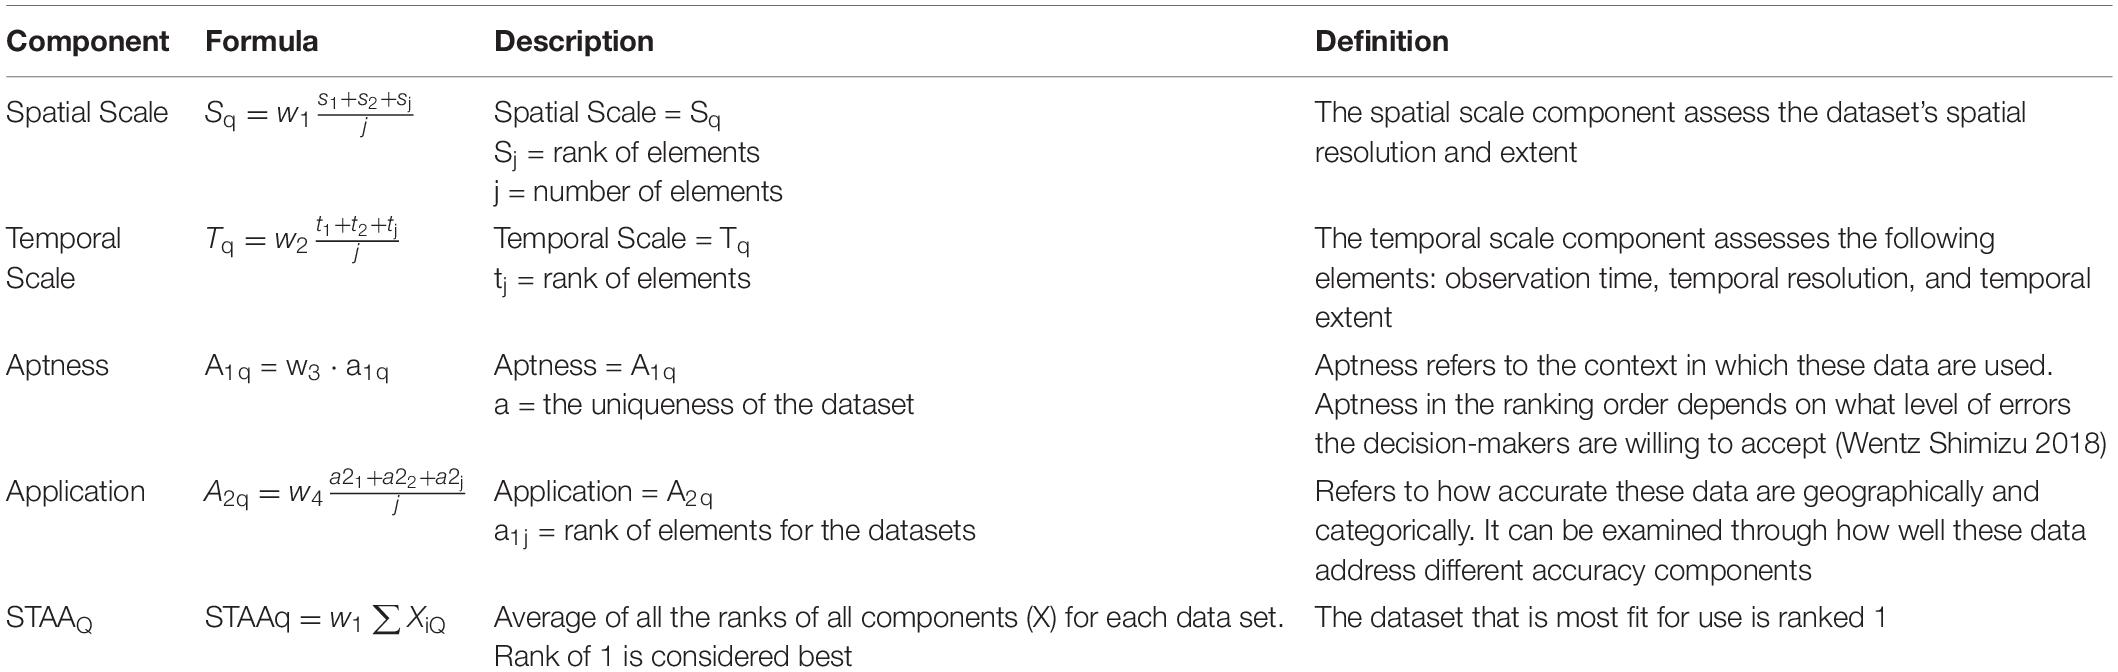
Table 1. STAAq assessment.
The Spatial component (S) (Figure 1) assesses two elements: spatial resolution and spatial extent. These elements are evaluated to determine each dataset’s rank. The datasets are assessed on how well they perform at different standards of the spatial scale elements. Depending on the geographic scale and scope of a research question, different resolutions may be desired in a dataset. For example, if a research question is focused on a small area, data with a finer spatial resolution may be desired. Spatial resolution refers to the minimum cell size of the raster data or a measurement of error in the case of point data (Goodchild, 2011). Spatial resolution is assessed through examining these data per a specific cell size or measurement of error. Spatial extent refers to the spatial scope of these data or the area size represented in these data (Goodchild, 2011). The spatial extent can be determined by calculating the convex hull around the set of data points.
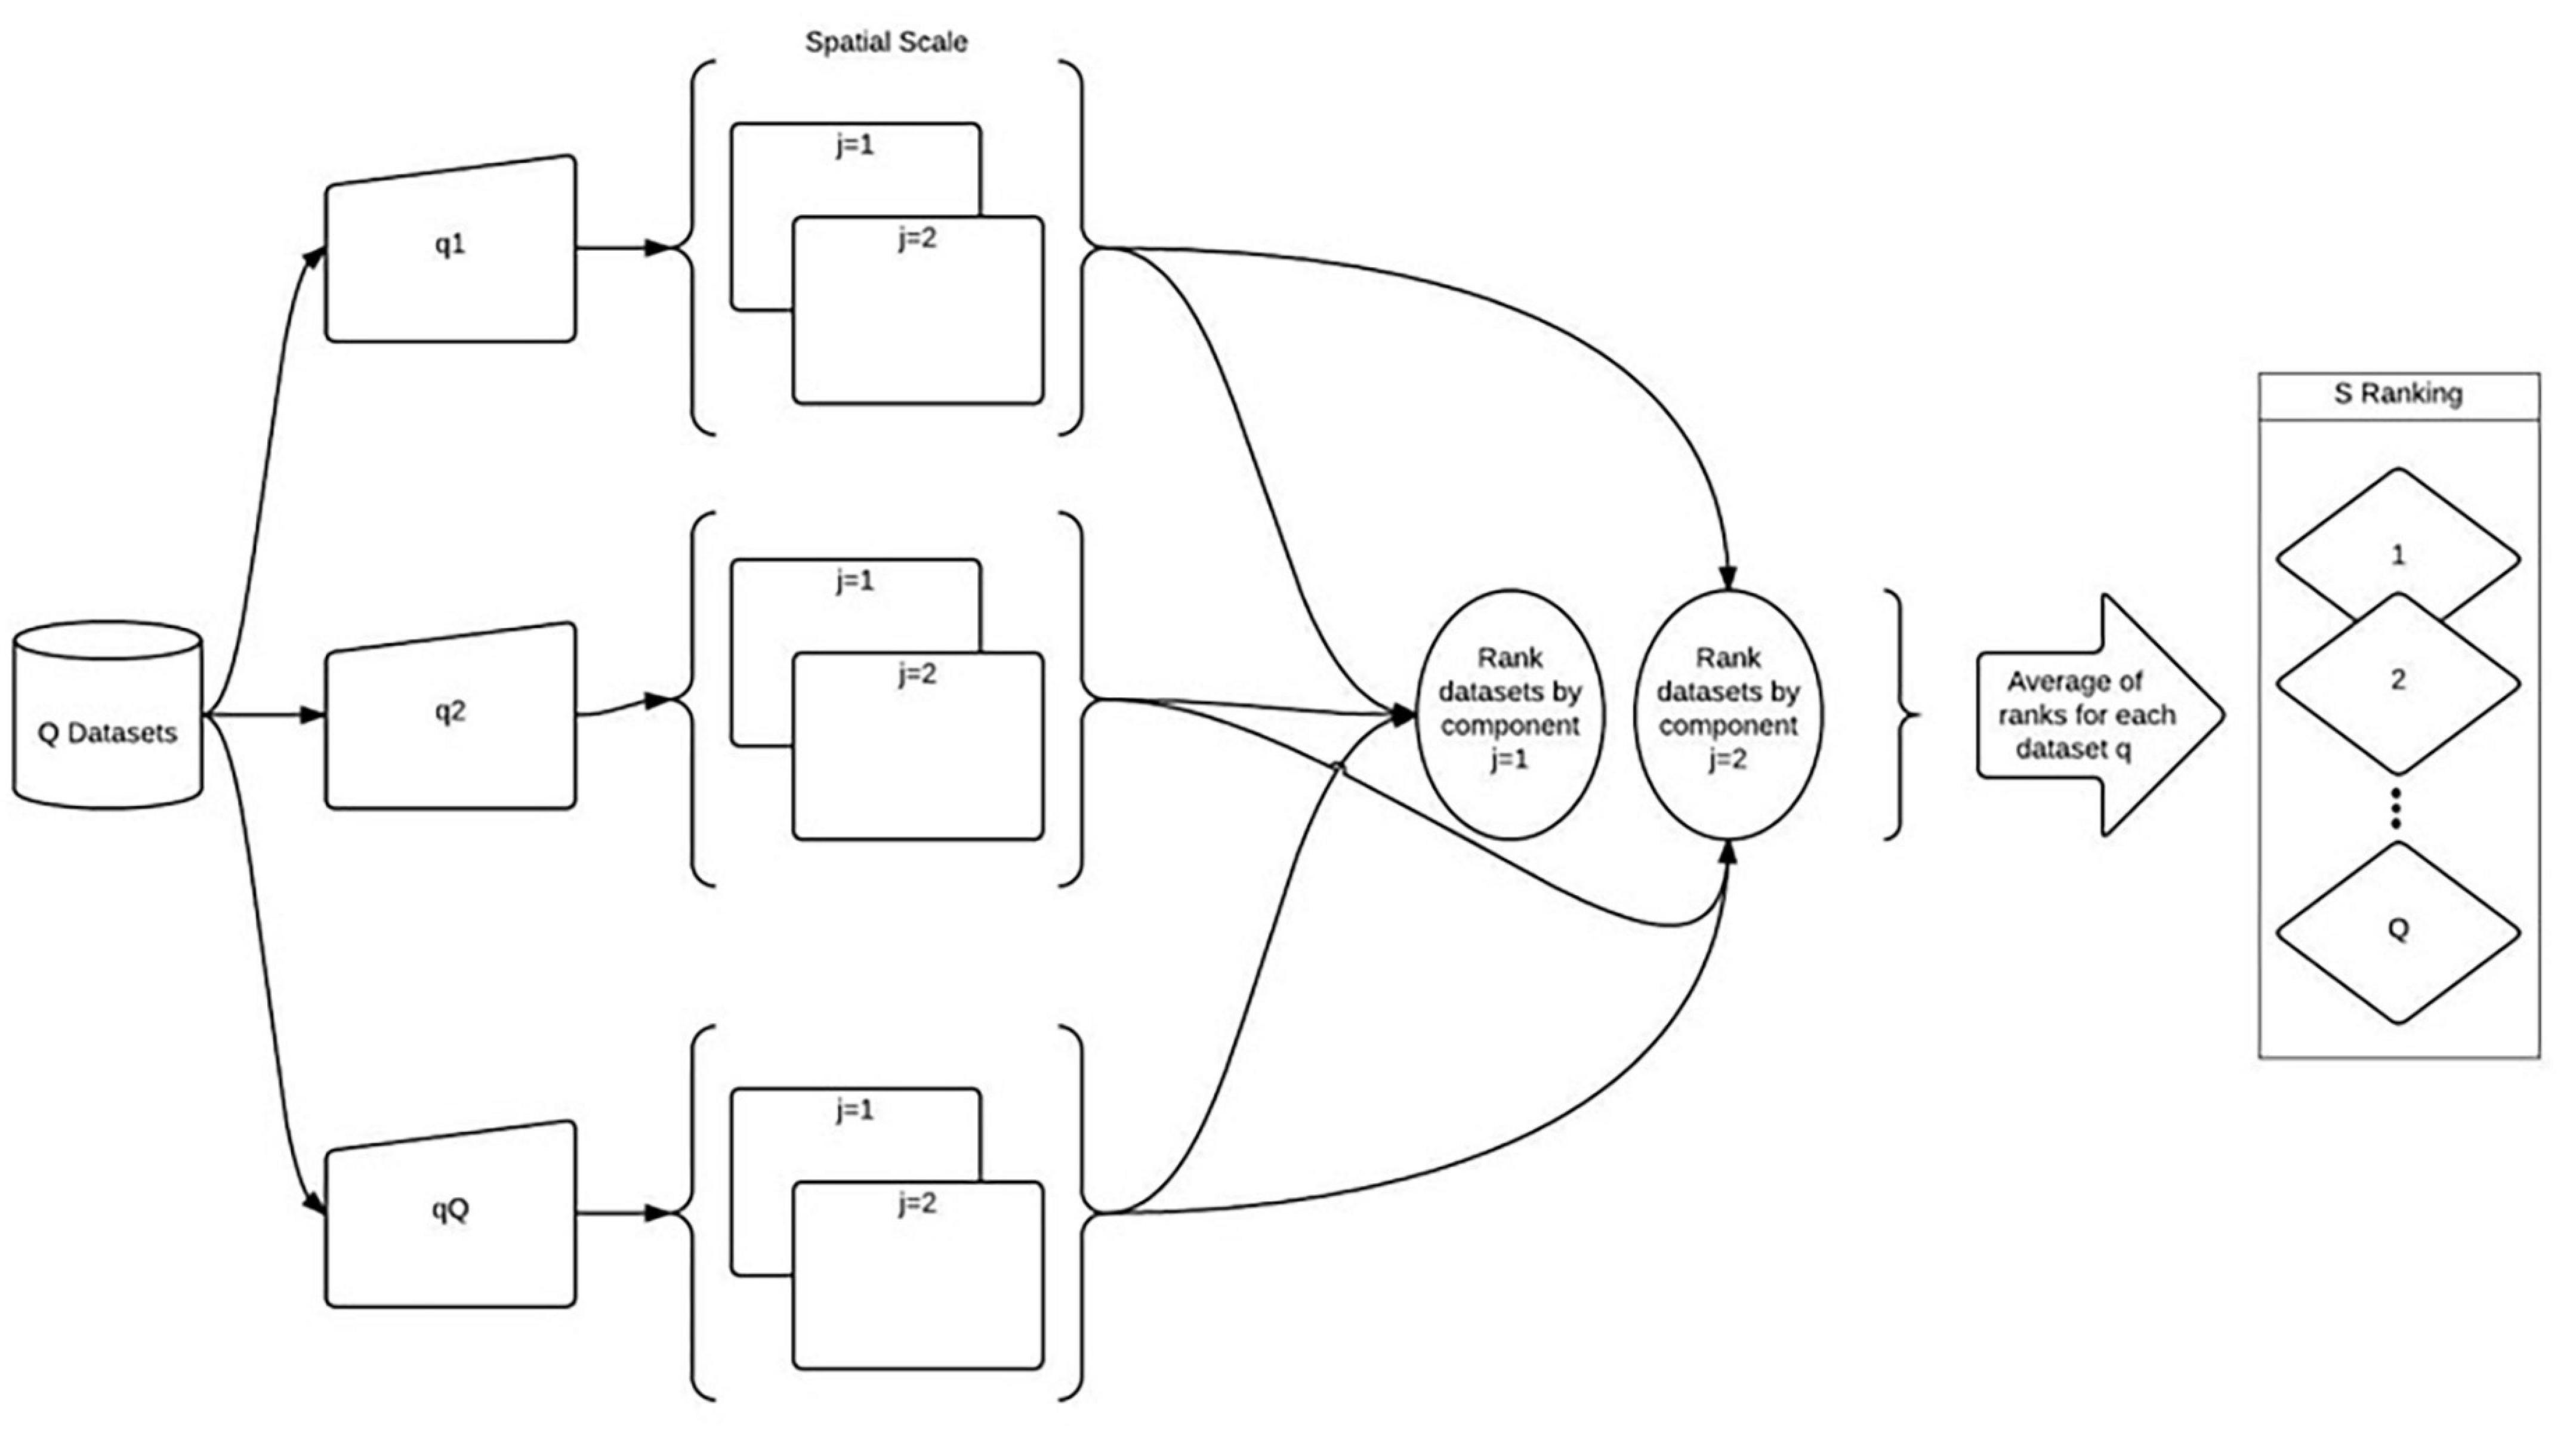
Figure 1. Spatial Scale (S) component, adapted from Shimizu (2014).
The Temporal component (T) (Figure 2) is determined by assessing the performance of each dataset with three different elements (j) of temporal scale, event, temporal resolution, and temporal extent. Temporal aspects of data are important for species observation data in particular. Temporal aspects of the data can show the season it was collected, the time of day, and how long the datasets have been collected. Event refers to the time at which the event was observed (Guptill and Morrison, 2013). Temporal resolution, also referred to as temporal consistency, is the frequency at which the dataset is collected (Guptill and Morrison, 2013). Temporal extent, or temporal transaction, relates to the data collection’s length or how much time the dataset covers (Guptill and Morrison, 2013). The datasets are ranked based on how they perform with each of the elements. For example, if a dataset spanning multiple years is desired, the dataset with a more extensive temporal extent is higher.
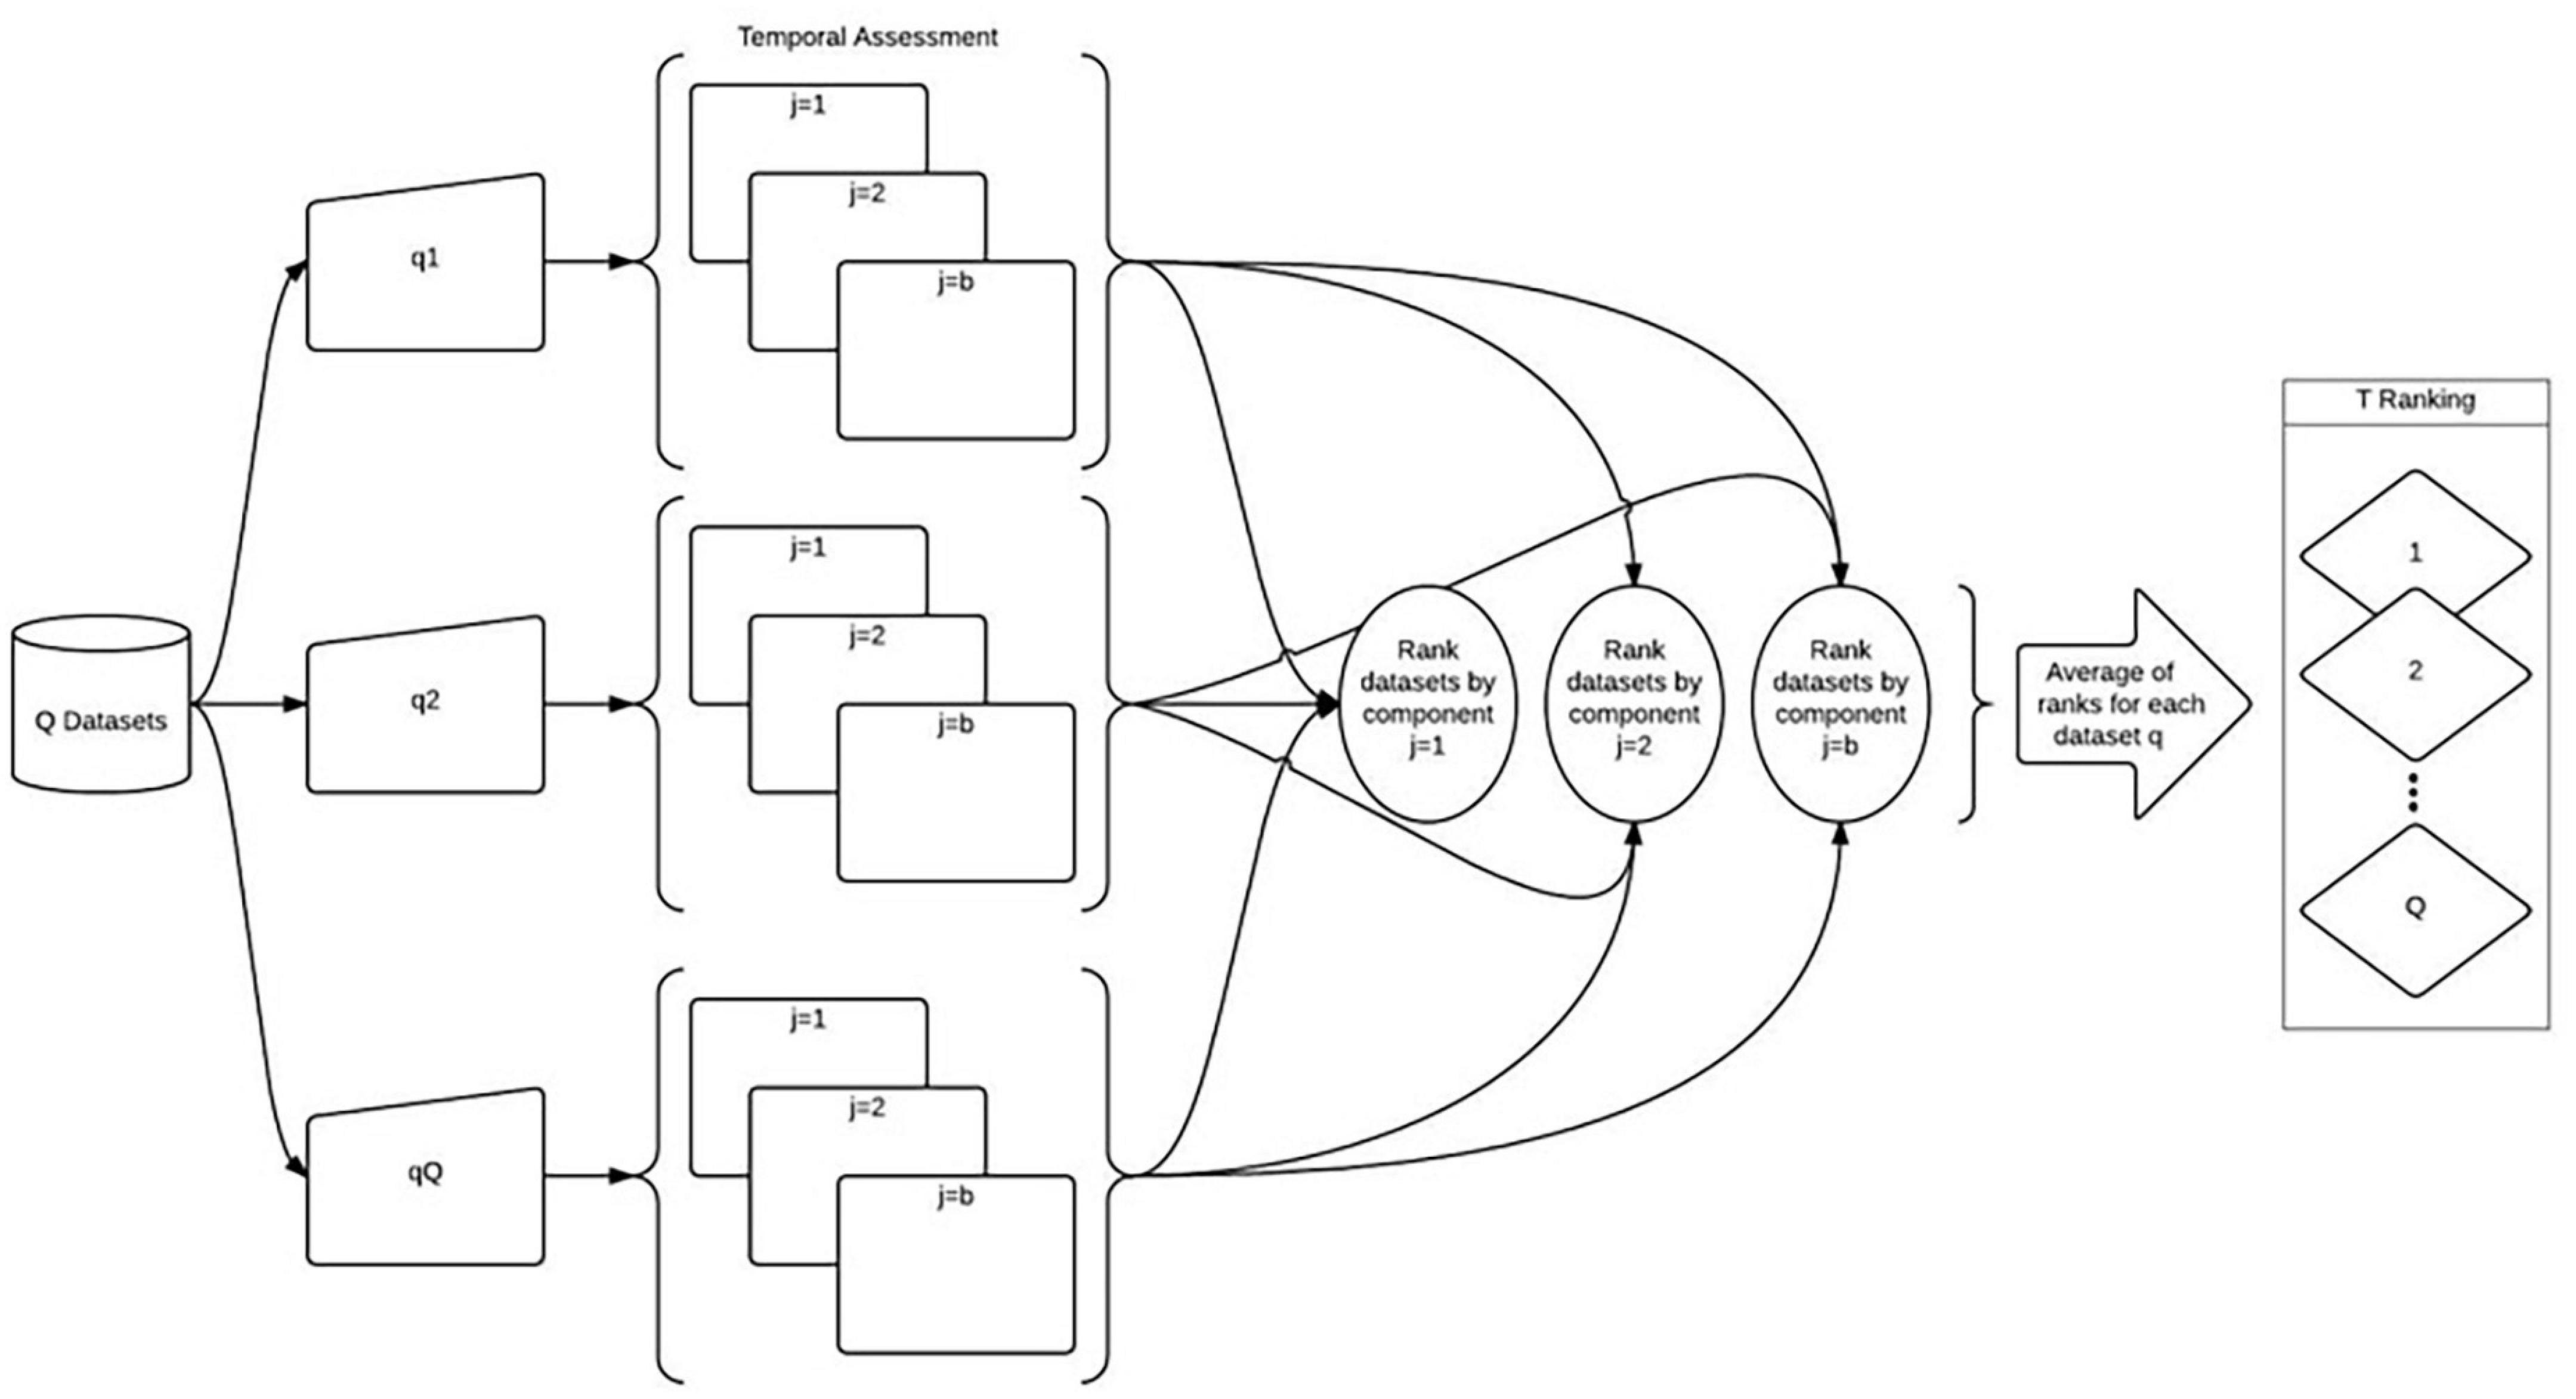
Figure 2. Temporal Scale (T) component, adapted from Shimizu (2014).
Aptness (A1) determines the uniqueness (U) of the datasets (Figure 3). To determine aptness, these data must be in raster format. Aptness is calculated cell by cell to determine how unique each dataset is. In some cases, uniqueness is a desired quality in the datasets, while it is not in other cases. For example, the Aptness component can identify outliers in a dataset not found in other datasets. Outliers may be desired, a researcher may want to know if there is something other datasets are missing, or outliers may not be desired because these outliers may be errors. Figure 3 Aptness (A1) Component modified from Shimizu (2014) shows the process of determining aptness. R1, R2, and RQ represent sample raster data for each of the datasets (Q). Each cell in the raster is given a value. The raster layers are then added together to create R. The original raster layers for each dataset are multiplied by R to create R1R, R2R, and RQR. Then cell by cell agreement, c, is determined between the datasets.
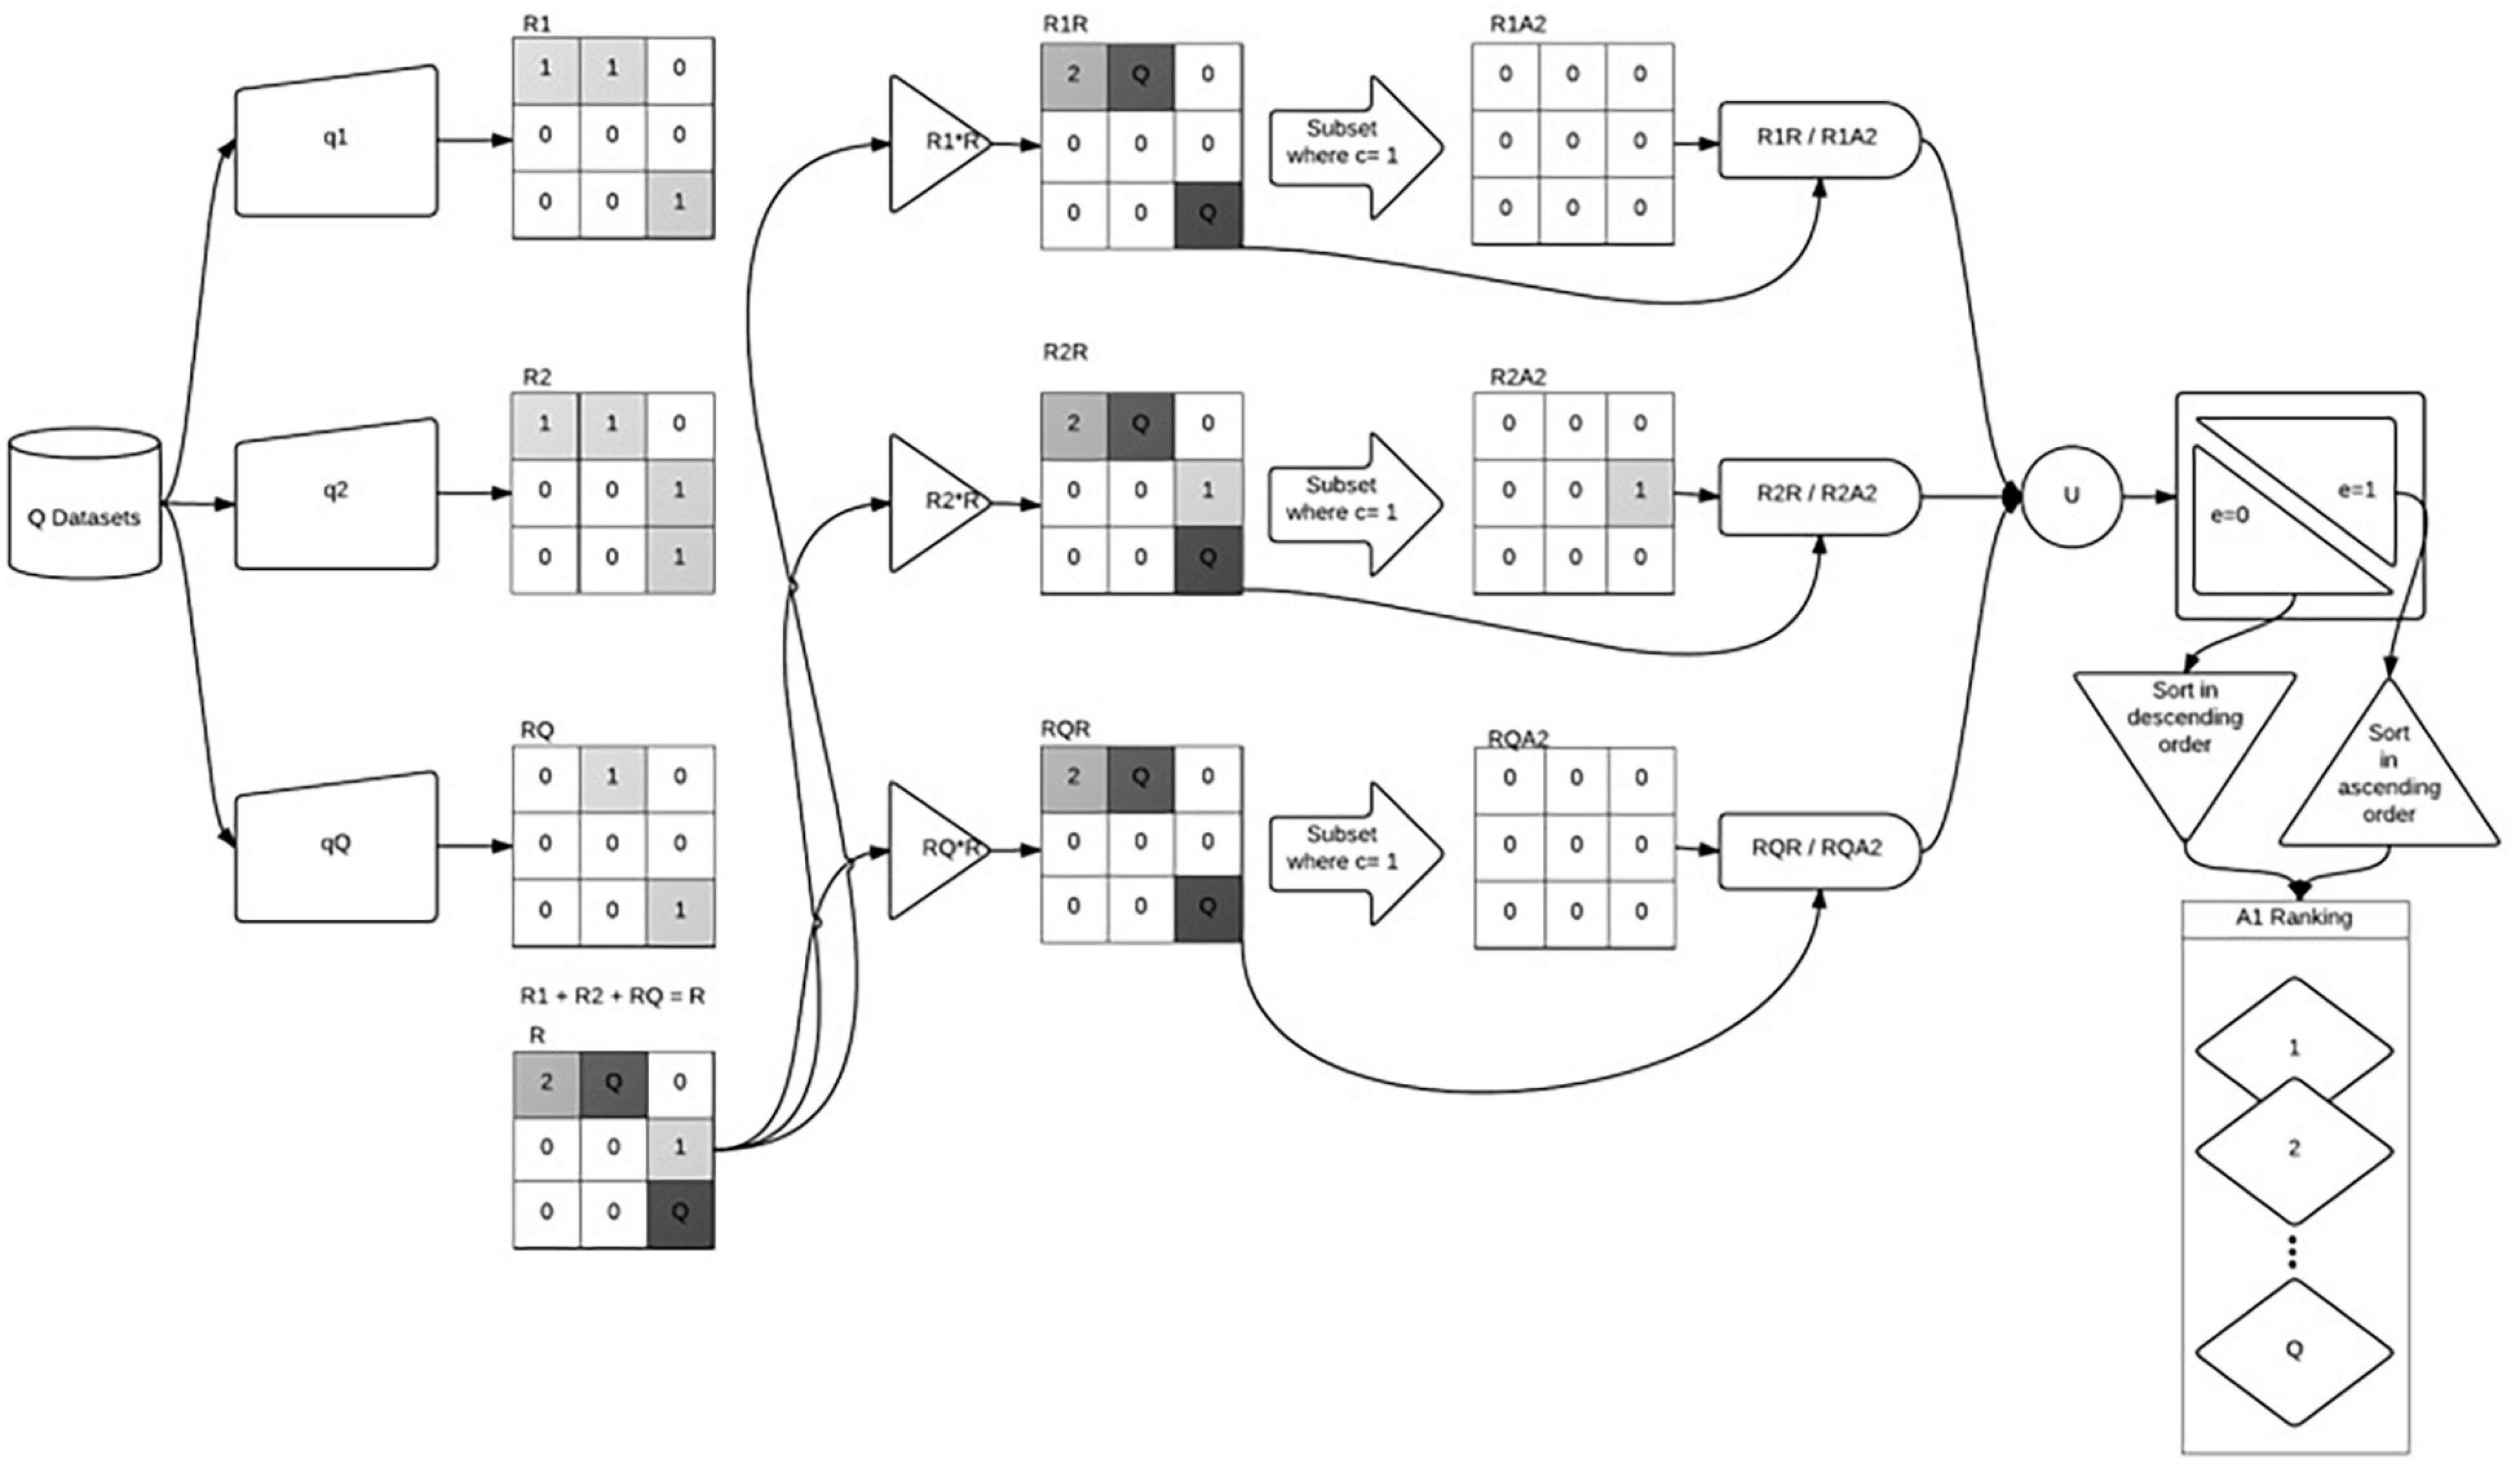
Figure 3. Aptness (A1) component, adapted from Shimizu (2014).
c = 0 none of the datasets have an attribute assigned to that cell.
c = 1 one dataset assigned an attribute to that cell.
c = 2 two datasets assigned an attribute to that cell.
c = Q all datasets assigned an attribute to that cell.
In the case of aptness, c = 1 shows which dataset is unique. The process of “cell by cell” agreement results in a new raster layer (RQA1); the layer RQR is divided by this new layer to calculate the percent of uniqueness (U) of the dataset. Then it must be determined if omission or commission is preferred. Is the uniqueness of a dataset a desired quality or not?
e = 1 when error of commission is preferred.
e = 0 when error of omission is preferred.
Finally, the datasets are ranked in either ascending or descending order, depending on the value of e.
The Application (A2) component is concerned with the product of a model (Figure 4). The elements of the Application component vary with the models being assessed. For example, Wentz and Shimizu (2018) use the Application component (called Accuracy component in Wentz and Shimizu, 2018) to determine how accurately a model calculates the total nitrogen removal and nitrogen load a watershed. The model that is used in this component is specific to the research question. In Figure 4 Application (A2) component applied from Shimizu (2014), the datasets are represented by q1, q2, and qQ.
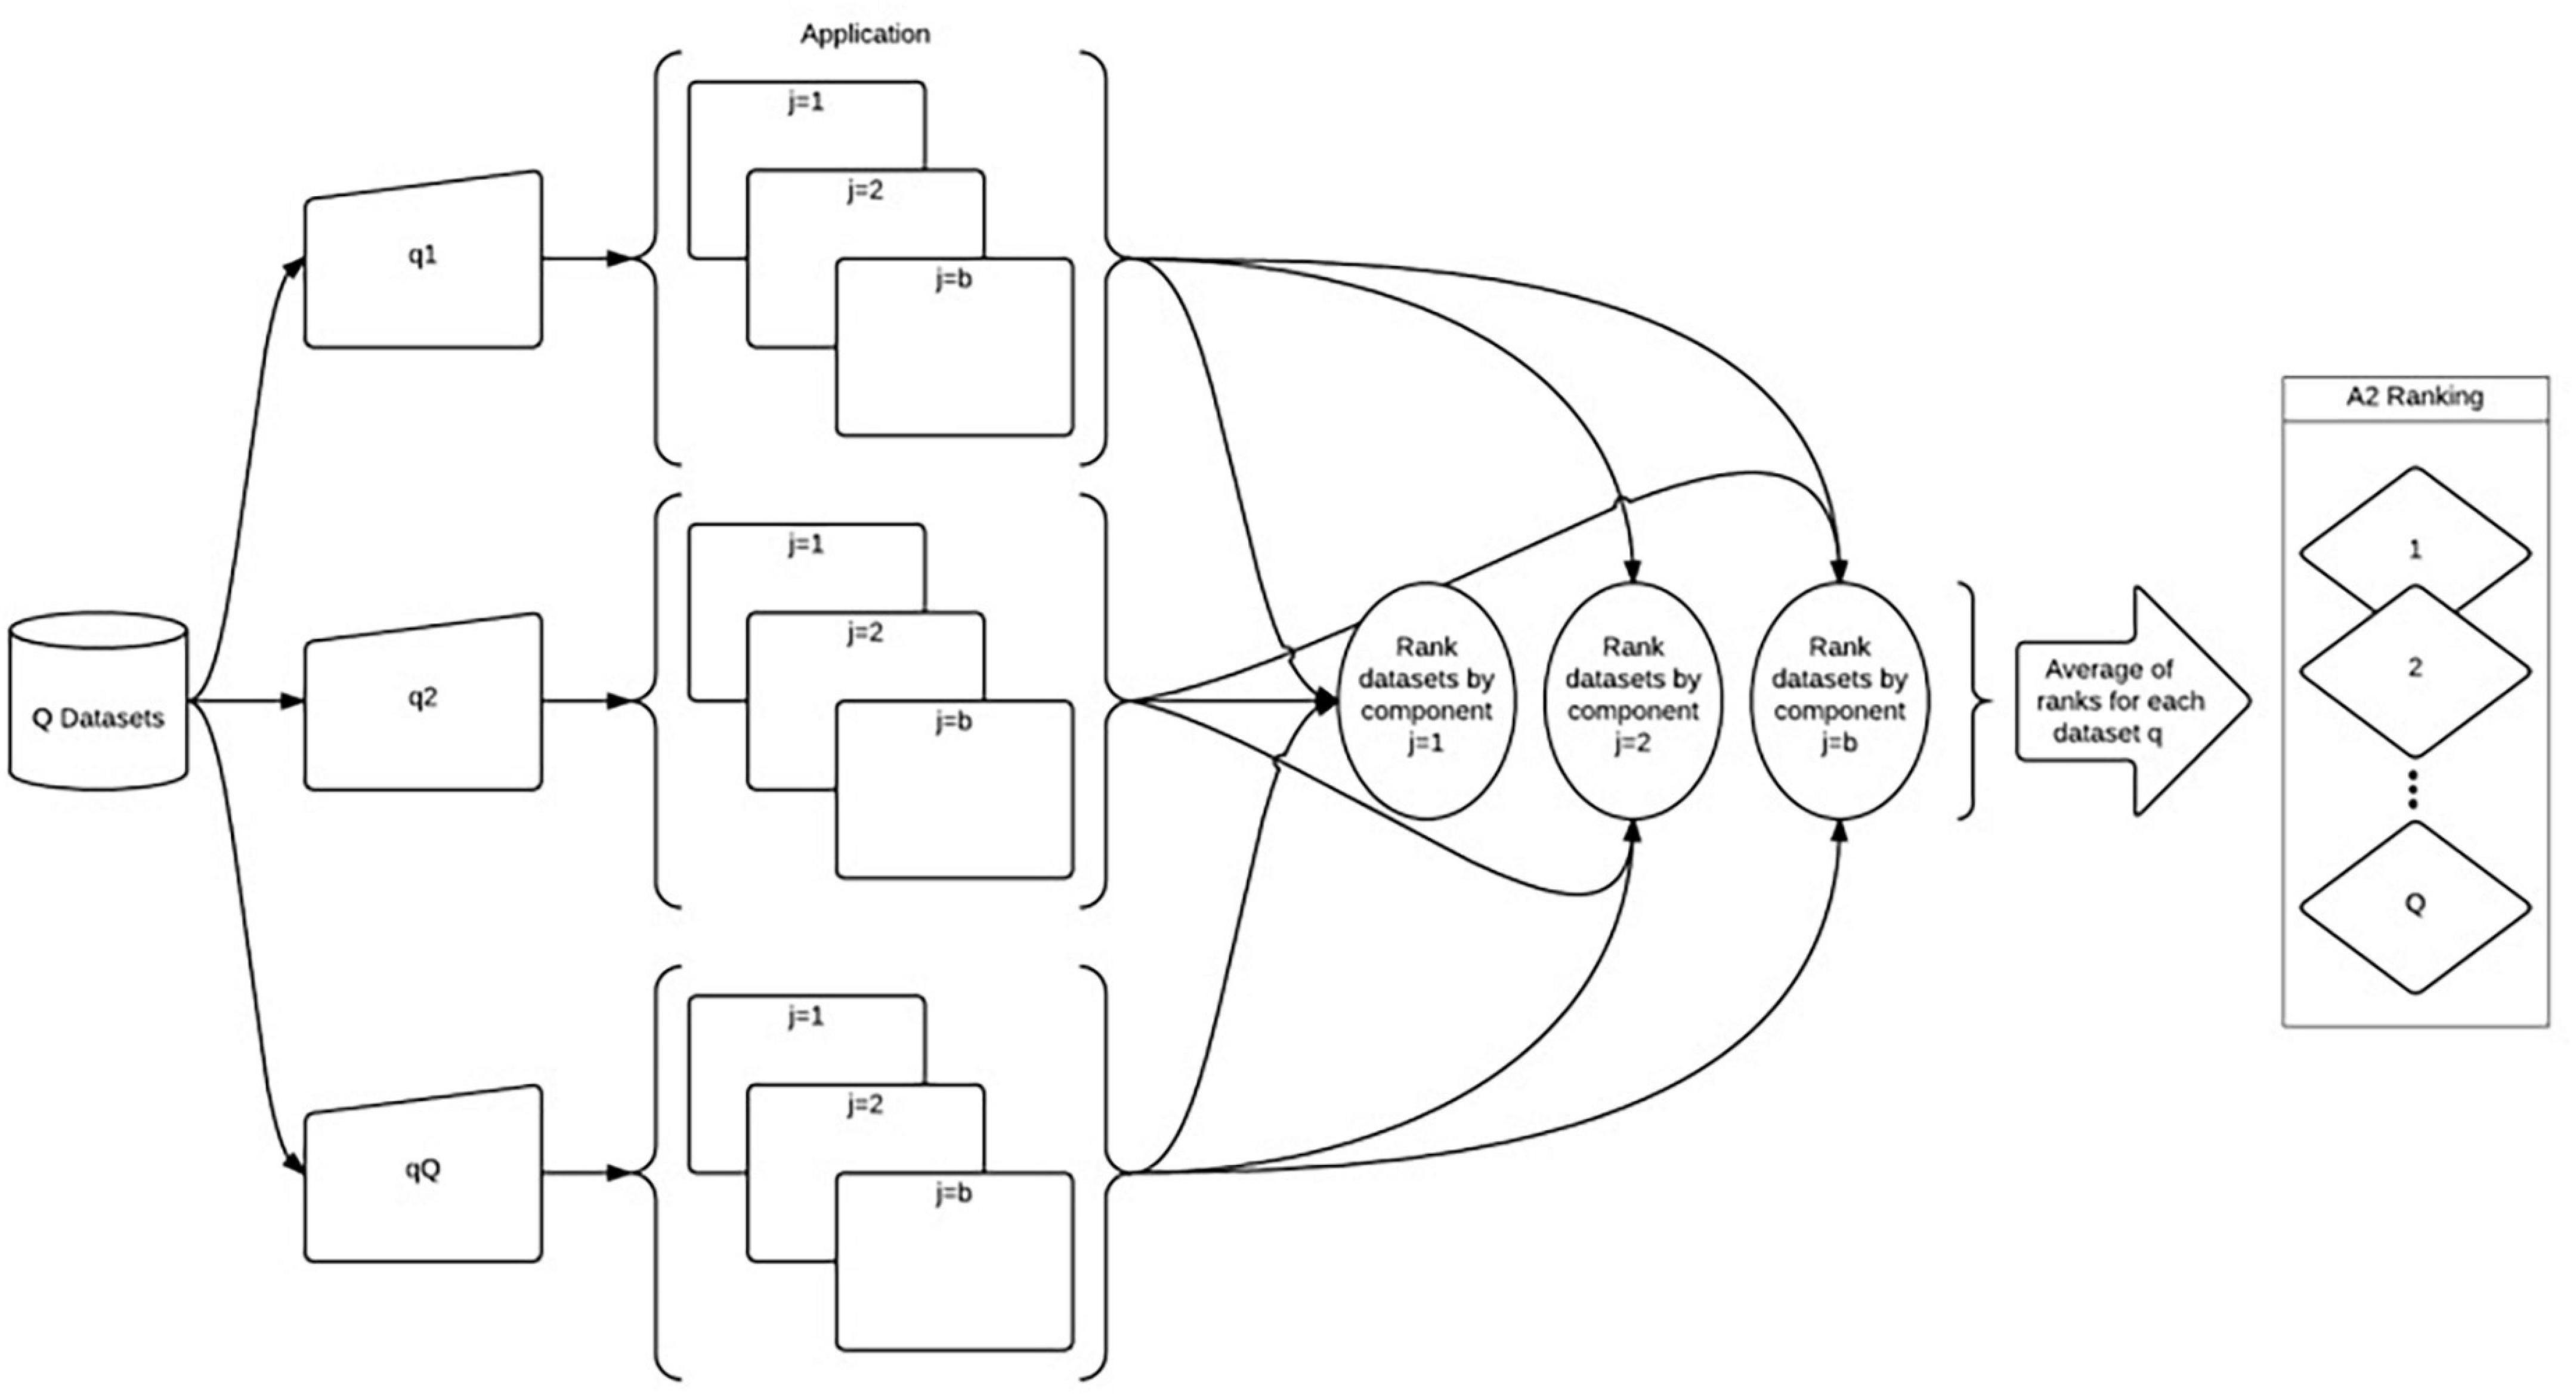
Figure 4. Application (A2) component, adapted from Shimizu (2014).
The datasets’ overall ranking was determined by averaging each component (Roszkowska, 2013). The resulting fractional ranks were then ranked to provide a final ranking of the datasets. We then examine the average ranking to compare datasets in terms of fitness for use. Weights can be applied to each component before averaging the ranks if desired. The elements and components of the assessment can be modified or weighted to fit the user’s needs; assessment results can be included within the metadata for each dataset and provide an example of what these data fit for. A vital aspect of this assessment is that it can be used when a conventionally collected dataset is unavailable or only one dataset exists. Additionally, the assessment can be used to partially perform a data fitness assessment.
This fitness for use assessment is relevant for volunteer collected data and can be used with many other types of data and models. Other typologies of citizen science programs can use the data fitness for use framework. In this article, we focused on adapting a method to work with the data collected by a contributory style citizen science program focused on ecological monitoring. Elements of the assessment can be adapted to fit other citizen science programs, such as a more collaborative program, incorporating traditional knowledge with scientific data. Additionally, this fitness for use assessment was developed with citizen science data in mind and used citizen science data. However, we recognize that this assessment can be applied to conventionally collected data.
Denali National Park and Preserve as a Case Study
We tested the STAAq assessment with a case study in Denali National Park and Preserve (Figure 5). We chose Denali as a case study because the park is interested in using citizen science collected data to support their ecological monitoring efforts, mainly monitoring the status and trends of selected environmental and resource “vital signs” such as vegetation composition, temperatures, species occurrence data, and visitor use (Sadoti et al., 2018; Brodie et al., 2019). In Denali specifically, vegetation changes due to rising temperatures affect caribou habitat in the park, especially in popular visitor areas (Joly, 2011). Thus, Denali is keen to monitor the changes in habitat in the park area and how they may affect the visitor experience. For this test of the assessment, we chose to focus on caribou monitoring and caribou occurrence data because of the abundance of data in the three datasets we compared for the test. We also chose it because the park actively impacts and monitors the needs of the Denali caribou herd. We wanted to showcase the potential of the STAAq assessment on data that scientists are using for wildlife monitoring. The results of this test of the assessment were not intended to be directly used by the park staff for caribou monitoring but rather be an example of how the STAAq assessment works and how it may perform with observation data collected through a citizen science mobile-application program.
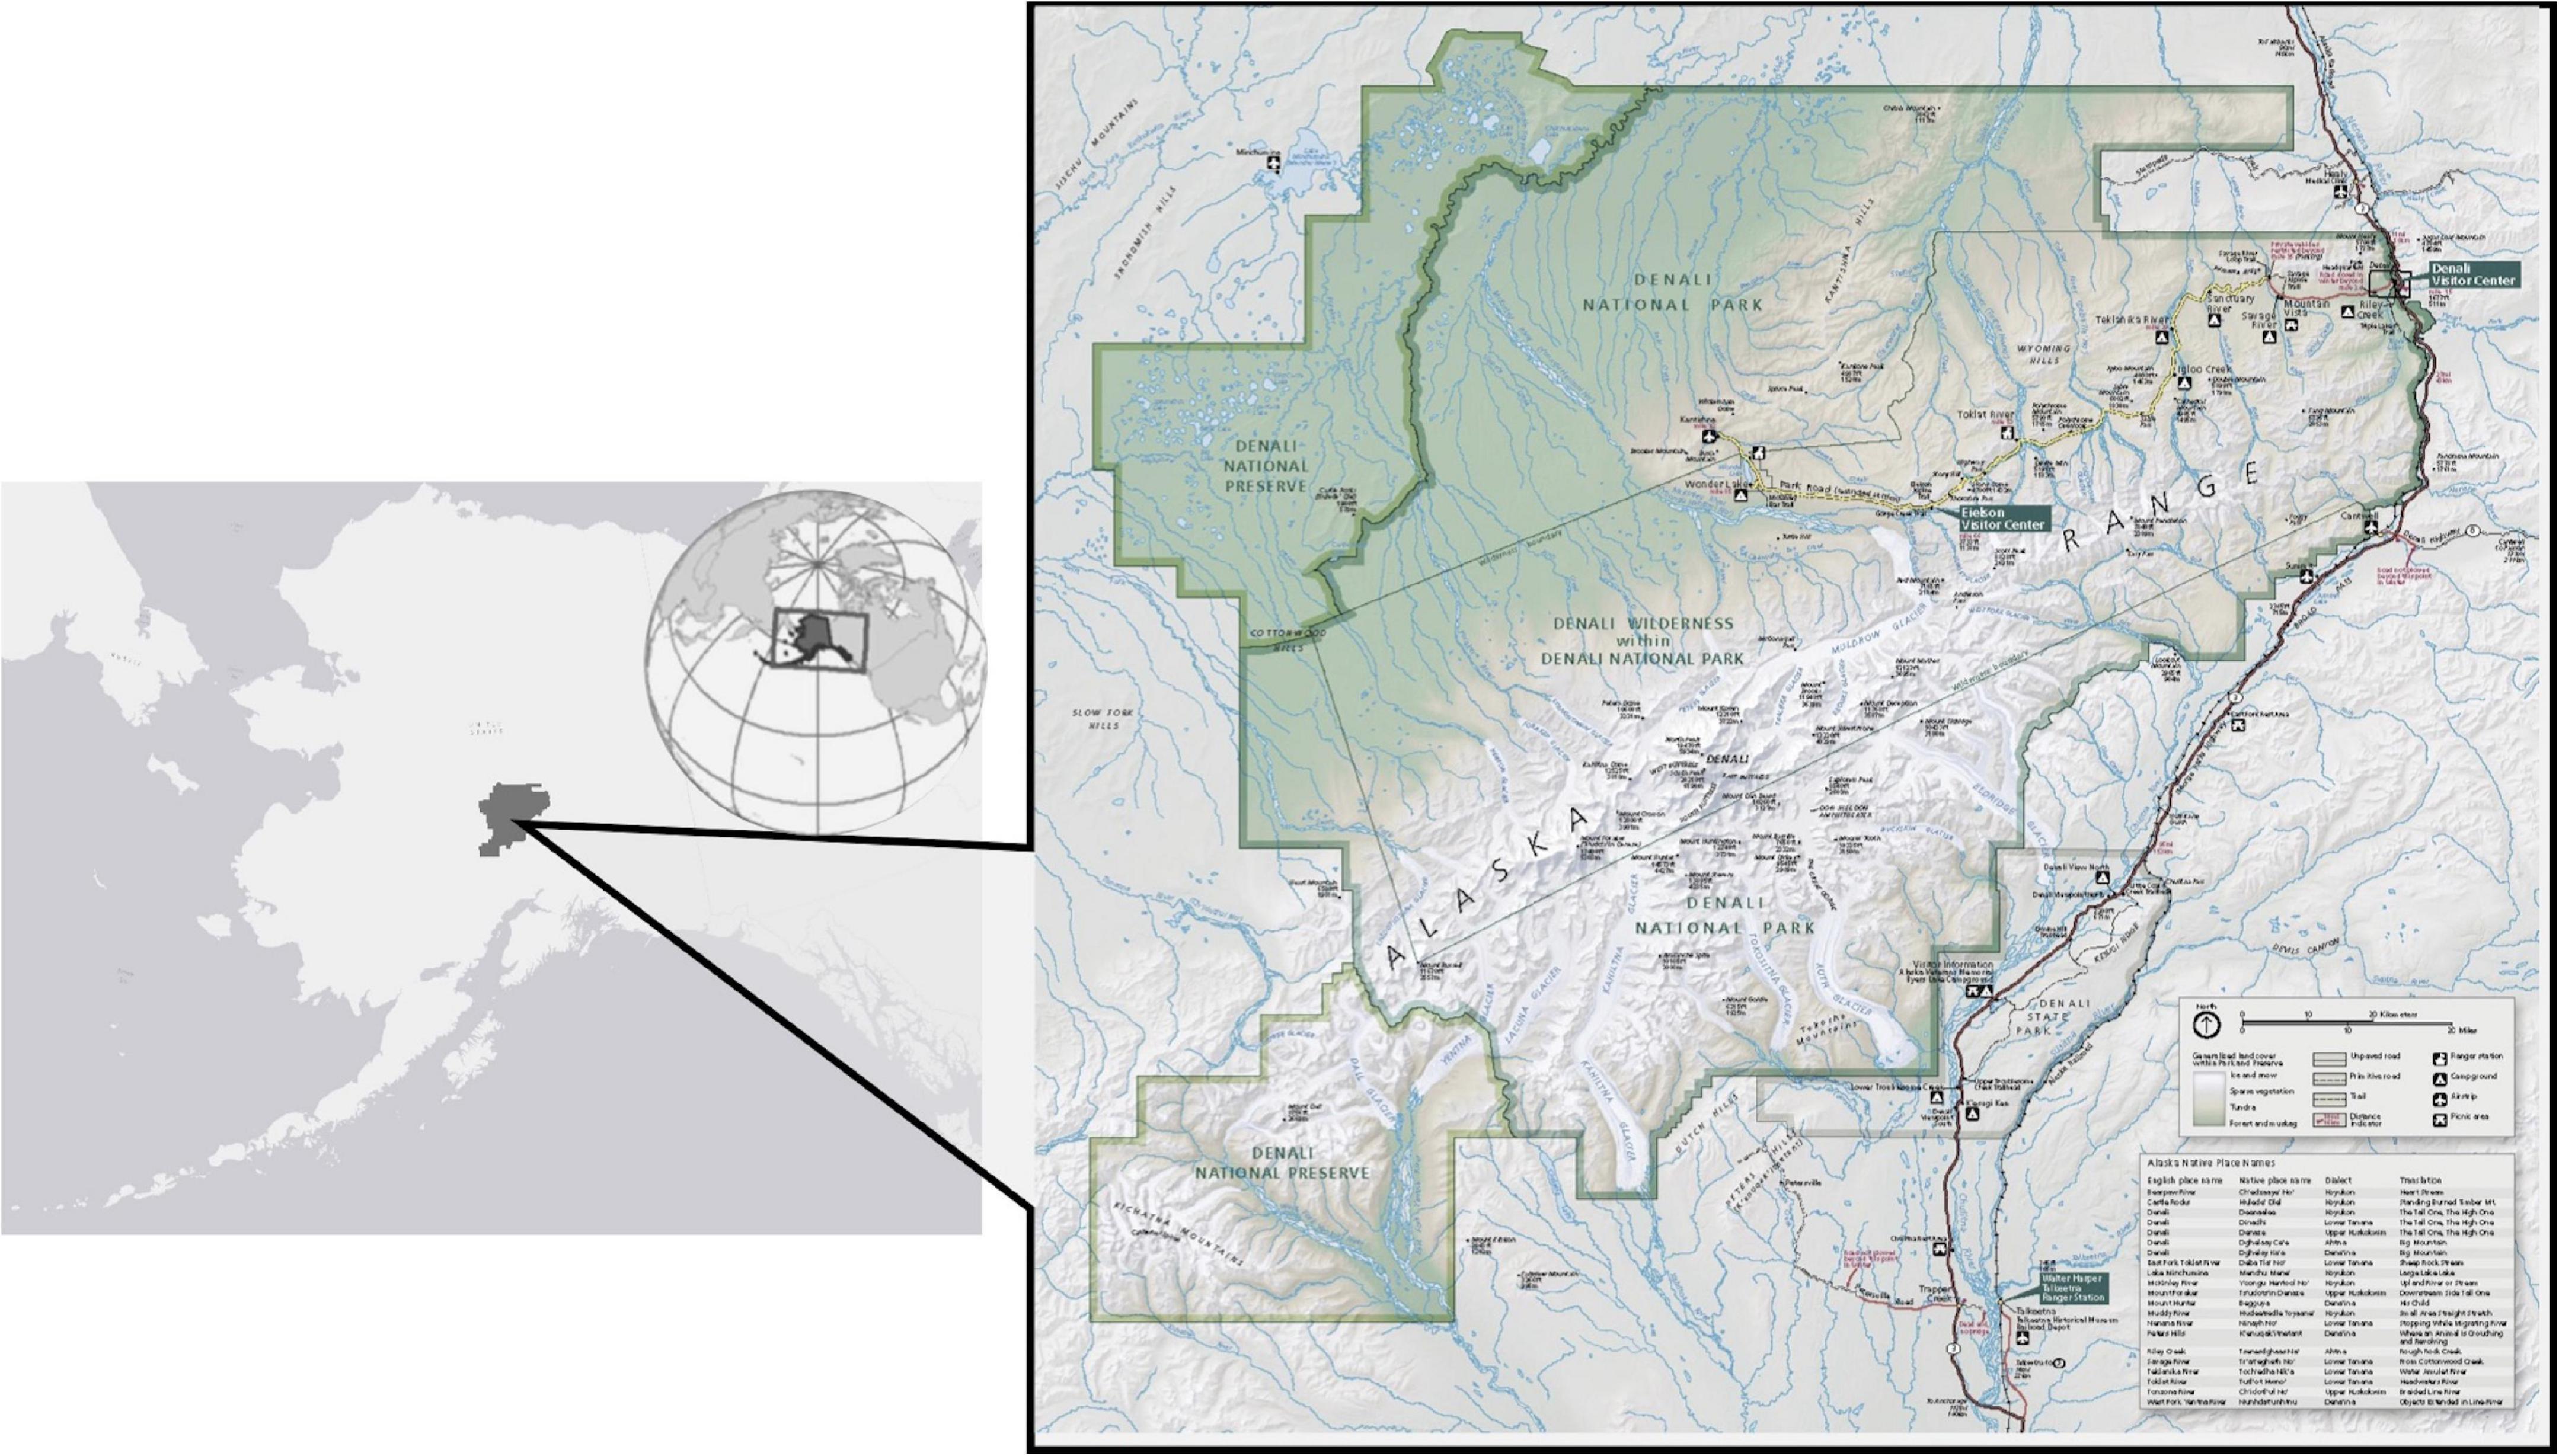
Figure 5. Denali National Park and Preserve (Park Map obtained from https://www.nps.gov/carto/).
The three datasets include volunteer collected data from the Map of Life mobile application (MOL), volunteer collected data from the Ride Observe and Record Program (ROAR), and radio-collar data from the National Park Service. The Map of Life mobile phone-based application developed at Yale University- allows volunteers to record the precise location of their wildlife observations while touring the park with their phone’s internal GPS to capture spatial data (Figure 6). The data used in this case study was collected in 2016; we retrieved from the Map of Life server on September 30, 2016. These data include the wildlife observation’s geographic coordinates, taxonomic information for the species, a time stamp, and a unique observer ID. In 2016 MOL volunteers recorded 1,200 wildlife and plant observations in Denali; 343 observations were caribou observations. The MOL volunteers are untrained and mainly tourists visiting Denali for the first time. The mobile application and data collection protocol are managed by the team at Yale University. The team did include specific information pages for areas where a user can download a species list. Thus, users in the Denali area were prompted to download a local species list and see a Denali-specific information page with some park-specific information, such as animal safety warnings. The species list includes species photos and detailed species information such as range maps.
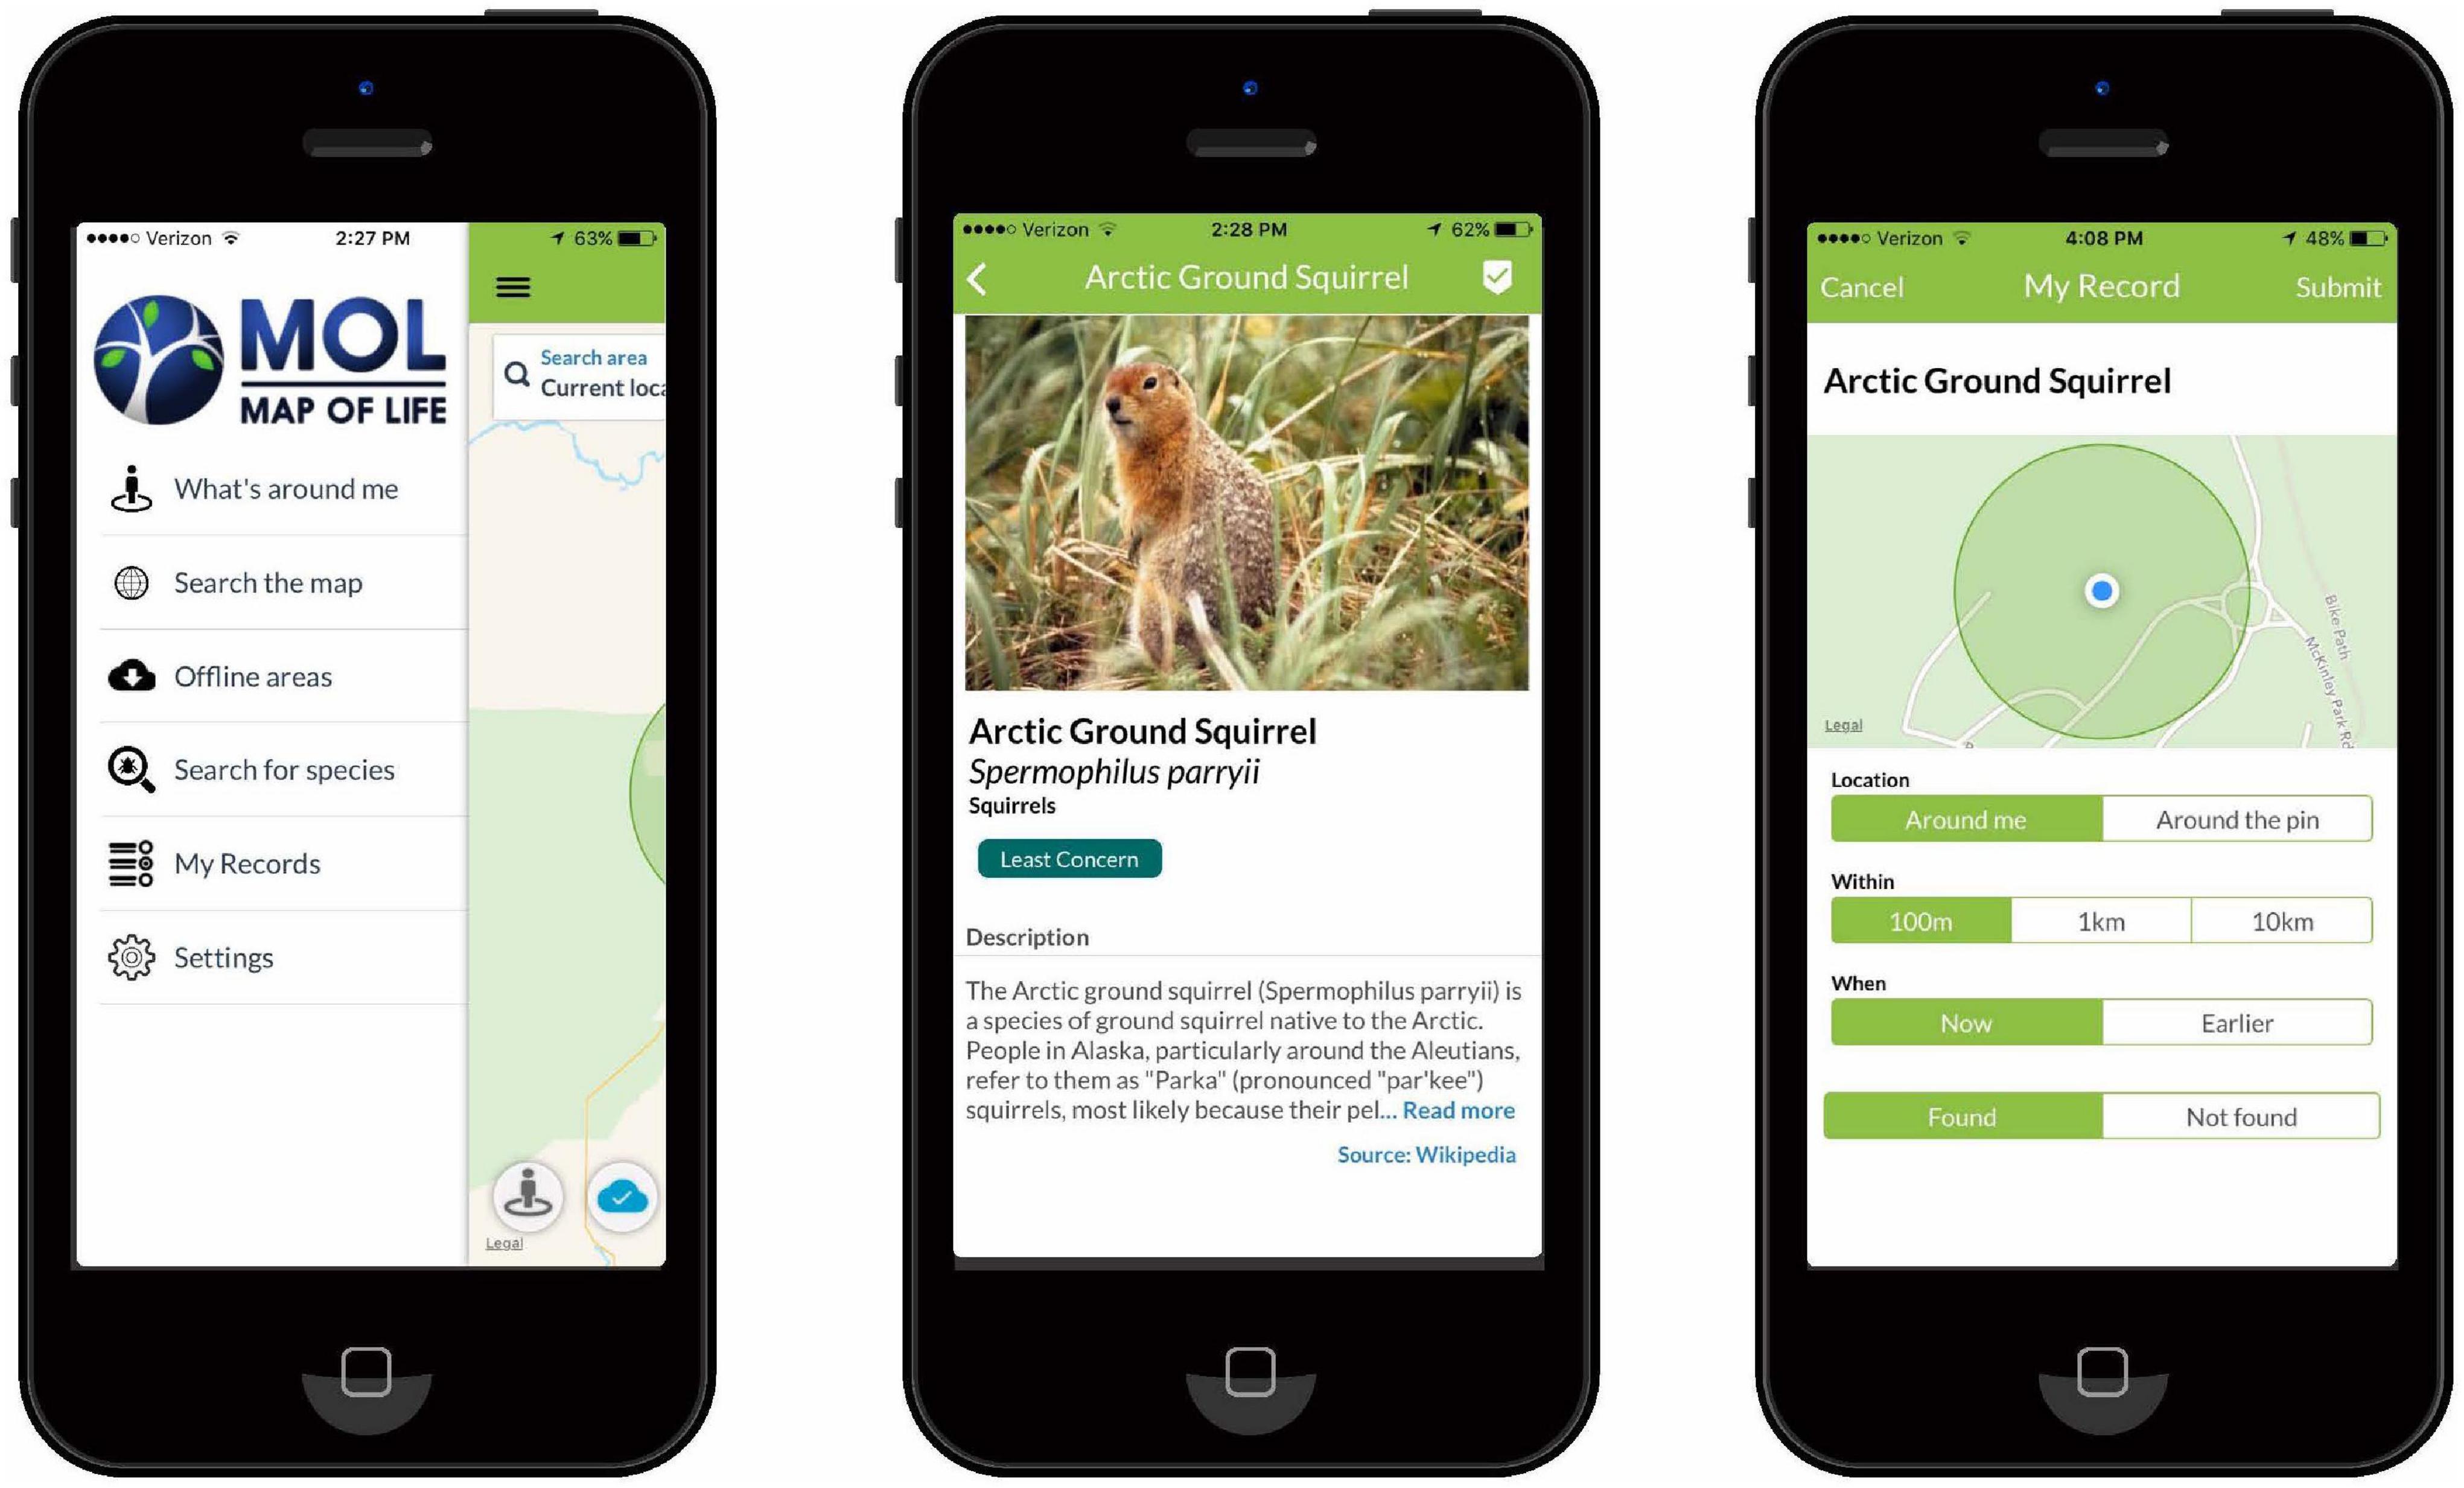
Figure 6. Map of life mobile application: home page, species information page, and record observation page.
Trained and incentivized local volunteers collect ROAR program data (some are park employees or students at the local high school and other community members). Volunteers ride the shuttle buses in the park and record species observation data using a GPS-enabled device to record: species location, time of observation, and species behavior. This program is managed and facilitated by park officials. These data used in this case study were also recorded during the summer of 2016. The radio collar caribou data were recorded through NPS wildlife population surveys and were recorded at various time spans over the last 25 years. Both male and female caribou are collared; they are captured and collared when they are calves (Adams, 2017). These data include location and time.
Park officials currently use ROAR data and radio-collar data for wildlife monitoring. They showed interest in seeing how citizen science collected species observation data through an established mobile application (such as MOL) could support Denali’s habitat monitoring efforts, especially in the high visitor use areas. Using an existing global-based app. means the park can benefit from the data collected and promote the use of the app. but does not need to manage another citizen science program. There were concerns over data quality and bias in the data. Thus, we felt this was a good test of the STAAq assessment to show how a researcher who does not control the data collection protocol can perform a data quality assessment to determine if these data are fit for their purposes.
Results
To test STAAq, we assessed each of the three datasets’ performance with each of the STAAq assessment components. The Spatial component of the STAAq assessment allows the examination of the spatial extent and resolution of the data. The desired spatial resolution is high-resolution caribou data for the Denali case study, reflecting the point data’s measurement error. Such data were collected with various techniques: GPS collar and mobile phone GPS systems. The resulting points have some error associated with them; the error amount is considered the spatial resolution. The dataset with the highest spatial resolution thus had the least amount of location error. For the spatial extent element of the Spatial component, the desired spatial extent is the park’s boundary. The percentage of the dataset area that falls within the park boundary was calculated to determine which datasets more closely matched the desired extent. In the STAAq assessment, each dataset is ranked in each element. The overall ranking for the Spatial component was determined by averaging the datasets’ rankings in each element.
For the spatial extent, the dataset, which most closely matches the desired extent- the park boundary in this case study- is given a rank of 1. Figure 7 and Table 2 show the results from the spatial extent analysis. The NPS caribou dataset covers 76.7% of the park area and thus received a rank of 1 (Table 2). The MOL data received a rank of 2, and the ROAR data was third because these data extent covered the least amount of the park. The extent that covers the park area the most is preferred because the data would be used to monitor the caribou distribution in the entire national park. The NPS dataset received a rank of 1 for the spatial resolution element because these data were collected at high resolution, with fewer errors. The NPS radio collar dataset’s resolution is mainly due to the data collection methods of radio collars directly on the caribou. In contrast, the other two datasets were collected through GPS locations on tablets or smartphones, recording the volunteer’s location observing the caribou, not the actual caribou.
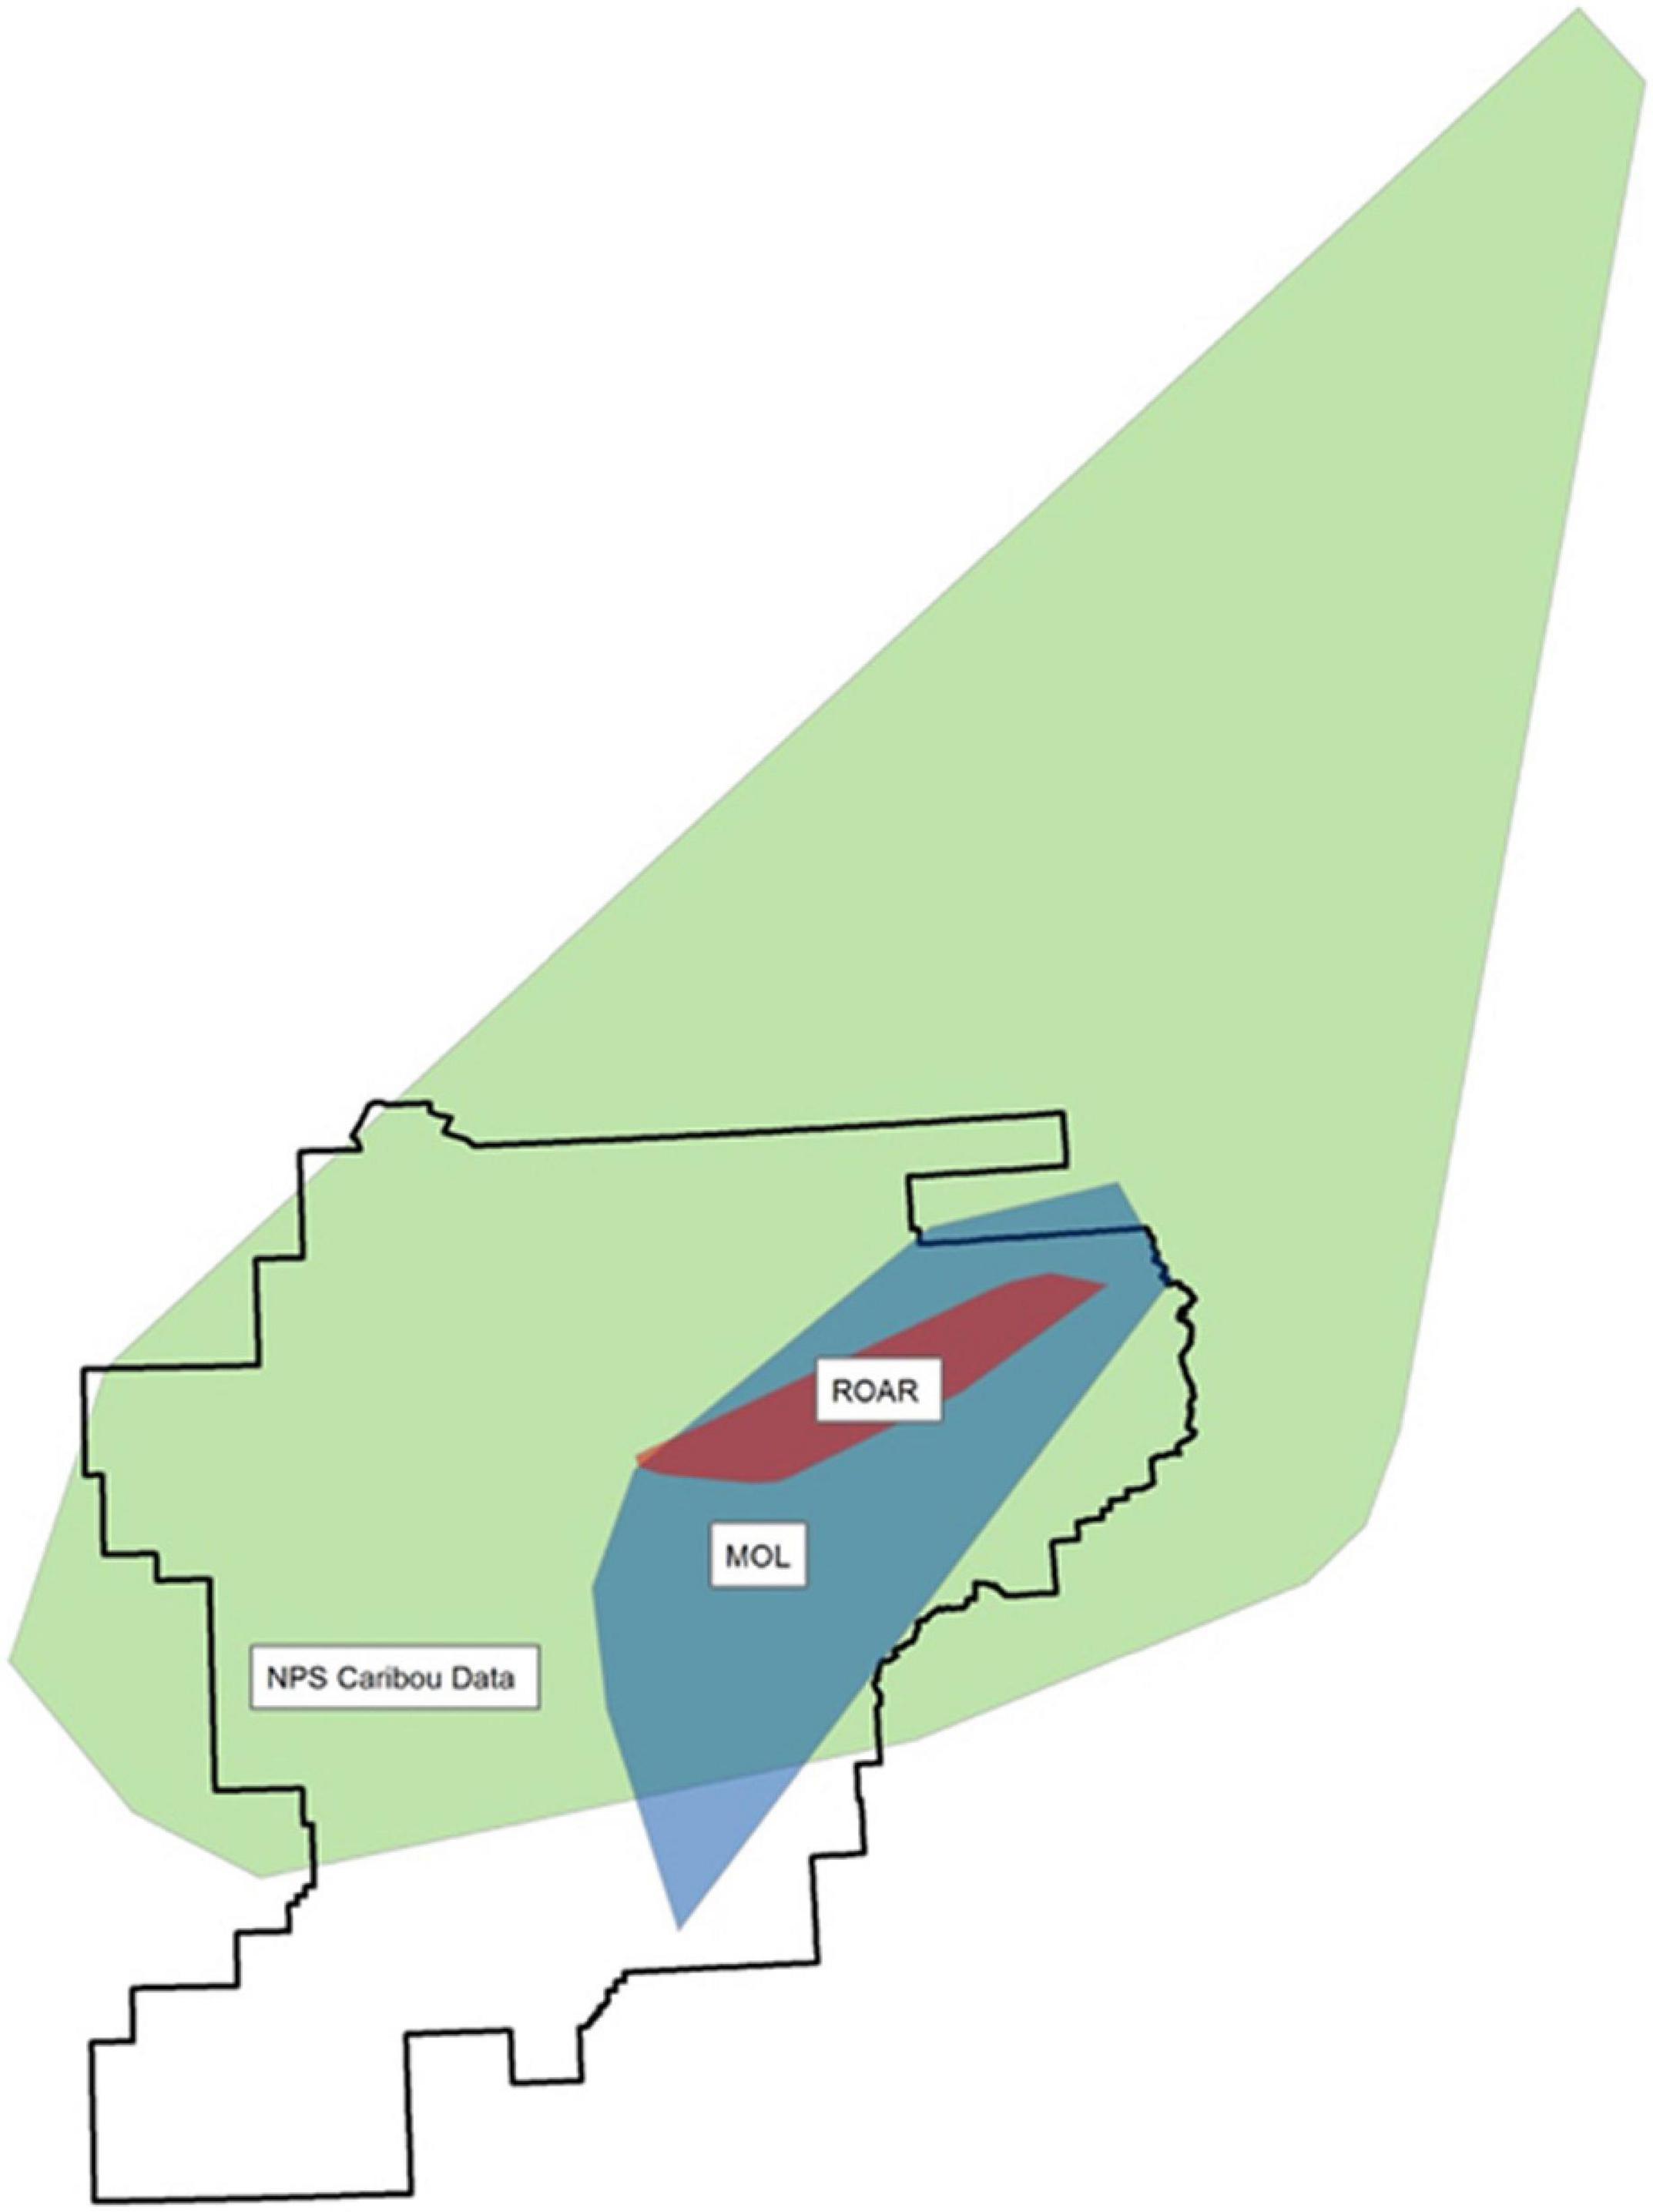
Figure 7. Spatial extent, convex hull for each dataset (the black outline represents the Denali Park boundary).
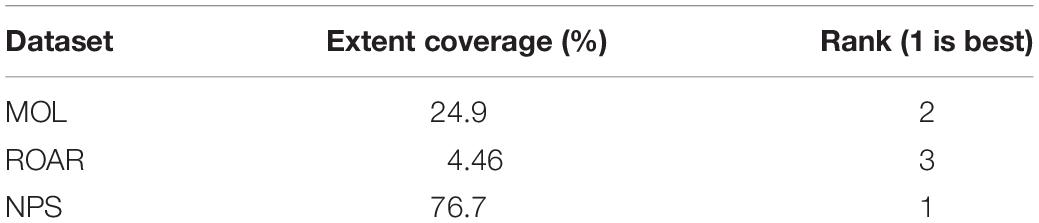
Table 2. Spatial extent, percentage of the desired extent covered, and rankings.
The Temporal component includes the analysis of the datasets’ temporal event, resolution, and extent. To monitor caribou distribution in the park, observations made at any time of day throughout the year on a weekly (or more frequent) basis are acceptable. The desired temporal extent is the last 5 years: June 2012 to September 2016. For the temporal event analysis, the MOL and ROAR data received a ranking of 1 because both were recently collected. The radio collar data was also collected year-round but not within the last 5 years, so this dataset received a rank of 3. For the temporal resolution analysis, the MOL and ROAR datasets were ranked 1 because the data were collected almost daily (multiple observations were made on collection days). Since the NPS data were collected with radio collars, each caribou’s location was only collected twice a month; thus, this dataset received a ranking of 3.
For the temporal extent analysis, the NPS data has the largest temporal extent and therefore received a rank of 1. The MOL and ROAR datasets only contain one summer season (2016) of data and are tied at a rank of 2. To obtain an overall ranking for the Temporal component, each dataset’s rankings for the temporal elements were averaged then ranked to create the final Temporal component rankings. The MOL and ROAR datasets are tied at a rank of 1; while these datasets did not match the desired temporal extent, they were acceptable for the desired temporal events and temporal resolution.
The Aptness component compares the datasets to each other and determines the spatial uniqueness of the datasets. Uniqueness is not the desired data quality for this case study, so the more similar dataset is ranked higher. The ROAR data are almost in total agreement with the other two datasets for the Aptness component, meaning that much of these data in the ROAR dataset is also reflected in the other two datasets (Figures 8, 9 and Table 3). Since the error of omission is preferred, the ROAR dataset is given a rank of 1.
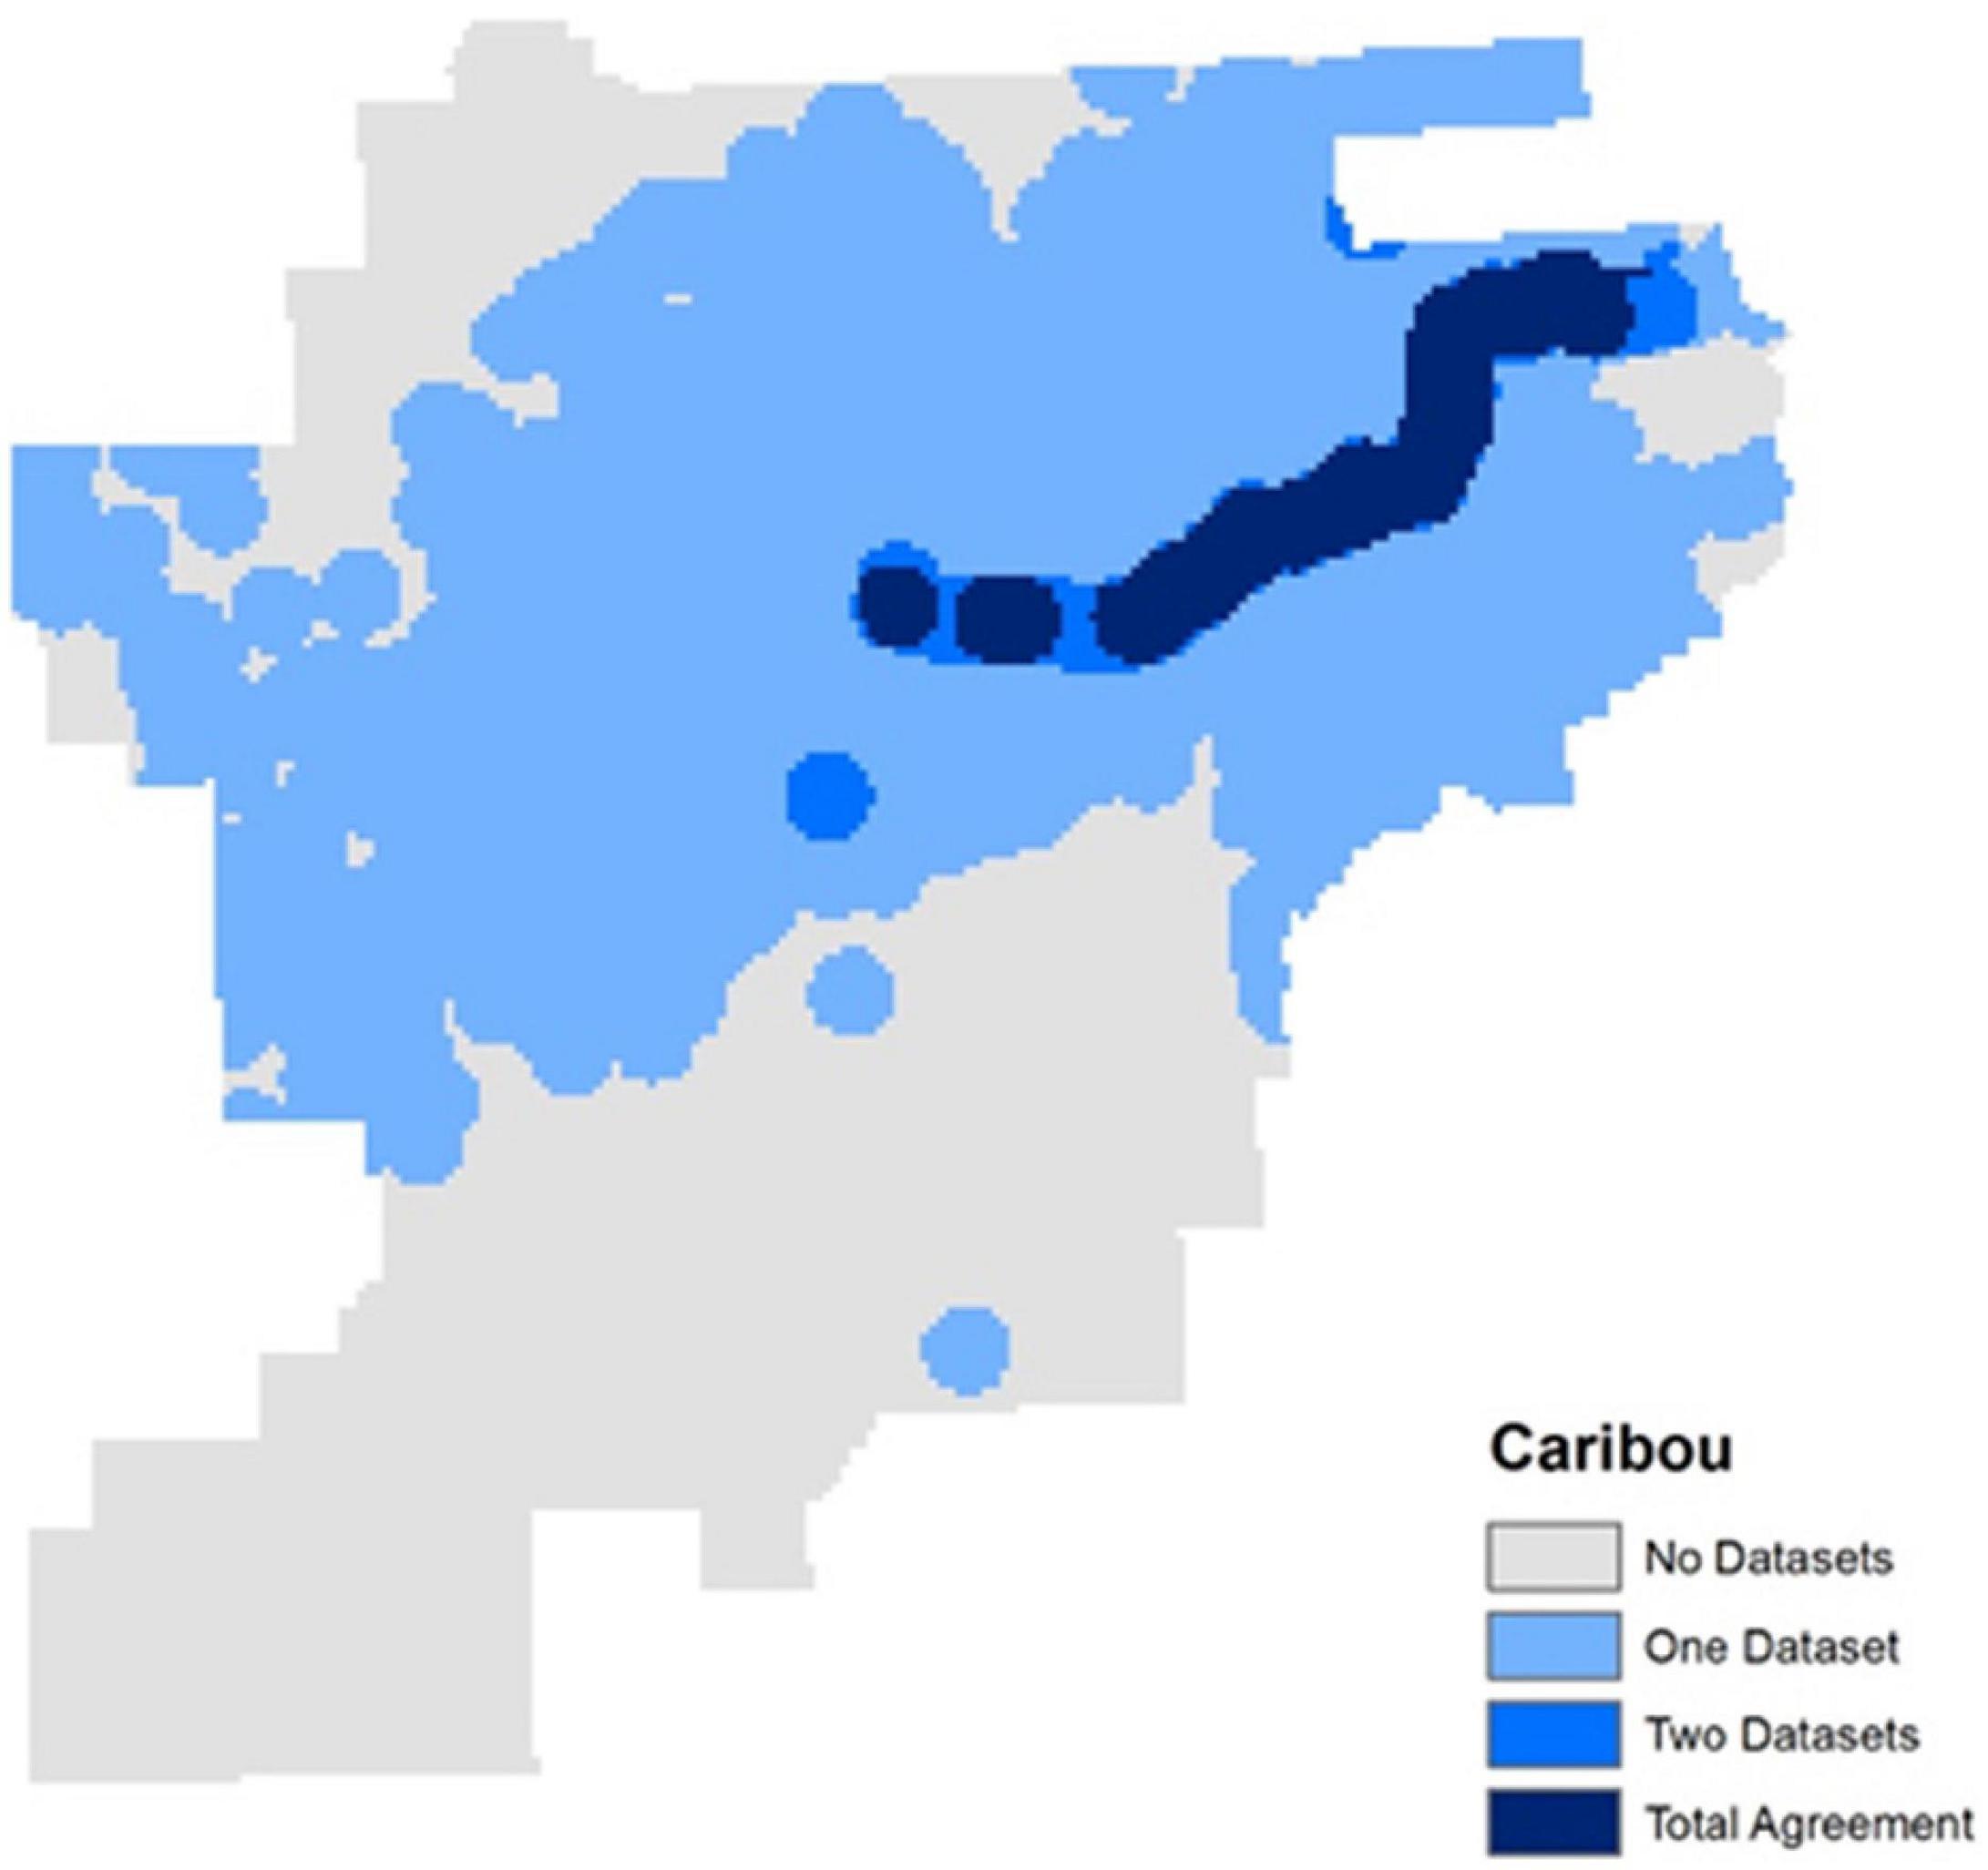
Figure 8. Aptness Component results, areas of dark blue show agreement amongst the three datasets.
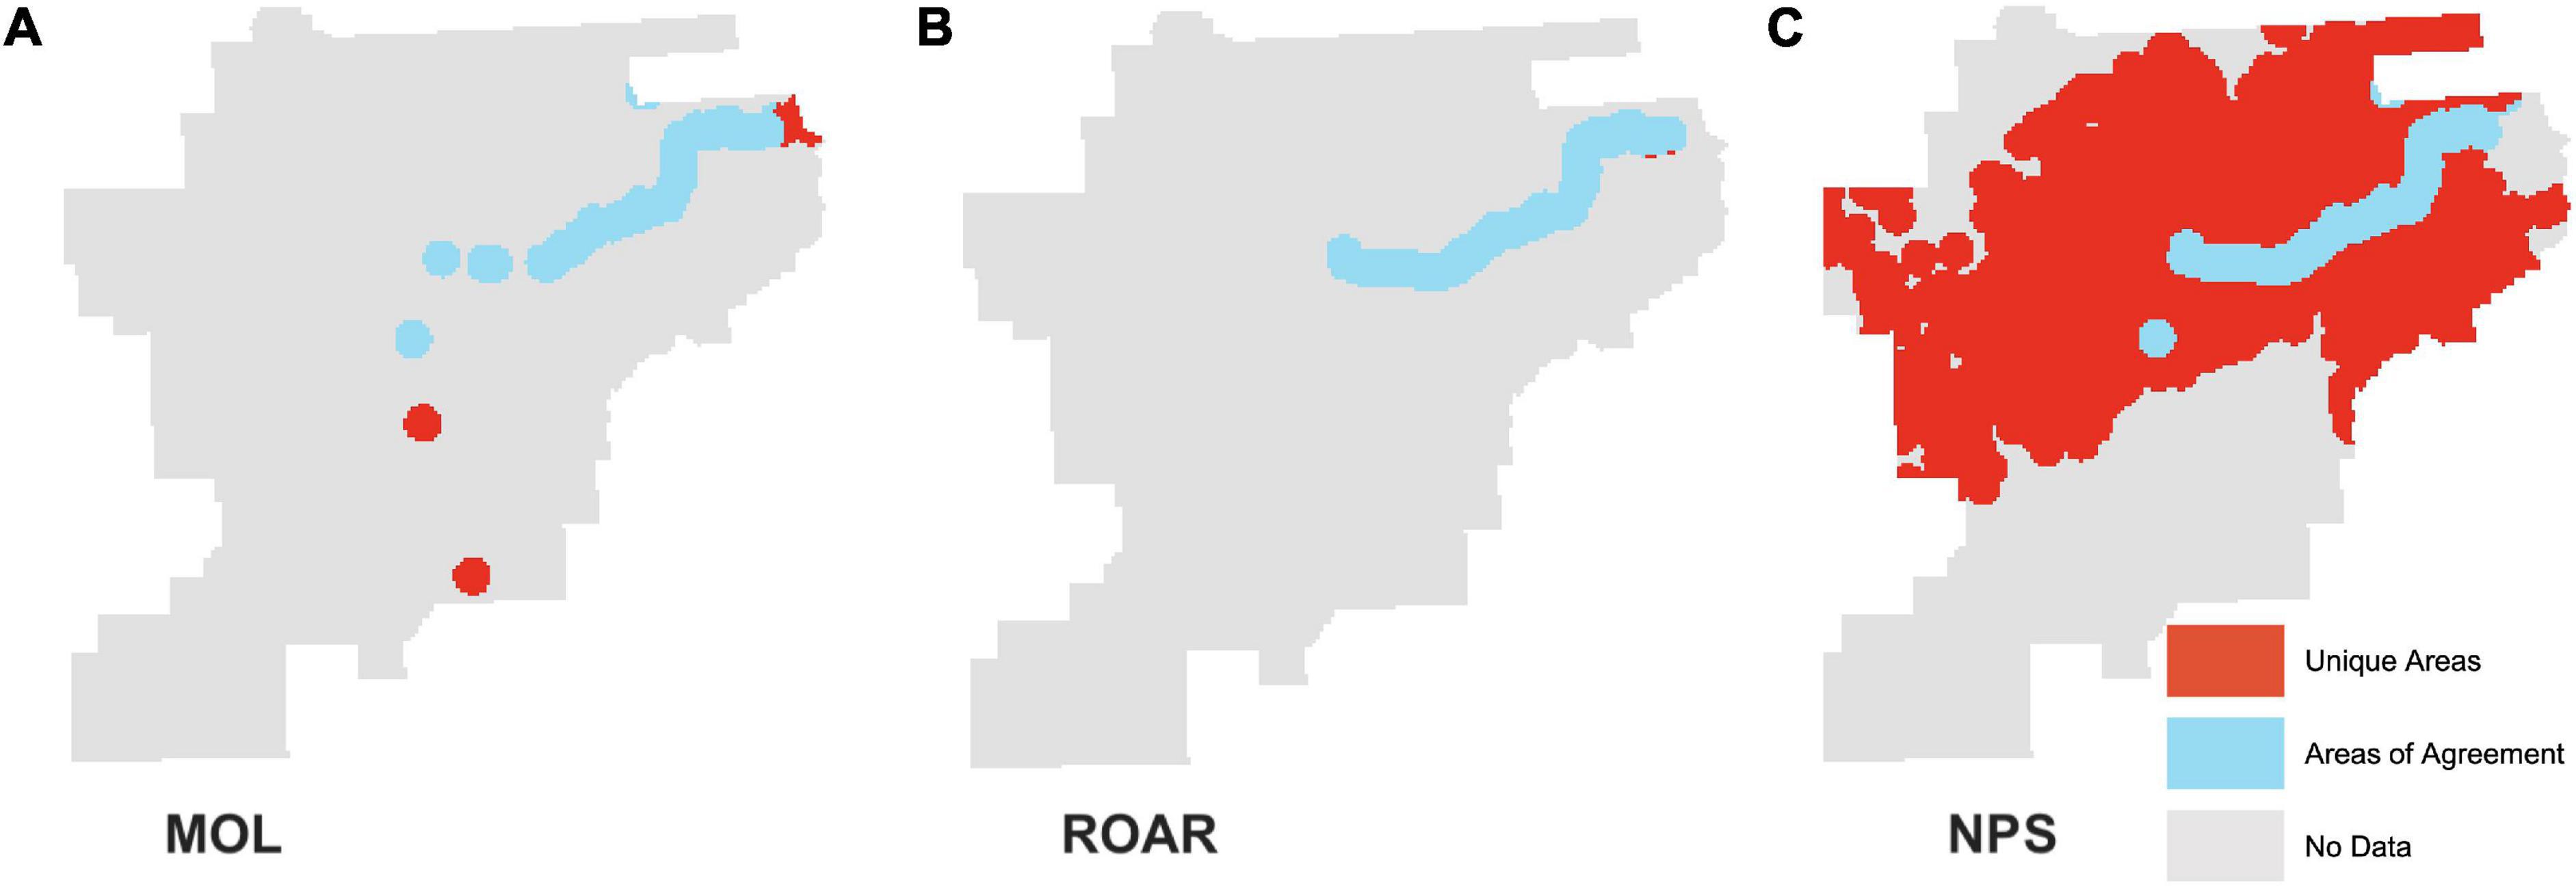
Figure 9. Aptness component results for each dataset. Gray areas are where no datasets have data, blue are areas of agreement, and red areas are unique. (A,B), and C show where each dataset is in the agreement with the others. (A) The MOL data; the areas in blue are where the MOL data are in agreement with the other two datasets and the areas in red show where the MOL data are unique and had observations where the other two datasets do not. (B) The ROAR data; the ROAR data are mostly in agreement with the other two datasets. (C) The NPS radio collar collected data and it is the dataset with the most unique points.
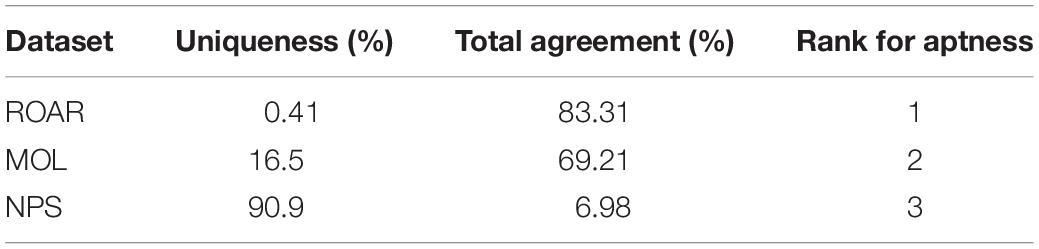
Table 3. Aptness Component Rankings.
The Application (A2) component is concerned with the model’s product, which in this case, we used Species Distribution Models (SDM). However, the STAAq assessment can be used with other models; in the Wentz and Shimizu (2018) DaFFU assessment, they used nitrogen models and ranked the data based on the outputs of the nitrogen models. We chose to use SMDs in this test of the assessment because they are ecological models that use species presence data and environmental variables to predict species distribution (Franklin, 2013), also many citizen science projects are applied to conservation biology and ecological assessments. The species occurrence points are subject to a set of constraints based on the environmental variables (Phillips et al., 2006). Environmental variables include climate, land/ground cover, and elevation. This project used the Maxent software package with the maximum entropy models and the species’ distribution. The available data drove this project to use Maxent, which only requires presence and ecological data for the study area (Phillips et al., 2006; Franklin, 2013).
The SDM created with the datasets is depicted in Figure 10. The resulting maps show areas with a high probability of caribou (warmer colors) and areas with a low probability of presence (cold colors). The large blue area in the middle of the park is the location of the Alaska Range and Denali; we do not expect to find caribou near 20,000 feet elevation. With the MOL data, the area to the northeast of the park (where many of the observation points were collected) has many areas with a high probability of occurrence. These areas are of known caribou habitat. The SDM output using the ROAR data are similar to the MOL data since both datasets were collected on and around the park road area (Figure 10). The model using ROAR data did outperform the model using MOL data by a small margin. The SDM model using the NPS dataset performed worse than the other two models.
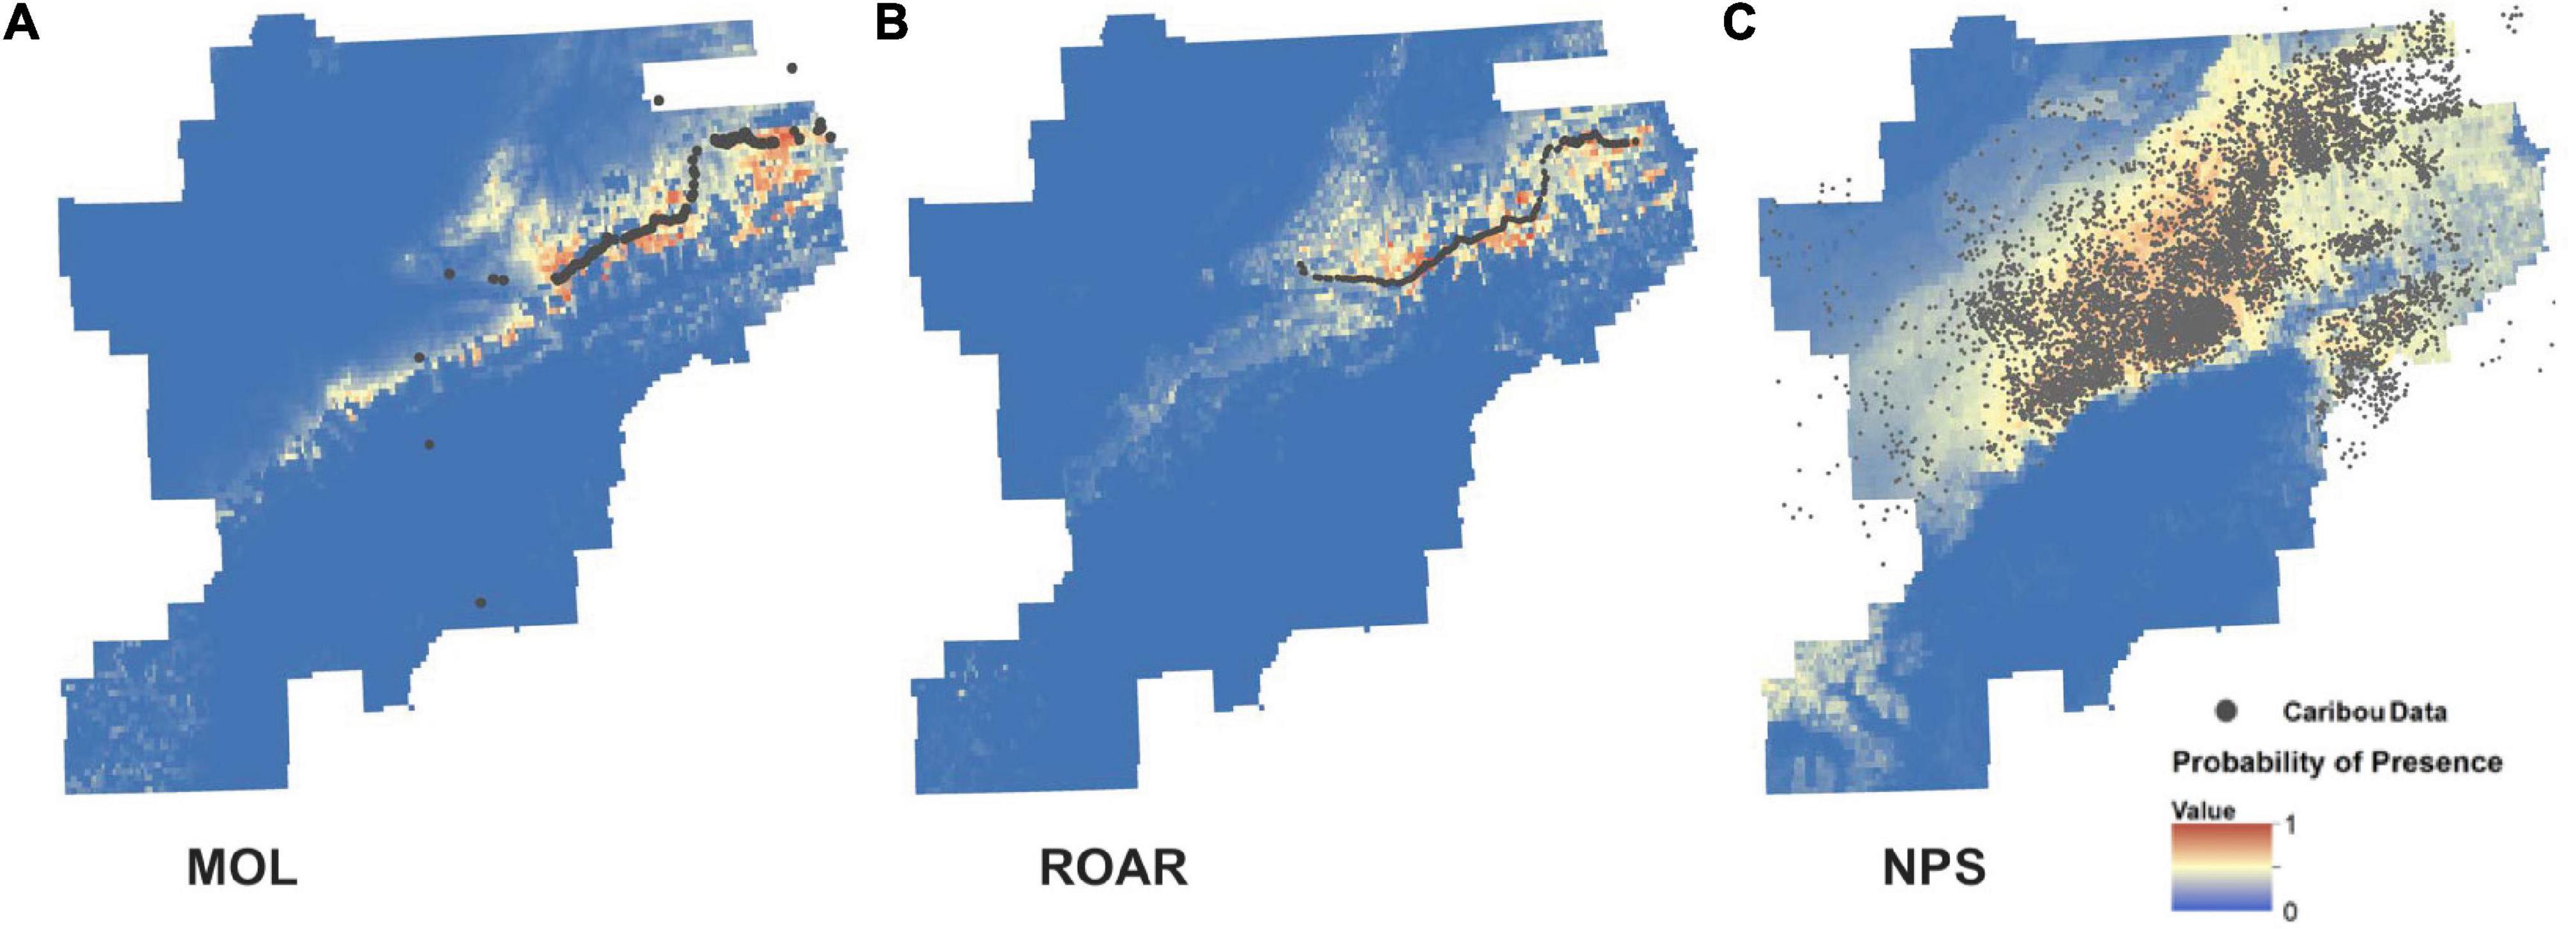
Figure 10. SDM made with caribou data. (A) The distribution of the MOL collected caribou data. (B) The ROAR data. (C) The NPS radio collar collected data. Areas of warmer colors have a higher probability of caribou presence.
The ROAR dataset had the highest AUC and received a rank of 1 (Table 4). The differences in variable contributions, seen in Table 4, may be caused by the datasets’ spatial extent; since the MOL and ROAR data are clustered around the park road, the model may be relying on variation in each of the environmental variables in that area. Land cover is essential for caribou habitat since caribou generally prefer open tundra and are not often found lingering in dense boreal forest areas.
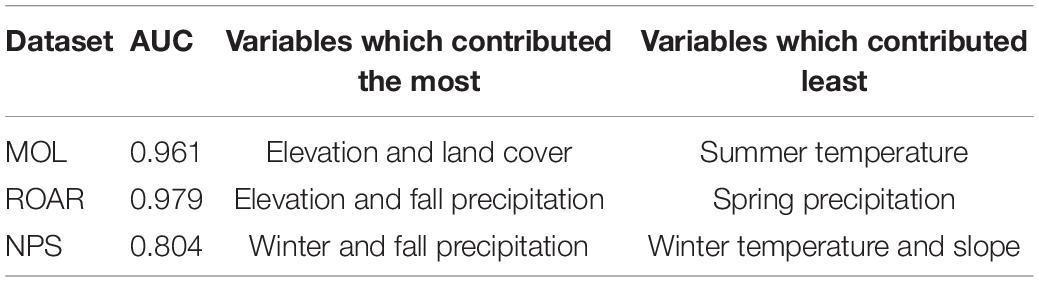
Table 4. SDM results.
Each dataset was assigned a final STAAq ranking, which is the average of the four component rankings. The highest-ranking is 1; this indicates the dataset that is the fittest for use. The ROAR program data was ranked 1, the Map of Life data came in second in this test, and the radio collar data was third (Table 5). This shows that volunteer collected data may be more fit than authoritative datasets when fitness for use is considered depending on the specific use case.
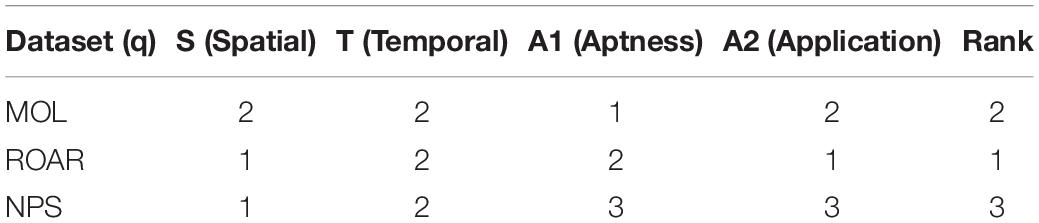
Table 5. Overall rankings.
Discussion
The STAAq assessment was tested to characterize data fitness for use in citizen science data. Citizen science data are typically not looked at for external data fitness but rather an internal assessment of data quality or accuracy. The STAAq assessment shows data fitness for a specific application and provides a third-party scientist or researcher the ability to assess data fitness for their particular needs. This type of assessment uses fitness indicators instead of metadata like other assessments such as Pôças et al. (2014). Citizen science data often have incomplete or missing metadata.
The STAAq assessment is relevant to evaluating data in the context of intended use. It assesses these data’s usability for that specific purpose by comparing these data to data from other datasets. We tested the assessment in a case study examining which of three datasets would be most fit to use in monitoring or caribou distribution in Denali National Park and Preserve. The assessment’s initial step is to clarify the desired data quality elements for the particular use case. This, in itself, is a valuable exercise. The assessment proved flexible and adaptable yet straightforward to implement. We were able to quantify how each dataset performed in the assessment in the same way, even though the datasets were collected differently, covered different spatial and temporal extents, and had different spatial and temporal resolutions.
For this case study, we expected the NPS radio collar data to outperform the volunteer datasets, not because these data are authoritative, but because the data covers a greater spatial and temporal extent. However, these data did not meet other desired data quality elements. We also thought the spatial bias of the MOL and ROAR data being collected near the park road might hinder its performance in the Application component. In Denali, this assessment shows that volunteer collected observation data was more fit for use than radio collar data for ecological modeling. This outcome of the assessment shows us that volunteer collected data from both the ROAR program and MOL is a viable and usable data source for caribou monitoring. The next step for biologists in Denali is to use the STAAq assessment to compare data for other species they monitor, such as bears, wolves, moose, and Dall sheep. It is also possible to combine the MOL and ROAR data and see how a hybrid dataset performs compared to the other datasets.
Employing and testing this assessment did pose some challenges and revealed some improvements and refinements that could be made. For the Spatial component, elements may be added. For example, an element related to the clustering of data in a given area, would be useful if the research question focused on a smaller area or multiple smaller area in a given region.
The Aptness component is the only component that requires other datasets for comparison, and it only performs a binary assessment – whether data for a particular attribute is present or not. It would be interesting to expand this assessment to be able to test the magnitude of the attributes. Also, it would be interesting to use the aptness components for vector data in addition to raster data. For this test of the STAAq assessment we choose to use SDMs for the Application component. Other types of models can be used in this component. We recognize the criticism of the use of AUC to evaluate SDMs (Lobo et al., 2008). The use of AUC in this test was to to compare models of the same species (similar to El-Gabbas and Dormann, 2018).
This fitness for use assessment is relevant for volunteer collected data and can be used with many other types of data and models. The elements and components of the assessment can be modified or weighted to fit the user’s needs. The STAAq assessment results can be included within the metadata for each dataset and provide an example of what these data are fit for. A vital aspect of this assessment is that it can be used when an authoritative dataset is unavailable or only one dataset exists. It can be used to partially perform a data fitness assessment.
Future directions for researching data fitness for use in citizen science include refining the STAAq assessment process, comparing this assessment technique to other data quality evaluation methods, and applying it to different types of citizen science programs. The impetus of this assessment was to determine data fitness for data collected in a contributory style citizen science program through a mobile application. The STAAq assessment should be further adapted and refined to possibly be used to assess data quality in other types of citizen science programs, such as collaborative programs and programs that may include local and indigenous knowledge with their data. The assessment could be used to assess the potential for a citizen science dataset to be combined with a conventionally collected dataset and determine the fitness for the hybridized dataset. As noted earlier in this article, hybrid datasets can fill in gaps and create a more comprehensive and complete dataset (Batty et al., 2010; Connors et al., 2012; Parker et al., 2012; Abdulkarim et al., 2014; Bruce et al., 2014; Upton et al., 2015). The assessment should be tested with standalone datasets to determine how the assessment can evaluate fitness for use when there are no conventionally collected datasets for comparison. Further development of this assessment could include automatization, web interface components, and possibly a simplified GUI (Graphical User Interface) to allow researchers to examine data fitness easily.
Conclusion
Mobile technology creates opportunities for citizen science programs to collect more ecological data covering more temporal and spatial extents (Jepson and Ladle, 2015). These data can be vital for ecological monitoring; however, without adequate data quality assessments, these data may go unused by scientists (Coleman et al., 2009; Boulos et al., 2011; Dickinson et al., 2012; Hart et al., 2012; Roy et al., 2012; Devisch and Veestraeten, 2013; Starr et al., 2014).
Various data quality assessments have been presented in the citizen science literature; however, these mainly focus on internal data quality and do not allow third-party scientists to assess external data fitness. An easy-to-implement data fitness for use assessment may encourage more scientists and researchers to utilize these ever-growing volunteer collected datasets for their own research and monitoring purposes (Wentz and Shimizu, 2018). This article presented and tested a promising method for assessing citizen science data based on its fitness for a particular purpose. This assessment stresses that not all data are created equal, and different datasets may be appropriate (or deemed adequate) for various purposes. Getting the scientific community to trust citizen science data is a fundamental challenge (Burgess et al., 2017). By developing easy-to-implement external data quality methods such as this data fitness for use assessment, citizen science data will become more accepted by the scientific community and more widely used for ecological monitoring. Data fitness assessments, like STAAq, can help make decisions on using different datasets for different models and analyses.
Data Availability Statement
The raw data supporting the conclusions of this article will be made available by the authors, without undue reservation.
Author Contributions
HF performed data analysis and supported the interpretation of the data analysis. LG and EW advised the study. EW initiated the development of the data fitness assessment. All authors contributed to the article and approved the submitted version.
Conflict of Interest
The authors declare that the research was conducted in the absence of any commercial or financial relationships that could be construed as a potential conflict of interest.
Publisher’s Note
All claims expressed in this article are solely those of the authors and do not necessarily represent those of their affiliated organizations, or those of the publisher, the editors and the reviewers. Any product that may be evaluated in this article, or claim that may be made by its manufacturer, is not guaranteed or endorsed by the publisher.
Acknowledgments
The authors would like to acknowledge the support of Denali National Park and Preserve for their logistical and intellectual support of this research. The authors would also like to thank the Map of Life team at Yale University for their development of the offline functionality of the Map of Life mobile application.
Footnotes
References
Abdulkarim, B., Kamberov, R., and Hay, G. J. (2014). Supporting urban energy efficiency with volunteered roof information and the google maps API. Remote Sens. 6, 9691–9711. doi: 10.3390/rs6109691
Adams, L. G. (2017). Dynamics of the Denali Caribou Herd, Denali National Park, Alaska: Progress Report (October 2015–September 2016). Anchorage, AK: USGS Alaska Science Center.
Andelman, S. J. (2011). Conservation science outside the comfort zone. Nature 475, 290–291. doi: 10.1038/475290a
Ballard, H. L., Robinson, L. D., Young, A. M., Pauly, J. B., Higgins, L. M., Johnson, R. F., et al. (2017). Contributions to conservation outcomes by natural history museum-led citizen science: examining evidence and next steps. Biol. Conserv. 208, 87–97. doi: 10.1016/j.biocon.2016.08.040
Batty, M., Hudson-Smith, A., Milton, R., and Crooks, A. (2010). Map mashups, Web 2.0 and the GIS revolution. Ann. GIS 16, 1–13. doi: 10.1080/19475681003700831
Bonter, D. N., and Cooper, C. B. (2012). Data validation in citizen science: a case study from project feederwatch. Front. Ecol. Environ. 10, 305–307. doi: 10.1890/110273
Boulos, M. N. K., Resch, B., Crowley, D. N., Breslin, J. G., Sohn, G., Burtner, R., et al. (2011). Crowdsourcing, citizen sensing and sensor web technologies for public and environmental health surveillance and crisis management: trends, OGC standards and application examples. Int. J. Health Geogr. 10:67. doi: 10.1186/1476-072x-10-67
Brodie, J. F., Roland, C. A., Stehn, S. E., and Smirnova, E. (2019). Variability in the expansion of trees and shrubs in boreal Alaska. Ecology 100:e02660. doi: 10.1002/ecy.2660
Bruce, E., Albright, L., Sheehan, S., and Blewitt, M. (2014). Distribution patterns of migrating humpback whales (Megaptera novaeangliae) in Jervis Bay, Australia: a spatial analysis using geographical citizen science data. Appl. Geogr. 54, 83–95. doi: 10.1016/j.apgeog.2014.06.014
Burgess, H. K., DeBey, L. B., Froehlich, H. E., Schmidt, N., Theobald, E. J., and Ettinger, A. K. (2017). The science of citizen science: exploring barriers to use as a primary research tool. Biol. Conserv. 208, 113–120. doi: 10.1016/j.biocon.2016.05.014
Callaghan, C. T., and Gawlik, D. E. (2015). Efficacy of EBird data as an aid in conservation planning and monitoring. J. Field Ornithol. 86, 298–304. doi: 10.1111/jofo.12121
Champion, C., Hobday, A. J., Tracey, S. R., and Pecl, G. T. (2018). Rapid shifts in distribution and high-latitude persistence of oceanographic habitat revealed using citizen science data from a climate change hotspot. Glob. Change Biol. 24, 5440–5453. doi: 10.1111/gcb.14398
Chrisman, N. (1991). “The error component in spatial data,” in Geographical Information Systems: Principles and Applications 1, eds P. A. Longley, M. F. Goodchild, and D. J. Maguire (Hobiken, NJ: Wiley).
Cohn, J. P. (2008). Citizen science: can volunteers do real research? BioScience 58, 192–197. doi: 10.1641/b580303
Coleman, D. J., Georgiadou, Y., and Labonte, J. (2009). Volunteered geographic information: the nature and motivation of produsers. Int. J. Spatial Data Infrastructures Res. 4, 332–358.
Comber, A., See, L., Fritz, S., Van der Velde, M., Perger, C., and Foody, G. (2013). Using control data to determine the reliability of volunteered geographic information about land cover. Int. J. Appl. Earth Obs. Geoinf. 23, 37–48. doi: 10.1016/j.jag.2012.11.002
Connors, J. P., Lei, S. F., and Kelly, M. (2012). Citizen science in the age of neogeography: utilizing volunteered geographic information for environmental monitoring. Ann. Assoc. Am. Geogr. 102, 1267–1289. doi: 10.1080/00045608.2011.627058
Cooper, C. B., Shirk, J., and Zuckerberg, B. (2014). The invisible prevalence of citizen science in global research: migratory birds and climate change. PLoS One 9:e0106508.
Crall, A. W., Jarnevich, C. S., Young, N. E., Panke, B. J., Renz, M., and Stohlgren, T. J. (2015). Citizen science contributes to our knowledge of invasive plant species distributions. Biol. Invasions 17, 2415–2427. doi: 10.1007/s10530-015-0885-4
Devillers, R., and Bédard, Y. (2007). Towards spatial data quality information analysis tools for experts assessing the fitness for use of spatial data. Int. J. Geogr. Inf. Sci. 21, 261–282. doi: 10.1080/13658810600911879
Devisch, O., and Veestraeten, D. (2013). From sharing to experimenting: how mobile technologies are helping ordinary citizens regain their positions as scientists. J. Urban Technol. 20, 63–76. doi: 10.1080/10630732.2013.769313
Dickinson, J. L., Shirk, J., Bonter, D., Bonney, R., Crain, R. L., Martin, J., et al. (2012). The current state of citizen science as a tool for ecological research and public engagement in a nutshell. Front. Ecol. Environ. 10, 291–297. doi: 10.1890/110236
Dickinson, J. L., Zuckerberg, B., and Bonter, D. N. (2010). Citizen science as an ecological research tool: challenges and benefits. Annu. Rev. Ecol. Evol. Syst. 41, 149–172. doi: 10.1146/annurev-ecolsys-102209-144636
El-Gabbas, A., and Dormann, C. F. (2018). Wrong, but useful: regional species distribution models may not be improved by range-wide data under biased sampling. Ecol. Evol. 8, 2196–2206. doi: 10.1002/ece3.3834
Elwood, S., Goodchild, M. F., and Sui, D. Z. (2012). Researching volunteered geographic information: spatial data, geographic research, and new social practice. Ann. Assoc. Am. Geogr. 102, 571–590. doi: 10.1080/00045608.2011.595657
Franklin, J. (2013). Species distribution models in conservation biogeography: developments and challenges. Divers. Distrib. 19, 1217–1223. doi: 10.1111/ddi.12125
Gervais, M., Bedard, Y., Levesque, M., Bernier, E., and Devillers, R. (2009). “Data quality issues and geographic knowledge discovery,” in Geographic Data Mining and Knowledge Discovery, eds H. J. Miller, J. Han, and H. J. Miller (Milton Park: Routledge). doi: 10.1201/9781420073980.ch5
Golumbic, Y. N., Orr, D., Baram-Tsabari, A., and Fishbain, B. (2017). Between vision and reality: a study of scientists’ views on citizen science. Citizen Sci. Theory Pract. 2:6. doi: 10.5334/cstp.53
Goodchild, M. F. (2009). “The quality of geospatial context,” in Quality of Context. QuaCon 2009. Lecture Notes in Computer Science, Vol 5786, eds K. Rothermel, D. Fritsch, W. Blochinger, and F. Dürr (Berlin: Springer).
Goodchild, M. F. (2011). Scale in GIS: an overview. Geomorphology 130, 5–9. doi: 10.1016/j.geomorph.2010.10.004
Grira, J., Bédard, Y., and Roche, S. (2010). Spatial data uncertainty in the VGI world: going from consumer to producer. Geomatica 64, 61–71.
Guisan, A., Graham, C. H., Elith, J., Huettmann, F., et al. The NCEAS Species Distribution Modelling Group (2007). Sensitivity of predictive species distribution models to change in grain size. Divers. Distrib. 13, 332–340. doi: 10.1111/j.1472-4642.2007.00342.x
Haklay, M. (2010). How good is volunteered geographical information? a comparative study of openstreetmap and ordnance survey datasets. Environ. Plann. B Plann. Des. 37, 682–703. doi: 10.1068/b35097
Haklay, M. (2013). “Citizen science and volunteered geographic information: overview and typology of participation,” in Crowdsourcing Geographic Knowledge, eds Z. Daniel and E. Sarah (Berlin: Springer). doi: 10.1007/978-94-007-4587-2_7
Hart, A., Stafford, R., Goodenough, A., and Morgan, S. (2012). The role of citizen science and volunteer data collection in zoological research. Int. J. Zool. 2012, 3–5. doi: 10.1155/2012/105345
Holt, B. G., Rioja-Nieto, R. M., MacNeil, A., Lupton, J., and Rahbek, C. (2013). Comparing diversity data collected using a protocol designed for volunteers with results from a professional alternative. Methods Ecol. Evol. 4, 383–392. doi: 10.1111/2041-210X.12031
Hurlbert, A. H., and Liang, Z. (2012). Spatiotemporal variation in avian migration phenology: citizen science reveals effects of climate change. PLoS One 7:e31662. doi: 10.1371/journal.pone.0031662
Jepson, P., and Ladle, R. J. (2015). Nature apps: waiting for the revolution. Ambio 44, 827–832. doi: 10.1007/s13280-015-0712-2
Jetz, W., McPherson, J. M., and Guralnick, R. P. (2012). Integrating biodiversity distribution knowledge: toward a global map of life. Trends Ecol. Evol. 27, 151–159. doi: 10.1016/j.tree.2011.09.007
Joly, K. (2011). Complexity of caribou population dynamics in a changing climate. Park Sci. 10, 26–31.
Juran, J. M., Gryna, F. M. J., and Bingham, R. M. (1974). Quality Control Handbook. New York: McGraw-Hill.
Kosmala, M., Wiggins, A., Swanson, A., and Simmons, B. (2016). Assessing data quality in citizen science. Front. Ecol. Environ. 14, 551–560. doi: 10.1002/fee.1436
Kremen, C., Ullman, K. S., and Thorp, R. W. (2011). Evaluating the quality of citizen-scientist data on pollinator communities. Conserv. Biol. 25, 607–617. doi: 10.1111/j.1523-1739.2011.01657.x
Kress, J. W., Garcia-Robledo, C., Soares, J. V. B., Jacobs, D., Wilson, K., Lopez, I. C., et al. (2018). Citizen science and climate change: mapping the range expansions of native and exotic plants with the mobile App Leafsnap. BioScience 68, 348–358. doi: 10.1093/biosci/biy019
Lobo, J. M., Jim nez-Valverde, A., and Real, R. (2008). AUC: a misleading measure of the performance of predictive distribution models. Glob. Ecol. Biogeogr. 17, 145–151. doi: 10.1111/j.1466-8238.2007.00358.x
Luna, S., Gold, M., Albert, A., Ceccaroni, L., Claramunt, B., Danylo, O., et al. (2018). “Developing mobile applications for environmental and biodiversity citizen science: considerations and recommendations,” in Multimedia Tools and Applications for Environmental and Biodiversity Informatics, eds A. Joly, S. Vrochidis, and K. Karatzas (Berlin: Springer). doi: 10.1007/978-3-319-76445-0_2
Magurran, A. E., Baillie, S. R., Buckland, S. T., McP Dick, L., Elston, D. A., Scott, E. M., et al. (2010). Long-term datasets in biodiversity research and monitoring: assessing change in ecological communities through time. Trends Ecol. Evol. 25, 574–582. doi: 10.1016/j.tree.2010.06.016
Parker, C. J., May, A., and Mitchell, V. (2012). Understanding design with VGI using an information relevance framework. Trans. GIS 16, 545–560. doi: 10.1111/j.1467-9671.2012.01302.x
Pecl, G. T., Stuart-Smith, J., Walsh, P., Bray, D. J., Kusetic, M., Burgess, M., et al. (2019). Redmap australia: challenges and successes with a large-scale citizen science-based approach to ecological monitoring and community engagement on climate change. Front. Mar. Sci. 6:349. doi: 10.3389/fmars.2019.00349
Phillips, S. J., Anderson, R. P., and Schapire, R. E. (2006). Maximum entropy modeling of species geographic distributions. Ecol. Model. 190, 231–259. doi: 10.1016/j.ecolmodel.2005.03.026
Pôças, I., Gonçalves, J., Marcos, B., Alonso, J., Castro, P., and Honrado, J. P. (2014). Evaluating the fitness for Use of spatial data sets to promote quality in ecological assessment and monitoring. Int. J. Geogr. Inf. Sci. 28, 2356–2371. doi: 10.1080/13658816.2014.924627
Riesch, H., and Potter, C. (2014). Citizen science as seen by scientists: methodological, epistemological and ethical dimensions. Public Underst. Sci. 23, 107–120. doi: 10.1177/0963662513497324
Roszkowska, E. (2013). Rank ordering criteria weighting methods–a comparative overview. Optimum. Studia Ekonomiczne NR 5, 14–33. doi: 10.15290/ose.2013.05.65.02
Roy, H. E., Pocock, M. J., Preston, C. D., Roy, D. B., Savage, J., Tweddle, J. C., et al. (2012). Understanding Citizen Science and Environmental Monitoring. Final Report on Behalf of UK Environmental Observation Framework. Atlanta: NERC.
Sadoti, G., McAfee, S. A., Roland, C. A., Fleur Nicklen, E., and Sousanes, P. J. (2018). Modeling high-latitude summer temperature patterns using physiographic variables. Int. J. Climatol. 38, 4033–4042. doi: 10.1002/joc.5538
Senaratne, H., Mobasheri, A., Ali, A. L. A., Capineri, C., and Haklay, M. (2016). A review of volunteered geographic information quality assessment methods. Int. J. Geogr. Inform. Sci. 31, 139–167. doi: 10.1080/13658816.2016.1189556
Shimizu, M. (2014). The Development and Assessment of a Spatial Decision Support System for Watershed Management in the Niantic River Watershed: A Geodesign Approach. Arizona: Arizona State University.
Shirk, J. L., Ballard, H. L., Wilderman, C. C., Phillips, T., Wiggins, A., Jordan, R., et al. (2012). Public participation in scientific research: a framework for intentional design. Ecol. Soc. 17:29. doi: 10.5751/ES-04705-170229
Starr, J., Schweik, C. M., Bush, N., Fletcher, L., Finn, J., Fish, J., et al. (2014). Lights, camera…citizen science: assessing the effectiveness of smartphone-based video training in invasive plant identification. PLoS One 9:e111433. doi: 10.1371/journal.pone.0111433
Theobald, E. J., Ettinger, A. K., Burgess, H. K., DeBey, L. B., Schmidt, N. R., Froehlich, H. E., et al. (2015). Global change and local solutions: tapping the unrealized potential of citizen science for biodiversity research. Biol. Conserv. 181, 236–244. doi: 10.1016/j.biocon.2014.10.021
Toogood, M. (2013). Engaging publics: biodiversity data collection and the geographies of citizen science. Geogr. Compass 7, 611–621. doi: 10.1111/gec3.12067
Upton, V., Ryan, M., O’Donoghue, C., and Ni Dhubhain, A. (2015). Combining conventional and volunteered geographic information to identify and model forest recreational resources. Appl. Geogr. 60, 69–76. doi: 10.1016/j.apgeog.2015.03.007
Van Strien, A. J., van Swaay, C. A. M., and Termaat, T. (2013). Opportunistic citizen science data of animal species produce reliable estimates of distribution trends if analysed with occupancy models. J. Appl. Ecol. 50, 1450–1458. doi: 10.1111/1365-2664.12158
Veregin, H. (1999). “Data quality parameters,” in Geographical Information Systems, eds P. A. Longley, M. F. Goodchild, D. J. Maguire, and D. W. Rhind (New York, NY: Wiley).
Walker, J., and Taylor, P. (2017). Using EBird data to model population change of migratory bird species. Avian Conserv. Ecol. 12:4. doi: 10.5751/ACE-00960-120104
Wentz, E. A., and Shimizu, M. (2018). Measuring spatial data fitness-for-use through multiple criteria decision making. Ann. Am. Assoc. Geogr. 108, 1–18. doi: 10.1080/24694452.2017.1411246
Keywords: volunteered geographic information, data fitness, data quality, ecological monitoring, citizen science
Citation: Fischer HA, Gerber LR and Wentz EA (2021) Evaluating the Fitness for Use of Citizen Science Data for Wildlife Monitoring. Front. Ecol. Evol. 9:620850. doi: 10.3389/fevo.2021.620850
Received: 11 February 2021; Accepted: 22 September 2021;
Published: 16 November 2021.
Edited by:
Sven Schade, European Commission, Joint Research Centre (JRC), ItalyReviewed by:
Ryan McLaren Meyer, California Ocean Science Trust, United StatesGary Kofinas, University of Alaska Fairbanks, United States
Copyright © 2021 Fischer, Gerber and Wentz. This is an open-access article distributed under the terms of the Creative Commons Attribution License (CC BY). The use, distribution or reproduction in other forums is permitted, provided the original author(s) and the copyright owner(s) are credited and that the original publication in this journal is cited, in accordance with accepted academic practice. No use, distribution or reproduction is permitted which does not comply with these terms.
*Correspondence: Heather A. Fischer, aGVhdGhlci5maXNjaGVyQG9yZWdvbnN0YXRlLmVkdQ==