 Sonia Llorente-Culebras1,2
 Rafael Molina-Venegas2,3A. Márcia Barbosa4
 Silvia B. Carvalho5
 Miguel Á. Rodríguez2,3
 Ana M. C. Santos*1,3,6
- 1Terrestrial Ecology Group (TEG-UAM), Departamento de Ecologia, Universidad Autónoma de Madrid, Madrid, Spain
- 2Universidad de Alcalá, Department of Life Sciences, Alcalá de Henares, Spain
- 3Universidad de Alcalá, GLOCEE - Global Change Ecology and Evolution Group, Department of Life Sciences, Alcalá de Henares, Spain
- 4Spatial Biology Lab, CICGE, Universidade do Porto, Vila Nova de Gaia, Portugal
- 5CIBIO/InBIO, Centro de Investigação em Biodiversidade e Recursos Genéticos da Universidade do Porto, Oporto, Portugal
- 6Centro de Investigación en Biodiversidad y Cambio Global (CIBC-UAM), Universidad Autónoma de Madrid, Madrid, Spain
Protected areas (PAs) have been created with the purpose of preserving biodiversity, acting as refuges from anthropogenic pressures. Traditionally, PAs have been designed and managed to represent mainly taxonomic diversity, ignoring other diversity facets such as its functional and phylogenetic components. Yet, functional and phylogenetic diversity are, respectively, connected with species’ roles on ecosystems and evolutionary history held within communities. Here, we focused on the amphibian, reptile, resident breeding bird, and non-flying mammal faunas of the national and natural parks of the Iberian Peninsula, to evaluate whether these PAs are adequately representing regional functional, phylogenetic, and taxonomic diversity of each group. Specifically, we computed functional and phylogenetic diversity within each PA, and then compared those values to the ones obtained from a random assembly of species from the regional pool, that was defined as the region encompassing the PA and a neighboring area of 50 km beyond its boundary. We also calculated the proportion of species in each regional pool that were present within the PAs. In general, the functional and phylogenetic diversity of amphibians, reptiles and non-flying mammals found within PAs did not differ significantly from random expectations generated from the species pertaining to the regional pool, although a few PAs showed a higher diversity. In contrast, resident breeding birds presented lower functional and phylogenetic diversity than expected by chance in many of the PAs, which could relate to climatic variables and the habitat specificity of some species. The proportion of species from the regional pools that are present in the PAs was high for amphibians, reptiles and mammals, and slightly lower for birds. These results suggest that the Iberian natural and national parks are effectively capturing the functional, phylogenetic and taxonomic diversity of most tetrapod assemblages present at the regional level. Future studies should identify priority areas to expand the representation of these biodiversity components, and assess potential effects of climate and land-use changes on current patterns.
Introduction
Human activity is causing serious ecological disturbances on Earth, which has led researchers to propose a new geological epoch, the Anthropocene (Waters et al., 2016). Land-use change, habitat loss and fragmentation, alien species, and climate change are prime drivers of ecosystem alterations (MEA - Millennium Ecosystem Assessment, 2005; Allan et al., 2019). At the global scale, the impact of these actions is significant and is inducing waves of species extinctions and population declines (Pimm et al., 1995; Hoffmann et al., 2010; Barnosky et al., 2011; Davidson et al., 2017; Ceballos et al., 2020), as well as disruption of ecosystem services (Isbell et al., 2017; Pecl et al., 2017; IPBES, 2019).
Protected areas (PAs) are legally protected geographic spaces that have been created to preserve biodiversity and mitigate the impact of human actions. These areas can potentially act as refuges, giving protection from ongoing temporal and/or spatial perturbations (Keppel et al., 2012). In the long-term, PAs may even act as refugia (sensu Keppel et al., 2012, 2018), if they are capable to maintain species occurrence when conditions become adverse in the surrounding areas (e.g., due to pollution or climate change). The design of PAs has been traditionally achieved through information on species distributions, being particularly based on the concepts of species representativeness and species protection from human impacts (Margules and Pressey, 2000), while accounting for economic and opportunity costs (Moilanen et al., 2009), but focusing mostly on taxonomic diversity (Myers et al., 2000; Brooks et al., 2006; Jenkins et al., 2013). By contrast, functional diversity (defined as the range, values, and relative abundance of functional features or traits of a given community; Díaz and Cabido, 2001; Díaz et al., 2007; Harrington et al., 2010) and phylogenetic diversity (i.e., the amount of evolutionary history encompassed by a set of taxa; Faith, 1992) have generally been left aside when designing PAs (Winter et al., 2013; Guilhaumon et al., 2015; Pollock et al., 2017). Yet, the emphasis on taxonomic diversity implies assuming that all species contribute to biodiversity equally, which ignores: (1) that species differ in terms of evolutionary distinctiveness (Faith, 1992; Rodrigues and Gaston, 2002); (2) that some ecosystem functions are performed by particular species (Flynn et al., 2011); and (3) that extinctions are often not random among species [e.g., across vertebrate groups, higher extinction probability has been reported for species from certain lineages such as carnivores or primates (e.g., Purvis et al., 2000), or with certain traits, such as species with a large or small body-mass, slow pace of life and/or a small distribution range size (e.g., Fritz et al., 2009; Ripple et al., 2017; Carmona et al., 2021)]. Therefore, it is essential to develop projects and proposals that integrate more facets of diversity and sources of data into conservation efforts (e.g., Devictor et al., 2010; Barak et al., 2016). One example comes from the EDGE – “Evolutionary Distinctive and Globally Endangered” project, which aims at prioritizing endangered and evolutionary distinct species in conservation planning (Isaac et al., 2007).
The effectiveness of PAs in preserving biodiversity has been traditionally evaluated with a focus on taxonomic diversity (e.g., Long et al., 2004; Araújo et al., 2007; González-Maya et al., 2015; Kukkala et al., 2016; Rosso et al., 2018; Hanson et al., 2020), while attention to functional and phylogenetic diversities is only beginning to arise (Devictor et al., 2010; Villamor and Becerro, 2012; Mazel et al., 2014; Guilhaumon et al., 2015; Thuiller et al., 2015; Brum et al., 2017; Pollock et al., 2017). Even so, since most of these recent studies have evaluated the representation of the gamma diversity hosted within the PAs network at broad geographical extents, how well each PA preserves all facets of biodiversity relative to their neighborhoods remains an open question (see Gaston et al., 2008). Critically, by assuring the maintenance and conservation of functionally and phylogenetically diverse communities–presumably better prepared to adapt to global change (Sgro et al., 2011; Mori et al., 2013)–we can, in general, also preserve the resilience of the ecosystems and the continuity of services they provide, particularly at larger spatial scales (Loreau et al., 2001; Díaz et al., 2013).
Focusing on the Iberian Peninsula (Iberia herein), comprising mainland Portugal and Spain, this study aims to evaluate whether each national and natural park is adequately representing the regional functional, phylogenetic, and taxonomic diversity across tetrapod assemblages (sensu Fauth et al., 1996; i.e., amphibians, reptiles, resident breeding birds, and non-flying mammals). With an extent area of 583,254 km2, which corresponds to 5.7% of Europe’s area, Iberia stands out in this continent for hosting approximately half of Europe’s animal and plant species (Williams et al., 2000; Araújo et al., 2007). The effectiveness of Iberian PAs as a conservation tool has been evaluated before. Araújo et al. (2007) concluded that Iberian PAs reasonably represent the taxonomic diversity of the vertebrates and plants that inhabit this region, and Rosso et al. (2018) suggested that Natura 2000 Network is an effective representation of the Iberian endemic fauna. There are also some studies focusing on other biodiversity components. For instance, Villamor and Becerro (2012) evaluated fish functional diversity in Spanish coastal PAs, and Carvalho et al. (2017) identified priority areas for conservation of Iberian herpetofauna phylogenetic diversity.
Yet, no study to date has examined whether each Iberian PAs is safeguarding regional phylogenetic and functional diversity across the taxonomic groups considered in this study. Here, we used a null model approach to evaluate whether each Iberian PA holds non-random fractions of both functional and phylogenetic diversity of the region where they stand. Protected areas showing functional or phylogenetic diversity values that are not different, or are higher, than expected by chance could be deemed as adequate representations of the regional faunas, and those PAs showing lower values as poor representations. Additionally, we evaluated the proportions to which the species present in the regional pools were also present in their corresponding PAs. Finally, we also investigated whether PA’s climate and habitat characteristics were related with these proportions and/or with deviations from randomness in functional and phylogenetic diversity, to explore potential aspects influencing PA’s representativeness of regional diversity.
Materials and Methods
Study Area
We focused on the two most important protection categories of Iberian PAs, i.e., National and Natural parks, of which there are 137 in mainland Spain (9 and 114, respectively) and Portugal (1 and 13, respectively) (Supplementary Table 1 in Data Sheet 1). Polygon maps for these PAs were downloaded from the websites of the former Spanish Ministry of Agriculture and Fisheries, Food and Environment (MAPAMA - Ministerio de Agricultura, Pesca, Alimentación y Medio Ambiente, 2017b), and the Portuguese “Instituto da Conservação da Natureza e das Florestas” (ICNF - Instituto da Conservação da Natureza e das Florestas, 2017). Afterward, they were combined, merging adjacent parks from both countries to form single analysis units (this occurred for 40 parks; see Supplementary Table 1 in Data Sheet 1), thus rendering a total of 113 different PAs to be considered in this study (the PAs’ main characteristics can be found in Supplementary Table 1 in Data Sheet 1).
Species Data
Presences/absences of terrestrial tetrapod species native to Iberia at the PAs were obtained by overlapping PAs’ polygon maps with several species occurrence data sources available at the original Universal Transverse Mercator (UTM) 10 × 10 km grid. Thus, amphibian and reptile data were extracted from Loureiro et al. (2008) and the Spanish Herpetological Society database SIARE (SIARE (Servidor de Información de Anfibios y Reptiles de España) - Asociación Herpetológica Española, 2017), while bird and mammal data were obtained from the atlas of mammals (Bencatel et al., 2017) and breeding birds of Portugal (ICNB – Instituto da Conservação da Natureza y da Biodiversidade, 2008), and the Spanish inventory of terrestrial species database (MAPAMA - Ministerio de Agricultura, Pesca, Alimentación y Medio Ambiente, 2017a). Bats, non-resident and non-breeding birds were excluded, thus rendering 383 native species in our database, of which 26 were amphibians, 50 reptiles, 247 birds, and 60 mammals.
Trait data were compiled from the literature and were related to: trophic behaviour, habitat, body size, daily activity, reproduction, longevity, and displacement mode (Table 1). Due to the physiological and anatomical differences between tetrapod groups, some of the traits differed across groups, yet they represented common biological functions (see Table 1).
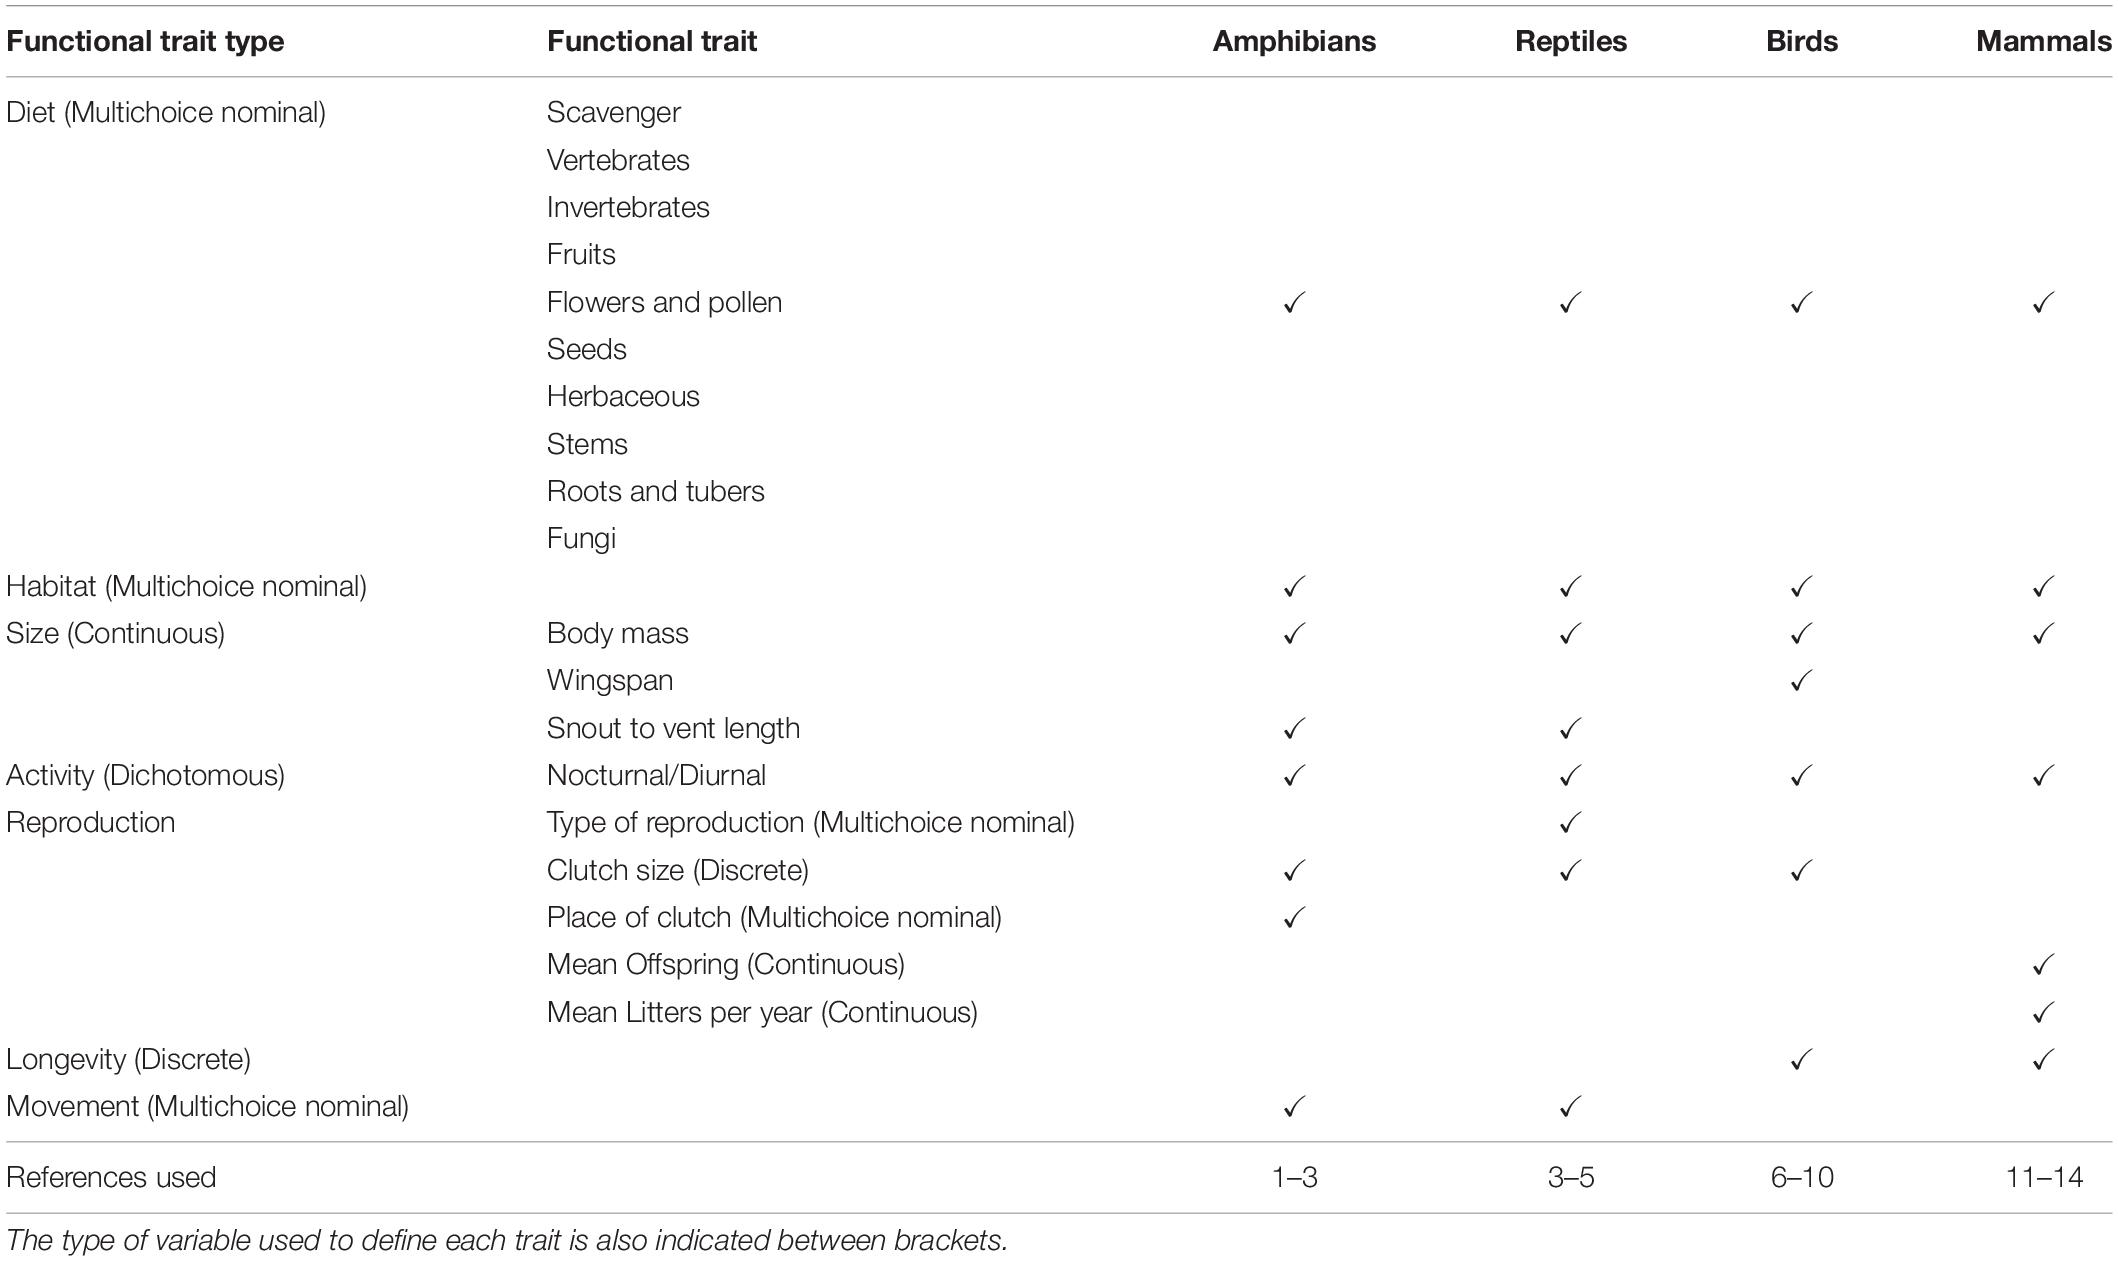
Table 1. Functional traits compiled for amphibians, reptiles, birds, and mammals using different sources: 1-García-París et al., 2004; 2-Trochet et al., 2014; 3-Carvalho et al., 2017; 4-Grimm et al., 2014; 5-Salvador, 2014; 6-Cramp et al., 2004; 7-Dunning, 2008; 8-Wilman et al., 2014; 9-Hume, 2016; 10-SEO - Sociedad Española de Ornitología, 2018; 11-Palomo et al., 2007; 12-Aulagnier, 2009; 13-Jones et al., 2009; 14-Safi et al., 2011.
Regarding the phylogenetic data, for amphibian and reptile species, we used the species-level ultrametric phylogenies published in Carvalho et al. (2017). The trees were inferred using Bayesian methods (BEAST v.1.8.0) based on three mitochondrial markers – 12S rRNA (12S), 16S rRNA (16S), and the nuclear gene cytochrome b (CYTB). The amphibian tree was inferred using an additional nuclear marker – the recombination-activating gene 1 (RAG1) – and the reptile tree with three additional nuclear markers – the oocyte maturation factor Mos (CMOS), the melanocortin receptor 1 (MC1R), and the recombination-activating gene 1 (RAG1) (see Carvalho et al., 2017 for full details). For birds and mammals, the phylogenies were built de novo using CYTB, COI, 16S, and 12S mitochondrial markers and a maximum likelihood approach (Roquet et al., 2013). The resultant trees were time-calibrated using the TreePL software (Smith and O’Meara, 2012) and node age estimations from Meredith et al. (2011) and Prum et al. (2015; see Supplementary Appendix 1 in Data Sheet 1 for full details on the phylogenetic procedures). Since the phylogenetic inference approaches used for amphibians and reptiles are different from those used for mammals and birds, there could be slightly different topologies toward the shallower branches (relationships among species within genera). However, accumulating evidence suggests that genus-level phylogenies are appropriate for phylogenetic diversity analyses (e.g., Allen et al., 2019; Qian and Jin, in press), and therefore, the putative differences in among-species evolutionary relationships that may result from the use of different inference methods would have a negligible impact in the analyses. It is also important to notice that the height of the four chronograms was scaled to unit to make them comparable.
Diversity Metrics
To evaluate whether PAs capture the functional, phylogenetic and taxonomic diversity of the region where they stand, we first defined species regional pools for each of them. Four concentric areas were designed placing their limits 15, 25, 50, or 100 km beyond the boundaries of the PA. Then, we defined four nested regional pools of increasing size, each corresponding to both the list of species occurring within the PA and those occurring in each of the four buffer zones. However, as diversity metrics [i.e., proportion of species and Standard Effect Size (SES) values; see below] strongly correlated across regional pools (Supplementary Table 2 in Data Sheet 1), we only present results pertaining to the 50 km buffer area. We chose the latter because larger buffer areas overlapped between some PAs and smaller areas resulted in depauperated regional pools.
For each tetrapod group, we obtained a functional dendrogram including the species observed across all the Iberian PAs and buffers (hereafter “Iberian functional dendrogram”). To do so, the complete group’s trait matrix was converted into a distance matrix using a modified version of Gower’s distance (Pavoine et al., 2009; “dist.ktab” from package “ade4”; Dray and Dufour, 2007), which was in turn used to obtain the Iberian functional dendrograms (“hclust” from package “ade4”, using UPGMA as the agglomerative method; Dray and Dufour, 2007). This methodology has been widely used in the literature in studies including similar goals to ours (e.g., Roa-Fuentes et al., 2019; Santos et al., 2020). Then, the Iberian functional dendrogram of each tetrapod group was pruned to each regional pool (composed by the species observed in each PA and respective buffer zone). These PA-specific functional dendrograms served to compute functional diversity (FD) of the PAs and the corresponding null assemblages of species (see below) as the minimum spanning path connecting the set of species in each case (Petchey and Gaston, 2002). Although the computation of Gower’s distance allows missing data, trait completeness was overall high across all groups (97.9%, 97.8%, 99.9%, and 100% completed for amphibians, reptiles, birds, and mammals, respectively). Likewise, Faith’s (1992) Phylogenetic Diversity (PD) index was used to calculate the phylogenetic diversity of each PA and the null assemblages of the respective regional pool, following the same procedure described above for FD but using the molecular phylogenies instead of the functional dendrogram (see Santos et al., 2020 for a similar approach).
We assessed whether the set of species of each taxonomic group inhabiting each PA represents its regional functional and phylogenetic diversity by comparing the FD and PD observed in the PAs with a null distribution generated by the random assembly of species from their corresponding regional pool (i.e., PA plus buffer zone). For each PA, we created 1,000 random assemblages from its regional pool, with the same number of species as in the PA, by shuffling species labels across the tips of the corresponding functional and phylogenetic dendrograms (Supplementary Figure 1 in Data Sheet 1). We performed 1,000 randomizations as these provide very similar FD and PD values as those obtained when using a higher number of randomizations, allowing to compromise between the robustness of the results and optimization of computational time (see Supplementary Figures 2–5 in Data Sheet 1). This was achieved using the function “ses.pd” of the “picante” R package (Kembel et al., 2010) and applying the null model “taxa shuffle” to calculate standardized effect sizes (SES; Gotelli and Graves, 1996; Kembel, 2009) for FD (herein SES.FD) and PD (herein SES.PD) as:
where the subscripts obs and null refer, respectively, to the observed diversity and the randomly generated null distribution of diversity values. For each SES, a p-value was calculated by placing the observed diversity in the ranked null distribution of randomized values and dividing its position by the number of randomizations +1. Thus, using a 5% nominal alpha, a positive SES.FD (or SES.PD) with p-value > 0.975 corresponds to a PA with significantly higher FD (or PD) than expected by a random assembly from the regional pool, while a negative SES.FD (or SES.PD) with p-value < 0.025 indicates the opposite. All values obtained through this methodology (observed FD/PD, SES.FD/PD, and p-values) can be found in Supplementary Table 1.
Regarding taxonomic diversity, we evaluated how much of the regional species diversity is present within each PA, by calculating the proportion of species from the regional pool that are also present in the PA (number of species present in the PA/number of species present in the total regional pool; herein species proportion). The values vary from 1 when all the species of the regional pool are present in the PA, and decrease as the number of species present in the PA is lower in comparison with its associated region.
Habitat and Climatic Data
Habitat diversity is one of the most important determinants of not only species richness (e.g., Tews et al., 2004; Moreno-Rueda and Pizarro, 2008), but also of functional diversity (García-Llamas et al., 2019) and phylogenetic diversity (Franke et al., 2020). In order to explore if there is any relationship between the habitat types and the regional diversity represented in the Iberian PAs, we compiled Iberian land uses from the CORINE Land Cover inventory, using them as proxies for habitats (for simplification, the different land covers will be referred to as habitats). This inventory classifies European land uses into three nested levels, from which we selected the second level with 15 categories (see details in Supplementary Table 3 in Data Sheet 1). We downloaded the 2012 update of these data (CORINE Land Cover, 2019) and processed them with Quantum GIS (version 3.6.0; QGIS Development Team, 2018) to generate a set of habitat variables for each PA: area of each CORINE land-use type, number of habitats, and diversity of habitats (calculated using the Shannon-Wiener index). We performed a preliminary analysis based on a paired Student t-test, to assess if the habitat configuration within the PAs (i.e., habitat richness, habitat diversity and the proportion of area occupied by each habitat) differs from what occurs in their surrounding region (see more details in Supplementary Appendix 2 in Data Sheet 1). Overall, this comparison indicated significantly different habitat configurations between inside and outside the PAs (see Supplementary Table A1 in Supplementary Appendix 2 in Data Sheet 1).
Climatic factors, as temperature and precipitation, influence vertebrates’ distribution and diversity (Moreno-Rueda and Pizarro, 2008), affecting particularly the environmental suitability for physiologically limited species (i.e., ectotherms; Clarke and Gaston, 2006). To explore the effect of climate on diversity metrics, we obtained climatic data for the 1970 to 2000 range from the WorldClim 2.1 database (WorldClim, 2020) at a resolution of ∼5 km × 5 km. We selected several climatic variables: Annual Mean Temperature, Temperature Seasonality, Minimum Temperature of Coldest Month, Annual Precipitation, Precipitation of Driest Month, and Precipitation Seasonality (see details in Supplementary Table 1 in Data Sheet 1). We processed these variables with Quantum GIS (version 3.6.0; QGIS Development Team, 2018) and then we obtained mean values of each climatic variable for each PA, by calculating the average values of the cells included within its boundaries. A preliminary analysis based on a paired Student t-test indicated there are no significant differences in the climatic conditions found within the PAs and their surrounding regions (see more details in Supplementary Appendix 2 in Data Sheet 1). However, as climate is known to have important effects on vertebrates’ functional and/or phylogenetic diversity, both at continental (Santos et al., 2020) and smaller scales (García-Llamas et al., 2019), we considered important including these variables in the analyses (see below).
Model Selection
To explore which PA’s characteristics might be related to deviation from randomness in functional and phylogenetic diversity, and also with species proportions of each taxonomic group, we used Generalized Linear Models (GLMs) in a multi-model inference procedure. This approach provides the best models (among all possible models) that explain the variation of the different diversity metrics between PAs.
We evaluated 12 response variables, resulting from the combination of taxonomic groups (amphibians, reptiles, birds, and mammals) and diversity metrics (functional diversity, phylogenetic diversity, and species proportion). The response variables for each vertebrate group were SES.FD, SES.PD, and the proportions of species from the regional pools that are present in PAs. The initial candidate predictor variables were related to three categories: habitat (area of each of the fifteen land use categories of CORINE Land Cover, number of habitat types, and habitat diversity of each PA), climate (mean of six bioclimatic variables; explained above), and the area of the PAs. All predictors were standardized to mean = 0 and standard deviation = 1. We then identified pairs of candidate predictors that were strongly correlated (|Spearman’s ρ| ≥ 0.8) and used the “corSelect” function of the “fuzzySim” R package (Barbosa, 2015) to exclude the variable with the weakest relationship with each particular response variable.
The remaining predictors were included in a multi-model inference procedure based on Akaike’s Information Criterion (AIC; Akaike, 1973) as implemented in the “glmulti” R package (Calcagno and de Mazancourt, 2010), using Gaussian family with “identity” link when the SES values were the response variables, and binomial family with “logit” link in the case of the proportion of species from the regional pool. We first selected those models with lower AICc values, i.e., AIC values corrected for small sample sizes (see Symonds and Moussalli, 2010), identifying the best models as those with ΔAICc < 2. Afterward, we applied a model averaging procedure to these models using the function “coef.glmulti” of the “glmulti” R package (Calcagno and de Mazancourt, 2010). This function provides the averaged estimates of all the variables which appear at least in one of the best models (presented in Supplementary Table 2), as well as the importance of each predictor variable. The importance corresponds to the sum of the AICc weights of the models in which each predictor variable appears. The importance varies from 1, when a variable appears in all the best models, decreasing to 0, when a variable appears in a reduced number of models or none. For simplification, we only discuss those variables that have an importance value of 1 for each response variable, but the importance values of the other variables can be found in Table 2. The amount of deviance that the best model for each response variable accounted for (D2; the equivalent to R2 of least square models, for general linear models; Guisan and Zimmermann, 2000) was calculated with the “Dsquared” function of the “modEvA” package (Barbosa et al., 2013) and is presented in Supplementary Table 2, along with the equation of the best models.
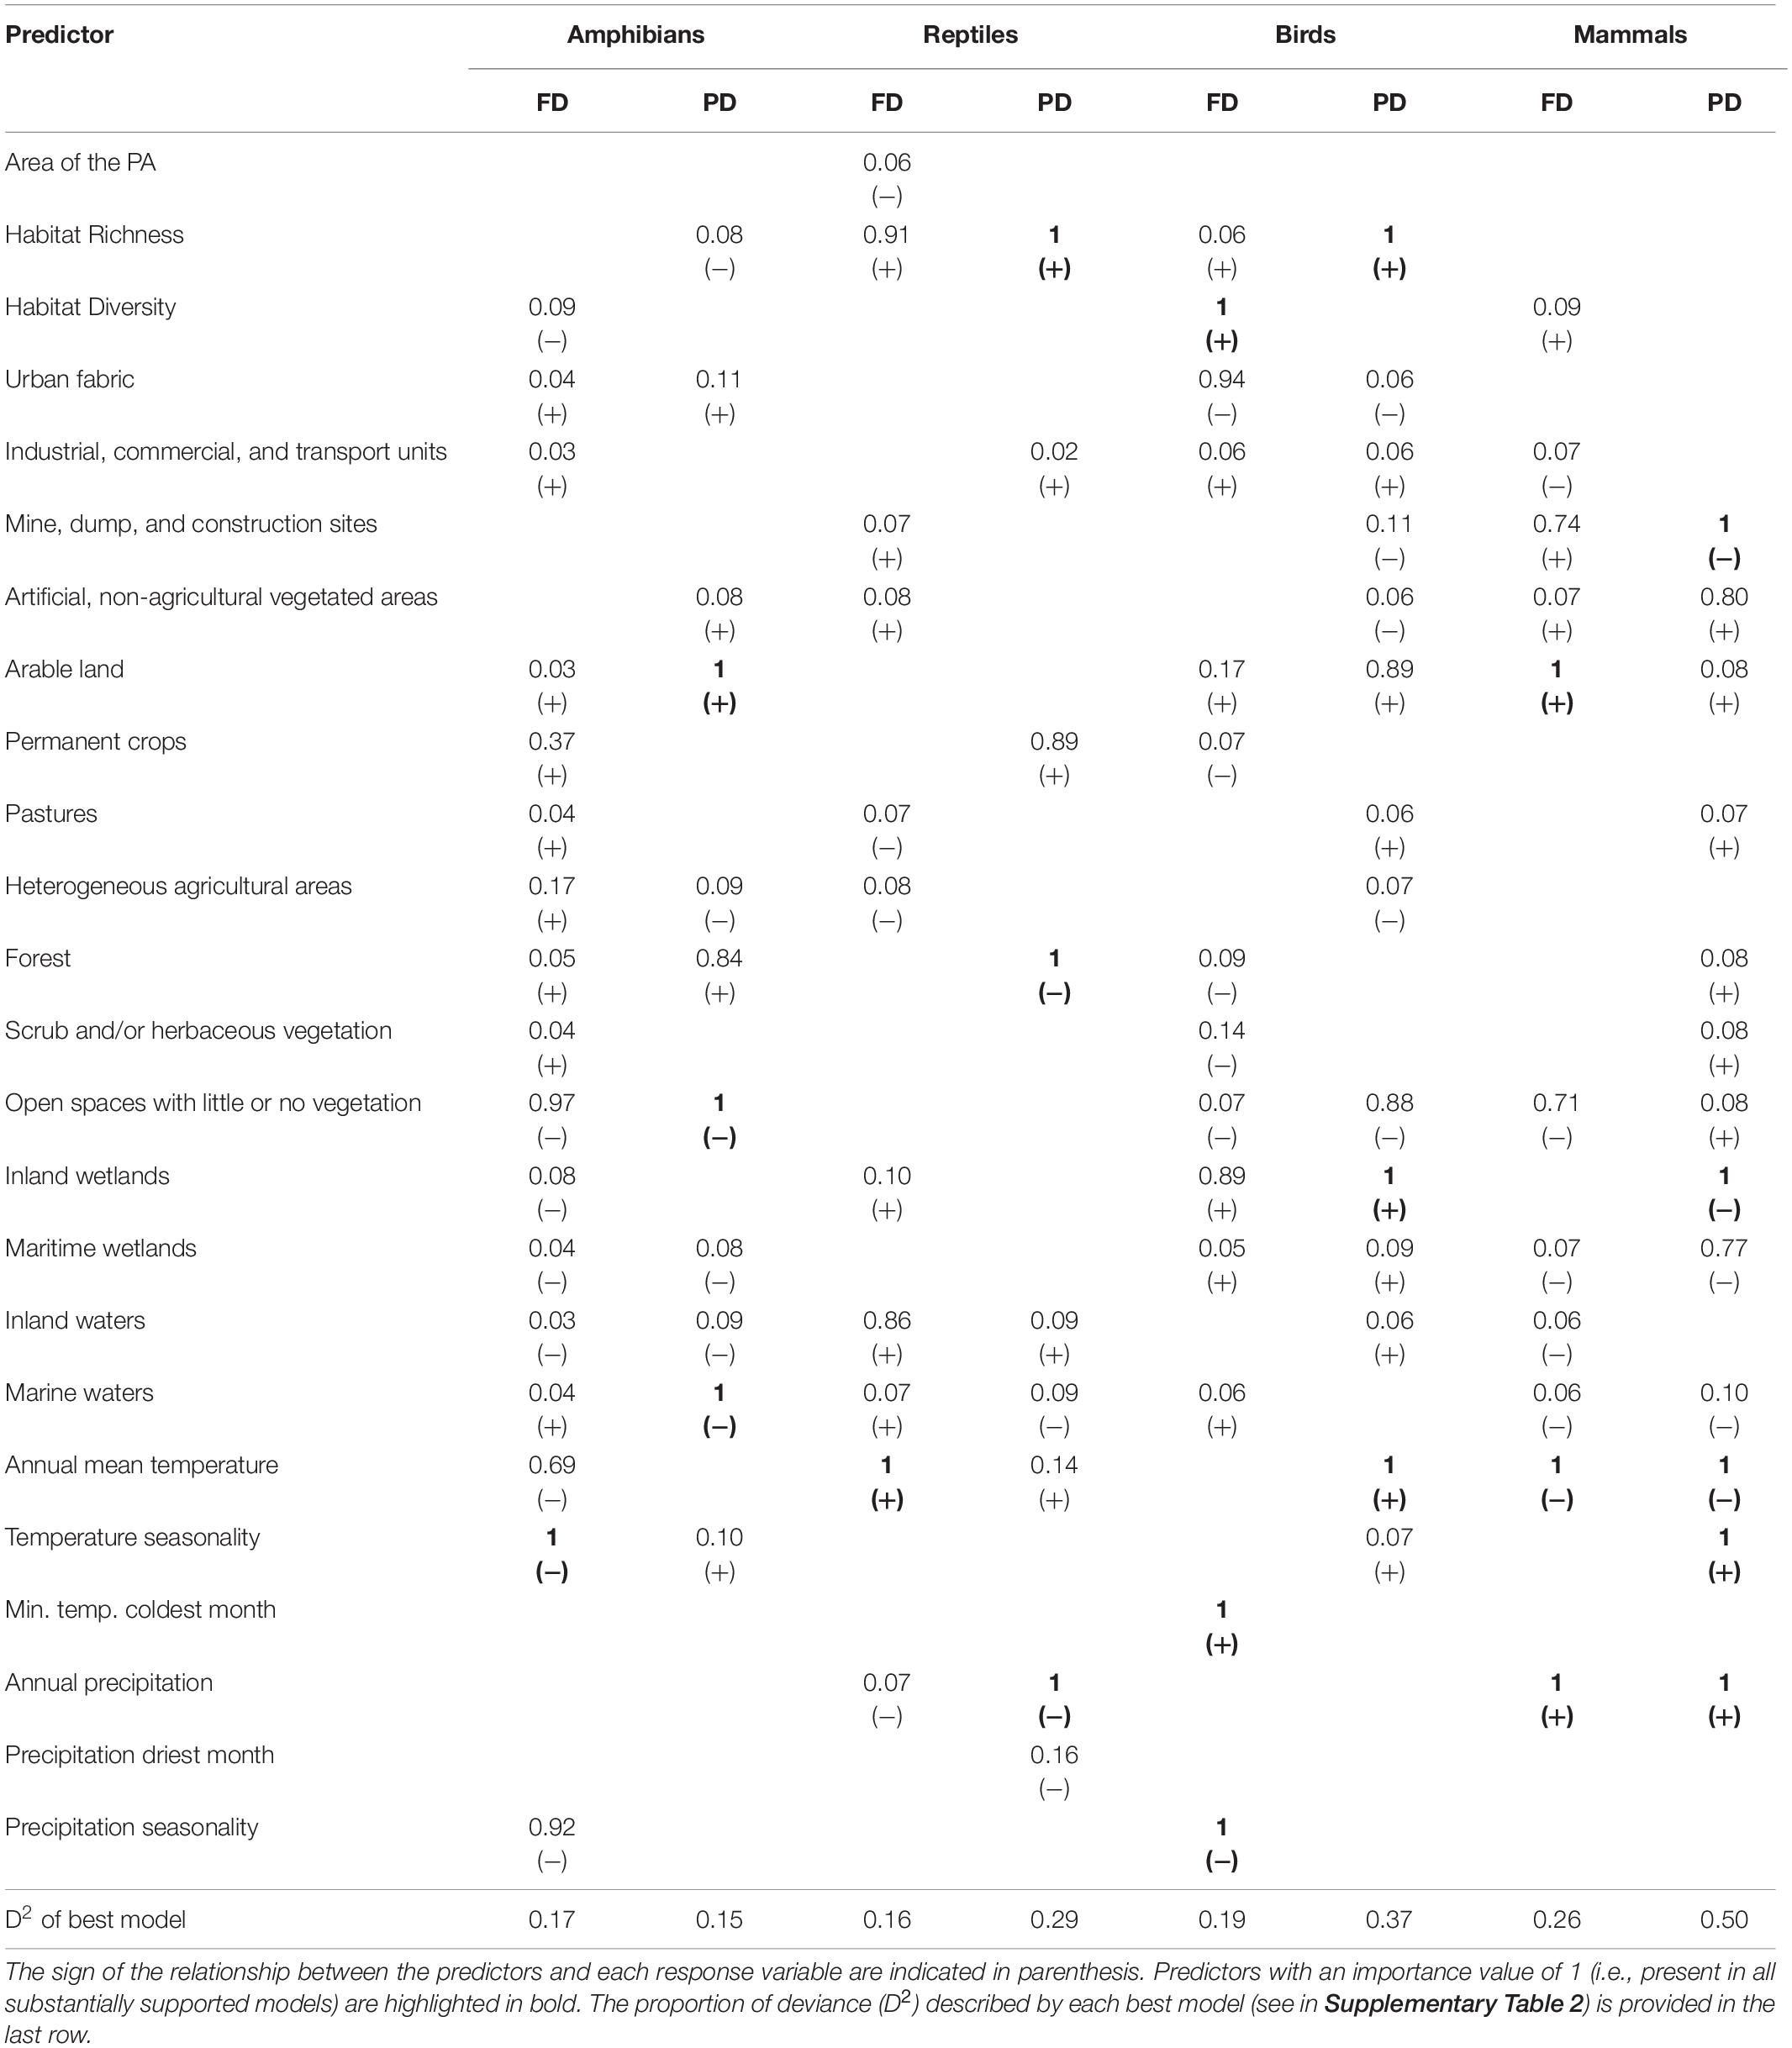
Table 2. Importance value of each predictor after the model averaging of the most substantially supported GLM models (i.e., with ΔAICc < 2) quantifying how well protected areas (PAs) represent the functional (FD) and phylogenetic (PD) regional diversities of four tetrapod groups (see Materials and Methods).
All statistical analyses were performed in R Version 1.0.136 (R Core Team, 2017). The R code used can be found in Supplementary Data Sheet 2).
Results
Amphibians’ functional and phylogenetic diversity of most PAs did not differ from the diversity of the regional pool (Figures 1A, 2A; see also Supplementary Figures 6A, 7A in Data Sheet 1). The exceptions are seven PAs from northern Iberia that presented significantly higher functional diversity than expected from the regional pool (i.e., with significantly positive SES.FD values), and one PA with significantly high phylogenetic diversity (i.e., with a significantly positive SES.PD value; see Figures 1A, 2A). Environmental GLM models for both functional and phylogenetic diversities were generally weak for this group (D2 = 0.17 and 0.15, respectively), but included a few environmental predictors with high importance values in each case. Related to this, our model selection procedure detected that SES.FD values tended to decrease in PAs presenting more seasonal climate (see Table 2). Moreover, SES.PD values tended to decrease in PAs with open spaces and scarce vegetation, and areas with marine waters, and to increase along with the cover of arable land. Regarding amphibian species proportions, more than half of the PAs (64 out of 113) contained at least 80% of the species present in the corresponding regional pools, of which 10 presented the same number of species as in the region where they stand (Supplementary Figure 8A in Data Sheet 1). Additionally, environmental predictors modeled did not explain the variability of amphibians species proportion (D2≈0 in the best model; see Supplementary Table 2).
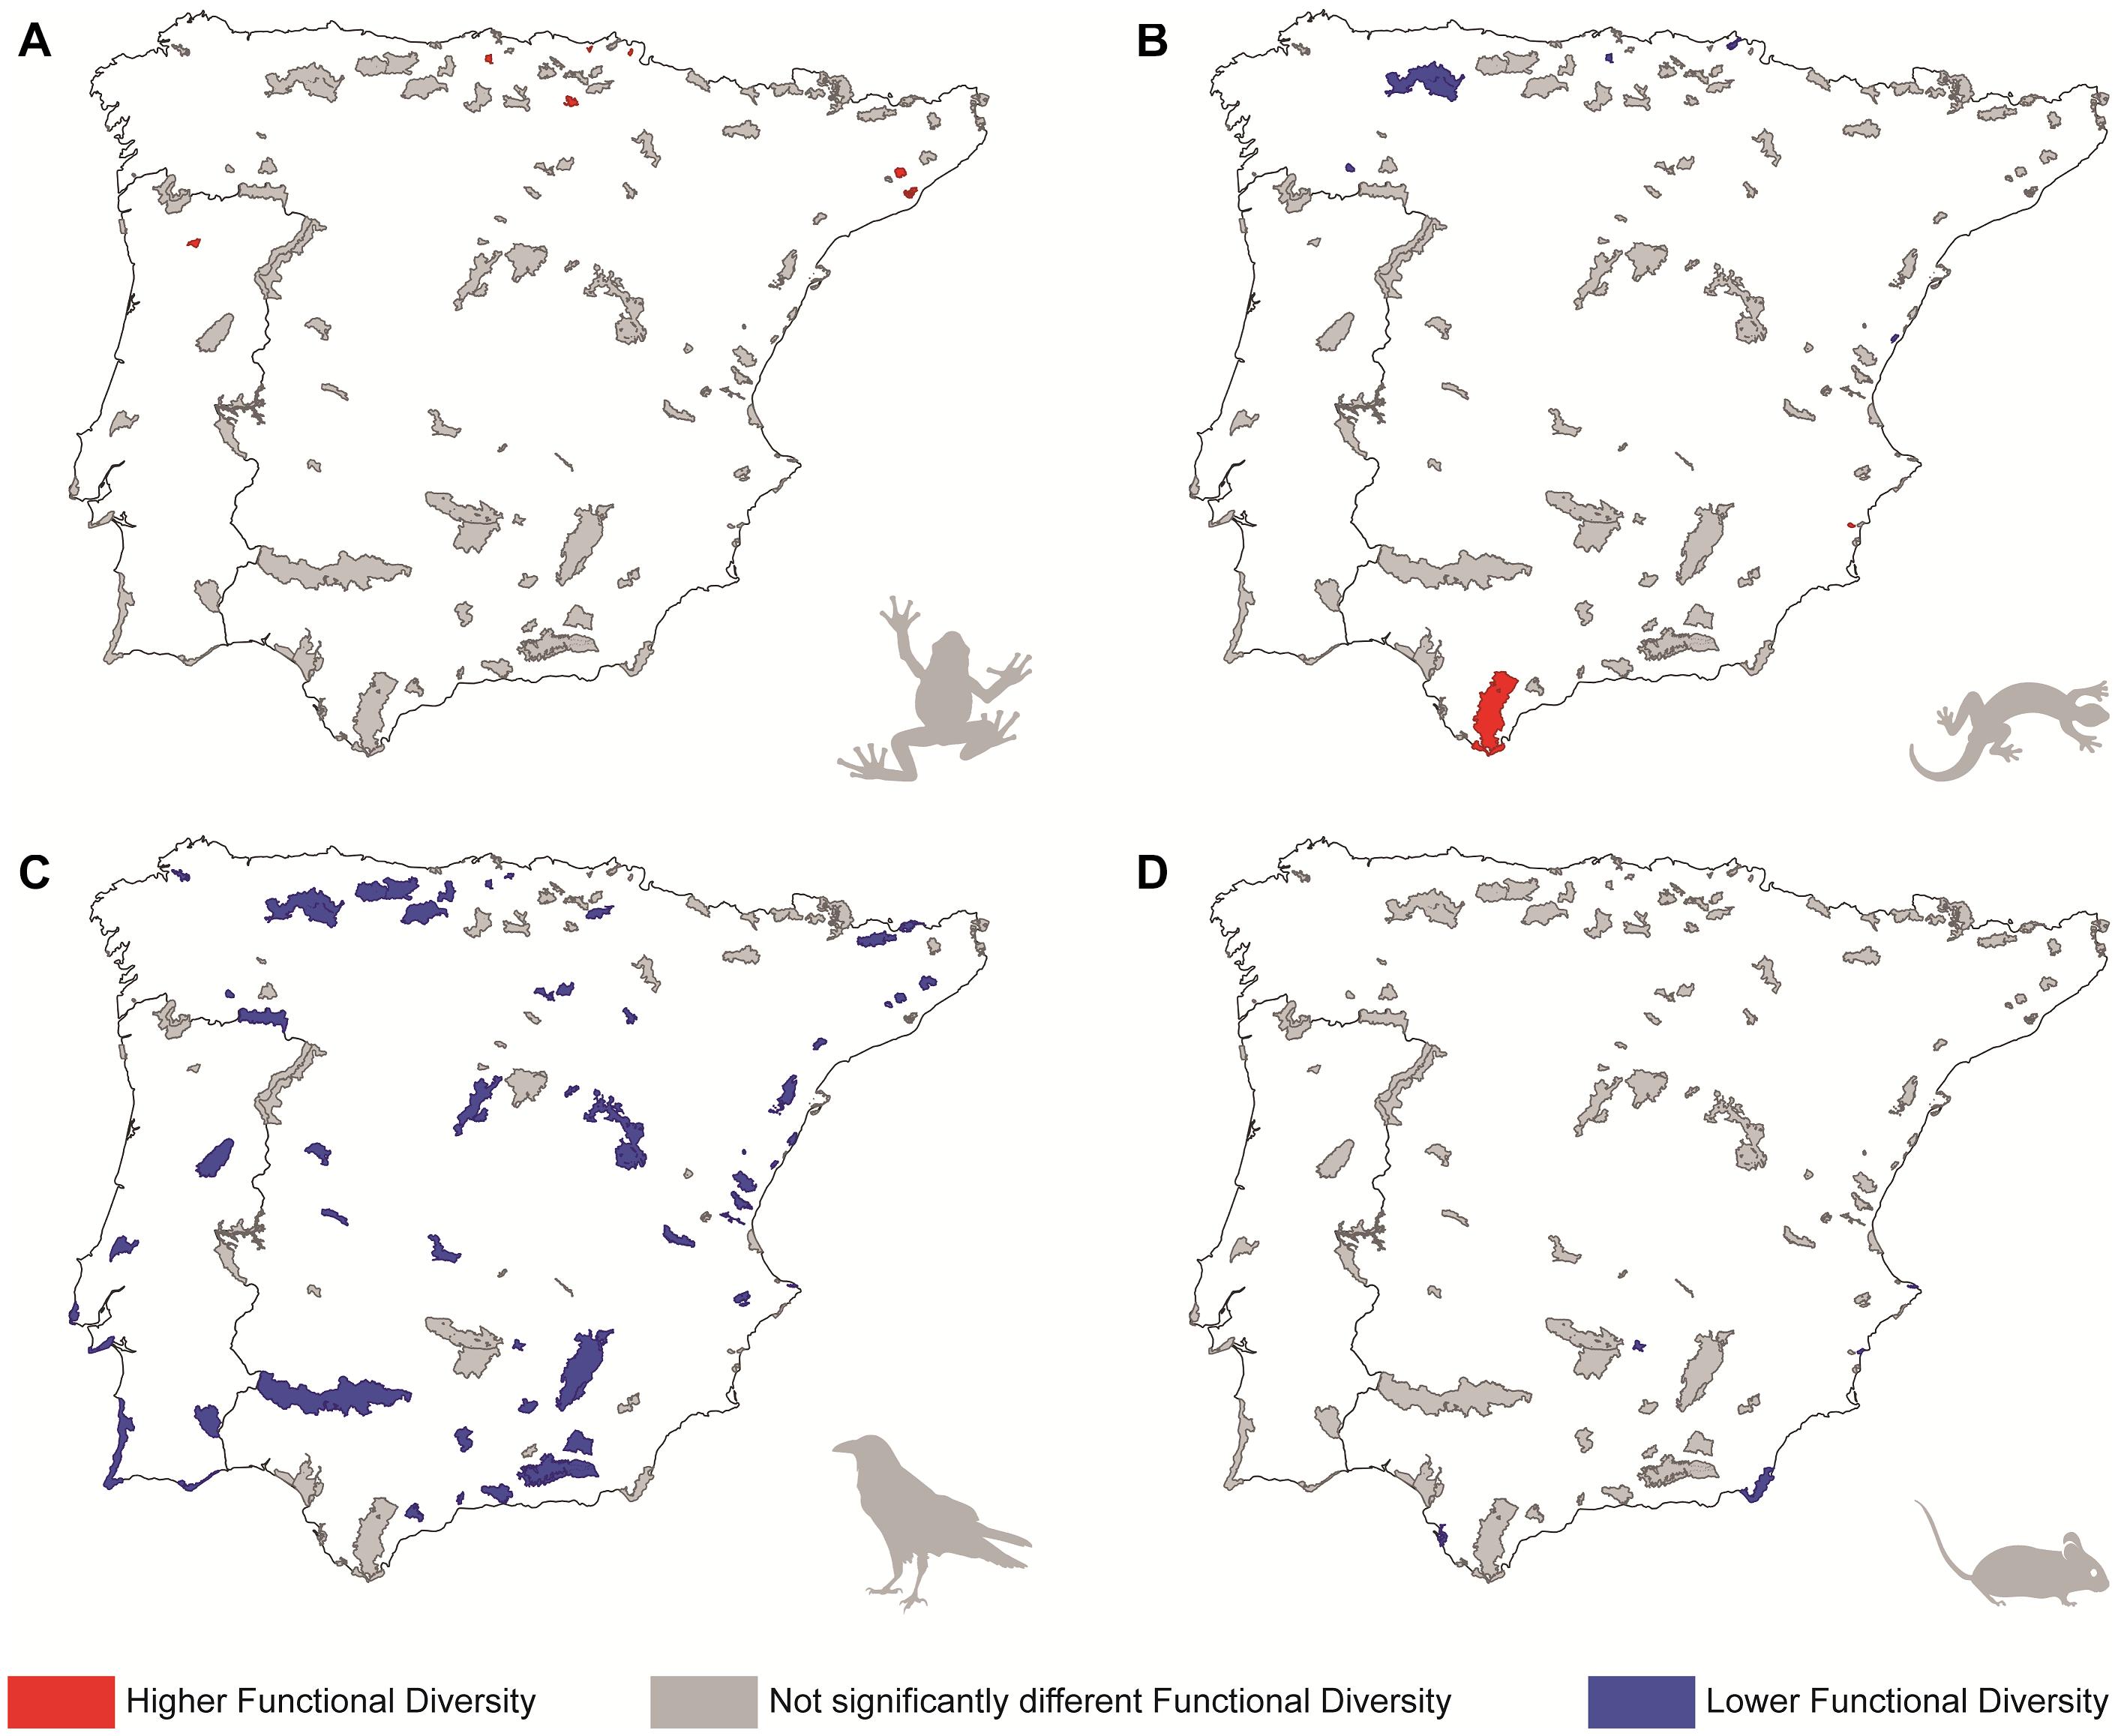
Figure 1. Representation of the protected areas according to the level of significance of the standardized effect sizes of functional diversity for different tetrapod groups: (A) amphibians, (B) reptiles, (C) birds, and (D) mammals. Colours indicate whether each protected area holds significantly higher (red) or lower (blue) functional diversity than it is expected from the region where it stands (an area designed placing its limits 50 km beyond the boundaries of the PA, including also the PA); parks in grey correspond to those where functional diversity does not differ from a random draw of species from the region where they stands (see main text for more details).
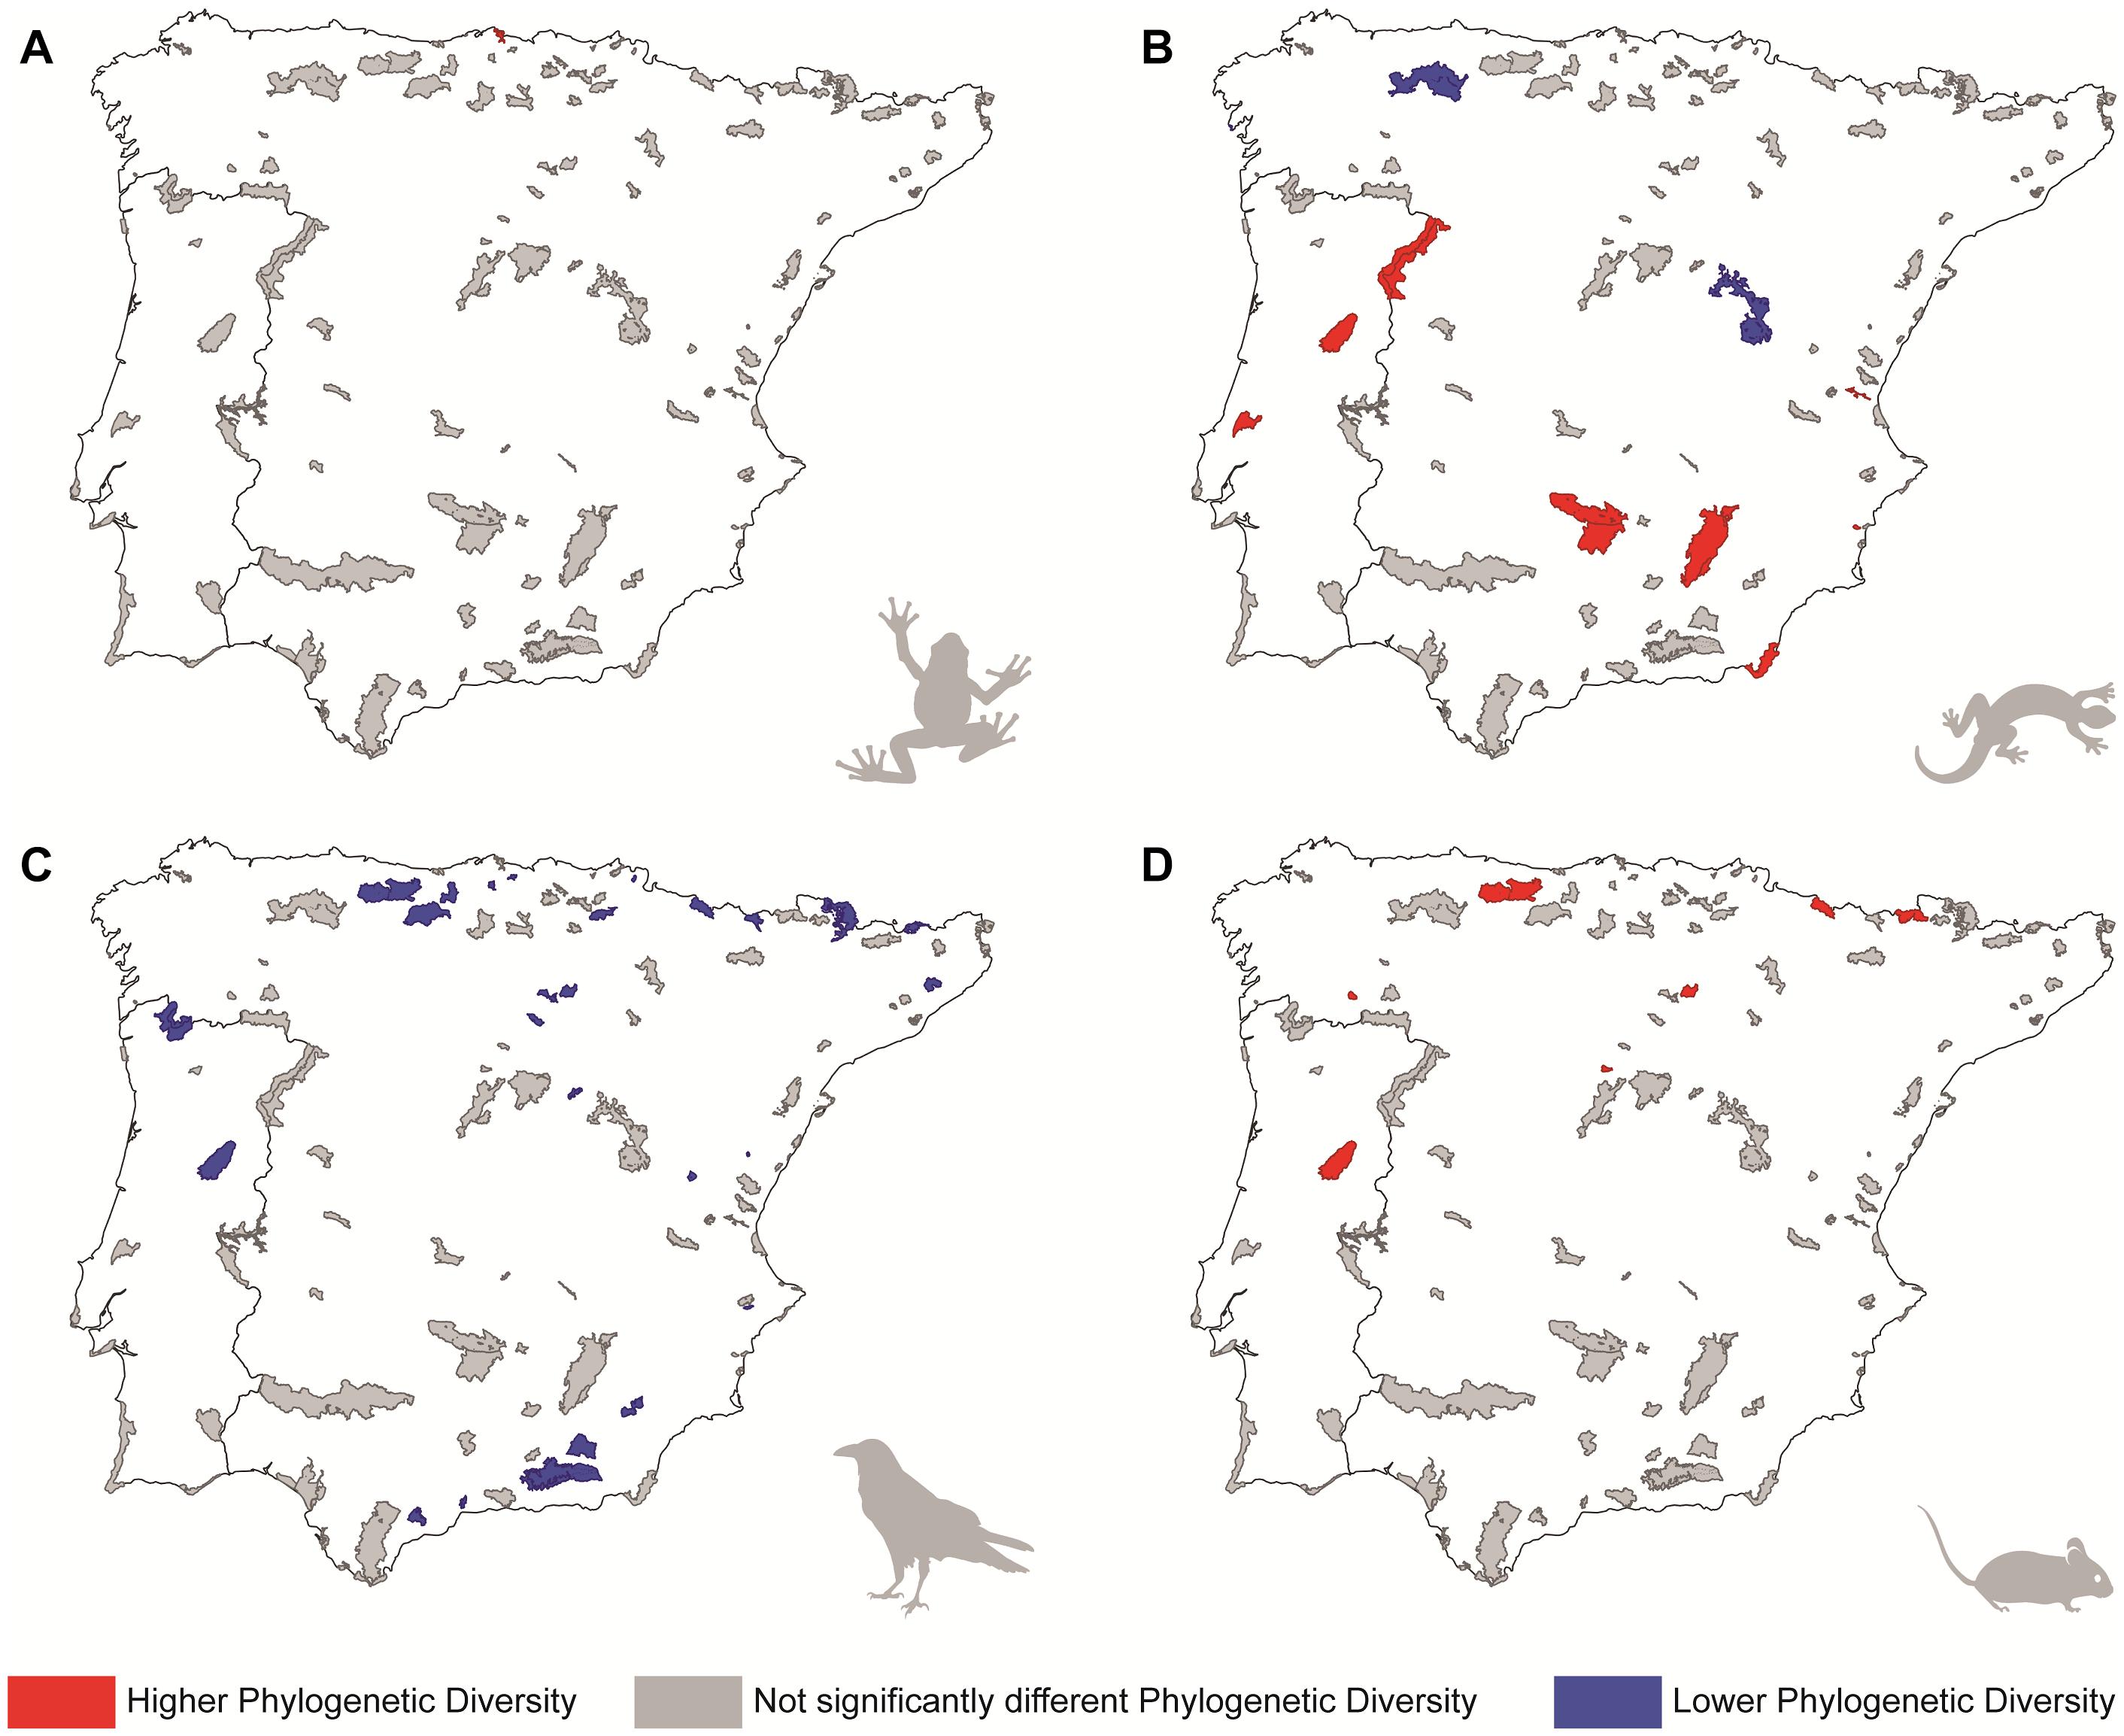
Figure 2. Representation of the protected areas according to the level of significance of the standardized effect sizes of phylogenetic diversity for different tetrapod groups: (A) amphibians, (B) reptiles, (C) birds, and (D) mammals. Colours indicate whether each protected area holds significantly higher (red) or lower (blue) phylogenetic diversity than it is expected from the region where it stands (an area designed placing its limits 50 km beyond the boundaries of the PA, including also the PA); parks in grey correspond to those where phylogenetic diversity does not differ from a random draw of species from the region where they stands (see main text for more details).
In the case of reptiles, again neither functional nor phylogenetic diversity of most PAs differed significantly from the regional pool (Figures 1B, 2B; see also Supplementary Figures 6B, 7B in Data Sheet 1). Only two PAs presented significantly high SES.FD values, while five PAs showed the opposite trend, having significantly lower SES.FD values than expected by chance from the regional pool (Figure 1B). On the other hand, eight PAs presented significantly high SES.PD values, while three PAs showed the inverse trend (Figure 2B). Environmental GLM models for reptiles explained more variation in SES.PD values (D2 = 0.29) than in SES.FD values (D2 = 0.16), a pattern also observed for birds and mammals (see Table 2). According to these models, SES.FD values tended to increase in PAs presenting high mean annual temperature, while SES.PD values were higher in habitat-rich PAs with reduced precipitation and scarce forest cover (variables which showed the highest importance values; see Table 2). Regarding reptile species proportions, only two PAs included all of the species present in the regional pool, and more than half of the PAs (66 out of 113) contained at least 75% of the regional taxonomic diversity (Supplementary Figure 8B in Data Sheet 1). As in the case of amphibians, we did not find a relationship between species proportion and the environmental predictors modeled (D2≈0 in the best model; Supplementary Table 2).
Contrary to other groups, birds exhibited lower functional and/or phylogenetic diversity than expected in their regional pool in a large number of PAs, or, in other words, they present significantly low SES.FD and/or SES.PD values (Figures 1C, 2C; see also Supplementary Figures 6C, 7C in Data Sheet 1). Specifically, 53 and 26 PAs showed significantly low SES.FD and SES.PD values, respectively. Among these PAs, 18 presented significantly low SES values for both facets of diversity (Figures 1C, 2C). Environmental GLM models for birds detected a trend for SES.FD values (D2 = 0.19) to increase in PAs with higher habitat diversity and winter temperatures, and reduced precipitation seasonality (variables showing the highest importance values; see Table 2), and for SES.PD values (D2 = 0.37) to increase in warmer habitat-rich PAs, with inland wetlands (Table 2). It is remarkable that the species proportion of birds in the PAs was the poorest of all groups investigated, with about half of the PAs studied (55) encompassing less than 65% of the regional bird diversity, and none having more that 85% of the species present in the regional pool (Supplementary Figure 8C in Data Sheet 1). Species proportion was also unrelated with the environmental variables considered (D2≈0 in all cases; Supplementary Table 2).
For mammals, we found once again a majority of PAs not differing from their regional pools in terms of functional and phylogenetic diversity (Figures 1D, 2D; see also Supplementary Figures 6D, 7D in Data Sheet 1). The exceptions in this case corresponded to five PAs that showed significantly low values of functional diversity and seven PAs which showed significantly high values of phylogenetic diversity (Figures 1D, 2D). Mammal models were the most explicative ones for each diversity facet (cf. D2 values in Table 2), which suggests a stronger influence of environmental factors on this group. In these models, both SES.FD and SES.PD values tended to increase at PAs with lower annual mean temperature and higher annual precipitation. Also, SES.FD values increased at PAs with more arable land, whereas SES.PD values increased at PAs with more temperature seasonality and decreased with the area occupied by inland wetlands and by mine, dump and construction sites within the PAs (Table 2). On the other hand, 65 PAs comprised over 75% of mammal species present in the regional pool, of which only two encompassed 100% of all regional species (Supplementary Figure 8D in Data Sheet 1). As for the rest of the considered groups, the species proportion of mammals was also unrelated with the environmental factors considered (D2< 0.05 in all cases; Supplementary Table 2).
Finally, it has to be noted that, across all tetrapod groups and GLMs evaluated, PAs area only appeared as a potentially relevant factor for reptile SES.FD values, and in this case with a very low importance value (0.06) (see Table 2). This reinforces the notion that the patterns we found were not artifacts due to area effects.
Discussion
The effectiveness of the Spanish and Portuguese networks of PAs for safeguarding biodiversity has been evaluated several times through different approaches (e.g., Araújo, 1999; Carrascal et al., 2003; Araújo et al., 2007; Hernández-Manrique et al., 2012; Villamor and Becerro, 2012; Guilhaumon et al., 2015; Hermoso et al., 2015; Rosso et al., 2018; Estrada and Real, 2018; Rodríguez-Rodríguez and Martínez-Vega, 2018). Yet, the ability of each area to represent functional and phylogenetic diversity components of the regional pool remained unknown. Here, we found that, except for birds, Iberian national and natural parks are generally adequate, and in some exceptional cases even optimal (i.e., better than expected by chance) representations of the regional functional and phylogenetic diversities. Iberian PAs also generally preserve a high proportion of the regional species richness. These results complement previous findings indicating that, overall, the existent network of PAs in this area adequately represents diversity for some taxonomic groups (e.g., Araújo et al., 2007; Rosso et al., 2018), although this does not necessarily hold for all the groups evaluated so far (e.g., Araújo et al., 2007; Sánchez-Fernández et al., 2008; Hernández-Manrique et al., 2012; Hermoso et al., 2015).
Previous studies focusing on European PAs showed that these achieve a significant representation of functional distinctive amphibian diversity (Thuiller et al., 2015). These results are in line with our findings, as the functional diversity of most PAs did not differ from that of the regional pool, and seven PAs located in northern Iberia even presented higher functional diversity than expected from the regional pool. Interestingly, some of these PAs match the main hotspots of amphibian richness of this region (Rey-Benayas and de la Montaña, 2003; Martins et al., 2014). As most amphibians are highly dependent on humid habitats to complete their reproductive cycle (Arnold and Burton, 1982; Vences and Köhler, 2007; da Silva et al., 2012), it is likely that the generally wetter climate of northern Iberia, which is maintained throughout the year, favors a functionally diverse amphibian fauna (Rey-Benayas and de la Montaña, 2003; Martins et al., 2014), a notion also supported by the decrease we found in amphibian’s functional diversity within the PAs presenting higher climatic seasonality in comparison with PAs with lower climatic variation. Thus, PAs located in the north of the peninsula could be acting as essential refuges for Iberian amphibian species, where they have found the ideal conditions for maintaining high levels of functional diversity. On the other hand, amphibian diversity seems to be affected by the kind of habitats present in the PA, which usually differ from those occurring outside the PA’s boundaries (see Supplementary Appendix 2 in Data Sheet 1). Protected areas dominated by open, scarcely vegetated surfaces showed lower amphibian phylogenetic diversity, possibly because desiccation and temperature are typically higher in bare soils (Kleidon et al., 2000), which may deem these areas inhabitable for many lineages. A similar negative association occurred between phylogenetic diversity and marine waters, likely because amphibians rely on freshwater for survival. By contrast, PAs with larger arable lands showed higher values of phylogenetic diversity, which was unsurprising as agricultural lands are regularly used by amphibians, some even in areas with high-intensity crop cover (Koumaris and Fahrig, 2016; Collins and Fahrig, 2017), particularly when artificial agricultural ponds are present and become alternative breeding sites for these species (Knutson et al., 2004). Finally, regarding species proportions, previous studies showed that amphibians are particularly underrepresented in PAs, both in Europe (Lobo and Araújo, 2003; Abellán and Sánchez-Fernández, 2015; see also Araújo et al., 2007) and at a global scale (Nori et al., 2015). This contrasts with our findings, as the Iberian PAs are safeguarding a large proportion of the species found in the region where they stand.
Existing evidence suggests that reptiles are underrepresented in protected areas of the Iberian Peninsula (Araújo et al., 2007; Carvalho et al., 2011, 2017), and also of Europe (Abellán and Sánchez-Fernández, 2015; Thuiller et al., 2015). Still, we found that the functional and phylogenetic diversity of reptiles in most PAs does not differ from the adjacent region, indicating that regional diversity is well captured in the current network of natural and national parks. Note, however, that previous studies have focused on evaluating the effectiveness of the overall Iberian PAs network, and not the regional representativeness of each PA individually, so our results do not necessarily contradict previous findings, as regional diversity could be simply low, and the PAs could just be mirroring such low diversity. Protected areas hosting high habitat richness tend to be associated with reptiles’ phylogenetic overrepresentation. Also, PAs presenting lower annual temperatures and higher precipitation levels showed a tendency toward an underrepresentation of functional and phylogenetic diversities, respectively. This could be related with reptiles’ ectothermy and their need for sunlight and heat to regulate body temperature and increase metabolic rates (Clarke and Gaston, 2006; Salvador, 2014), which could also explain the trend of reptile phylogenetic diversity to be underrepresented in PAs with larger shaded forest habitats. Finally, our results show that the species composition harbored by most of the PAs reflects a large proportion of the regional reptile species richness, although the results found by Araújo et al. (2007), and by Lobo and Araújo (2003) suggest that the current locations of Iberian PAs do not capture the hotspots of Iberian reptile’s species richness.
In the case of mammals, we have found that Iberian PAs are generally adequate representations of their regional functional and phylogenetic diversity. Interestingly, although Brum et al. (2017) concluded that the current PAs global network does not adequately represent the different facets of mammalian biodiversity and advocated for its expansion, these authors did not included Iberia among the high priority regions, which is in line with our findings. However, although the climatic characteristics within the PAs did not differ significantly from the regions where they are located (see Supplementary Appendix 2 in Data Sheet 1), our results showed that both diversity facets were influenced by the climatic conditions found within the PA’s boundaries. These results agree with the findings of Santos et al. (2020), who concluded that current climate strongly affects both functional and phylogenetic diversity gradients of European mammals. Particularly, we found a tendency for higher functional and phylogenetic diversity than expected from the regional pool in PAs with high annual precipitations and low annual mean temperature. Small mammals and rodents are the most common groups of this taxonomic group in Iberia, and they usually prefer temperate, moist and rainy habitats since their basic diet components (insects and herbaceous plants) proliferate throughout the year in these areas (Vickery and Rivest, 1992; Milstead et al., 2007; Hsu et al., 2012); therefore, PAs with very warm and arid climates could be harboring species with similar traits or lineages which are adapted to survive under these climatic conditions. Conversely, PAs with larger areas covered with inland wetlands and mine, dump and construction sites showed a tendency toward an underrepresentation of phylogenetic diversity, which is not unexpected because these habitats are extremely hostile for most terrestrial mammals where only a reduced number of species can survive (Ardente et al., 2016; Lawer et al., 2019). We found higher functional diversity of mammals than expected from the regional pool in PAs with larger areas covered by arable lands, which could be due to the presence of generalist species that are known to thrive in agricultural landscapes (Dotta and Verdade, 2011; Magioli et al., 2016). Also, taxonomic-based assessment of mammal diversity indicates that this group is fairly represented in Iberian PAs (Araújo et al., 2007) and in Natura 2000 Network (Rosso et al., 2018), which is much in line with our findings (more than half of PAs host at least the 75% of mammal species from their region).
Different from other groups, bird functional and phylogenetic diversities were underrepresented in a large number of the Iberian PAs, which agrees with the findings of other studies conducted at different scales. Pollock et al. (2017) concluded that both functional and phylogenetic diversity of birds are poorly represented in protected areas worldwide because the design of these areas was based on optimizing taxonomic diversity, which is an inefficient conservation solution for other diversity facets. Zupan et al. (2014) also reported incongruences between hotspots of birds’ phylogenetic diversity and European PAs, which despite their effectiveness in preserving high species numbers might hold low phylogenetic diversity due to low extinction rates and recent events of higher diversification affecting only some clades. At smaller scales, Devictor et al. (2010) found a mismatch between the location of French PAs and the distribution of functional diversity, which appears underrepresented in comparison with taxonomic diversity. In the Iberian Peninsula, birds are the most diverse tetrapod group, comprising many habitat specialist species (Cramp et al., 2004) (e.g., Ardea purpurea or Podiceps cristatus in wetlands, and Tetrax tetrax in crop steppes). Indeed, our results indicate that PAs with high habitat diversity and richness favor the presence of functional and phylogenetic diverse bird communities, respectively. Therefore, PAs highly dominated by a particular habitat type, that might in turn be missing outside the PA’s limits (see Supplementary Appendix 2 in Data Sheet 1), are expected to harbor a reduced portion of the regional functional and phylogenetic spectrum. That could also explain the slightly lower proportion of regional bird species in the PAs when compared with other taxonomic groups. It is noteworthy that PAs including larger areas of inland wetlands correspond to those with higher representation of regional phylogenetic diversity, a result that complements the findings of Brazner and MacKinnon (2020), who identified northern Europe wetlands as hotspots of bird diversity. Our results also indicate that climate conditions influence functional and phylogenetic diversity (note that climatic characteristics within the PAs did not differ from those of the regions where they are located; see Supplementary Appendix 2 in Data Sheet 1), a result that is in line with Ferger et al. (2014), who concluded that temperature and precipitation strongly affect species richness of birds, having temperature the strongest overall effect on bird richness. However, our results do not necessarily indicate that PAs are inefficiently protecting species that are important targets in conservation programs. Rather, they indicate that PAs are safeguarding species that are functional and/or phylogenetically close (e.g., habitat specialist species) or that belong to a particular guild (Duckworth and Altwegg, 2018), thus diverging from presumably generalist species that may occur outside the PAs. Therefore, if we are to achieve a high representation in the PAs of the regional functional and phylogenetic diversity, then it might be necessary to expand the current PAs in order to increase the amount of habitat heterogeneity under protection.
On the other hand, as commented above, the proportion of regional species hosted in each PA is generally not related to any of the predictors considered, i.e., habitat diversity, habitat type, climate, or the area of the PA itself. This can be indicating that other predictors different from those considered in this study could be causing such patterns. Future studies should explore the determinants of these surprising results.
In summary, while the current network of Iberian national and natural parks generally reflects regional functional, phylogenetic and taxonomic diversity of amphibians, reptiles and mammals, birds’ regional diversity is underrepresented in several PAs. These results are somewhat unexpected, considering that the definition of these PAs has mainly been done ad hoc (Araújo et al., 2007), and that previous studies in general reported a misrepresentation of species diversity in Iberian PAs. Also, we found a very limited overrepresentation of the regional pool diversity within the parks, indicating that PAs are not hotspots of the overall regional diversity, although they might be acting as refuges for particular species, providing more suitable conditions than the surrounding region and safeguarding population declines driven by human impacts. In the long-term, the persistence of these PAs could allow them to act as refugia (sensu Keppel et al., 2012, 2018), as they could serve as retreats for biotas when conditions are unfavourable in the surrounding areas, and then act as sources of recolonization once suitable conditions are restored. Future studies should focus on other types of protected areas (e.g., Natura 2000), including those established specifically to preserve birds (i.e., Special Protection Areas for Birds, ZEPAs acronym in Spain), which were not considered in this study. Such future developments should also be complemented with the identification of hotspots of functional and phylogenetic diversity, and an evaluation of whether these can be preserved by the current PAs network. Finally, considering the ongoing and future effects of climate change, future research should also focus on the importance of PAs for biodiversity preservation in the long-term. Therefore, it is necessary to identify which geographical areas are in fact acting as biodiversity refugia, and where are the regions that will host suitable climatic conditions in the future. This knowledge will allow us to evaluate whether there is a spatial match between such areas and the current network of PAs, and eventually propose the design of new PAs that will assure the maintenance of biodiversity under the current scenario of global change.
Data Availability Statement
The original contributions presented in the study, as well as datasets and R code generated, are included in the Supplementary Material; further inquiries can be directed to the corresponding author.
Author Contributions
SL-C, MÁR, and AMCS conceived the ideas. SL-C and AMB compiled the distribution database. SL-C and SBC compiled the trait data. RM-V and SBC built the phylogenies. SL-C, AMCS, and AMB analyzed the data. SL-C and AMCS wrote the manuscript with the help from all the authors. All authors contributed to the article and approved the submitted version.
Funding
This research was partially supported by the MINECO (Ministerio de Economía y Competitividad, Spain; project “Bioregionalization, graph theory and simulated worlds: revisiting foundational goals of biogeography with 21st century tools”- CGL2017-86926-P), by the Universidad de Alcalá (project CCG2016/BIO-018), and by the Fundação para a Ciência e Tecnologia (project PTDC/BIA-BIC/3545/2014), supported by the Norte Portugal Regional Operational Programme (NORTE 2020), under the PORTUGAL 2020 Partnership Agreement, through the European Regional Development Fund (ERDF).
SL-C was supported by the Universidad de Alcalá grant “Initiation to Research Activity”. RM-V was supported by the TALENTO program of the Regional Government of the Community of Madrid (2018-T2/AMB-10332). SBC was supported by National funds by FCT (Foundation for Science and Technology), through the individual scientific employment program-contract (CEECIND/01464/2017). AMCS was supported by a “Juan de la Cierva” Fellowship (IJCI-2014-19502) funded by the current Spanish ‘Ministerio de Ciencia y Innovación”.
Conflict of Interest
The authors declare that the research was conducted in the absence of any commercial or financial relationships that could be construed as a potential conflict of interest.
Publisher’s Note
All claims expressed in this article are solely those of the authors and do not necessarily represent those of their affiliated organizations, or those of the publisher, the editors and the reviewers. Any product that may be evaluated in this article, or claim that may be made by its manufacturer, is not guaranteed or endorsed by the publisher.
Acknowledgments
We thank Alberto Jiménez-Valverde and Salvador Carranza for providing feedback on the statistical analyses and Ana Paula Portela for assisting with data collection.
Supplementary Material
The Supplementary Material for this article can be found online at: https://www.frontiersin.org/articles/10.3389/fevo.2021.634653/full#supplementary-material
References
Abellán, P., and Sánchez-Fernández, D. (2015). A gap analysis comparing the effectiveness of Natura 2000 and national protected area networks in representing European amphibians and reptiles. Biodivers. Conserv. 24, 1377–1390. doi: 10.1007/s10531-015-0862-3
Akaike, H. (1973). “Information theory and an extension of the maximum likelihood principle,” in Proceeding of the 2nd International Symposium on Information Theory, eds B. N. Petrovand and F. Caski (Budapest: Akadémiai Kiadó), 267–281.
Allan, J. R., Watson, J. E. M., Di Marco, M., O’Bryan, C. J., Possingham, H. P., Atkinson, S. C., et al. (2019). Hotspots of human impact on threatened terrestrial vertebrates. PLoS Biol. 17:e3000158. doi: 10.1371/journal.pbio.3000598
Allen, J. M., Germain-Aubrey, C. C., Barve, N., Neubig, K. M., Majure, L. C., Laffan, S. W., et al. (2019). Spatial phylogenetics of Florida vascular plants: the effects of calibration and uncertainty on diversity estimates. iScience 11, 57–70. doi: 10.1016/j.isci.2018.12.002
Araújo, M. B. (1999). Distribution patterns of biodiversity and the design of a representative reserve network in Portugal. Divers. Distrib. 5, 151–163. doi: 10.1046/j.1472-4642.1999.00052.x
Araújo, M. B., Lobo, J. M., and Moreno, J. C. (2007). The effectiveness of Iberian protected areas in conserving terrestrial biodiversity. Conserv. Biol. 21, 1423–1432. doi: 10.1111/j.1523-1739.2007.00827.x
Ardente, N. C., Ferreguetti, Á. C., Gettinger, D., Leal, P., Mendes-Oliveira, A. C., Martins-Hatano, F., et al. (2016). Diversity and impacts of mining on the non-volant small mammal communities of two vegetation types in the Brazilian Amazon. PLoS One 11:e0167266. doi: 10.1371/journal.pone.0167266
Arnold, E. N., and Burton, J. A. (1982). Guía de Campo de Los Reptiles y Anfibios de España y Europa. Barcelona: Omega Editoriales.
Aulagnier, S. (2009). Guía de Los Mamíferos de Europa, del Norte de África y de Oriente Medio. Bellaterra: Lynx.
Barak, R. S., Hipp, A. L., Cavender-Bares, J., Pearse, W. D., Hotchkiss, S. C., Lynch, E. A., et al. (2016). Taking the long view: integrating recorded, archeological, paleoecological, and evolutionary data into ecological restoration. Int. J. Plant Sci. 177, 90–102. doi: 10.1086/683394
Barbosa, A. M. (2015). fuzzySim: applying fuzzy logic to binary similarity indices in ecology. Meths. Ecol. Evol. 6, 853–858. doi: 10.1111/2041-210x.12372
Barbosa, A. M., Real, R., Muñoz, A. R., and Brown, J. A. (2013). New measures for assessing model equilibrium and prediction mismatch in species distribution models. Div. Distrib. 19, 1333–1338. doi: 10.1111/ddi.12100
Barnosky, A. D., Matzke, N., Tomiya, S., Wogan, G. O. U., Swartz, B., Quental, T. B., et al. (2011). Has the Earth’s sixth mass extinction already arrived? Nature 471, 51–57. doi: 10.1038/nature09678
Bencatel, J., Álvares, F., Moura, A. E., and Barbosa, A. M. (2017). Atlas de Mamíferos de Portugal. Évora: Universidade de Évora.
Brazner, J., and MacKinnon, F. (2020). Relative conservation value of Nova Scotia’s forests: forested wetlands as avian diversity hotspots. Can. J. For. Res. 50, 1307–1322.
Brooks, T. M., Mittermeier, R. A., Da Fonseca, G. A. B., Gerlach, J., Hoffmann, M., Lamoreux, J. F., et al. (2006). Global biodiversity conservation priorities. Science 313, 58–61. doi: 10.1126/science.1127609
Brum, F., Graham, C., Costa, G., Hedges, S., Penone, C., Radeloff, V., et al. (2017). Global priorities for conservation across multiple dimensions of mammalian diversity. Proc. Natl. Acad. Sci. U.S.A. 114, 7641–7646. doi: 10.1073/pnas.1706461114
Calcagno, V., and de Mazancourt, C. (2010). glmulti: an R Package foreasy automated model selection with (generalized) linear models. J. Stat. Softw. 34, 1–29. doi: 10.18637/jss.v034.i12
Carmona, C. P., Tamme, R., Partel, M., de Bello, F., Brosse, S., Capdevila, P., et al. (2021). Erosion of global functional diversity across the tree of life. Sci. Adv. 7:eabf2675. doi: 10.1126/sciadv.abf2675
Carrascal, L. M., Lobo, J. M., and Martí, R. (2003). “Respuestas a viejas preguntas con nuevos datos: estudio de los patrones de distribución de la avifauna española y consecuencias para su conservación,” in Atlas de las Aves Reproductoras de España, ed. J. C. del Moral (Madrid: Ministerio de Medio Ambiente), 651–668.
Carvalho, S., Velo-Anton, G., Tarroso, P., Portela, A., Barata, M., Carranza, S., et al. (2017). Spatial conservation prioritization of biodiversity spanning the evolutionary continuum. Nat. Ecol. Evol. 1:0151. doi: 10.1038/s41559-017-0151
Carvalho, S. B., Brito, J. C., Crespo, E. G., Watts, M. E., and Possingham, H. P. (2011). Conservation planning under climate change: toward accounting for uncertainty in predicted species distributions to increase confidence in conservation investments in space and time. Biol. Conserv. 144, 2020–2030. doi: 10.1016/j.biocon.2011.04.024
Ceballos, G., Ehrlich, P. R., and Raven, P. H. (2020). Vertebrates on the brink as indicators of biological annihilation and the sixth mass extinction. Proc. Natl. Acad. Sci. U.S.A. 117, 13596–13602. doi: 10.1073/pnas.1922686117
Clarke, A., and Gaston, K. J. (2006). Climate, energy and diversity. Proc. R. Soc. B. 273, 2257–2266. doi: 10.1098/rspb.2006.3545
Collins, S. J., and Fahrig, L. (2017). Responses of anurans to composition and configuration of agricultural landscapes. Agric. Ecosyst. Environ. 239, 399–409. doi: 10.1016/j.agee.2016.12.038
CORINE Land Cover (2019). Cartography. Available online at: https://land.copernicus.eu/pan-european/corine-land-cover (Accessed September 2019, 26).
Cramp, S., Simmons, K. E. L., and Perrins, C. M. (2004). Handbook of the Birds of Europe, the Middle East and North Africa, Vol. 1-9. Oxford: Oxford University Press.
da Silva, F. R., Almeida-Neto, M., do Prado, V. H. M., Haddad, C. F. B., and de Cerqueira Rossa-Feres, D. (2012). Humidity levels drive reproductive modes and phylogenetic diversity of amphibians in the Brazilian Atlantic Forest. J. Biogeogr. 39, 1720–1732. doi: 10.1111/j.1365-2699.2012.02726.x
Davidson, A. D., Shoemaker, K. T., Weinstein, B., Costa, G. C., Brooks, T. M., Ceballos, G., et al. (2017). Geography of current and future global mammal extinction risk. PLoS One 12:e0186934. doi: 10.1371/journal.pone.0186934
Devictor, V., Mouillot, D., Meynard, C., Jiguet, F., Thuiller, W., and Mouquet, N. (2010). Spatial mismatch and congruence between taxonomic, phylogenetic and functional diversity: the need for integrative conservation strategies in a changing world. Ecol. Lett. 13, 1030–1040. doi: 10.1111/j.1461-0248.2010.01493.x
Díaz, S., and Cabido, M. (2001). Vive la différence: plant functional diversity matters to ecosystem processes. Trends Ecol. Evol. 16, 646–655. doi: 10.1016/S0169-5347(01)02283-2
Díaz, S., Lavorel, S., Bello, F. D., Quétier, F., Grigulis, K., and Robson, T. M. (2007). Incorporating plant functional diversity effects in ecosystem service assessments. Proc. Natl. Acad. Sci. U.S.A. 104, 20684–20689. doi: 10.1073/pnas.0704716104
Díaz, S., Purvis, A., Cornelissen, J. H. C., Mace, G. M., Donoghue, M. J., Ewers, R. M., et al. (2013). Functional traits, the phylogeny of function, and ecosystem service vulnerability. Ecol. Evol. 3, 2958–2975. doi: 10.1002/ece3.601
Dotta, G., and Verdade, L. M. (2011). Medium to large-sized mammals in agricultural landscapes of south-eastern Brazil. Mammalia 75, 345–352. doi: 10.1515/mamm.2011.049
Dray, S., and Dufour, A. B. (2007). The ade4 package: implementing the duality diagram for ecologists. J. Stat. Softw. 22, 1–20. doi: 10.18637/jss.v022.i04
Duckworth, G. D., and Altwegg, R. (2018). Effectiveness of protected areas for bird conservation depends on guild. Divers. Distrib. 24, 1083–1091. doi: 10.1111/ddi.12756
Estrada, A., and Real, R. (2018). Assessment of the National Park network of mainland Spain by the Insecurity Index of vertebrate species. PLoS One 13:e0197496. doi: 10.1371/journal.pone.0197496
Faith, D. P. (1992). Conservation evaluation and phylogenetic diversity. Biol. Conserv. 61, 1–10. doi: 10.1016/0006-3207(92)91201-3
Fauth, J. E., Bernardo, J., Camara, M., Resetarits, W. J., Van Buskirk, J., and McCollum, S. A. (1996). Simplifying the jargon of community ecology: a conceptual approach. Am. Nat. 147, 282–286.
Ferger, S. W., Schleuning, M., Hemp, A., Howell, K. M., and Böhning-Gaese, K. (2014). Food resources and vegetation structure mediate climatic effects on species richness of birds. Glob. Ecol. Biogeograph. 23, 541–549. doi: 10.1111/geb.12151
Flynn, D. F., Mirotchnick, N., Jain, M., Palmer, M. I., and Naeem, S. (2011). Functional and phylogenetic diversity as predictors of biodiversity–ecosystem-function relationships. Ecology 92, 1573–1581. doi: 10.1890/10-1245.1
Franke, S., Brandl, R., Heibl, C., Mattivi, A., Müller, J., Pinkert, S., et al. (2020). Predicting regional hotspots of phylogenetic diversity across multiple species groups. Div. Distrib. 26, 1305–1314. doi: 10.1111/ddi.13125
Fritz, S. A., Bininda-Emonds, O. R. P., and Purvis, A. (2009). Geographical variation in predictors of mammalian extinction risk: big is bad, but only in the tropics. Ecol. Lett. 12, 538–549. doi: 10.1111/j.1461-0248.2009.01307.x
García-Llamas, P., Rangel, T. F., Calvo, L., and Suárez-Seoane, S. (2019). Linking species functional traits of terrestrial vertebrates and environmental filters: a case study in temperate mountain systems. PLoS One 14:e0211760. doi: 10.1371/journal.pone.0211760
García-París, M., Montori, A., and Herrero, P. H. S. (2004). Fauna Ibeìrica: Amphibia. Madrid: Museo Nacional de Ciencias Naturales.
Gaston, K. J., Jackson, S. F., Cantú-Salazar, L., and Cruz-Piñón, G. (2008). The ecological performance of protected areas. Annu. Rev. Ecol. Evol. Syst. 39, 93–113. doi: 10.1146/annurev.ecolsys.39.110707.173529
González-Maya, J. F., Víquez-R, L. R., Belant, J. L., and Ceballos, G. (2015). Effectiveness of protected areas for representing species and populations of terrestrial mammals in Costa Rica. PLoS One 10:e0124480. doi: 10.1371/journal.pone.0124480
Gotelli, N. J., and Graves, G. R. (1996). Null Models in Ecology. Washington, DC: Smithsonian Institution Press.
Grimm, A., Ramírez, A. M. P., Moulherat, S., Reynaud, J., and Henle, K. (2014). Life-history trait database of European reptile species. Nat. Conserv. 9, 45–67. doi: 10.3897/natureconservation.9.8908
Guilhaumon, F., Albouy, C., Claudet, J., Velez, L., Ben Rais Lasram, F., Tomasini, J., et al. (2015). Representing taxonomic, phylogenetic and functional diversity: new challenges for Mediterranean marine−protected areas. Divers. Distrib. 21, 175–187. doi: 10.1111/ddi.12280
Guisan, A., and Zimmermann, N. E. (2000). Predictive habitat distribution models in ecology. Ecol. Model. 135, 147–186. doi: 10.1016/S0304-3800(00)00354-9
Hanson, J. O., Rhodes, J. R., Butchart, S. H. M., Buchanan, G. M., Rondinini, C., Ficetola, G. F., et al. (2020). Global conservation of species’ niches. Nature 580, 232–234. doi: 10.1038/s41586-020-2138-7
Harrington, R., Anton, C., Dawson, T. P., de Bello, F., Feld, C. K., Haslett, J. R., et al. (2010). Ecosystem services and biodiversity conservation: concepts and a glossary. Biodivers. Conserv. 19, 2773–2790. doi: 10.1007/s10531-010-9834-9
Hermoso, V., Filipe, A. F., Segurado, P., and Beja, P. (2015). Effectiveness of a large reserve network in protecting freshwater biodiversity: a test for the Iberian Peninsula. Freshw. Biol. 60, 698–710. doi: 10.1111/fwb.12519
Hernández-Manrique, O. L., Numa, C., Verdú, J. R., Galante, E., and Lobo, J. M. (2012). Current protected sites do not allow the representation of endangered invertebrates: the Spanish case. Insect Conserv. Divers. 5, 414–421. doi: 10.1111/j.1752-4598.2011.00175.x
Hoffmann, M., Hilton-Taylor, C., Angulo, A., Böhm, M., Brooks, T. M., Butchart, S. H. M., et al. (2010). The impact of conservation on the status of the world’s vertebrates. Science 330, 1503–1509. doi: 10.1126/science.1194442
Hsu, J. S., Powell, J., and Adler, P. B. (2012). Sensitivity of mean annual primary production to precipitation. Glob. Change Biol. 18, 2246–2255. doi: 10.1111/j.1365-2486.2012.02687.x
ICNB – Instituto da Conservação da Natureza y da Biodiversidade (2008). Atlas das Aves Nidificantes em Portugal. Portugal: Assírio & Alvim Editora.
ICNF - Instituto da Conservação da Natureza e das Florestas (2017). Áreas Protegidas. Available online at: http://www2.icnf.pt/portal/ap (Accessed November 3, 2017)
IPBES (2019). Global Assessment Report on Biodiversity and Ecosystem Services of the Intergovernmental Science-Policy Platform on Biodiversity and Ecosystem Services. Bonn: IPBES secretariat.
Isaac, N. J. B., Turvey, S. T., Collen, B., Waterman, C., and Baillie, J. E. M. (2007). Mammals on the EDGE: conservation priorities based on threat and phylogeny. PLoS One 2:e296. doi: 10.1371/journal.pone.0000296
Isbell, F., Gonzalez, A., Loreau, M., Cowles, J., Díaz, S., Hector, A., et al. (2017). Linking the influence and dependence of people on biodiversity across scales. Nature 546, 65–72. doi: 10.1038/nature22899
Jenkins, C. N., Pimm, S. L., and Joppa, L. N. (2013). Global patterns of terrestrial vertebrate diversity and conservation. Proc. Natl. Acad. Sci. U.S.A. 110, E2602–E2610. doi: 10.1073/pnas.1302251110
Jones, K. E., Bielby, J., Cardillo, M., Fritz, S. A., O’Dell, J., Orme, C. D. L., et al. (2009). PanTHERIA: a species-level database of life history, ecology, and geography of extant and recently extinct mammals: ecological archives E090-184. Ecology 90:2648. doi: 10.1890/08-1494.1
Kembel, S. W. (2009). Disentangling niche and neutral influences on community assembly: assessing the performance of community phylogenetic structure tests. Ecol. Lett. 12, 949–960. doi: 10.1111/j.1461-0248.2009.01354.x
Kembel, S. W., Cowan, P. D., Helmus, M. R., Cornwell, W. K., Morlon, H., Ackerly, D. D., et al. (2010). Picante: R tools for integrating phylogenies and ecology. Bioinformatics 26, 1463–1464. doi: 10.1093/bioinformatics/btq166
Keppel, G., Ottaviani, G., Harrison, S., Wardell-Johnson, G. W., Marcantonio, M., and Mucina, L. (2018). Towards an eco-evolutionary understanding of endemism hotspots and refugia. Ann. Bot. 122, 927–934. doi: 10.1093/aob/mcy173
Keppel, G., Van Niel, K. P., Wardell-Johnson, G. W., Yates, C. J., Byrne, M., Mucina, L., et al. (2012). Refugia: identifying and understanding safe havens for biodiversity under climate change. Glob. Ecol. Biogeogr. 21, 393–404. doi: 10.1111/j.1466-8238.2011.00686.x
Kleidon, A., Fraedrich, K., and Heimann, M. (2000). A green planet versus a desert world: estimating the maximum effect of vegetation on the land surface climate. Clim. Change. 44, 471–493. doi: 10.1023/A:1005559518889
Knutson, M. G., Richardson, W. B., Reineke, D. M., Gray, B. R., Parmelee, J. R., and Weick, S. E. (2004). Agricultural ponds support amphibian populations. Ecol. Appl. 14, 669–684. doi: 10.1890/02-5305
Koumaris, A., and Fahrig, L. (2016). Different anuran species show different relationships to agricultural intensity. Wetlands 36, 731–744. doi: 10.1007/s13157-016-0781-4
Kukkala, A. S., Santangeli, A., Butchart, S. H. M., Maiorano, L., Ramirez, I., Burfield, I. J., et al. (2016). Coverage of vertebrate species distributions by important bird and biodiversity areas and special protection areas in the European Union. Biol. Conserv. 202, 1–9. doi: 10.1016/j.biocon.2016.08.010
Lawer, E. A., Mupepele, A. C., and Klein, A. M. (2019). Responses of small mammals to land restoration after mining. Landsc. Ecol. 34, 473–485. doi: 10.1007/s10980-019-00785-z
Lobo, J. M., and Araújo, M. B. (2003). La aplicación de datos faunísticos para el diseño de redes de reservas: el caso de los anfibios y reptiles de la Península Ibérica. Graellsia 49, 2–3. doi: 10.3989/graellsia.2003.v59.i2-3.255
Long, J. S., Rodrigues, A. S. L., Boitani, L., Pressey, R. L., Yan, X., Fishpool, L. D. C., et al. (2004). Effectiveness of the global protected area network in representing species diversity. Nature 428, 640–643. doi: 10.1038/nature02422
Loreau, M., Naeem, S., Inchausti, P., Bengtsson, J., Grime, J. P., Hector, A., et al. (2001). Biodiversity and ecosystem functioning: current knowledge and future challenges. Science 294, 804–808. doi: 10.1126/science.1064088
Loureiro, A., Ferrand de Almeida, N., Carretero, M. A., and Paulo, O. S. (2008). Atlas dos Anfíbios e Répteis de Portugal. Lisboa: Instituto da Conservação da Natureza e da Biodiversidade.
Magioli, M., Ferraz, K. M. P. M., Setz, E. Z. F., Percequillo, A. R., Rondon, M. V., Kuhnen, V. V., et al. (2016). Connectivity maintain mammal assemblages functional diversity within agricultural and fragmented landscapes. Europ. J. Wildlife Res. 62, 431–446. doi: 10.1007/s10344-016-1017-x
MAPAMA - Ministerio de Agricultura, Pesca, Alimentación y Medio Ambiente (2017a). Bases de Datos del Inventario Español de Especies Terrestres. Available online at: http://www.mapama.gob.es/es/biodiversidad/temas/inventarios-nacionales/inventario-especies-terrestres/inventario-nacional-de-biodiversidad/bdn-ieet-default.aspx. (Accessed November 3, 2017)
MAPAMA - Ministerio de Agricultura, Pesca, Alimentación y Medio Ambiente (2017b). Espacios Naturales Protegidos. Available online at: http://www.mapama.gob.es/es/biodiversidad/servicios/banco-datos-naturaleza/informacion-disponible/ENP.aspx (Accessed December 12, 2017)
Margules, C. R., and Pressey, R. L. (2000). Systematic conservation planning. Nature 405, 243–253. doi: 10.1038/35012251
Martins, I. S., Proença, V., and Pereira, H. M. (2014). The unusual suspect: land use is a key predictor of biodiversity patterns in the Iberian Peninsula. Acta Oecol. 61, 41–50. doi: 10.1016/j.actao.2014.10.005
Mazel, F., Guilhaumon, F., Mouquet, N., Devictor, V., Gravel, D., Renaud, J., et al. (2014). Multifaceted diversity-area relationships reveal global hotspots of mammalian species, trait and lineage diversity. Glob. Ecol. Biogeogr. 23, 836–847. doi: 10.1111/geb.12158
MEA - Millennium Ecosystem Assessment (2005). Ecosystems and Human Well-Being: Biodiversity Synthesis. Washington DC: World Resources Institute.
Meredith, R. W., Janecka, J. E., Gatesy, J., Ryder, O. A., Fisher, C. A., Teeling, E. C., et al. (2011). Impacts of the Cretaceous terrestrial revolution and KPg extinction on mammal diversification. Science 334, 521–524. doi: 10.1126/science.1211028
Milstead, W. B., Meserve, P. L., Campanella, A., Previtali, M. A., Kelt, D. A., and Gutiérrez, J. R. (2007). Spatial ecology of small mammals in north-central Chile: role of precipitation and refuges. J. Mammal. 88, 1532–1538. doi: 10.2307/25145049
Moilanen, A., Possingham, H. P., and Wilson, K. A. (2009). “Spatial conservation prioritization: past, present and future,” in Spatial Conservation Prioritization–Quantitative Methods and Computational Tools, eds A. Moilanen, K. A. Wilson, and H. P. Possingham (Oxford: Oxford University Press), 260–268.
Moreno-Rueda, G., and Pizarro, M. (2008). Relative influence of habitat heterogeneity, climate, human disturbance, and spatial structure on vertebrate species richness in Spain. Ecol. Res. 24, 335–344. doi: 10.1007/s11284-008-0509-x
Mori, A. S., Furukawa, T., and Sasaki, T. (2013). Response diversity determines the resilience of ecosystems to environmental change. Biol. Rev. 88, 349–364. doi: 10.1111/brv.12004
Myers, N., Mittermeier, R. A., da Fonseca, G. A. B., Kent, J., and Mittermeier, C. G. (2000). Biodiversity hotspots for conservation priorities. Nature 403, 853–858. doi: 10.1038/35002501
Nori, J., Lemes, P., Urbina-Cardona, N., Baldo, D., Lescano, J., and Loyola, R. (2015). Amphibian conservation, land-use changes and protected areas: a global overview. Biol. Conserv. 191, 367–374. doi: 10.1016/j.biocon.2015.07.028
Palomo, L. J., Gisbert, J., and Blanco, J. C. (2007). Atlas y Libro Rojo de los Mamíferos Terrestres de España. Madrid: Dirección General para la Biodiversidad-SECEM-SECEMU.
Pavoine, S., Vallet, J., Dufour, A. B., Gachet, S., and Daniel, H. (2009). On the challenge of treating various types of variables: application for improving the measurement of functional diversity. Oikos 118, 391–402. doi: 10.1111/j.1600-0706.2008.16668.x
Pecl, G. T., Araújo, M. B., Bell, J. D., Blanchard, J., Bonebrake, T. C., Chen, I. C., et al. (2017). Biodiversity redistribution under climate change: impacts on ecosystems and human well-being. Science 355:eaai9214. doi: 10.1126/science.aai9214
Petchey, O. L., and Gaston, K. J. (2002). Functional diversity (FD), species richness and community composition. Ecol. Lett. 5, 402–411. doi: 10.1046/j.1461-0248.2002.00339.x
Pimm, S. L., Russell, G. J., Gittleman, J. L., and Brooks, T. M. (1995). The future of biodiversity. Science 269, 347–350. doi: 10.1126/science.269.5222.347
Pollock, L., Thuiller, W., and Jetz, W. (2017). Large conservation gains possible for global biodiversity facets. Nature 546, 141–141. doi: 10.1038/nature22368
Prum, R. O., Berv, J. S., Dornburg, A., Field, D. J., Townsend, J. P., Lemmon, E. M., et al. (2015). A comprehensive phylogeny of birds (Aves) using targeted next-generation DNA sequencing. Nature 526, 569–573. doi: 10.1038/nature15697
Purvis, A., Agapow, P. M., Gittleman, J. L., and Mace, G. M. (2000). Nonrandom extinction and the loss of evolutionary history. Science 288, 328–330. doi: 10.1126/science.288.5464.328
QGIS Development Team (2018). QGIS Geographic Information System. Open Source Geospatial Foundation Project. Available online at: http://qgis.osgeo.org.
Qian, H., and Jin, Y. (in press). Are phylogenies resolved at the genus level appropriate for studies on phylogenetic structure of species assemblages? Plant Divers. doi: 10.1016/j.pld.2020.11.005
R Core Team (2017). R: A Language and Environment for Statistical Computing. Vienna: R Foundation for Statistical Computing.
Rey-Benayas, J. M., and de la Montaña, E. (2003). Identifying areas of high-value vertebrate diversity for strengthening conservation. Biol. Conserv. 114, 357–370. doi: 10.1016/S0006-3207(03)00064-8
Ripple, W. J., Wolf, C., Newsome, T. M., Hoffmann, M., Wirsing, A. J., and McCauley, D. J. (2017). Extinction risk is most acute for the world’s largest and smallest vertebrates. Proc. Natl. Acad. Sci. U.S.A. 114, 10678–10683. doi: 10.1073/pnas.1702078114
Roa-Fuentes, C. A., Heino, J., Cianciaruso, M. V., Ferraz, S., Zeni, J. O., and Casatti, L. (2019). Taxonomic, functional, and phylogenetic β-diversity patterns of stream fish assemblages in tropical agroecosystems. Freshw. Biol. 64, 447–460. doi: 10.1111/fwb.13233
Rodrigues, A. S. L., and Gaston, K. J. (2002). Maximising phylogenetic diversity in the selection of networks of conservation areas. Biol. Conserv. 105, 103–111. doi: 10.1016/S0006-3207(01)00208-7
Rodríguez-Rodríguez, D., and Martínez-Vega, J. (2018). Representation and protection of threatened biodiversity by the largest Spanish regional network of protected areas. Endanger. Species Res. 35, 125–139. doi: 10.3354/esr00878
Roquet, C., Thuiller, W., and Lavergne, S. (2013). Building megaphylogenies for macroecology: taking up the challenge. Ecography 36, 13–26. doi: 10.1111/j.1600-0587.2012.07773.x
Rosso, A., Aragón, P., Acevedo, F., Doadrio, I., García-Barros, E., Lobo, J. M., et al. (2018). Effectiveness of the Natura 2000 network in protecting Iberian endemic fauna. Anim. Conserv. 21, 262–271. doi: 10.1111/acv.12387
Safi, K., Cianciaruso, M. V., Loyola, R. D., Brito, D., Armour-Marshall, K., and Diniz-Filho, J. A. (2011). Understanding global patterns of mammalian functional and phylogenetic diversity. Philos. Trans. Biol. Sci. 366, 2536–2544. doi: 10.1098/rstb.2011.0024
Sánchez-Fernández, D., Bilton, D. T., Abellán, P., Ribera, I., Velasco, J., and Millán, A. (2008). Are the endemic water beetles of the Iberian Peninsula and the Balearic Islands effectively protected? Biol. Conserv. 141, 1612–1627. doi: 10.1016/j.biocon.2008.04.005
Santos, A. M. C., Cianciaruso, M. V., Barbosa, A. M., Bini, L. M., Diniz−Filho, J. A. F., Faleiro, F. V., et al. (2020). Current climate, but also long−term climate changes and human impacts, determine the geographic distribution of European mammal diversity. Glob. Ecol. Biogeogr. 29, 1758–1769. doi: 10.1111/geb.13148
SEO - Sociedad Española de Ornitología (2018). Guía de Aves. Available online at: https://www.seo.org/listado-aves/. (Accessed January 15, 2018)
Sgro, C. M., Lowe, A. J., and Hoffmann, A. (2011). Building evolutionary resilience for conserving biodiversity under climate change. Evol. Appl. 4, 326–337. doi: 10.1111/j.1752-4571.2010.00157.x
SIARE (Servidor de Información de Anfibios y Reptiles de España) - Asociación Herpetológica Española. (2017). Base de Datos de Anfibios y Reptiles de España. Available online at: http://siare.herpetologica.es/bdh (Accessed November 10, 2017)
Smith, S. A., and O’Meara, B. C. (2012). treePL: divergence time estimation using penalized likelihood for large phylogenies. Bioinformatics 28, 2689–2690. doi: 10.1093/bioinformatics/bts492
Symonds, M. R. E., and Moussalli, A. (2010). A brief guide to model selection, multimodel inference and model averaging in behavioural ecology using Akaike’s information criterion. Behav. Ecol. Sociobiol. 65, 13–21. doi: 10.1007/s00265-010-1037-6
Tews, J., Brose, U., Grimm, V., Tielbörger, K., Wichmann, M. C., Schwager, M., et al. (2004). Animal species diversity driven by habitat heterogeneity/diversity: the importance of keystone structures. J Biogeogr. 31, 79–92. doi: 10.1046/j.0305-0270.2003.00994.x
Thuiller, W., Maiorano, L., Mazel, F., Guilhaumon, F., Guilhaumon, F., Ficetola, G. F., et al. (2015). Conserving the functional and phylogenetic trees of life of european tetrapods. Philos. Trans. R. Soc. 370:20140005. doi: 10.1098/rstb.2014.0005
Trochet, A., Moulherat, S., Calvez, O., Stevens, V. M., Clobert, J., and Schmeller, D. S. (2014). A database of life-history traits of European amphibians. Biodivers. Data J. 2, 23–38. doi: 10.3897/BDJ.2.e4123
Vences, M., and Köhler, J. (2007). Global diversity of amphibians (Amphibia) in freshwater. Hydrobiologia 595, 569–580. doi: 10.1007/s10750-007-9032-2
Vickery, W. L., and Rivest, D. (1992). The influence of weather on habitat use by small mammals. Ecography 15, 205–211. doi: 10.1111/j.1600-0587.1992.tb00026.x
Villamor, A., and Becerro, M. A. (2012). Species, trophic, and functional diversity in marine protected and non-protected areas. J. Sea Res. 73, 109–116. doi: 10.1016/j.seares.2012.07.002
Waters, C. N., Zalasiewicz, J., Summerhayes, C., Barnosky, A. D., Poirier, C., Gałuszka, A., et al. (2016). The Anthropocene is functionally and stratigraphically distinct from the Holocene. Science 351, 137. doi: 10.1126/science.aad2622
Williams, P. H., Humphries, C., Araujo, M., Lampinen, R., Hagemeijer, W., Gasc, J. P., et al. (2000). Endemism and important areas for representing European biodiversity: a preliminary exploration of atlas data for plants and terrestrial vertebrates. Belg. J. Entomol. 2, 21–46.
Wilman, H., Belmaker, J., Simpson, J., de la Rosa, C., Rivadeneira, M. M., and Jetz, W. (2014). EltonTraits 1.0: Species-level foraging attributes of the world’s birds and mammals: ecological archives E095-178. Ecology 95, 2027–2027. doi: 10.1890/13-1917.1
Winter, M., Devictor, V., and Schweiger, O. (2013). Phylogenetic diversity and nature conservation: where are we? Trends Ecol. Evol. 28, 199–204. doi: 10.1016/j.tree.2012.10.015
WorldClim (2020). Historical Climate Data. Available online at: https://www.worldclim.org/data/worldclim21.html. (Accessed January 2, 2021)
Keywords: amphibians, birds, conservation, mammals, national park, natural park, reptiles
Citation: Llorente-Culebras S, Molina-Venegas R, Barbosa AM, Carvalho SB, Rodríguez MÁ and Santos AMC (2021) Iberian Protected Areas Capture Regional Functional, Phylogenetic and Taxonomic Diversity of Most Tetrapod Groups. Front. Ecol. Evol. 9:634653. doi: 10.3389/fevo.2021.634653
Received: 28 November 2020; Accepted: 24 June 2021;
Published: 26 July 2021.
Edited by:
Fernando Augusto Oliveira Silveira, Federal University of Minas Gerais, BrazilReviewed by:
Enrico Tordoni, University of Trieste, ItalyMatteo Marcantonio, University of California, Davis, United States
Copyright © 2021 Llorente-Culebras, Molina-Venegas, Barbosa, Carvalho, Rodríguez and Santos. This is an open-access article distributed under the terms of the Creative Commons Attribution License (CC BY). The use, distribution or reproduction in other forums is permitted, provided the original author(s) and the copyright owner(s) are credited and that the original publication in this journal is cited, in accordance with accepted academic practice. No use, distribution or reproduction is permitted which does not comply with these terms.
*Correspondence: Ana M. C. Santos, YW5hLm1hcmdhcmlkYS5jLnNhbnRvc0BnbWFpbC5jb20=