 Adam D. Leaché1,2*
 Hayden R. Davis1,2
 Sonal Singhal3
 Matthew K. Fujita4
 Megan E. Lahti5Kelly R. Zamudio6
- 1Burke Museum of Natural History and Culture, Seattle, WA, United States
- 2Department of Biology, University of Washington, Seattle, WA, United States
- 3Department of Biology, California State University-Dominguez Hills, Carson, CA, United States
- 4Department of Biology, Amphibian and Reptile Diversity Research Center, The University of Texas at Arlington, Arlington, TX, United States
- 5Department of Biology, Truckee Meadows Community College, Reno, NV, United States
- 6Department of Ecology and Evolutionary Biology, Cornell University, Ithaca, NY, United States
Phylogenomic investigations of biodiversity facilitate the detection of fine-scale population genetic structure and the demographic histories of species and populations. However, determining whether or not the genetic divergence measured among populations reflects species-level differentiation remains a central challenge in species delimitation. One potential solution is to compare genetic divergence between putative new species with other closely related species, sometimes referred to as a reference-based taxonomy. To be described as a new species, a population should be at least as divergent as other species. Here, we develop a reference-based taxonomy for Horned Lizards (Phrynosoma; 17 species) using phylogenomic data (ddRADseq data) to provide a framework for delimiting species in the Greater Short-horned Lizard species complex (P. hernandesi). Previous species delimitation studies of this species complex have produced conflicting results, with morphological data suggesting that P. hernandesi consists of five species, whereas mitochondrial DNA support anywhere from 1 to 10 + species. To help address this conflict, we first estimated a time-calibrated species tree for P. hernandesi and close relatives using SNP data. These results support the paraphyly of P. hernandesi; we recommend the recognition of two species to promote a taxonomy that is consistent with species monophyly. There is strong evidence for three populations within P. hernandesi, and demographic modeling and admixture analyses suggest that these populations are not reproductively isolated, which is consistent with previous morphological analyses that suggest hybridization could be common. Finally, we characterize the population-species boundary by quantifying levels of genetic divergence for all 18 Phrynosoma species. Genetic divergence measures for western and southern populations of P. hernandesi failed to exceed those of other Phrynosoma species, but the relatively small population size estimated for the northern population causes it to appear as a relatively divergent species. These comparisons underscore the difficulties associated with putting a reference-based approach to species delimitation into practice. Nevertheless, the reference-based approach offers a promising framework for the consistent assessment of biodiversity within clades of organisms with similar life histories and ecological traits.
Introduction
One of the most difficult aspects of species delimitation is determining when genetic divergence is sufficient for the recognition of new species. Many methods have been developed to help determine the boundary between populations and species using genetic data (Yang and Rannala, 2010; Jones et al., 2015; Kapli et al., 2017; Smith and Carstens, 2020; Sukumaran et al., 2021), yet the question still remains whether or not the delimited units should be recognized as populations or species (Sukumaran and Knowles, 2017; Leaché et al., 2019). This is an important question, because as the ease of genomic data collection increases so does the resolution at which populations can be distinguished. This has the potential to lead to over-splitting species and artificially inflating biodiversity estimates (Carstens et al., 2013; Rannala, 2015).
One potential solution to this problem is to measure and compare the levels of genetic divergence for putative taxa to those observed among other closely related species (Sites and Marshall, 2003, 2004; Galtier, 2019). This reference-based taxonomic approach uses levels of divergence among species to define a potential shared boundary between population and species (Tobias et al., 2010). Comparing levels of genetic divergence using a reference-based taxonomy allows us to answer the question, “Are putative species more or less divergent compared to reference species?” If a clear population-species transition point is identified, then it could be used to establish a more effective and reliable “yardstick” for conducting quantitative taxonomic comparisons (Sukumaran et al., 2021). This approach requires a thorough understanding of a group’s taxonomy so that existing biases are not perpetuated onto a revised taxonomy. Further, although low levels of genetic divergence may provide weak evidence in favor of the new species, other sources of data such as morphology and ecology could be integrated to strengthen the case for species identity (de Queiroz, 2007; Padial et al., 2010). In doing so, reference-based taxonomy builds on the existing data available for a species group and moves species delimitation into a comparative framework (Galtier, 2019).
Reference-based approaches are not a new idea (Mayr, 1969). Some DNA barcoding approaches routinely use heuristic cutoffs for species delimitation (i.e., thresholds of genetic divergence) based on levels of divergence among species (Hebert et al., 2004; Hebert and Gregory, 2005). However, these approaches are limited by the use of a single, idiosyncratic locus (typically mtDNA coding genes) and their requirement for reciprocal monophyly (Moritz and Cicero, 2004: Hickerson et al., 2006). A modern approach based on genome-wide data can overcome these limitations by incorporating multiple independent loci and a coalescent model to accommodate incomplete lineage sorting. Multilocus data and coalescent models provide a more thorough perspective on the genetic divergence and demographic history of populations and species (Yang and Rannala, 2017). Yet, like its predecessors, this genome-wide approach can still falter when there is introgression or hybridization (Jiao and Yang, 2021), or when different axes of divergence disagree (e.g., morphological vs. genetic).
Modernizing reference-based taxonomic approaches to leverage genomic data can provide an empirical perspective on how genetic divergence relates to the “speciation continuum” (Chan and Grismer, 2019; Poelstra et al., 2021). A reference-based taxonomy could use any number of genetic diversity measures ranging from pairwise genetic distances to more sophisticated coalescent-based metrics. An advantage of coalescent units is that they provide an expectation for the amount of genealogical discordance produced by different combinations of species tree branch lengths and population sizes (Pamilo and Nei, 1988). One such coalescent-based metric is the genealogical divergence index (gdi; Jackson et al., 2017). The gdi measures genetic divergence between two populations, reflecting the combined effects of genetic isolation and gene flow (Jackson et al., 2017). Higher gdi values indicate that populations are more evolutionarily independent and can be used as evidence to distinguish between populations and species.
Here, we use genomic data (ddRADseq) to estimate genetic divergence among species to develop a reference-based taxonomy for Horned Lizards (Phrynosoma) to conduct comparative species delimitation within the Greater Short-horned Lizard species complex (P. hernandesi). A previous phylogeographic study of P. hernandesi using mitochondrial DNA (mtDNA) identified three major clades with relatively strong geographical structure (Figure 1). These mtDNA clades did not correspond to existing subspecies boundaries defined by morphology, precluding their recognition as species (Zamudio et al., 1997). A systematic study of P. hernandesi based on morphometric analyses of morphological traits recommended the recognition of five species (two of which contained two subspecies; Montanucci, 2015; Figure 1). The morphological study provided indirect evidence of gene flow and identified large geographic regions of putative hybridization (Montanucci, 2015). A subsequent species delimitation analysis of mtDNA data supported anywhere from 1 to 10 species, and although the validity of the morphological species were questioned, no formal taxonomic recommendations were made (Blair and Bryson, 2017). Because mtDNA and morphological species assignments conflict and there is evidence of hybridization, we collected multilocus nuclear data to investigate phylogeny, phylogeography, demography, and species delimitation in the P. hernandesi species complex. First, we characterize population structure and phylogeny in the P. hernandesi species complex and three other closely related Phrynosoma species. We then use coalescent models to infer the demographic history of P. hernandesi populations. Finally, we analyze patterns of genetic divergence among all Phrynosoma species to develop a reference-based taxonomy and to delimit P. hernandesi populations.
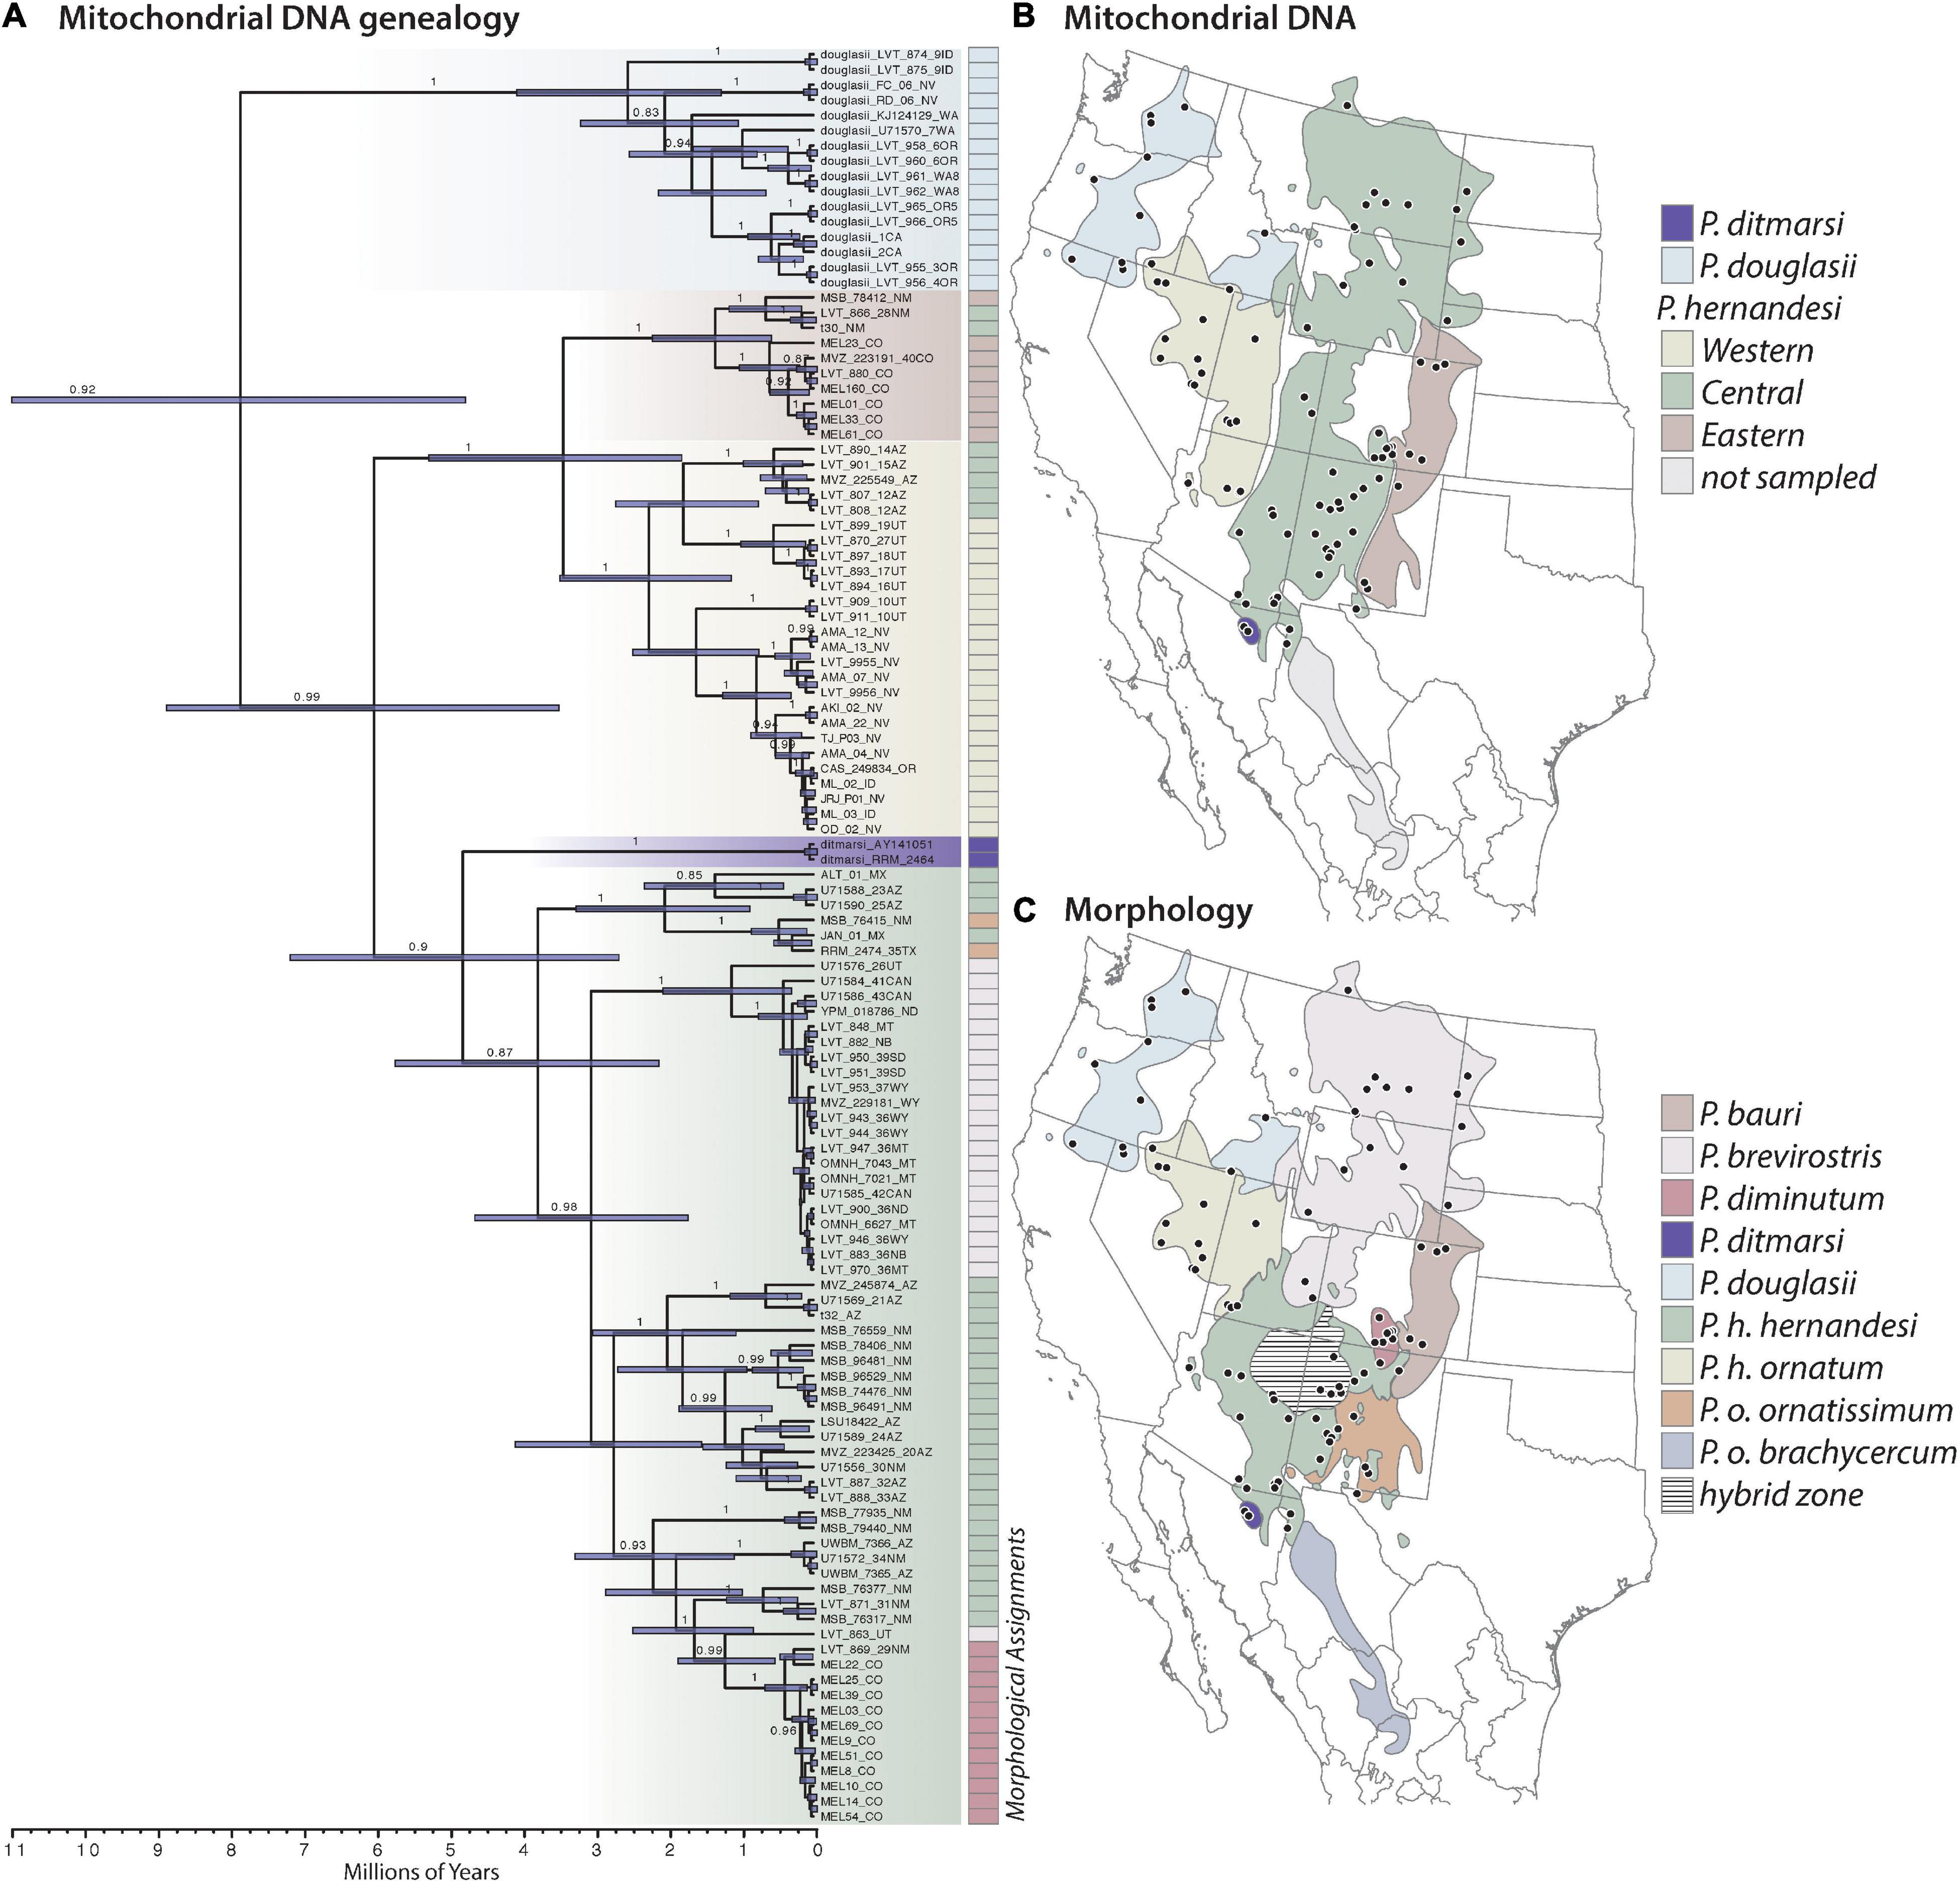
Figure 1. Summary of previous systematic studies of Phrynosoma hernandesi and closely related species belonging to the Tapaja clade, which includes P. ditmarsi, P. douglasii, P. hernandesi, and P. orbiculare (not shown). (A) Mitochondrial DNA genealogy estimated with Bayesian inference (posterior probability values ≥ 80% are shown). The tree was calibrated using a secondary fossil calibration information on the age of Tapaja (12.7 Ma; 95% CI = 10.8–14.7). Node bars show divergence time estimation uncertainty. The genealogy is color-coded to illustrate the species-level taxonomy and phylogeographic groups within P. hernandesi supported by the mtDNA genealogy and described by Zamudio et al. (1997). (B) Geographic distributions of the mtDNA clades within P. hernandesi (modified from Zamudio et al., 1997). Unsampled area of taxonomic importance (P. o. brachycercum) is shown in gray. (C) Geographic distributions of species and subspecies based on morphological delimitations (modified from Montanucci, 2015). The hatched area in the Colorado Plateau is one of several putative hybrid zones hypothesized to occur between species. Mapping the morphological taxonomy onto the mtDNA genealogy illustrates their discordances.
Materials and Methods
Ethics Statement
Tissue samples were obtained as loans from natural history museum collections. We also included mtDNA sequence data from Phrynosoma hernandesi that were used in a previous phylogeographic study (Zamudio et al., 1997) and an unpublished dissertation (Lahti, 2010). All animal research protocols presented in this study were approved by the University of Washington Institutional Animal Care and Use Committee (UW IACUC #4367–03).
Taxon Sampling
Analyses were conducted at three different levels: (1) phylogeny of the P. hernandesi species complex and other closely related species in the Tapaja clade, (2) phylogeographic and demographic history of P. hernandesi populations, and (3) genetic divergence comparisons among Phrynosoma to develop a reference-based taxonomy for delimiting the P. hernandesi populations.
Phylogeny of Tapaja
These analyses focused on estimating the phylogenetic relationships within and among species of Tapaja, which is the name referring to the crown clade originating in the last common ancestor of P. ditmarsi, P. douglasii, P. hernandesi, and P. orbiculare (Leaché and McGuire, 2006). Molecular phylogenetic studies provide strong evidence for the monophyly of Tapaja (Leaché and McGuire, 2006; Leaché et al., 2015; Leaché and Linkem, 2015). The species within Tapaja share several life history and morphological characteristics including viviparity (give birth to live young) and short to extremely reduced cranial horns. Separate phylogenetic analyses were conducted with mtDNA and nuclear data. The mtDNA dataset included 118 samples (Supplementary Table 1): P. ditmarsi (n = 2), P. douglasii (n = 16), P. hernandesi (n = 99), and P. orbiculare (n = 1). The ddRADseq dataset included 118 samples (Supplementary Table 2): P. ditmarsi (n = 3), P. douglasii (n = 17), P. hernandesi (n = 94), and P. orbiculare (n = 4).
Phylogeographic and Demographic History of P. hernandesi
To investigate the population structure and demography of P. hernandesi, we conducted focused analyses of the ddRADseq data on range-wide P. hernandesi samples (90 samples from 73 unique locations) from across Western and Central North America. These analyses excluded four samples belonging to an early diverging lineage containing four samples that cause P. hernandesi to be paraphyletic with respect to P. douglasii.
Reference-Based Taxonomy
The final taxon sampling set was used to establish a reference-based taxonomy for Phrynosoma, and included multiple samples for all 17 species in the genus (Table 1). A total of 83 samples were included with 24 of the samples representing the P. hernandesi species complex (Supplementary Table 3).
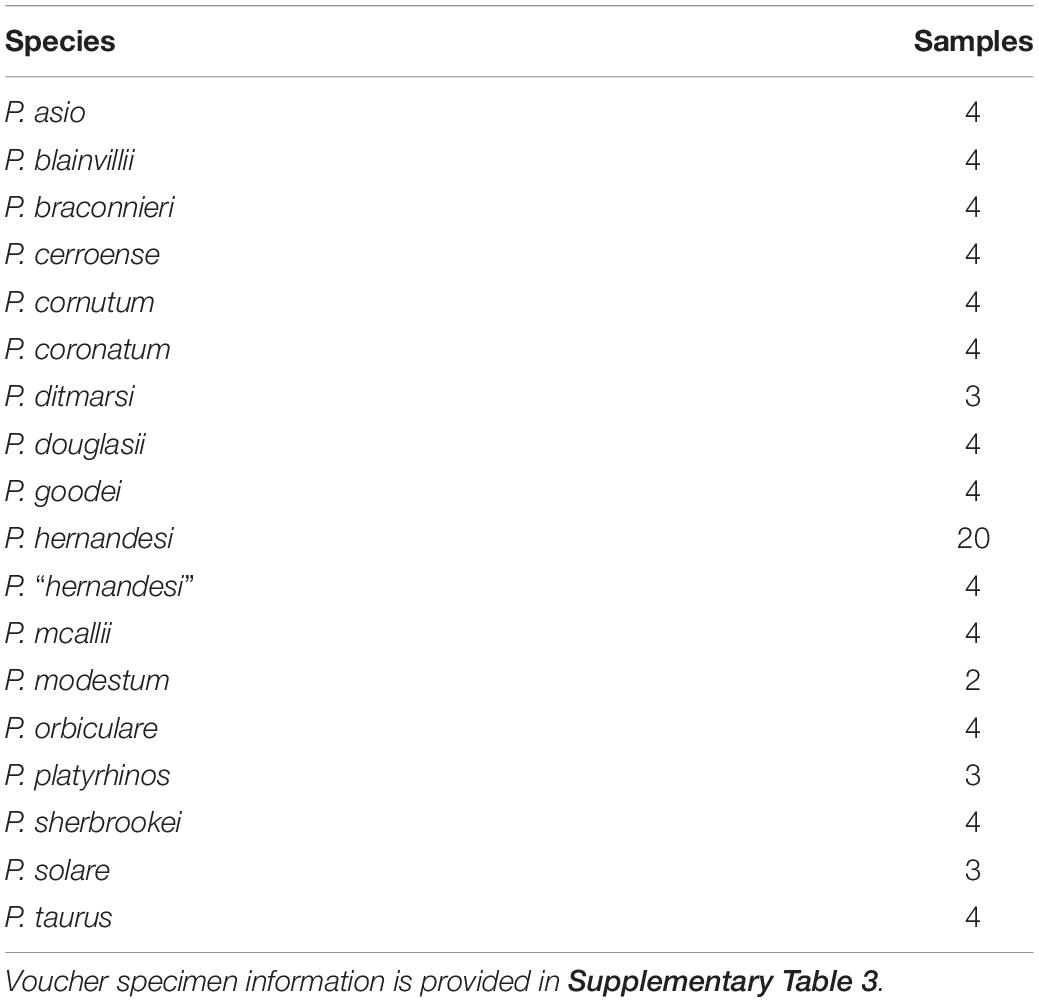
Table 1. Species included in the reference-based taxonomic analysis of Phrynosoma.
Molecular Methods
Genomic DNA was extracted from fresh tissue samples using QIAGEN DNeasy extraction kits (QIAGEN Inc.). We collected mtDNA sequence data from the ND4 gene to build on the existing mtDNA genealogy (Figure 1; Zamudio et al., 1997). We followed standard PCR amplification and sequencing protocols with primers used in a previous Phrynosoma study (Leaché and McGuire, 2006). To obtain multilocus nuclear data, we collected ddRADseq data following the protocol described by Peterson et al. (2012) using a slightly modified protocol with the restriction enzymes SbfI and MspI (Leaché et al., 2015). Short sequence reads (51 base pairs) were obtained using single-end sequencing with an Illumina HiSeq 4,000 at the QB3 facility at UC Berkeley.
Bioinformatics
For the mtDNA data, we edited and aligned the raw ND4 sequences using Geneious (Kearse et al., 2012). The ND4 protein-coding gene contained no indels making alignment with existing sequences trivial. For the ddRADseq data, we processed raw Illumina reads using the program iPyRAD v.0.7.30 (Eaton and Overcast, 2020). We de-multiplexed samples using their unique barcode and adapter sequences, and sites with Phred quality scores under 99.95% (Phred score = 33) were changed into “N” characters and reads with ≥10% N’s were discarded. The filtered reads were clustered using a threshold of 90%. Consensus sequences that had low coverage (<6 reads), excessive undetermined or heterozygous sites (>5), or too many haplotypes (>2 for diploids) were discarded. We removed putative paralogs by filtering out loci with excessive shared heterozygosity among samples (paralog filter = 0.5). We then assembled separate datasets for each of the three taxon sampling sets to minimize the amount of missing data. For each dataset, we controlled levels of missing data by adjusting the minimum individual (min. ind.) value, which specifies the minimum number of individuals that are required to have data present at a locus for that locus to be included in the final matrix. Details on the levels of missing data for each assembly are provided in the relevant methods sections below.
Phylogeny of Tapaja
The mitochondrial ND4 data were analyzed using BEAST v2.6.4 (Bouckaert et al., 2019). We used the GTR nucleotide substitution model with gamma distributed rate variation (five categories), following previous studies of P. hernandesi using the same locus (Zamudio et al., 1997; Blair and Bryson, 2017). Time calibration was accomplished with a relaxed log normal clock model calibrated using a secondary fossil calibration information from a phylogenomic analysis of Phrynosoma that estimated the crown age of Tapaja at 12.7 Ma (Leaché and Linkem, 2015). We implemented a normal distribution with a mean = 12.7 Ma on the age of Tapaja with a 95% confidence interval of 10.8–14.7 Ma to accommodate divergence time estimation errors. We conducted two replicate analyses (10 million generations each) and assessed convergence by comparing posterior distributions of parameters and checking for high ESS values (>200). The posterior distributions were combined using LogCombiner, and a maximum clade credibility (MCC) tree was summarized using TreeAnnotator after discarding the first 20% of samples as burn-in.
The ddRADseq data were assembled with a maximum of 15% missing data at a locus (min.ind. = 100). To identify genetic structure within and among species, we used Adegenet (Jombart, 2008) to conduct a principal component analysis (PCA) using all variable sites from across all loci. The genetic clusters identified by PCA were used in the subsequent species tree analysis. PCA does not make any assumptions about the underlying population genetic model, making it a useful approach for visualizing genetic differences among populations and species.
The concatenated ddRADseq data were analyzed using ML with RAxML (Stamatakis, 2014) using the GTRGAMMA substitution model and 100 bootstrap replicates. To determine phylogenetic relationships among the genetic clusters identified in the PCA, we estimated a time-calibrated species tree from the unlinked and biallelic SNPs using the multispecies coalescent model in the program SNAPP v1.5.0 (Bryant et al., 2012) implemented in BEAST v2.5.2 (Bouckaert et al., 2019). Divergence-time estimation was accomplished with a strict clock model calibrated using secondary fossil calibration information from a phylogenomic analysis of Phrynosoma that estimated the crown age of Tapaja at 12.7 Ma (Leaché and Linkem, 2015). We implemented a normal distribution with a mean = 12.7 Ma on the divergence of Tapaja with a 95% confidence interval of 10.8–14.7 Ma to accommodate divergence time estimation errors. The input files were generated using methods described by Stange et al. (2018) using the snapp_prep.rb scripts available on GitHub1. To reduce computational time, the number of samples included for P. douglasii was reduced to eight (one sample from each unique sampling locality), and the number of P. hernandesi samples was reduced to 12 (Supplementary Table 4). Two independent analyses were run for 200,000 generations each, sampling every 50 generations. The posterior distributions were combined using LogCombiner, and a MCC tree was summarized using TreeAnnotator after discarding the first 20% of samples as burn-in.
Phylogeographic and Demographic History of P. hernandesi
Given the conflict between mitochondrial and morphological species delimitations for P. hernandesi, we conducted a focused exploration of the phylogeography and population demographics of this species. Our phylogenetic analysis of the Tapaja clade revealed that P. hernandesi is paraphyletic with respect to P. douglasii, with an early diverging lineage containing four samples from three relatively low elevation locations in the southern portion of the range in New Mexico, Texas, and Mexico (Figure 2). We excluded this early diverging lineage of P. “hernandesi” and P. douglasii from subsequent phylogeographic and demographic analyses and focused on the remaining 90 samples of P. hernandesi. The SNP data assembly allowed a maximum of 50% missing data at a locus (min. ind. = 45).
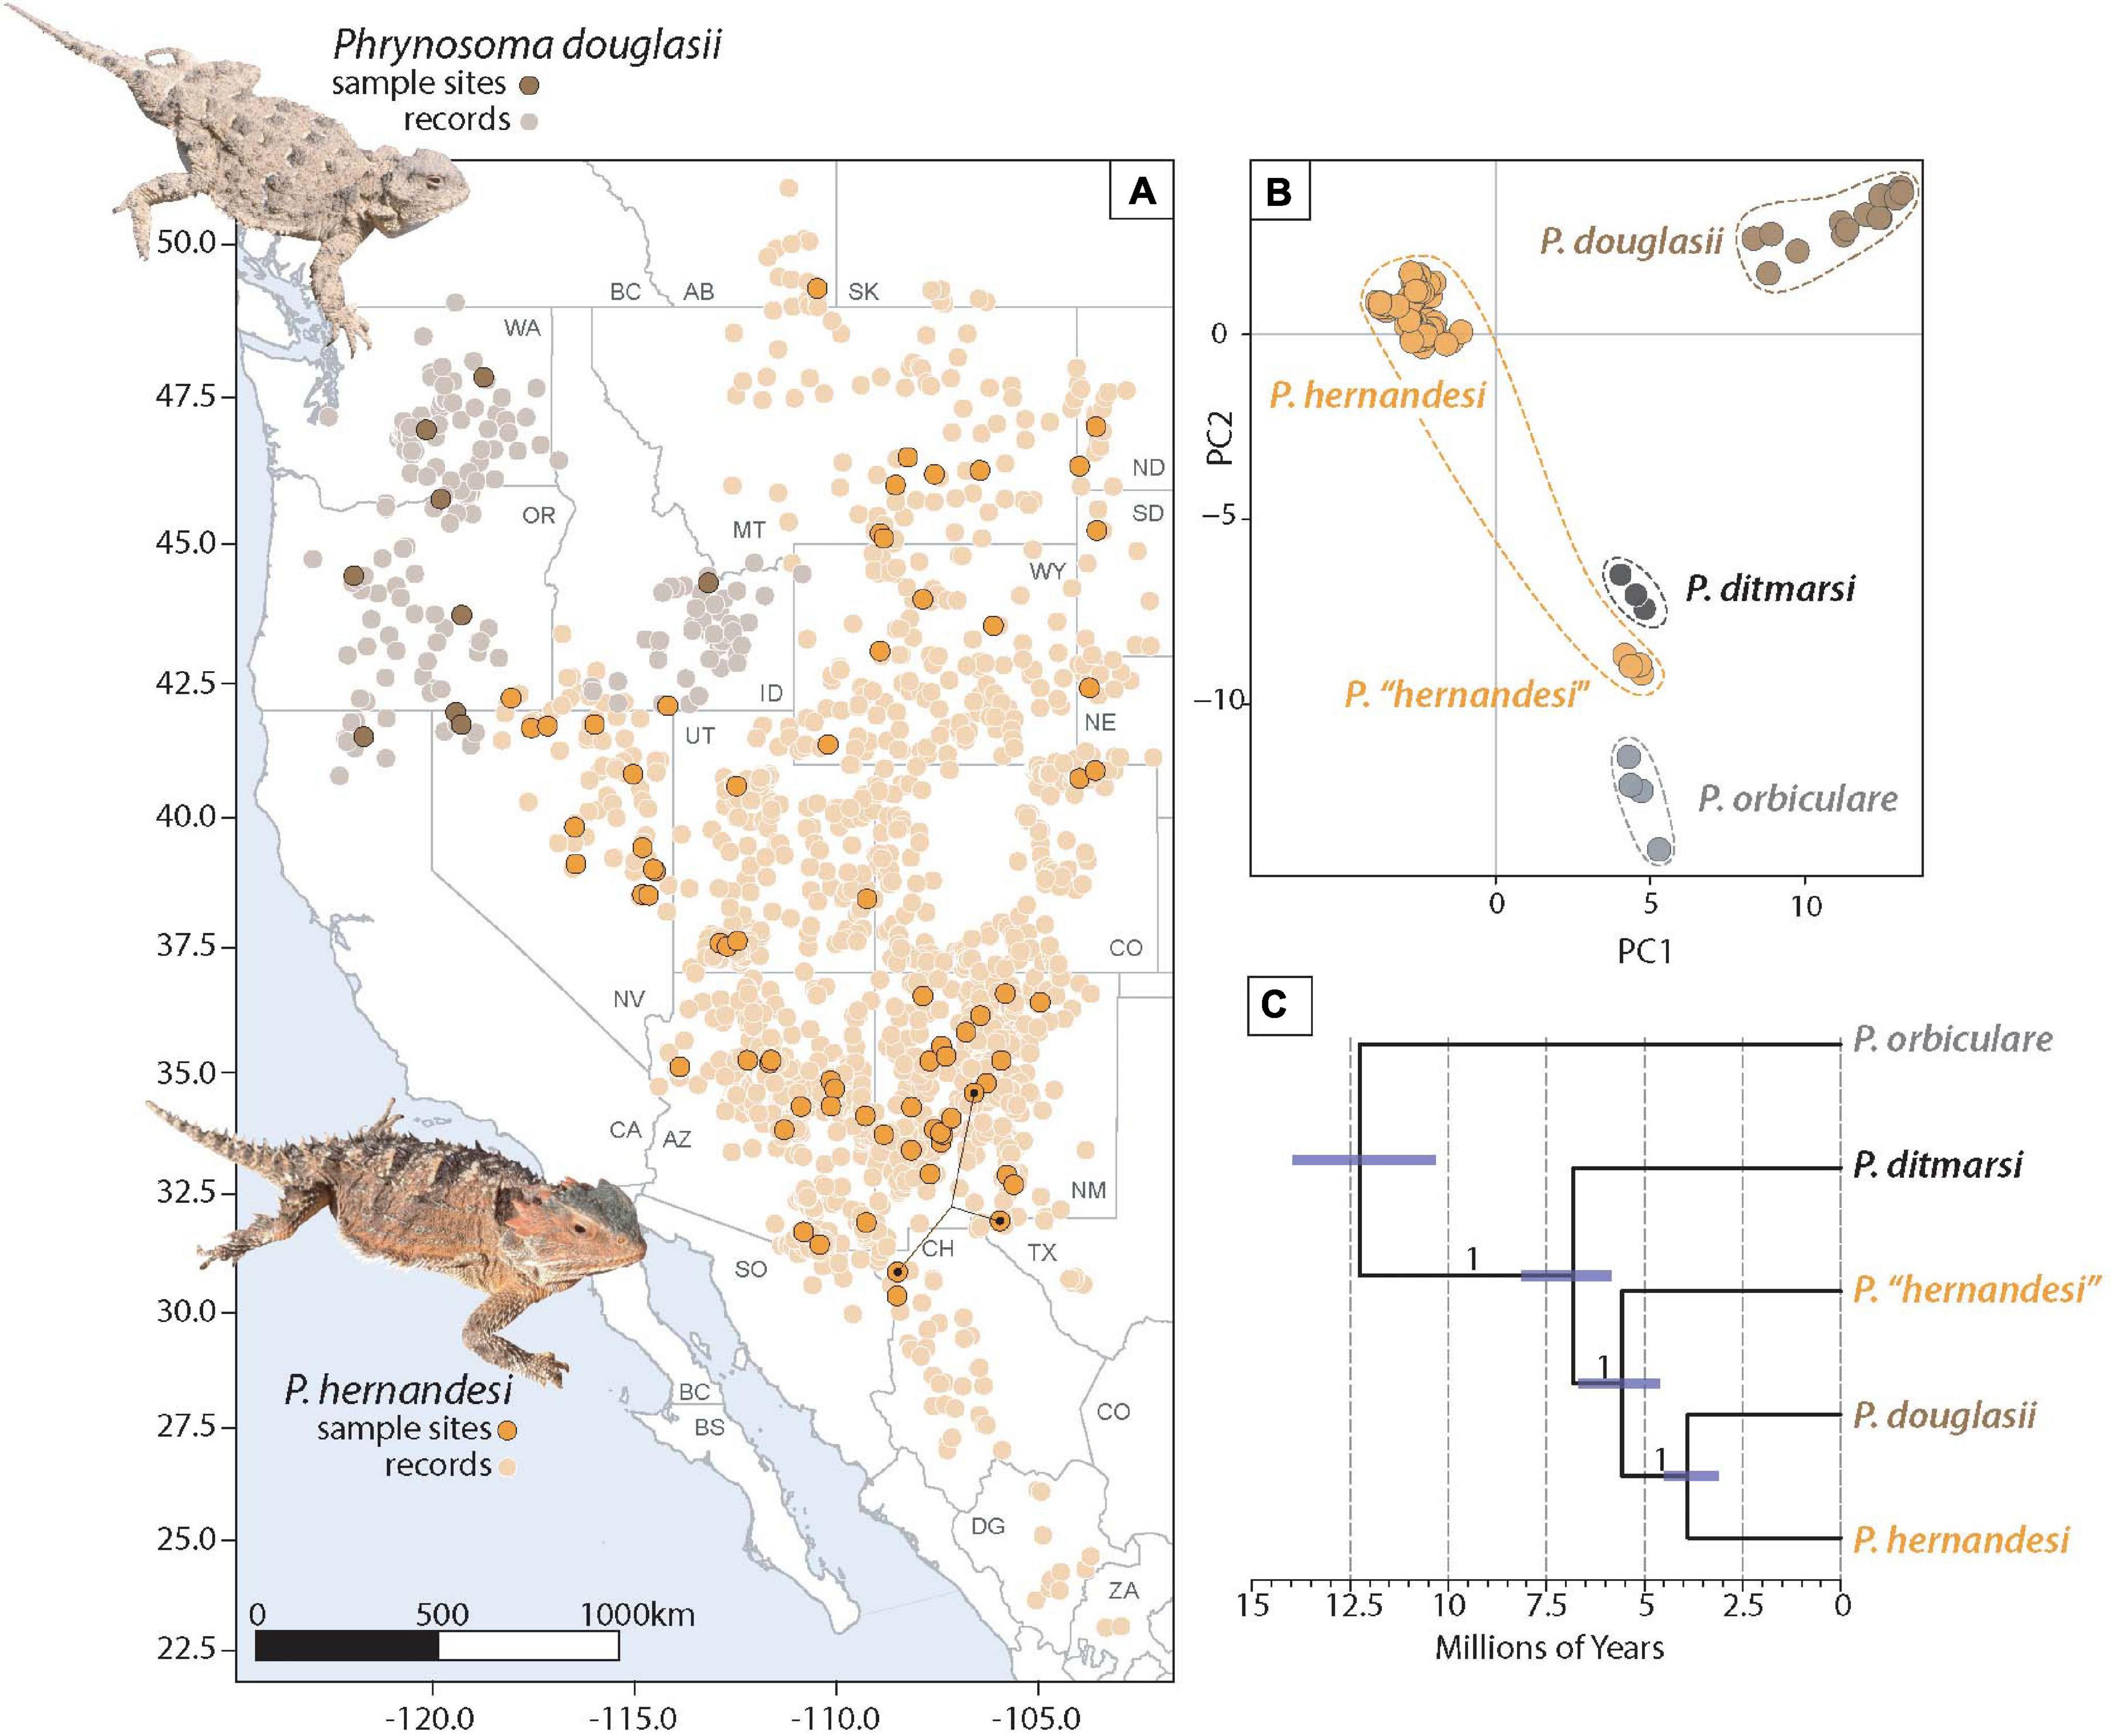
Figure 2. Analyses of multilocus nuclear data focusing on Phrynosoma douglasii and P. hernandesi. (A) Geographic distribution of P. douglasii and P. hernandesi in Western and Central North America. Distributional data are based on published locality records and distribution maps (Montanucci, 2015) and augmented with records downloaded from VertNet.org and iNaturalist. Detailed information on sample sites included in the phylogeographic component of this study are provided in Supplementary Table 2. (B) Principal components analysis of genetic variation (5,715 biallelic SNPs) for the species belonging to the Tapaja clade of Phrynosoma. The 94 P. hernandesi samples form two genetic clusters; the majority of the samples belong to P. hernandesi (n = 90), while P. “hernandesi” only includes four samples from the southern portion of the range with localities in New Mexico, Texas, and Mexico (shown on map with connected black dots). (C) A time-calibrated species tree analysis using the biallelic SNP data supports the paraphyly of P. hernandesi with respect to P. douglasii. Numbers on nodes are posterior probability values.
Population structure was estimated using the maximum likelihood method ADMIXTURE v1.3.0 (Alexander et al., 2009) to determine the optimal number of populations (K) and admixture proportions of samples. This analysis is necessary for identifying putative hybrids with mixed population ancestry; previous morphological data indicate that taxa in the P. hernandesi species complex hybridize (Montanucci, 2015). Samples were considered admixed with assignment probabilities ≤0.90. To determine the best-fit model, we compared analyses for K = 1 through K = 10 and selected the analysis that minimized group assignment error; e.g., the K with the lowest cross-validation error was considered the best-fit model. The analyses were repeated 10 times to measure uncertainty in cross-validation error estimation. After selecting the K value with the lowest cross-validation error, the 10 replicate runs were combined to summarize the admixture proportions for each sample.
Phylogeographic studies often present intraspecific genealogical relationships among samples, but in the context of nuclear loci that segregate independently the concept of a single bifurcating tree relating all samples is misleading. Network methods can depict relationships that are not necessarily bifurcating and can also help identify admixed samples (Blair and Ané, 2020). A genetic network was constructed from the concatenated SNP data (uncorrected “p” distances; all constant and variable sites were included) using the NeighborNet algorithm (Bryant and Moulton, 2004) in SplitsTree v4.6 (Huson and Bryant, 2006).
We estimated the phylogenetic relationships among populations using SNAPP using the population assignments estimated from the top-ranked ADMIXTURE model. We limited the number of samples assigned to each population to reduce computational times (Supplementary Table 5). An estimate of the nuclear genome-wide substitution rates for lizards (7.7 × 10⁻¹⁰ substitutions per site per year; Perry et al., 2018) was used to convert branch length estimates to absolute time. This is a strong assumption that directly influences the divergence dates being estimated. We compared the divergence times estimated for P. hernandesi between this analysis, which assumes a substitution rate calibration, to the estimate obtained independently using a divergence time prior in the species tree analysis of Tapaja. Two independent analyses were run for 200,000 generations each, sampling every 50 generations. The posterior distributions were combined using LogCombiner, and an MCC tree was summarized using TreeAnnotator after discarding the first 20% of samples as burn-in.
We compared three demographic models to better understand the history of gene flow among populations of P. hernandesi (Supplementary Figure 1). In particular, we tested for gene flow and secondary contact during divergence and additionally estimated divergence times (τ), population sizes (θ), the amounts and directions of gene flow (scaled by population size—Nm), and timing of secondary contact. The first model was a simple isolation model with no gene flow during divergence. The second model was a standard isolation-migration model (IM) that allowed gene flow among all contemporary and ancestral populations. The final model, the secondary contact model (SC), allowed for gene flow after an initial period of divergence in isolation. We fit these models to a phylogeny for the three P. hernandesi populations [north, (south, west)] using fastsimcoal2 (Excoffier et al., 2013), which can model multiple populations using simulations under the joint site frequency spectra (JSFS). JSFS were made from unlinked SNPs sampled from a VCF file using easySFS2. The full data were projected down to a smaller number of chromosomes per population to account for missing data and maximize the number of segregating sites in the JSFS (Supplementary Table 6). Parameters were converted to demographic units using the same mutation rate assumptions as the species tree analysis (mutation rate of 7.7 × 10⁻¹⁰ substitutions per site per generation). Models were optimized using 10 replicate searches (100,000 simulations each). The best-fit run from each of 10 replicates was ranked using the Akaike information criterion (AIC), and Akaike weights were used as a measure of statistical confidence of the top-ranked model. Finally, uncertainty in the point estimates for parameters of the best-fit model were obtained by non-parametric bootstrapping. Unlinked SNPs in the VCF file were sampled with replacement (50 replicates), and each bootstrap dataset was optimized in fastsimcoal2 with 10,000 simulations.
Reference-Based Taxonomy
To generate a reference-based taxonomy for Phrynosoma, we calculated levels of genetic divergence across all species in the clade. A total of 83 samples of Phrynosoma were included for the reference-based taxonomic analysis (Supplementary Table 3). Multiple samples were included for all 17 species of Phrynosoma (Table 1) with the addition of multiple samples for the P. hernandesi species complex. The genetic divergence values for the P. hernandesi species complex were compared to the values calculated for all other Phrynosoma species. The final SNP data assembly allowed a maximum of 40% missing data at a locus (min.ind. = 52).
All sites from the phased alleles (variable and constant sites) were used to calculate four measures of genetic diversity. For the first two measures, we calculated FST and dxy among all population-pairs (Nei, 1987; Reich et al., 2009). Our third and fourth measures were gdi values and the population divergence times in coalescent units (2τ/θ) for population and species using the multispecies coalescent model implemented in BPP v4.3.0 (Flouri et al., 2018). The species tree topology was fixed to match a previous species tree estimated for Phrynosoma from phylogenomic data (Leaché and Linkem, 2015). The phylogenetic relationships within Tapaja were updated to reflect the results of this study at both the species-level and for populations within P. hernandesi (Figures 2, 3). Posterior probability distributions for τ and θ were estimated with BPP using analysis A00 (Yang, 2015). Two replicate runs were conducted and compared to check for convergence, with each analysis sampling 200,000 steps (sample frequency = 2) after a burnin period of 100,000 steps. The priors were set for θ∼inversegamma (3, 0.01) and τ∼inversegamma (3, 0.04), which provide mean values of 0.005 and 0.02, respectively. We calculated population divergence times in coalescent units (2τ/θ) for each species and population using all samples from the combined posterior distributions. We calculated gdi for each species using equation gdi = 1− e–2τ /θ (Leaché et al., 2019). Although the gdi can measure the combined effects of genetic isolation and gene flow (Jackson et al., 2017), we analyze the data under a multispecies coalescent model assuming no gene flow, which has been shown to provide accurate species delimitations using computer simulation (Leaché et al., 2019). The gdi is continuous between 0 (panmixia) and 1 (strong divergence from the sister group), and thus can indicate where a population lies on the path to speciation. Although there is no fixed “delimitation cutoff” between populations and species, Jackson et al. (2017) suggested that gdi < 0.2 = single species, gdi >0.7 = different species, and a broad range of intermediate values represent ambiguous delimitation results.
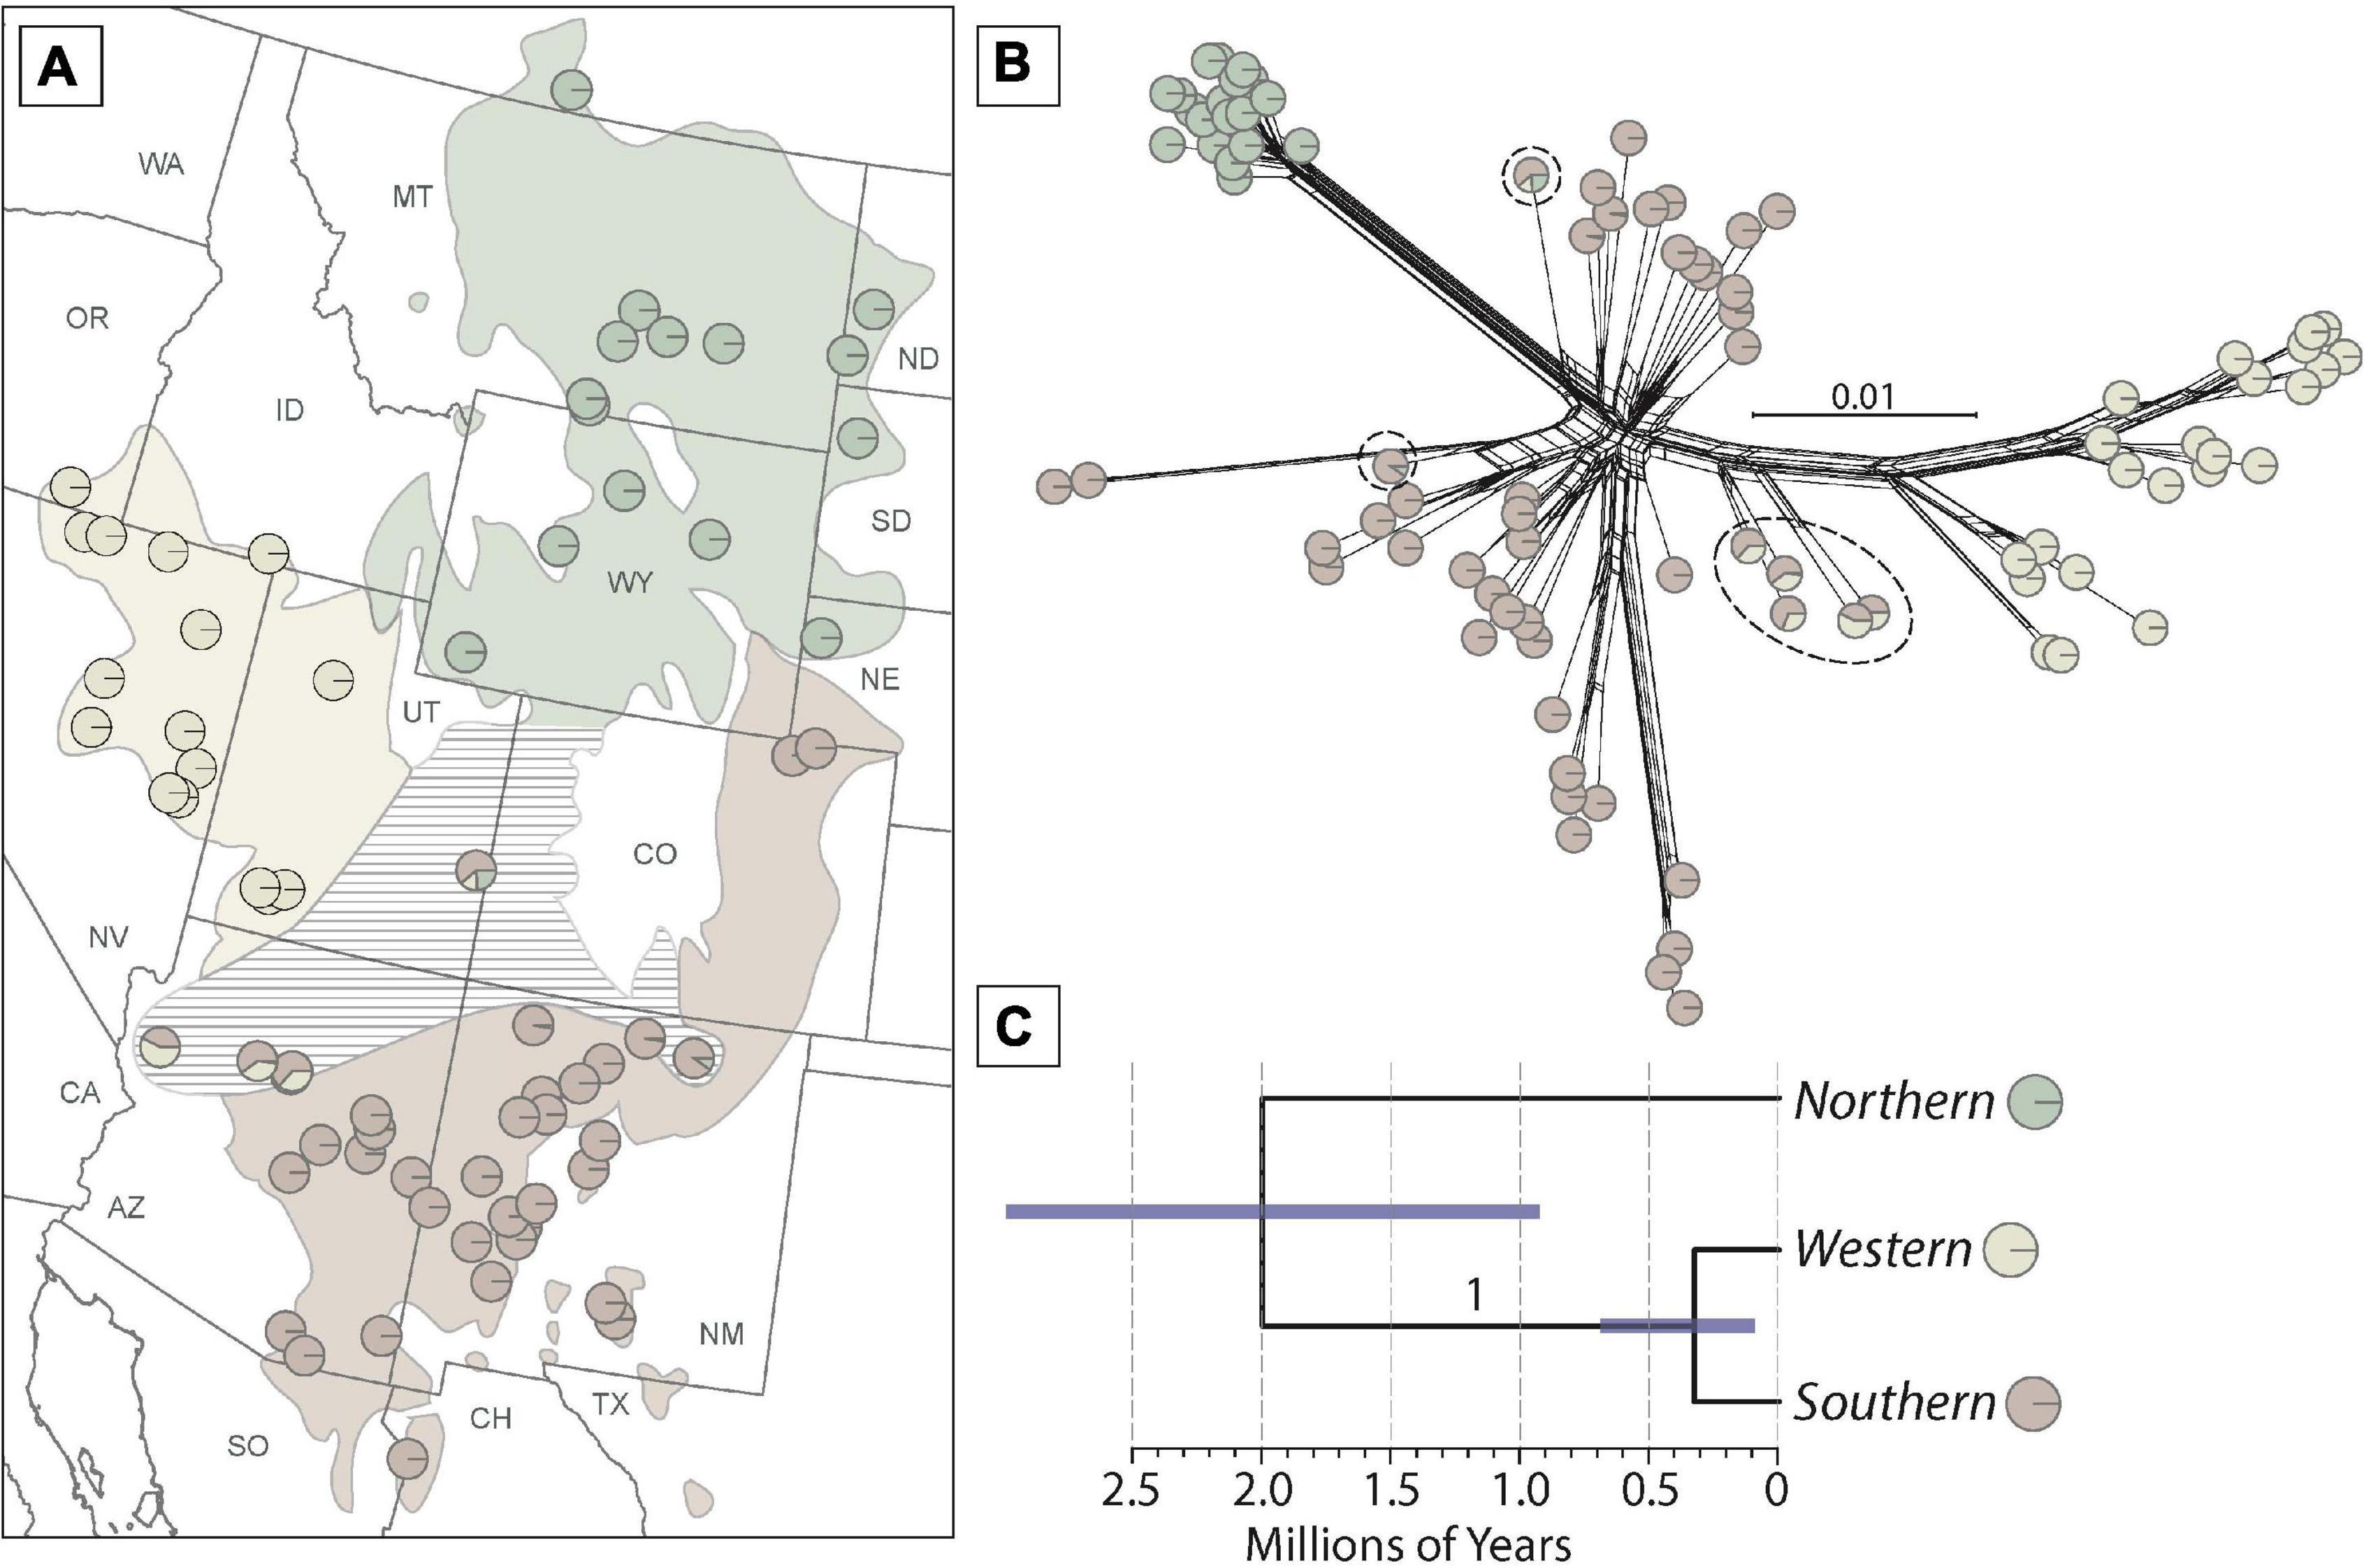
Figure 3. Phylogeographic analysis supports at least three populations within Phrynosoma hernandesi. (A) Population structure analysis with the optimal K = 3 model estimated with ADMIXTURE. Each sample is represented by a pie-chart with colors indicating ancestry proportions. Hatching indicates an area where admixed samples are found. (B) Network analysis inferred from the program SplitsTree with admixture proportions assigned to each sample. Admixed samples are encircled with dashed lines. (C) A species tree analysis inferred from the unlinked and biallelic SNP data for the three populations. The posterior probability value supporting the west and south populations as a clade is 1.0. Branch lengths (error bars are 95% highest posterior densities) were converted to absolute time assuming a rate of 7.7 × 10⁻¹⁰ substitutions per site per year (see “Materials and Methods” section for details).
Results
Phylogeny of Tapaja
The final alignment of the mtDNA data (ND4) included 118 sequences and 851 base pairs. The mtDNA gene tree estimated using Bayesian inference provides strong support for a sister relationship between P. douglasii (monophyletic) and P. “hernandesi” (paraphyletic with respect to P. ditmarsi; Figure 1). The phylogenetic patterns within P. hernandesi match those from previous studies (Zamudio et al., 1997; Blair and Bryson, 2017), most notably the support for three clades, which we refer to as the western, central, and eastern clades. The western clade includes localities in Oregon, Idaho, Nevada, Utah, and Arizona. The central clade includes localities in the Colorado Plateau, Wyoming Basins, and the Northern Great Plains. The eastern clade is primarily in the eastern piedmont (foothills) of the Rockies in New Mexico and Colorado. Mapping the morphological delimitations onto the mtDNA genealogy provides weak evidence in support of the morphological species, which are not monophyletic, and indicates that instances of conflict involve samples from the geographic boundaries between populations/species (Figure 1).
The PCA analysis of 5,715 biallelic SNPs (Figure 2) supports five clusters corresponding to (1) P. douglasii, (2) P. ditmarsi, (3) P. orbiculare, (4) P. hernandesi, and (5) P. “hernandesi” The four samples grouping in P. “hernandesi” are from locations at relatively low elevations in the Rio Grande River Valley in the southern portion of the species range (Texas, New Mexico, Chihuahua, MX). Samples from nearby locations are from relatively higher elevations and are grouped with P. hernandesi.
The phylogenetic analysis of the concatenated ddRADseq data (118 samples and 52,171 base pairs) supports the monophyly of P. douglasii and the paraphyly of P. hernandesi, which is divided into two separate lineages (Supplementary Figure 2). One lineage contains the four samples representing P. “hernandesi” and is placed sister to P. ditmarsi with weak bootstrap support (52%; Supplementary Figure 2). This clade (P. ditmarsi + P. “hernandesi”) is sister to a clade containing P. douglasii and the remaining 90 samples of P. hernandesi.
The time-calibrated species tree estimated with 1,321 unlinked and biallelic SNPs using SNAPP is strongly supported with posterior probability values of 1.0 for each clade (Figure 2). The species tree is asymmetric (Figure 2) with a root age for Tapaja of 12.3 mya (95% HPD = 10.3–14.0 mya), followed by the divergence of P. ditmarsi at 6.8 mya (95% HPD = 5.8–8.1 mya), then the divergence of P. “hernandesi” at 5.6 mya (95% HPD = 4.6–6.7 mya), and finally the divergence between P. hernandesi and P. douglasii at 3.9 mya (95% HPD = 3.1–4.5).
Phylogeographic and Demographic History of P. hernandesi
Population structure analysis of P. hernandesi (excluding the four low elevation P. “hernandesi” samples) with ADMIXTURE using 90 samples and 5,823 unlinked SNPs (sampled from 6,531 loci) supports K = 3 as best-fit population model according to cross-validation scores, and this result is supported across all 10 replicate analyses (Supplementary Figure 3). The three phylogeographic groups are partitioned into northern, western and southern populations, and samples with mixed ancestry are located at the geographic boundaries between populations (Figure 3). Three different geographic regions contain admixed samples, including (1) northern Arizona between the west and south populations, (2) northern New Mexico between northern and southern populations, and (3) eastern Utah with evidence of admixture among all three populations. The samples belonging to the western population are relatively congruent with the western mtDNA clade; however, the geographic distributions of the southern and northern populations are discordant with respect to mtDNA groups (Figures 1, 3 and Supplementary Figures 5,6).
The genetic network analysis (90 samples and 261,618 base pairs) shows similar clustering into three populations (Figure 3). Genetic diversity (as represented by clustering of samples) is greatest in the southern population, followed by the western population, and the lowest level in the northern population. Admixed samples (as estimated by the ADMIXTURE analysis) are placed in positions intermediate to these three populations in the genetic network (Figure 3).
The species tree analysis using 20 samples and 4,949 unlinked and biallelic SNPs (Figure 3) supports a close relationship between the west and south populations (posterior probability = 1.0) with a shallow divergence time of 324 kya (95% HPD = 90–649 kya). The estimated divergence at the root of the tree between the northern population and the remaining samples is 2 mya with a broad confidence interval (95% HPD) from 900 kya to 4 mya (Figure 3).
Demographic modeling strongly supported the secondary contact model as the best-fit model with a weighted AIC score of 1.0, followed by the IM model (Table 2). Divergence time is estimated at 313 kya (63–453 kya), which is younger than the phylogenetic estimate from the SNAPP analysis (Figure 3). The divergence time between the west and south populations is 67 kya (32–91 kya), and the timing of secondary contact is 2,267 kya (561–10,347 kya; Table 3). Migration rates are highest from the south to north (1.808 migrants per generation) and south to west (1.427 migrants per generation), and also from north to the common ancestor of west + south (1.299 migrants per generation).
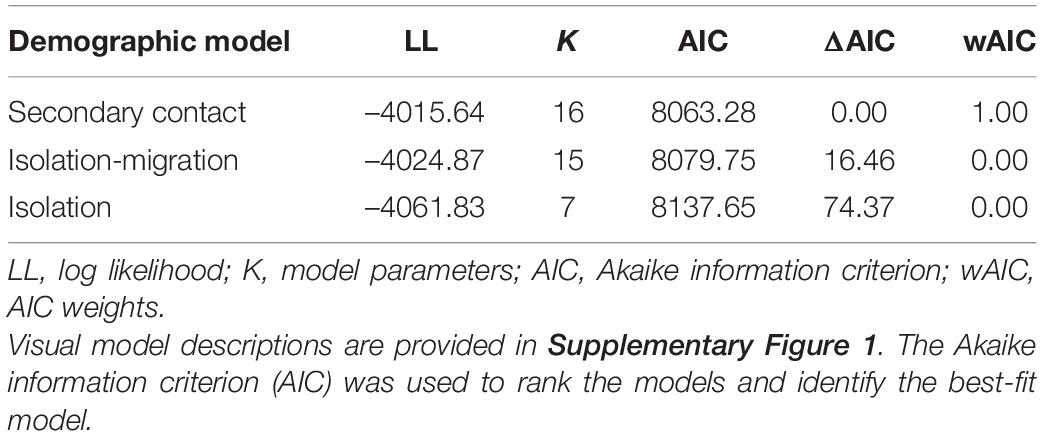
Table 2. Demographic model selection results for the north, south and west populations of Phrynosoma hernandesi.
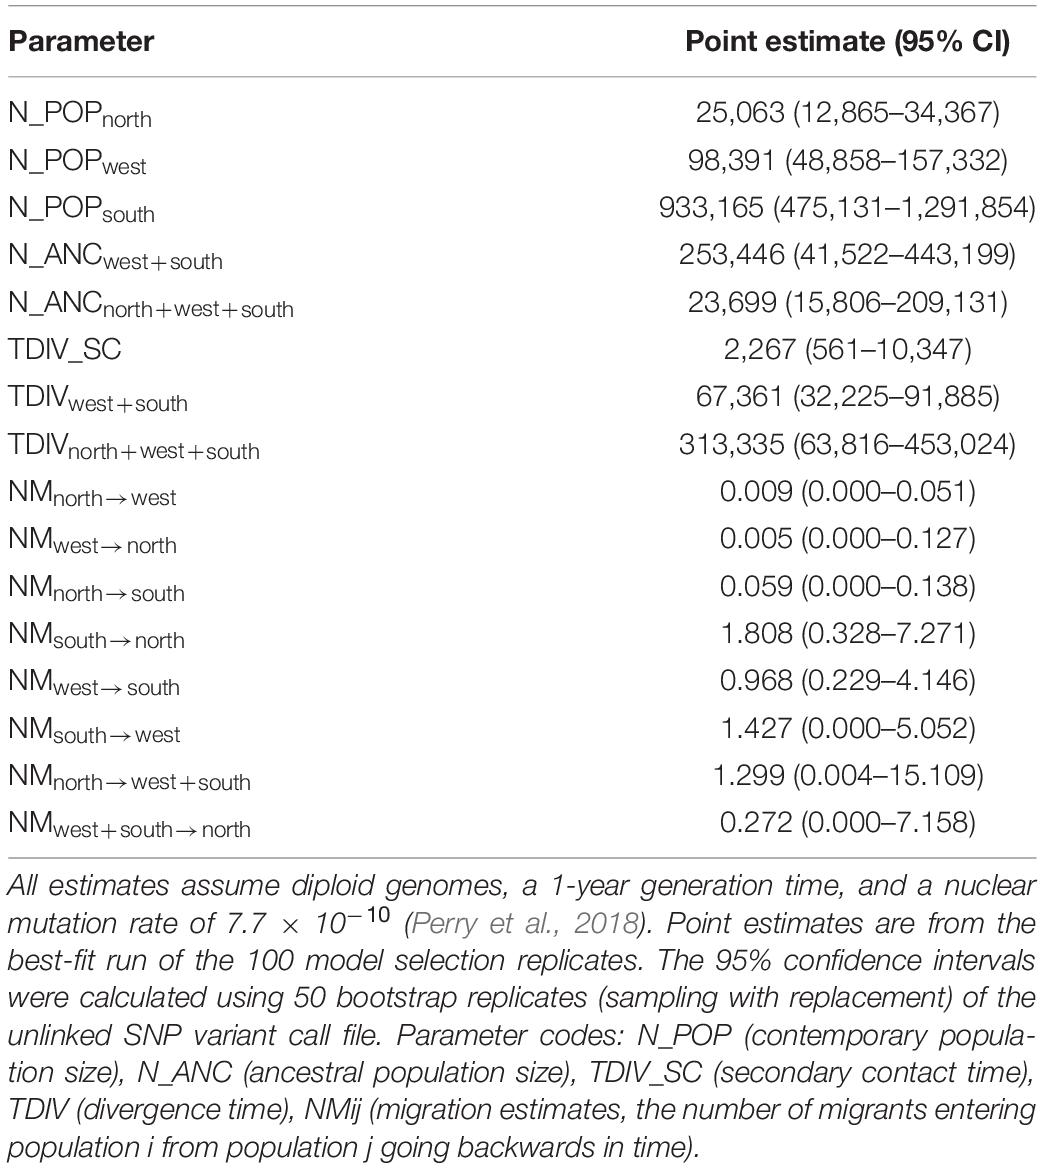
Table 3. Demographic parameter estimates for Phrynosoma hernandesi populations (north, west, south) under the secondary contact model.
Reference-Based Taxonomy
The ddRADseq dataset used for the reference-based taxonomy contained 83 samples (partitioned into 17 species; Table 1), and the concatenated ddRADseq data contained 35,677 base pairs for 909 loci. Analysis of 500 loci in BPP on the fixed species tree (Figure 4) provided estimates for population sizes (θ) and divergence times (τ) used to calculate genetic divergence values gdi and coalescent units (Supplementary Table 7). Values for gdi ranged from a low of 0.2 to nearly 1.0 for species of Phrynosoma (Figure 4). Species with the lowest values of gdi included P. blainvillii, P. cerroense, P. taurus, P. goodei, and P. platyrhinos. The remaining species had relatively higher gdi values >0.8 (Figure 4). In comparison, values of gdi for P. “hernandesi” were high (>0.9) and exceeded values for at least 10 other species (Figure 4). The gdi values for the three populations of P. hernandesi were mixed with low values (<0.3) for the south and west populations and high (>0.9) for the north population (Figure 4). Comparison of coalescent units (2τ/θ) produced similar patterns (Figure 4). Comparisons of the P. hernandesi species complex using FST and dxy show lower overall levels of genetic divergence compared to nominal species-pairs (Figure 5). Again, P. “hernandesi” is relatively divergent compared to other species of Phrynosoma (Figure 5).
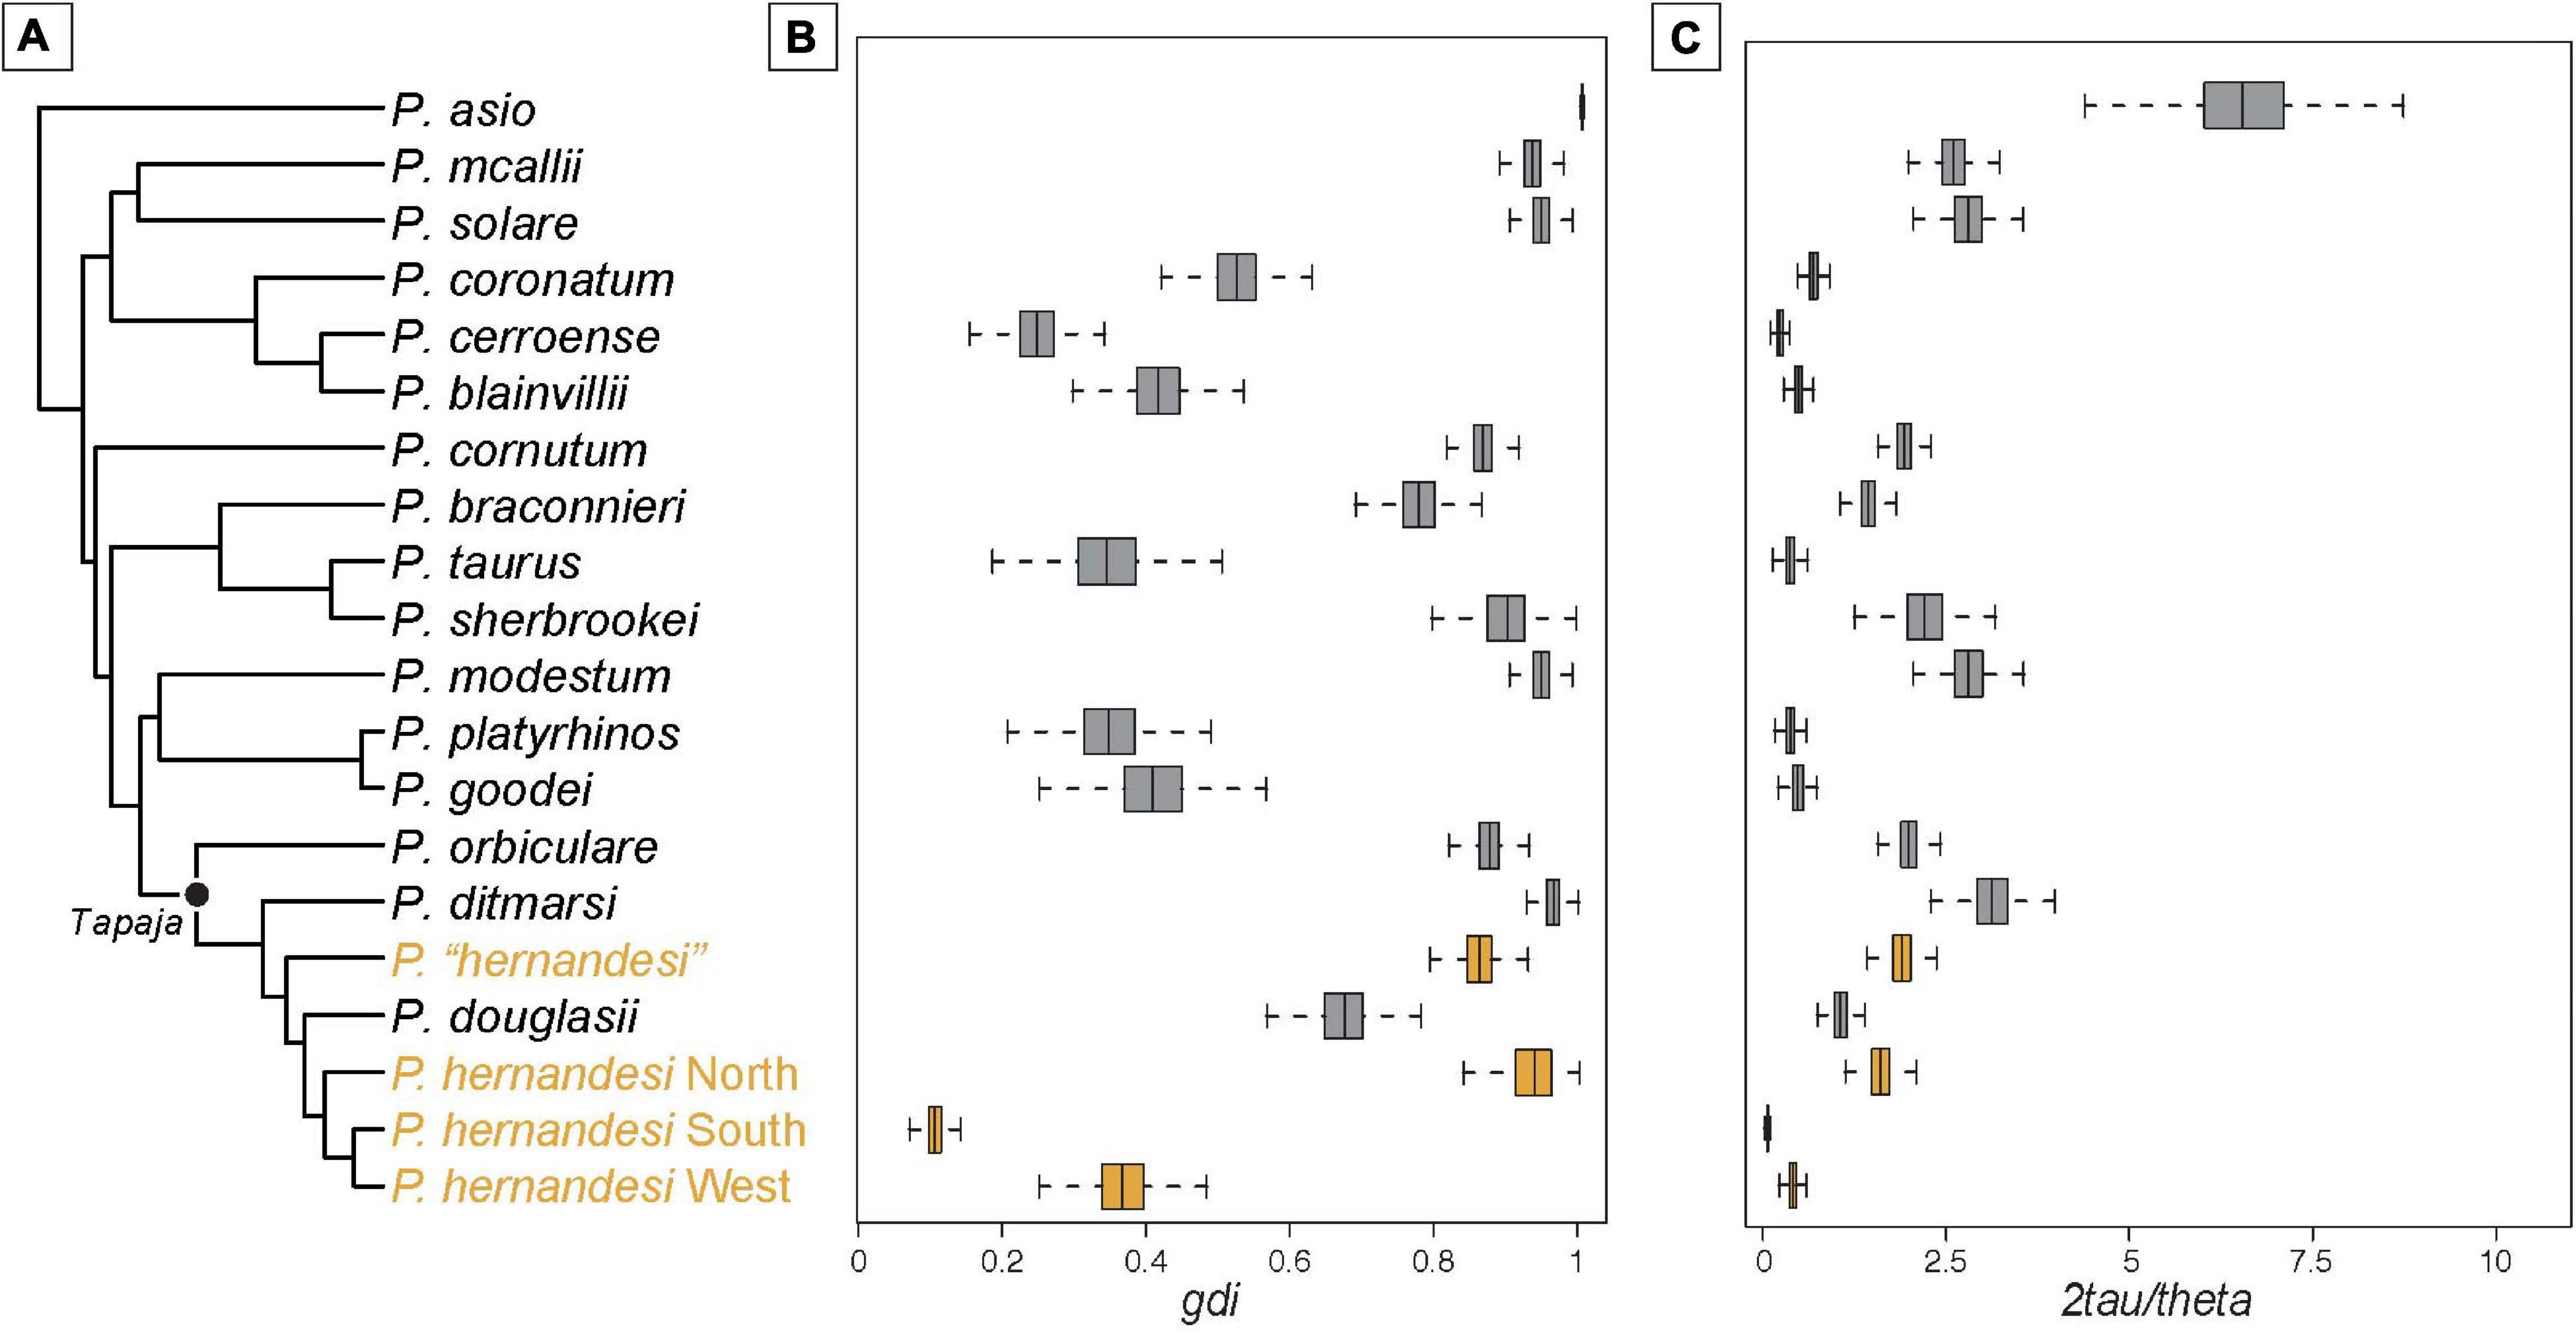
Figure 4. Comparison of Phrynosoma populations and species using measures of divergence. (A) Guide-tree used for the multispecies coalescent (MSC) estimation of population sizes (θ) and divergence times (τ) in BPP. The topology was estimated using 584 nuclear loci (Leaché and Linkem, 2015). The topology for the Short-horned Lizards (Tapaja) has been updated to include the populations shown in Figures 1, 2. Box and whisker plots for gdi (B) and coalescent units (C) calculated using the posterior probability distributions for θ and τ estimated with BPP.
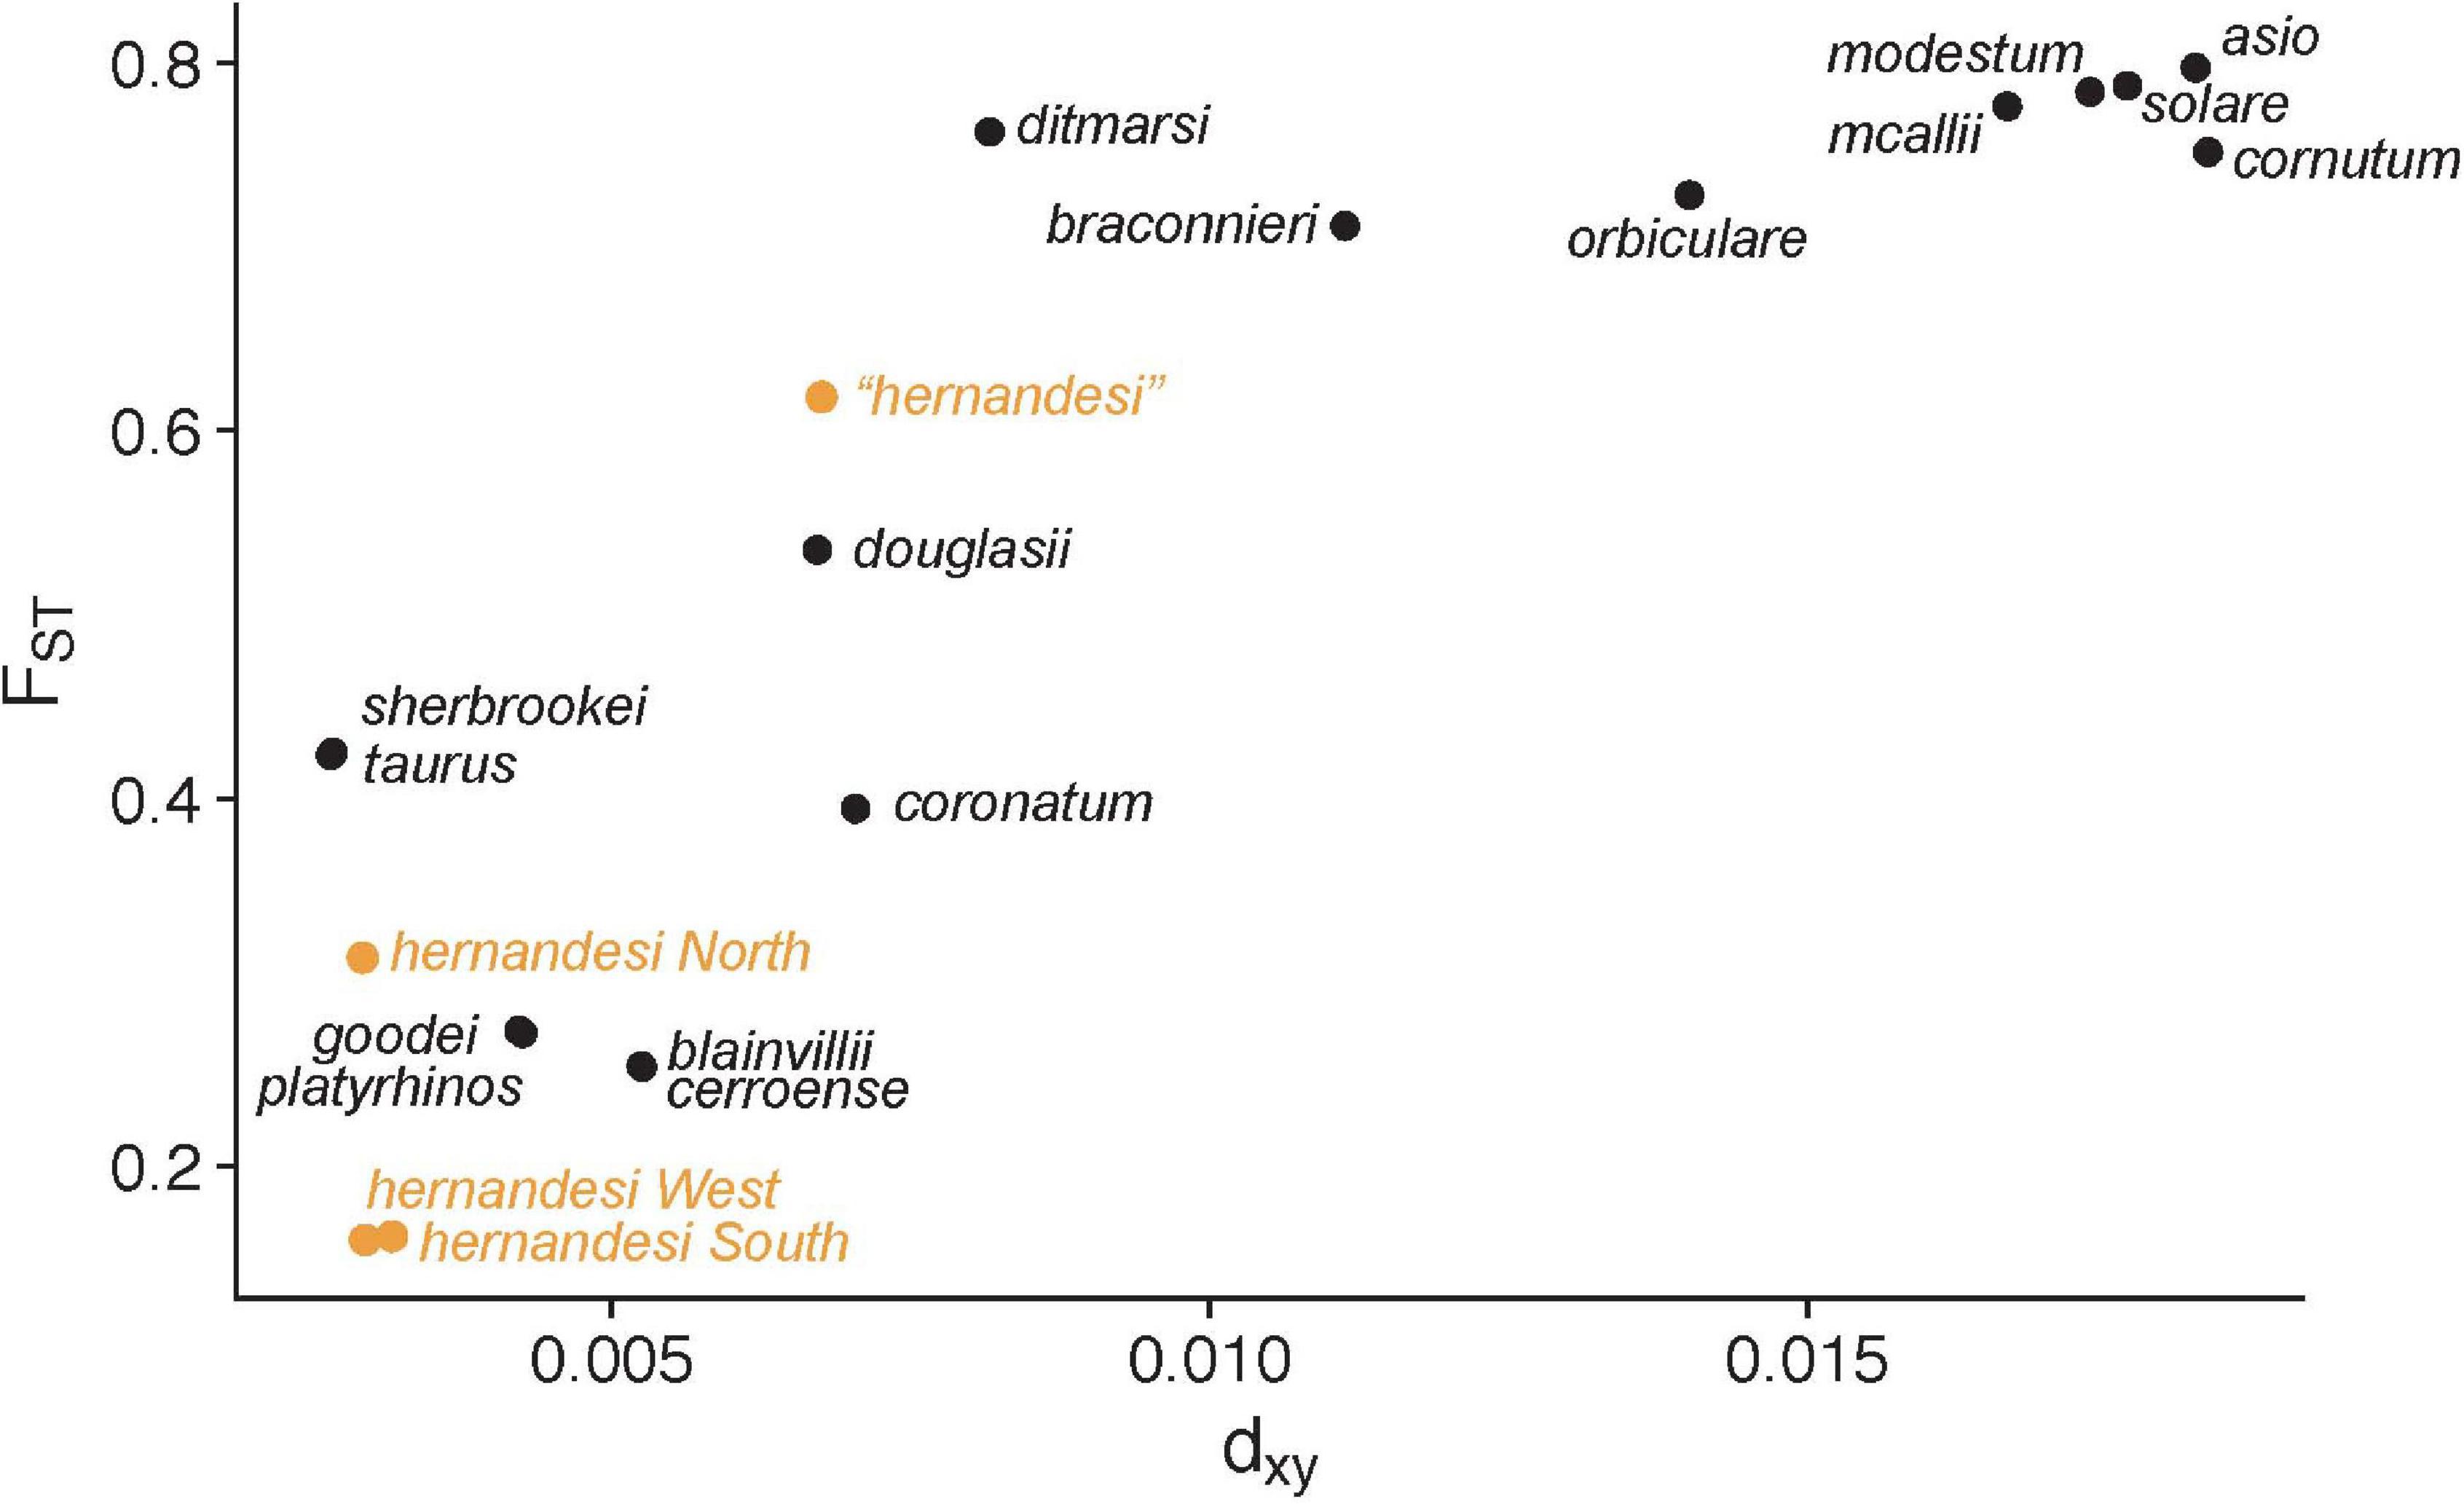
Figure 5. FST and dxy comparisons among Phrynosoma species (black dots) and four P. hernandesi populations (orange dots). FST and dxy were estimated among all population-pairs. For each taxon, shown are the lowest FST and dxy values across all its population comparisons. The three P. hernandesi populations (north, south, west) show markedly lower levels of genetic divergence compared to currently described species. The phylogenetically divergent P. “hernandesi” lineage has relatively high levels of genetic divergence in comparison to other described species.
Discussion
Systematics of the Phrynosoma hernandesi Species Complex
Using genomic data in a comparative taxonomic framework, this study resolves relationships within Phrynosoma and builds on previous studies using mitochondrial DNA (Zamudio et al., 1997) and morphological (Montanucci, 2015) data. The multilocus nuclear data support P. hernandesi being composed of at least two species. One of these species, P. hernandesi sensu stricto (referred to as P. hernandesi; Figure 2), has a broad distribution and contains at least three populations that diverged from P. douglasii approximately 3.9 mya. The other species, which up until now we have referred to as P. “hernandesi” (Figure 2) diverged earlier at approximately 5.6 mya and has a relatively restricted distribution in the southern portion of the range (Figure 2). This study supports the morphology-based taxonomy that described this divergent lineage as P. ornatissimum (Montanucci, 2015). Recognizing P. hernandesi and P. ornatissimum as two independent evolutionary lineages (= species) follows the general lineage concept of species (de Queiroz, 1998). Our phylogenetic analysis suggests that these lineages are distinct and divergent in relation to other species of Phrynosoma.
Phrynosoma ornatissimum was originally described by Girard (1858), and the current type locality is restricted to “Rio Grande Valley at Albuquerque, Bernalillo County, New Mexico” (Montanucci, 2015). This species has a unique combination of morphological characteristics, including but not limited to a relatively short tail, truncate snout, and large rounded dorsal spots with light-colored borders (Montanucci, 2015). Phrynosoma ornatissimum occurs at relatively low elevations (1,436 m–2,134 m) and primarily in arid short-grass plains of southern New Mexico, Texas, and northern Mexico (Montanucci, 2015). Phrynosoma ornatissimum is replaced by P. hernandesi at higher elevations (1,916–3,475 m) where juniper-pinyon woodland habitats dominate (Montanucci, 2015). The replacement of these species along elevation and habitat gradients results in a peculiar distributional pattern where montane populations of P. hernandesi are surrounded by P. ornatissimum occupying the adjacent short-grass plains (Supplementary Figure 4). If the isolated montane populations of P. hernandesi are reproductively isolated from one another, then it is possible that they could represent independent evolutionary lineages. Morphological data indicate that P. hernandesi and P. ornatissimum hybridize at habitat ecotones, but we found no evidence for admixture between these species based on the small number of P. ornatissimum samples included in our analyses. Interestingly, according to the mtDNA genealogy, the samples assigned to P. ornatissimum are nested within P. hernandesi (Figure 1), suggesting that mitochondrial introgression may have occurred at some point, or, that the genealogical discordance could be a consequence of incomplete lineage sorting. We were not able to include samples for P. o. brachycercum from Mexico, and additional work is needed to clarify how this taxon is related to P. ornatissimum and P. hernandesi. Based on geography and morphological similarities (Montanucci, 2015), it is likely P. o. brachycercum will be verified as conspecific with P. ornatissimum.
The results presented here call into question several of the morphology-based taxa described by Montanucci (2015), including P. bauri, P. brevirostris, P. diminutum, and P. hernandesi ornatum (Figure 1). We propose that these taxa should be lumped and placed within P. hernandesi sensu stricto (Supplementary Figure 5). Phrynosoma hernandesi contains at least three populations that are apparently connected by gene flow. Previous studies of P. hernandesi identified large geographic regions containing putative hybrid individuals with intermediate morphological characteristics (Montanucci, 2015). The nuclear data presented here provides additional support for hybridization. Clustering analyses revealed admixed individuals occurring in regions between populations (Figure 3), and demographic modeling inferred significant migration rates (>1 migration per generation). In addition, demographic modeling suggests that gene flow occurred during secondary contact following a period of divergence in isolation (Table 2). Theoretically, recent secondary contact can reinforce reproductive isolation as the offspring of the reconnected populations often have reduced fitness (Servedio, 2004). Alternatively, lineage fusion could be a possibility given some migration estimates exceed 1 migrant per generation (Table 3). Significant sampling gaps remain throughout the regions where admixed samples occur; collecting more specimens and data from these gaps will inform our understanding of the frequency of hybridization and introgression.
The genetic diversity of the three populations within Phrynosoma hernandesi is uneven, which has a direct influence on the coalescent-based estimates of genetic divergence. The west and south populations have relatively large population sizes (θ), and, together with their recent divergence time, this places them both at the low end of the speciation continuum in comparison to most other Phrynosoma (Figure 4). In contrast, the north population of P. hernandesi could be considered a separate species based on the coalescent estimates of genetic divergence in the reference-based taxonomy (Figure 4), but we argue that this result is driven primarily by small population size (θ). Genetic diversity is low for the north population, likely resulting from a recent bottleneck and/or recent population expansion into northern latitudes (Leung et al., 2014). However, comparisons of FST and dxy values suggest that the northern population of P. hernandesi is at the lower end of the Phrynosoma speciation continuum along with the southern and western populations (Figure 5). This disparity among genetic divergence measures highlights the problematic nature that population size estimates can have on heuristic species delimitation. Recent simulation work has shown that population histories that include drastically different population sizes and asymmetric migration rates can create an anomaly zone with skewed gene tree probabilities that mislead species delimitation (Jiao and Yang, 2021). This situation could apply to P. hernandesi populations, which have drastically different population sizes and asymmetric migration rates.
The evidence presented here for admixture and gene flow among P. hernandesi populations suggests that these populations are incompletely separated and that they may not represent independent evolutionary lineages. Given that the nature of population admixture and hybridization can and should have an important influence on species delimitation (Burbrink and Ruane, in press), it would be premature to describe these populations as species. Simulation studies have shown that sparse sampling and isolation by distance can lead to inaccurate species delimitations (Mason et al., 2020). Further, it is too early to tell if hybridization will lead to reinforcing or fusing of population boundaries. There is an active discussion on how to treat incompletely/partially separated lineages in species delimitation. Lineages such as these have been argued to be species by some authors (Frost and Hillis, 1990), and subspecies by others (Hillis, 2020), while still others argue that they are both species and subspecies (de Queiroz, 2020). Here, we take a conservative approach; we do not recognize these populations as subspecies or species. Given the strong evidence for lack of reproductive isolation among populations, future studies of this species complex will benefit from increased sampling at population boundaries.
A morphologically distinctive population of Phrynosoma hernandesi occurs in the San Luis Valley in southern Colorado and northern New Mexico (Lahti, 2010). This population was described as a new species (P. diminutum) by Montanucci (2015). The San Luis Valley is a broad and relatively flat valley (20,700 km2) at the headwaters of the Rio Grande River located between the Sangre de Cristo Mountain Range to the east and the San Juan Mountain Range to the west. The population of P. hernandesi in the San Luis Valley is morphologically distinctive with a significantly smaller body size and proportions compared to populations in surrounding areas (Hahn, 1968; Lahti, 2010; Montanucci, 2015). The mtDNA genealogy (Figure 1) suggests that all samples from the San Luis Valley form a recently diverged clade (≤0.5 mya) within the central clade of P. hernandesi that is closely related to samples from northern New Mexico. While morphologically distinct, the recent divergence of the San Luis Valley P. hernandesi suggests that this population is not a unique evolutionary lineage. Additional studies of the demographic and phylogenetic history of P. hernandesi in the San Luis Valley are needed.
Discordance between the nuclear and mtDNA data results in conflicting interpretations of P. hernandesi monophyly (Supplementary Figure 6). The nuclear phylogeny supports the monophyly of P. hernandesi, whereas the mtDNA genealogy supports P. hernandesi paraphyly with respect to P. ditmarsi and P. ornatissimum (Supplementary Figure 6). These results are similar to previous analyses of mtDNA data (Zamudio et al., 1997; Leung et al., 2014; Blair and Bryson, 2017) and nuclear data (Leaché and Linkem, 2015; Leaché et al., 2015), although previous genetic studies have not considered P. ornatissimum as a separate species. This discordance highlights an obvious problem with using a single genetic locus to delimit species: A taxonomy based on the mtDNA data will reflect the idiosyncratic history of a single genetic locus instead of the evolutionary history of the populations and species. Incomplete lineage sorting and introgression of the mtDNA genome can lead to phylogenetic discordance (Toews and Brelsford, 2012), resulting in using mtDNA for species delimitation unreliable. By ignoring these issues and not incorporating any published nuclear data, a recent species delimitation study of Phrynosoma based solely on mtDNA reduced the number of species from 17 to 12 (Köhler, 2021). We recommend the use of an 18 species taxonomy for Phrynosoma, which considers and builds upon all available data. This taxonomy is outlined in Table 1, with the addition of P. ornatissimum in place of P. “hernandesi.”
The Potential and Challenges of Comparative Species Delimitation
A reference-guided approach to species delimitation has two primary benefits. First, comparative species delimitation ensures that the ultimate output—a taxonomy of species—results in comparable units within the designated clade (Fujita and Leaché, 2011). Having standardized units is essential for downstream uses of a species taxonomy, including comparative analyses of diversification, biogeographic reconstruction, and trait evolution (Ruane et al., 2014) and conservation aims (Fujita et al., 2012). Second, researchers can define the appropriate phylogenetic scale for determining the threshold (Hey and Pinho, 2012; Galtier, 2019). If set at the appropriate phylogenetic scale, this threshold can reflect shared biogeographic history, which might also affect the rates at which populations transition to species (Mittelbach et al., 2007). In this study, we compared genetic diversity metrics among Phrynosoma; all species in the clade have similar life history characteristics (Sherbrooke, 2003) and speciated across the same general biogeographic arena (Scarpetta et al., 2020). However, if species vary in the rate at which reproductive isolation evolves (Rabosky and Matute, 2013; Campillo et al., 2020), lineages will acquire evolutionary independence at different rates, making it difficult to identify a fixed threshold. In Phrynosoma, the lowest gdi among species is ∼0.3 for P. cerroense (Figure 4). Applying this as our threshold for a population-species boundary would lead to the recognition of some P. hernandesi populations as species (north and west), but not the south (Figure 4). However, this assumes that all the species in Phrynosoma achieve evolutionary independence at similar rates, a yet untested assumption.
There are several potential weaknesses of comparative species delimitation as implemented here. This approach assumes that the existing taxonomy is robust. If the existing taxonomy consists of overly split or overly lumped species, a reference-guided taxonomy would perpetuate these biases into the new species delimitations. This can be further complicated if the initial taxonomy was defined along an axis not included in the current study. For example, imagine a taxonomy initially defined by differences in external morphology and color pattern, which is pertinent to the case of the Phrynosoma. If a subsequent reference-guided approach measured genetic divergence among species, and if external morphology and color pattern are uncorrelated with genetic divergence, then a reference-based approach would be less useful. One solution might be to be selective in which species are included in the reference taxonomy—e.g., only including species that exist in sympatry with close relatives (Tobias et al., 2010). This approach is likely to be overly conservative in estimating separately evolving lineages, given that species that occur in sympatry are often relatively far along in the process of lineage divergence. Fortunately, the existing taxonomy of species is robust in Phrynosoma, and many described species exhibit high levels of genetic divergence that are indicative of species-level differences (gdi > 0.7; Figure 4).
More generally, reference-guided taxonomy works best when divergence across different axes are correlated. But, empirical examples of speciation indicate that divergence can be inconsistent across axes. Most notably perhaps are cases of ecological speciation, in which species often exhibit pronounced phenotypic divergence but limited genetic divergence. How do we best reconcile conflicting signals from multiple axes, such as those can arise from conflicts between molecular and morphological data? One solution might be to apply integrative approaches to species delimitation that can accommodate different lines of evidence in a joint analysis (Solís-Lemus et al., 2015). The present study is an extreme version of this issue; here, we see inconsistencies across multiple metrics of the same axis of divergence: Genetic divergence (Figures 4, 5). The northern population of P. hernandesi is distinct using the gdi metric (Figure 4) but not with other genetic metrics (Figure 5). Because we identified that metrics relying on population size can sometimes be problematic (gdi; Figure 4), we took a conservative approach and concluded for now that the northern population of P. hernandesi does not meet the criteria for being named a species (Figure 5).
Finally, comparative species delimitation does not solve some of the most persistent and thorny issues in species delimitation. Sampling gaps can create the illusion of discrete, evolutionarily independent species units (Barley et al., 2018). However, as shown in the current study, even sparse sampling throughout parapatric population borders can reveal gene flow between putative taxa, complicating our understandings of species boundaries. Introgression more generally poses a challenge for species delimitation (Burbrink et al., 2021; Jiao and Yang, 2021). An influx of genomic data has revealed that introgression is common during population divergence and between species (Edwards et al., 2016). However, determining how much introgression is too much is not clear and might depend on the underlying genomic architecture of gene flow (Harrison and Larson, 2014; Barth et al., 2020). For example, should the relatively high exchange of migrants among P. hernandesi populations be sufficient to preclude species status? How should our interpretation change if introgression is heterogeneous across the genome?
Data Availability Statement
The datasets presented in this study can be found in online repositories. The names of the repository/repositories and accession number(s) can be found below: https://www.ncbi.nlm.nih.gov/genbank/, MW662366 - MW662452; https://www.ncbi.nlm.nih.gov/, BioProject PRJNA704386; https://datadryad.org/stash, doi: 10.5061/dryad.gtht76hmq; https://www.ncbi.nlm.nih.gov/genbank/, MZ313846 - MZ313861.
Ethics Statement
All animal research protocols presented in this study were approved by the University of Washington Institutional Animal Care and Use Committee (UW IACUC #4367-03).
Author Contributions
KZ and MEL contributed the samples. HD collected the data. AL and SS performed the analyses. All authors wrote the manuscript and designed the study.
Funding
This project was supported by the National Science Foundation grants to AL (NSF-SBS-2023723), SS (NSF-SBS-2023979), and MF (NSF-SBS-2024014).
Conflict of Interest
The authors declare that the research was conducted in the absence of any commercial or financial relationships that could be construed as a potential conflict of interest.
Publisher’s Note
All claims expressed in this article are solely those of the authors and do not necessarily represent those of their affiliated organizations, or those of the publisher, the editors and the reviewers. Any product that may be evaluated in this article, or claim that may be made by its manufacturer, is not guaranteed or endorsed by the publisher.
Acknowledgments
We thank the Arizona Game and Fish Department for permission to collect specimens for scientific research (LIC# SP568189). We thank K. Epperly for assisting in ddRADseq and mtDNA data collection. We thank the following collections for tissue loans: Louisiana State University Museum of Natural Science; Museum of Southwestern Biology, University of New Mexico; Burke Museum of Natural History and Culture, University of Washington; California Academy of Sciences; Museum of Vertebrate Zoology, University of California, Berkeley; Oklahoma Collection of Genomic Resources, Sam Noble Oklahoma Museum of Natural History, The University of Oklahoma; Dr. Rafael Alejandro Lara Reséndiz, Instituto de Biología, UNAM; Peabody Museum of Natural History, Yale University; and Dr. B. Riddle, University of Las Vegas. We thank Keaka Farleigh and Dr. Tereza Jezkova for sharing data for Phrynosoma platyrhinos. MEL thanks to Drs. E.D. Brodie and M. E. Pfrender for their mentorship and lab use for Phrynosoma hernandesi samples from the San Luis Valley. This work used the Vincent J. Coates Genomics Sequencing Laboratory at UC Berkeley, supported by NIH S10 OD018174 Instrumentation Grant.
Supplementary Material
The Supplementary Material for this article can be found online at: https://www.frontiersin.org/articles/10.3389/fevo.2021.678110/full#supplementary-material
Footnotes
References
Alexander, D. H., Novembre, J., and Lange, K. (2009). Fast model-based estimation of ancestry in unrelated individuals. Genome Res. 19, 1655–1664. doi: 10.1101/gr.094052.109
Barley, A. J., Brown, J. M., and Thomson, R. C. (2018). Impact of model violations on the inference of species boundaries under the multispecies coalescent. Syst. Biol. 67, 269–284. doi: 10.1093/sysbio/syx073
Barth, J. M., Gubili, C., Matschiner, M., Tørresen, O. K., Watanabe, S., Egger, B., et al. (2020). Stable species boundaries despite ten million years of hybridization in tropical eels. Nat. commun. 11, 1–13.
Blair, C., and Ané, C. (2020). Phylogenetic trees and networks can serve as powerful and complementary approaches for analysis of genomic data. Syst. Biol. 69, 593–601. doi: 10.1093/sysbio/syz056
Blair, C., and Bryson, R. W. (2017). Cryptic diversity and discordance in single-locus species delimitation methods within horned lizards (Phrynosomatidae: Phrynosoma). Mol. Ecol. Res. 17, 1168–1182. doi: 10.1111/1755-0998.12658
Bouckaert, R., Vaughan, T. G., Barido-Sottani, J., Duchêne, S., Fourment, M., Gavryushkina, A., et al. (2019). BEAST 2.5: an advanced software platform for Bayesian evolutionary analysis. PLoS Comput. Biol. 15:e1006650. doi: 10.1371/journal.pcbi.1006650
Bryant, D., and Moulton, V. (2004). Neighbor-net: an agglomerative method for the construction of phylogenetic networks. Mol. Biol. Evol. 21, 255–265. doi: 10.1093/molbev/msh018
Bryant, D., Bouckaert, R., Felsenstein, J., Rosenberg, N. A., and RoyChoudhury, A. (2012). Inferring species trees directly from biallelic genetic markers: bypassing gene trees in a full coalescent analysis. Mol. Biol.Evol. 29, 1917–1932. doi: 10.1093/molbev/mss086
Burbrink, F. T., Gehara, M., McKelvy, A. D., and Myers, E. A. (2021). Resolving spatial complexities of hybridization in the context of the gray zone of speciation in North American ratsnakes (Pantherophis obsoletus complex) in press. Evolution 75, 260–277. doi: 10.1111/evo.14141
Campillo, L. C., Barley, A. J., and Thomson, R. C. (2020). Model-based species delimitation: are coalescent species reproductively isolated? Syst. Biol. 69, 708–721. doi: 10.1093/sysbio/syz072
Carstens, B. C., Pelletier, T. A., Reid, N. M., and Satler, J. D. (2013). How to fail at species delimitation. Mol. Ecol. 22, 4369–4383. doi: 10.1111/mec.12413
Chan, K. O., and Grismer, L. L. (2019). To split or not to split? Multilocus phylogeny and molecular species delimitation of southeast Asian toads (family: Bufonidae). BMC Evol. Biol. 19:95. doi: 10.1186/s12862-019-1422-3
de Queiroz, K. (1998). “The general lineage concept of species, species criteria, and the process of speciation: a conceptual unification and terminological recommendations,” in Endless Forms: Species And Speciation, eds D. J. Howard and S. H. Berlocher (Oxford: Oxford University Press), 57–75.
de Queiroz, K. (2007). Species concepts and species delimitation. Syst. Biol. 56, 879–886. doi: 10.1080/10635150701701083
de Queiroz, K. (2020). An updated concept of subspecies resolves a dispute about the taxonomy of incompletely separated lineages. Herpetol. Rev. 51, 459–461.
Eaton, D. A., and Overcast, I. (2020). ipyrad: interactive assembly and analysis of RADseq datasets. Bioinformatics 36, 2592–2594. doi: 10.1093/bioinformatics/btz966
Edwards, S. V., Potter, S., Schmitt, C. J., Bragg, J. G., and Moritz, C. (2016). Reticulation, divergence, and the phylogeography-phylogenetics continuum. Proc. Nat. Acad. Sci. U.S.A. 113, 8025–8032. doi: 10.1073/pnas.1601066113
Excoffier, L., Dupanloup, I., Huerta-Sánchez, E., Sousa, V. C., and Foll, M. (2013). Robust demographic inference from genomic and SNP data. PLoS Genetics 9:e1003905. doi: 10.1371/journal.pgen.1003905
Flouri, T., Jiao, X., Rannala, B., and Yang, Z. (2018). Species tree inference with BPP using genomic sequences and the multispecies coalescent. Mol. Biol. Evol. 35, 2585–2593. doi: 10.1093/molbev/msy147
Frost, D. R., and Hillis, D. M. (1990). Species in concept and practice: herpetological applications. Herpetologica 46, 87–104.
Fujita, M. K., and Leaché, A. D. (2011). A coalescent perspective on delimiting and naming species: a reply to Bauer et al. Proc. R. Soc. B: Biol. Sci. 278, 493–495. doi: 10.1098/rspb.2010.1864
Fujita, M. K., Leaché, A. D., Burbrink, F. T., McGuire, J. A., and Moritz, C. (2012). Coalescent-based species delimitation in an integrative taxonomy. Trends Ecol. Evol. 27, 480–488. doi: 10.1016/j.tree.2012.04.012
Galtier, N. (2019). Delineating species in the speciation continuum: a proposal. Evol. Appl. 12, 657–663. doi: 10.1111/eva.12748
Girard, C. (1858). Herpetology. United States Exploring Expedition. During the years 1838, 1839, 1840, 1841, 1842 under the command of Charles Wilkes, U.S.N. J. B. Lippincott and Co., Philadelphia, PA., 20, xviii + 496 pp. Philadelphia, PA: C. Sherman & Son.
Hahn, D. E. (1968). A Biogeographic Analysis of the Herpetofauna of the San Luis Valley, Colorado. Master’s Thesis. Baton Rouge, LA Louisiana State University.
Harrison, R. G., and Larson, E. L. (2014). Hybridization, introgression, and the nature of species boundaries. J. Hered. 105, 795–809. doi: 10.1093/jhered/esu033
Hebert, P. D. N., Stoeckle, M. Y., Zemlak, T. S., and Francis, C. M. (2004). Identification of birds through DNA barcodes. PLoS Biol. 2:e312. doi: 10.1371/journal.pbio.0020312
Hebert, P. D. N., and Gregory, T. R. (2005). The promise of DNA barcoding for taxonomy. Syst. Biol. 54, 852–859. doi: 10.1080/10635150500354886
Hey, J., and Pinho, C. (2012). Population genetics and objectivity in species diagnosis. Evolution 66, 1413–1429. doi: 10.1111/j.1558-5646.2011.01542.x
Hickerson, M. J., Meyer, C. P., and Moritz, C. (2006). DNA barcoding will often fail to discover new animal species over broad parameter space. Syst. Biol. 55, 729–739. doi: 10.1080/10635150600969898
Hillis, D. M. (2020). The detection and naming of geographic variation within species. Herpetol. Rev. 51, 52–56.
Huson, D. H., and Bryant, D. (2006). Application of phylogenetic networks in evolutionary studies. Mol. Biol. Evol. 23, 254–267. doi: 10.1093/molbev/msj030
Jackson, N. D., Carstens, B. C., Morales, A. E., and O’Meara, B. C. (2017). Species delimitation with gene flow. Syst. Biol. 66, 799–812.
Jiao, X., and Yang, Z. (2021). Defining species when there is gene flow. Syst. Biol. 70, 108–119. doi: 10.1093/sysbio/syaa052
Jombart, T. (2008). adegenet: a R package for the multivariate analysis of genetic markers. Bioinformatics 24, 1403–1405. doi: 10.1093/bioinformatics/btn129
Jones, G., Aydin, Z., and Oxelman, B. (2015). DISSECT: an assignment-free Bayesian discovery method for species delimitation under the multispecies coalescent. Bioinformatics 31, 991–998. doi: 10.1093/bioinformatics/btu770
Kapli, P., Lutteropp, S., Zhang, J., Kobert, K., Pavlidis, P., Stamatakis, A., et al. (2017). Multi-rate Poisson tree processes for single-locus species delimitation under maximum likelihood and Markov chain Monte Carlo. Bioinformatics 33, 1630–1638.
Kearse, M., Moir, R., Wilson, A., Stones-Havas, S., Cheung, M., Sturrock, S., et al. (2012). Geneious Basic: an integrated and extendable desktop software platform for the organization and analysis of sequence data. Bioinformatics 28, 1647–1649. doi: 10.1093/bioinformatics/bts199
Köhler, G. (2021). Taxonomy of horned lizards, genus Phrynosoma (Squamata. Phrynosomatidae). Taxonomy 1, 83–115. doi: 10.3390/taxonomy1020009
Lahti, M. E. (2010). The Status Of Dwarfed Populations Of Short-Horned Lizards (Phrynosoma hernandesi) and Great Plains Toads (Anaxyrus cognatus) in the san Luis Valley, Colorado. Dissertation. Logan (UT): Utah State University.
Leaché, A. D., and McGuire, J. A. (2006). Phylogenetic relationships of horned lizards (Phrynosoma) based on nuclear and mitochondrial data: evidence for a misleading mitochondrial gene tree. Mol. Phylogenet. Evol. 39, 628–644. doi: 10.1016/j.ympev.2005.12.016
Leaché, A. D., and Linkem, C. W. (2015). Phylogenomics of horned lizards (Genus: Phrynosoma) using targeted sequence capture data. Copeia 103, 586–594. doi: 10.1643/ch-15-248
Leaché, A. D., Banbury, B. L., Felsenstein, J., De Oca, A. N. M., and Stamatakis, A. (2015). Short tree, long tree, right tree, wrong tree: new acquisition bias corrections for inferring SNP phylogenies. Syst. Biol. 64, 1032–1047. doi: 10.1093/sysbio/syv053
Leaché, A. D., Zhu, T., Rannala, B., and Yang, Z. (2019). The spectre of too many species. Syst. Biol. 68, 168–181. doi: 10.1093/sysbio/syy051
Leung, M. N.-Y., Paszkowski, C. A., and Russell, A. P. (2014). Genetic structure of the endangered greater short -horned lizard (Phrynosoma hernandesi) in Canada: evidence from mitochondrial and nuclear genes. Can. J. Zoo. 92, 875–883. doi: 10.1139/cjz-2014-0079
Mason, N. A., Fletcher, N. K., Gill, B. A., Funk, W. C., and Zamudio, K. R. (2020). Coalescent-based species delimitation is sensitive to geographic sampling and isolation by distance. Syst. Biodivers. 18, 269–280. doi: 10.1080/14772000.2020.1730475
Mittelbach, G. G., Schemske, D. W., Cornell, H. V., Allen, A. P., Brown, J. M., Bush, M. B., et al. (2007). Evolution and the latitudinal diversity gradient: speciation, extinction and biogeography. Ecol. Lett. 10, 315–331.
Montanucci, R. R. (2015). A taxonomic revision of the Phrynosoma douglasii species complex (Squamata: Phrynosomatidae). Zootaxa 4015, 1–177. doi: 10.11646/zootaxa.4015.1.1
Moritz, C., and Cicero, C. (2004). DNA barcoding: promise and pitfalls. PLoS Biol. 2:e354. doi: 10.1371/journal.pbio.0020354
Padial, J. M., Miralles, A., De la Riva, I., and Vences, M. (2010). The integrative future of taxonomy. Front. Zoo. 7:1–14. doi: 10.1186/1742-9994-7-16
Pamilo, P., and Nei, M. (1988). Relationships between gene trees and species trees. Mol. Biol. Evol. 5, 568–583.
Perry, B. W., Card, D. C., McGlothlin, J. W., Pasquesi, G. I., Adams, R. H., Schield, D. R., et al. (2018). Molecular adaptations for sensing and securing prey and insight into amniote genome diversity from the garter snake genome. Genome Biol. Evol. 10, 2110–2129. doi: 10.1093/gbe/evy157
Peterson, B. K., Weber, J. N., Kay, E. H., Fisher, H. S., and Hoekstra, H. E. (2012). Double digest RADseq: an inexpensive method for de novo SNP discovery and genotyping in model and non-model species. PloS One 7:e37135. doi: 10.1371/journal.pone.0037135
Poelstra, J., Salmona, J., Tiley, G. P., Schüßler, D., Blanco, M. B., Andriambeloson, J. B., et al. (2021). Cryptic patterns of speciation in cryptic primates: microendemic mouse lemurs and the multispecies coalescent. Syst. Biol. 70, 203–218. doi: 10.1093/sysbio/syaa053
Rabosky, D. L., and Matute, D. R. (2013). Macroevolutionary speciation rates are decoupled from the evolution of intrinsic reproductive isolation in Drosophila and birds. Proc. Nat. Acad. Sci. U.S.A. 110, 15354–15359. doi: 10.1073/pnas.1305529110
Rannala, B. (2015). The art and science of species delimitation. Curr. Zoo. 61, 846–853. doi: 10.1093/czoolo/61.5.846
Reich, D., Thangaraj, K., Patterson, N., Price, A. L., and Singh, L. (2009). Reconstructing Indian population history. Nature 461, 489–494. doi: 10.1038/nature08365
Ruane, S., Bryson, R. W., Pyron, R. A., and Burbrink, F. T. (2014). Coalescent species delimitation in milksnakes (genus Lampropeltis) and impacts on phylogenetic comparative analyses. Syst. Biol. 63, 231–250. doi: 10.1093/sysbio/syt099
Scarpetta, S. G., Ledesma, D. T., Llauger, F. O., and White, B. A. (2020). Evolution of North American lizards. eLS 1, 705–717. doi: 10.1002/9780470015902.a0029078
Servedio, M. R. (2004). The what and why of research on reinforcement. PLoS Biol. 2:e420. doi: 10.1371/journal.pbio.0020420
Sherbrooke, W. C. (2003). Introduction to Horned Lizards of North America (No. 64). Berkeley: University of California Press.
Sites, J. W., and Marshall, J. C. (2003). Delimiting species: a Renaissance issue in systematic biology. Trends Ecol. Evol. 18, 462–470. doi: 10.1016/s0169-5347(03)00184-8
Sites, J. W., and Marshall, J. C. (2004). Operational criteria for delimiting species. Ann. Rev. Ecol. Evol. Syst. 35, 199–227. doi: 10.1146/annurev.ecolsys.35.112202.130128
Smith, M. L., and Carstens, B. C. (2020). Process-based species delimitation leads to identification of more biologically relevant species. Evolution 74, 216–229. doi: 10.1111/evo.13878
Solís-Lemus, C., Knowles, L. L., and Ané, C. (2015). Bayesian species delimitation combining multiple genes and traits in a unified framework. Evolution 69, 492–507. doi: 10.1111/evo.12582
Stamatakis, A. (2014). RAxML version 8: a tool for phylogenetic analysis and post-analysis of large phylogenies. Bioinformatics 30, 1312–1313. doi: 10.1093/bioinformatics/btu033
Stange, M., Sánchez-Villagra, M. R., Salzburger, W., and Matschiner, M. (2018). Bayesian divergence-time estimation with genome-wide single-nucleotide polymorphism data of sea catfishes (Ariidae) supports Miocene closure of the Panamanian Isthmus. Syst. Biol. 67, 681–699. doi: 10.1093/sysbio/syy006
Sukumaran, J., and Knowles, L. L. (2017). Multispecies coalescent delimits structure, not species. Proc. Nat. Acad. Sci. U.S.A. 114, 1607–1612. doi: 10.1073/pnas.1607921114
Sukumaran, J., Holder, M. T., and Knowles, L. L. (2021). Incorporating the speciation process into species delimitation. PLoS Comput. Biol. 17:e1008924. doi: 10.1371/journal.pcbi.1008924
Tobias, J. A., Seddon, N., Spottiswoode, C. N., Pilgrim, J. D., Fishpool, L. D., and Collar, N. J. (2010). Quantitative criteria for species delimitation. Ibis 152, 724–746. doi: 10.1111/j.1474-919x.2010.01051.x
Toews, D. P., and Brelsford, A. (2012). The biogeography of mitochondrial and nuclear discordance in animals. Mol. Ecol. 21, 3907–3930. doi: 10.1111/j.1365-294x.2012.05664.x
Yang, Z. (2015). The BPP program for species tree estimation and species delimitation. Curr. Zoo. 61, 854–865. doi: 10.1093/czoolo/61.5.854
Yang, Z., and Rannala, B. (2010). Bayesian species delimitation using multilocus sequence data. Proc. Nat. Acad. Sci. U.S.A. 107, 9264–9269. doi: 10.1073/pnas.0913022107
Yang, Z., and Rannala, B. (2017). Bayesian species identification under the multispecies coalescent provides significant improvements to DNA barcoding analyses. Mol. Ecol. 26, 3028–3036. doi: 10.1111/mec.14093
Keywords: multispecies coalescent, Phrynosoma, phylogeography, species delimitation, systematics, taxonomy comparative species delimitation
Citation: Leaché AD, Davis HR, Singhal S, Fujita MK, Lahti ME and Zamudio KR (2021) Phylogenomic Assessment of Biodiversity Using a Reference-Based Taxonomy: An Example With Horned Lizards (Phrynosoma). Front. Ecol. Evol. 9:678110. doi: 10.3389/fevo.2021.678110
Received: 08 March 2021; Accepted: 14 June 2021;
Published: 26 July 2021.
Edited by:
Michael G. Campana, Smithsonian Conservation Biology Institute (SI), United StatesReviewed by:
Kevin De Queiroz, Smithsonian National Museum of Natural History (SI), United StatesSusan Tsang, American Museum of Natural History, United States
Copyright © 2021 Leaché, Davis, Singhal, Fujita, Lahti and Zamudio. This is an open-access article distributed under the terms of the Creative Commons Attribution License (CC BY). The use, distribution or reproduction in other forums is permitted, provided the original author(s) and the copyright owner(s) are credited and that the original publication in this journal is cited, in accordance with accepted academic practice. No use, distribution or reproduction is permitted which does not comply with these terms.
*Correspondence: Adam D. Leaché, bGVhY2hlQHV3LmVkdQ==