 Ying Liao
 Yiying Li1,2
 Jihui Fan
- 1Institute of Mountain Hazards and Environment, Chinese Academy of Sciences, Chengdu, China
- 2College of Resources and Environment, University of Chinese Academy of Sciences, Beijing, China
- 3Civil Engineering Department, Faculty of Engineering and Technology, Imam Khomeini International University, Qazvin, Iran
- 4Civil Engineering Department, Buein Zahra Technical University, Qazvin, Iran
Freezing and thawing indices (FI and TI) are commonly used as indicators for climate change assessment and permafrost extent estimation in cold regions. In this study, based on the meteorological daily data (1978–2017) among 34 meteorological stations in Tibet, the temperature in space has been interpolated and FI and TI have been calculated. Finally, spatiotemporal variations have been analyzed and the permafrost area has been estimated. The results showed the mean annual of FI and TI in Tibet are 1241.36 and 1290.22°C⋅day, respectively. A significant downward trend in freezing index (FI) and an upward trend in thawing index (TI) have been reported in the time series, in against, analyzing the spatial distribution showed there is an increasing trend from southeast to northwest for FI while TI was decreased gradually in the same region in Tibet. This research indicates that altitude has a significant influence on the change of FI and TI. With the increase of altitude, FI decreased and TI increased more significantly. The permafrost area was estimated at about 0.59 × 10⁶ km2 in Tibet.
Introduction
The cryosphere, mainly distributed in high-latitude and -altitude areas, is sensitive to climate warming (Qin et al., 2014). The global land surface temperature was 1.59 higher in the past two decades (2011–2020) than 1850–1900 (IPCC, 2021). Global warming resulted in that permafrost degraded area on the Qinghai-Tibet Plateau was about 105 km2 (Wang et al., 2000) and the permafrost temperature increased by 0.29 ± 0.12 °C from 2007 to 2016 (Ding et al., 2019), which may release more greenhouse gas into the atmosphere and accelerates global warming (Mu et al., 2018). Besides, frequent freeze-thaw cycling can affect the stability of the soil, destroy the ecological environment and threaten the safety of buildings (Feng et al., 2017). In order to better quantify the interdecadal and seasonal variations of permafrost, the freezing index (FI) and thawing index (TI) have been proposed, defined as the cumulative value of temperature within a specific period of time (Harris et al., 1988). Since the data is easy to catch, Freezing and thawing indices (FI and TI) are widely applying in estimating permafrost distribution (Nelson and Outcalt, 1987; Shi et al., 2019) and predicting active layer thickness (Nelson et al., 1997; Shiklomanov and Nelson, 2002; Zhang et al., 2005; Park et al., 2016; Peng et al., 2018). At first, the monthly average temperature was used to calculate annual air FI and TI in many areas (McCormick, 1991; Frauenfeld et al., 2007; Wu et al., 2011). However, the monthly average temperature may conceal the variation process of daily temperature, thus, the daily air temperature data has been used to calculate annual FI and TI and showed more advantages than the monthly air temperature (Steurer and Crandell, 1995; Shi et al., 2019). In small-scale region, observed daily temperature data were used to calculate and analyze FI and TI (Jiang et al., 2008, 2015; Wu et al., 2013; He et al., 2019; Dai et al., 2020; Liu and Luo, 2020). But the results may only display the situation in the vicinity of the representative stations and it may not provide the continuous spatial distribution of the FI and TI over the entire region especially in mountainous areas with intensive temperature variations. In order to show continuous spatial distribution, many studies directly interpolated FI and TI which have already been calculated at stations (Liu and Li, 2018; Wang et al., 2019), whereas in this research the FI and TI should be calculated after spatially interpolating of the original temperature data. Then the aim of this study is to present the order of interpolation and calculation which has a great impact on the final results.
Tibet is the original part of the Qinghai-Tibet Plateau and a significant part of the global cryosphere. A number of studies have indicated that Tibet climate are becoming warmer and more humid with air temperature growth rate reached 0.3–0.4°C⋅(10a)–1 over the past 50 years has, which is about twice the global temperature increment rate in the same period (Liu and Yin, 2002; Rangwala et al., 2009; Kang et al., 2010). Since the positively or negatively changes in accumulated temperature near the ground surface will directly have an effect on the augmentation and shrinkage of permafrost and seasonally frozen soil, therefore, the frozen soil of Tibet has been strongly influenced with a thickness of overall active layer growth at a rate of 0.036 – 0.075 m⋅a–1 in the past 30 years (Wu and Zhang, 2010; Li et al., 2012). Along with the negative effects caused by population growth, industrial emissions, tourism development and so on, the fragility of the permafrost of Tibet has become increasingly prominent (Du et al., 2004), which will destroy the ecological balance and hinder engineering construction. Nevertheless, previous researches on using FI and TI for the evaluation of climate change and permafrost mainly applied across the whole Northern Hemisphere (Shi et al., 2019) with 25 km resolution and the permafrost areas were illustrated in hemispherical scale, but the results for the Tibetan Plateau, the third pole of the world, were not detailed enough. Some available studies focused on Tibet but only the Yarlung Zangbo River basin (Liu and Luo, 2020) or along the Qinghai-Tibet Railway (Jiang et al., 2008), and did not conduct a systematic study of using FI and TI to estimate permafrost throughout the whole Tibet.
Freezing and thawing indices only calculated at meteorological database cannot show spatial continuity and the results of directly interpolating FI and TI lacks rationality, so the high-resolution FI and TI spatial variations and the distribution of frozen soil in Tibet have never been calculated and mapped. Since that, the objectives of this paper are as follows: (1) this study utilizes the combined Inverse Distance Weighted (IDW) and temperature lapse rate method to evaluate temporal and spatial daily air temperature datasets by air temperature over 34 representative meteorological stations during 1978–2017; (2) stimulate and map the temporal and spatial distribution and variation of FI and TI in Tibet during 1978–2017; (3) estimate the extent and area of Tibet permafrost based on the stimulated high-resolution FI and TI by using a predictive model.
Materials and Methods
Study Area and Data
Tibet is located in the mid-latitudes of the northern hemisphere (26°50′∼36°53′N,78°25′∼99°06′E) with an area of approximately 120 × 104 km2 and the average elevation is 4,700 m (Figure 1; Yang et al., 2011). The mean annual temperature and precipitation decrease from southeast to northwest, ranging −1.1 ∼ 12.1°C and 117.4 ∼ 929.4 mm, respectively.1 The permafrost area of Tibet is 70 km2 × 104 km2, which is about half of the permafrost area of the entire Qinghai-Tibet Plateau (Zhang et al., 2010) and is the largest alpine permafrost area in China.
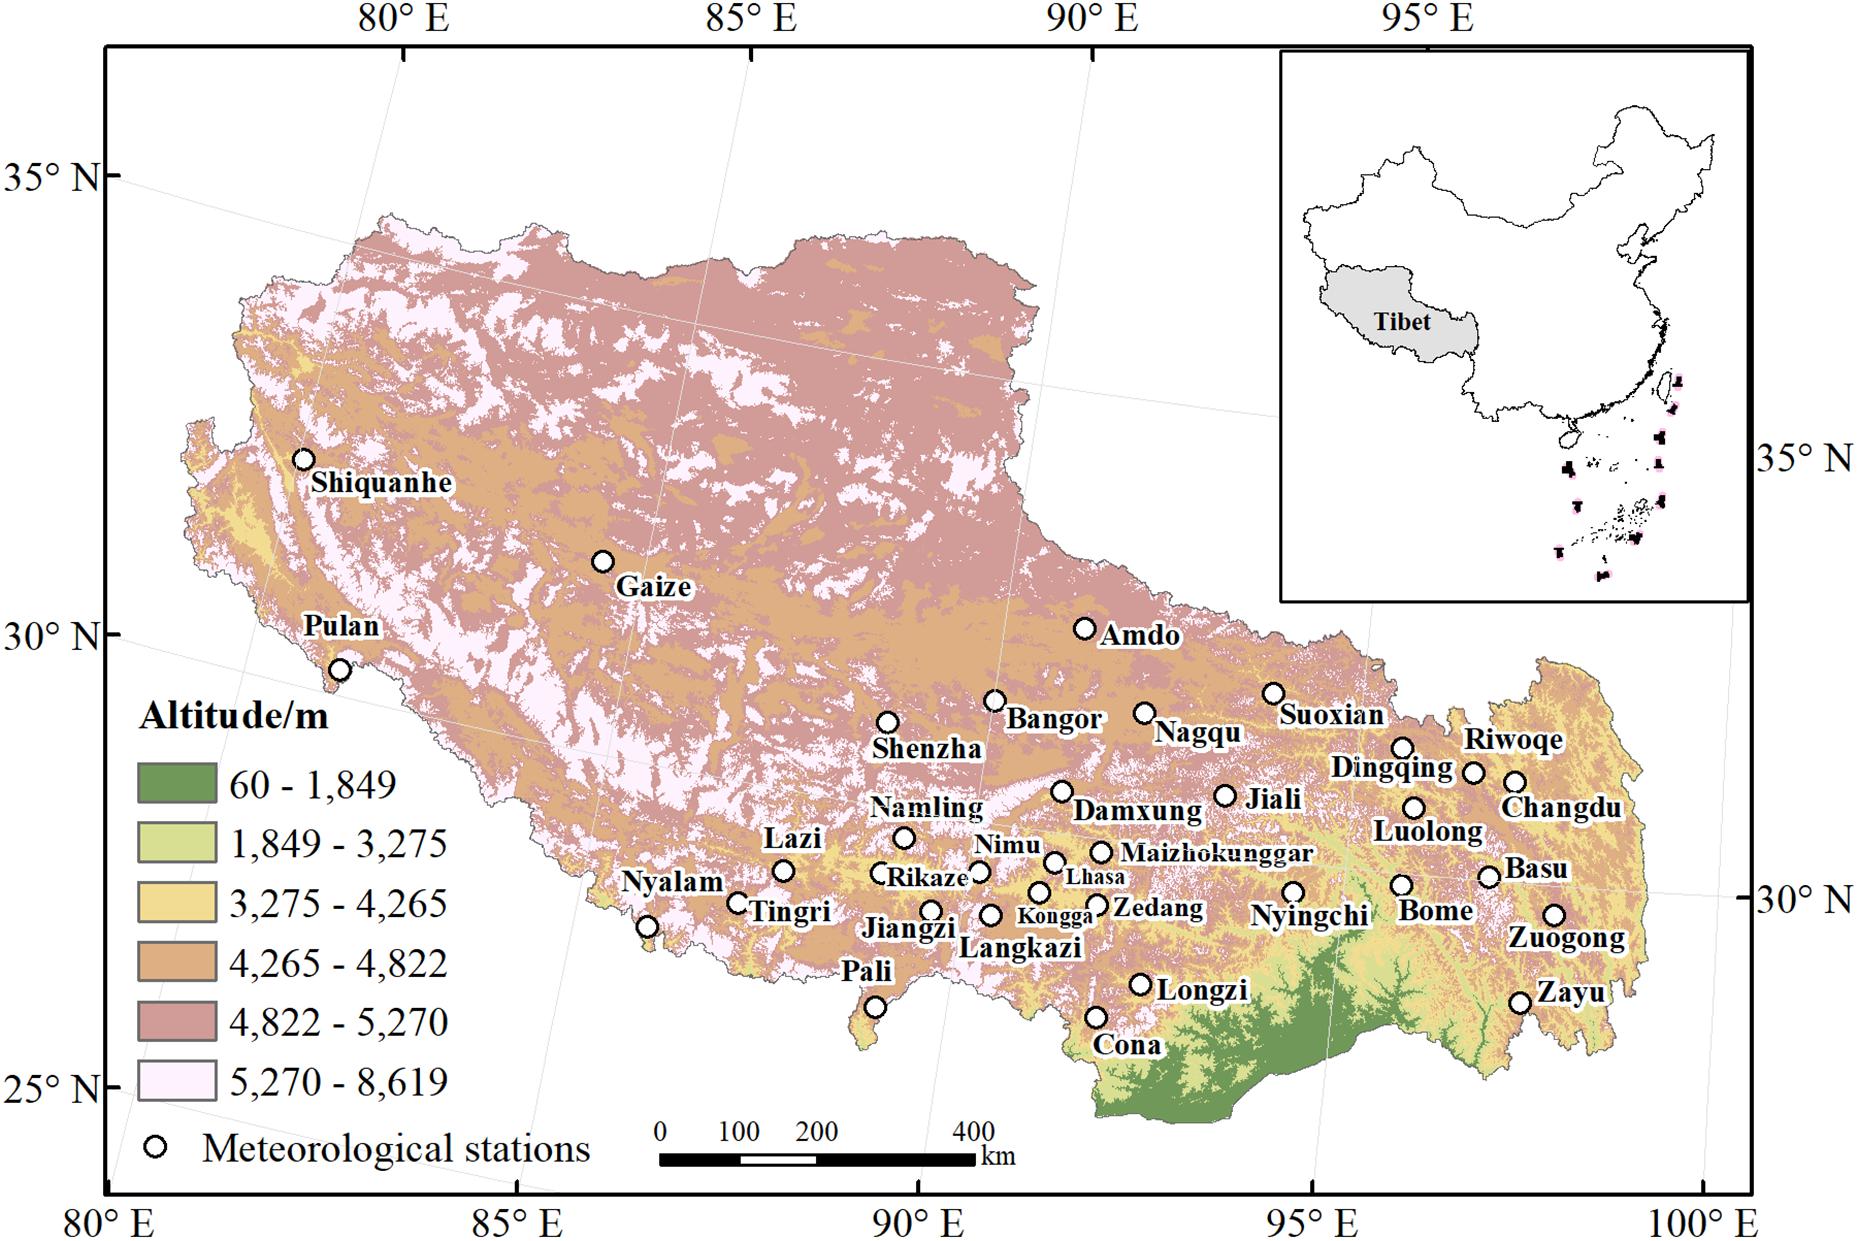
Figure 1. Geographic location of the study area and the 34 meteorological stations sites.
The daily air temperature data of 34 representative meteorological stations (1978–2018) (Figure 1) were collected from the National Meteorological Information Center.2 Because of the relocation of stations and repair of equipment during the last years, there was partial inconsistency in the data series. To fill in 1–2 days of discontinuous data, the mean temperatures of the neighbor stations were used. For estimating the missing data in a time period less than 1 year, the average of the data in the same period between 2 years (one before and one after the year) were calculated. If the time period of missing data in a station was more than 1 year, the gap was filled up using the interpolation technique between neighbor stations with high correlation.
The geographical base map data, the Digital Elevation Model (DEM), the glacier and lake maps and the published permafrost map were collected from Resource and Environment Data Cloud Platform3 and the National Tibetan Plateau Data Center (NTPDC) (htTibet://data.Tibetdc.ac.cn). ArcGIS (Version 10.5) was used to analyze the data such as extraction, projection, interpolation and resampling of the spatial images with the unified resolution as 1 km × 1 km and projection as the Albers Equal Area Conic.
Methods
Freezing and Thawing Indices
There is a widely used method of computing annual FI and TI in which the daily average air temperature below (above) 0°C during the freezing (thawing) period is accumulated (Frauenfeld et al., 2007). Considering the distinct seasons in Tibet and in order to ensure the continuity of the freezing period, an annual freezing period to be July 1st – June 30th of the following year and an annual thawing period to be January 1st – December 31st of a calendar year were defined. The relationships are as followed (Frauenfeld et al., 2007):
where FI and TI are the annual freezing and thawing indices (°C⋅d), respectively; Ti and Tj are average daily temperature (°C); i/j = 1, 2, 3 … NF/NT refers to the days when the average daily temperature is below/above 0°C during the corresponding freezing/thawing periods, respectively. Thus, time series of annual freezing and thawing indices from 1978 to 2017 were obtained using the Equations 1, 2.
Only the observed daily temperature of 34 meteorological stations have imperfection to show continuous spatial distribution over the entire region, so the daily temperature of all stations will be spatially interpolated to transform point data to surface data by IDW interpolation technique (Duchon, 1976; Wahba, 1990; Hutchinson, 1993) which linearly weight the sample points to estimate the values of interpolation points. The weight is inversely proportional to the distance between interpolation points and the sample points where the closer the distance is, the greater the weight is given. The formula is:
where is the estimated values of interpolation point; n is the number of the sample points; Zi(s) is the known value of the sample point i; λi is the weights assigned to the sample point i.
However, plain interpolation of the temperature without considering elevation can reduce the accuracy of the interpolation results (Robeson, 1994). Hence, the sea level reference temperatures (°C) at the location of the meteorological stations were calculated first based on the temperature lapse rate which is 6.5°C/km (Stone and Carlson, 1979). The equation is as follow:
whereTS is the sea level reference temperature (°C); T_o is the observed temperature at the stations; L_r is the temperature lapse rate; E_o is the observed elevation of stations.
Next, the sea level reference temperature is used for spatial interpolation (Equation 3), then by using DEM and the temperature lapse rate, the temperatures at interpolation points were estimated as follow:
where T_p is the estimated temperature at interpolation points; E_d is digital elevation.
Numbers of researches (Pan et al., 2004; Kayıkçı and Kazancı, 2016; Ma et al., 2020) were shown that a combination of temperature lapse rate and IDW technique for considering the elevation effects are needed for high-resolution daily temperature estimation.
Analysis of Trends
In this study, the analysis of FI and TI trends and evaluation of their significance levels on the regional scale and the pixel scale was implemented using simple linear regression (SLR; Zou et al., 2003) and the Mann–Kendall statistical test and Sen’s slope estimation (Mann, 1945; Kendall, 1948; Sen, 1968), respectively. The Mann–Kendall statistical test is a method for measuring the significance level of changes which is widely used in the analysis of time-series trends in many fields with the advantages of applicability of the data with various distribution types and effective handle of few abnormal data.
Linear trends of FI and TI based on pixel scale are obtained using Sen’s slope estimation, which is calculated as follows:
where Slopex represents variation trends of pixel x during the past four decades; xi and xj are pixel values at times i and j. In brief, a positive value of Slope indicates an upward trend, while a negative value of Slope means a downward trend.
The SLR was used to calculate and analyze the change trends of the FI and TI on region scale of Tibet in the past 40 years, which is reflected by the slope estimated by the least square method with the equation as:
where Slopek is variation trends of FI and TI during 40 years; n is a serial number from 1 to 40; ki is the FI or TI of the ith year. When the slope >0, it indicates an increasing trend, when the slope <0, it indicates a decreasing trend.
Based on the natural breaks method (Chen et al., 2013), the rate of FI decreasing was classified into three levels which are defined as rapid decline, slow decline and generally unchanged, corresponding to the rates of −17 ∼−15, −12 ∼−9, and −9 ∼−1°C⋅day/a, respectively. Besides, the rates of increase were also classified into three levels which were defined as a rapid increase, slow increase and generally unchanged, corresponding to the rates of 11 ∼ 18, 5 ∼ 11, and 0.1 ∼ 5°C⋅day/a, respectively. These classify are shown in Table 1.
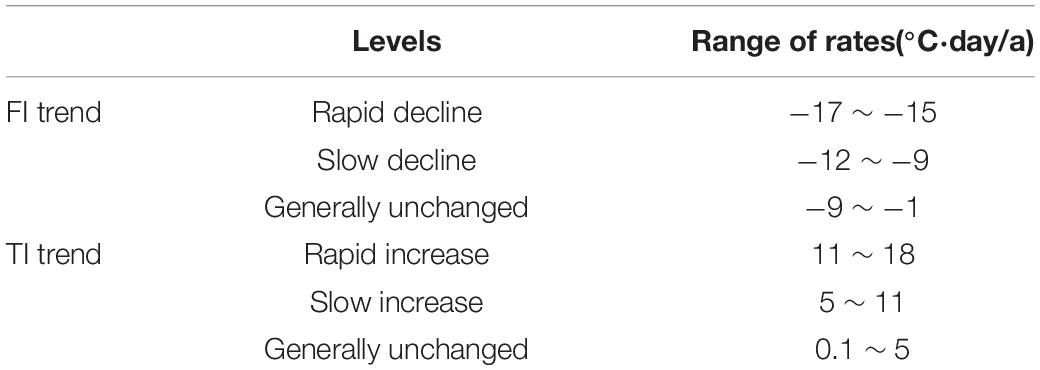
Table 1. Levels of freezing and thawing indices (FI and TI) changing trends and the range of changing rates with each level.
Estimation of Permafrost Extent and Area
The application of FI and TI is extensive and significant for cold regions. Evaluation of the permafrost distribution is one of the main practical applications. Nelson and Outcalt (1987) have developed the “frost number” revised by snow cover and snow quantity to estimate permafrost extent. On the basis of this formula, Nan et al. (2012) has adjusted its parameters specifically for the Qinghai-Tibet Plateau. FI and TI in this study were obtained by meticulous interpolation based on the observed data, so the FI and TI datasets were directly calculated using Equations 1, 2 to map the permafrost extent and to estimate permafrost area over the Tibetan Plateau:
where F = 0.5 is considered as a standard for distinguishing seasonally frozen ground and permafrost; if 0.5 < F < 0.667 or 2/3, the permafrost is discontinuous, otherwise the permafrost is continuous (Nan et al., 2012).
Results
The Spatial Patterns of Freezing and Thawing Indices
The mean annual FI across Tibet is 1241.36°C⋅day (Figure 2A). FI is high in most areas while the low FI is gathered in the southeast region. The value of FI is highly associated with altitude, increasing from low elevations to high mountain regions. In order to analyze the regional characteristics and differences, the mean annual FI was calculated based on four climate zones which were categorized from north to south as plateau frigid zone, plateau cool temperate zone, plateau temperate zone, subtropical mountainous areas (Wang, 1980). Figure 2B represents that FI gradually increases from southeast to northwest, from subtropical mountainous areas (222.04°C⋅day) to plateau frigid zone (1560.08°C day).
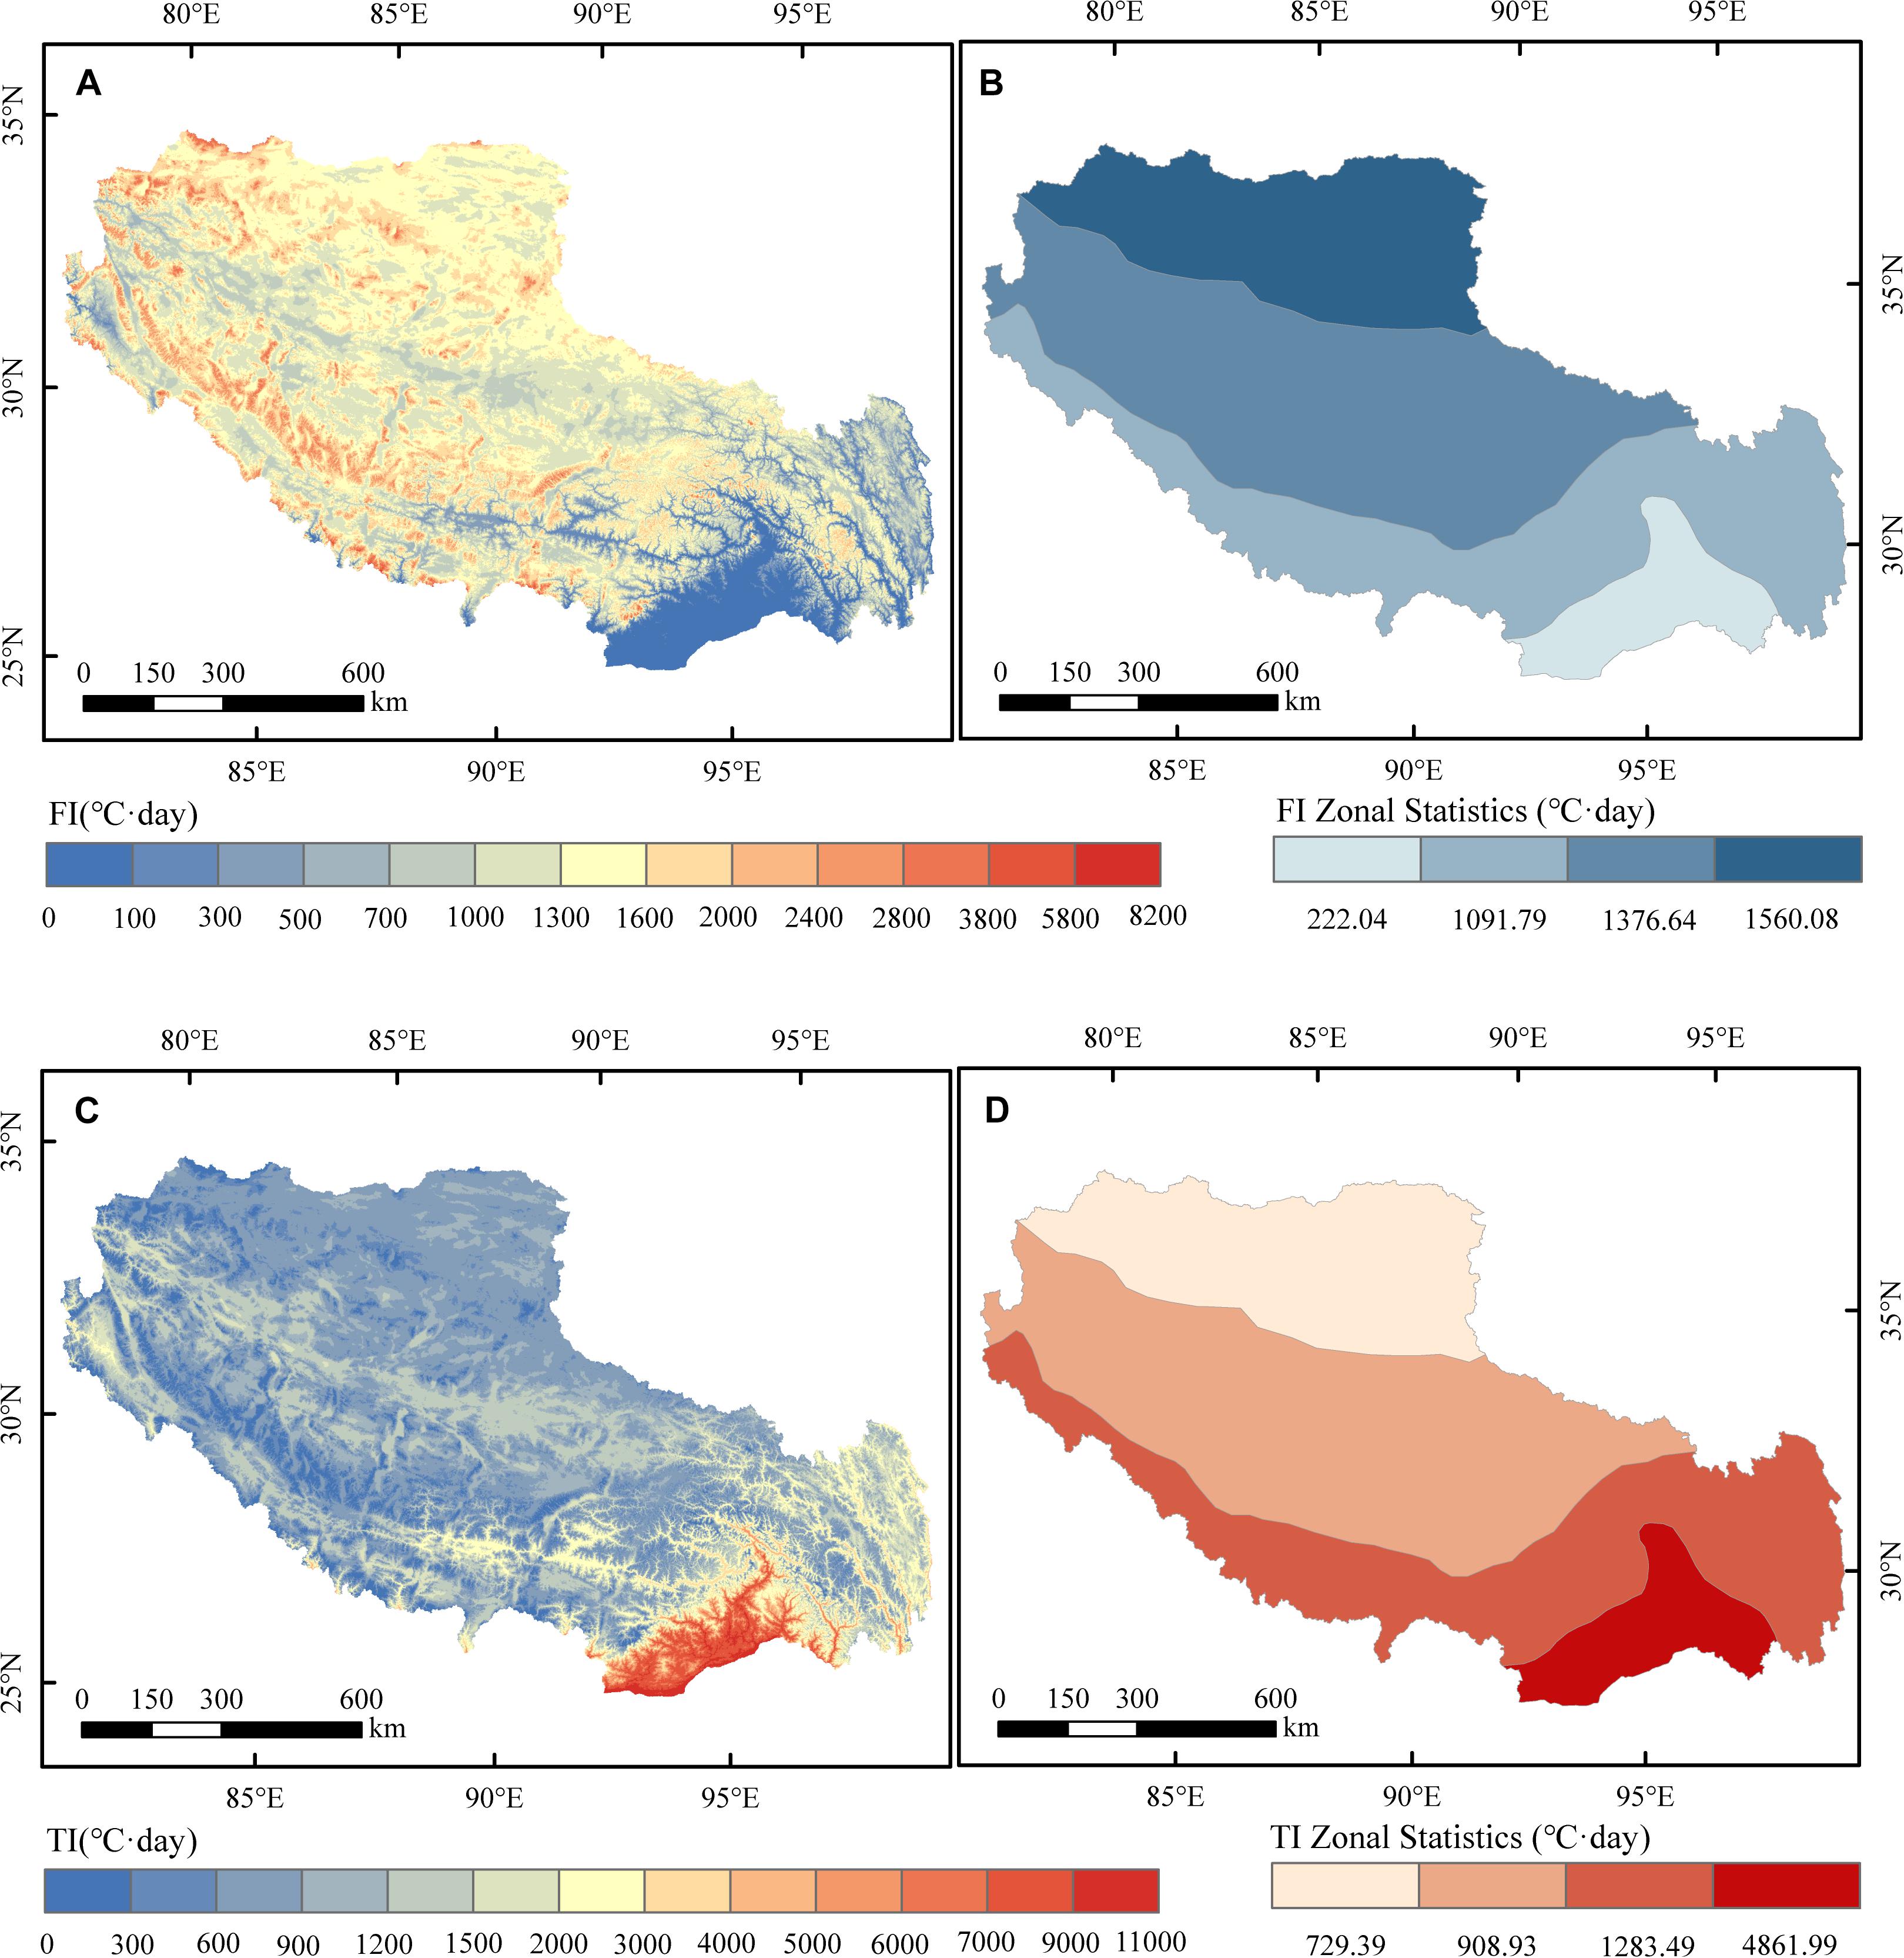
Figure 2. (A) The spatial patterns of the long-term (1978–2017) freezing index (FI) and (B) 4 parts zonal statistics over Tibet. (C) The spatial patterns of the long-term (1978–2017) thawing index (TI) and (D) 4 parts zonal statistics over Tibet.
The spatial distribution of the mean annual TI throughout Tibet is negatively correlated with the spatial pattern of FI (Figure 2C). The high TI often occurs in the area whose FI is low. Therefore, unlike the FI, TI is decreased when the elevation is increased. Based on the zonal statistics (Figure 2D), the mean annual TI in subtropical mountainous areas (4861.99°C⋅day) is very larger than in the plateau temperate zone (1283.49°C⋅day) as well as plateau cool temperate zone (908.93°C⋅day). The lowest TI is in the plateau frigid zone with a value of 729.39°C⋅day.
Changing Trend of Freezing and Thawing Indices
Changing Trend Over Regional Scale
The time series of FI and TI from 1978 to 2017 in Tibet and their trends show a significant downward of FI (Figure 3A) and upward of TI (Figure 3B) with a degradation rate of 10.732°C⋅day/a and increment rate of 6.583°C⋅day/a, respectively, indicating that the warming has a greater impact on FI than on TI across Tibet. FI has been changed from 1421.66°C⋅day in 1978 to 974.77°C⋅day in 2017 and TI has been changed from 1137.46°C⋅day in 1978 to 1410.32°C⋅day in 2017. Using M–K test method, change-point year emerged in 1980 and 1986 for FI time series but never emerged for TI. In 1980–1986, the decline rate of FI is most rapidly, reaching 19.66°C⋅day/a.
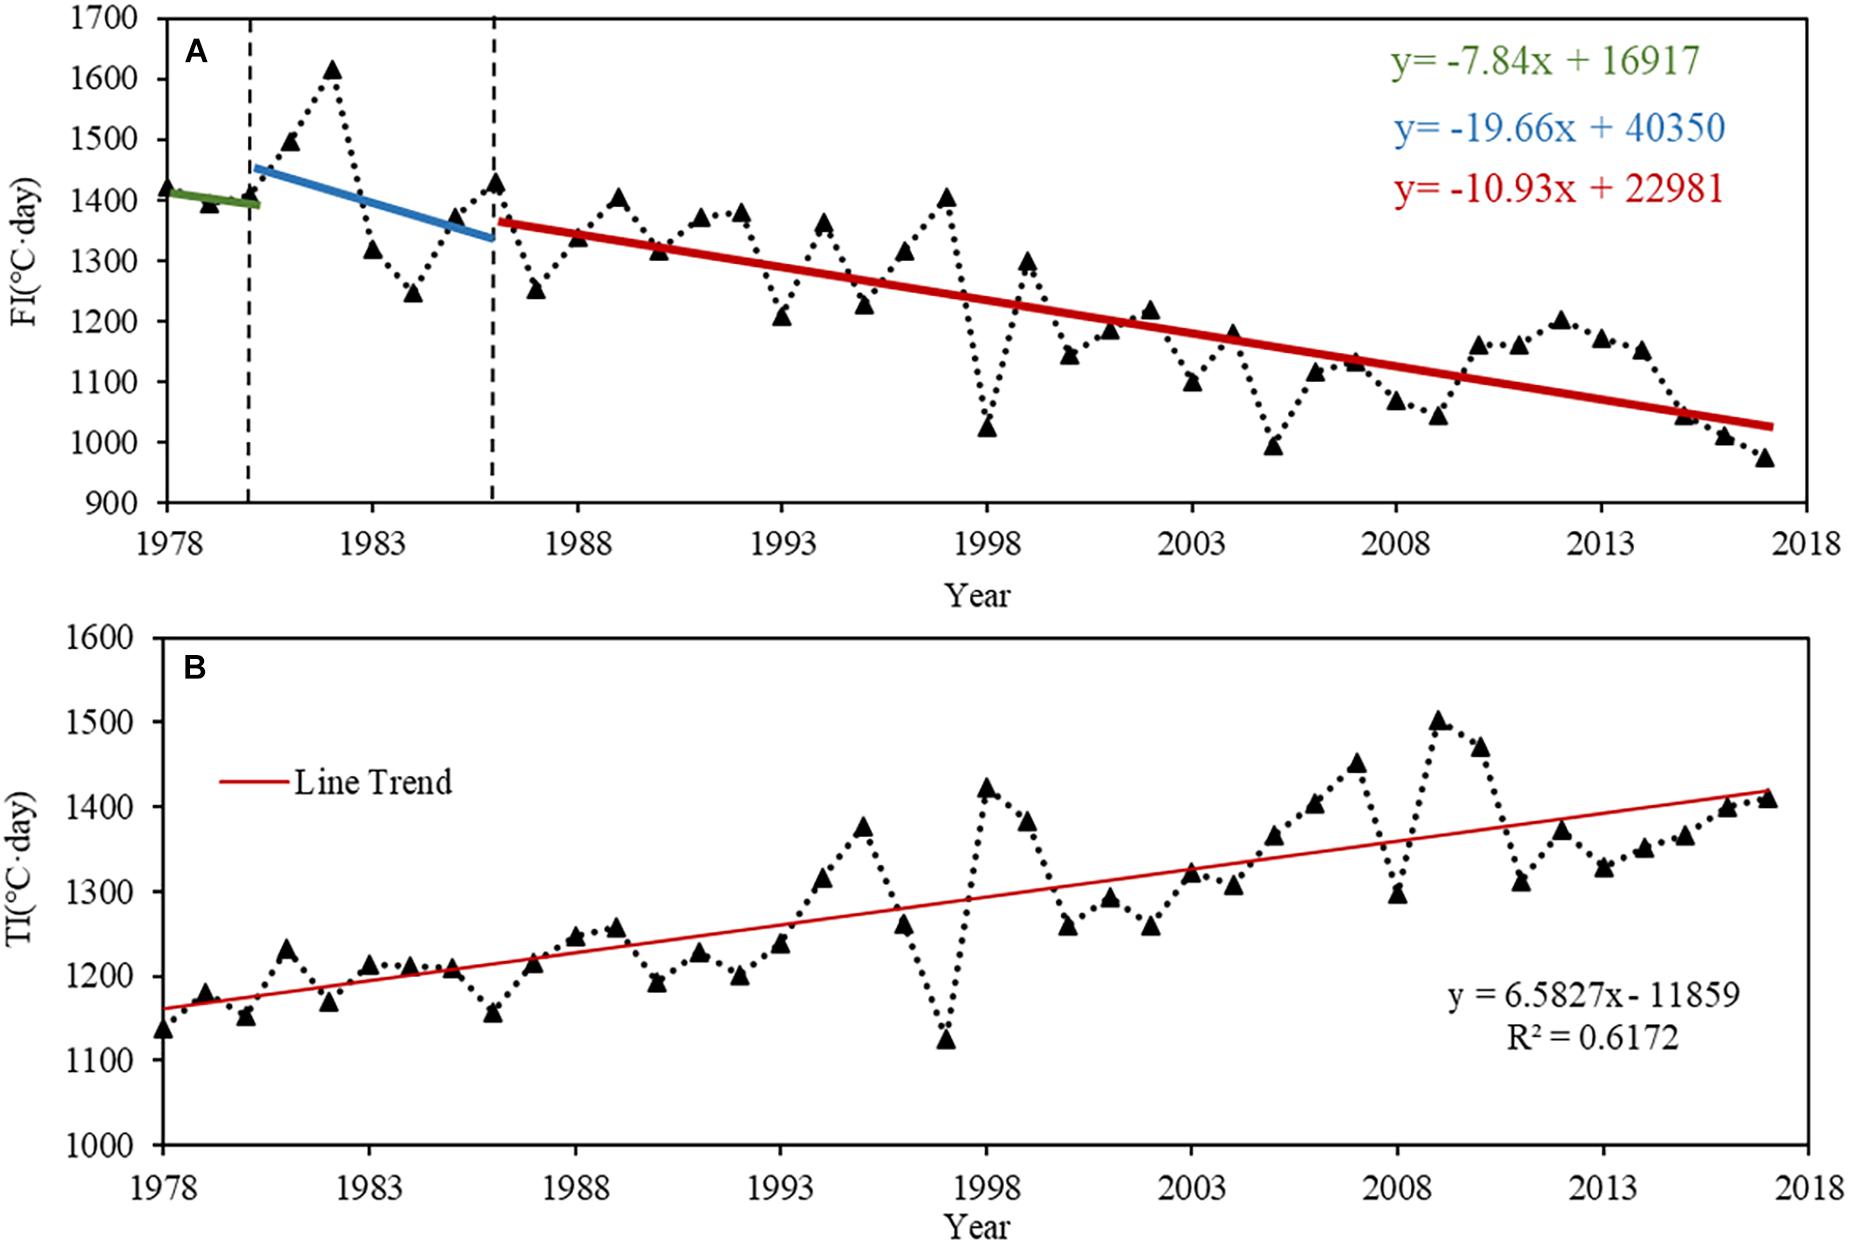
Figure 3. (A) The 1978–2017 time series of FI and (B) TI; over Tibet. Green, blue and red line represents variation trend. Note that x is year and y is FI or TI. Vertical lines represent change points.
Changing Trends Over Pixel Scale
Every pixel has been experienced a significant downward trend of FI during this period but the decline rate is various in different regions, except for the areas in the southeast where is too warm to have FI, which leads to no obvious trend of FI (Figure 4A). FI for the majority of pixels (67.49%) was decreased −12 ∼−9°C⋅day/a, experiencing a slow decline (Table 1). For some high mountain areas (22.11%), FI was also decreased even >−12°C⋅day/a. Besides, the area where FI basically remains unchanged has the least proportion of Tibet, counting 10.40%, mainly distributed in the southeast with lowlands and valleys. Therefore, with increasing the altitude, the downward trend of FI is more obvious. To observe how FI is changed in heterogeneous regions, the mean variation rate of FI was calculated in four climate zones (Wang, 1980; Figure 4B). From southeast to northwest, FI was decreased as −3.07, −10.17, −11.34, and −11.88°C⋅day/a, respectively. The mean degradation rates of FI in three regions were generally at a low decline level, besides the subtropical mountainous areas located in the southeast that was generally stable (−3.07°C⋅day/a).
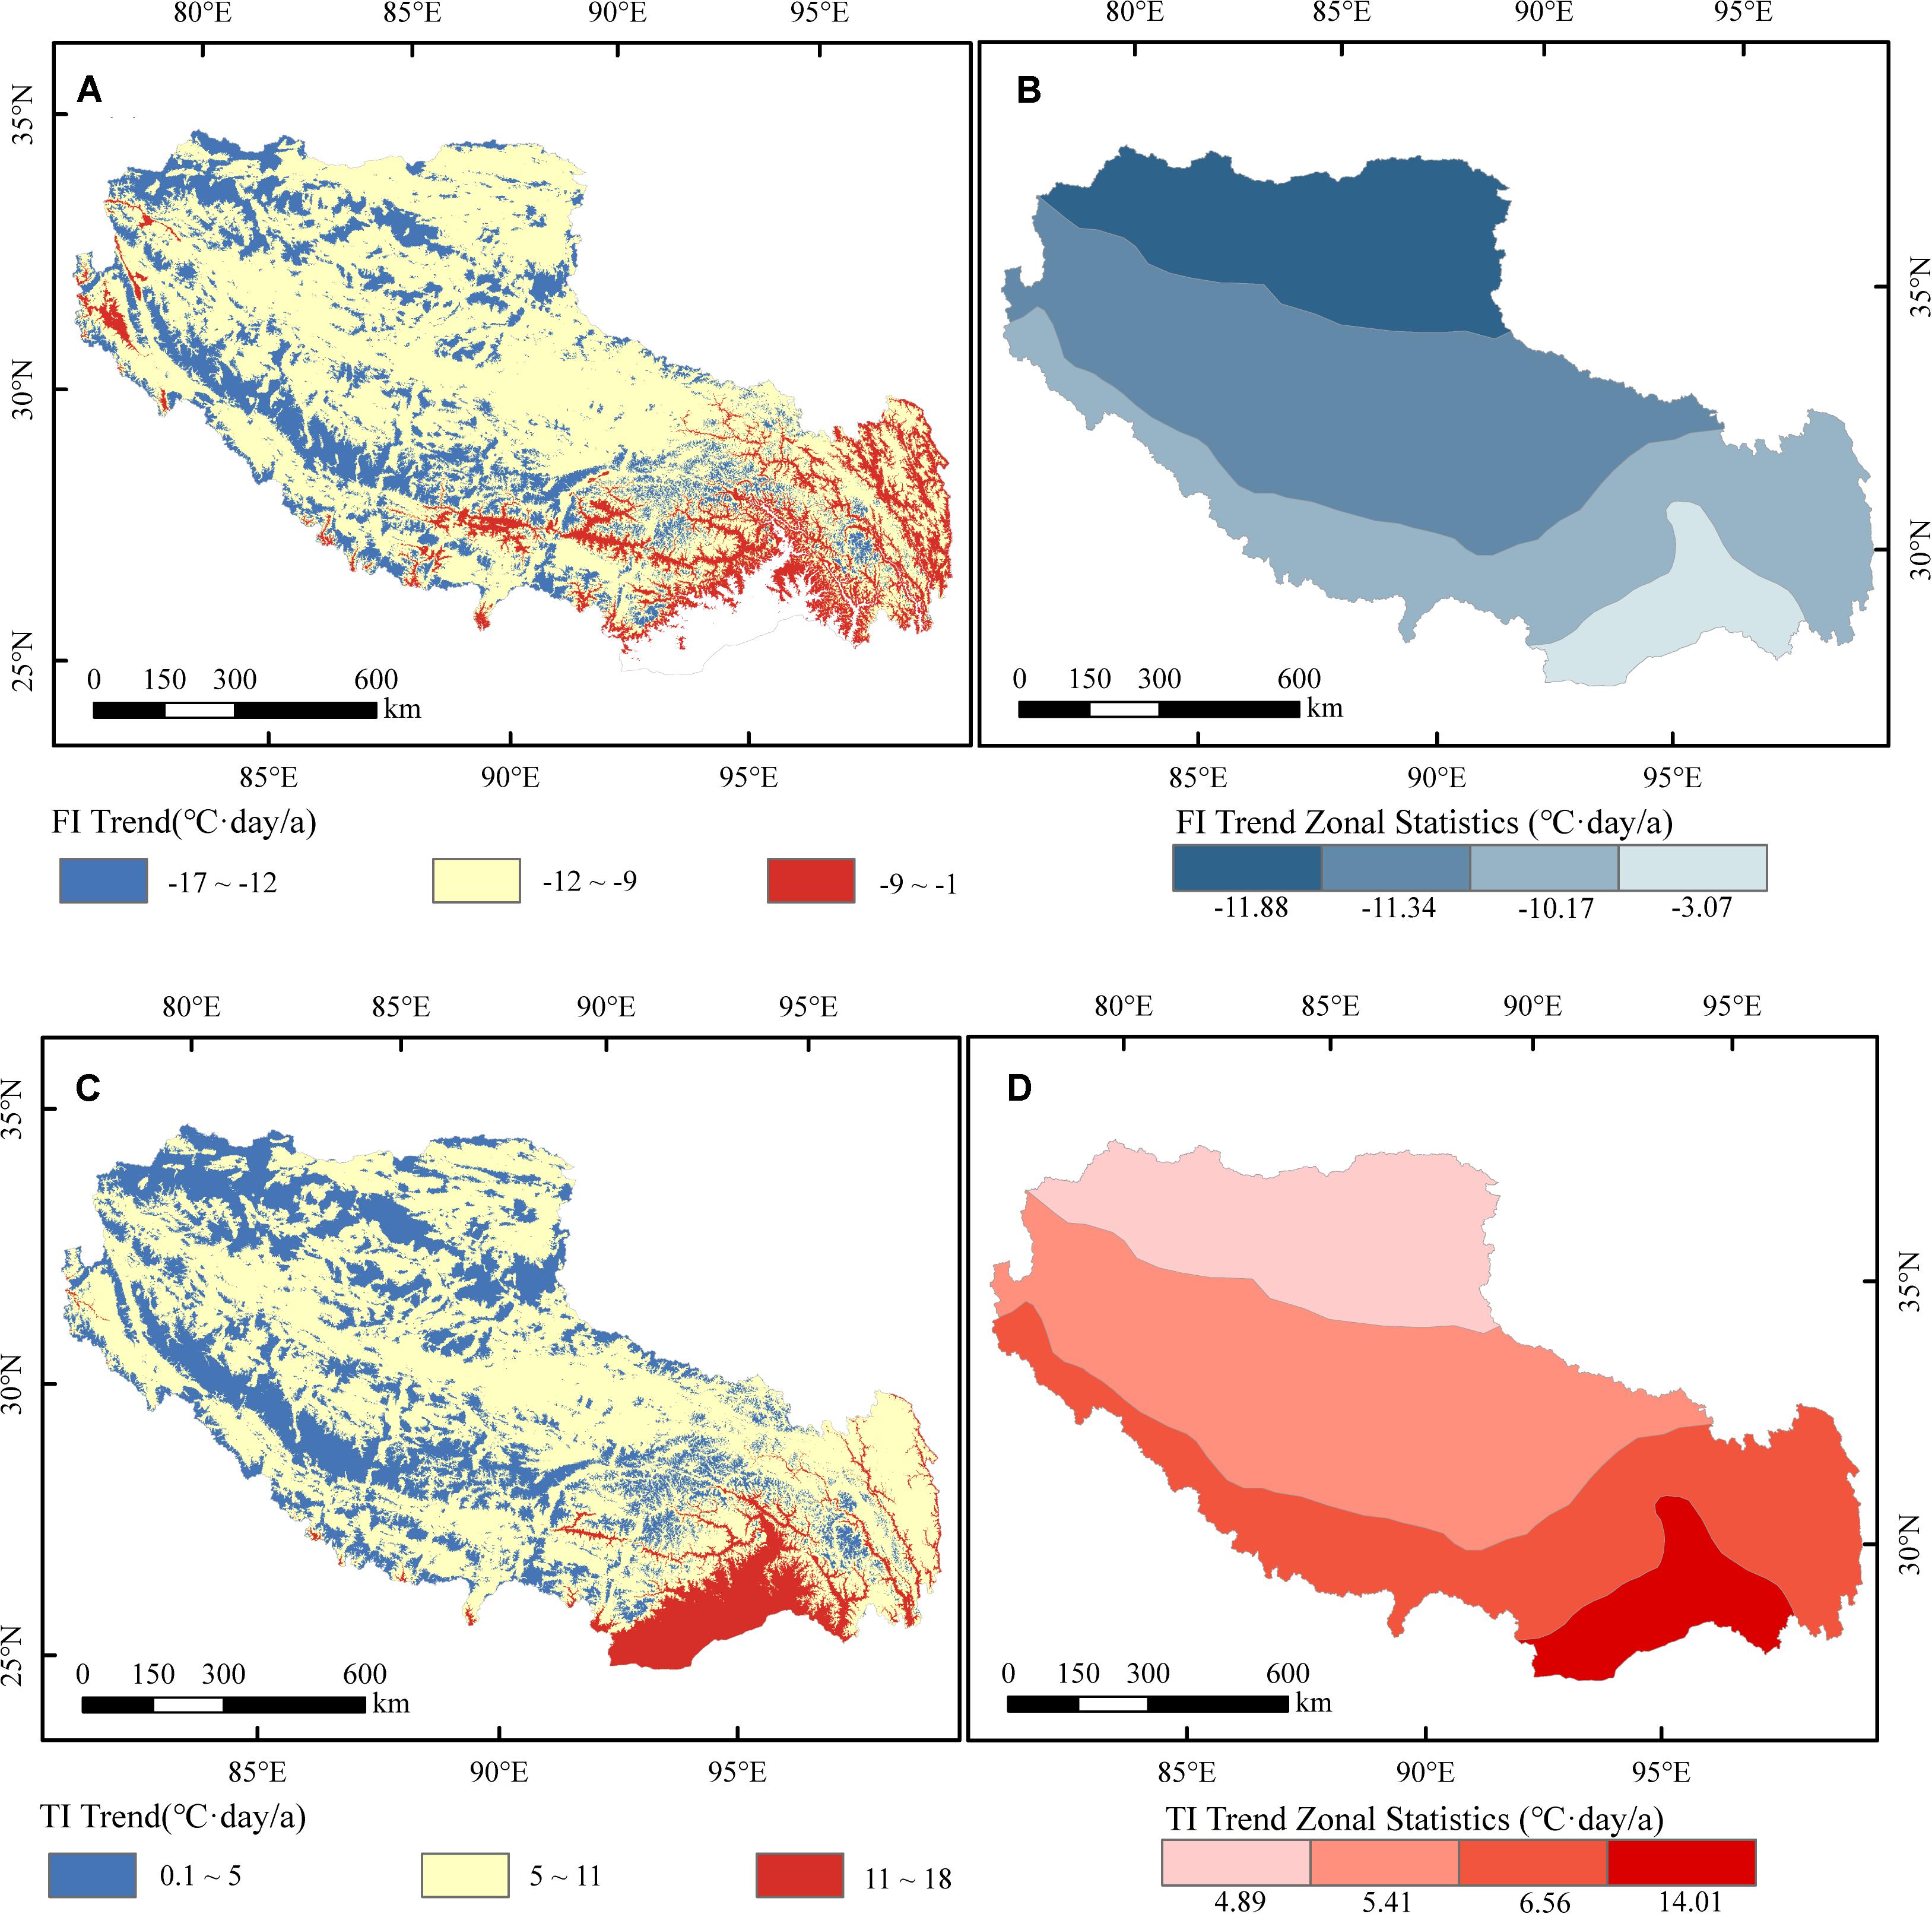
Figure 4. (A) Trends (°C⋅day/a) for the FI over Tibet from 1978 to 2017 and (B) 4 parts zonal statistics. (C) Trends (°C⋅day/a) for the TI over Tibet from 1978 to 2017 and (D) 4 parts zonal statistics. Note that the white area has no FI and TI changing trends.
Figure 4C represents the spatial trends of TI variation for each individual pixel during the past four decades indicating that the whole Tibet has a unified significant increasing trend of change. In the high elevated mountainous areas, where FI decreases significantly, the increase of TI was not observed. Conversely, in areas with slight FI, the upward trends of TI were significant. Thus, the increasing rate of TI slows down as the altitude increases. Pixels with a slow increase trend (Table 1) of TI still covered the majority of the region (63.03%), followed by pixels with moderate increase trends, occupying 29.59%, and pixels showing rapid increase trends covering up to 7.37%. The results of zonal statistics were also showed that from southeast to northwest, TI growth rate for the climate zones were 14.01, 6.56, 5.41 and 4.89°C⋅day/a, respectively which were the opposite of the results for FI (Figure 4D).
Permafrost Extent Estimated Based on Freezing and Thawing Indices
The results showed that the permafrost extent and distribution were apparently changed from 1978 to 2017. In 1978 (Figure 5A), continuous permafrost widely distributes in high elevated mountainous areas, accounting for 14.04% of the region. Seasonally frozen ground is mainly concentrated in the east and southeast occupying 25.70% and discontinuous permafrost is the majority type throughout Tibet (60.29%). Nevertheless, in 2017 (Figure 5B), the pattern of permafrost extent has changed very high. The extent of continuous permafrost has been significantly reduced, and the area has become more scattered, accounting for less than half of the area in the past (5.95%). The important note is that the discontinuous permafrost areas and continuous permafrost areas have been widely replaced by seasonally frozen ground, taking up to 48.86%.
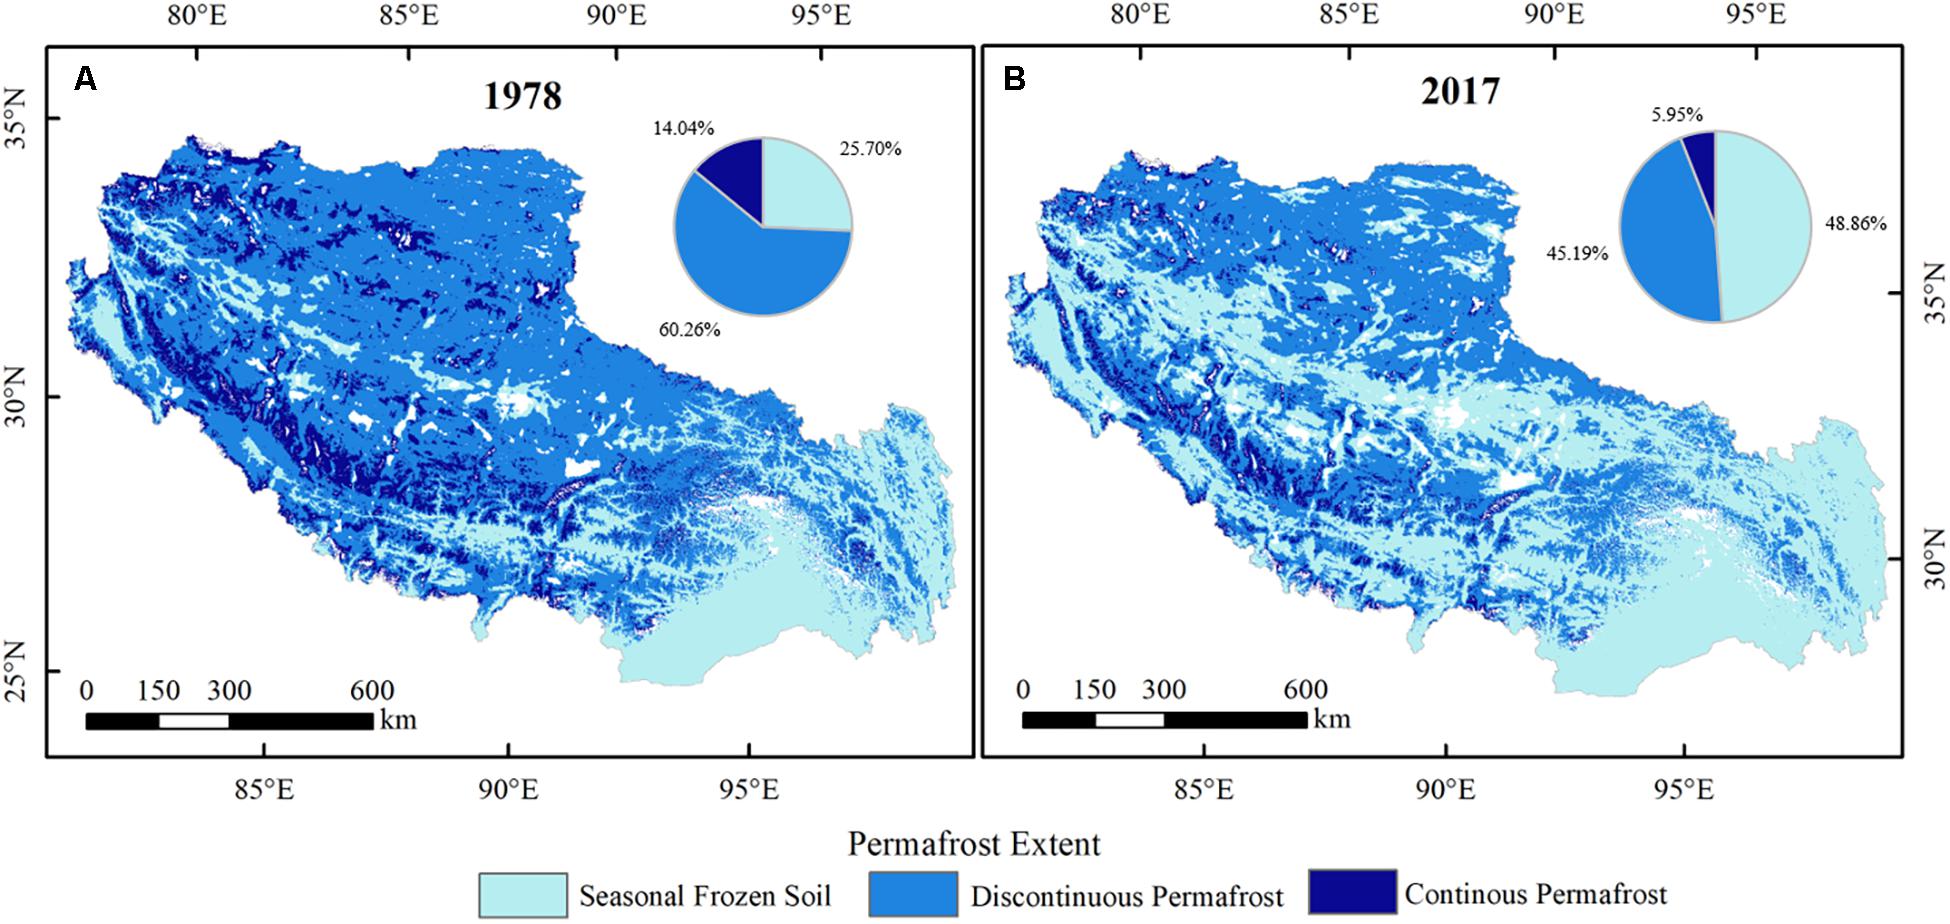
Figure 5. (A) Simulated previous and (B) current extent of permafrost for 1978 and 2017, respectively. Note that the white areas are lake and glacier.
According to the results of the permafrost transformation matrix which is summarized in Table 2, the type of frozen soil has been changed obviously but regions that remain the same type still account for 68.67% of the entire Tibet. There are only two types of frozen soil changes which have widely taken place in Tibet. One is the change from discontinuous permafrost to seasonally frozen ground, being responsible for 23.16% of the entire region, and the other transformation is from continuous permafrost to discontinuous permafrost, accounting for 8.17%. Moreover, the permafrost areas were simulated as 0.85 km2 × 106 km2 in 1978 and 0.59 km2 × 106 km2 in 2017 which indicated that both the extent and area of permafrost have been decreasing during the past 40 years.
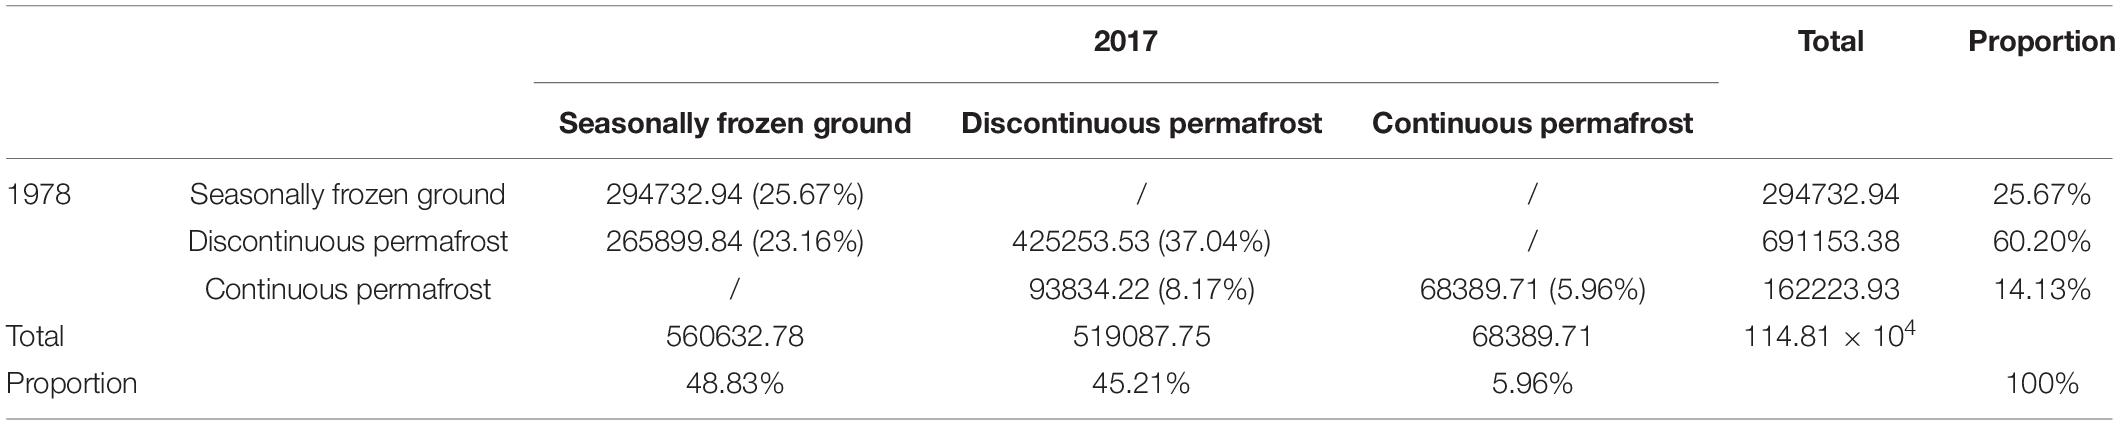
Table 2. Permafrost transformation matrix over Tibet between 1978 and 2017 (Unit: km2).
Discussion
Variation of Freezing and Thawing Indices in Tibet
Freezing and thawing indices have been widely used as indicators to reflect the response for global warming of different regions. In this study, between the first change-point year (1980) and second change-point year (1986), the decrease of FI is more obvious. After 1986, although the decline rate became slower, still faster than the decline rate before 1980s, which indirectly reflects recent rapid climate warming after 1980s (Johannessen et al., 2016). However, for TI, no change-point year occurred in the time series, and TI has basically maintained a stable rise in the past four decades, indicating that FI in Tibet may give faster and more sensitive response to global warming.
Compared with previous studies, in this study the ranges of the FI and TI basically agree with the results of the entire northern hemisphere and the Qinghai-Tibet Plateau. The mean annual FI and TI of Tibet were slightly lower than that of the entire Qinghai-Tibet Plateau estimated by climate datasets (Shi et al., 2019), which is attributed to the differences in the study area and the presumption that FI and TI computed from climate datasets might be overestimated across the Qinghai-Tibet Plateau (Peng et al., 2019).
Furthermore, the majority of previous kinds of literature that have been implemented in different regions throughout the world indicated that FI is clearly decreasing and TI is clearly increasing for half of the century which indirectly indicated that global climate has indeed experienced a warming variation. The average downward changing rate of FI over Tibet during 1978–2017 was 10.732°C⋅day/a, which is higher than the rate of 1.58°C⋅day/a during 1986–2015 (Shi et al., 2019) in the Qinghai-Tibet Plateau and is lower than 13.4°C⋅day/a during 1972–2005 in northeastern China (Luo et al., 2014). Besides, the average increasing rate of TI over Tibet during 1978–2017 was 6.583°C⋅day/a, which is higher than 0.98°C⋅day/a during 1986–2015 (Shi et al., 2019) in the Qinghai-Tibet Plateau and is lower than 8.71°C day/a during 1972–2005 in northeastern China (Luo et al., 2014). It illustrates that Tibet with higher elevated areas are more sensitive to warming than the entire Qinghai-Tibet Plateau, but it is less sensitive than northeastern China with high latitude. Additionally, the FI changing trend in Tibet was larger than TI, which indicates that the warming effects in Tibet and other cold regions are stronger (Peng et al., 2019).
Many previous studies demonstrated that the spatial distribution of FI and TI is highly correlated with latitude (Frauenfeld et al., 2007; Peng et al., 2019; Shi et al., 2019). Nevertheless, Shi et al. (2019) has proved that with the increase of latitude over circum-Arctic, the values and the decreasing rate of FI increase from south to north except Tibet. Thus, the spatial distributions of FI and TI and their variations over Tibet must be distinctive. The results of the current study indicated that FI and TI and their changing trends were closely related to the distribution of altitude across Tibet. With increasing the altitude, FI and its degradation rate were increased while TI and its growth rate were decreased which shows a good agreement with the conclusion of Wang et al. (2019) study at the source region of the Yellow River. Simultaneously, according to the regional average statistics based on the high-resolution spatial distribution results in this study, as the climate zone changes from south to north, the spatial variations of FI and TI and their changing rates still have a strong correlation with latitude which agrees with the results of previous researches.
Application and Uncertainty of Freezing and Thawing Indices
This study was used combined IDW and temperature lapse rate method (Kayıkçı and Kazancı, 2016) to evaluate the influence of elevation on the temperature and calculation of FI and TI. The spatial analysis showed that FI and TI were strongly correlated with altitude. Since the 34 meteorological stations are located at different altitudes, if the daily air temperature data would be interpolated horizontally, the estimated values of other sites will deviate greatly from the true values. In other studies, the results of FI and TI analysis which were done based on horizontal interpolation, like Wang et al. (2019), only show large-scale spatial changing characteristics, which were closely related to the distribution of the meteorological stations. This indicates that using the relationship between temperature and altitude to perform interpolation correction and simulate the temperature can indeed improve the accuracy of the spatial results. In order to further prove that the FI and TI and their variation trends have a strong correlation with altitude, the FI and were calculated in-situ based on the meteorological database and altitudes and were analyzed by Pearson Correlation Coefficient Analysis (Table 3). The equation is as follow:
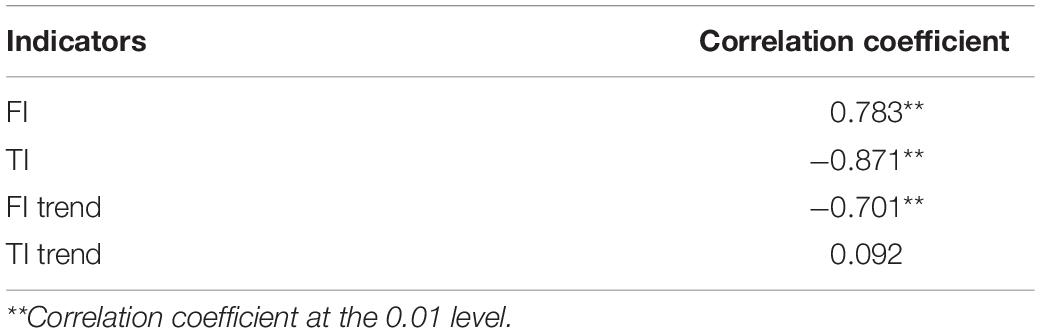
Table 3. The Pearson correlation coefficients of elevation and FI and TI and their changing trends.
Where rij is the correlation coefficient between i and j; i is FI/TI/FI trend/TI trend of stations; j is the observed elevation of stations.
Table 3 shows that the mean annual FI and TI calculated based on the observed temperature has a significant positive (0.783) and negative (−0.871) correlation with elevation, respectively. There is a significant negative correlation between the changing slope of FI and elevation with −0.701 correlation coefficient which means that the rate of decrease of FI gradually accelerates as the elevation increases, but the changing slope of TI and elevation have almost no correlation. These results are highly in agreement with the spatial results obtained before for the changing trend of TI.
Both FI (TI) based on the observed temperature and FI (TI) based on the stimulated temperature show a strong correlation with altitude, but the influence of the combined IDW and temperature lapse rate method on the correlation between FI (TI) and altitude needs to be further explored. This study compares the results of the mean annual FI (TI) based on the observed temperature and the mean annual FI (TI) based on the simulated temperature of the 34 meteorological stations sites during 1978–2017 (Figure 6). Figure 6A shows that the slope of linear approximation between FI based on the observed temperature and FI based on the stimulated temperature is 0.65, R2 is 0.62, which a high correlation (p = 0.002). Figure 6B shows that the slope of linear approximation between TI based on the observed temperature and TI based on the stimulated temperature is 0.90, R2 is 0.73, which are better than FI. These results illustrate that the combined IDW and temperature lapse rate method used in this study can better simulate FI and TI over Tibet, and the accuracy of the simulating TI is higher than that of the simulating FI.
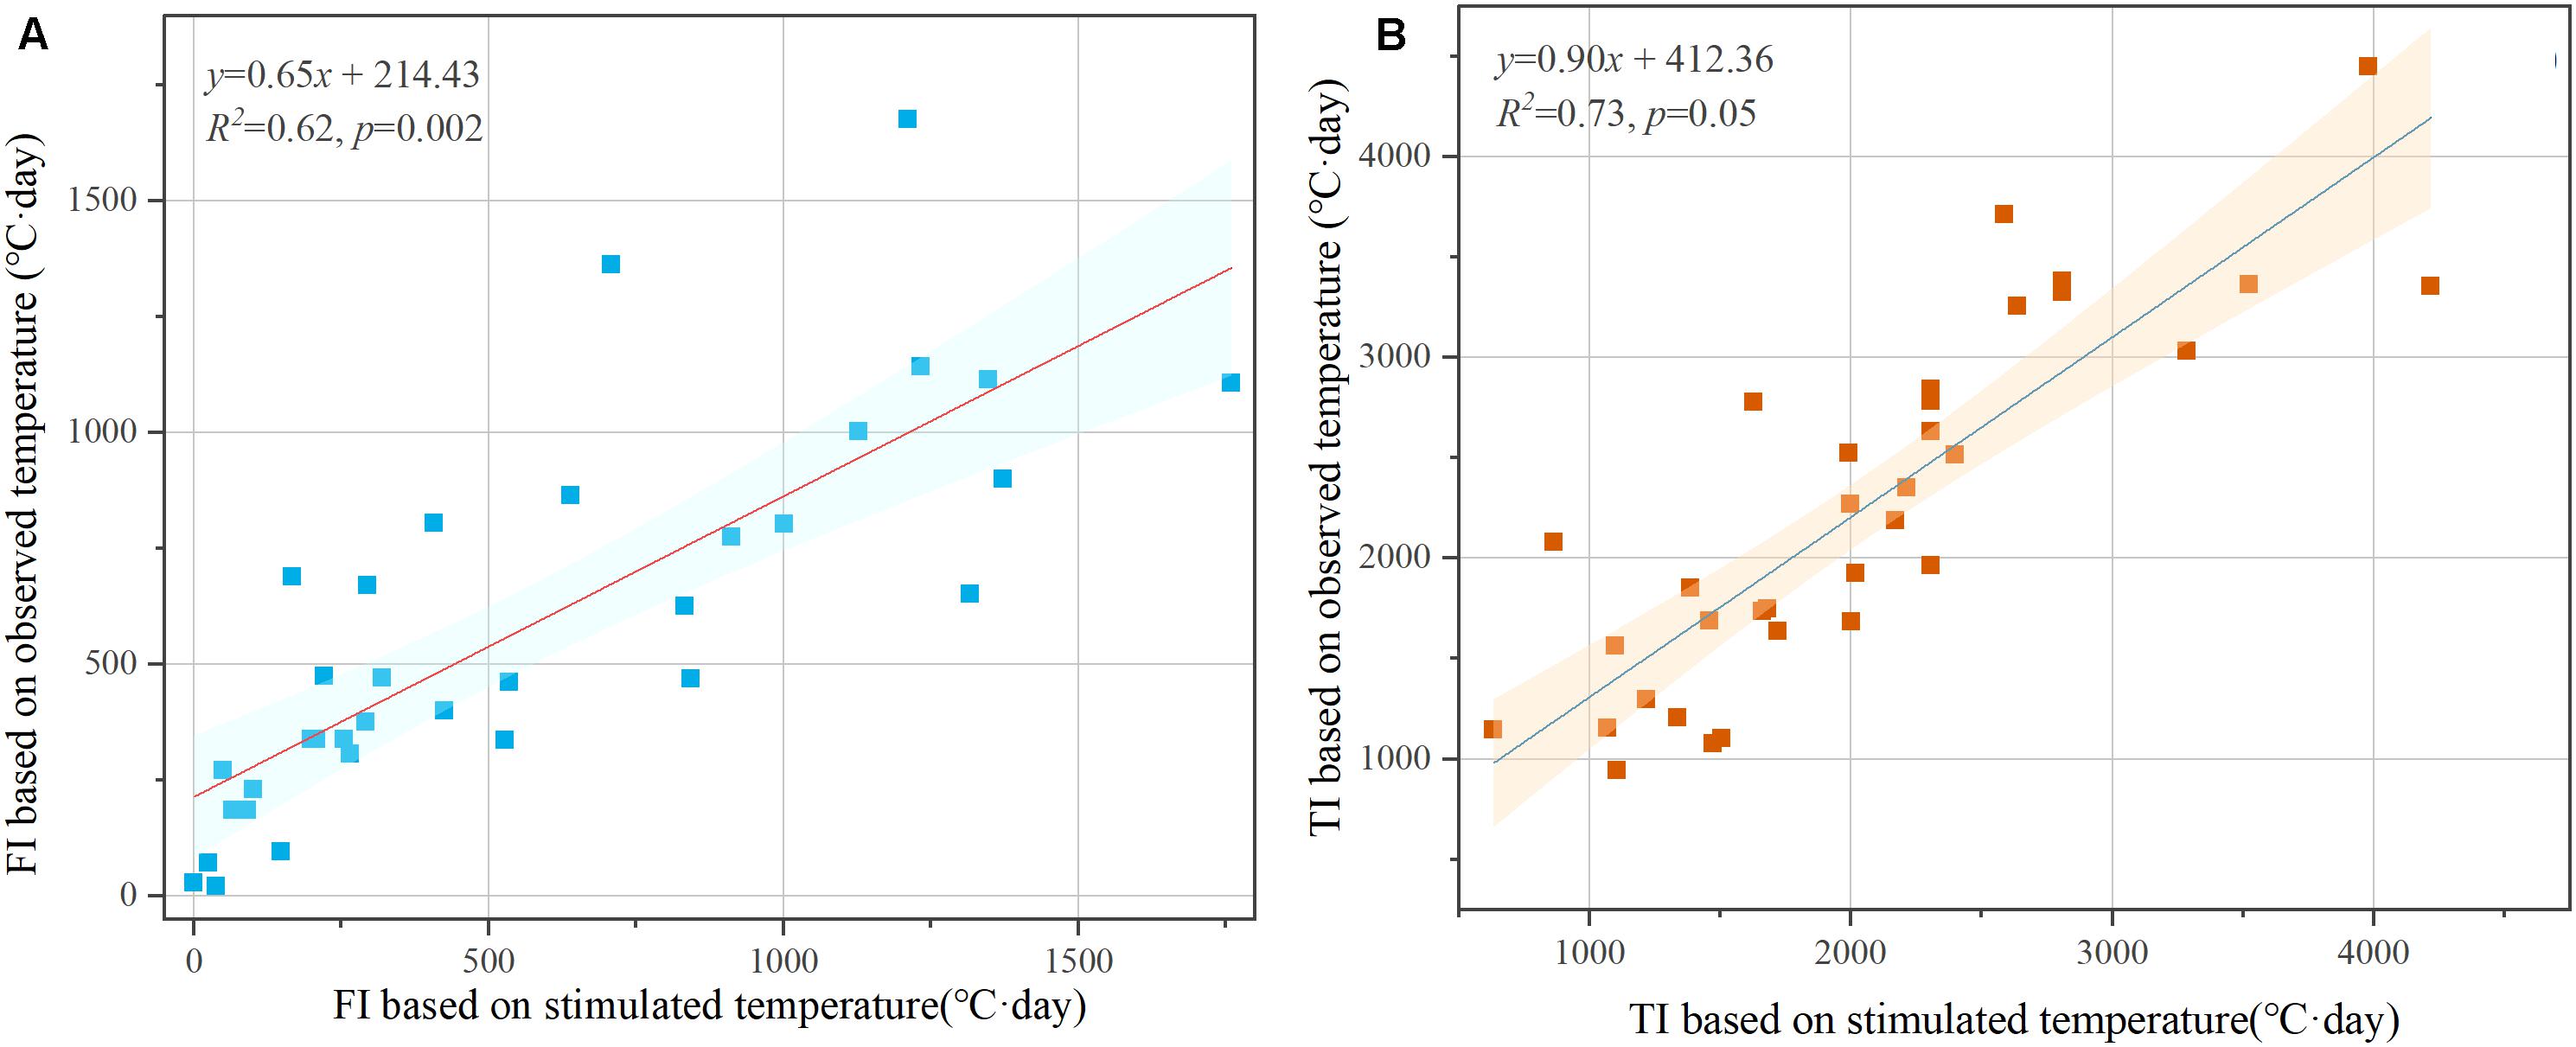
Figure 6. (A) The linear approximation between the mean annual FI based on the observed temperature and the mean annual FI based on the stimulated temperature. (B) The linear approximation between the mean annual TI based on the observed temperature and the mean annual TI based on the stimulated temperature of the 34 meteorological stations sites during 1978–2017.
Although the combined IDW and temperature lapse rate method can estimate FI and TI reliably, it is still worth noting that the temperature lapse rate which was used in this study was fixed value 6.5°C/km (Stone and Carlson, 1979). However, some studies have demonstrated that the temperature lapse rate is not immutable (Laughlin, 1982; Rolland, 2003; Blandford et al., 2008; Kattel et al., 2013; Gao et al., 2018), and its magnitudes vary in different conditions, such as surface condition, elevation and distance from the sea and so on. Due to the vastness of Tibet and its complex terrain, it is difficult to calibrate the temperature lapse rate in each place. Therefore, this study used the uniform and internationally accepted temperature lapse rate in the troposphere for interpolation correction. At the same time, the temperature lapse rate calibration for different regions with different climate characteristics, elevations and radiation conditions of Tibet will be done in the future.
Additionally, this study used FI and TI and a simplified climate-based predictive model (Nelson and Outcalt, 1987) to estimate the extent and area of permafrost over Tibet. The complete model should also contain other parameters like snow depth, snow density and snow thermal conductivity to estimate the correct FI. However, the r of snow depth datasets is too crude to reach 1 km × 1 km and other parameters data are not available. In order to ensure that the high resolution of the estimated permafrost extent, we omit the process of correcting FI and directly use the FI calculated by the optimized method above to stimulate the permafrost extent and area. The published permafrost map of Tibet in 2017 given by NTPDC (Figure 7; Zou et al., 2016; Zhao, 2019) shows that majority of Tibet is occupied by seasonally frozen soil, which is same as the estimated permafrost extent in 2017. Nevertheless, compared with the permafrost map published by NTPDC, the estimated permafrost extent illustrates larger permafrost extent and less seasonally frozen ground extent, which may be attributed to the impact of snow cover on the near-surface temperature. The process of correcting FI was omitted in this paper, so the permafrost extent in Tibet was slightly overestimated. It is also worth noting that the observed temperature at meteorological stations used in this study are the near-surface (2 m a. s. l) air temperature. However, Luo et al. (2018) comparing the near-surface air temperature with the ground surface temperature, and great differences exist between them because the snow cover and litter have a thermal insulation effect on the soil, resulting in different FI and TI calculated from the near-surface air temperature and the ground surface temperature, respectively. Most literature shows that the FI calculated by near-surface air temperature is much higher than the FI calculated by ground surface temperature, and the TI is the opposite (Luo et al., 2018; Wu et al., 2018; Wang et al., 2019). This difference may exaggerate the distribution of permafrost (Luo et al., 2018) like the estimated permafrost in Tibet in this study. Although the near-surface air temperature has a long history of being applied to calculate FI and TI and to stimulate the extent of permafrost, it is undeniable that the ground surface temperature, as the true thermal upper boundary of permafrost models, maybe a much more reliable indicator. However, how much deviation between permafrost extent estimated by using different temperature data is not yet known, which may become the key target of further research.
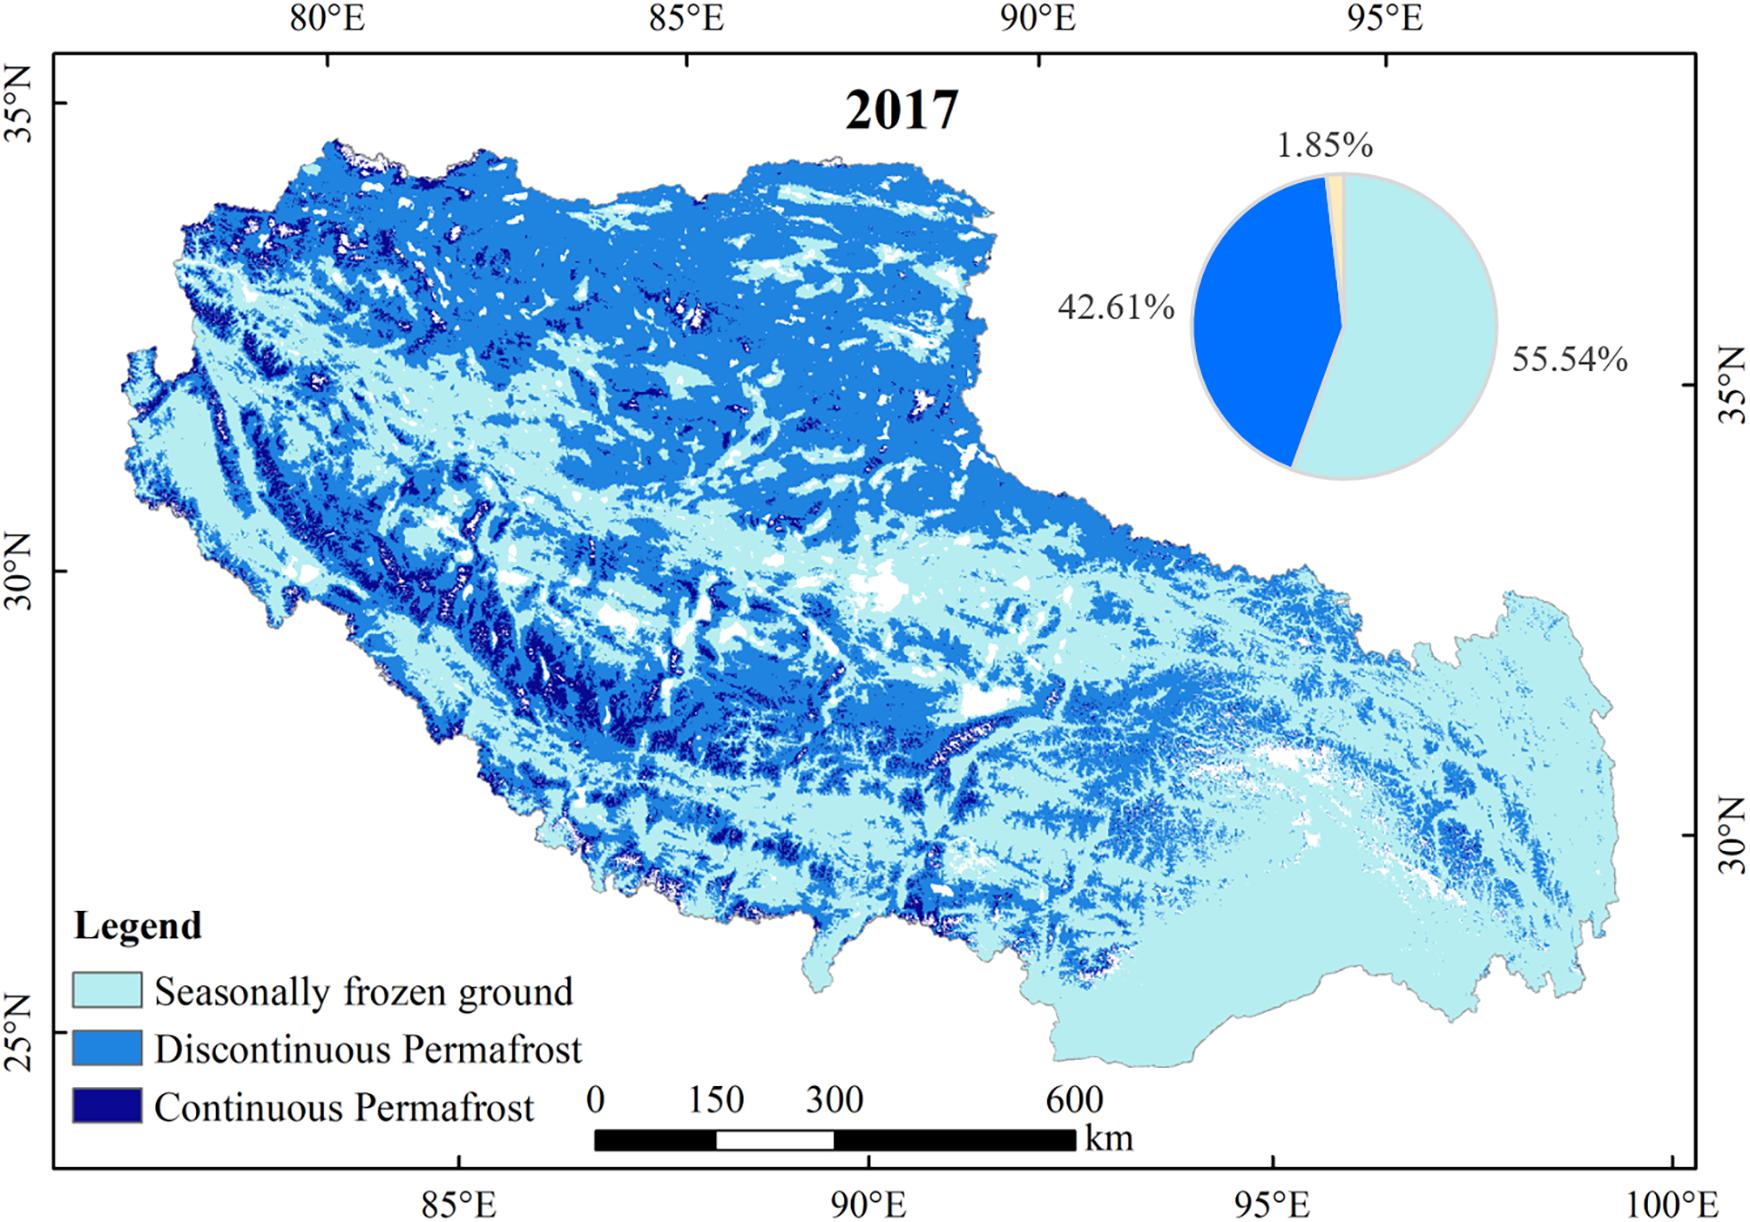
Figure 7. The published permafrost map across Tibet derived from National Tibetan Plateau Data Center (NTPDC) (htTibet://data.Tibetdc.ac.cn). Note that the white area is undefined.
Conclusion
The mean annual values and spatiotemporal variations of the FI and TI across Tibet from 1978 to 2017 were investigated based on observed daily temperature datasets. Moreover, using the high-resolution FI and TI calculated in this study, the permafrost in 1978 and 2017 are estimated. The main conclusions are as follows:
(1) The mean annual FI and TI in Tibet is 1241.36 and 1290.22°C⋅day during the past four decades, respectively. The spatial patterns of FI and TI is highly associated with altitude. FI increases from low elevations to high mountain regions, and TI is totally opposite. Besides, based on the zonal statistics, FI increase and TI decrease from southeast to northwest in Tibet.
(2) On the regional scale, the time series of FI and TI from 1978 to 2017 in Tibet and their trends show a significant downward of FI and upward of TI with a degradation rate of 10.73°C⋅day/a and increment rate of 6.58°C⋅day/a, respectively. On the pixel scale, each pixel has experienced a significant decrease of FI and increase of TI. As the altitudes and latitudes increase, the variation rate of FI increases and TI decreases.
(3) Over the past 40 years, the permafrost of Tibet has been undergoing continuous degradation. The current permafrost area was estimated about 0.59 km2 × 106 km2, which is lower than 0.85 km2 × 106 km2 in 1978. The extent of continuous permafrost has been greatly shrunk (reduced by 8.08% in Tibet) and the extent of seasonally frozen ground has been widely extended (increased by 23.16% in Tibet). The estimated permafrost extent of 2017 is roughly similar to the published permafrost extent of 2017 by NTPDC, but slightly overestimated.
(4) Combined IDW and temperature lapse rate method was used to evaluate the influence of elevation on the temperature and calculate the FI and TI based on spatially interpolated daily temperature data, which indeed draws more accurate conclusion.
Data Availability Statement
The original contributions presented in the study are included in the article/supplementary material, further inquiries can be directed to the corresponding author.
Author Contributions
JF initiated the underlying research project and obtained funding and developed the research goal and designed the study. YL conducted and analyzed the data. YL and YYL wrote the manuscript. MG and AM conducted the figures. All authors reviewed and edited the manuscript.
Funding
This research was supported by National Natural Science Foundation of China (Grant Nos. 41871072 and 41671016) and the Strategic Priority Research Program of the Chinese Academy of Sciences (Grant No. XDA20020401).
Conflict of Interest
The authors declare that the research was conducted in the absence of any commercial or financial relationships that could be construed as a potential conflict of interest.
Publisher’s Note
All claims expressed in this article are solely those of the authors and do not necessarily represent those of their affiliated organizations, or those of the publisher, the editors and the reviewers. Any product that may be evaluated in this article, or claim that may be made by its manufacturer, is not guaranteed or endorsed by the publisher.
Acknowledgments
The authors would like to thank the National Tibetan Plateau Data Center (htTibet://data.Tibetdc.ac.cn), providing the new map of permafrost distribution in Tibet.
Footnotes
References
Blandford, T. R., Humes, K. S., Harshburger, B. J., Moore, B. C., Walden, V. P., and Ye, H. (2008). Seasonal and synoptic variations in near-surface air temperature lapse rates in a mountainous basin. J. Appl. Metrorol. Climatol. 47, 249–261. doi: 10.1175/2007jamc1565.1
Chen, J., Yang, S. T., Li, H. W., Zhang, B., and Lv, J. R. (2013). Research on geographical environment unit division based on the method of natural breaks (JENKS). Int. Arch. Photogramm. Remote Sens. Spat. Inf. Sci. 3, 47–50. doi: 10.5194/isprsarchives-XL-4-W3-47-2013
Dai, H. Y., Chen, G. W., Wu, J. H., Yang, L. P., and Du, W. L. (2020). Changes in freeze-thaw index and rapid cold-warm turning in middle and high latitudes of China. Arid Zone Res. 37, 275–281. doi: 10.13866/j.azr.2020.02.01
Ding, Y., Zhang, S., Zhao, L., Li, Z., and Kang, S. (2019). Global warming weakening the inherent stability of glaciers and permafrost. Sci. Bull. 64, 245–253. doi: 10.1016/j.scib.2018.12.028
Du, M. Y., Kawashima, S., Yonemura, S., Zhang, X. Z., and Chen, S. B. (2004). Mutual influence between human activities and climate change in the Tibetan Plateau during recent years. Glob. Planet. Change 41, 241–249. doi: 10.1016/j.gloplacha.2004.01.010
Duchon, J. (1976). Interpolation des fonctions de deux variables suivant le principe de la flexion des plaques minces. Revue française d’automatique, informatique, recherche opérationnelle. Analyse Numérique 10, 5–12. doi: 10.1051/m2an/197610R300051
Feng, D. L., Lin, B., Zhang, F., and Feng, X. (2017). A review of freeze-thaw effects on soil geotechnical properties. Sci. Sin. Technol. 47, 111–127. doi: 10.1360/N092016-00224
Frauenfeld, O. W., Zhang, T. J., and McCreight, J. L. (2007). Northern hemisphere freezing/thawing index variations over the twentieth century. Int. J. Climatol. 27, 47–63. doi: 10.1002/joc.1372
Gao, Y., Chen, F., Lettenmaier, D. P., Xu, J., Xiao, L., and Li, X. (2018). Does elevation-dependent warming hold true above 5000 m elevation? Lessons from the Tibetan Plateau. NPJ Clim. Atmos. Sci. 1, 1–7. doi: 10.1038/s41612-018-0030-z
Harris, S. A., French, H. M., Heginbottom, J. A., Johnston, G. H., Ladanyi, B., Sego, D., et al. (1988). Glossary of Permafrost and Related Ground-Ice Terms. National Research Council of Canada, Associate Committee on Geotechnical Research. Technical Research No. ACGR-TM-142. Ottawa, ON: National Research Council of Canada, Permafrost Subcommittee, 156. doi: 10.4224/20386561
He, B. B., Sheng, Y., Huang, L., Huang, X. B., and Zhang, X. Y. (2019). Variation trends of freezing and thawing index in North Xinjiang from 1961 to 2017. J. Glaciol. Geocryol. 41, 1107–1114. doi: 10.7522/j.issn.1000-0240.2019.0322 (In Chinese).
Hutchinson, M. F. (1993). “On thin plate splines and kriging,” in Computing and Science in Statistics, Vol. 25, eds M. E. Tarter and M. C. Lock (Berkeley, CA: Interface Foundation of North America, University of California, Berkeley), 55.
IPCC (2021). “Summary for policymakers,” in Climate Change 2021: The Physical Science Basis. Contribution of Working Group I to the Sixth Assessment Report of the Intergovernmental Panel on Climate Change, eds V. Masson-Delmotte, P. Zhai, A. Pirani, S. L. Connors, C. Péan, S. Berger, et al. (Cambridge: Cambridge University Press).
Jiang, F. Q., Hu, R. J., and li, Z. (2008). Variations and trends of the freezing and thawing index along the Qinghai-Xizang Railway for 1966-2004. J. Geogr. Sci. 18, 3–16. doi: 10.3969/j.issn.1009-637X.2008.01.001
Jiang, F. Q., Jilili, A. W., Wang, S. P., Hu, R. J., and Li, X. L. (2015). Annual thawing and freezing indices changes in the China Tianshan Mountains. Reg. Environ. Change 15, 227–240. doi: 10.1007/s10113-014-0610-3
Johannessen, O. M., Kuzmina, S. I., Bobylev, L. P., and Miles, M. W. (2016). Surface air temperature variability and trends in the Arctic: new amplification assessment and regionalisation. Tellus 68:28234. doi: 10.3402/tellusa.v68.28234
Kang, S. C., Xu, Y. W., You, Q. L., Flugel, W. A., Pepin, N., and Yao, T. D. (2010). Review of climate and cryospheric change in the Tibetan Plateau. Environ. Res. Lett. 5:8. doi: 10.1088/1748-9326/5/1/015101
Kattel, D. B., Yao, T., Yang, K., Tian, L., Yang, G., and Joswiak, D. (2013). Temperature lapse rate in complex mountain terrain on the southern slope of the central Himalayas. Theor. Appl. Climatol. 113, 671–682. doi: 10.1007/s00704-012-0816-6
Laughlin, G. P. (1982). Minimum temperature and lapse rate in complex terrain: influencing factors and prediction. Arch. Meteorol. Geophys. Bioclimatol. Ser. B Theor. Appl. Climatol. 30, 141–152. doi: 10.1007/BF02323400
Li, R., Zhao, L., Ding, Y. J., Wu, T. H., Xiao, Y., Du, E. J., et al. (2012). Temporal and spatial variations of the active layer along the Qinghai-Tibet Highway in a permafrost region. Chin. Sci. Bull. 57, 4609–4616. doi: 10.1007/s11434-012-5323-8
Liu, L., and Luo, D. L. (2020). Spatial and temporal characteristics of air/ground freezing and thawing index in the middle and lower reaches of the Yarlung Zangbo River during 1977 – 2017. J. Glaciol. Geocryol. 42, 1–11. doi: 10.7522/j.issn.1000-0240.2019.0048 (In Chinese).
Liu, X., and Li, J. (2018). Research on temporal and spatial variation of freeze-thaw index in Northeast China during the past 1960–2012. Heilongjiang Sci. 9, 162–164. doi: 10.3969/j.issn.1674-8646.2018.20.075 (In Chinese).
Liu, X. D., and Yin, Z. Y. (2002). Sensitivity of East Asian monsoon climate to the uplift of the Tibetan Plateau. Palaeogeogr. Palaeoclimatol. Palaeoecol. 183, 223–245. doi: 10.1016/S0031-0182(01)00488-6
Luo, D. L., Jin, H. J., Marchenko, S. S., and Romanovsky, V. E. (2018). Difference between near-surface air, land surface and ground surface temperatures and their influences on the frozen ground on the Qinghai-Tibet Plateau. Geoderma 312, 74–85. doi: 10.1016/j.geoderma.2017.09.037
Luo, D. L., Jin, H. J., Jin, R., Yang, X. G., and Lu, L. Z. (2014). Spatiotemporal variations of climate warming in northern Northeast China as indicated by freezing and thawing indices. Quat. Int. 349, 187–195. doi: 10.1016/j.quaint.2014.06.064
Ma, N., Tang, Y., Chang, C., and Jia, L. H. (2020). Comparation of spatial interpolation methods of temperature based on DEM data. J. Arid Meteorol. 38, 465–471. doi: 10.11755/j.issn.1006-76392020-03-0465 (In Chinese).
Mann, H. B. (1945). Nonparametric tests against trend. Econometrica 13, 245–259. doi: 10.2307/1907187
McCormick, G. (1991). Freezing and thawing indexes in northern Canada. Can. Geotech. J. 28, 899–903. doi: 10.1139/t91-106
Mu, C., Li, L., Wu, X., Zhang, F., Jia, L., Zhao, Q., et al. (2018). Greenhouse gas released from the deep permafrost in the northern Qinghai-Tibetan Plateau. Sci. Rep. 8, 1–9. doi: 10.1038/s41598-018-22530-3
Nan, Z. T., Li, S. X., Cheng, G. D., and Huang, P. P. (2012). Surface frost model and its application to the Tibetan Plateau. J. Glaciol. Geocryol. 34, 89–95. (In Chinese).
Nelson, F. E., and Outcalt, S. I. (1987). A computational method for prediction and regionalization of permafrost. Arctic Alpine Res. 19, 279–288. doi: 10.2307/1551363
Nelson, F. E., Shiklomanov, N. I., Mueller, G. R., Hinkel, K. M., Walker, D. A., and Bockheim, J. G. (1997). Estimating active-layer thickness over a large region: Kuparuk River Basin, Alaska, USA. Artic Alpine Res. 29, 367–378. doi: 10.2307/1551985
Pan, Y. Z., Gong, D. Y., Deng, L., Li, J., and Gao, J. (2004). Smart Distance Searching-based and DEM-informed interpolation of surface air temperature in China. Acta Geogr. Sin. 59, 366–374. doi: 10.11821/xb200403006 (In Chinese).
Park, H., Kim, Y., and Kimball, J. S. (2016). Widespread permafrost vulnerability and soil active layer increases over the high northern latitudes inferred from satellite remote sensing and process model assessments. Remote Sens. Environ. 175, 349–358. doi: 10.1016/j.rse.2015.12.046
Peng, X. Q., Zhang, T. J., Frauenfeld, O. W., Wang, K., Luo, D. L., Cao, B., et al. (2018). Spatiotemporal changes in active layer thickness under contemporary and projected climate in the northern hemisphere. J. Clim. 31, 251–266. doi: 10.1175/jcli-d-16-0721.1
Peng, X. Q., Zhang, T. J., Liu, Y. J., and Luo, J. (2019). Past and projected freezing/thawing indices in the northern hemisphere. J. Appl. Meteorol. Climatol. 58, 495–510. doi: 10.1175/jamc-d-18-0266.1
Qin, D. H., Zhou, B. T., and Xiao, C. D. (2014). Progress in studies of cryospheric changes and their impacts on climate of China. J. Meteorol. Res. 28, 732–746. doi: 10.1007/s13351-014-4029-z
Rangwala, I., Miller, J. R., and Xu, M. (2009). Warming in the Tibetan Plateau: possible influences of the changes in surface water vapor. Geophys. Res. Lett. 36:L06703. doi: 10.1029/2009gl037245
Robeson, S. (1994). Influence of spatial sampling and interpolation on estimates of air temperature change. Clim. Res. 4:119. doi: 10.3354/cr004119
Rolland, C. (2003). Spatial and seasonal variations of air temperature lapse rates in alpine regions. J. Clim. 16, 1032–1046. doi: 10.1175/1520-0442(2003)016<1032:Sasvoa>2.0.Co;2
Sen, P. K. (1968). Estimates of the regression coefficient based on Kendall’s Tau. J. Am. Stat. Assoc. 63, 1379–1389. doi: 10.1080/01621459.1968.10480934
Shi, Y. Y., Niu, F. J., Lin, Z. J., and Luo, J. (2019). Freezing/thawing index variations over the circum-arctic from 1901 to 2015 and the permafrost extent. Sci. Total Environ. 660, 1294–1305. doi: 10.1016/j.scitotenv.2019.01.121
Shiklomanov, N. I., and Nelson, F. E. (2002). Active-layer mapping at regional scales: a 13-year spatial time series for the Kuparuk region, north-central Alaska. Permafr. Periglac. Process. 13, 219–230. doi: 10.1002/ppp.425
Steurer, P. M., and Crandell, J. H. (1995). Comparison of methods used to create estimate of air-freezing index. J. Cold Reg. Eng. 9, 64–74. doi: 10.1061/(asce)0887-381x19959:2(64)
Stone, P. H., and Carlson, J. H. (1979). Atmospheric lapse rate regimes and their parameterization. J. Atmos. Sci. 36, 415–423. doi: 10.1175/1520-0469(1979)036<0415:Alrrat>2.0.Co;2
Kayıkçı, E. T., and Kazancı, S. Z. (2016). Comparison of regression-based and combined versions of inverse distance weighted methods for spatial interpolation of daily mean temperature data. Arab. J. Geosci. 9, 1–10. doi: 10.1007/s12517-016-2723-0
Wahba, G. (1990). Spline Models for Observational Data. Philadelphia, PA: Society for Industrial and Applied Mathematics, doi: 10.1137/1.9781611970128
Wang, B. M. (1980). Tibet Climate Regionalization. Tibet Agricultural Technology. 21–34. Available online at: https://kns.cnki.net/kcms/detail/detail.aspx?FileName=XZNY198003001&DbName=CJFQ1980 (In Chinese).
Wang, R., Zhu, Q. K., and Ma, H. (2019). Changes in freezing and thawing indices over the source region of the Yellow River from 1980 to 2014. J. For. Res. 30, 257–268. doi: 10.1007/s11676-017-0589-y
Wang, S. L., Jin, H. J., Li, S. X., and Zhao, L. (2000). Permafrost degradation on the Qinghai-Tibet Plateau and its environmental impacts. Permafr. Periglac. Process. 11, 43–53. doi: 10.1002/(SICI)1099-1530(200001/03)11:1<43::AID-PPP332>3.0.CO;2-H
Wu, Q. B., and Zhang, T. J. (2010). Changes in active layer thickness over the Qinghai-Tibetan Plateau from 1995 to 2007. J. Geophys. Res. Atmos. 115:12. doi: 10.1029/2009jd012974
Wu, T. H., Qin, Y. H., Wu, X. D., Li, R., Zou, D. F., and Xie, C. W. (2018). Spatiotemporal changes of freezing/thawing indices and their response to recent climate change on the Qinghai-Tibet Plateau from 1980 to 2013. Theor. Appl. Climatol. 132, 1187–1199. doi: 10.1007/s00704-017-2157-y
Wu, T. H., Wang, Q. C., Zhao, L., Batkhishig, O., and Watanabe, M. (2011). Observed trends in surface freezing/thawing index over the period 1987-2005 in Mongolia. Cold Reg. Sci. Technol. 69, 105–111. doi: 10.1016/j.coldregions.2011.07.003
Wu, T. H., Zhao, L., Li, R., Wang, Q. X., Xie, C. W., and Pang, Q. Q. (2013). Recent ground surface warming and its effects on permafrost on the central Qinghai-Tibet Plateau. Int. J. Climatol. 33, 920–930. doi: 10.1002/joc.3479
Yang, K., Ye, B. S., Zhou, D. G., Wu, B. Y., Foken, T., Qin, J., et al. (2011). Response of hydrological cycle to recent climate changes in in the Tibetan Plateau. Clim. Change 109, 517–534. doi: 10.1007/s10584-011-0099-4
Zhang, J. G., Lu, P. H., Zhou, Z. H., and Zhang, W. S. (2010). Melting and shrinkage of cryosphere in Tibet and its impact on ecology and environment. Arid Land Geogr. 33, 703–709. doi: 10.13826/j.cnki.cn65-1103/x.2010.05.006 (In Chinese).
Zhang, T. J., Frauenfeld, O. W., Serreze, M. C., Etringer, A., Oelke, C., McCreight, J., et al. (2005). Spatial and temporal variability in active layer thickness over the Russian Arctic drainage basin. J. Geophys. Res. Atmos. 110:14. doi: 10.1029/2004jd005642
Zhao, L. (2019). A New Map of Permafrost Distribution on The Tibetan Plateau (2017). National Tibetan Plateau Data Center. doi: 10.11888/Geocry.tpdc.270468
Zou, D. F., Zhao, L., Sheng, Y., Chen, J., Wu, T. H., Wu, J. C., et al. (2016). A new map of permafrost distribution on the Tibetan Plateau. The Cryosphere 11, 2527–2542.
Keywords: Tibet, freezing and thawing indices, climate change, variation trends, permafrost degradation
Citation: Liao Y, Li Y, Fan J, Galoie M and Motamedi A (2021) Spatiotemporal Variations of Freezing and Thawing Indices During the Past Four Decades in Tibet. Front. Ecol. Evol. 9:750961. doi: 10.3389/fevo.2021.750961
Received: 31 July 2021; Accepted: 13 September 2021;
Published: 29 September 2021.
Edited by:
Jian Sun, Institute of Tibetan Plateau Research, Chinese Academy of Sciences (CAS), ChinaReviewed by:
Dongliang Luo, Northwest Institute of Eco-Environment and Resources, Chinese Academy of Sciences (CAS), ChinaBen Niu, Institute of Geographic Sciences and Natural Resources Research, Chinese Academy of Sciences (CAS), China
Copyright © 2021 Liao, Li, Fan, Galoie and Motamedi. This is an open-access article distributed under the terms of the Creative Commons Attribution License (CC BY). The use, distribution or reproduction in other forums is permitted, provided the original author(s) and the copyright owner(s) are credited and that the original publication in this journal is cited, in accordance with accepted academic practice. No use, distribution or reproduction is permitted which does not comply with these terms.
*Correspondence: Jihui Fan, amhmYW5AaW1kZS5hYy5jbg==