 Philipp L. Knaus
 Anneke H. van Heteren
 Jacqueline K. Lungmus
 P. Martin Sander2
- 1Institut für Biologie, Humboldt-Universität zu Berlin, Berlin, Germany
- 2Institut für Geowissenschaften, Universität Bonn, Bonn, Germany
- 3Museum für Naturkunde Berlin, Leibniz-Institut für Evolutions – und Biodiversitätsforschung, Berlin, Germany
- 4Sektion Mammalogie, Zoologische Staatssammlung München – Staatliche Naturwissenschaftliche Sammlungen Bayerns, Munich, Germany
- 5Geobio-Center, Ludwig-Maximilians-Universität München, Munich, Germany
- 6Department Biologie II, Ludwig-Maximilians-Universität München, Munich, Germany
- 7Department of Organismal Biology and Anatomy, University of Chicago, Chicago, IL, United States
- 8Negaunee Integrative Research Center, Field Museum of Natural History, Chicago, IL, United States
Varanids are the only non-avian sauropsids that are known to approach the warm-blooded mammals in stamina. Furthermore, a much higher maximum metabolic rate (MMR) gives endotherms (including birds) higher stamina than crocodiles, turtles, and non-varanid lepidosaurs. This has led researchers to hypothesize that mammalian endothermy evolved as a second step after the acquisition of elevated MMR in non-mammalian therapsids from a plesiomorphic state of low metabolic rates. In recent amniotes, MMR correlates with the index of blood flow into the femur (Qi), which is calculated from femoral length and the cross-sectional area of the nutrient foramen. Thus, Qi may serve as an indicator of MMR range in extinct animals. Using the Qi proxy and phylogenetic eigenvector maps, here we show that elevated MMRs evolved near the base of Synapsida. Non-mammalian synapsids, including caseids, edaphosaurids, sphenacodontids, dicynodonts, gorgonopsids, and non-mammalian cynodonts, show Qi values in the range of recent endotherms and varanids, suggesting that raised MMRs either evolved in synapsids shortly after the Synapsida-Sauropsida split in the Mississippian or that the low MMR of lepidosaurs and turtles is apomorphic, as has been postulated for crocodiles.
Introduction
Comparisons of endothermic mammals and birds with ectothermic sauropsids reveal a chasm in metabolic rates between the two functional groups of amniotes. Endotherms maintain mass-specific basal metabolic rates (BMR) an order of magnitude higher than most ectotherms (Bennett and Ruben, 1979) to produce body heat and actively thermoregulate by metabolic investment (we follow this definition of endothermy; for a review of vertebrate endothermy, see Legendre and Davesne, 2020). Monotremes and some marsupials show slightly lower values than placentals with birds showing the highest BMRs among amniote endotherms. Maximum aerobic metabolic rate (MMR), the highest metabolic rate that animals can maintain once initial anaerobic metabolism is exhausted, governs stamina (e.g., Carrier, 1987; Jones and Lindstedt, 1993; Clemente et al., 2009). Short bursts of activity between long bouts of rest are typical of ectotherms and are sustained through anaerobic metabolism (Garland, 1982). MMR is much higher in endotherms than ectotherms, but varanids can exceed half the mass-specific MMR of endotherms under ideal temperatures (Taylor et al., 1981; Clemente et al., 2009), whereas varanid BMR is comparable to other non-avian sauropsids (Christian and Conley, 1994). In practice, metabolic rates are even more different between endotherms and ectotherms, because the chemical reactions of metabolism are temperature-sensitive in their reaction speed. Colder ectotherms are more sluggish than endotherms (Nagy, 1987), although when body temperature is accounted for, differences persist (Gillooly et al., 2001). Still, certain animals with intermediate physiological characteristics exist that might be the key to understanding the stark metabolic contrast between endotherms and ectotherms. When scaling metabolic rates of amniote ectotherms up to the body temperature of mammals (higher than the behaviorally optimized ideal temperature of most ectotherms, while bird body temperatures are even higher), their BMR can be compared to that of tenrecid mammals (Oelkrug et al., 2013). Also, recent experiments with black and white tegus (Salvator merianae) have revealed seasonal non-shivering thermogenesis in these squamates, if at a relatively low body temperature (Tattersall et al., 2016).
In the light of this metabolic dichotomy, scientists have proposed different hypotheses explaining how the evolution from ectothermy to endothermy could have taken shape in mammals. Models for the evolution of (mammalian) endothermy can be broadly divided into three categories: the thermoregulation-first models, the aerobic capacity-first models, and the correlated progression model. The former two suggest stepwise evolution of endothermy (requiring high BMR) and aerobic capacity (meaning high MMR), whereas the correlated progression model proposes an integrated evolution of endothermy. Thermoregulation-first models propose that increases in aerobic capacity were preceded by endothermy in the evolution of mammalian endothermy. They focus on various selective factors, such as nocturnal lifestyle (Crompton et al., 1978) and large brains (Hulbert, 1980; Rowe et al., 2011) in Mesozoic Mammaliaformes, or parental care (Farmer, 2000, 2003) and phylogenetic reduction in body size (McNab, 1978) in late Permian therapsids. Aerobic capacity-first models regard aerobic scope to have increased prior to the evolution of endothermy. For support, they point to greater initial selective advantage of stamina over costly endothermy (Bennett and Ruben, 1979), to general morphology (Bennett and Ruben, 1986), and to adaptations to widely foraging lifestyles (Hopson, 2012) in late Permian therapsids, or to increased aerobic metabolic requirements of parental care for the parent animals in cynodonts (Koteja, 2000). Lovegrove (2017) integrated the evidence for elevated locomotion capacity and parental care (and the associated required aerobic capacity) in late Permian therapsids into his first phase of endothermy evolution as a precondition to endothermy in Late Triassic cynodonts (for a detailed review, see Lovegrove, 2019). The correlated progression model of Kemp (2006) tries to resolve the argument between the two other basic approaches by integrating them into one model. Kemp cites three lines of evidence for his hypothesis of a gradual and integrated evolution of the complex system of adaptations necessary for endothermy: models for selective forces in complex systems, the sequence of acquisition of characters in the fossil record, and the interrelated nature of certain characters regarding endothermy in recent mammals. Similarly, Benton (2021) reviewed the latest literature on endothermy evolution and developed a hypothesis of a gradual and integrated acquisition of characters typical of endothermy in both synapsids and archosaurs over millions of years. Benton (2021) hypothesizes that the Permian-Triassic mass extinction and competition catalyzed the evolution of endothermy in both lineages during the Triassic Terrestrial Revolution.
While many questions as to the interrelation and adaptive value of certain characters of endothermy in mammals can be tested in a recent environment, all the mentioned hypotheses make predictions about the order of character acquisition. Such chronological predictions cannot be tested in recent animals, especially since examples for both pathways of endothermy evolution exist. Black and white tegus evolved (intermittent) endothermy first and maintain low aerobic capacity (comp. Tattersall et al., 2016), but varanids evolved higher aerobic capacity first and maintain ectothermy (comp. Christian and Conley, 1994). Thus, we need to consult the fossil record to trace the historical process.
The most reliable evidence for endothermy in non-mammalian synapsids comes from the preservation of complete fur in Lower Jurassic mammaliaforms (Ji et al., 2006) [although the furry tenrecs have limited ability for thermogenesis (Lovegrove and Génin, 2008; Oelkrug et al., 2013)]. The evolution of hair can be traced back to vibrissae in prozostrodont cynodonts (Benoit et al., 2016) and late Permian finds in coprolites (Smith and Botha-Brink, 2011; Bajdek et al., 2016), but this is no strong case for a full coat as embryology suggests a primarily sensory function of hair (Hulbert, 1988).
A further morphological indicator of endothermy and the associated high BMR are bony attachment ridges in several cynodonts, dicynodonts, and therocephalians that suggest the presence of respiratory turbinates (Hillenius, 1992, 1994; Ruf et al., 2014). Ossified respiratory turbinates allow endothermic mammals to reduce water loss despite non-intermittent breathing and are strong indicators of constantly high oxygen consumption and thus high BMR. Crompton et al. (2017) tracked the evolution of respiratory turbinates from non-mammaliaform cynodonts to non-mammalian mammaliaforms and hypothesized that the function of their unossified respiratory turbinates in combination with the ancestral morphology of the nasal region likely aided in evaporative cooling. However, the study concluded that only late non-mammalian mammaliaforms could also employ turbinates for water conservation as would be advantageous for high metabolism.
The most direct evidence for endothermy in non-mammalian synapsids, however, is not found in morphology. Geochemical studies of oxygen isotope concentration from therapsid teeth in different localities show values expected for endotherms in lystrosaurid and kannemeyeriiform dicynodonts (Lystrosaurus, Shansiodon, Kannemeyeria, and Parakannemeyeria), as well as eucynodonts (Diademodon and Cynognathus) (Rey et al., 2017). Histological indicators of BMR in dicynodonts and cynodonts corroborate the geochemical data and mark the latest origin of mammalian BMR in the last common ancestor of Neotherapsida (Dicynodontia + Theriodontia) (Olivier et al., 2017). Additionally, secondary palates evolved convergently in several neotherapsid lineages (Hillenius, 1994). Newham et al. (2020) recently provided evidence for unexpectedly long lifespans in Early Jurassic mammaliaforms indicating lower basal metabolic rates than recent mammals, although bats also have exceptionally long lifespans for their size (Munshi-South and Wilkinson, 2010).
In non-neotherapsid synapsids, indicators of elevated basal metabolic rate still occur but are less conclusive. Fibrolamellar bone tissue (FLB) is associated with high growth rates in recent amniotes and occurs in endotherms with a body mass above 10 kg. This bone tissue type has been identified in many non-mammalian therapsid taxa (Enlow and Brown, 1957; de Ricqlès, 1974; Chinsamy-Turan, 2012; Botha-Brink et al., 2018) and the earliest branching synapsids (Shelton and Sander, 2017). Additionally, incipient fibrolamellar bone has been found in the sphenacodontid Dimetrodon (Shelton et al., 2013).
Until now, our understanding of non-mammalian synapsid MMR is relatively poor when compared to that of BMR. For most of this subject’s history, only Carrier (1987) cited evidence of elevated MMR in therapsids. He argued that the more erect stance of therapsids was indicative of high MMR because the parasagittal gait restricts the effect of Carrier’s constraint and allows for higher stamina. Recently, however, Huttenlocker and Farmer (2017) have studied quantitative indicators of red blood cell size in non-mammalian histology. Red blood cell size negatively correlates with relative heart mass, which is a proxy for aerobic capacity. Thus, their study gives an indication of stamina in the studied taxa. Their findings suggest the presence of elevated stamina in theriodont therapsids but do not distinguish between values in non-theriodont synapsids, varanids, and the American Alligator. The similarity of the values is unexpected in the last two taxa because varanids show elevated MMR over that of crocodiles. Thus, this quantitative indicator of activity metabolism in synapsids appears to be unable to distinguish low aerobic capacity from intermediate levels while mammalian-like aerobic capacity likely evolved only in cynodonts.
Seymour et al. (2012) reason that higher MMR allows for increased locomotor exercise, putting more stress on the femur. Many endotherms remodel their bones as a result of loading throughout the organism’s life, which requires oxygen and nutrients that are supplied through the nutrient artery that enters the nutrient canal and empties into the medullary cavity. From the central medullary cavity, near the original ossification center, blood then gets distributed along the length of the bone. In more active animals the nutrient canal thus has a larger diameter to accommodate higher blood flow for increased remodeling (Seymour et al., 2012).
The index of blood flow (Qi) developed by Seymour et al. (2012) works as a proxy for MMR and absolute aerobic scope (AAS = MMR − BMR) and has been used to infer the metabolic status of extinct non-avian dinosaurs (Seymour et al., 2012), a non-mammalian mammaliaform (Newham et al., 2020), as well as the lifestyle of extinct birds (Allan et al., 2014). Also, the blood flow index can distinguish the values of varanids from those of other non-dinosaur sauropsids, although this has not been tested under phylogenetic compensation. Varanids maintain lower MMRs than mammals but high AAS since varanid BMR agrees with that of other ectothermic amniotes while exceeding MMR of other non-avian sauropsids.
With these capabilities, Seymour’s Qi can help elucidate the origin of elevated aerobic scopes in the synapsid lineage and test the aerobic capacity model in general, while also testing Hopson’s (2012) foraging hypothesis in particular. Recently, Newham et al. (2020) were the first to calculate blood flow index in the mammalian fossil lineage in Morganucodon, close to the origin of mammals, and inferred MMR elevated over non-varanid ectothermic amniotes (from here on termed non-varanid ectotherms).
Although a recent study in mice found the importance of nutrient arteries to be lower than trans-cortical vessels for blood supply to long bones (Grüneboom et al., 2019), the correlation between blood flow index and MMR could be empirically confirmed in the same species by Schwartz et al. (2018).
Phylogenetic eigenvector maps (Guénard et al., 2013) offer a way to reconstruct metabolic rates in extinct organisms. This has been demonstrated for BMR in archosaurs (Legendre et al., 2016), archosauromorphs (Cubo and Jalil, 2019), plesiosaurs (Fleischle et al., 2018), therapsids (Olivier et al., 2017), a larger sample of synapsids (Faure-Brac and Cubo, 2020), and Notosuchia (Cubo et al., 2020). For the first time, we apply this method to the reconstruction of MMR in the mammalian lineage using Seymour’s Qi as a co-predictor. The aerobic-capacity first models of endothermy evolution predict elevated MMR in non-neotherapsid synapsids, while the thermoregulation-first and correlated progression models predict that elevated MMR evolved exclusively in neotherapsids after or in conjunction with elevated BMR.
Materials
Thirty femora from a wide phylogenetic scope of non-mammalian synapsids were evaluated (see Table 1 and Supplementary Table 1). The sample covers four of the six known non-therapsid synapsid families (Reisz, 1986) (Ophiacodontidae, Caseidae, Edaphosauridae, and Sphenacodontidae, but not Varanopidae and Eothyrididae). However, the assignment of Varanopidae to Synapsida is currently under debate (see Laurin and Piñeiro, 2018; MacDougall et al., 2018; Ford and Benson, 2020), reducing the number of known non-therapsid synapsid families to five. Also, the sample includes three of the six major taxa of non-mammalian therapsids (Kemp, 2012) (Anomodontia, Gorgonopsia, and Cynodontia). Thus, the material covers taxa from the earliest-branching non-mammalian synapsids of the Carboniferous (Clepsydrops) to a probainognathian eucynodont (Chiniquodon) from the late Middle to early Late Triassic close to the origin of mammaliaforms. The femora originate from 13 different stratigraphic units in Brazil, Malawi, South Africa, Tanzania, and the United States: the upper Pennsylvanian middle McLeansboro Group of Illinois, Cisuralian Abo Formation (Fm.) of New Mexico, Cisuralian Archer City Fm., Nocona Fm., Arroyo Fm., and Clear Fork Fm. of Texas as well as the Cisuralian Abo Fm. of New Mexico. The only Guadalupian aged fossil of our dataset comes from the Chickashaw Fm. of Oklahoma (for dating of the Chickashaw Fm., see Reisz and Laurin, 2001, 2002). Therapsids come from the Lopingian Usili Fm. of Tanzania and the Chiweta Beds of Malawi. South African specimens come from the Lower Triassic Lystrosaurus Assemblage Zone (AZ) and Middle Triassic Cynognathus AZ. Finally, the Manda Fm. in Tanzania and Santa Maria Fm. in Brazil were sources of Middle Triassic fossils in our data set.
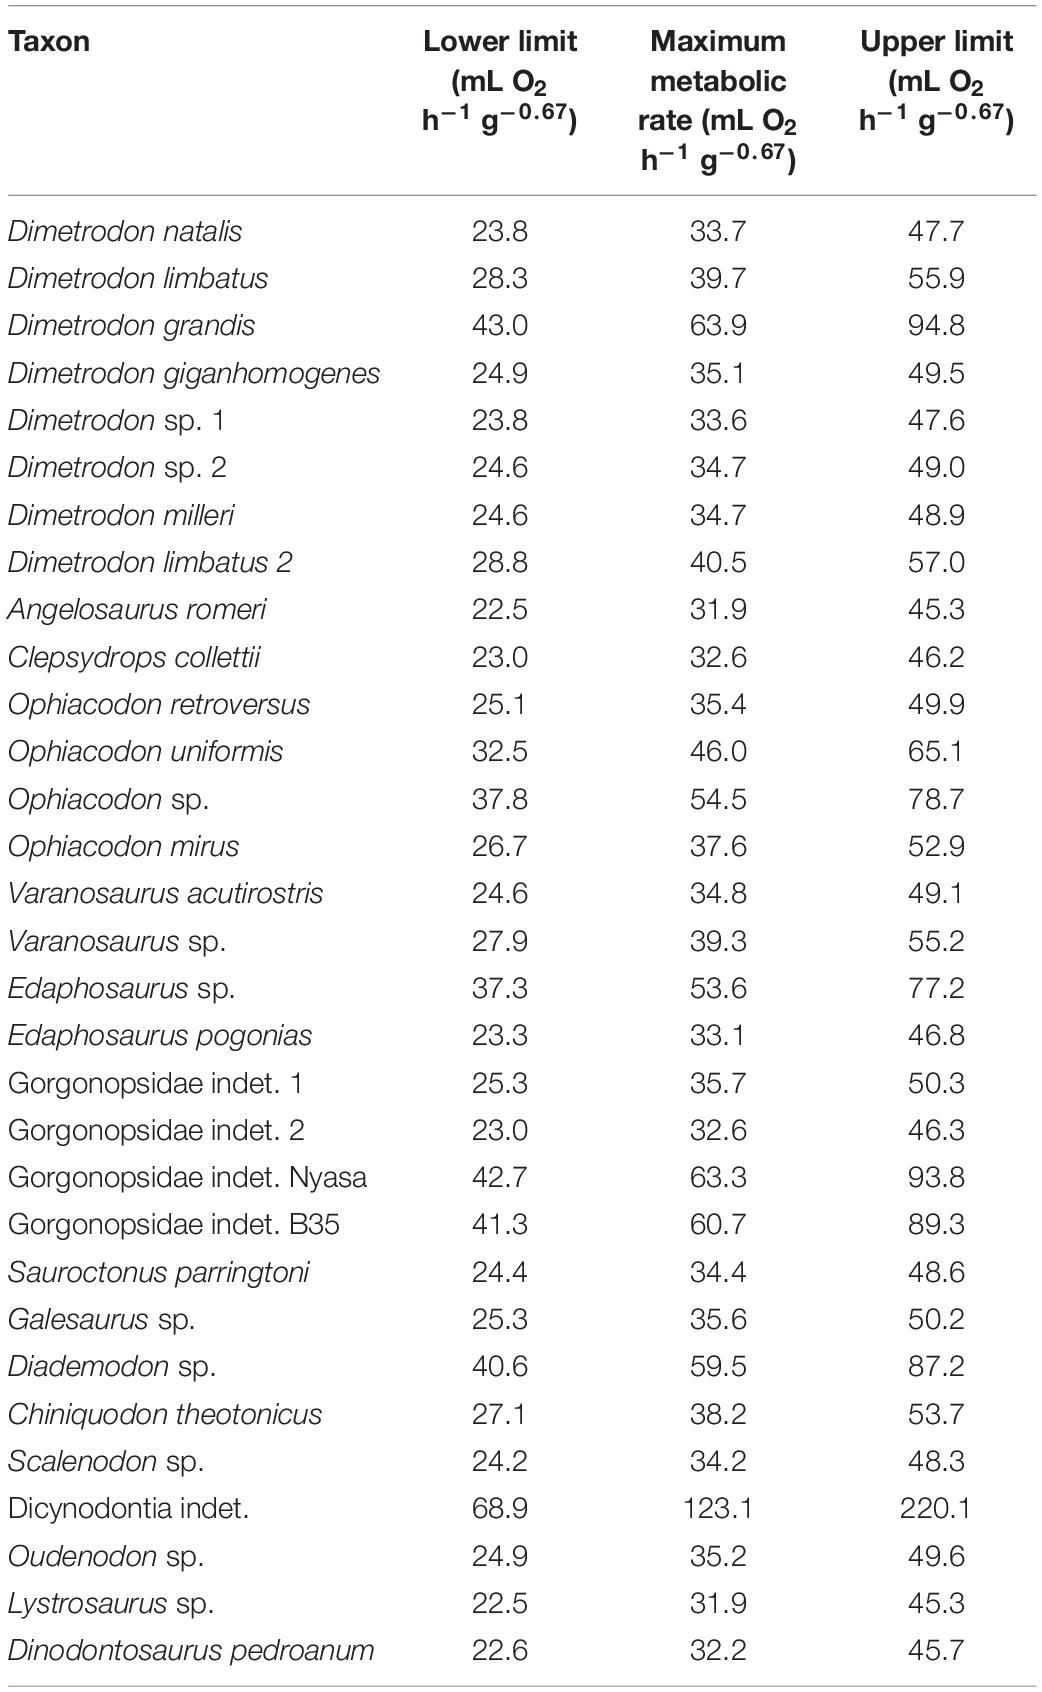
Table 1. Predicted maximum metabolic rates calculated through phylogenetic eigenvector maps with Qi as co-predictor.
Specimens represent primarily terrestrial taxa as well as potentially semi-aquatic taxa, as locomotion style has been demonstrated to affect Qi (Allan et al., 2014). Semiaquatic lifestyles have been suggested for Ophiacodontidae (Laurin and de Buffrénil, 2016), Lystrosaurus (Ray et al., 2005), and Caseidae (Lambertz et al., 2016).
To minimize ontogenetic bias to Qi through the elevated blood supply needs of growth (Brookes, 1967; Hu et al., 2018), we chose non-therapsid synapsid femora based on the ontogenetic stages developed by Brinkman (1988) for sphenacodontids of ossification stages III or higher and selected the largest femora available for other taxa.
Methods
Nutrient Canal Cross-Sectional Area Analysis
Where nutrient foramina were not obscured by matrix, digital photographs were acquired with a Canon Ixus 220 HS digital camera with a scale bar or calipers placed in the frame for scale. Where nutrient foramina could be located but were still occluded, matrix was carefully removed from the canal with an airscribe and needles until the cross-sectional area ceased to decrease below the superficial funnel. Care was taken to avoid widening the nutrient canal in this process. Then, photomicrographs were taken using either a camera adapter on a stereo microscope with a digital camera or a Hirox KH 7700 digital microscope at different planes of focus. In using photography, the picture was taken from an angle that provided visibility of the deepest unobscured point of the nutrient canal.
When nutrient foramina could not be cleared sufficiently or were not visible, femora were scanned using a General Electric phoenix V|tome|x S180/240 CT scanner (Section Palaeontology, Institut für Geowissenschaften, Universität Bonn) or a General Electric phoenix V|tome|x S240 CT scanner with custom added 180 kV tube (PaleoCT lab at the Department of Organismal Biology and Anatomy, University of Chicago), using either the 180 or 240 kV tube varying according to specimen dimensions.
Based on the μCT scans, image stacks were produced with the phoenix datos|x software and volumetric models were constructed from these image stacks using VG Studio Max software by Volume Graphics GmbH. To produce virtual cross sections of the nutrient canals, the canal paths were identified in the volumetric models. For this, we first marked the nutrient foramen in a slice window. Secondly, the canal was traced to its full extent and connected to the first mark through a vector. During this step, we also controlled for the direction of the nutrient canal toward the ossification center to avoid measuring vascular canals that did not directly feed into the medullary cavity (compare Figures 1, 2). Third, the vector was aligned coaxially with the view angle and fourth, scrolling through the cross sections along the canal, we identified the point of minimal canal cross sectional area. Last, we obtained an image file with scale bar from the virtual cross section in isometric view using the snapshot tool. In three specimens, both photographic and μCT methods were used to produce image files of the nutrient canal cross sections for cross-validation of methods and resulted in identical values. Hu et al. (2020) found no significant difference between radius and cross-sectional area of nutrient canals measured from microphotographs and micro-CT in a larger sample.
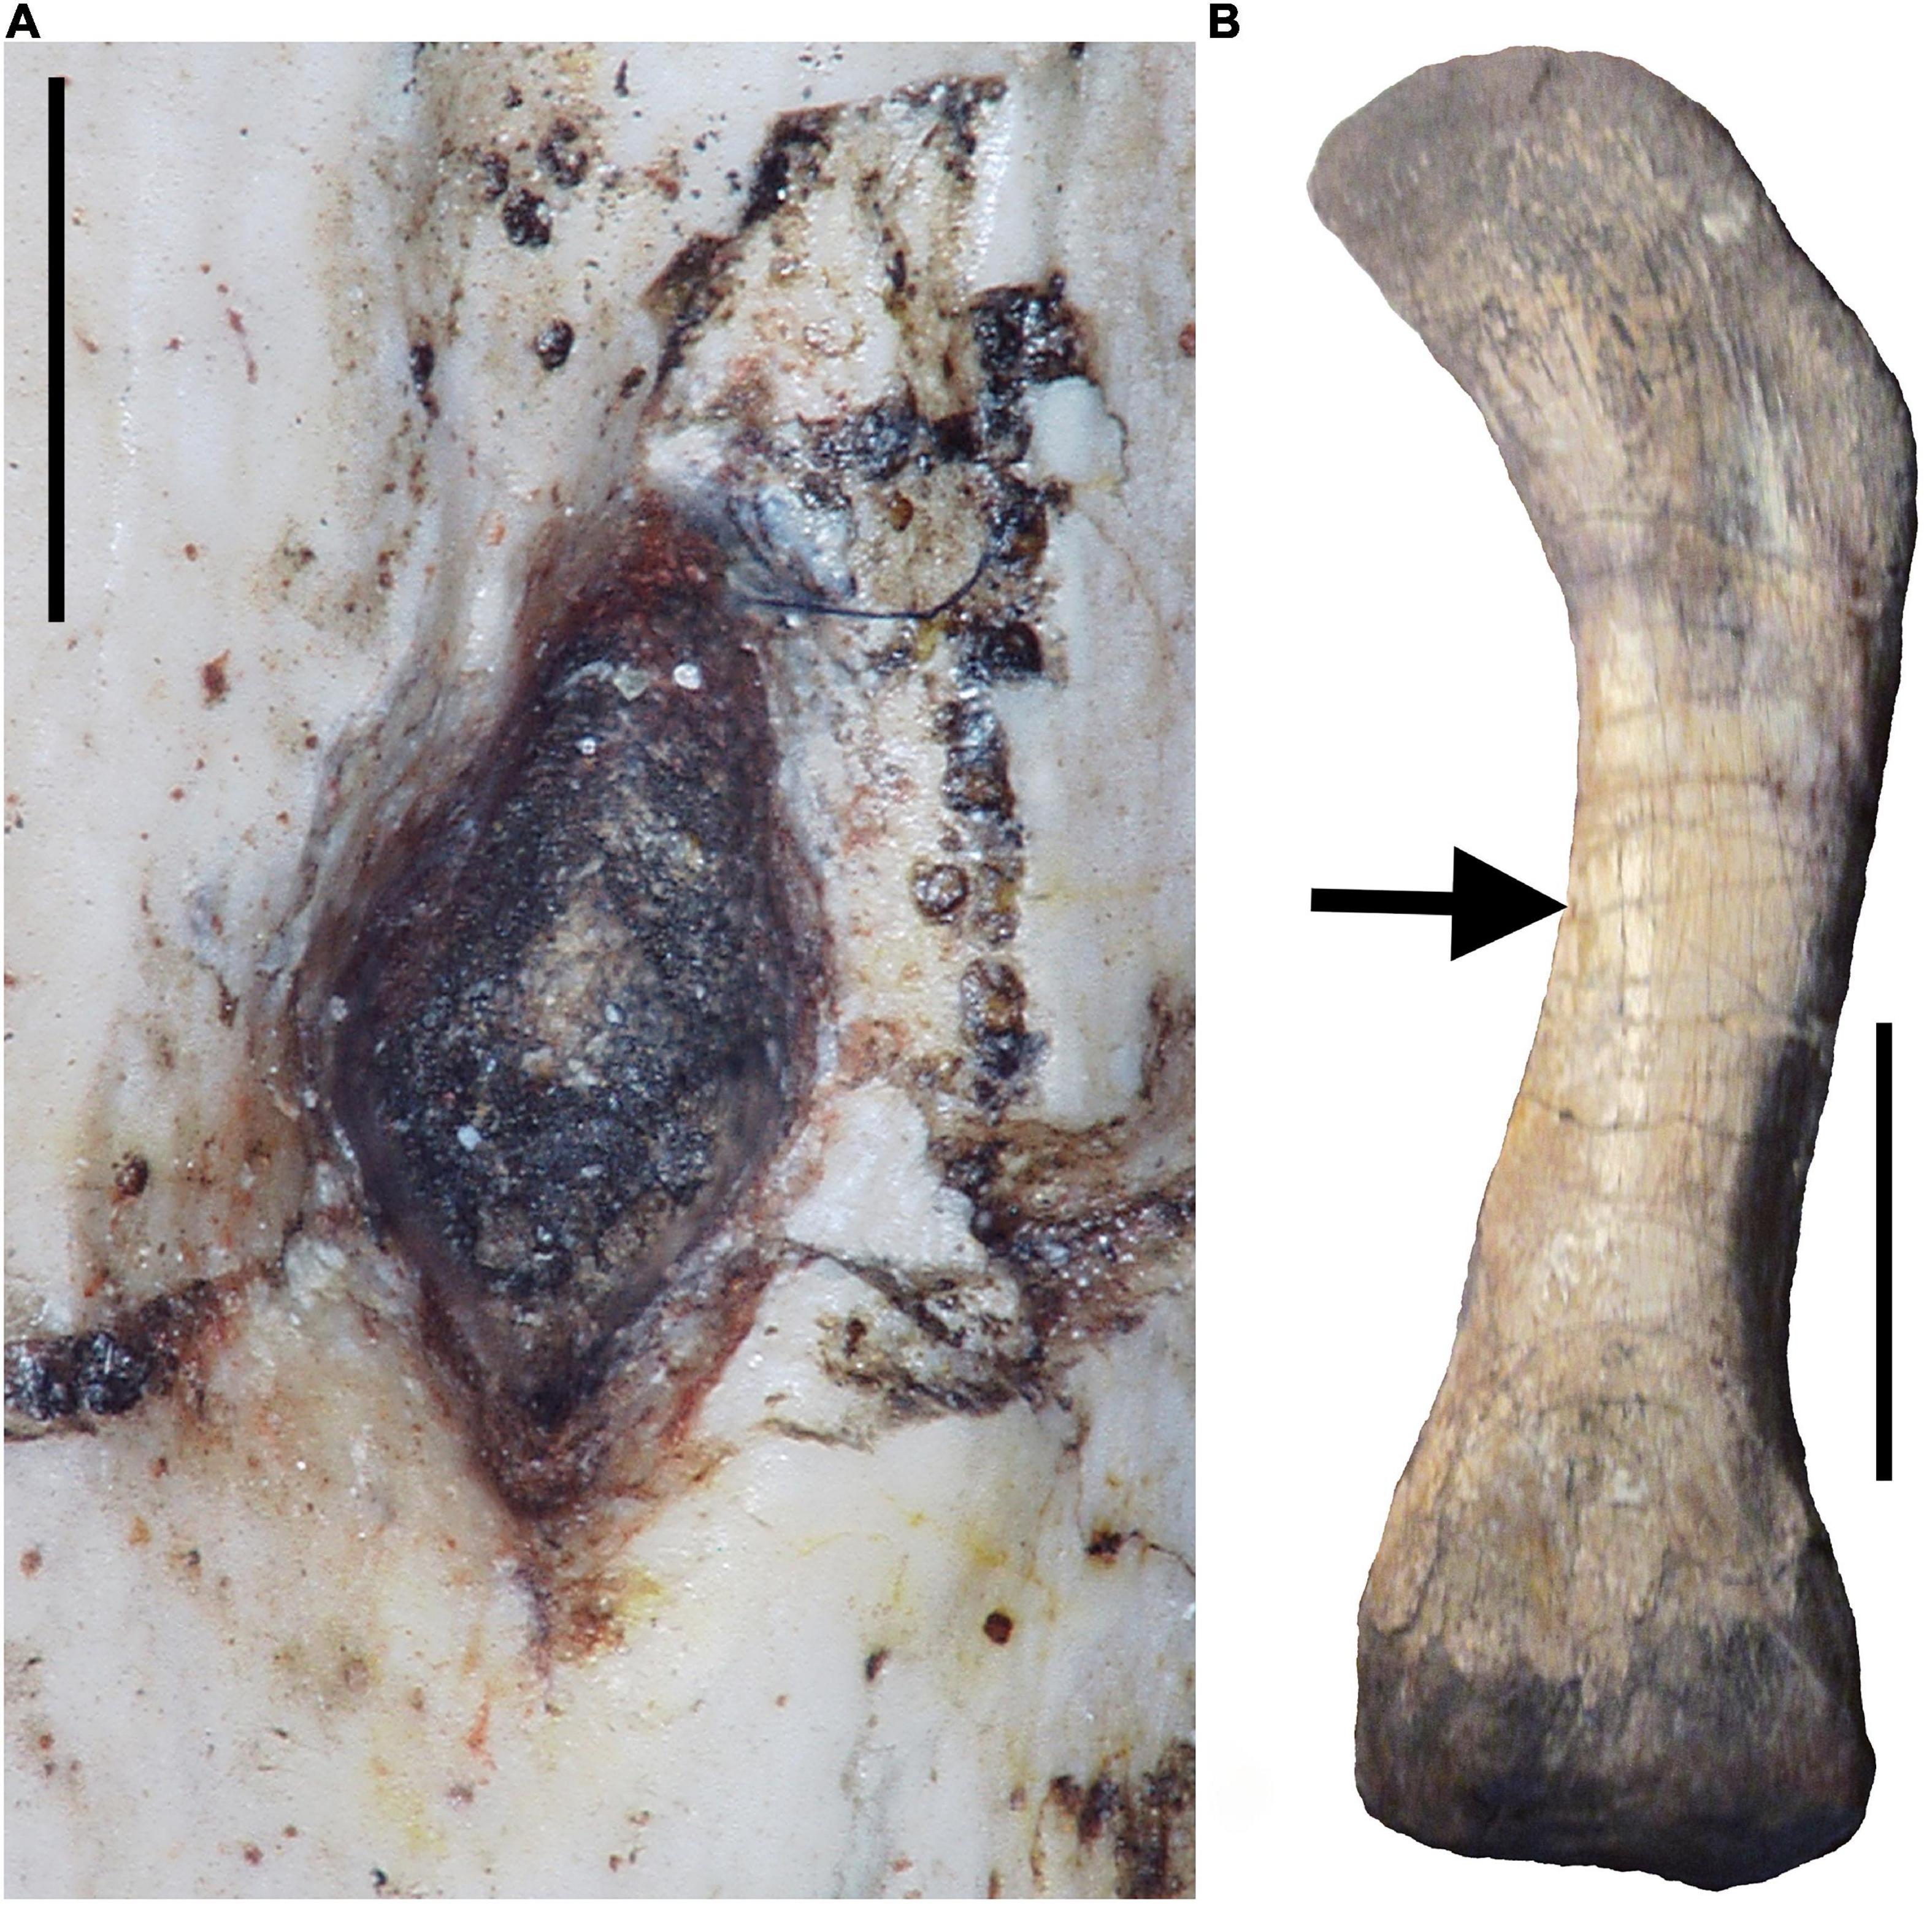
Figure 1. Photographs of the left femur of the gorgonopsid therapsid Sauroctonus parringtoni [Paläontologische Sammlung, Universität Tübingen, Tübingen, Germany (GPIT/RE/7113)]. (A) Digital photomicrograph of the nutrient foramen. Note wide funnel that needs to be avoided when measuring nutrient foramen radius superficially. Scale bar equals 1 mm. (B) Photograph of entire femur in dorsal view with arrow indicating location of nutrient foramen. Scale bar equals 5 cm.
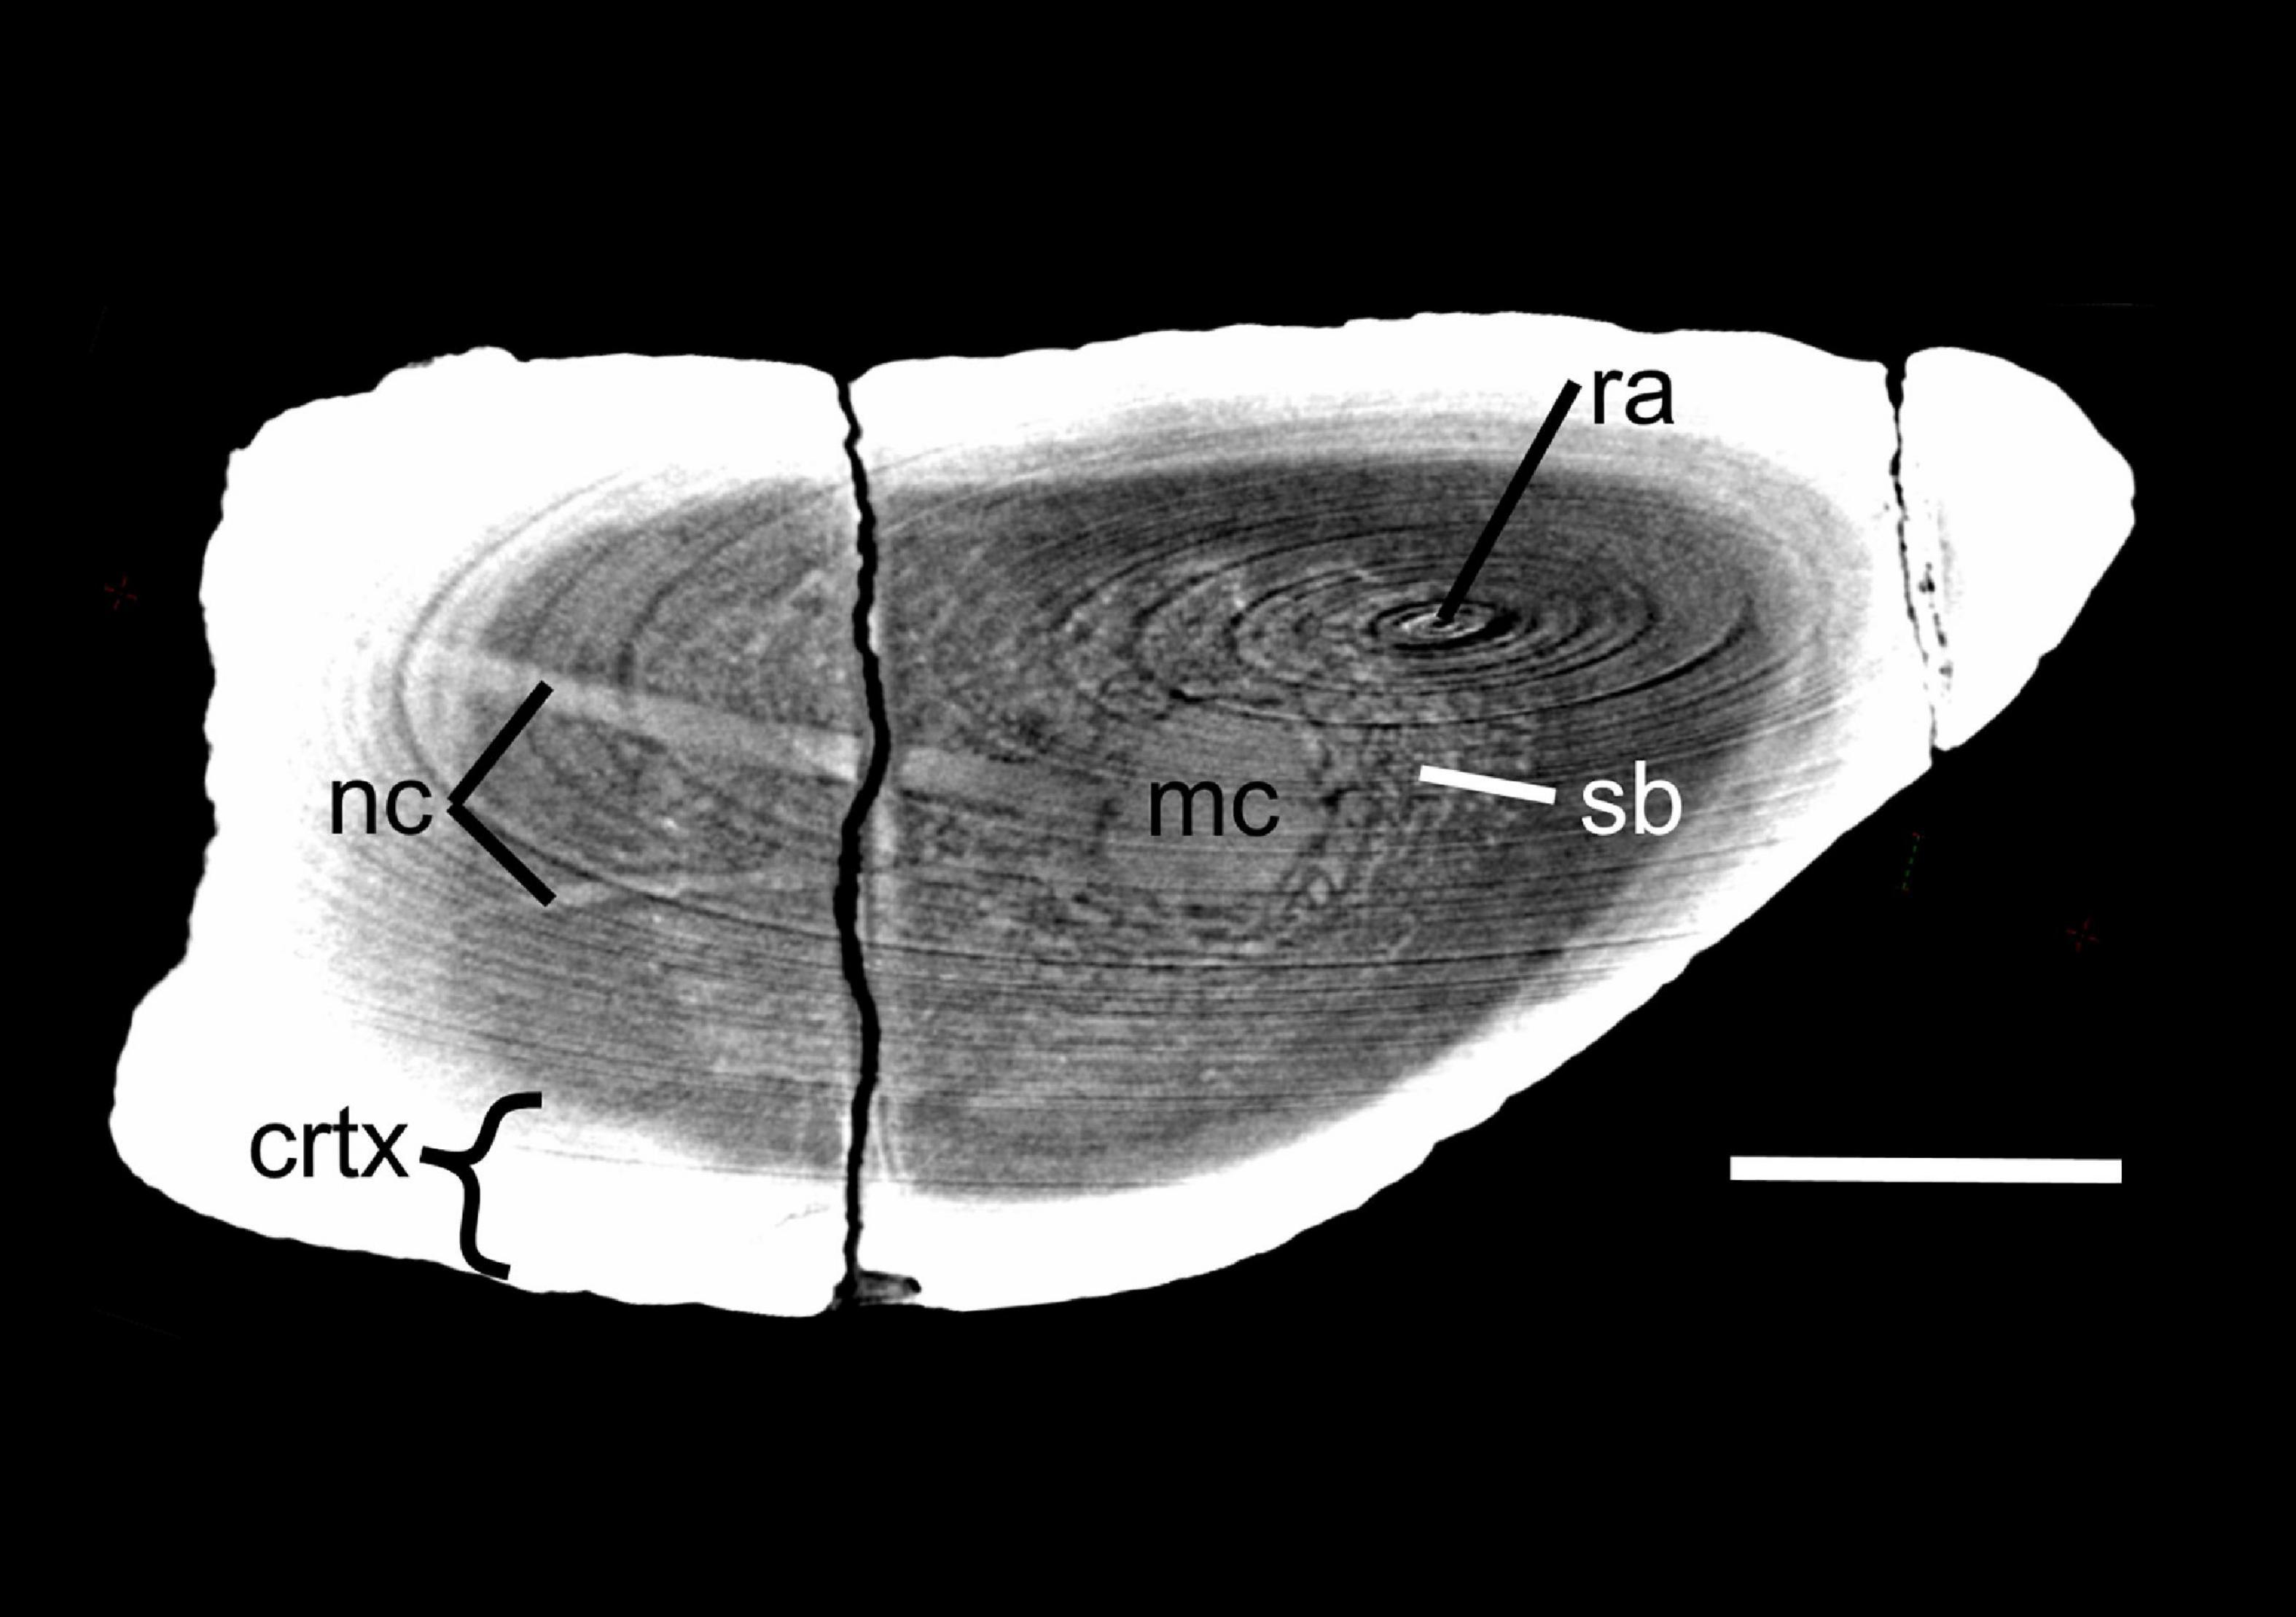
Figure 2. Virtual cross section through the femur of Lystrosaurus sp. [Museum of Zoology, Cambridge, United Kingdom (UMZ T 767)]. Disregard ring artifacts (ra). Note the nutrient canals (nc) crossing the cortex (crtx) and spongy bone (sb) in the medullary region to feed into the center of the medullary cavity (mc) where the primary ossification center is located. When multiple nutrient canals were discovered, minimum cross-sectional area of each canal was added to calculate Qi. Scale bar equals 1 cm.
Image files from 3D models and digital photographs were loaded into ImageJ 1.49k (Fiji package) image analysis software, and cross-sectional area of the nutrient canal was averaged from at least three measurements of each file to minimize tracing subjectivity. If multiple nutrient canals had been identified, their cross-sectional areas were added. Nutrient foramen radius was calculated from a perfect circle with the same cross-sectional area as the nutrient canal as needed for Seymour’s index of blood flow.
Blood Flow Index Calculation
Seymour et al. (2012) derived the index of blood flow (Qi) from the Hagen-Poiseulle equation, which gives the flow rate of blood (Q) given laminar flow through blood vessels depending on blood viscosity, blood pressure difference (P), vessel radius (r), and vessel length (L): Q = (Pπ r4)/(8 L η). As blood flow and viscosity are independent of body size, both terms are eliminated to get the index of blood flow equation: Qi = r4/L.
Body Mass Estimation
Body mass (Mb) for non-mammalian synapsids was calculated with the equation of Campione and Evans (2012) from mid-diaphysis circumference of the humerus (CH) and the Femur (CF): Mb = 10^[2.749 * log10 (CH + CF) − 1.104)].
In several cases, however, only isolated femora were available. For Dimetrodon, the CH/CF ratios of Shelton et al. (2013) were employed. In the case of therapsids, ratios were measured in closely related complete skeletons at GPIT (Tübingen Palaeontological Collection, Tübingen, Germany; Sauroctonus for gorgonopsids, Chiniquodon for cynodonts, and Tetragonias for dicynodonts). For other non-therapsid synapsids, the CH/CF ratio was calculated from values of closely related taxa published in Shelton (2015). The CH value was then calculated from the CH/CF quotient and used in mass estimation.
Least Squares Regressions
For visualization purposes, Qi was plotted against body mass on a double logarithmic scale using Microsoft Excel. We performed simple linear least squares regressions for non-mammalian synapsids, non-avian dinosaurs, birds, mammals, varanids, and non-varanid ectotherms, adding calculated 95% confidence intervals to maintain comparability with the original results of Seymour et al. (2012) (see Figure 3).
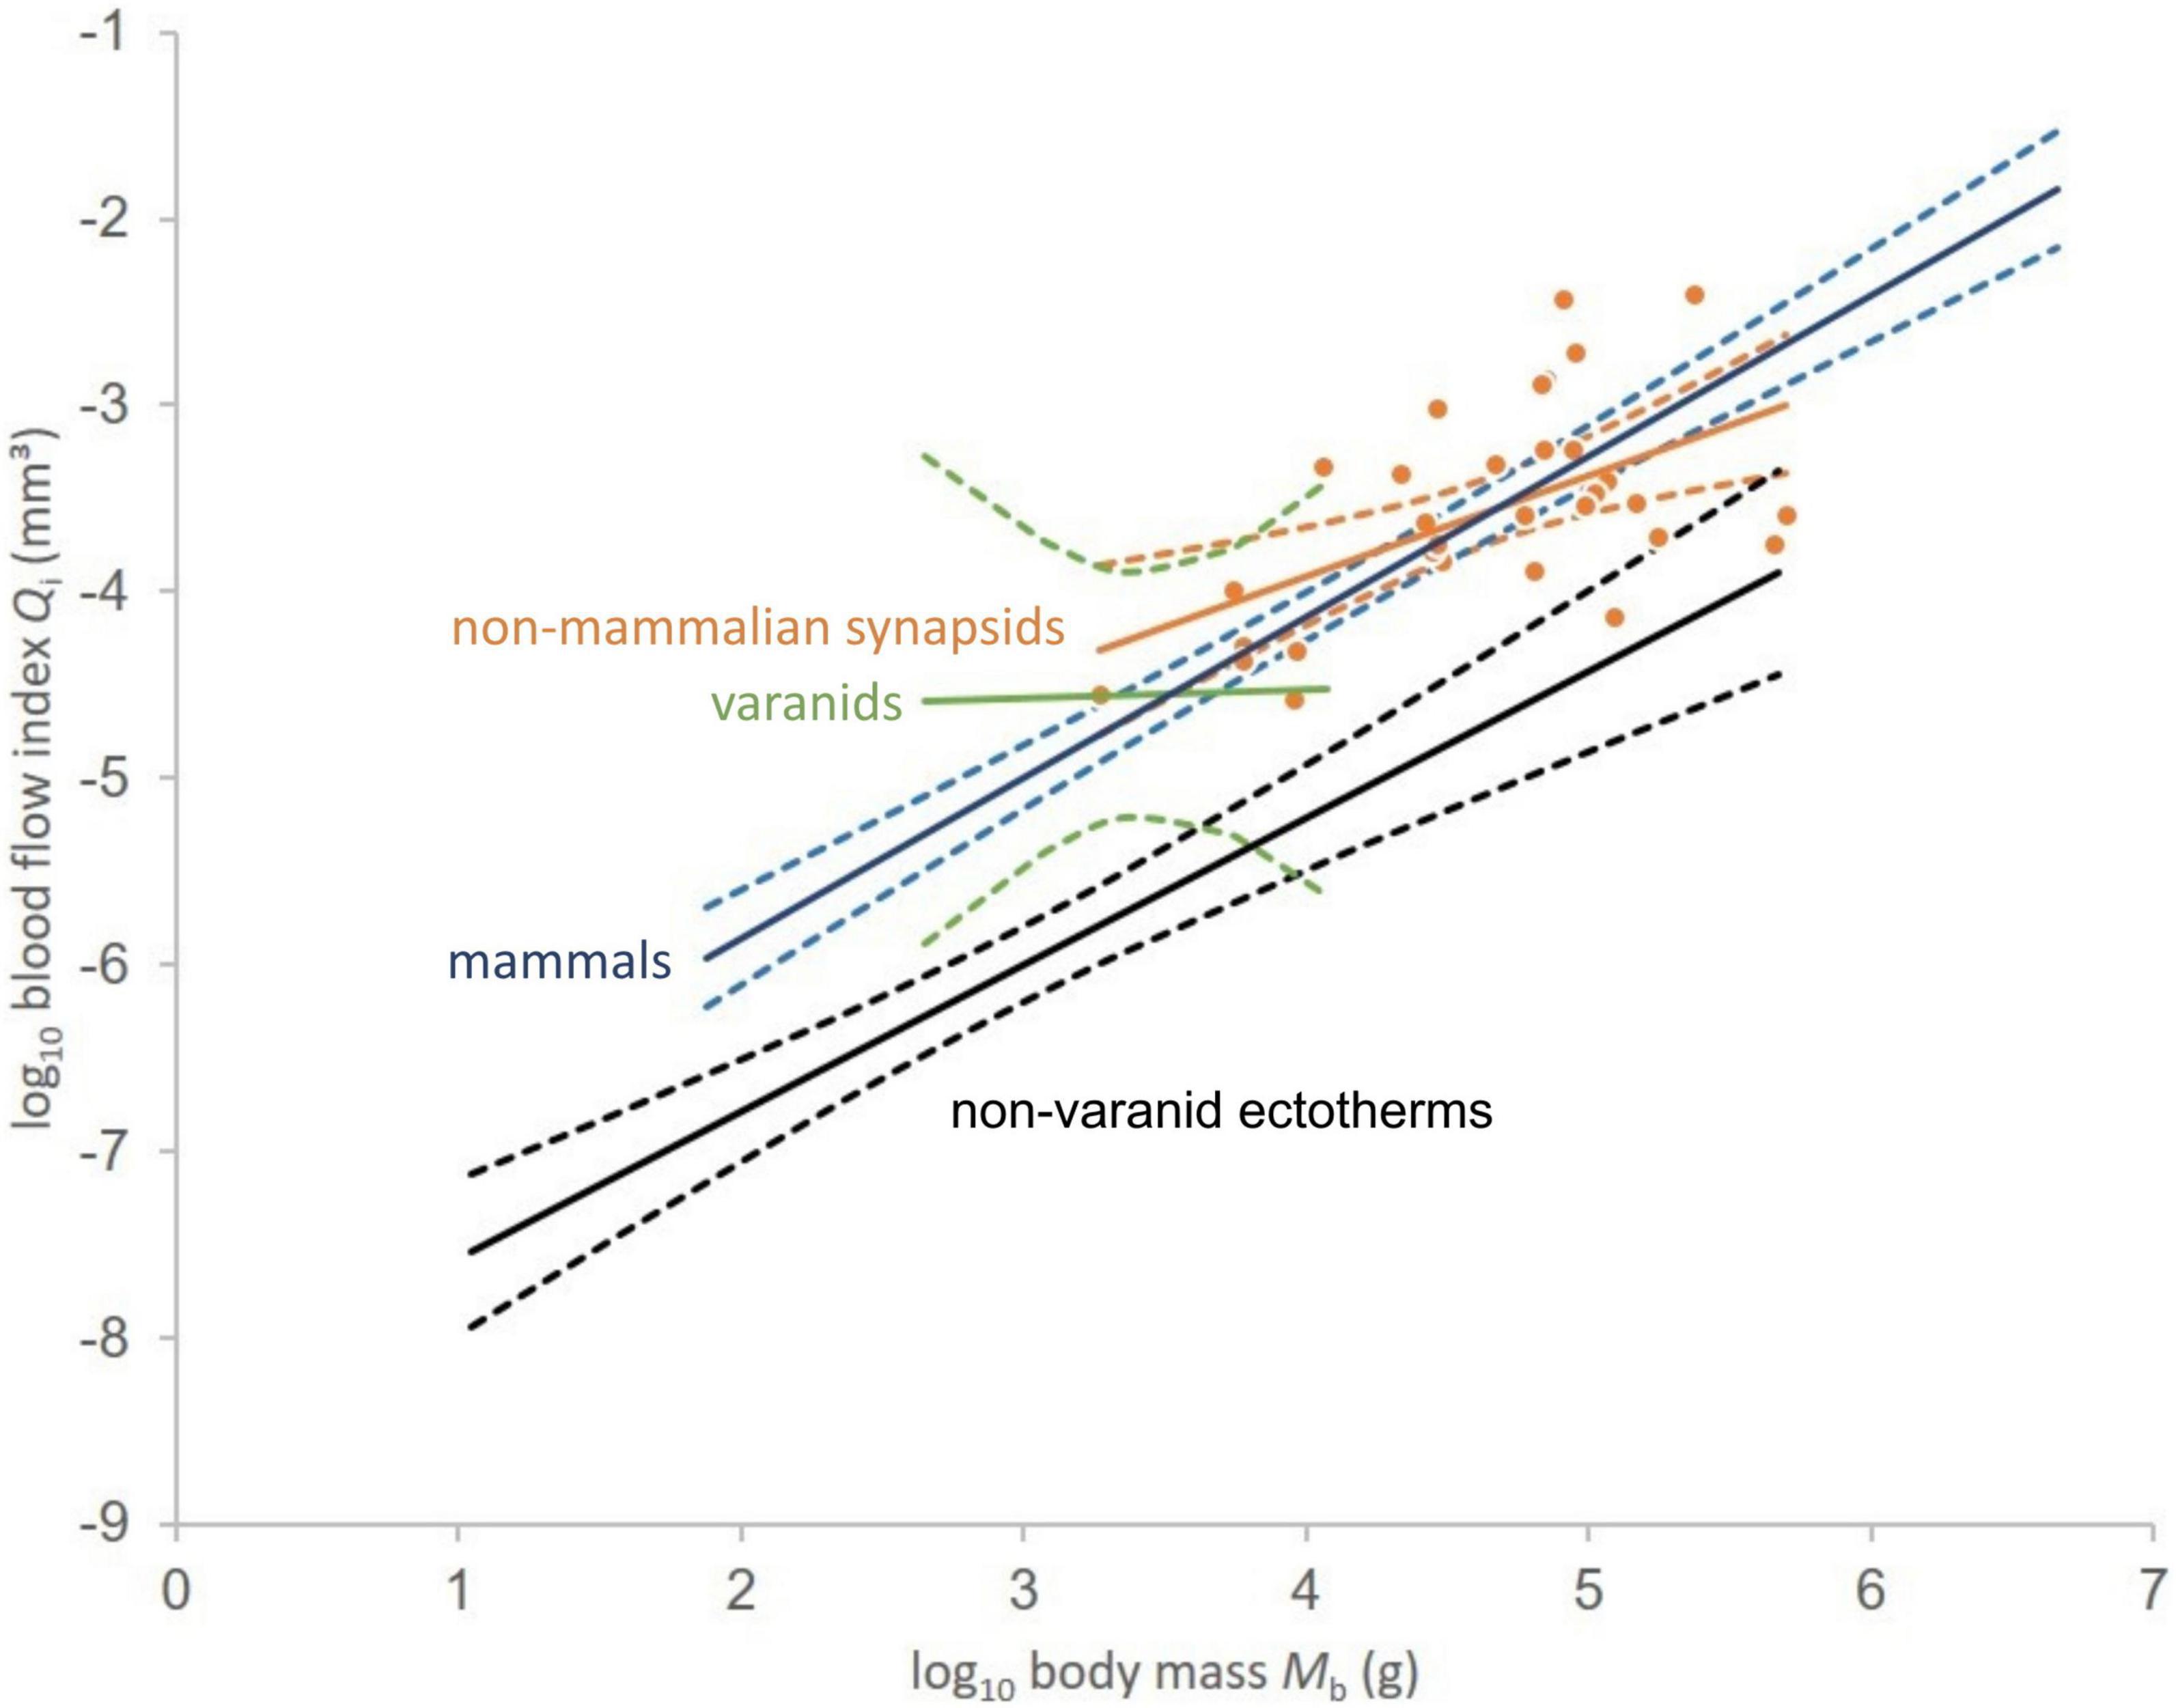
Figure 3. Relationship between logarithms of blood flow index and body mass for non-mammalian synapsids (orange dots). Linear least squares regressions in solid lines given for non-mammalian synapsids (Qi = 0.5416Mb – 6.0844), mammals (Qi = 0.8619Mb – 7.5806), varanids (Qi = 0.0421Mb – 4.6942), and non-varanid ectotherms (Qi = 0.7865Mb – 8.3534). Respective 95% confidence intervals of the regression mean indicated by dashed lines. Data except non-mammalian synapsids from Seymour et al. (2012).
Construction of Phylogenetic Tree
First, a phylogenetic tree was constructed from the recent taxa of Seymour et al. (2012) and Allan et al. (2014) using the Timetree website1 (Hedges et al., 2006, 2015; Kumar and Hedges, 2011) and saved in Nexus format (Newick notation). The tree file was loaded into Mesquite software (version 3.06; Maddison and Maddison, 2019) equipped with ‘Stratigraphic tools for Mesquite’ (version 1.0c, Josse et al., 2006) and manually modified to add extinct taxa. As trees had to be fully resolved for analysis with ‘nlme’ (Pinheiro et al., 2014) in R (R Core Team, 2021), polytomies were resolved to multiple dichotomies with a branch length of 0.0000001 (equaling 0.1 years). Phylogenetic relationships and divergence dates of extinct taxa were taken from Benson et al. (2014) for dinosaurs, Benson (2012) for basal synapsids, from Kemp (2012) for the interrelationships of major therapsid groups, from Fröbisch (2007) for dicynodonts, and from Botha-Brink et al. (2012) for cynodonts. Following Field et al. (2014), turtles were treated as the sister group to Archosauromorpha with the divergence dated according to the appearance of the oldest stem turtle Eunotosaurus (Bever et al., 2015, but for a contrary opinion see Lichtig and Lucas, 2021).
Phylogenetic Generalized Least Squares, Phylogenetic Analysis of Covariance and Analysis of Covariance
Statistical comparative methods generally assume independence, homoscedasticity, and normality of the data points analyzed to produce reliable results that allow reliable deductions. This is required because statistical methods test a priori for null-hypotheses that assume no relationship between variables and our regressions require normality. In data sets derived from organisms, however, said requirements may be violated due to the phylogenetic relationships between taxa (Felsenstein, 1985). Therefore, we performed phylogenetic generalized least squares regression (PGLS) (Grafen, 1989), following the methodology of Mitchell et al. (2017), to detect potential phylogenetic signal (Blomberg and Garland, 2002) in the relationships of Qi and body mass. Additionally, PGLS confirmed significant relationships between Qi and body mass for previous data under phylogenetic compensation (Seymour et al., 2012; Allan et al., 2014).
Qi and body mass data from Seymour et al. (2012) as well as phylogenetic trees (Newick format) were fed into R and tested for the best fit of evolutionary model using the ‘fitcontinuous’ function of the R package ‘geiger’ (Harmon et al., 2008). A choice of Brownian Motion (Felsenstein, 1973), Ornstein-Uhlenbeck (Butler and King, 2004), Early Burst (Harmon et al., 2010), and White Noise models was available. ΔAICc (Burnham et al., 2011) gave the best-fitting model the lowest value, which was then selected.
When ‘fitcontinuous’ recommended the White Noise model, compensation for phylogenetic signal was not necessary, but in all other cases, the function ‘pgls’ of the package ‘caper’ (Orme et al., 2013) or the function ‘gls’ of the package ‘nlme’ was used with phylogenetic weights and the phylogenetic correlation structure “corMartins” of the package ‘ape’ (Paradis et al., 2004). To ensure normality in the residuals after phylogenetic adjustment, we used the Lillefors test (‘lille.test’ function) of the R package ‘nortest’ (Gross and Ligges, 2015). When the test showed p-values below 0.05, quantile-quantile plots were consulted to check for the normality of distribution and fitted values plotted against residuals to control for heteroscedasticity (see Supplementary Figures 1, 2). Outliers were then removed to produce a normal distribution of residuals and homoscedasticity in the dataset.
To confirm the distinctness of varanids from other ectothermic amniotes for Qi vs. body mass regression under phylogenetic compensation, we performed phylogenetic ANCOVA (analysis of covariance) on the subset of recent species from Seymour et al. (2012), applying the methodology of Smaers and Rohlf (2016). We used the function ‘gls.ancova’ of the ‘evomap’ package (Smaers and Mongle, 2014) of R (R Core Team, 2021), setting Qi as the dependent variable, higher taxon as indicator variable, and body mass as covariate (Table 2).
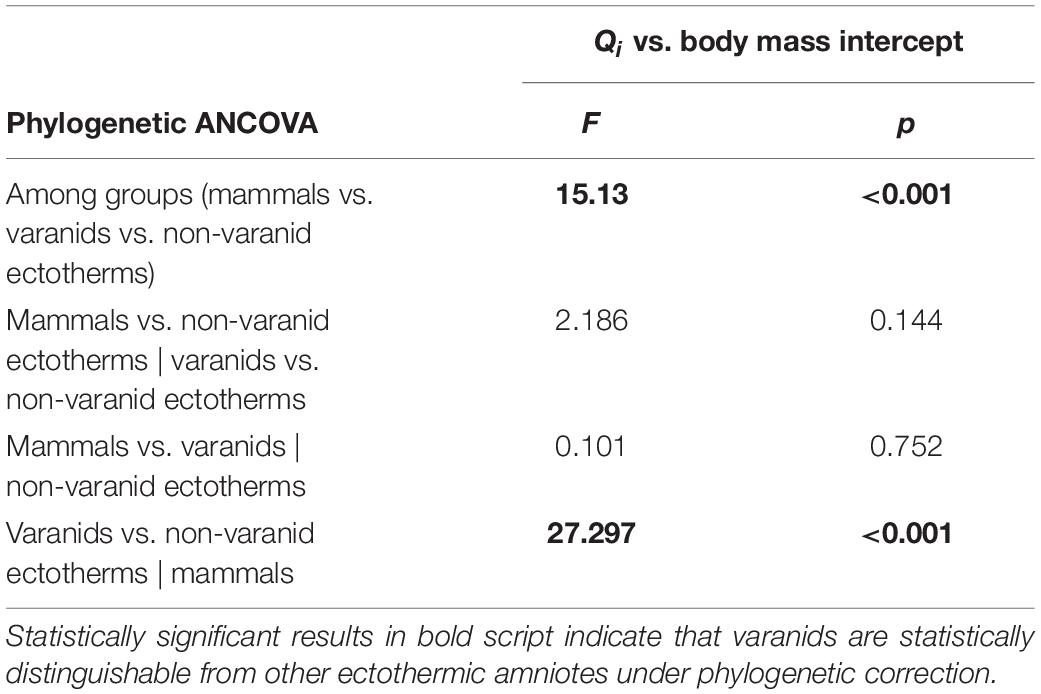
Table 2. Differences in intercept of regression models with phylogenetic correction for recent dataset of Seymour et al. (2012) plus statistical significance.
To compare distinctness of regression slope and intercept for the Qi vs. body mass plots of our non-mammalian synapsids to previously published recent datasets (Seymour et al., 2012; Allan et al., 2014), we performed pairwise ANCOVA (analysis of covariance) with the ‘aov’ function of the ‘stats’ package of R, designating Qi as the dependent variable, higher taxon as factor, and body mass as the covariate. We applied a Bonferroni correction to counteract the problem of multiple comparisons, lowering the desired significance level to α = 0.05/9 = 0.0056. If F and p-values indicated no significant slope difference, we used the function ‘anova’ of ‘nlme’ package to test for significant differences in elevation (Table 3).
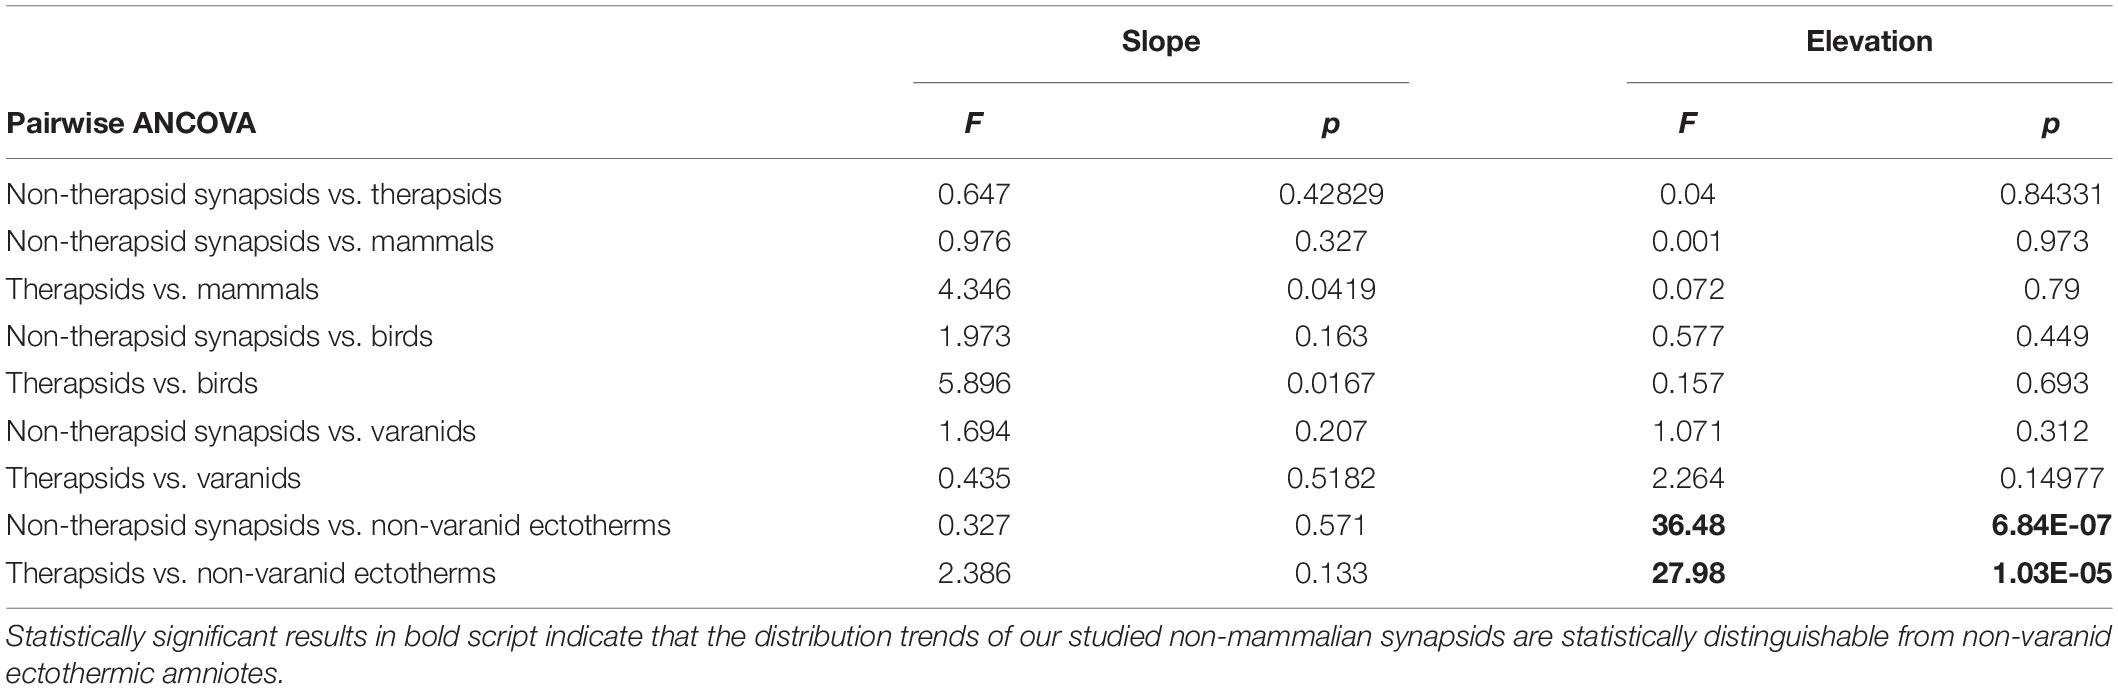
Table 3. Differences in slope and intercept in regression models of Qi vs. body mass between fossil synapsid taxa and recent amniote groups and their statistical significance.
Phylogenetic Eigenvector Maps Analysis
We calculated phylogenetic eigenvector maps from the phylogeny using the R-package “MPSEM” (Guénard et al., 2013). For this we used the reduced dataset of 19 recent taxa with MMR values (see section “Construction of Phylogenetic Tree”) in combination with our extinct synapsid taxa. AICs corrected for small sample sizes (Hurvich and Tsai, 1989) was used to decide between the predictive models, with and without the co-predictor Qi. Cross-validation was provided by leave-one-out cross-validation. Selecting the co-predictor Qi (AICc 0.9407704, R2 35.52039; without co-predictor AICc 0.87, R2 42.272), we used the predictive model to estimate MMR for the extinct synapsid taxa and 95% confidence interval boundaries. To test for the influence of Chelonia mydas (with exceptionally high MMR for a turtle) on the reconstructed values, we reran the analysis without this taxon.
Phylogenetic Eigenvector Maps (PEM) belongs to a family of phylogenetic comparative methods aimed at inferring missing values in samples where values are known for the great majority of species (Molina-Venegas et al., 2018). Because of the large number of predicted values (31) relative to the smaller number of known values from which the prediction model was calculated (19), we performed a series of PEM analyses using subsets of extinct taxa and the full extant data set. Values from all subset analyses were identical to the predictions for the entire dataset.
Calculation of Mass-Specific Maximum Metabolic Rate
Mass-independent MMR values are given in mL O2 h–1 g–0.67. Although maximum aerobic metabolism is empirically shown to correlate with body mass to the power of 0.82 in ectothermic amniotes (Bennett and Dawson, 1976) or 0.86 in mammals (White and Seymour, 2005), different from 0.76 for BMR (Withers, 1992), many metabolic processes in animals are dependent on surface area of body membranes, which correlate with body mass to the power of 0.67 (Hemmingsen, 1960). For this reason and to provide better comparability with previous studies of metabolic rates in synapsids, we chose the lower exponent.
Results
Qi and Body Mass Values
The sample of non-mammalian synapsids spans two orders of body size magnitude, with the lightest animal estimated at 1.86 kg (Galesaurus) and the heaviest at 503 kg (Dinodontosaurus). Qi-values of non-mammalian synapsids reach from a minimum 2.653E-5 mm3 for the second-smallest specimen of Clepsydrops to 3.918E-3 mm3 for the longest non-therapsid synapsid femur of Dimetrodon grandis. These two specimens illustrate that Qi correlates strongly with body mass in our synapsid dataset as previous studies have found in other groups (Seymour et al., 2012; Allan et al., 2014).
Qi vs. Body Mass Plot
In plotting the index of blood flow against body mass (Figure 3), non-therapsid synapsids and non-mammalian therapsids are statistically indistinguishable from recent endotherms (mammals and birds), but also from varanids. Varanids have been shown (Seymour et al., 2012) to be statistically different from mammals in slope, but not in intercept. Like recent endotherms and varanids, stem mammals are significantly different from recent non-varanid ectotherms. While varanids differ in slope from other non-avian sauropsids (Seymour et al., 2012), endotherms and non-mammalian synapsids differ significantly in intercept from non-varanid ectotherms. Like certain bird and mammal species, two therapsids and one non-therapsid synapsid overlap with a non-varanid sauropsids in the range of values. These do not impact the statistical significance of the results.
Comparing regression functions with those for non-varanid ectotherms, average Qi-values are 13.6-fold higher for therapsids (Figure 4) and 12.9 times higher for non-therapsid synapsids (Figure 5) along the common body mass range (5.5 to 456.4 kg), with an overall stem-mammal value of 13.1 times the Qi of sauropsids in stem mammals. These blood flow values compare closely with those of mammals (13.4 times average non-varanid ectotherm Qi over the body mass range).
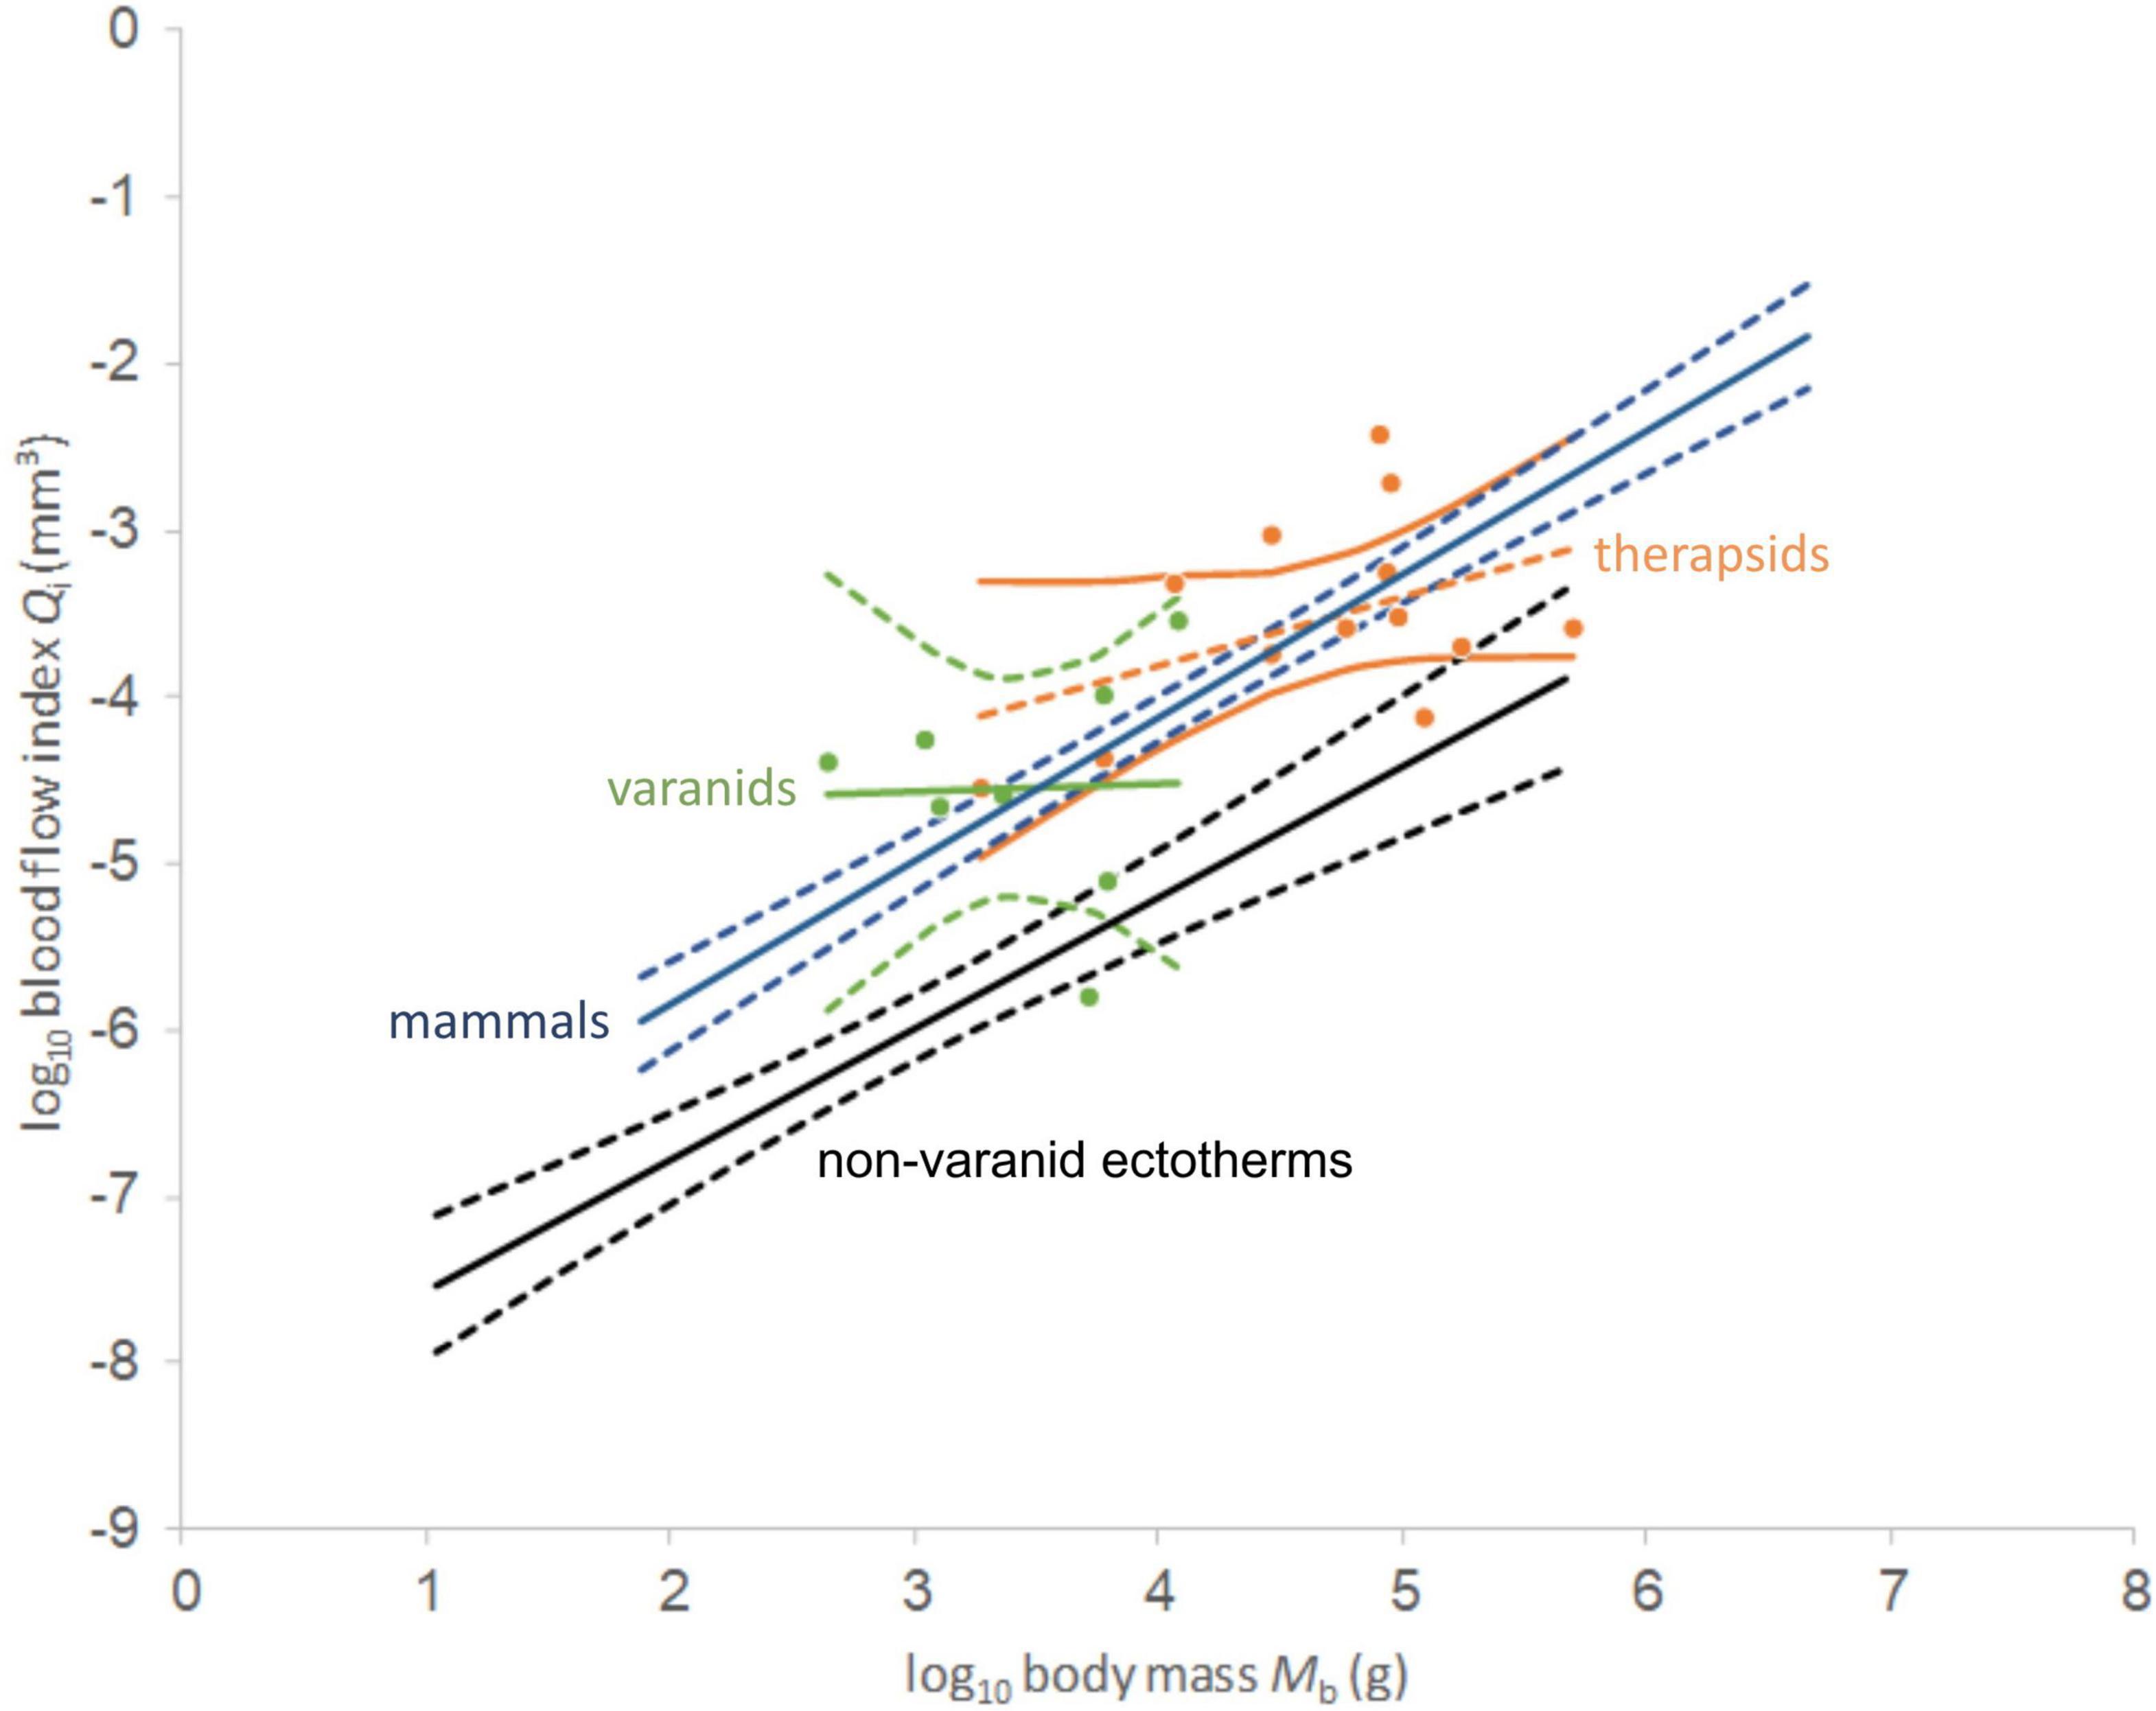
Figure 4. Double-logarithmic plot and linear regression lines of blood flow index against body mass for non-mammalian therapsids (orange dots) and varanids (green dots). 95% confidence intervals of the regression mean are supplied for the plotted taxa, non-varanid ectotherms (black) and mammals (blue). Note wide range among both taxa and similar slope. Data except non-mammalian synapsids from Seymour et al. (2012).
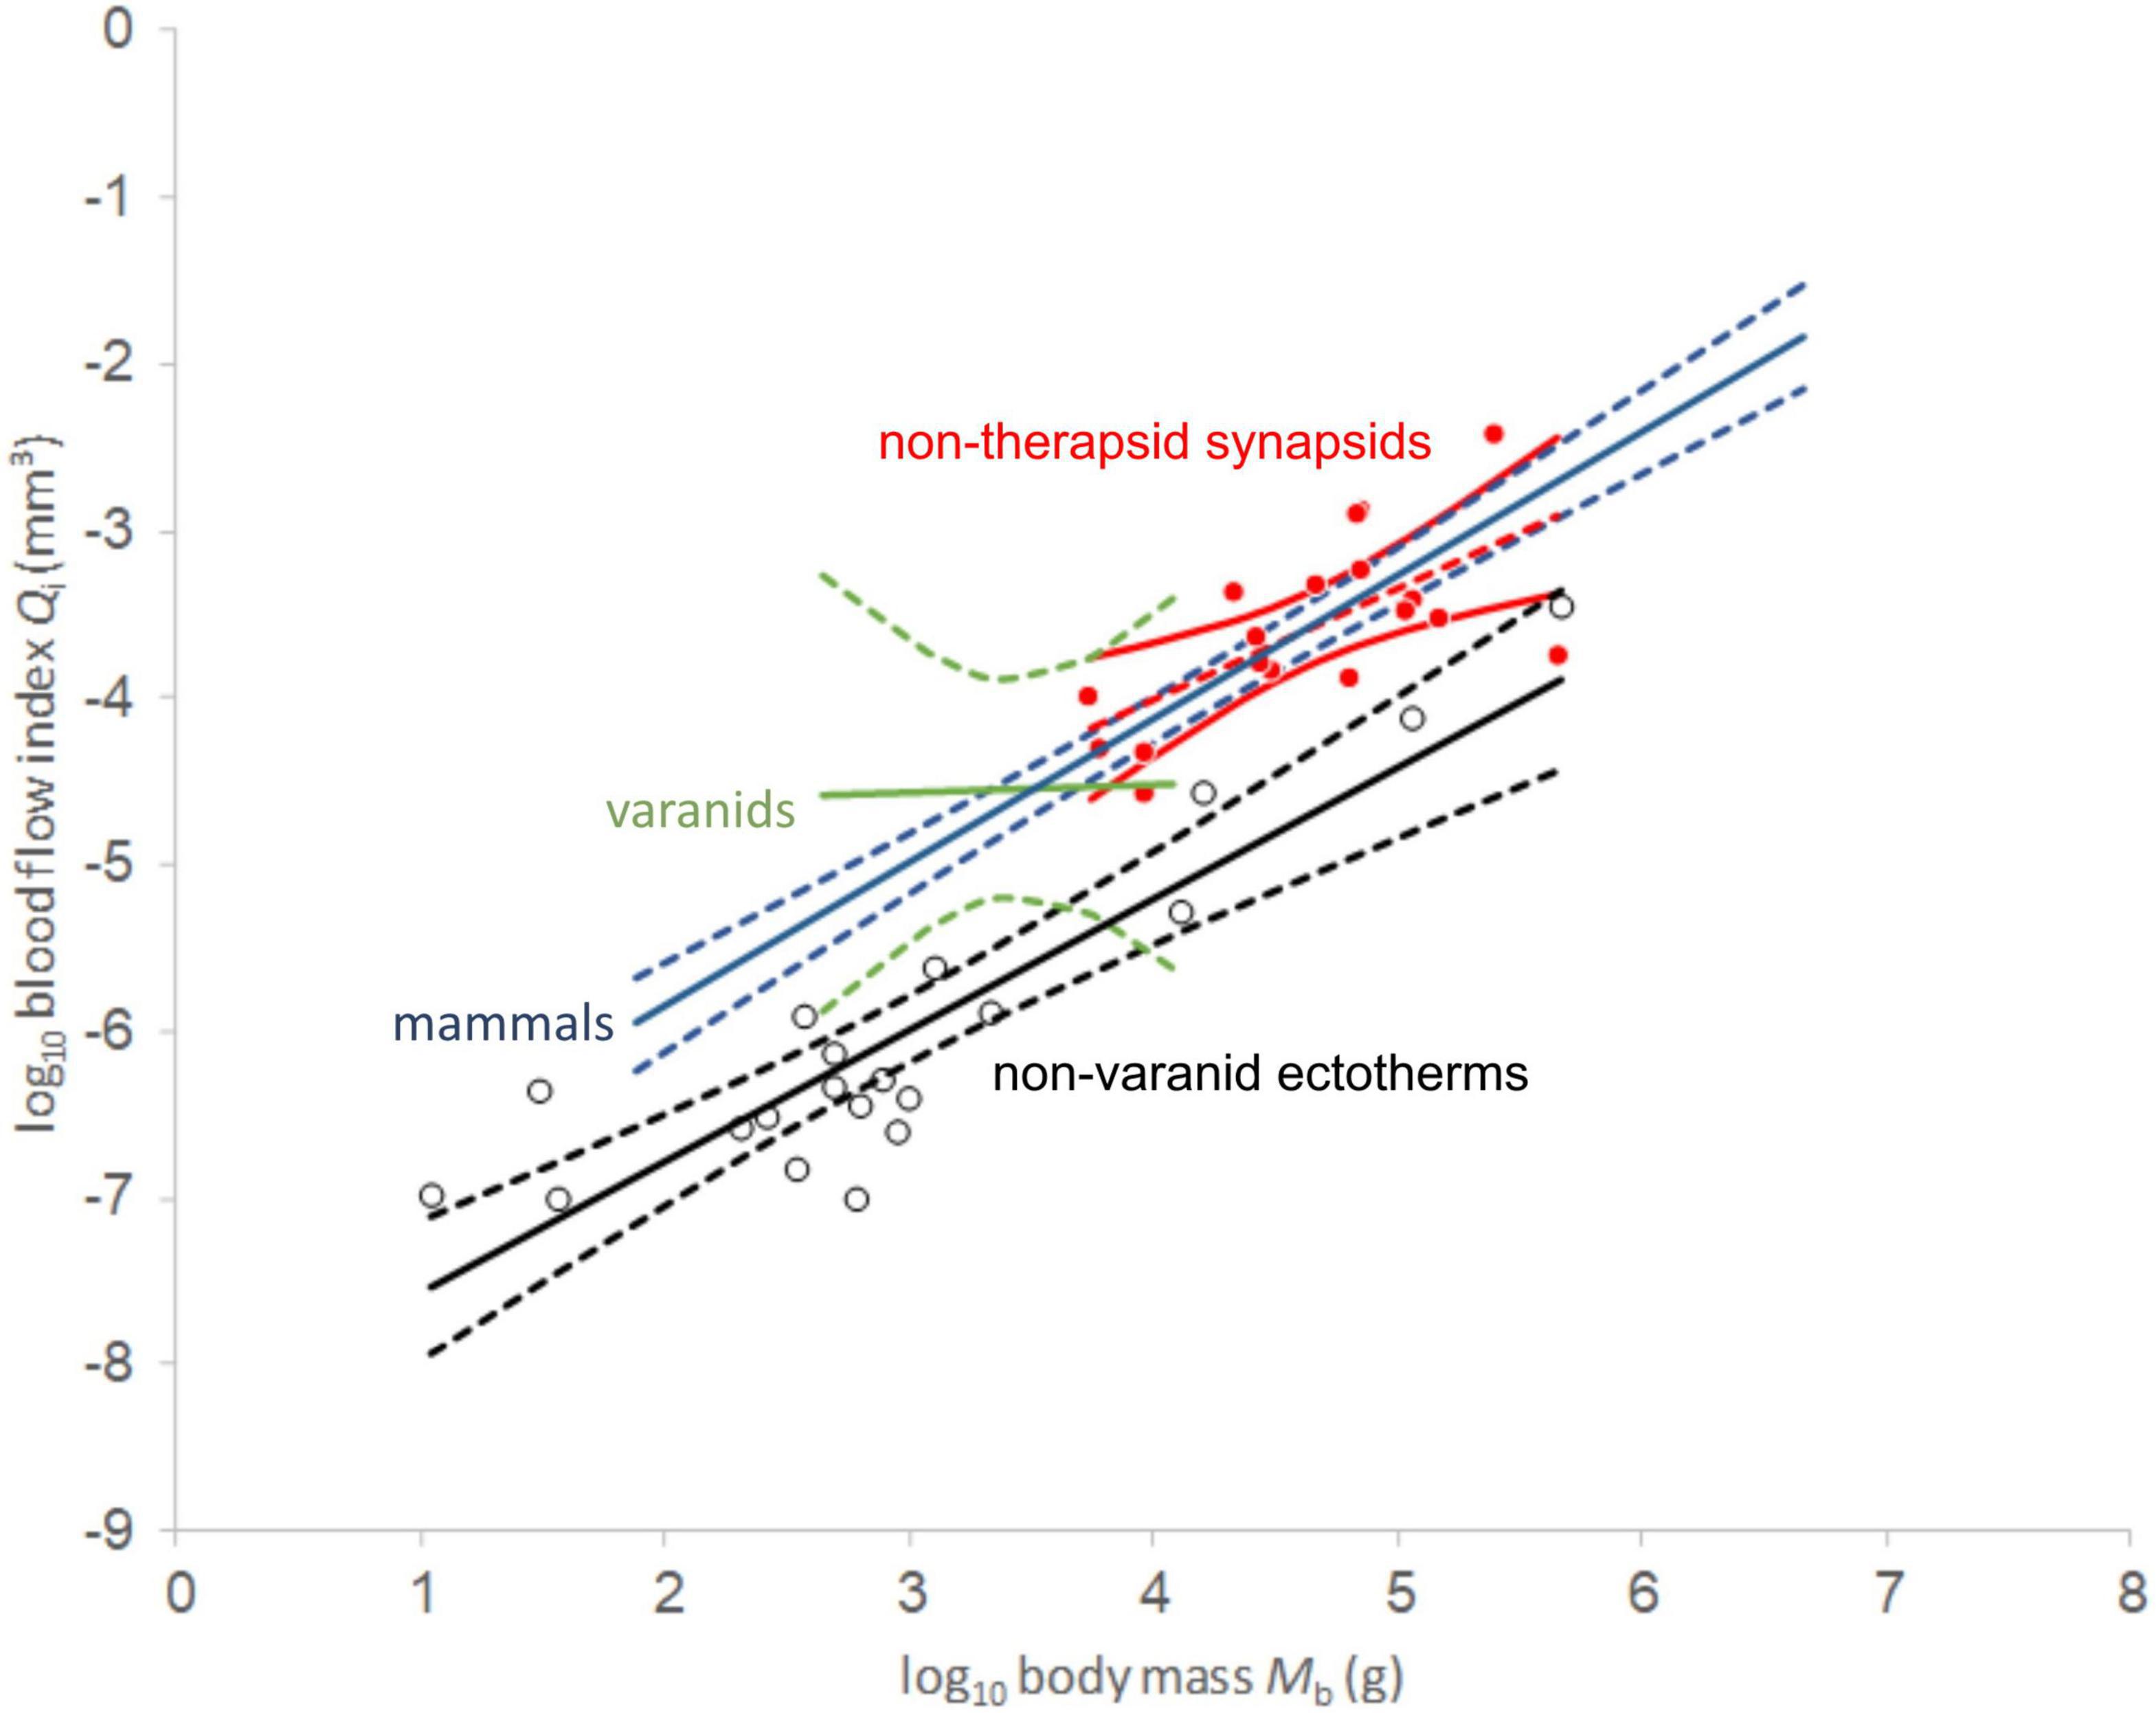
Figure 5. Log-log plot of blood flow index against body mass. Red values represent non-therapsid synapsids and red dashed line represents linear least squares regression. 95% confidence of the regression mean intervals in solid red. Empty circles represent non-varanid ectotherm values. Note clustering of non-avian sauropsid values in a tight range between 100 and 1000 g body mass which causes heteroscedasticity in our PGLS analysis. Data except non-mammalian synapsids from Seymour et al. (2012).
Phylogenetic Generalized Least Squares Analysis
The search for the best-fitting evolutionary model found phylogenetic signal in all groups except varanids and non-mammalian synapsids, which were best described with the White Noise model. Among the groups that showed a phylogenetic signal, all were best described by the Ornstein-Uhlenbeck model of evolution and showed homoscedasticity and normality in the distribution of the residuals. The PGLS analysis of the entire dataset resulted in an Ornstein–Uhlenbeck model of evolution being selected, showing phylogenetic signal in the data. Yet, after the analysis was performed and gave a highly significant result (p < 0.001), a Lillefors test for normality returned a statistically significant result (indicating deviation from the normality in the residuals), and our Q–Q plot revealed numerous outliers among the dinosaur dataset. After the dinosaur data set (Seymour et al., 2012) and the further outlier Emeus crassus were removed, the Lillefors test passed in the phylogenetically corrected residuals.
The PGLS analysis returned a model with a much steeper slope than that of the individual groups of 0.9675. The Q–Q plot revealed a degree of heteroscedasticity caused by a low number of data points on the extreme ends of the distribution (see Supplementary Figure 1). The distribution is likely caused by the low number of sauropsids of high body mass (above 10 kg) and low body mass (below 100 g) in the data set.
Analysis of Covariance
Phylogenetic ANCOVA analysis returned a significant result for the distinction between varanids and non-varanid ectothermic amniotes in Qi vs. body mass regressions (Table 1). Pairwise ANCOVA returned significant results for the distinction of varanids from other ectothermic amniotes, but we found no significant difference between varanids and endothermic groups.
Distribution of Recent and Reconstructed Maximum Metabolic Rate Values
Mass-specific MMR ranges over two orders of magnitude (4 to 637.7 mL O2 h–1 g–0.67 in the common blue-tongued skink (Tiliqua scincoides) and the domestic goat (Capra hircus), respectively) (see Figure 6). Two Tiliqua species have the lowest values. Varanid values are higher, but the green sea turtle Chelonia mydas exceeds them in MMR. Tachyglossus, the echidna, has a lower MMR than Varanus gouldii and C. mydas. Therian mammals have the highest values, at least an order of magnitude above Tiliqua. The MMR values predicted by our analysis for non-mammalian synapsids have a much lower variation (17.5 to 37.3 mL O2 h–1 g–0.67 in Lystrosaurus sp. and an undetermined dicynodont, respectively) than the complete dataset. Predicted values overlap with varanids, Tachyglossus, and C. mydas. Differences between the range of values of non-mammalian therapsids and non-therapsid synapsids are not visible.
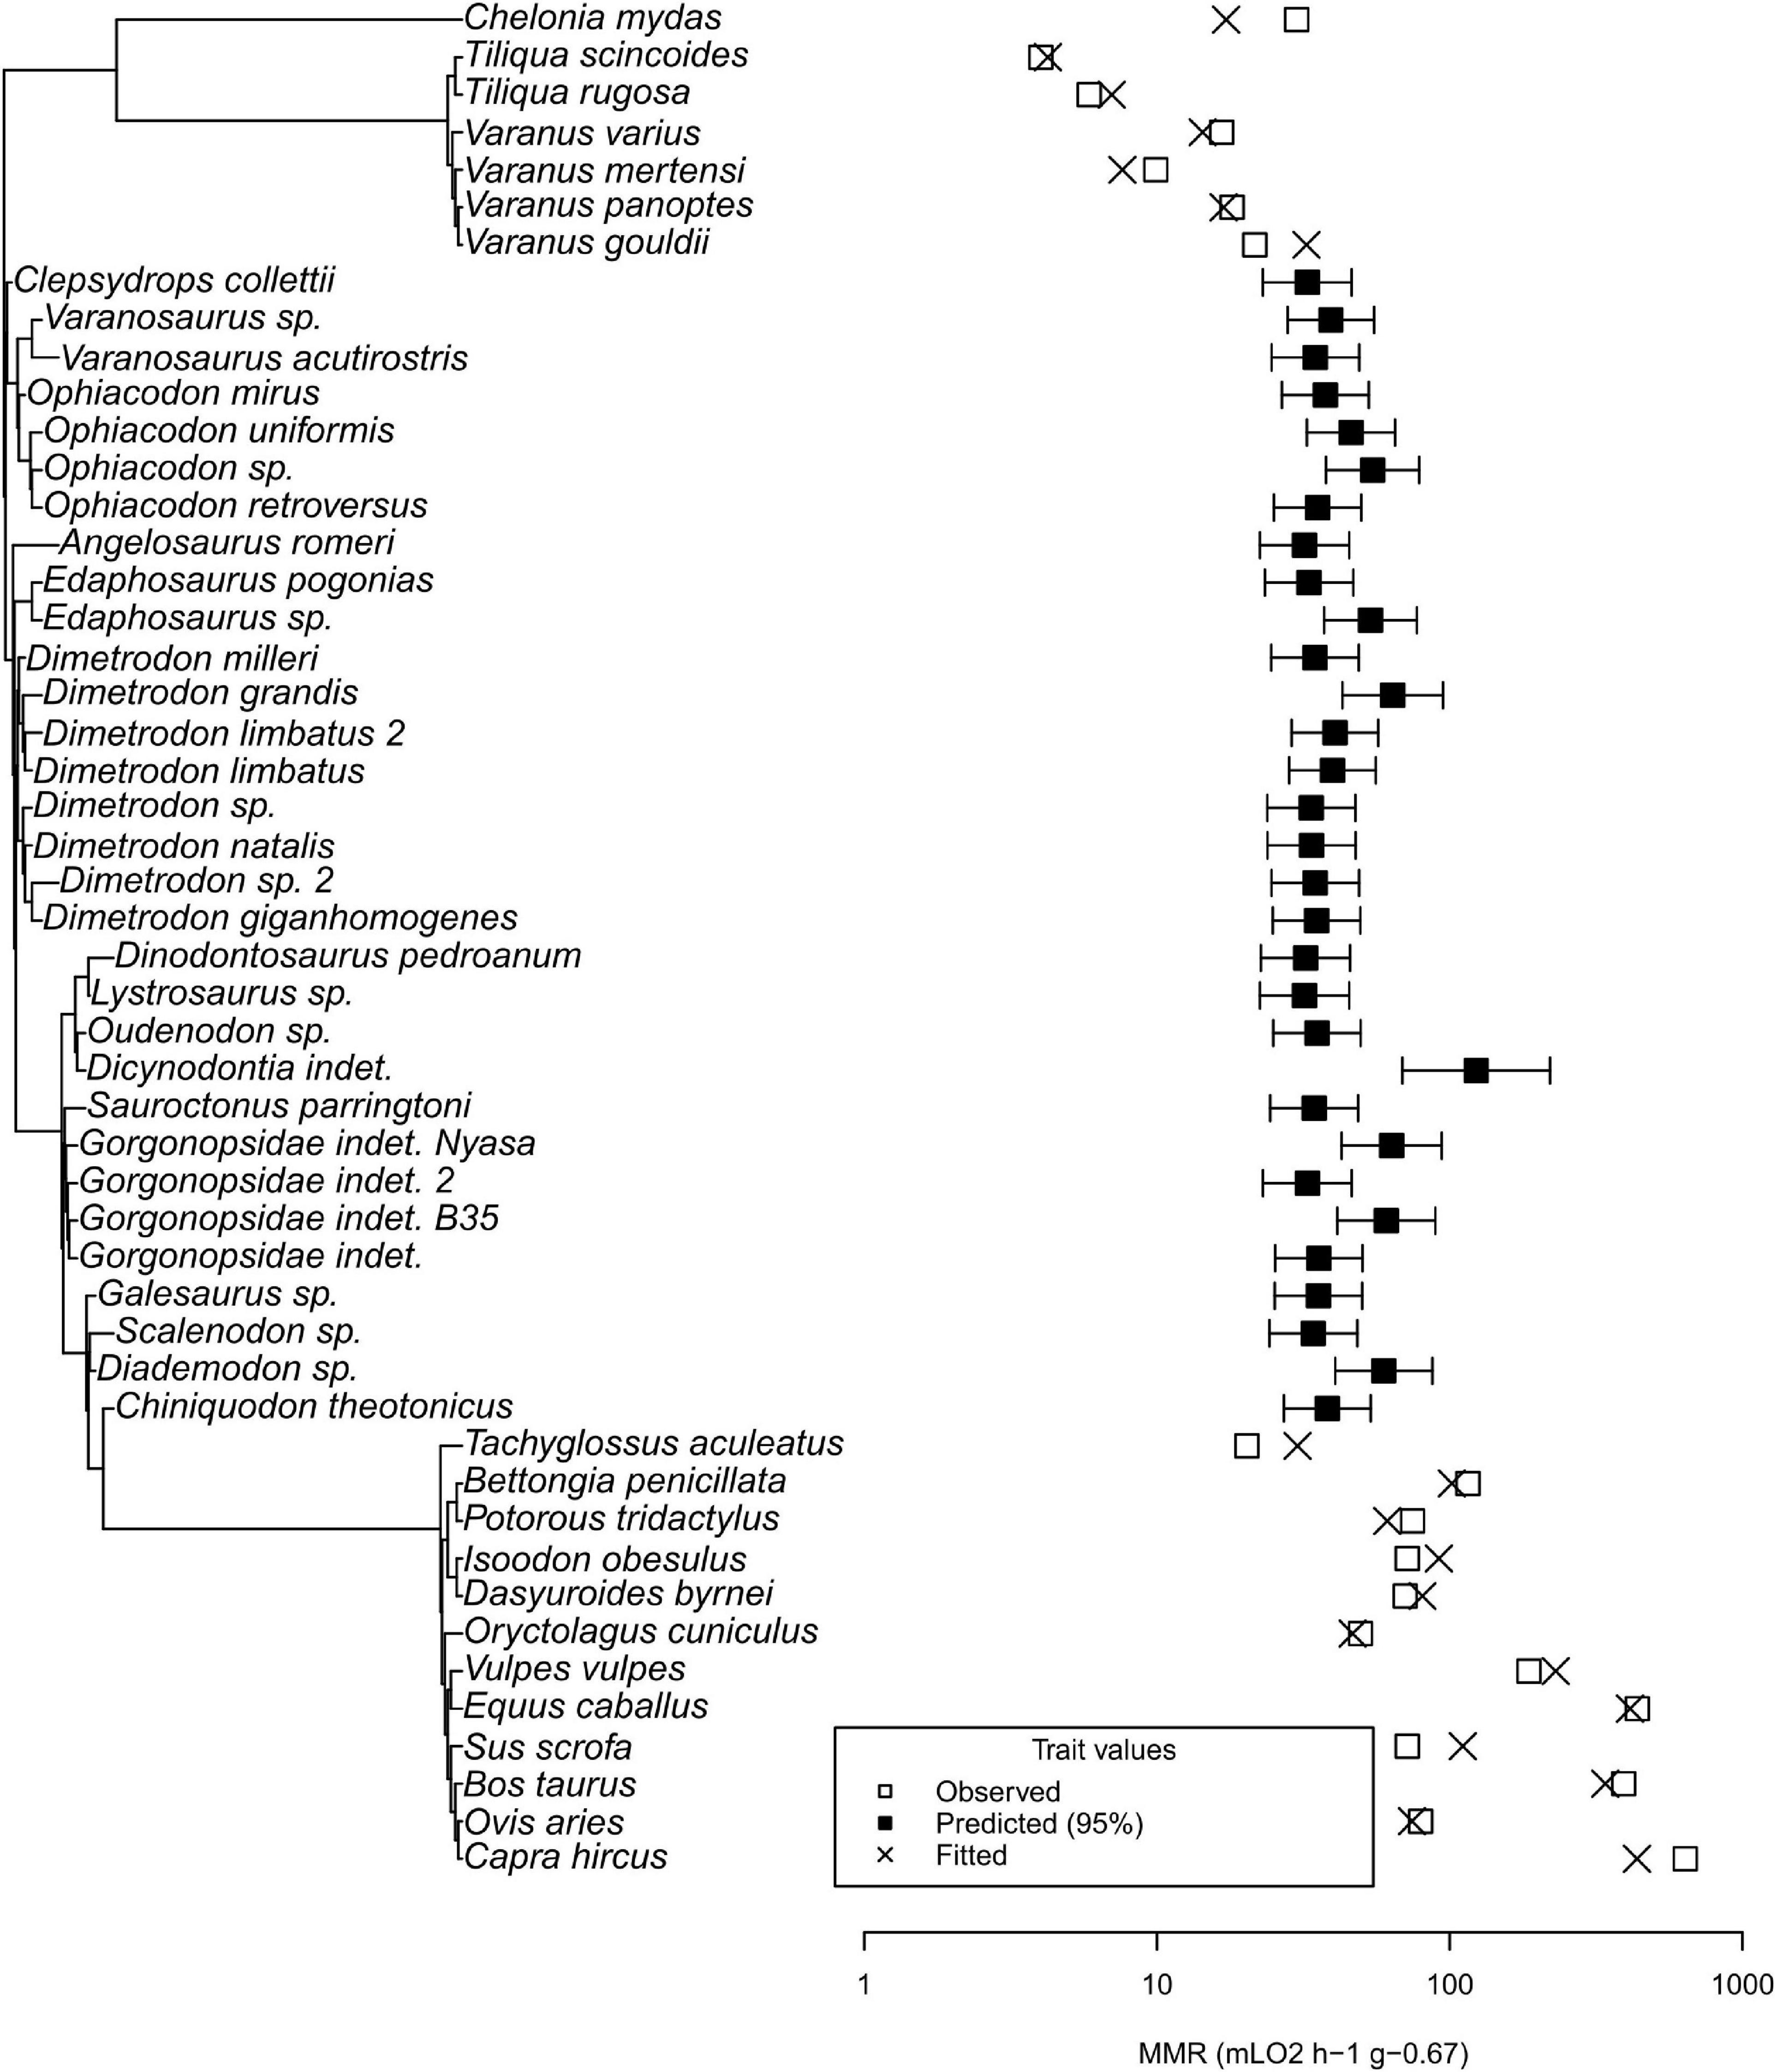
Figure 6. Phylogenetic tree and plot of maximum metabolic rates for recent taxa with MMR data and fossil taxa. Note that the predicted values for fossil non-mammalian synapsids are above non-varanid ectotherms and overlap with recent mammals, comparable to varanids and the echidna Tachyglossus.
Excluding C. mydas from the dataset resulted in lower reconstructed values in extinct synapsids. The lowest value among non-mammalian synapsids, 18, decreases to 14.2 mL O2 h–1 g–0.67 in Lystrosaurus, lower than Varanus panoptes and Varanus varius, but higher than Varanus mertensi.
Discussion
Reliability of Qi-Values
Evolutionary model tests detected no phylogenetic signal in either the non-therapsid synapsid or non-mammalian therapsid subsets. This pattern coincides with the wide range of Qi values in both paraphyletic groups on the Qi-Mb plot. The combination could represent a diverse pattern of mass-specific Qi in the samples due to either widely differing blood flow in taxa, differing loading regimes resulting from fundamentally differing locomotion styles such as in birds (Allan et al., 2014), or the pattern could be an artifact of sampling. As blood flow in extinct taxa cannot be directly measured, the first hypothesis cannot be rejected but would require the ad hoc assumption of stem-mammal exceptionality. Therefore, we will pursue the other alternatives further. Differing femur loading regimes in major taxa influencing Qi have been postulated for birds, but usually result in overall homogeneous values for closely related groups with similar morphology [e.g., gruiform birds in the dataset of Allan et al. (2014)]. In our non-mammalian synapsid data, however, closely related taxa can show widely differing Qi values such as different specimens of Dimetrodon that can vary by an order of magnitude. Such wide differences in individuals from closely related populations could result from biological variability but also from sampling or measurement errors.
Juvenile specimens could present outliers. The fossil dinosaurs analyzed by Seymour et al. (2012), for example, include two outliers in their distribution whose values we suspect resulted from ontogenetic effects. The Ornithomimidae indet. and Thescelosauridae indet. femora are particularly short when compared to closely related species and could thus belong to juveniles. This might explain their high Qi values and thus large nutrient foramina due to the increased need for blood flow in a growing bone. By selecting only the largest fossil femora for a given taxon and excluding many incompletely ossified bones, we minimized this possible source of sampling error. Yet, ontogenetic influence cannot be completely eliminated except in specimens with ossification states indicating late ontogeny such as the edaphosaurs, which have predicted MMR values higher than Tachyglossus.
The preservation of most sampled bones from the Carboniferous to the Triassic presents an alternative possible source of measurement error. Fractures of bones can obliterate nutrient canals. Additionally, long bones tend to break at the point of least resistance. In femora this occurs in particular at the mid-diaphysis, the most common location of nutrient canals (compare Figure 1). For this reason, nutrient canals could not be detected in numerous fossil synapsid femora that we screened in preparation for our study. Several femora preserved multiple nutrient canals of differing size (compare Figure 2). If the largest had been destroyed in a specimen, but at least one smaller canal were present and measured, the resulting value would be much smaller than would be measured on the intact femur. Thus, we cannot exclude the possibility that the Qi values recorded for fossil taxa are based on a fraction of the original nutrient canal cross-sectional area. Therefore, we suspect that the non-mammalian synapsid average Qi values observed represent conservative estimates due to the caveats of data collection on fossils.
Qi elevated over non-varanid ectothermic amniotes has been postulated for Morganucodon (Newham et al., 2020), agreeing with our findings in elevation, but since our lightest specimens have body masses at least an order of magnitude higher than the mammaliaform, comparisons with our data are difficult.
Regressions and Reconstructed Maximum Metabolic Rate
Traditional least squares regressions as well as phylogenetic and pairwise ANCOVA alone indicate that non-mammalian synapsids potentially exhibited maximum aerobic metabolic rates elevated over the level of recent ectotherms other than varanids. This hypothesis is substantiated by the reconstructed MMR values for non-mammalian synapsids using phylogenetic eigenvector maps. However, the subset of taxa with MMR measurements is limited to low sampling size, which might skew the results. The relatively high aerobic capacity of the only turtle in the dataset for which MMR values are available (Chelonia mydas) and the high abundance of varanids in the dataset used for PEM analysis skews the ancestral state reconstruction toward higher values.
The MMR value of C. mydas is higher than for other sauropsids, likely an adaptation for long-endurance swimming (Penick et al., 1996). MMR values with and without Chelonia differ, but excluding the turtle from the analysis only results in more species of varanids overlapping with non-mammalian synapsids (see Supplementary Material). The inclusion of other turtles with a lower MMR might decrease the ancestral MMR value for sauropsids but would likely not impact our main result. Additionally, endothermic archosaurs are equally excluded from the dataset, the inclusion of which might raise the ancestral value for amniotes. Overall, more sampling is needed in order to obtain more robust ancestral value reconstructions for early amniotes.
Influence of Blood Pressure
The index of blood flow serves as an instrument to estimate blood flow in the absence of data on blood pressure. In fact, differences of an order of magnitude between the Qi of endotherms and non-varanid, non-avian sauropsids are translated into nearly three times higher blood pressure and a higher oxygen carrying capacity of mammal blood to produce an about fiftyfold increase in oxygenation rate of the mammalian femora over those of sauropsids other than birds and varanids (Seymour et al., 2012). No recent ectothermic amniote maintains a mean arterial blood pressure (MAP) nearing 15 kPa. Ectothermic tetrapods have incompletely separated pulmonary and systemic circulations with low blood pressures in both. In Varanus niloticus, the derived morphology of the varanid heart facilitates the highest MAP of ectothermic tetrapods at 11.6 kPa, in the lower range typical of mammals (Millard and Johansen, 1974). This indicates femoral oxygenation rates for varanids intermediate between mammals and other non-avian sauropsids, because the oxygen carrying capacity of varanid blood is no higher than that of other non-avian sauropsids (Bennett, 1973). Hence, blood pressure values are required to determine whether the blood flow rates of non-mammalian synapsids can be compared with that of recent varanids.
Seymour (2016) applied physiological principles in recent animals to determine blood pressure in extinct dinosaurs and Dimetrodon. As a continuous blood column must transfer pressure from the location of the heart to the highest point of the animal and since the density of blood is near constant (about 1000 kg/m3) across taxa, we can calculate the pressure at height of the heart necessary to maintain the blood column to the highest point of the body (Pg). In sail-backed non-therapsid synapsids such as Dimetrodon grandis and Edaphosaurus pogonias, distances between the location of the heart at the ventral side of the body cavity to the highest neural spines measure 1.5 m and 1 m, respectively (Romer and Price, 1940). In addition to this pressure, perfusion pressure is required at the highest point of the body to calculate the actual mean arterial pressure (MAP), which is unknown. Thus, mean arterial blood pressures were considerably higher than the MAP of non-avian, non-varanid sauropsids (about 5 kPa) in the two synapsids because Pg alone for Edaphosaurus (9.7 kPa) lies in the varanid range of MAP or even well within the mammalian range of MAP for Dimetrodon (15.3 kPa). As non-therapsid synapsid femora articulate in a horizontal to more parasagittal orientation at the height of the heart or below, blood pressure at the femoral nutrient foramen was as least as high as mean arterial blood pressure.
Considering the Qi values comparable to varanids and endotherms, we conclude that the high calculated blood pressures facilitated blood flow rates equal or higher than varanids in some non-therapsid synapsids.
Red Blood Cell Size
Huttenlocker and Farmer (2017) inferred blood cell sizes for non-eutheriodont synapsids to be larger than those of endotherms, in the range of modern non-avian sauropsids. Inversely correlating this value with relative heart size as an indicator for stamina, they suggested that elevated stamina evolved no earlier than in ancestral therocephalians and cynodonts. Yet, varanids reach much higher AAS and MMR than other ectothermic sauropsids while maintaining large blood cell sizes and low relative heart sizes (Vinogradov and Anatskaya, 2006).
However, our predictive model of MMR does not recover elevated activity metabolism in cynodonts compared to non-cynodont synapsids. Although red blood cell (RBC) sizes likely play a role in the high stamina of mammals and birds (Snyder and Sheafor, 1999; Vinogradov and Anatskaya, 2006), our prediction model for MMR does not account for RBC size and is only sensitive to the distinction between very low (i.e., turtle, lepidosaur, and crocodile) levels and intermediate to high (i.e., varanid and mammalian) levels. Therefore, our model likely underestimates MMR of cynodonts with lower RBC sizes. We hypothesize that ancestral synapsids showed elevated stamina such as in varanids and that MMR increased further in therocephalians and cynodonts. At least two phases of increase imply gradual evolution of activity metabolism in synapsids.
Implications of High Blood Flow and High Blood Pressures
Higher MAP in the systemic circulation needs to be separated from the pulmonary circulation, because high blood pressures in the latter can cause fatal pulmonary edema (Smits, 1989). Varanids and pythons are the only non-archosaurian sauropsids capable of considerable pressure separation between the two circulations through specially adapted hearts (Wood et al., 1977; Burggren and Johansen, 1982; Wang et al., 2002). Recent archosaurs and mammals feature four-chambered hearts for separation of the pulmonary from the systemic blood circulation and thus have much higher MAP. Mammalian-level blood pressures in Dimetrodon imply that the four-chambered heart or a functional analog allowing systemic pressure separation was present in the earliest Sphenacodontoidea.
Experiments with Alligator mississippiensis suggest that high blood pressures might be the direct consequence of a four-chambered heart: Normally, crocodiles show MAP in the amniote ectotherm range (e.g., Jones and Shelton, 1993). When Eme et al. (2009) surgically removed the pulmonary systemic shunt common to all crocodilians in their test animals, blood pressures increased markedly. We suggest that once the four-chambered heart or a functional analog was acquired, subsequent blood pressures remained high in all Sphenacodontoidea, including therapsids.
Other Indicators of Elevated Activity Metabolism in Non-mammalian Synapsids
The hypothesis of elevated metabolism in non-mammalian synapsids helps to explain several patterns in the fossil record inconsistent with previous hypotheses of a “reptilian-like” physiology in non-mammalian synapsids. Analyses of non-therapsid synapsid bone histology have uncovered FLB, a primary bone tissue typical of recent endotherms, in the early-branching Ophiacodon (Shelton and Sander, 2017) and incipient FLB in Dimetrodon (Shelton et al., 2013). This bone tissue is indicative of high growth rates, and only the secondarily ectothermic crocodiles (Seymour et al., 2004) can produce incipient FLB among recent non-avian sauropsids (Woodward et al., 2014). Elevated MMR in synapsids thus likely coincided with the elevated BMR needed for higher growth rates and FLB tissue in the earliest synapsids.
Non-therapsid synapsids also present morphological characters that we interpret here as indicative of a more energetic lifestyle. The evidence for a diaphragm-homologue in caseids suggests that the early synapsids could maintain breathing during locomotion (Lambertz et al., 2016). Plesiomorphically, continuous breathing necessary for elevated metabolic rates is hindered by locomotion in tetrapods as the axial body wall musculature tasked with undulatory locomotion cannot simultaneously inflate the lungs, known as Carrier’s constraint (Carrier, 1987). Just as endotherms, two highly active squamates groups (varanids and tegus) have evolved mechanisms to overcome this constraint (Owerkowicz et al., 1999; Klein et al., 2003).
A strong component of lateral undulation in locomotion is typical of non-avian sauropsids and associated with the sprawling stance typical of classical ectotherms. Mammals and archosaurs, on the other hand, evolved an erect stance, thus increasing stamina through the capacity of breathing during exercise with the help of the body wall musculature (Carrier, 1987). Traditionally, non-therapsid synapsids have been considered representing the basal amniote condition in the morphology of their locomotory apparatus (e.g., Blob, 2001), but non-therapsid synapsids in general, and Sphenacodontia in particular, show marked adaptations for a reduction of lateral undulation. Jones et al. (2021) found distinct locomotory adaptations in the vertebrae of non-mammalian synapsids such as increased stiffness of the column that might represent an early exaptation for the parasagittal gait that later evolved in mammals. Basal synapsid zygapophyses are oriented markedly different from the horizontal plane (30° in ophiacodonts, 45° in Dimetrodon), thus restricting the lateral movement of the vertebral column (Kemp, 2005: 101). Trackways of the Lower Permian ichnotaxon Dimetropus leisnerianus produced by (possibly sphenacodontid) non-therapsid synapsid trackmakers show an average pace angulation of about 110°, higher than the average angulation of the contemporary tetrapods at about 90° indicating a more erect stance [see Supplementary material of Kubo and Benton (2009)]. The trend to the parasagittal gait necessary for higher locomotion capacity [as a precondition to mammalian endothermy, compare Lovegrove (2017)] consequently began in non-therapsid synapsids.
Implications for the Chronology of Endothermy Evolution
To determine what elevated aerobic metabolism in the earliest synapsids means for the chronology of mammalian endothermy evolution, we must assess the evidence for BMR in the mammalian stem group. Rey et al. (2017) produced geochemical evidence from three different assemblage zones in the Beaufort Group of South Africa for homeothermy in dicynodonts and cynodonts. Olivier et al. (2017) and Faure-Brac and Cubo (2020) used proxies for BMR (or the similar resting metabolic rate, RMR) from bone histology to infer mammalian-like BMR/RMR in dicynodonts. Therefore, metabolic thermogenesis evolved at the base of Neotherapsida (the last common ancestor of dicynodonts and mammals and all its descendants) no later than 270 Mya (Liu et al., 2010). de Ricqlès (1974) based his hypothesis of endothermy in all therapsids explicitly on the presence of FLB, but incipient FLB is also reported from alligators (Woodward et al., 2014). The only indicators of elevated basal metabolism in non-therapsid synapsids remain high blood pressures (Seymour, 2016) and the presence of FLB as well as incipient FLB (Shelton et al., 2013; Shelton and Sander, 2017). Their histology suggests that elevated growth rates and high blood pressures facilitated higher metabolic rates, but these facts by themselves do not justify pushing back the origin of endothermy into non-mammalian synapsids. Consequently, we must reject the thermoregulation-first hypothesis. Elevated aerobic capacity was present first in non-therapsid synapsids, while endothermy evolved only second in neotherapsids or later.
Non-therapsid synapsids had high MMR (this study) and low RMR/BMR (Faure-Brac and Cubo, 2020), whereas non-mammalian neotherapsids had high MMR (this study) and high RMR/BMR (Faure-Brac and Cubo, 2020). More precisely, Faure-Brac and Cubo (2020) showed that all non-therapsid synapsids analyzed but one (Ophiacodon uniformis) had RMR/BMR significantly lower than the threshold value separating endotherms from ectotherms. The value inferred for Ophiacodon uniformis was lower than this threshold, but the upper limit of the 95% confidence interval was slightly higher than it. As a result, we amend the foraging hypothesis of Hopson (2012) and the triphasic model of endothermy evolution of Lovegrove (2017). Our finding of high blood flow rates and inferred elevated aerobic capacity in synapsids predating the evolution of physiological thermoregulation is generally in agreement with the two models, although they suggest that elevated MMR evolved only in therapsids. Hopson’s idea of a varanid-like animal with increased aerobic scopes due to elevated MMR and low BMR as an intermediary stage to the first therapsid endotherms is a hypothesis our data supports. Judging from additional indicators of increased locomotor capacity (an exaptation for Lovegrove’s second phase of endothermy evolution) and inferred soft part anatomy capable of coping with high blood pressures as well as increased oxygen requirements, our picture of the non-therapsid synapsids shifts: away from that of passive sit-and-wait predators that rely mostly on anaerobic metabolism toward widely foraging animals with elevated aerobic metabolic rates for sustained activity. Coincidentally, the varanid analogy in metabolism used by Hopson (2012) confirms the intuitive connection made by Broili (1904) and Williston (1911) in the descriptions of the non-therapsid synapsids Varanosaurus (and Varanops) due to their morphological resemblance to varanids.
Our findings could also be interpreted to support the assimilation capacity model of Koteja (2000) since a widely foraging lifestyle could have evolved to satisfy metabolic requirements of intense parental care in the parent animal. Botha-Brink and Modesto (2007) published tentative evidence of parental care in varanopsids. However, the only conclusive evidence for the assimilation capacity model would be measurements of juvenile growth rates in non-mammalian synapsids that are significantly higher than in recent non-avian sauropsids. This could be obtained from bone histology.
The Ancestral State of MMR in Amniotes and Implications for the Origin of the Metabolic Chasm in Amniota
Our tentative evidence for elevated MMR in the earliest synapsids is supported by the fact that ancestral amniotes most parsimoniously had complex lungs and that the simple lungs of squamates originated in an ancestral lepidosauromorph as an adaptation to extremely small body size (Lambertz et al., 2015). Also, endothermy appears to have evolved several times independently in diapsids, at least once among archosaurs (Legendre et al., 2016), and possibly three times in marine reptiles (Bernard et al., 2010; Fleischle et al., 2018). A low metabolism, ectothermic lifestyle has diverse advantages (Pough, 1980). We speculate that the taxa at the two extreme ends of the amniote metabolic spectrum, energetically efficient ectothermic non-avian sauropsids on the one hand, high throughput endothermic mammals and birds on the other, could have diverged from an ancestral state of low BMR and elevated aerobic metabolism.
Conclusion
Our findings of elevated blood flow in non-mammalian synapsids indicate that aerobic capacity was elevated in non-therapsid synapsids above the level of most recent non-varanid lepidosaurs, turtles and crocodilians since the late Carboniferous (ca. 310 Mya) with maximum aerobic metabolic rates at, or above, the level of varanids. This supports the aerobic capacity model for the evolution of endothermy. Aerobic capacity increased markedly prior to the evolution of endothermy in Neotherapsida in the middle Permian (ca. 270 Mya) or later. Non-therapsid synapsids were animals with higher stamina than most recent non-avian sauropsids, capable of widely foraging lifestyles as seen in modern varanids while likely maintaining low energetic requirements. This would be caused by a mega-trend of evolution among amniotes that overwhelmingly selects against animals of intermediate metabolism today (except for varanids and some sea turtles), whereas such animals were abundant in the terrestrial ecosystems of the late Carboniferous and early Permian.
However, further research is needed to confirm our hypothesis of an elevated MMR as plesiomorphic for amniotes by investigating the Qi of early diapsids and amniote outgroups such as diadectids.
Data Availability Statement
The raw data supporting the conclusions of this article will be made available by the authors, without undue reservation.
Author Contributions
As part of the master thesis of PK; PK and PMS conceived the project and organized collection visits. PK designed the study, took measurements, performed statistical analysis, and wrote the manuscript. PK, AH, and JL contributed to the CT-scanning of specimens. All authors contributed to the article and approved the submitted version.
Funding
The Bundesministerium für Bildung und Forschung (BMBF) provided funding for PK (BROMACKER Project 2020) during the statistical reanalysis and final writing of the manuscript, and the Society of Vertebrate Paleontology provided partial funding of a research visit through the Jackson School of Geosciences Student Travel Grant to PK. AH was supported by the Alexander von Humboldt Foundation in the lab of PMS during scanning. Additional funding was provided by DFG, project number 203352091 to PMS. We acknowledge support by the German Research Foundation (DFG) and the Open Access Publication Fund of Humboldt-Universität zu Berlin.
Conflict of Interest
The authors declare that the research was conducted in the absence of any commercial or financial relationships that could be construed as a potential conflict of interest.
Publisher’s Note
All claims expressed in this article are solely those of the authors and do not necessarily represent those of their affiliated organizations, or those of the publisher, the editors and the reviewers. Any product that may be evaluated in this article, or claim that may be made by its manufacturer, is not guaranteed or endorsed by the publisher.
Acknowledgments
We would like to thank Dr. Jessica Mitchell (University of Bonn, now INM-6 Computational and Systems Neuroscience, Research Centre Jülich, Germany), for indispensable support with statistical methods including R scripts, Lucas Legendre from the Jackson School of Geosciences, University of Texas at Austin, for providing R scripts and crucial information on phylogenetic comparative methods, Paulina Jimenez Huidobro (Institute of Geosciences, University of Bonn) for microCT scanning of specimens, Olaf Dülfer from the Institute of Geosciences, Henrik Stöhr from the Institut für Paläontologie, Tübingen, and Kenneth Bader from the Texas Memorial Museum, Austin, for their great help in preparation. Also, we would like to thank the following people for help in collections work: Dr. Davit Vasilyan from the Jurassica Museum, Porrentruy, Switzerland, Dr. Ingmar Werneburg and Prof. Dr. Madelaine Böhme from the Institut für Paläontologie, Tübingen, Kenneth Angielczyk and Bill Simpson from the Field Museum, Chicago, Matt Lowe and Jason Head from the Museum of Zoology, University of Cambridge, United Kingdom, and Chris Sagebiel from the Texas Memorial Museum, Austin. Also, we would like to thank Darius Nau, Tomasz Owerkowicz, and Roger S. Seymour for discussion. We would like to thank Jörg Fröbisch for his continued support for the publication of this work and the Open Access Publication Fund of Humboldt-Universität zu Berlin for publication funding. Finally, we would like to thank the reviewers, Jorge Cubo, Agustin G. Martinelli, and Roger Seymour, and the editor, Michel Laurin, for their constructive criticism and suggestions that greatly improved the manuscript.
Supplementary Material
The Supplementary Material for this article can be found online at: https://www.frontiersin.org/articles/10.3389/fevo.2021.751238/full#supplementary-material
Footnotes
References
Allan, G. H., Cassey, P., Snelling, E. P., Maloney, S. K., and Seymour, R. S. (2014). Blood flow for bone remodelling correlates with locomotion in living and extinct birds. J. Exp. Biol. 217, 2956–2962. doi: 10.1242/jeb.102889
Bajdek, P., Qvarnström, M., Owocki, K., Sulej, T., Sennikov, A. G., Golubev, V. K., et al. (2016). Microbiota and food residues including possible evidence of pre-mammalian hair in Upper Permian coprolites from Russia. Lethaia 49, 455–477. doi: 10.1111/let.12156
Bennett, A., and Ruben, J. (1979). Endothermy and activity in vertebrates. Science 206, 649–654. doi: 10.1126/science.493968
Bennett, A. F. (1973). Blood physiology and oxygen transport during activity in two lizards, Varanus gouldii and Sauromalus hispidus. Comp. Biochem. Physiol. A Comp. Physiol. 46, 673–690. doi: 10.1016/0300-9629(73)90120-5
Bennett, A. F., Dawson, W. R. (1976). “Metabolism,” in Biology of the Reptilia, Physiology A, Vol. 5, eds W. R. Dawson and C. Gans (New York, NY: Academic Press), 127–223.
Bennett, A. F., and Ruben, J. A. (1986). “The metabolic and thermoregulatory status of therapsids,” in The Ecology and Biology of Mammal-Like Reptiles, eds A. F. Bennett, J. A. Ruben, N. Hotton, P. D. MacLean, J. J. Roth, and E. C. Roth (Washington, DC: Smithsonian Institution), 207–218.
Benoit, J., Manger, P. R., and Rubidge, B. S. (2016). Palaeoneurological clues to the evolution of defining mammalian soft tissue traits. Sci. Rep. 6:25604. doi: 10.1038/srep25604
Benson, R. B. J. (2012). Interrelationships of basal synapsids: cranial and postcranial morphological partitions suggest different topologies. J. Syst. Palaeontol. 10, 601–624. doi: 10.1080/14772019.2011.631042
Benson, R. B. J., Campione, N. E., Carrano, M. T., Mannion, P. D., Sullivan, C., Upchurch, P., et al. (2014). Rates of dinosaur body mass evolution indicate 170 million years of sustained ecological innovation on the avian stem lineage. PLoS Biol. 12:e1001853. doi: 10.1371/journal.pbio.1001853
Benton, M. J. (2021). The origin of endothermy in synapsids and archosaurs and arms races in the Triassic. Gondwana Res. 100, 261–289. doi: 10.1016/j.gr.2020.08.003
Bernard, A., Lécuyer, C., Vincent, P., Amiot, R., Bardet, N., Buffetaut, E., et al. (2010). Regulation of body temperature by some Mesozoic marine reptiles. Science 328, 1379–1382. doi: 10.1126/science.1187443
Bever, G. S., Lyson, T. R., Field, D. J., and Bhullar, B.-A. S. (2015). Evolutionary origin of the turtle skull. Nature 525, 239–242. doi: 10.1038/nature14900
Blob, R. W. (2001). Evolution of hindlimb posture in nonmammalian therapsids: biomechanical tests of paleontological hypotheses. Paleobiology 27, 14–38. doi: 10.1666/0094-8373(2001)027<0014:EOHPIN>2.0.CO;2
Blomberg, S. P., and Garland, T. Jr. (2002). Tempo and mode in evolution: phylogenetic inertia, adaptation and comparative methods. J. Evol. Biol. 15, 899–910. doi: 10.1046/j.1420-9101.2002.00472.x
Botha-Brink, J., Abdala, F., and Chinsamy-Turan, A. (2012). “The radiation and osteohistology of nonmammaliaform cynodonts,” in Forerunners of Mammals: Radiation, Histology, Biology, ed. A. Chinsamy-Turan (Bloomington, IN: Indiana University Press), 223–246.
Botha-Brink, J., and Modesto, S. P. (2007). A mixed-age classed ‘pelycosaur’ aggregation from South Africa: earliest evidence of parental care in amniotes? Proc. R. Soc. B 274, 2829–2834. doi: 10.1098/rspb.2007.0803
Botha-Brink, J., Soares, M. B., and Martinelli, A. G. (2018). Osteohistology of Late Triassic prozostrodontian cynodonts from Brazil. PeerJ 6:e5029. doi: 10.7717/peerj.5029
Brinkman, D. (1988). Size-independent criteria for estimating relative age in Ophiacodon and Dimetrodon (Reptilia, Pelycosauria) from the admiral and lower Belle Plains formations of west-central Texas. J. Vertebr. Paleontol. 8, 172–180. doi: 10.1080/02724634.1988.10011695
Broili, F. (1904). Permische stegocephalen und reptilien aus Texas: erste Hälfte. Palaeontographica 51, 1–48, I–VI.
Brookes, M. (1967). Blood flow rates in compact and cancellous bone, and bone marrow. J. Anat. 101, 533–541.
Burggren, W., and Johansen, K. (1982). Ventricular haemodynamics in the monitor lizard Varanus exanthematicus: pulmonary and systemic pressure separation. J. Exp. Biol. 96, 343–354. doi: 10.1242/jeb.96.1.343
Burnham, K. P., Anderson, D. R., and Huyvaert, K. P. (2011). AIC model selection and multimodel inference in behavioral ecology: some background, observations, and comparisons. Behav. Ecol. Sociobiol. 65, 23–35. doi: 10.1007/s00265-010-1029-6
Butler, M. A., and King, A. A. (2004). Phylogenetic comparative analysis: a modeling approach for adaptive evolution. Am. Nat. 164, 683–695. doi: 10.1086/426002
Campione, N. E., and Evans, D. C. (2012). A universal scaling relationship between body mass and proximal limb bone dimensions in quadrupedal terrestrial tetrapods. BMC Biol. 10:60. doi: 10.1186/1741-7007-10-60
Carrier, D. R. (1987). The evolution of locomotor stamina in tetrapods: circumventing a mechanical constraint. Paleobiology 13, 326–341. doi: 10.1017/S0094837300008903
A. Chinsamy-Turan (ed.) (2012). Forerunners of Mammals: Radiation, Histology, Biology. Bloomington, IN: Indiana University Press.
Christian, K., and Conley, K. (1994). Activity and resting metabolism of varanid lizards compared with typical lizards. Aust. J. Zool. 42, 185–193. doi: 10.1071/ZO9940185
Clemente, C. J., Withers, P. C., and Thompson, G. G. (2009). Metabolic rate and endurance capacity in Australian varanid lizards (Squamata: Varanidae: Varanus): evolution of endurance in varanids. Biol. J. Linn. Soc. 97, 664–676. doi: 10.1111/j.1095-8312.2009.01207.x
Crompton, A. W., Owerkowicz, T., Bhullar, B.-A. S., and Musinsky, C. (2017). Structure of the nasal region of non-mammalian cynodonts and mammaliaforms: speculations on the evolution of mammalian endothermy. J. Vertebr. Paleontol. 37:e1269116. doi: 10.1080/02724634.2017.1269116
Crompton, A. W., Taylor, C. R., and Jagger, J. A. (1978). Evolution of homeothermy in mammals. Nature 272, 333–336. doi: 10.1038/272333a0
Cubo, J., and Jalil, N.-E. (2019). Bone histology of Azendohsaurus laaroussii: implications for the evolution of thermometabolism in Archosauromorpha. Paleobiology 45, 317–330. doi: 10.1017/pab.2019.13
Cubo, J., Sena, M. V. A., Aubier, P., Houee, G., Claisse, P., Faure-Brac, M. G., et al. (2020). Were Notosuchia (Pseudosuchia: Crocodylomorpha) warm-blooded? A palaeohistological analysis suggests ectothermy. Biol. J. Linn. Soc. 131, 154–162. doi: 10.1093/biolinnean/blaa081
Eme, J., Gwalthney, J., Blank, J. M., Owerkowicz, T., Barron, G., and Hicks, J. W. (2009). Surgical removal of right-to-left cardiac shunt in the American alligator (Alligator mississippiensis) causes ventricular enlargement but does not alter apnoea or metabolism during diving. J. Exp. Biol. 212, 3553–3563. doi: 10.1242/jeb.034595
Enlow, D. H., and Brown, S. O. (1957). A comparative histological study of fossil and recent bone tissues. Part II. Texas J. Sci. 9, 186–204.
Farmer, C. G. (2000). Parental care: the key to understanding endothermy and other convergent features in birds and mammals. Am. Nat. 155, 326–334. doi: 10.1086/303323
Farmer, C. G. (2003). Reproduction: the adaptive significance of endothermy. Am. Nat. 162, 826–840. doi: 10.1086/380922
Faure-Brac, M. G., and Cubo, J. (2020). Were the synapsids primitively endotherms? A palaeohistological approach using phylogenetic eigenvector maps. Philos. Trans. R. Soc. B Biol. Sci. 375:20190138. doi: 10.1098/rstb.2019.0138
Felsenstein, J. (1973). Maximum-likelihood estimation of evolutionary trees from continuous characters. Am. J. Hum. Genet. 25, 471–492.
Felsenstein, J. (1985). Phylogenies and the comparative method. Am. Nat. 125, 1–15. doi: 10.1086/284325
Field, D. J., Gauthier, J. A., King, B. L., Pisani, D., Lyson, T. R., and Peterson, K. J. (2014). Toward consilience in reptile phylogeny: miRNAs support an archosaur, not lepidosaur, affinity for turtles: reptile phylogeny from miRNAs. Evol. Dev. 16, 189–196. doi: 10.1111/ede.12081
Fleischle, C. V., Wintrich, T., and Sander, P. M. (2018). Quantitative histological models suggest endothermy in plesiosaurs. PeerJ 6:e4955. doi: 10.7717/peerj.4955
Ford, D. P., and Benson, R. B. J. (2020). The phylogeny of early amniotes and the affinities of Parareptilia and Varanopidae. Nat. Ecol. Evol. 4, 57–65. doi: 10.1038/s41559-019-1047-3
Fröbisch, J. (2007). The cranial anatomy of Kombuisia frerensis Hotton (Synapsida, Dicynodontia) and a new phylogeny of anomodont therapsids. Zool. J. Linn. Soc. 150, 117–144. doi: 10.1111/j.1096-3642.2007.00285.x
Garland, T. Jr. (1982). Scaling maximal running speed and maximal aerobic speed to body mass in mammals and lizards. Physiologist 25:338.
Gillooly, J. F., Brown, J. H., West, G. B., Savage, V. M., and Charnov, E. L. (2001). Effects of size and temperature on metabolic rate. Science 293, 2248–2251. doi: 10.1126/science.1061967
Gross, J., and Ligges, U. (2015). Package Nortest: Test for Normality. Available online at: https://CRAN.R-project.org/package=nortest (accessed April 28, 2021).
Grüneboom, A., Hawwari, I., Weidner, D., Culemann, S., Müller, S., Henneberg, S., et al. (2019). A network of trans-cortical capillaries as mainstay for blood circulation in long bones. Nat. Metabol. 1, 236–250. doi: 10.1038/s42255-018-0016-5
Guénard, G., Legendre, P., and Peres-Neto, P. (2013). Phylogenetic eigenvector maps: a framework to model and predict species traits. Methods Ecol. Evol. 4, 1120–1131. doi: 10.1111/2041-210X.12111
Harmon, L. J., Losos, J. B., Davies, T. J., Gillespie, R. G., Gittleman, J. L., Bryan Jennings, W., et al. (2010). Early bursts of body size and shape evolution are rare in comparative data. Evolution 64, 2385–2396. doi: 10.1111/j.1558-5646.2010.01025.x
Harmon, L. J., Weir, J. T., Brock, C. D., Glor, R. E., and Challenger, W. (2008). GEIGER: investigating evolutionary radiations. Bioinformatics 24, 129–131. doi: 10.1093/bioinformatics/btm538
Hedges, S. B., Dudley, J., and Kumar, S. (2006). TimeTree: a public knowledge-base of divergence times among organisms. Bioinformatics 22, 2971–2972. doi: 10.1093/bioinformatics/btl505
Hedges, S. B., Marin, J., Suleski, M., Paymer, M., and Kumar, S. (2015). Tree of life reveals clock-like speciation and diversification. Mol. Biol. Evol. 32, 835–845. doi: 10.1093/molbev/msv037
Hemmingsen, A. M. (1960). Energy metabolism as related to body size and respiratory surface, and its evolution. Rep. Steno Meml. Hosp. 13, 1–110.
Hillenius, W. J. (1992). The evolution of nasal turbinates and mammalian endothermy. Paleobiology 18, 17–29. doi: 10.1017/S0094837300012197
Hillenius, W. J. (1994). Turbinates in therapsids: evidence for late Permian origins of mammalian endothermy. Evolution 48, 207–229. doi: 10.1111/j.1558-5646.1994.tb01308.x
Hopson, J. A. (2012). The role of foraging mode in the origin of therapsids: implications for the origin of mammalian endothermy. Fieldiana Life Earth Sci. 5, 126–148. doi: 10.3158/2158-5520-5.1.126
Hu, Q., Nelson, T. J., and Seymour, R. S. (2020). Bone foramen dimensions and blood flow calculation: best practices. J. Anat. 236, 357–369. doi: 10.1111/joa.13106
Hu, Q., Nelson, T. J., Snelling, E. P., and Seymour, R. S. (2018). Femoral bone perfusion through the nutrient foramen during growth and locomotor development of western grey kangaroos (Macropus fuliginosus). J. Exp. Biol. 221, doi: 10.1242/jeb.168625
Hulbert, A. J. (1980). “The evolution of energy metabolism in mammals,” in Comparative Physiology: Primitive Mammals, eds K. Schmidt-Nielsen, L. Bolis, and C. R. Taylor (Cambridge: Cambridge University Press), 129–139.
Hulbert, A. J. (1988). “Metabolism and the development of Endothermy,” in The Developing Marsupial: Models for Biomedical Research, eds C. H. Tyndale-Biscoe and P. A. Janssens (Berlin: Springer-Verlag), 148–161. doi: 10.1007/978-3-642-88402-3_11
Hurvich, C. M., and Tsai, C.-L. (1989). Regression and time series model selection in small samples. Biometrika 76, 297–307. doi: 10.1093/biomet/76.2.297
Huttenlocker, A. K., and Farmer, C. G. (2017). Bone microvasculature tracks red blood cell size diminution in Triassic mammal and dinosaur forerunners. Curr. Biol. 27, 48–54. doi: 10.1016/j.cub.2016.10.012
Ji, Q., Luo, Z.-X., Yuan, C.-X., and Tabrum, A. R. (2006). A swimming mammaliaform from the Middle Jurassic and ecomorphological diversification of early mammals. Science 311, 1123–1127. doi: 10.1126/science.1123026
Jones, D. R., and Shelton, G. (1993). The physiology of the Alligator heart: left aortic flow patterns and right-to-left shunts. J. Exp. Biol. 176, 247–269. doi: 10.1242/jeb.176.1.247
Jones, J. H., and Lindstedt, S. L. (1993). Limits to maximal performance. Annu. Rev. Physiol. 55, 547–569. doi: 10.1146/annurev.ph.55.030193.002555
Jones, K. E., Dickson, B. V., Angielczyk, K. D., and Pierce, S. E. (2021). Adaptive landscapes challenge the “lateral-to-sagittal” paradigm for mammalian vertebral evolution. Curr. Biol. 31, 1883–1892.e7. doi: 10.1016/j.cub.2021.02.009
Josse, S., Moreau, T., and Laurin, M. (2006). Stratigraphic Tools for Mesquite. Available online at: mesquiteproject.org/packages/stratigraphicTools/ (accessed July 15, 2020).
Kemp, T. S. (2006). The origin of mammalian endothermy: a paradigm for the evolution of complex biological structure. Zool. J. Linn. Soc. 147, 473–488. doi: 10.1111/j.1096-3642.2006.00226.x
Kemp, T. S. (2012). “The origin and radiation of therapsids,” in Forerunners of Mammals: Radiation, Histology, Biology, ed. A. Chinsamy-Turan (Bloomington, IN: Indiana University Press), 2–28.
Klein, W., Andrade, D. V., Abe, A. S., and Perry, S. F. (2003). Role of the post-hepatic septum on breathing during locomotion in Tupinambis merianae (Reptilia: Teiidae). J. Exp. Biol. 206, 2135–2143. doi: 10.1242/jeb.00400
Koteja, P. (2000). Energy assimilation, parental care and the evolution of endothermy. Proc. R. Soc. Lond. B 267, 479–484. doi: 10.1098/rspb.2000.1025
Kubo, T., and Benton, M. J. (2009). Tetrapod postural shift estimated from Permian and Triassic trackways. Palaeontology 52, 1029–1037. doi: 10.1111/j.1475-4983.2009.00897.x
Kumar, S., and Hedges, S. B. (2011). TimeTree2: species divergence times on the iPhone. Bioinformatics 27, 2023–2024. doi: 10.1093/bioinformatics/btr315
Lambertz, M., Grommes, K., Kohlsdorf, T., and Perry, S. F. (2015). Lungs of the first amniotes: why simple if they can be complex? Biol. Lett. 11:20140848. doi: 10.1098/rsbl.2014.0848
Lambertz, M., Shelton, C. D., Spindler, F., and Perry, S. F. (2016). A caseian point for the evolution of a diaphragm homologue among the earliest synapsids: early synapsid origin of a diaphragm homologue. Ann. N. Y. Acad. Sci. 1385, 3–20. doi: 10.1111/nyas.13264
Laurin, M., and de Buffrénil, V. (2016). Microstructural features of the femur in early ophiacodontids: a reappraisal of ancestral habitat use and lifestyle of amniotes. C. R. Palevol 15, 115–127. doi: 10.1016/j.crpv.2015.01.001
Laurin, M., and Piñeiro, G. (2018). Response: commentary: a reassessment of the taxonomic position of mesosaurs, and a surprising phylogeny of early amniotes. Front. Earth Sci. 6:220. doi: 10.3389/feart.2018.00220
Legendre, L. J., and Davesne, D. (2020). The evolution of mechanisms involved in vertebrate endothermy. Philos. Trans. R. Soc. B 375:20190136. doi: 10.1098/rstb.2019.0136
Legendre, L. J., Guénard, G., Botha-Brink, J., and Cubo, J. (2016). Palaeohistological evidence for ancestral high metabolic rate in archosaurs. Syst. Biol. 65, 989–996. doi: 10.1093/sysbio/syw033
Lichtig, A. J., and Lucas, S. G. (2021). Chinlechelys from the Upper Triassic of New Mexico, USA, and the origin of turtles. Palaeontol. Electron. 24, 1–49. doi: 10.26879/886
Liu, J., Rubidge, B., and Li, J. (2010). A new specimen of Biseridens qilianicus indicates its phylogenetic position as the most basal anomodont. Proc. R. Soc. B 277, 285–292. doi: 10.1098/rspb.2009.0883
Lovegrove, B. G. (2017). A phenology of the evolution of endothermy in birds and mammals: evolution of endothermy. Biol. Rev. 92, 1213–1240. doi: 10.1111/brv.12280
Lovegrove, B. G. (2019). Fires of Life – Endothermy in Birds and Mammals. New Haven, CT, London: Yale University Press.
Lovegrove, B. G., and Génin, F. (2008). Torpor and hibernation in a basal placental mammal, the lesser hedgehog tenrec Echinops telfairi. J. Comp. Physiol. B 178, 691–698. doi: 10.1007/s00360-008-0257-9
MacDougall, M. J., Modesto, S. P., Brocklehurst, N., Verrière, A., Reisz, R. R., and Fröbisch, J. (2018). Commentary: a reassessment of the taxonomic position of mesosaurs, and a surprising phylogeny of early amniotes. Front. Earth Sci. 6:99. doi: 10.3389/feart.2018.00099
Maddison, W. P., and Maddison, D. R. (2019). Mesquite: A Modular System for Evolutionary Analysis. Available online at: www.mesquiteproject.org (accessed September 01, 2021).
McNab, B. K. (1978). The evolution of endothermy in the phylogeny of mammals. Am. Nat. 112, 1–21. doi: 10.1086/283249
Millard, R. W., and Johansen, K. (1974). Ventricular outflow dynamics in the lizard, Varanus niloticus: responses to hypoxia, hypercarbia and diving. J. Exp. Biol. 60, 871–880. doi: 10.1242/jeb.60.3.871
Mitchell, J., Legendre, L. J., Lefèvre, C., and Cubo, J. (2017). Bone histological correlates of soaring and high-frequency flapping flight in the furculae of birds. Zoology 122, 90–99. doi: 10.1016/j.zool.2017.03.004
Molina-Venegas, R., Moreno-Saiz, J. C., Castro Parga, I., Davies, T. J., Peres-Neto, P. R., and Rodríguez, M. A. (2018). Assessing among−lineage variability in phylogenetic imputation of functional trait datasets. Ecography 41, 1740–1749. doi: 10.1111/ecog.03480
Munshi-South, J., and Wilkinson, G. S. (2010). Bats and birds: exceptional longevity despite high metabolic rates. Ageing Res. Rev. 9, 12–19. doi: 10.1016/j.arr.2009.07.006
Nagy, K. A. (1987). Field metabolic rate and food requirement scaling in mammals and birds. Ecol. Monogr. 57, 111–128. doi: 10.2307/1942620
Newham, E., Gill, P. G., Brewer, P., Benton, M. J., Fernandez, V., Gostling, N. J., et al. (2020). Reptile-like physiology in Early Jurassic stem-mammals. Nat. Commun. 11:5121. doi: 10.1038/s41467-020-18898-4
Oelkrug, R., Goetze, N., Exner, C., Lee, Y., Ganjam, G. K., Kutschke, M., et al. (2013). Brown fat in a protoendothermic mammal fuels eutherian evolution. Nat. Commun. 4:2140. doi: 10.1038/ncomms3140
Olivier, C., Houssaye, A., Jalil, N.-E., and Cubo, J. (2017). First palaeohistological inference of resting metabolic rate in an extinct synapsid, Moghreberia nmachouensis (Therapsida: Anomodontia). Biol. J. Linn. Soc. 121, 409–419. doi: 10.1093/biolinnean/blw044
Orme, D., Freckleton, R., Thomas, G., Petzoldt, T., Fritz, S., Isaac, N., et al. (2013). The caper Package: Comparative Analysis of Phylogenetics and Evolution in R. Available online at: https://CRAN.R-project.org/package=caper
Owerkowicz, T., Farmer, C. G., Hicks, J. W., and Brainerd, E. L. (1999). Contribution of gular pumping to lung ventilation in monitor lizards. Science 284, 1661–1663. doi: 10.1126/science.284.5420.1661
Paradis, E., Claude, J., and Strimmer, K. (2004). APE: analyses of phylogenetics and evolution in R language. Bioinformatics 20, 289–290. doi: 10.1093/bioinformatics/btg412
Penick, D. N., Paladino, F. V., Steyermark, A. C., and Spotila, J. R. (1996). Thermal dependence of tissue metabolism in the green turtle, Chelonia mydas. Comp. Biochem. Physiol. A Physiol. 113, 293–296. doi: 10.1016/0300-9629(95)02068-3
Pinheiro, J., Bates, D., DebRoy, S., and Sarkar, D. (2014). nlme: Linear and Nonlinear Mixed Effects Models. Available online at: https://CRAN.R-project.org/package=nlme
R Core Team (2021). R: A Language and Environment for Statistical Computing. Vienna: R Foundation for Statistical Computing. Available online at: https://www.r-project.org
Ray, S., Chinsamy, A., and Bandyopadhyay, S. (2005). Lystrosaurus murrayi (Therapsida, Dicynodontia): bone histology, growth and lifestyle adaptations. Palaeontology 48, 1169–1185. doi: 10.1111/j.1475-4983.2005.00513.x
Reisz, R. R. (1986). Encyclopedia of Paleoherpetology Part 17 A Pelycosauria. Stuttgart, New York: Gustav Fischer Verlag.
Reisz, R. R., and Laurin, M. (2001). The reptile Macroleter: first vertebrate evidence for correlation of Upper Permian continental strata of North America and Russia. Geol. Soc. Am. Bull. 113, 1229–1233. doi: 10.1130/0016-7606(2001)113<1229:trmfve>2.0.co;2
Reisz, R. R., and Laurin, M. (2002). Discussion and reply: the reptile Macroleter: first vertebrate evidence for correlation of Upper Permian continental strata of North America and Russia. Geol. Soc. Am. Bull. 114, 1176–1177.
Rey, K., Amiot, R., Fourel, F., Abdala, F., Fluteau, F., Jalil, N.-E., et al. (2017). Oxygen isotopes suggest elevated thermometabolism within multiple Permo-Triassic therapsid clades. eLife 6:e28589. doi: 10.7554/eLife.28589
Romer, A. S., and Price, L. W. (1940). Review of the pelycosaurs. Geol. Soc. Am. Spec. Pap. 28, 1–538. doi: 10.1002/1097-4687(200007)245:1<29::AID-JMOR3>3.0.CO;2-B
Rowe, T. B., Macrini, T. E., and Luo, Z.-X. (2011). Fossil evidence on origin of the mammalian brain. Science 332, 955–957. doi: 10.1126/science.1203117
Ruf, I., Maier, W., Rodrigues, P. G., and Schultz, C. L. (2014). Nasal anatomy of the non-mammaliaform cynodont Brasilitherium riograndensis (Eucynodontia, Therapsida) reveals new insight into mammalian evolution. Anat. Rec. 297, 2018–2030. doi: 10.1002/ar.23022
Schwartz, N. L., Patel, B. A., Garland, T. Jr., and Horner, A. M. (2018). The effect of selective breeding for high voluntary wheel−running behavior on femoral nutrient canal abundance and size. FASEB J. 32:855.18. doi: 10.1111/joa.12830
Seymour, R. S. (2016). Cardiovascular physiology of dinosaurs. Physiology 31, 430–441. doi: 10.1152/physiol.00016.2016
Seymour, R. S., Bennett−Stamper, C. L., Johnston, S. D., Carrier, D. R., and Grigg, G. C. (2004). Evidence for endothermic ancestors of crocodiles at the stem of archosaur evolution. Physiol. Biochem. Zool. 77, 1051–1067. doi: 10.1086/422766
Seymour, R. S., Smith, S. L., White, C. R., Henderson, D. M., and Schwarz-Wings, D. (2012). Blood flow to long bones indicates activity metabolism in mammals, reptiles and dinosaurs. Proc. R. Soc. B 279, 451–456. doi: 10.1098/rspb.2011.0968
Shelton, C. D. (2015). Origins of Endothermy in the Mammalian Lineage – the Evolutionary Beginning of Fibro-Lamellar Bone in the “Mammal-Like” Reptiles. Ph.D. thesis. Available online at: https://d-nb.info/107729011X/34.
Shelton, C. D., and Sander, P. M. (2017). Long bone histology of Ophiacodon reveals the geologically earliest occurrence of fibrolamellar bone in the mammalian stem lineage. C. R. Palevol 16, 397–424. doi: 10.1016/j.crpv.2017.02.002
Shelton, C. D., Sander, P. M., Stein, K., and Winkelhorst, H. (2013). Long bone histology indicates sympatric species of Dimetrodon (Lower Permian, Sphenacodontidae). Earth Environ. Sci. Trans. R Soc. Edinb. 103, 217–236. doi: 10.1017/S175569101300025X
Smaers, J. B., and Mongle, C. S. (2014). evomap: R Package for the Evolutionary Mapping of Continuous Traits. Available online at: https://github.com/JeroenSmaers/evomap (accessed April 28, 2021).
Smaers, J. B., and Rohlf, F. J. (2016). Testing species’ deviation from allometric predictions using the phylogenetic regression. Evolution 70, 1145–1149. doi: 10.1111/evo.12910
Smith, R. M. H., and Botha-Brink, J. (2011). Morphology and composition of bone-bearing coprolites from the Late Permian Beaufort Group, Karoo Basin, South Africa. Palaeogeogr. Palaeoclimatol. Palaeoecol. 312, 40–53. doi: 10.1016/j.palaeo.2011.09.006
Smits, A. W. (1989). “Fluid balance in vertebrate lungs,” in Comparative Pulmonary Physiology, ed. S. C. Wood (New York, NY: Marcel Dekker), 503–537.
Snyder, G. K., and Sheafor, B. A. (1999). Red blood cells: centerpiece in the evolution of the vertebrate circulatory system. Am. Zool. 39, 189–198. doi: 10.1093/icb/39.2.189
Tattersall, G. J., Leite, C. A. C., Sanders, C. E., Cadena, V., Andrade, D. V., Abe, A. S., et al. (2016). Seasonal reproductive endothermy in tegu lizards. Sci. Adv. 2:e1500951. doi: 10.1126/sciadv.1500951
Taylor, C. R., Maloiy, G. M., Weibel, E. R., Langman, V. A., Kamau, J. M., Seeherman, H. J., et al. (1981). Design of the mammalian respiratory system. III. Scaling maximum aerobic capacity to body mass: wild and domestic mammals. Respir. Physiol. 44, 25–37. doi: 10.1016/0034-5687(81)90075-x
Vinogradov, A. E., and Anatskaya, O. V. (2006). Genome size and metabolic intensity in tetrapods: a tale of two lines. Proc. R. Soc. B 273, 27–32. doi: 10.1098/rspb.2005.3266
Wang, T., Altimiras, J., and Axelsson, M. (2002). Intracardiac flow separation in an in situ perfused heart from Burmese python Python molurus. J. Exp. Biol. 205, 2715–2723. doi: 10.1242/jeb.205.17.2715
White, C. R., and Seymour, R. S. (2005). Allometric scaling of mammalian metabolism. J. Exp. Biol. 208, 1611–1619. doi: 10.1242/jeb.01501
Wood, S. C., Johansen, K., and Gatz, R. N. (1977). Pulmonary blood flow, ventilation/perfusion ratio, and oxygen transport in a varanid lizard. Am. J. Physiol. Regul. Integr. Comp. Physiol. 233, R89–R93. doi: 10.1152/ajpregu.1977.233.3.R89
Keywords: MMR, eigenvector, pelycosaur, therapsid, microanatomy, bone
Citation: Knaus PL, van Heteren AH, Lungmus JK and Sander PM (2021) High Blood Flow Into the Femur Indicates Elevated Aerobic Capacity in Synapsids Since the Synapsida-Sauropsida Split. Front. Ecol. Evol. 9:751238. doi: 10.3389/fevo.2021.751238
Received: 31 July 2021; Accepted: 11 October 2021;
Published: 24 December 2021.
Edited by:
Michel Laurin, UMR 7207 Centre de Recherche sur la Paléobiodiversité et les Paléoenvironnements (CR2P), FranceReviewed by:
Jorge Cubo, Sorbonne Université, FranceAgustin G. Martinelli, Museo Argentino de Ciencias Naturales Bernardino Rivadavia, Argentina
Roger Seymour, University of Adelaide, Australia
Copyright © 2021 Knaus, van Heteren, Lungmus and Sander. This is an open-access article distributed under the terms of the Creative Commons Attribution License (CC BY). The use, distribution or reproduction in other forums is permitted, provided the original author(s) and the copyright owner(s) are credited and that the original publication in this journal is cited, in accordance with accepted academic practice. No use, distribution or reproduction is permitted which does not comply with these terms.
*Correspondence: Philipp L. Knaus, a25hdXNwaGlAaHUtYmVybGluLmRl