 Jiayan Ren1
 Guohe Huang
 Yongping Li
 Xiong Zhou
 Jinliang Xu
 Feng Wang
- 1State Key Joint Laboratory of Environmental Simulation and Pollution Control, China-Canada Center for Energy, Environment and Ecology Research, UR-BNU, School of Environment, Beijing Normal University, Beijing, China
- 2Environmental Systems Engineering Program, University of Regina, Regina, SK, Canada
- 3Key Laboratory of Power Station Energy Transfer Conversion and System, North China Electric Power University, Ministry of Education, Beijing, China
- 4Guangdong Provincial Key Laboratory of Water Quality Improvement and Ecological Restoration for Watersheds, Institute of Environmental and Ecological Engineering, Guangdong University of Technology, Guangzhou, China
A heat wave is an important meteorological extreme event related to global warming, but little is known about the characteristics of future heat waves in Guangdong. Therefore, a stepwise-clustered simulation approach driven by multiple global climate models (i.e., GCMs) is developed for projecting future heat waves over Guangdong under two representative concentration pathways (RCPs). The temporal-spatial variations of four indicators (i.e., intensity, total intensity, frequency, and the longest duration) of projected heat waves, as well as the potential changes in daily maximum temperature (i.e., Tmax) for future (i.e., 2006–2095) and historical (i.e., 1976–2005) periods, were analyzed over Guangdong. The results indicated that Guangdong would endure a notable increasing annual trend in the projected Tmax (i.e., 0.016–0.03°C per year under RCP4.5 and 0.027–0.057°C per year under RCP8.5). Evaluations of the multiple GCMs and their ensemble suggested that the developed approach performed well, and the model ensemble was superior to any single GCM in capturing the features of heat waves. The spatial patterns and interannual trends displayed that Guangdong would undergo serious heat waves in the future. The variations of intensity, total intensity, frequency, and the longest duration of heat wave are likely to exceed 5.4°C per event, 24°C, 25 days, and 4 days in the 2080s under RCP8.5, respectively. Higher variation of those would concentrate in eastern and southwestern Guangdong. It also presented that severe heat waves with stronger intensity, higher frequency, and longer duration would have significant increasing tendencies over all Guangdong, which are expected to increase at a rate of 0.14, 0.83, and 0.21% per year under RCP8.5, respectively. Over 60% of Guangdong would suffer the moderate variation of heat waves to the end of this century under RCP8.5. The findings can provide decision makers with useful information to help mitigate the potential impacts of heat waves on pivotal regions as well as ecosystems that are sensitive to extreme temperature.
Introduction
A heat wave, as one of the most frequent extreme events under climate warming, has caused a destructive social, economic, and ecological impacts around the world, giving rise to a number of weather-related human mortality, property losses, and ecosystem challenges (Perkins et al., 2012; Yang et al., 2013; Zhang L. et al., 2018; Zhu et al., 2018; Shiva et al., 2019; Vogel et al., 2019; Zheng et al., 2019; Ren et al., 2021a; Woolway et al., 2021). For example, northwest Atlantic was significantly affected by a heat wave occurred in 2012, which resulted in the massive loss of biological habitats, the depletion of biodiversity, the destruction of nutrient cycles, and the variation in the distribution of commercial fisheries species (Mills et al., 2013; Smale et al., 2019). A heat wave has also appreciably disrupted ecosystem services and goods (Suryan et al., 2021). In 2012, 30% of global ocean has experienced strong or severe heat waves, which increased to approximately 70% in 2016 (Hobday et al., 2018; Smale et al., 2019). Furthermore, an estimation conducted by Zhao et al. (2017) indicates that global yields of wheat, rice, maize, and soybean would be, respectively, reduced by 6.0, 3.2, 7.4, and 3.1% for each degree-Celsius increase in global mean temperature during 2029–2058 relative to 1981–2010. Several prominent heat wave events have struck many regions in recent years, conspicuous events occurred in China in 2006 and 2013 (Chen and Fan, 2007), in Europe in 2003 and 2006 (Rebetez et al., 2009), in Russia in 2010 (Hauser et al., 2016), in the United States in 2015 (Fewings and Brown, 2019), in India in 2015 (Ghatak et al., 2017), and in Australia in 2009 (Zhang et al., 2017). Heat wave activities are likely to intensify longer and severer in the coming decades, and are expected to have an increasing impact on the socioeconomic system (Perkins, 2015; Wang et al., 2018; Wu et al., 2020; Gha et al., 2021). Consequently, it is desired to project future heat waves and investigate their characteristics to provide valuable information for future mitigation and adaption strategies since they can induce an increasing threat in many parts of the world.
Warming in China has also increased at a rate of approximately 0.24°C per decade during 1951–2006, which has been almost double the global average increase of surface meant temperature at 0.13 per decade from 1956 to 2005 (Ding and Qian, 2011). Consequently, China is one of the countries that have suffered deadly heat waves in the past few decades (Chen and Fan, 2007; Sun et al., 2014; Gu et al., 2016). For instance, many cities in south China suffered high temperature that lasted 20–50 days from July to early September in 2003 (Ding and Qian, 2011). As one of the most economically developed and populated regions in China (Luo and Lau, 2017), Guangdong Province has also experienced deadly heat waves due to climate change (Wang W. W. et al., 2013; Luo and Lau, 2017; Wang et al., 2018). For example, in June–July 2004, a severe heat wave event with a maximum temperature exceeding 40°C that occurred has resulted in 39 deaths (Du et al., 2013) in the capital city of Guangdong (i.e., Guangzhou). Yang et al. (2013) explored the heat wave-related mortality in 2005 over Guangzhou and found that the average and a total number of deaths reached 12 and 145 during the heat waves, respectively. Moreover, the 2005 heat wave has led to an increase of 23% (34%) of non-accidental (cardiovascular) mortality. Thus, it is of great significance to explore the characteristics of heat waves in Guangdong in the 21st century.
Previously, there have been some studies investigating the projection of future heat waves in China (Zhou B. T. et al., 2014; Li et al., 2019; Guo et al., 2020). Based on the outputs of 24 GCMs from the coupled model intercomparison projected phase 5 (CMIP5) models under two RCPs, projected changes of temperature extremes in China have been analyzed by Zhou B. T. et al. (2014). They found that the duration of warm spell duration index would be 136 days under RCP8.5, and that, under RCP4.5, would be 87 days lower. Based on 12 GCMs, Guo et al. (2017) projected future heat waves in China and showed that the frequency and intensity of heat waves would have a more dramatic increase under more emission-intense scenarios. Li et al. (2019) projected the properties of the future heat waves over China on the basis of the multi-model ensemble of 10 CMIP5 models and illustrated that heat waves are likely to become more frequent (0.40 and 1.26 per decade) and more extreme (1.07 and 2.90 days per decade) under RCP4.5 and RCP8.5, respectively. In brief, the projected variations in heat waves are becoming more obvious.
However, in most of the previous pieces of research, the projections of future heat waves were conducted on the basis of direct outputs of GCMs. Guangdong is located in the south part of China and faces the South China Sea; strong air-sea interactions exist in coastal areas such as Guangdong, which involves small-scale climate processes that are not well-represented in GCMs due to their coarse resolution over 100 km. Furthermore, GCMs may have less than 10-grid points involved in Guangdong, which cannot reflect the climate variations sufficiently within the region. Moreover, existing studies of extreme climate events in the Guangdong were mostly focused on the characteristics of history heat waves and the associated possible influencing factors (Luo and Lau, 2017), as well as the evaluation of impacts (Du et al., 2013; Tao et al., 2013; Yang et al., 2013); the characteristics and patterns in future heat waves over Guangdong have not been assessed in detail.
Thus, as an extension of previous studies, this study aims to examine the temporal-spatial variations of future heat waves in Guangdong through a developed statistical downscaling model. It entails: (1) a stepwise-clustered simulation approach will be developed on the station scale to reproduce the high-resolution simulations in Guangdong; (2) the trend of projected daily maximum temperature (i.e., Tmax, 2006–2100) will be analyzed; (3) historical (1976–2005) and future (2006–2100) heat waves will be calculated based on the projection results; and (4) the temporal-spatial variations and trend of four heat wave indicators (i.e., intensity, total intensity, frequency, and the longest duration) will be analyzed. This study may be of great significance for the development of heat wave alert systems and the formulation of early adaptive actions to protect vulnerable regions and sensitive ecosystems in Guangdong that are exposed to the adverse effects of heat waves.
Stepwise-Clustered Simulation Approach for Projecting Future Heat Waves
To reproduce the daily maximum temperature (i.e., Tmax) for the analysis of future heat waves, a stepwise-clustered simulation approach based on the stepwise clustering analysis (i.e., SCA) is developed. The framework of the developed approach is presented in Figure 1. SCA was introduced by Huang (1992) and has been widely used in pieces of environmental research, such as climate change, air pollution, process control, and hydrology prediction (Huang et al., 2006; Wang X. Q. et al., 2013; Li et al., 2015; Wang and Huang, 2015; Fan et al., 2016; Zhuang et al., 2016; Sun et al., 2019; Zhai et al., 2019; Duan et al., 2020; Ren et al., 2021b; Wang et al., 2021). These studies have indicated the SCA has satisfactory performance in projecting environmental processes with complex non-linear and dynamic relationships. Multivariate analysis of variance is the fundamental theory of SCA (Morrison, 1967; Fan et al., 2016; Wang X. et al., 2017). The projection is realized through the establishment of a cluster tree from inputs (i.e., predictors or independent variables) to outputs (i.e., predictands or dependent variables). An SCA cluster tree will be obtained after a series iteration process of cutting and merging of dependent variables according to the specific given criteria, and independent variables are used as references in the process (Huang et al., 2006). Previously, statistical downscaling methods mostly assume that the interested dependent variable is a function of independent variables (Wilby et al., 2002; Hessami et al., 2008; Gibson et al., 2017), while the improvements of the quality of downscaled simulation reproduced through such a function are likely to be limited relative to the raw GCMs’ output owning to the complex climate system (Wilby et al., 2002; Wang X. Q. et al., 2013). However, the underlying complex relationships (including non-linear and discrete relationships) between dependent and independent variables can be revealed by the generated cluster tree without assuming the functional relationship compared to these downscaling methods (Wang X. Q. et al., 2013; Zhuang et al., 2016; Duan et al., 2020). Handling the complicated relationship among multiple dependent and independent variables at the same time is another significant advantage of SCA (Fan et al., 2015; Wang et al., 2021). In addition, heat wave, as one of the extreme climate events, the projection of which is also challenging due to the inherently complex relationship between predictors (i.e., large-scale coarse atmospheric variables) and predictands (i.e., local surface variables). Therefore, given the advantage of the SCA method and characteristics of heat waves, a stepwise-clustered simulation approach based on SCA is developed for heat wave projection in this study. Previous studies assumed that the developed relationship through the statistical downscaling method can hold for the future (Wu et al., 2017; Xu and Wang, 2019; Araya-Osses et al., 2020). Such a cluster tree then can be further employed for the projection of predictions once new predictors are available. A detailed process for SCA can be demonstrated as following five steps, which include the determination of the original inputs and outputs, establishment of the cutting and merging criterion, operation of cut and merge, output of the cluster tree and the operating rules, and projection for the study period. Following that, the developed stepwise-clustered simulation approach was used for statistically downscaling the GCMs outputs to generate high-resolution heat wave projections for Guagdong. Previous studies showed that extreme climate events (such as heat waves and temperature anomaly) were likely to become more frequent, longer duration and higher intensity during 1976–2005 and 2036–2095 over South China (including Guangdong) (Lewis and King, 2016; Almazroui et al., 2021; Ren et al., 2021b). Thus, to provide comparability results, outputs from the GCM projections are expected and divided into three 30-year periods, including the historical period (i.e., 1976–2005) and the future period (i.e., 2036–2065, 2050s; 2066–2095, 2080s) under RCP4.5 and RCP8.5. Variations of future climate in comparison with the historical period were then investigated to help better understand the possible future changes in heat waves.
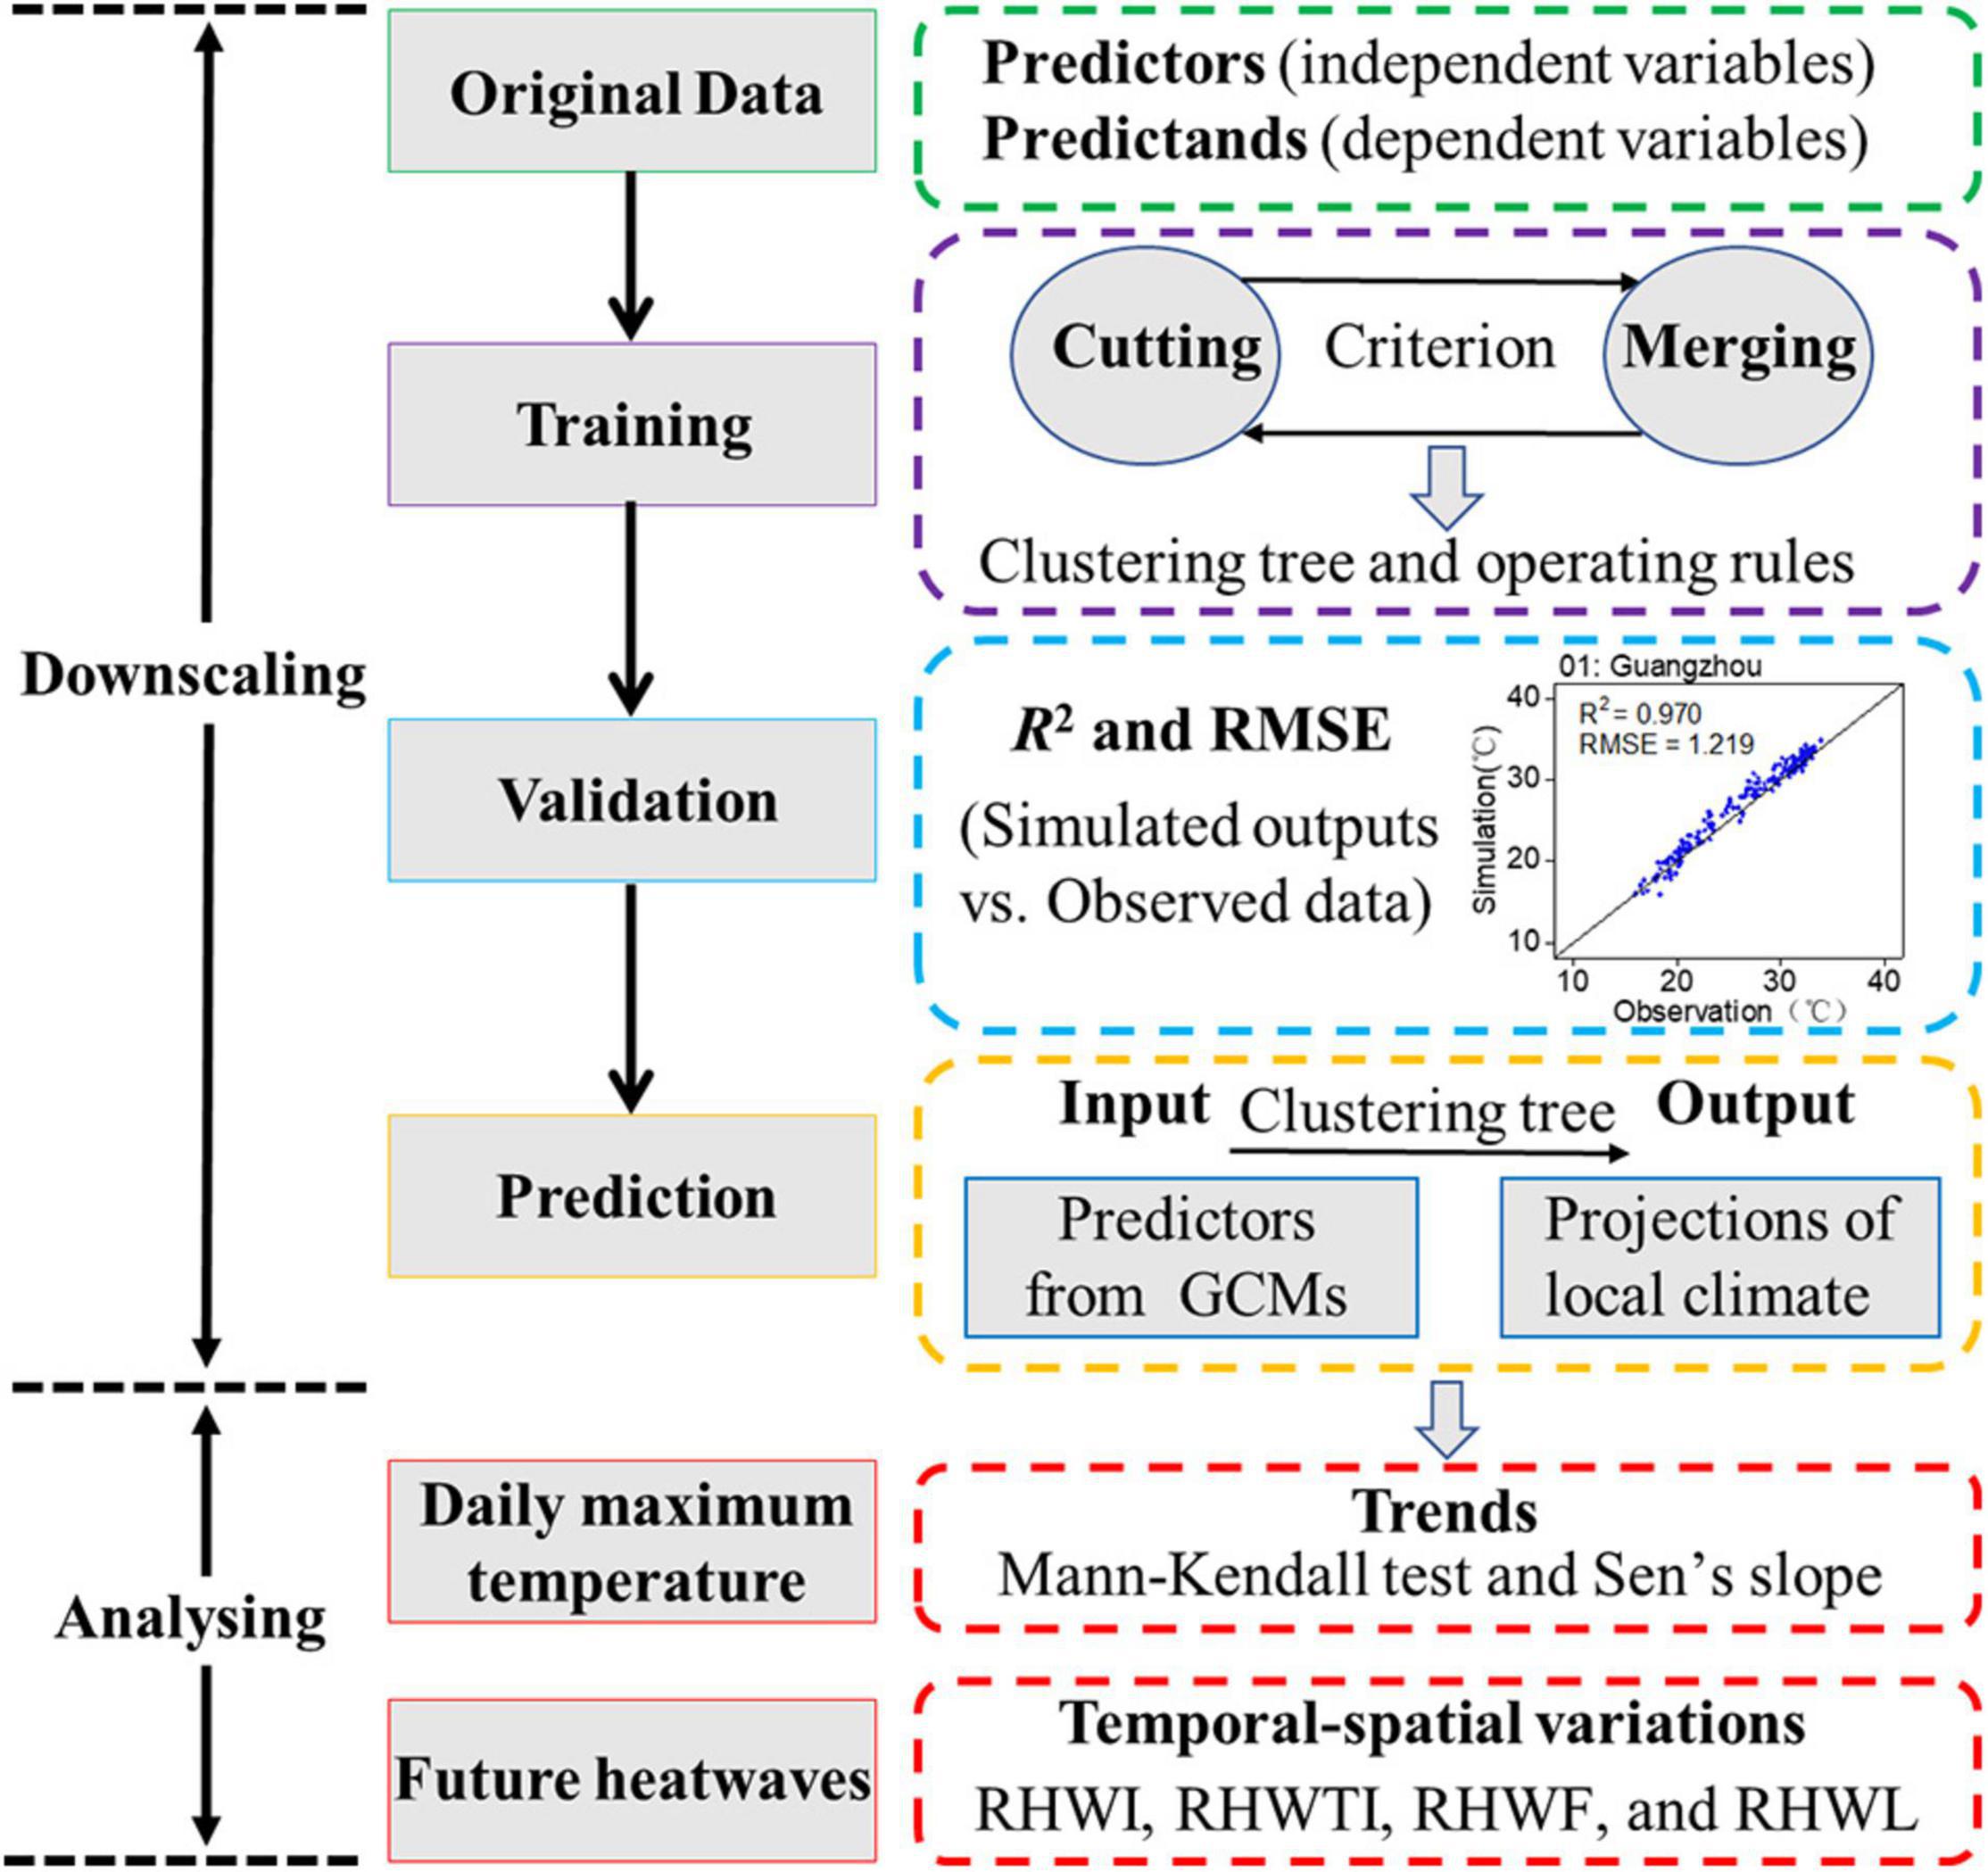
Figure 1. The framework of the developed stepwise-clustered simulation approach.
The coefficient of determination (R2) measures of the extent of a model explains variations in the data; the root mean squared error (RMSE) evaluates the variance of errors independent of sample size and characterizes the difference between simulations and observations. In this study, the performance of the developed approach for projecting future heat waves is evaluated based on the R2 and RMSE values. The reliability of the approach increases as R2 approaches one, and when it is equal to one, which indicates that all variations can be explained. In terms of RMSE, when the fit between simulations and observations is perfect, the RMSE would have a value of zero. Thus, the lower the value (close to zero), the better performance of the approach. R2 and RMSE have been broadly used in the evaluation of climatic or hydrological models (Fan et al., 2015, 2016, 2017; Wang and Huang, 2015; Zhou et al., 2018; Sun et al., 2019; Zhai et al., 2019; Duan et al., 2020; Li et al., 2020; Pramod et al., 2021). To assess the ability of the developed approach in reproducing the observations, the R2 and RMSE were used in this study and expressed as follows:
where n is the sample number in the training or validation dataset; Oi and Si are the observed and simulated values in the ith sample, respectively; and itch are the averages of Oi and Si, respectively.
The Mann—Kendall test (i.e., MK test) is one of the most populated method for evaluating the variation trends in climatic studies (Gupta et al., 2018; Zhai et al., 2019; Mukherjee and Mishra, 2020; Farooq et al., 2021; Zhou et al., 2021). The MK test is a non-parametric procedure due to its advantages in considering the distribution of time series data as well as processing outlies (Mann, 1945; Kendall, 1948); the MK test is used to investigate the trends of variables (i.e., Tmax and heat wave indicators) in this study. A null hypothesis (H0) assumes that time series of variables are specifically distributed contrary to the alternative hypothesis (H1), which demonstrates an increasing or declining trend. The temporal trend of the MK test is identified based on the standardized test static (i.e., denoted as Z) as follows:
where Xi and Xj are the consecutive time series of the variables (i.e., Tmax and heat wave indicators), and n is the time series length of the variable. Z is the Kendall’s test statistic; it can be an increasing trend (positive), a declining trend (negative), or a no trend (zero). The statistical significance of the trends is determined by the Zij, and the H0 of no trend will be rejected when the absolute value of Zij is larger than 1.96. See Farooq et al. (2021) for more detailed information about the MK test.
Sen’s slope is a non-parametric estimator that is applied to obtain variations in trends of the variable in a time series (Sen, 1968). In this study, the variables are Tmax and heat wave indicators. The rate of variation (Qmed) was calculated from the slopes (S) of all consecutive pairs of data (N).
The data trend is reflected by the Qmed sign, and a positive value of Qmed demonstrates an increase in variation, and vice versa.
An Overview of the Study Area
Guangdong Province (109°39′–117°19′E and 20°13′–25°31′N) is located in the south part of China and faces the South China Sea and adjacent to Macau and Hong Kong (Figure 2). Guangdong has a total area of about 1.798 × 10⁵ km2, with the total population of 0.115 × 10³ million at the end of the year 2019 (Guangdong Statistical Yearbook, 2020). Guangdong has experienced rapid urbanization and developed as one of the largest economic provinces of China since 1989 (Luo and Lau, 2017; Liu et al., 2019; Yu et al., 2019). Continued urbanization throughout Guangdong contributes to the heat-island effect, and the occurrence, intensity, and duration of heat waves are expected to increase under climate warming (Zeng et al., 2006; Sun et al., 2012; Luo and Lau, 2017).
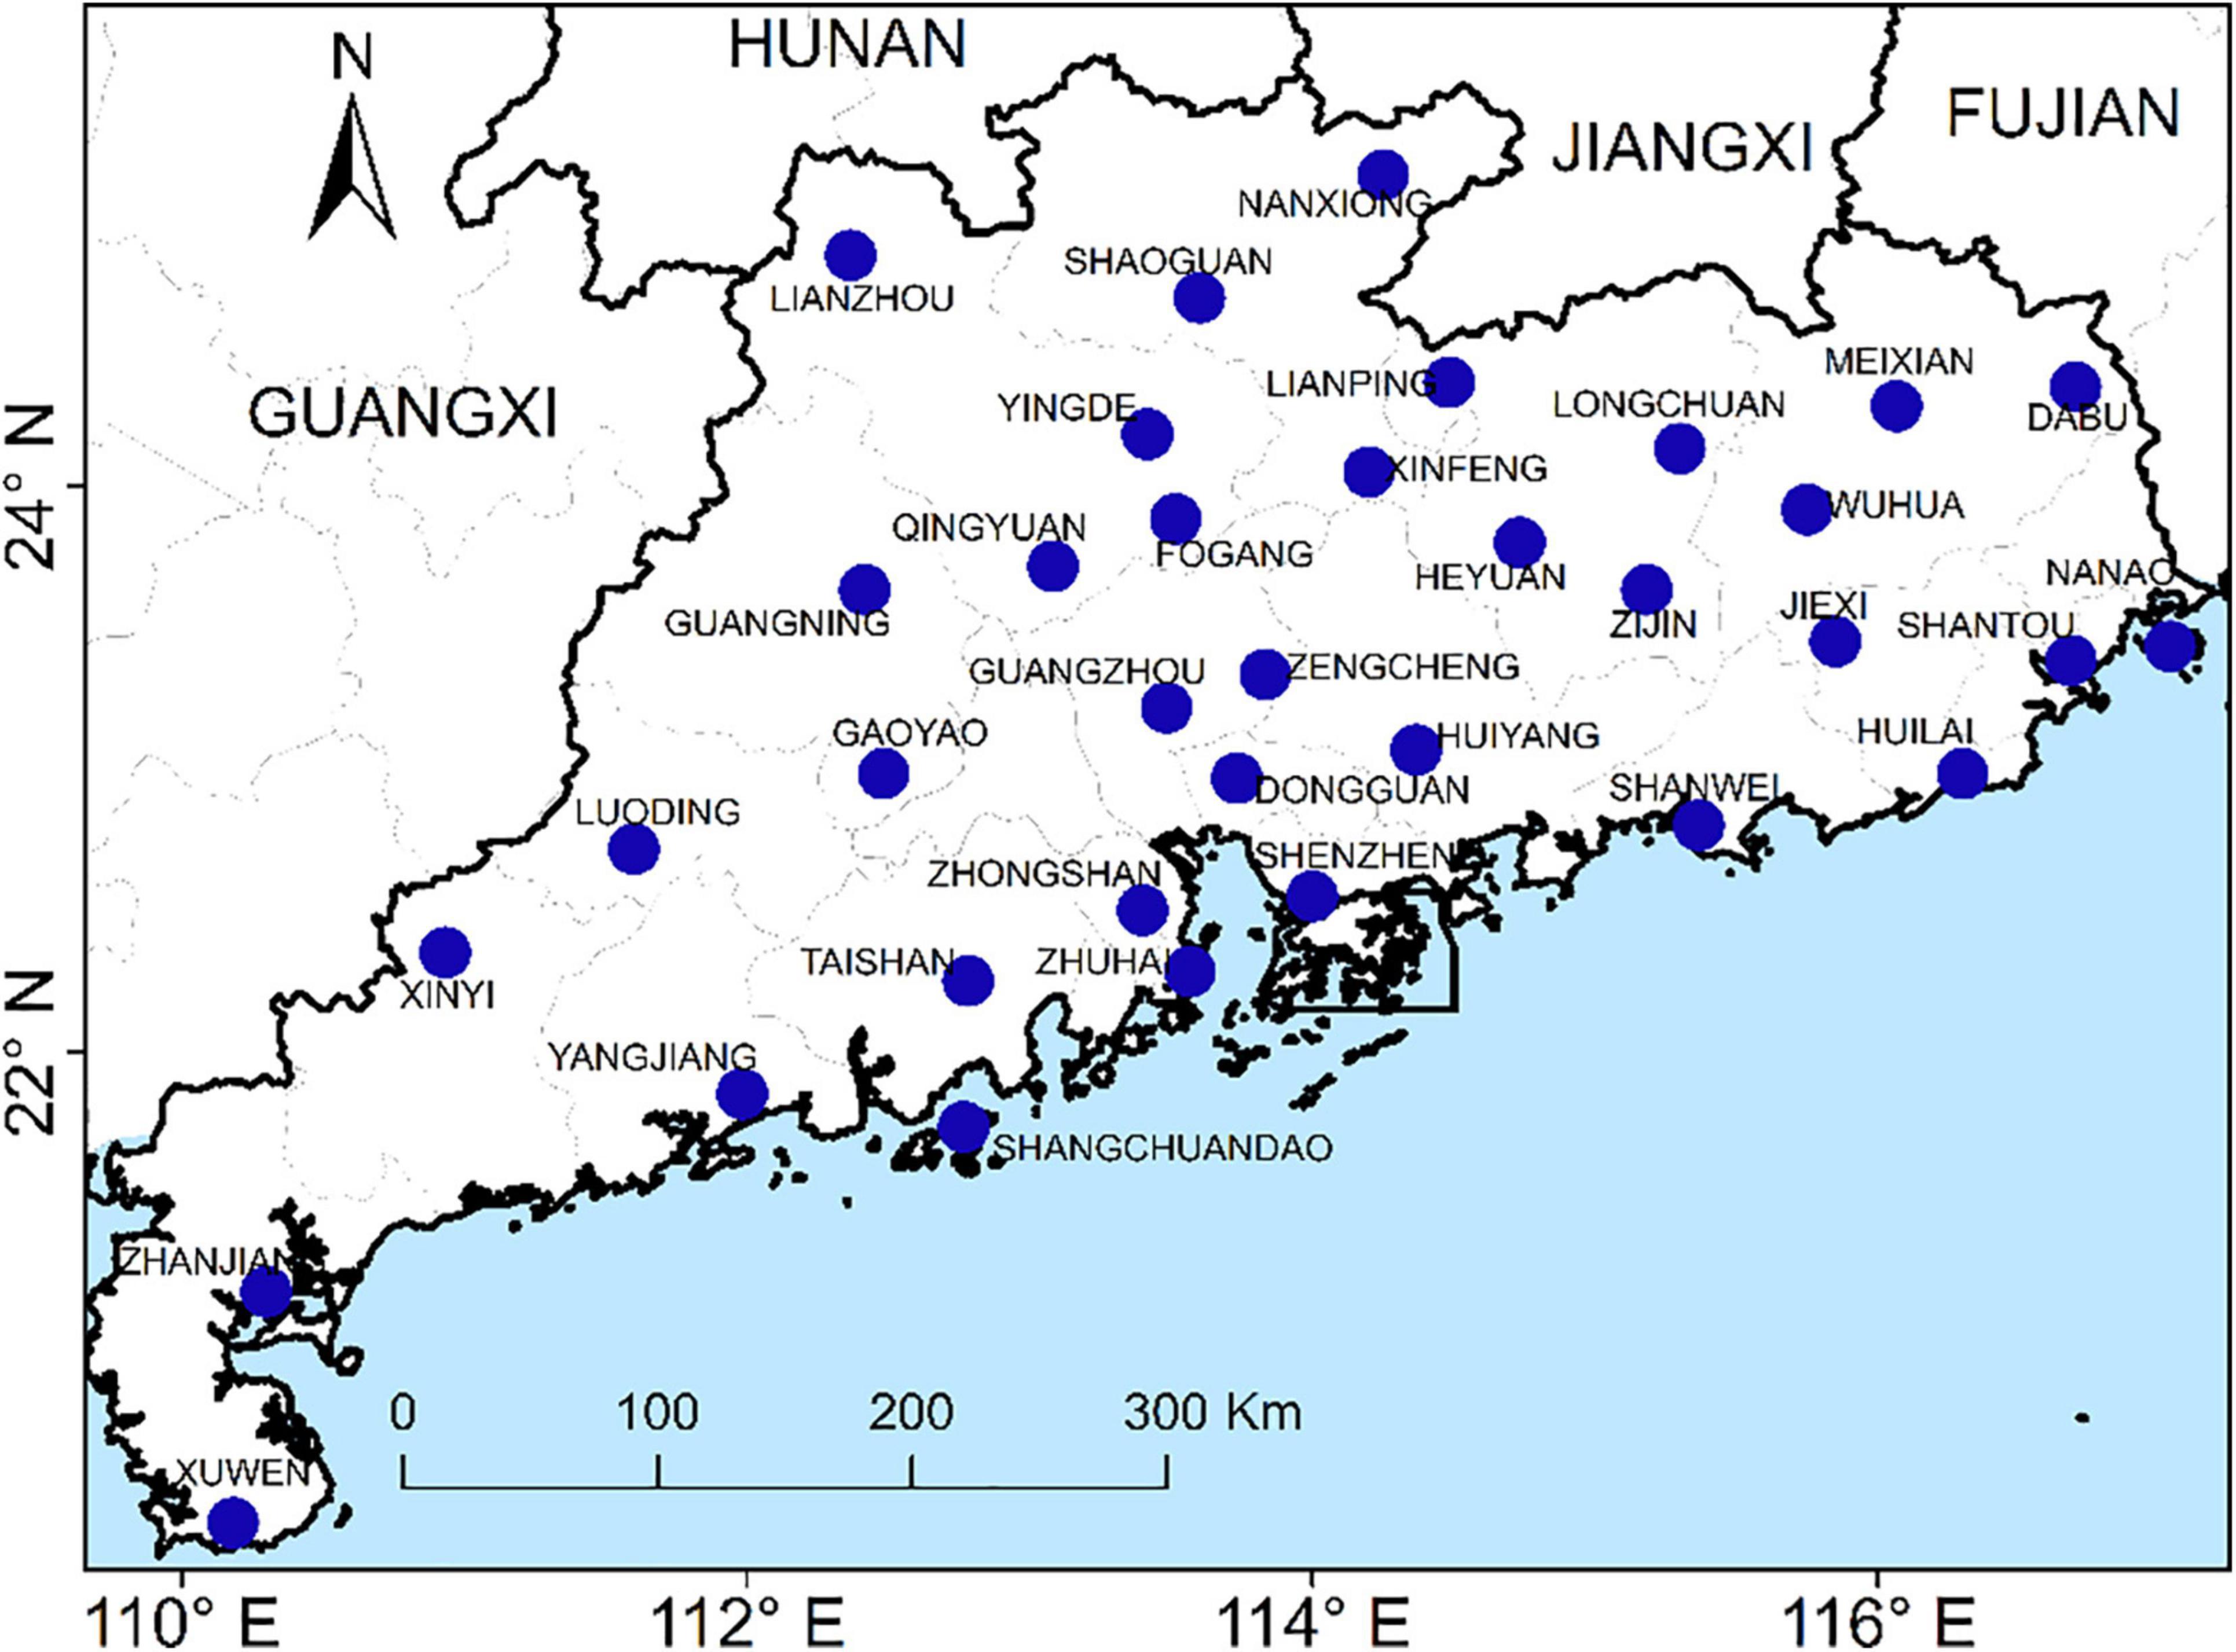
Figure 2. Geographical positions of the 16 weather stations over Guangdong Province, China.
Guangdong is characterized by typical tropical and subtropical climates. Its climate has been changing dynamically due to the close relationship with large-scale atmospheric activities, such as East Asian monsoon and the North Pacific subtropical high (Luo and Lau, 2017). From 1976 to 2005, the average summer temperature is 32.3°C at 35 stations over Guangdong, while this in winter is 19°C. Guangdong has experienced a fluctuating rise in temperature since the 1980s. With the variation of average annual temperature as high as 0.03°C per year, the Pearl River Delta region is the main warming area of Guangdong (Yu et al., 2007). During 1986–2015, the annual temperature is 22°C (Wu et al., 2019). The annual precipitation is over 1,300 mm, nearly 60% of which is concentrated in the rainy season (i.e., June–August) (Wu et al., 2019). The surface air temperature increased at a rate of 0.13°C per decade in the capital of Guangdong (i.e., Guangzhou) during 1951–2004, while it is expected to increase rapidly in Guangdong in the coming decades (Liu et al., 2019). In the long-term adaption to climate change, Guangdong has experienced extreme climate events, such as heat waves, drought, and coastal flooding, which have resulted in losses and threats to the lives and safety (Zhu et al., 2014; Xu and Wang, 2019; Yu et al., 2019; He et al., 2020). For instance, Yang et al. (2013) investigated the impact of a diurnal temperature range on mortality in the capital of Guangdong and concluded that the increase in diurnal temperature of 1°C at 0–4 lag days would induce a 0.47% increase in non-accidental mortality. In addition, Zhang L. et al. (2018) quantified the mortality effects of future heat waves on human health; they found that the average annual loss of the elders (≥65) would be 1,675 deaths per million in Guangzhou during 2051–2095 under RCP. Climate warming will induce extreme disastrous impacts to coastal cities, such as a sea level rise, the expansion of storm surge inundation areas, and ecosystem degradation of coastal wetlands, mangroves, and reefs (He et al., 2012; Rahmoun et al., 2016). He et al. (2012) assessed the sea level rising in China; the investigation illustrated that the sea level in Guangdong rose by 20 mm during 2001–2010 relative to 1991–2000. Moreover, it is estimated that, in 2030 and 2050, the average increase of the sea level in the Pearl River Delta will be approximately 20–33 and 50 mm, respectively. According to the prediction of Li et al. (1993), the low altitude of 1,500 km2 below 0.4 m in the Pearl River Delta would be completely submerged when the sea level rises to 0.7 m in the middle of 21st century. Thus, it is desired to improve our understanding of future heat waves in Guangdong and provide helpful guidance for improving our ability in projecting the variations of heat waves in that region.
In this study, 35 weather stations are selected. For each weather station, the observed Tmax from 1976 to 2005 was obtained from the National Meteorological Information Center.1 The quality of the raw Tmax dataset was checked before analysis and used as a predictand of the heat wave downscaling model. The variables of reanalysis dataset were acquired through the National Centers for Environmental Prediction (NCEP/NCAR)2 and were used as large-scale atmospheric predictors (Table 1). Through the correlation analysis, the seven most relevant large-scale atmospheric variables were chosen as predictors of Tmax (i.e., the bold font). The NCEP/NCAR dataset has been derived from the interpolation of daily observations since 1948 with a resolution of 2.5° × 2.5° (Kalnay et al., 1996). It has been used in many branches of climatological research (Simmons et al., 2004; Luo and Lau, 2017; Wang P. et al., 2017; Zhai et al., 2019), and its reliability is better for surface air temperature in the southern and eastern parts of China (Xu and Ding, 2001; Shi et al., 2007). The associated data (i.e., predictors and prediction) supporting the development of the heat wave downscaling model for the same period (i.e., the historical period, 1976–2005) were extracted. In addition, these data were further divided into two 15-year subsets, including 1976–1990 and 1991–2005. The former set was used for the training of the developed model, and the latter one was used to validate the performance of the developed model.

Table 1. A list of NARR variables selected as predictors for Tmax.
Daily gridded data from the four GCMs, i.e., Centre National de Recherches Météorologique CNRM-CM5 Model 5 (i.e., CNRM-CM5), Commonwealth Scientific and Industrial Research Organisation Mark 3.6.0 (i.e., CSIRO-Mk3.6.0), Institut Pierre Simon Laplace Model CM5A-MR (i.e., IPSL-CM5A-MR), and Model for Interdisciplinary Research on Climate Version Five (i.e., MIROC5) were downloaded from the CMIP5 dataset to analyze the future variations of heat waves in Guangdong (Li et al., 2019; Xu and Wang, 2019; Ren et al., 2021b). The four GCMs cover the historical and future simulations data under different emission scenarios. Their scenarios were developed based on their end-of-century radiative forcing, including RCP 2.6, RCP4.5, RCP 6.0, and RCP 8.5. Among which, RCP 4.5 is a stabilization scenario—its stabilization without an overshoot pathway to 4.5 Wm–2 at stabilization after 2100 (Clarke et al., 2007). RCP8.5 represents a high-emission global warming scenario; the rising radiative forcing would lead to 8.5 Wm–2 by the end of 21st century (Adeniyi, 2016). In this study, the four GCMs are re-gridded to the coarsest resolution (NCEP/NCAR data) through the bilinear interpolation method (Zhai et al., 2019). They were then extracted for the periods of 1976–2005 (i.e., historical) and 2006–2100 (i.e., under RCP4.5 and RCP8.5). The extracted data were used to develop the heat wave downscaling model and project the future heat wave. Especially, to provide comparability results, the GCM data from 1991 to 2005 (i.e., the validation period) were also prepared.
In general, a heat wave event is defined as a period during which the daily temperature (e.g., daily temperature of maximum, minimum, and mean) exceeds its threshold temperature and consecutive several days (Perkins et al., 2012; Wang P. et al., 2017; Shiva et al., 2019; Woolway et al., 2021). In this study, the daily maximum temperature (i.e., Tmax) exceeds the corresponding relative threshold for at least 4 consecutive days, which was used as the criterion to identify heat wave events in Guangdong and denoted as relative heat wave events (i.e., RHWs). The relative threshold (i.e., the 90th percentile of Tmax) was calculated based on centered 21-day moving window samples with observations during May to December in the historical period (i.e., 1976–2005). The total samples are 4,590 days (153 × 30). Following previous studies (Perkins et al., 2012; Pezza et al., 2012; Guo et al., 2017; Luo and Lau, 2017; Wang P. et al., 2017; Oliver et al., 2018; Fenner et al., 2019; Shiva et al., 2019), four indicators (i.e., intensity, total intensity, frequency, and the length of the longest event of RHW) are measured to quantify the properties of relative heat waves; their definitions are as follows:
• Average intensity of heat wave (RHWI): the average intensity of heat waves within a year, i.e., the average of cumulative value of the temperature biases when the daily maximum temperature exceeds its threshold temperature during the heat wave event within a year, calculating by averaging all participating event days; Eq. 5 summarizes the definition of RHWI (unit: °C/event).
• Total intensity of heat wave (RHWTI): the total intensity of heat waves within a year, i.e., the cumulative value of the temperature biases when the daily maximum temperature exceeds its threshold temperature during the heat wave event within a year; Eq. 6 summarizes the definition of RHWTI (unit: °C).
• Frequency of a heat wave (RHWF): the total number of days within a year that meet the relative heat wave criterion; Eq. 7 summarizes the definition of RHWF (unit: °C).
• The longest heat wave event (RHWL): the length of the longest heat wave event within a year; Eq. 8 summarizes the definition of RHWL (unit: days).
where N is the total number of occurred RHW during the study period. Tij is the Tmax on Day j in the RHW, and TRij is the corresponding threshold temperature of Tij. The intensity of heat wave i is the sum of the temperature biases that exceed its threshold values during the duration Di. And max(Di) is the length of the longest RHWs within a year.
Results
Evaluation of the Statistical Downscaling Model
In this study, the stepwise-clustered simulation approach is developed and used for the heat wave downscaling. The 1976–2005 period is divided into two 15-year sets: 1976–1990 and 1991–2005, with one set used for training and the other for validation. To validate the performance of the developed model, the downscaling results for Tmax are shown with the corresponding simulations during 1991–2005 (Figures 3, 4, 5). In this study, 16 weather stations spatially distributed across Guangdong were selected as examples to present the associated results. Figure 3 shows the validation results of the downscaling model. The determination coefficient (i.e., R2) and RMSE between the NCEP reproduced dataset through the downscaling model and observations were calculated for the 16 weather stations. The R2 values range from 0.950 to 0.987, and the RMSEs of all stations range from 0.863 to 1.730°C, evidencing that the NCEP-trained approach exhibits outstanding performance.
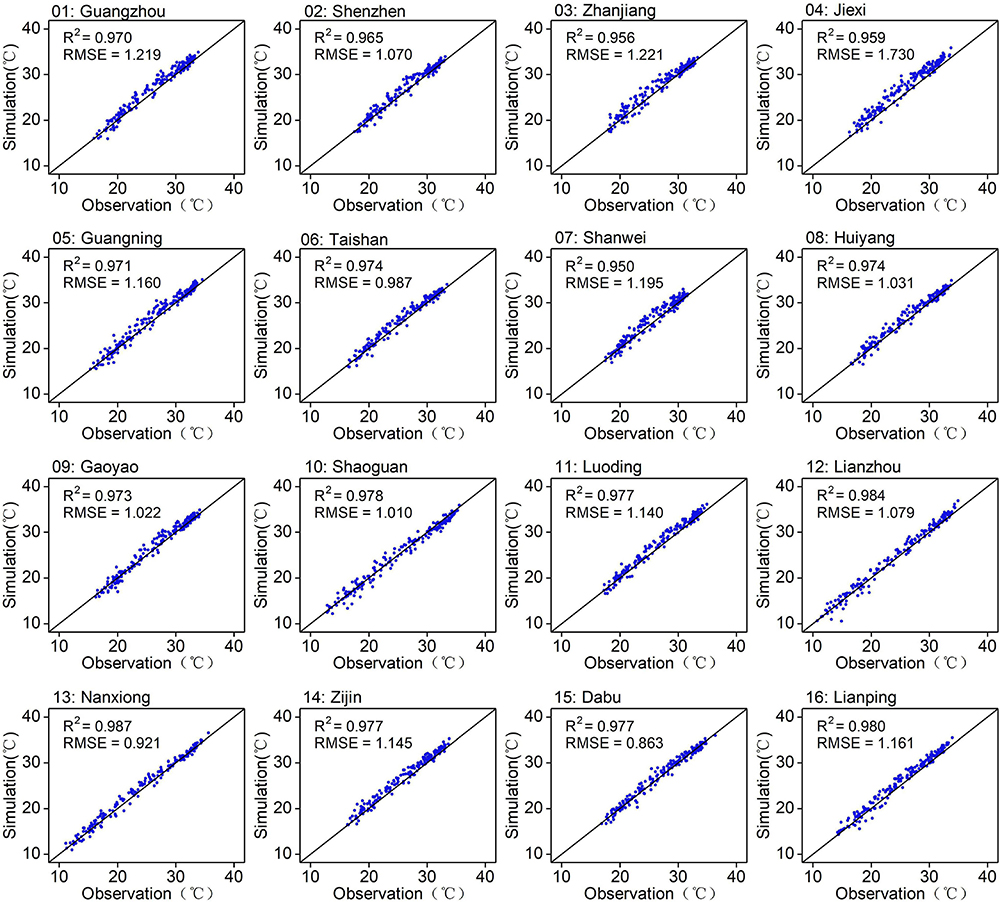
Figure 3. Evaluation results for multiyear monthly average of Tmax between observed and NCEP/NARR reanalysis at the 16 selected weather stations, 1991–2005.
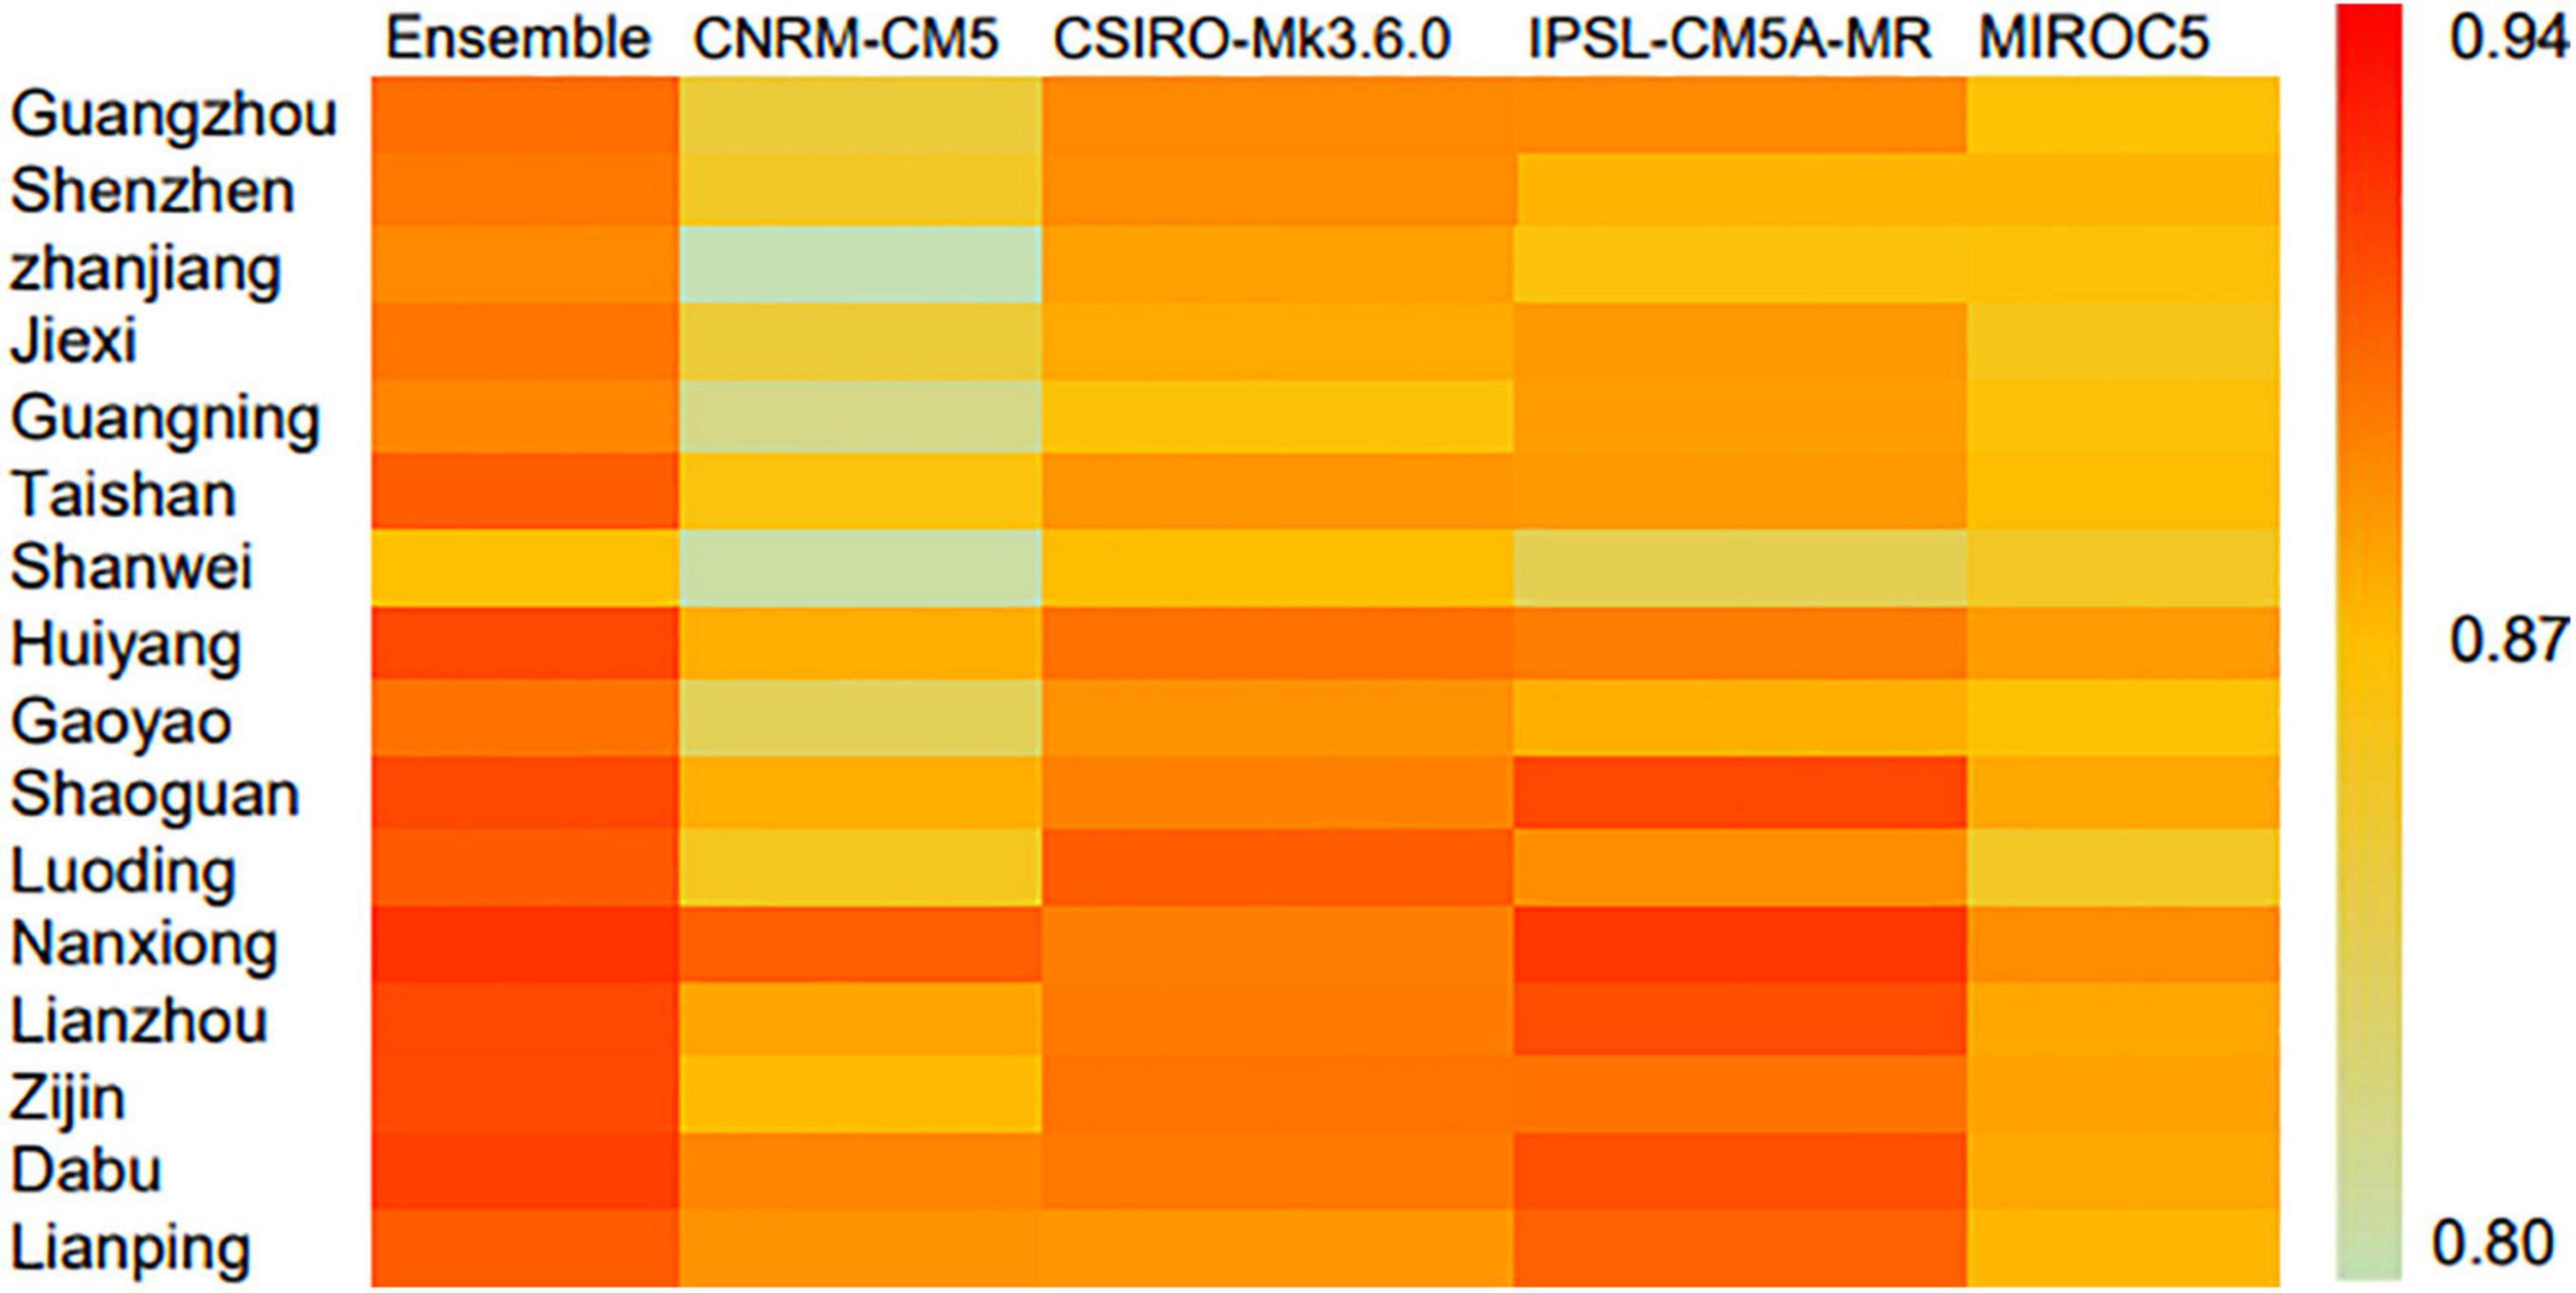
Figure 4. Comparisons of the monthly average between observed Tmax and downscaled outputs from CNRM-CM5, CSIRO-Mk3.6.0, IPSL-CM5A-MR, MIROC5, and their ensemble, 1991–2005 [color bars represent the coefficient of determination (R2) value between observed Tmax and downscaled outputs].
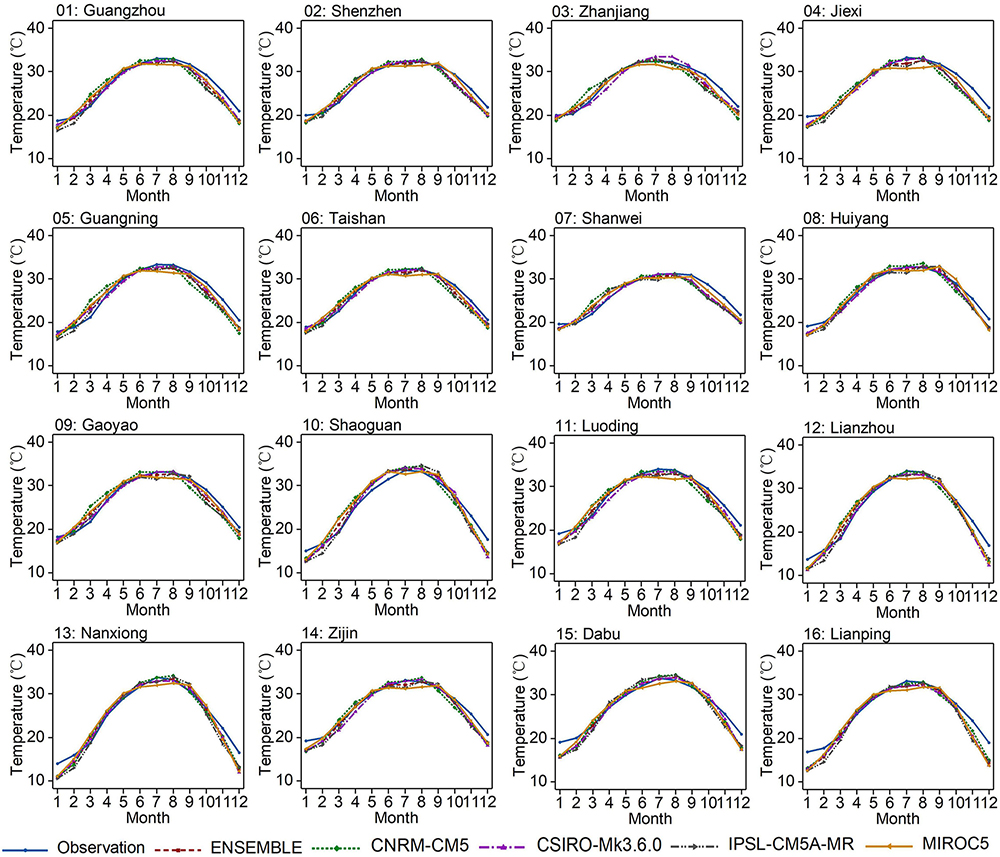
Figure 5. Monthly variations of the observed Tmax and downscaled values for GCMs and their ensemble at the 16 selected weather stations, 1991–2005.
To validate the performance of the developed model, the R2 values for the monthly average between the simulations of the four GCMs (i.e., CNRM-CM5, CSIRO-Mk3.6.0, IPSL-CM5A-MR, MIROC5, and their model ensemble) and the observed Tmax are also represented in Figure 4. Although the performance of the developed approach displays variations among stations over Guangdong, it can reproduce Tmax well. For instance, the maximum R2 value of 0.923 is related to the reproduced Tmax from the model ensemble. The results implied that the model ensemble can be an effective tool in the case of reproducing the observed Tmax at the 16 selected weather stations over Guangdong. Previous studies have also found the use of model ensemble reduced more the bias in the evaluation than using only a single GCM, thereby improving the reliability of climate projections (Webber et al., 2018; Qian et al., 2020; Ma et al., 2021). Similarly, it can be found that the developed approach also demonstrates significant performance in reproducing the observed Tmax from the four GCMs at the 16 selected weather stations (Figure 5). The comparison results of the monthly variations between the observed Tmax and reproduced values from GCMs during 1991–2005 possess similar trends, which means that the developed approach has significant ability in capturing present-day Tmax, especially for those reproduced by the model ensemble in the periods from May to October. In addition, Tmax is somewhat over- and underestimated by the single GCM. In detail, Tmax is somewhat overestimated by the CNRM-CM5 from March to April (e.g., Guangning and Shanwei), and underestimated by the MIROC5 during July to August (e.g., Nanxiong and Zijin). This is mainly due to the uncertainty of the model, which may be induced by differences in the model parameterization, emission concentration scenarios, and internal climate variability (Zhai et al., 2019; Ma et al., 2021). Therefore, it is essentially recommended to present the Tmax with the model ensemble from multiple GCMs’ outputs to reduce potential biases.
Characteristics of the Projected Daily Maximum Temperature
Projections of future temperature from the ensemble of four GCMs (i.e., CNRM-CM5, CSIRO-Mk3.6.0, IPSL-CM5A-MR, and MIROC5) are resulted from the developed approach. The characteristics of the projected Tmax in Guangdong are shown in Figures 6, 7, 8, 9 and Table 2. Figures 6, 7 provide the monthly trend of the projected average of Tmax at the 16 selected weather stations from 2006 to 2100 under RCP4.5 and RCP8.5. The trend of the projected Tmax is obtained by fitting the monthly time series data of each weather station using the lowess method (Zhai et al., 2019), which is displayed as a smooth bold red line. It provides a better understanding of the possible variations of future Tmax. The results indicate that there is a consistent increase at all 16 weather stations under RCP4.5 and RCP8.5. In detail, the highest increasing trend of the Tmax is likely to occur at Shaoguan (Nanxiong) under RCP4.5 (RCP8.5). Moreover, Table 2 provides the trends of seasonal (spring, summer, autumn, and winter) and annual average of Tmax through the Mann–Kendall statistics and Sen’s slope estimator test for 16 selected weather stations. These two test methods have been extensively used by previous studies to explore monotonic trends in climatic time series (Zhai et al., 2019; Farooq et al., 2021). It is pretty evident that all stations suggest significant increasing trends for their respective mean seasonal and annual of Tmax, with MK-p values less than.001. It indicated that Guangdong is likely to experience a warmer future. The increase is various among stations under RCP4.5 and RCP8.5. For instance, of all the seasons under two RCPs, the most remarkable increase is detected in spring, lesser in winter and summer, followed by autumn. Besides, Shaoguan presents the highest increasing trend of 0.075°C per year during summer under RCP8.5. On the annual time scale, the increase varies between 0.016°C per year (i.e., at Zhanjiang) and 0.030°C per year (i.e., at Shaoguan) under RCP4.5, while these range from 0.027°C (i.e., at Lianzhou) to 0.057°C (i.e., at Nanxiong) per year under RCP8.5. This is consistent with previous pieces of research that the climate in Guangdong will become warmer in the future (Sutton, 2009).
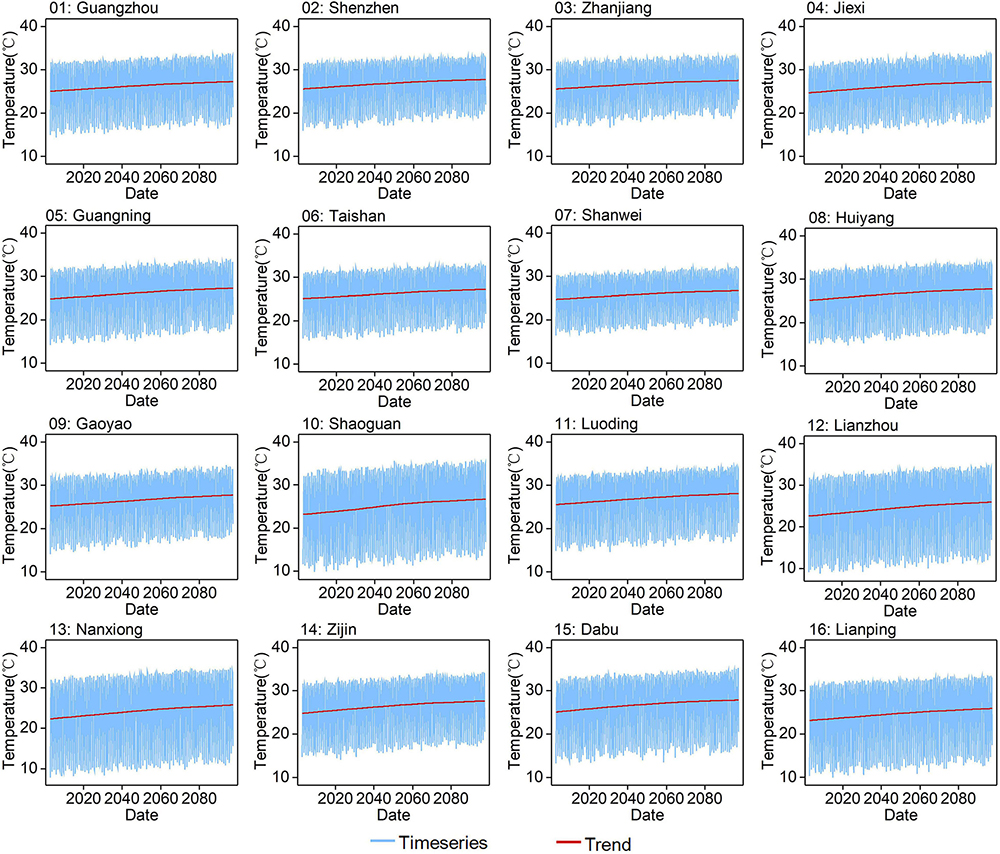
Figure 6. Monthly projected Tmax of the ensemble of GCMs (i.e., CNRM-CM5, CSIRO-Mk3.6.0, IPSL-CM5A-MR, and MIROC5) from 2006 to 2100 under RCP4.5.
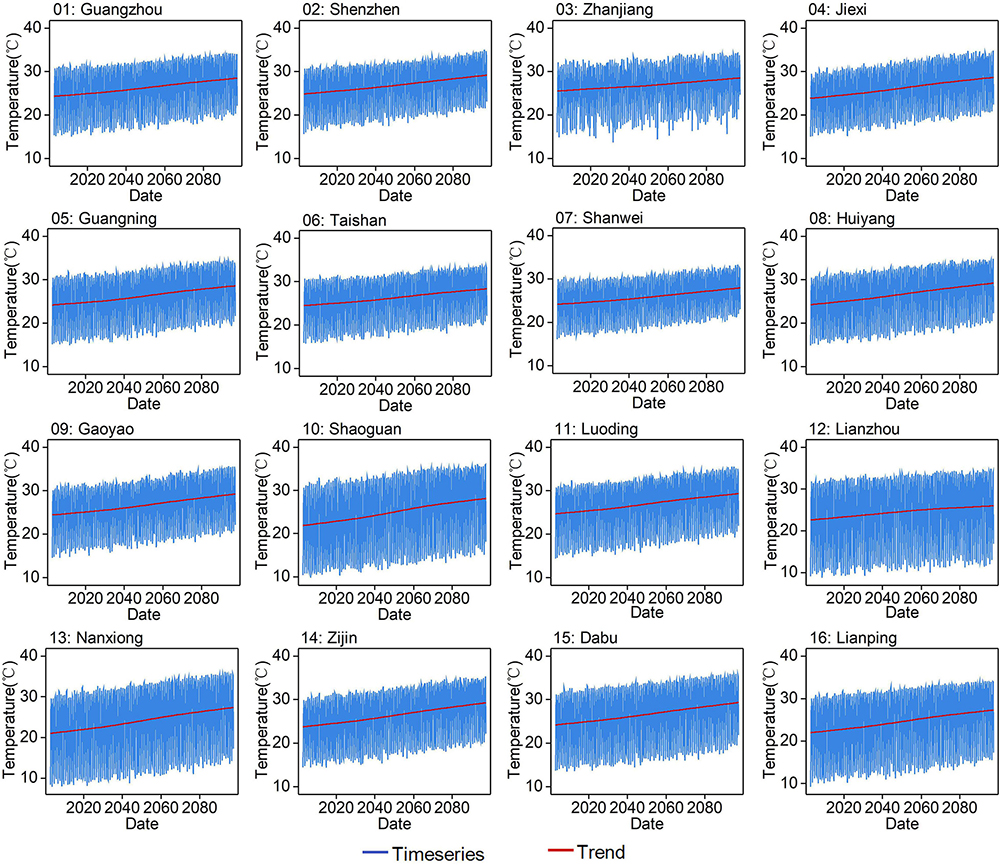
Figure 7. Monthly projected Tmax of the ensemble of GCMs (i.e., CNRM-CM5, CSIRO-Mk3.6.0, IPSL-CM5A-MR, and MIROC5) from 2006 to 2100 under RCP8.5.
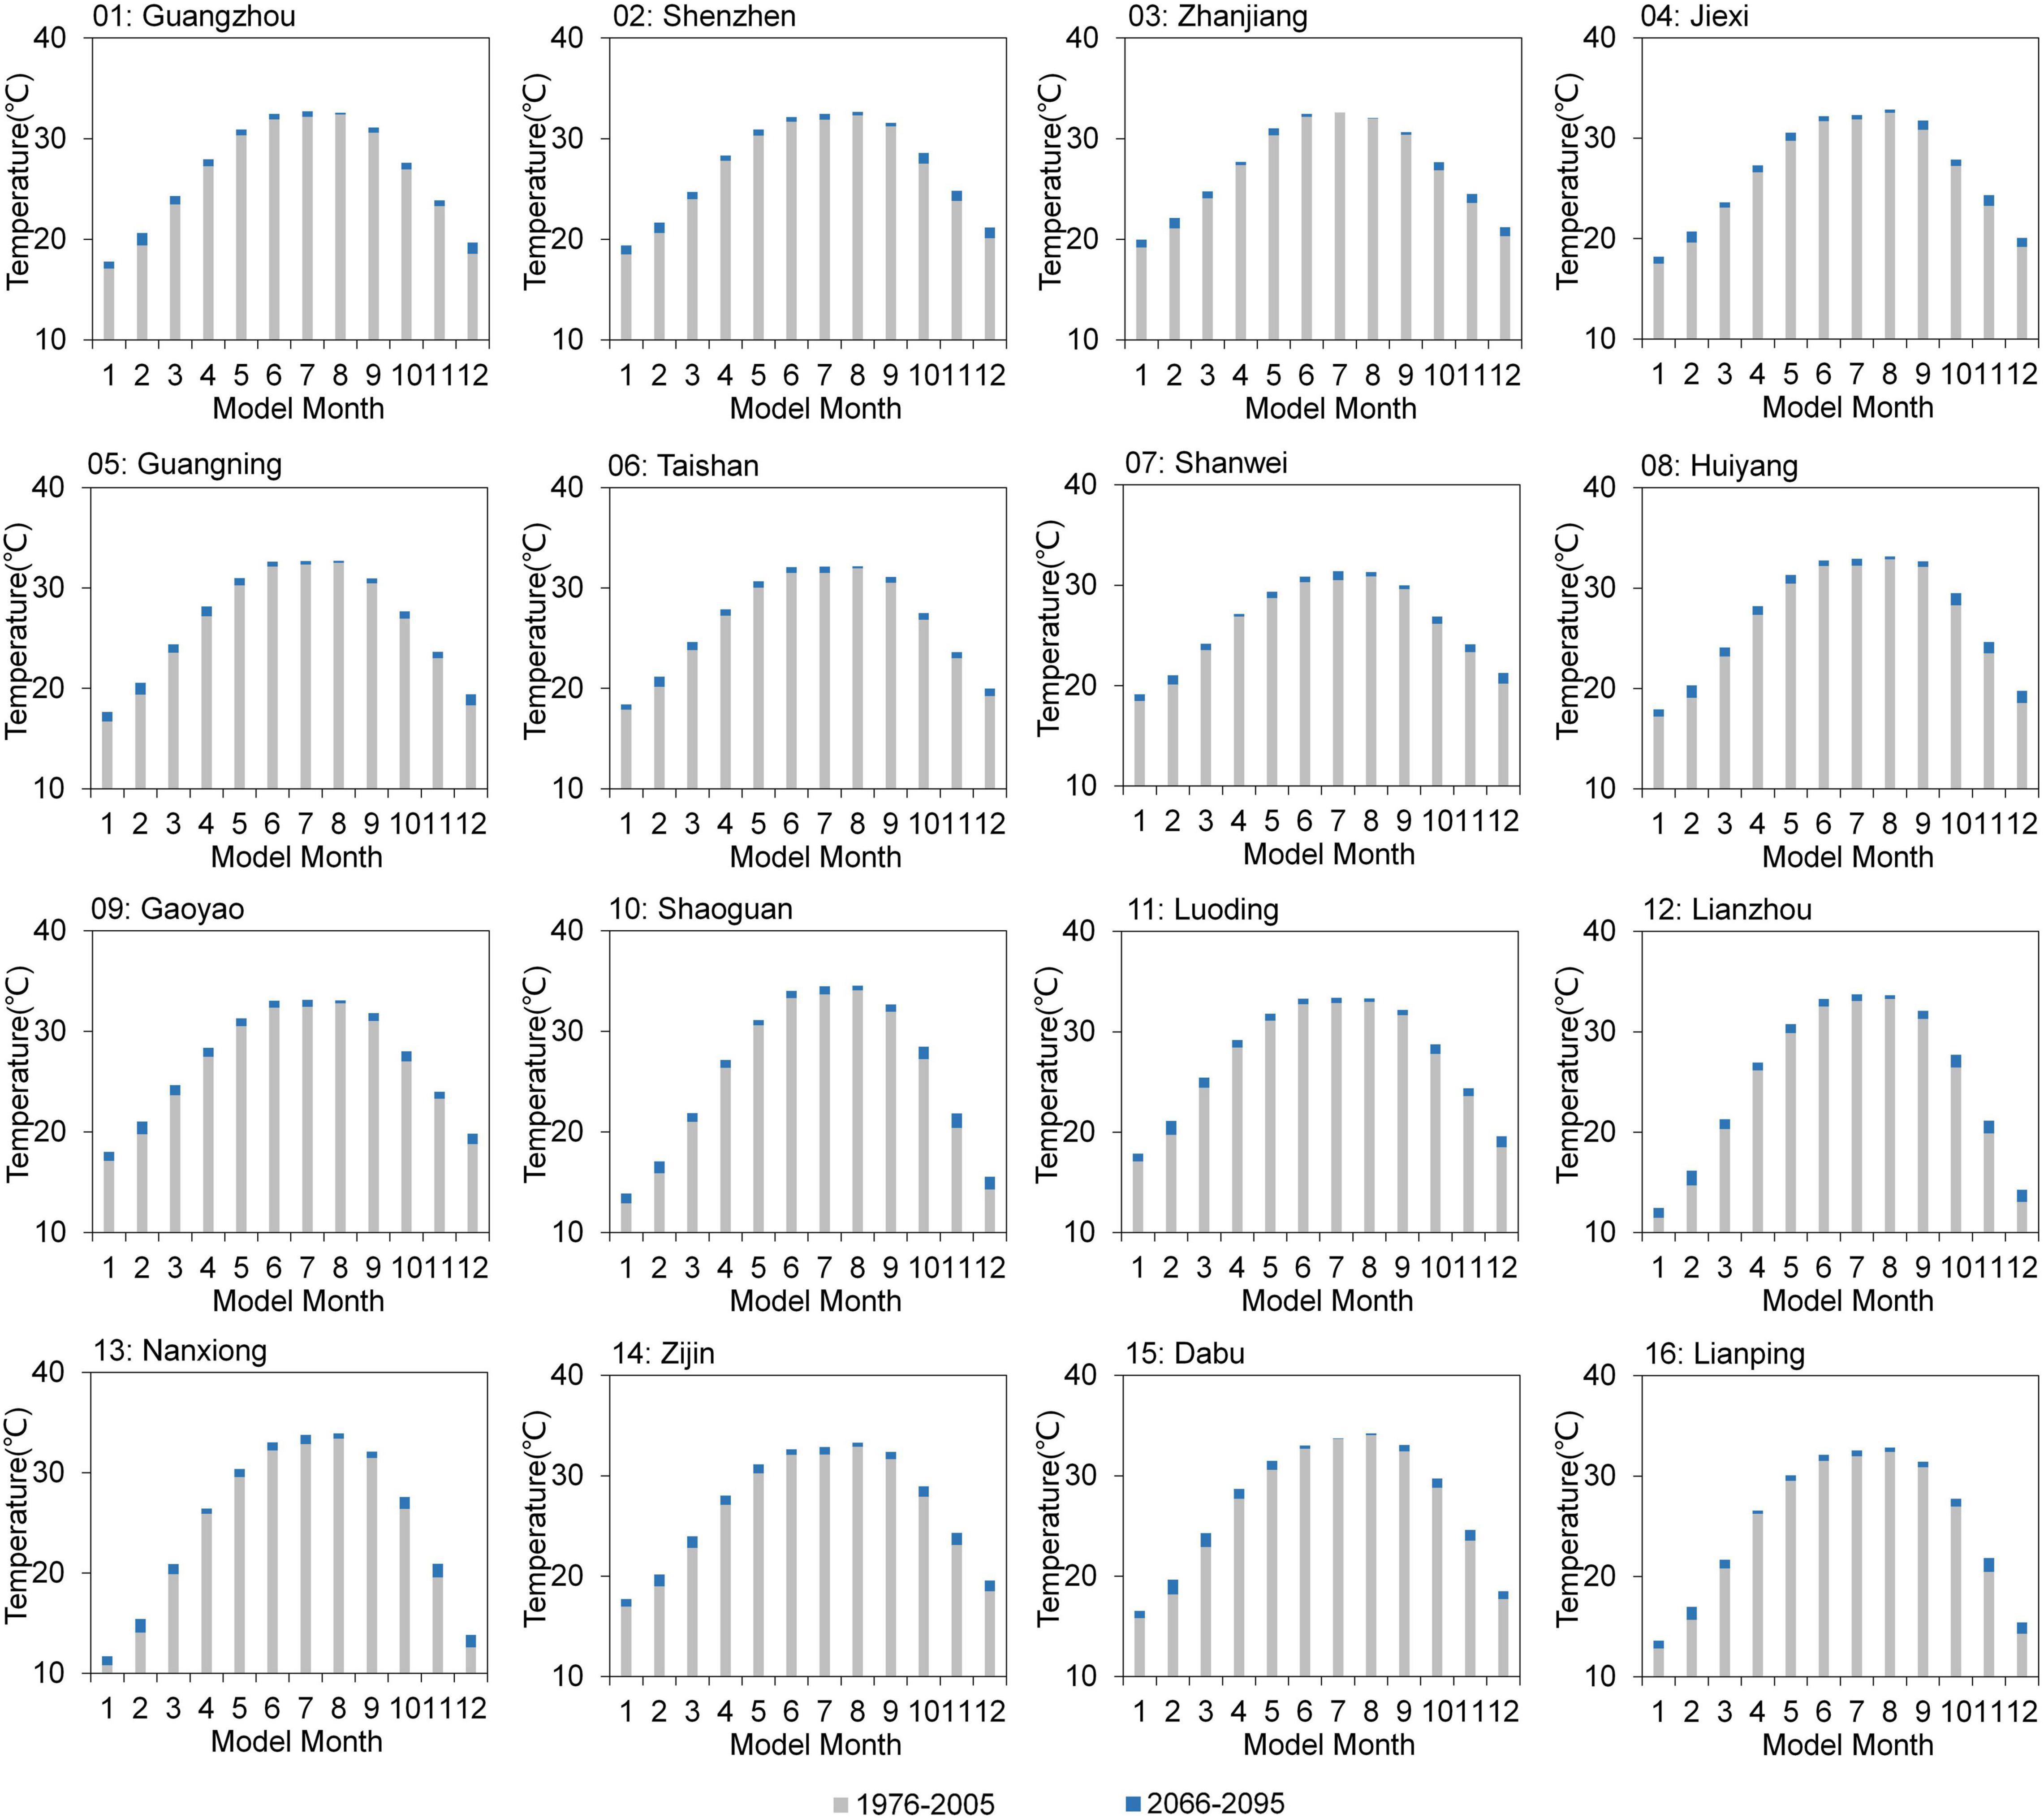
Figure 8. Projected monthly variations of Tmax between 2066–2095 and 1976–2005 under RCP4.5.
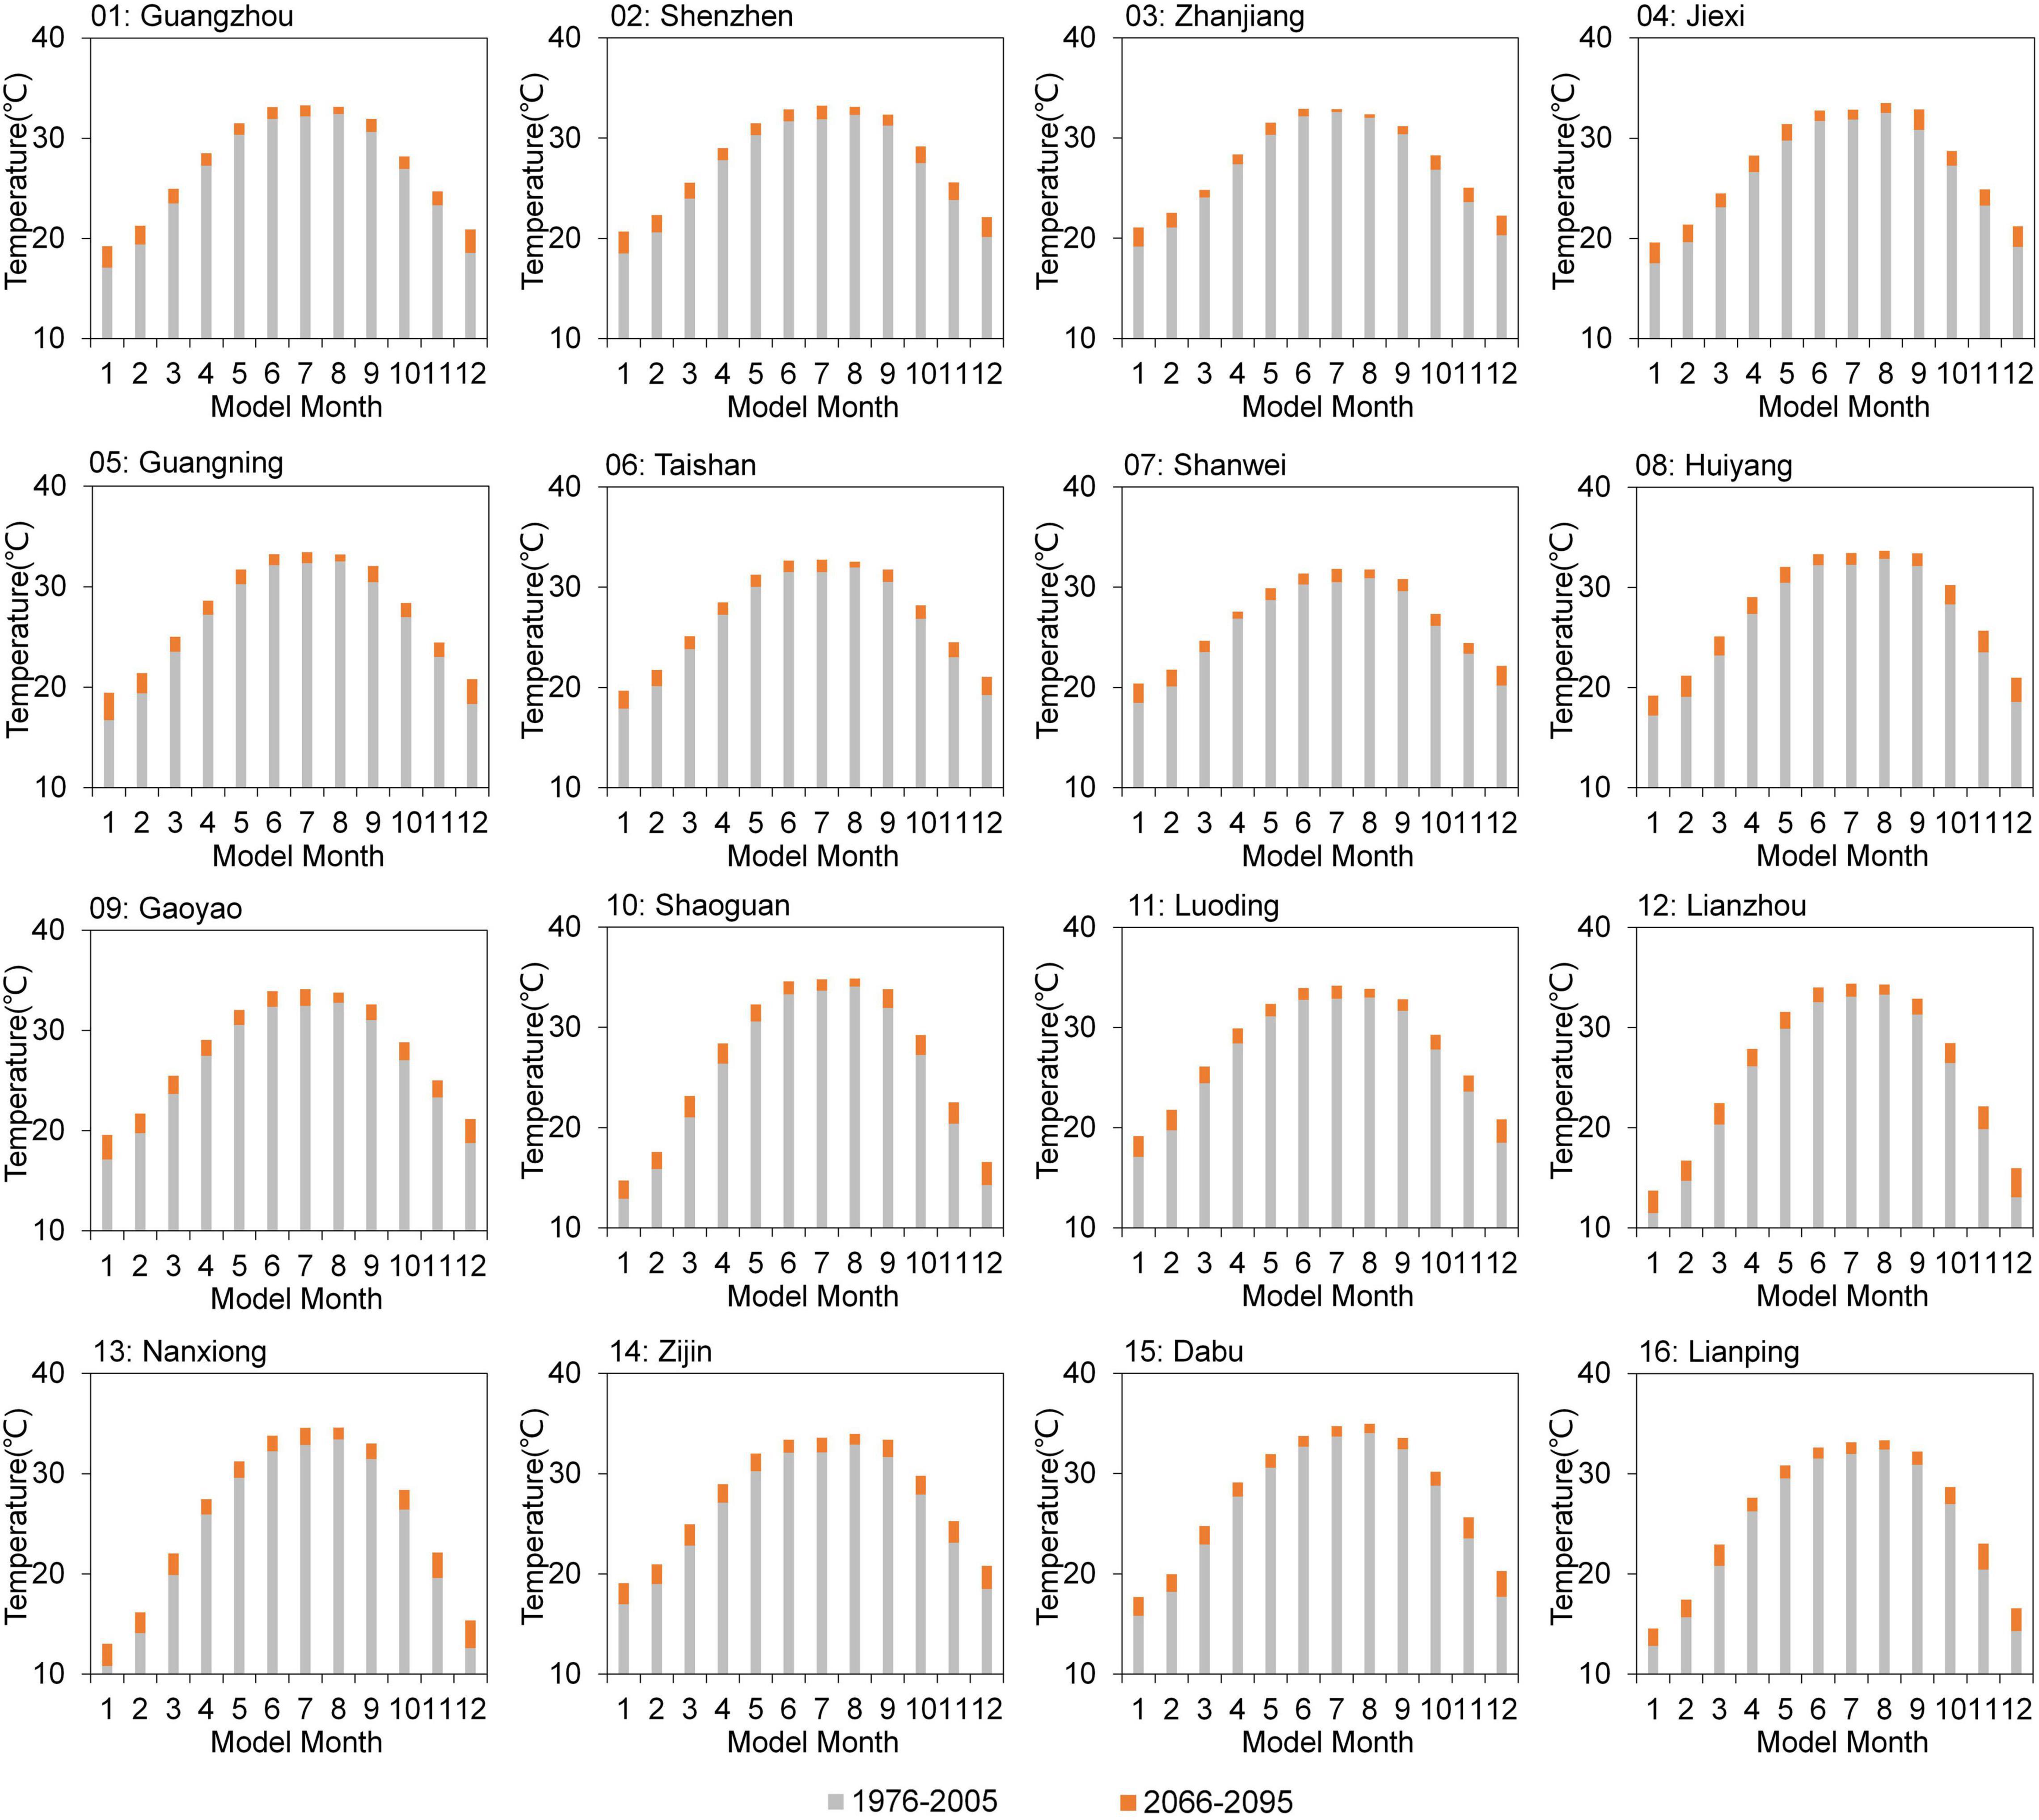
Figure 9. Projected monthly variations of Tmax between 2066–2095 and 1976–2005 under RCP8.5.

Table 2. Sen’s slope values (in °C/year) of annual and seasonal of Tmax (in °C) at the 16 weather stations in Guangdong for the period of 2006–2095.
Figures 8, 9 show the most likely variations in monthly average Tmax at Guangdong during 2066–2095 in comparison with those in the historical period (1976–2005). The results present that the projected Tmax is increasing in all months to the end of this century under RCP4.5 and RCP8.5. In detail, the increase of projected Tmax during November, December, and February over Guangdong is more prominent relative to the increase in other months, especially August. Those increases can be similarly discovered over all 16 weather stations under two RCPs. In addition, it is noticeable that the increases of Tmax during 2066–2095 are more significant under RCP8.5. For example, the smallest projected variation of Tmax occurs in the weather station of Zhanjiang in August, which is likely to be 0.046°C, and the largest projected change would expand to 1.474°C in November (i.e., Shaoguan) under RCP4.5. While the projected variation ranges from 0.334°C (i.e., in August at the Zhanjiang station) to 2.985°C (i.e., in December at the Lianzhou station) under RCP8.5. Therefore, it can be inferred that a higher emission concentration will lead to a much higher variation in the Tmax. Consequently, the projected Tmax of the 16 selected weather stations in Guangdong will continue to increase by the end of this century under two RCPs.
Evaluation of Relative Heat Waves During the Historical Period
To evaluate the ability of the developed approach to simulating the historically observed heat waves, the spatial distributions between the observations and ensemble simulations of the four GCMs during 1976–2005 over Guangdong are presented in Figures 10, 11. The spatial patterns of a 30-year average of RHW intensity and total intensity (i.e., RHWI and RHWTI) are shown in Figure 10. In terms of RHWI, it can be found that the stations in southwestern Guangdong experience higher observed heat wave intensity, exceeding 6.3°C/event per year (e.g., Xuwen, Zhanjiang, and Xinyi) (Figure 10A). In central Guangdong and most of the coastal areas, the RHWI was low with values less than 2.7°C/event per year. This spatial pattern is consistent with the variations of HWM in this region in Luo and Lau (2018), which has slightly less constrained definitions. Those spatial characteristics might associate with the stronger solar radiation, the amplifying effect of El Niño, and the anomalous anticyclonic circulation (Luo and Lau, 2018; Wang et al., 2018). When it comes to the reproduced RHWI from the model ensemble, the overall spatial patterns of RHWI over Guangdong are well captured, although it is faintly overestimated (underestimated) in Lianzhou, Shaoguan, and Nanxiong (Meixian, Dabu, and Wuhua) over northern (eastern) Guangdong (Figure 10B). Similarly, the single GCM performs better in reproducing the spatial characteristics of RHWI, except for IPSL-CM5A-MR, which almost underestimated the whole Guangdong. CNRM-CM5, CSIRO-Mk3.6.0, and MIROC5 show overestimation in northern Guangdong and the surrounding stations of Guangzhou, while the rest stations are closer to the observed RHWI. Consequently, the spatial pattern of RHWI can be reasonably simulated by the model ensemble of the four GCMs.
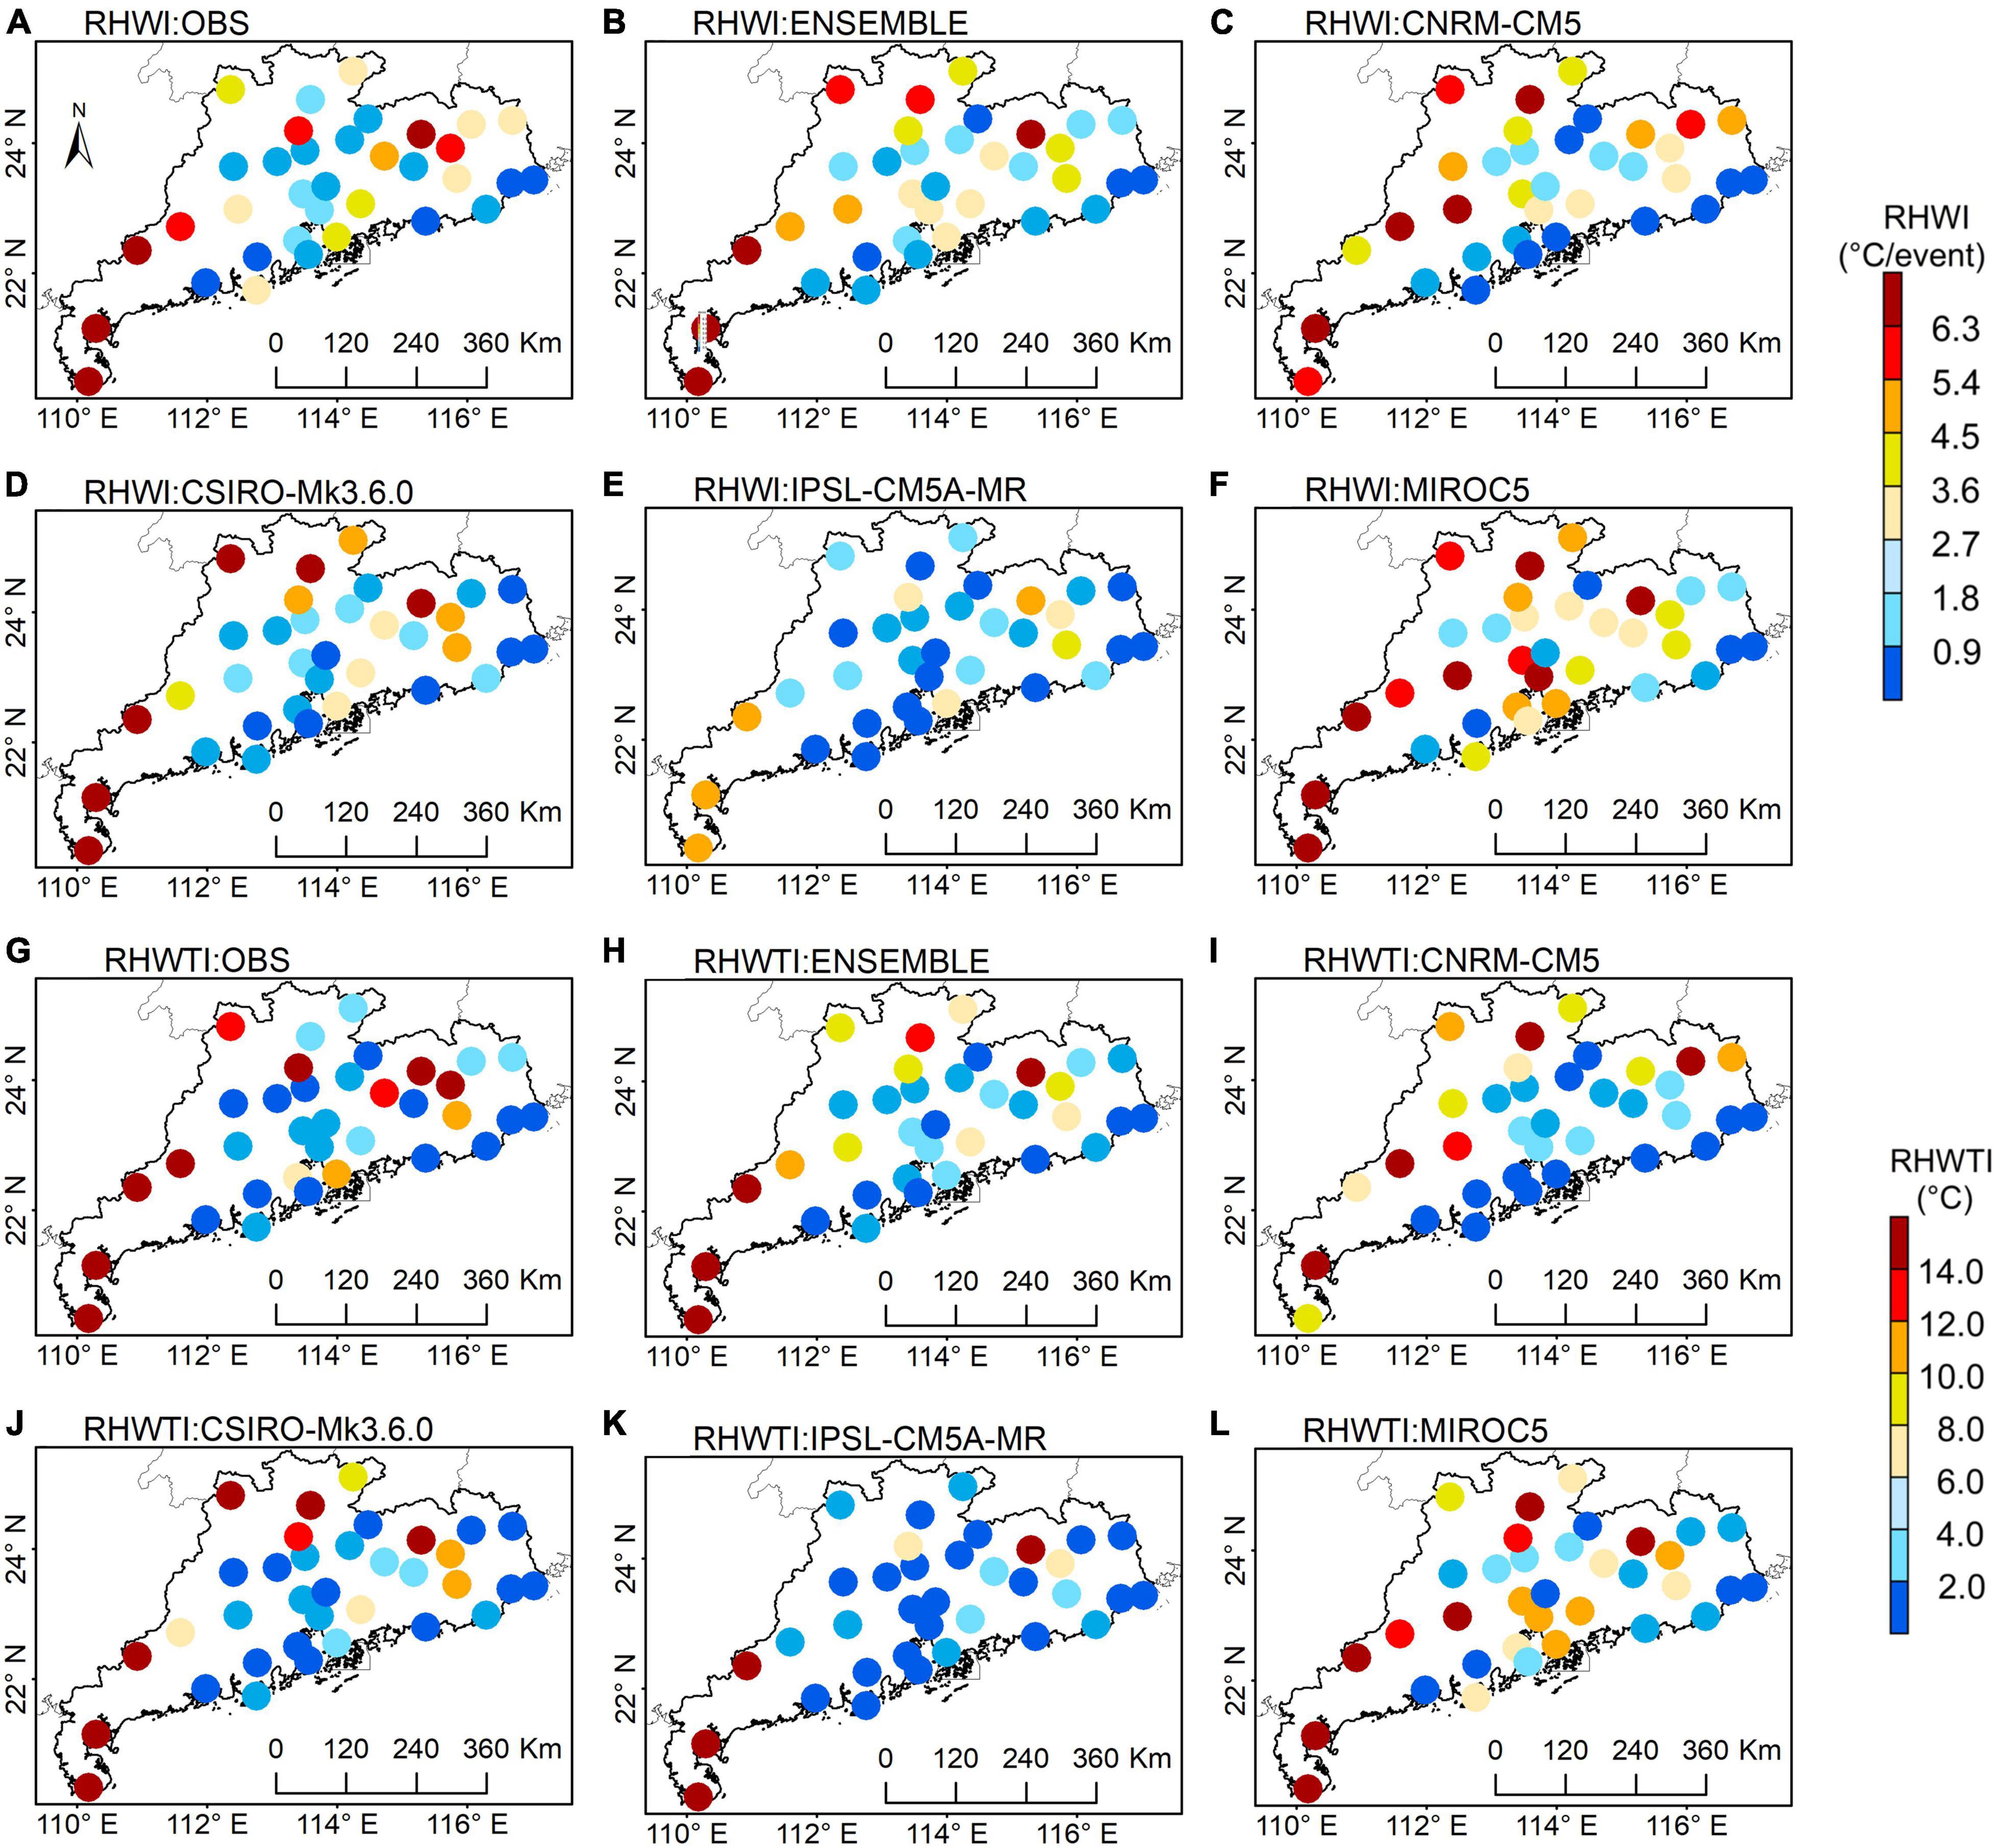
Figure 10. The spatial distributions of observed (A) and simulated RHWI (unit: °C/event), driven by CNRM-CM5 (C), CRIRO-Mk3.6.0 (D), IPSL-CM5A-MR (E), and MIROC5 (F) and the model ensemble (B). Panels (G–L) are same as panels (A–F), but for RHWTI (unit: °C).
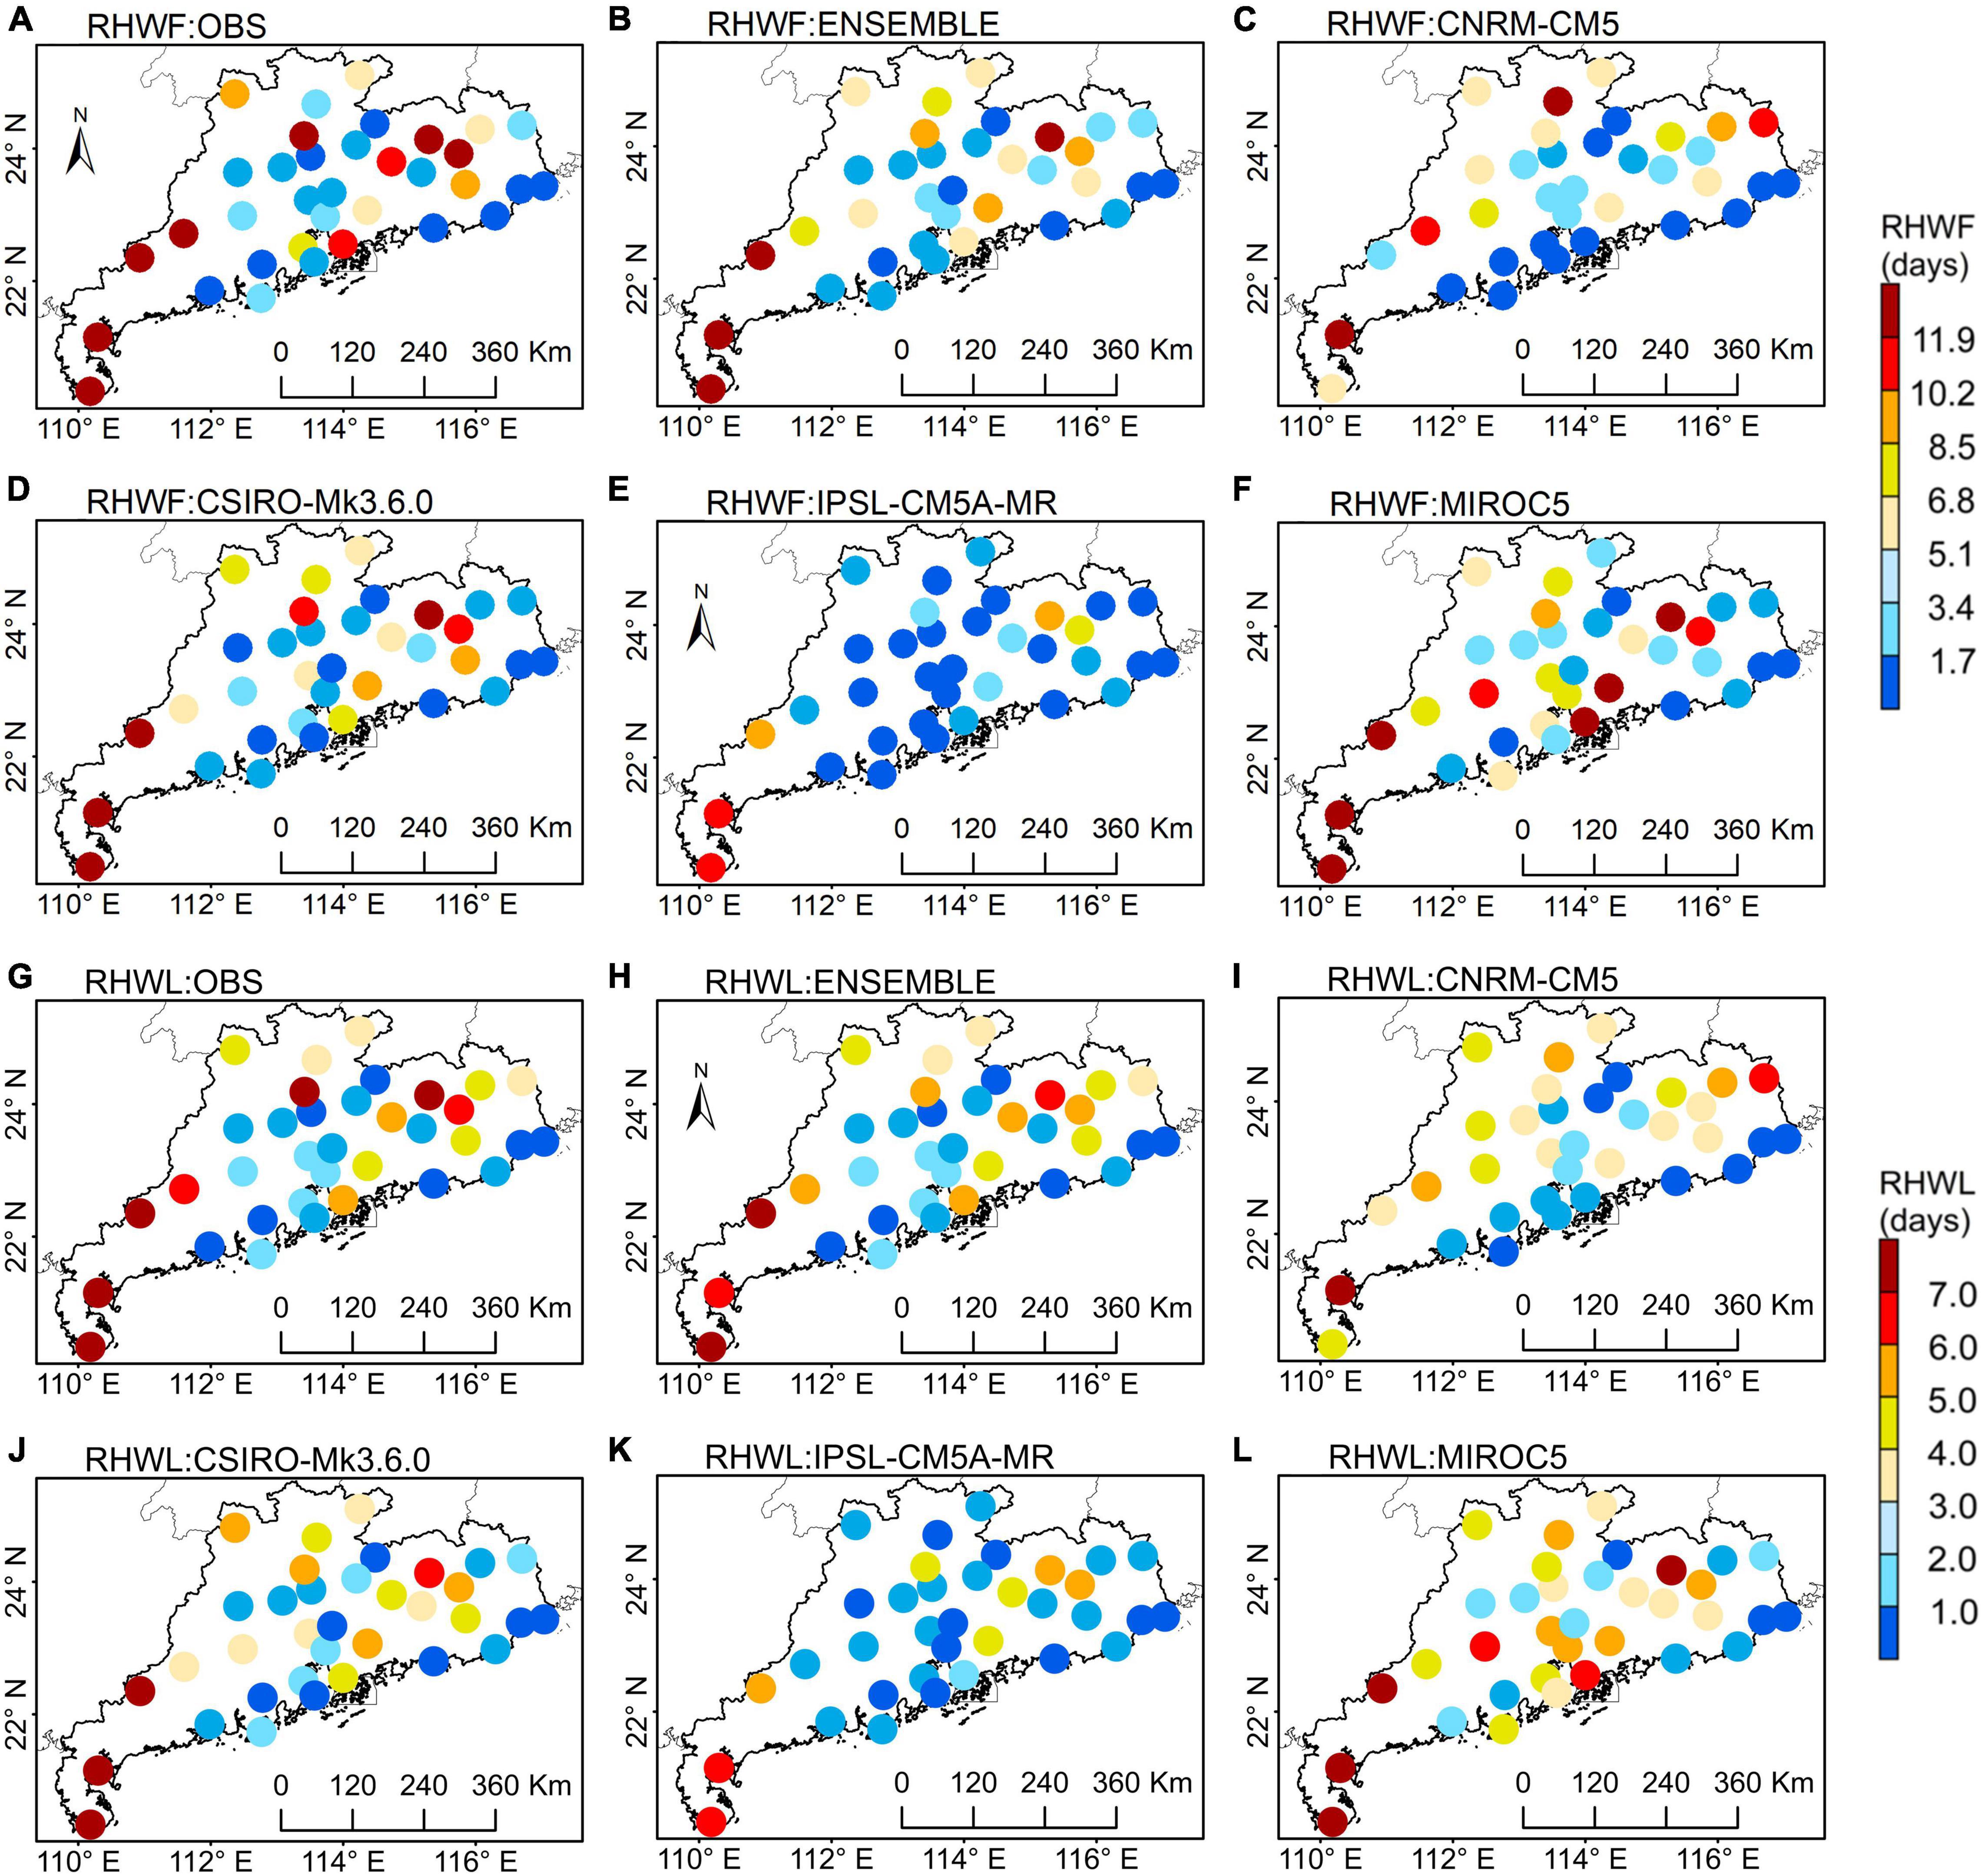
Figure 11. Same as Figure 9, but for RHWF (A–F, unit: days) and RHWL (G–L, unit: days).
The spatial distribution of the observed RHWTI is similar to that of the RHWI, which presents the higher values at most of the stations over southwestern Guangdong. However, the lower RHWTI values do not directly follow those of HWI (Figure 10G). In addition to the coastal areas of Guangdong, the stations with lower values no more than 2°C are also distributed in northeastern Guangdong, which has the highest altitude of the province. This supports previous investigation, suggesting that cooler sites at higher altitude will result in less severe heat waves (Wang et al., 2018; Woolway et al., 2021). CNRM-CM5 and MIROC5 exhibit similar distribution of observed RHWTI, overestimating it over central Guangdong (e.g., Guangzhou and Dongguan) (Figures 10I,L). Likewise, the CSIRO-Mk3.6.0 and IPSL-CM5A-MR underestimated RHWTI over eastern Guangdong (e.g., Meixian and Dabu) and overestimated RHWTI in the peripheral of Guangdong (e.g., Nanxiong and Huilai). As a result, the ensemble of the four GCMs is able to capture the spatial distributions of RHWTI well but shows under- and overestimation in eastern and central Guangdong, respectively.
Moreover, the spatial patterns of the frequency and the longest duration of relative heat waves (i.e., RHWF and RHWL) during the historical period (1976–2005) for all the weather stations over Guangdong are provided in Figure 11. The spatial pattern of observed and simulated RHWF is quite similar to that of RHWL. In terms of observations, the largest observed values of RHWF and RHWL distribute in the southwest region, such as Zhanjiang, with higher values exceeding 11.9 and 7 days per year, respectively (Figures 11A,G). However, the performance of GCMs in reproducing the spatial characteristics of RHWF and RHWL varies. For example, CNRM-CM5 and CSIRO-Mk3.6.0 can better reproduce the spatial distribution of RHWF and RHWL; although CNRM-CM5 overestimates the observed values in western (e.g., Guangning and Gaoyao) and eastern (e.g., Meixian and Dabu) Guangdong. The CSIRO-Mk3.6.0 slightly underestimated the RHWF and RHWL in the central-northern regions of Guangdong (e.g., Yingde and Cengcheng) and overestimated for the eastern region (e.g., Zijin). IPSL-CM5A-MR tends to underestimate the observed RHWF and RHWL in almost all Guangdong. MIROC5 reproduces the HWF and RHWL of more than 5 days per year in the central (e.g., Guangzhou and Dongguan) and coastal (e.g., Shenzhen and Huiyang) Guangdong, which slightly overestimated for these regions. The model ensemble simulates RHWF less than 3.4 days per year for the central Guangdong, which is consistent with the observations, while slightly underestimated (overestimated) over marginal Guangdong, such as Shangchuandao (Huilai) (Figure 11E). The model ensemble of RHWL also performs well at capturing these, but the longest day of heat waves in the southwestern (i.e., Zhanjiang) and eastern (i.e., Longchuan and Wuhua) parts of Guangdong is a little underestimated (Figure 11H). Therefore, the model ensemble performs well in reproducing the RHWF and RHWL, even if there is a certain deviation between these GCMs. Thus, the ensemble of simulated outputs with multiple GCMs is suitable for the projection of heat waves.
Spatial Patterns of the Projected Heat Waves in Guangdong
Projections of future RHW over Guangdong are reproduced through the developed downscaling approach. To better understand the spatial variations of future RHW in the context of Guangdong, the projections in the 21st century are split into two 30-year periods, 2050s (i.e., 2036–2065) and 2080s (i.e., 2066–2095) under RCP4.5 and RCP8.5. For each indicator, the projected changes of future RHW relative to these during the historical period (i.e., 1976–2005) are calculated and shown in Figure 12. In detail, the indicators of intensity, total intensity, frequency, and the longest duration of relative heat waves (i.e., RHWI, RHWTI, RHWF, and RHWL) over Guangdong will be analyzed.
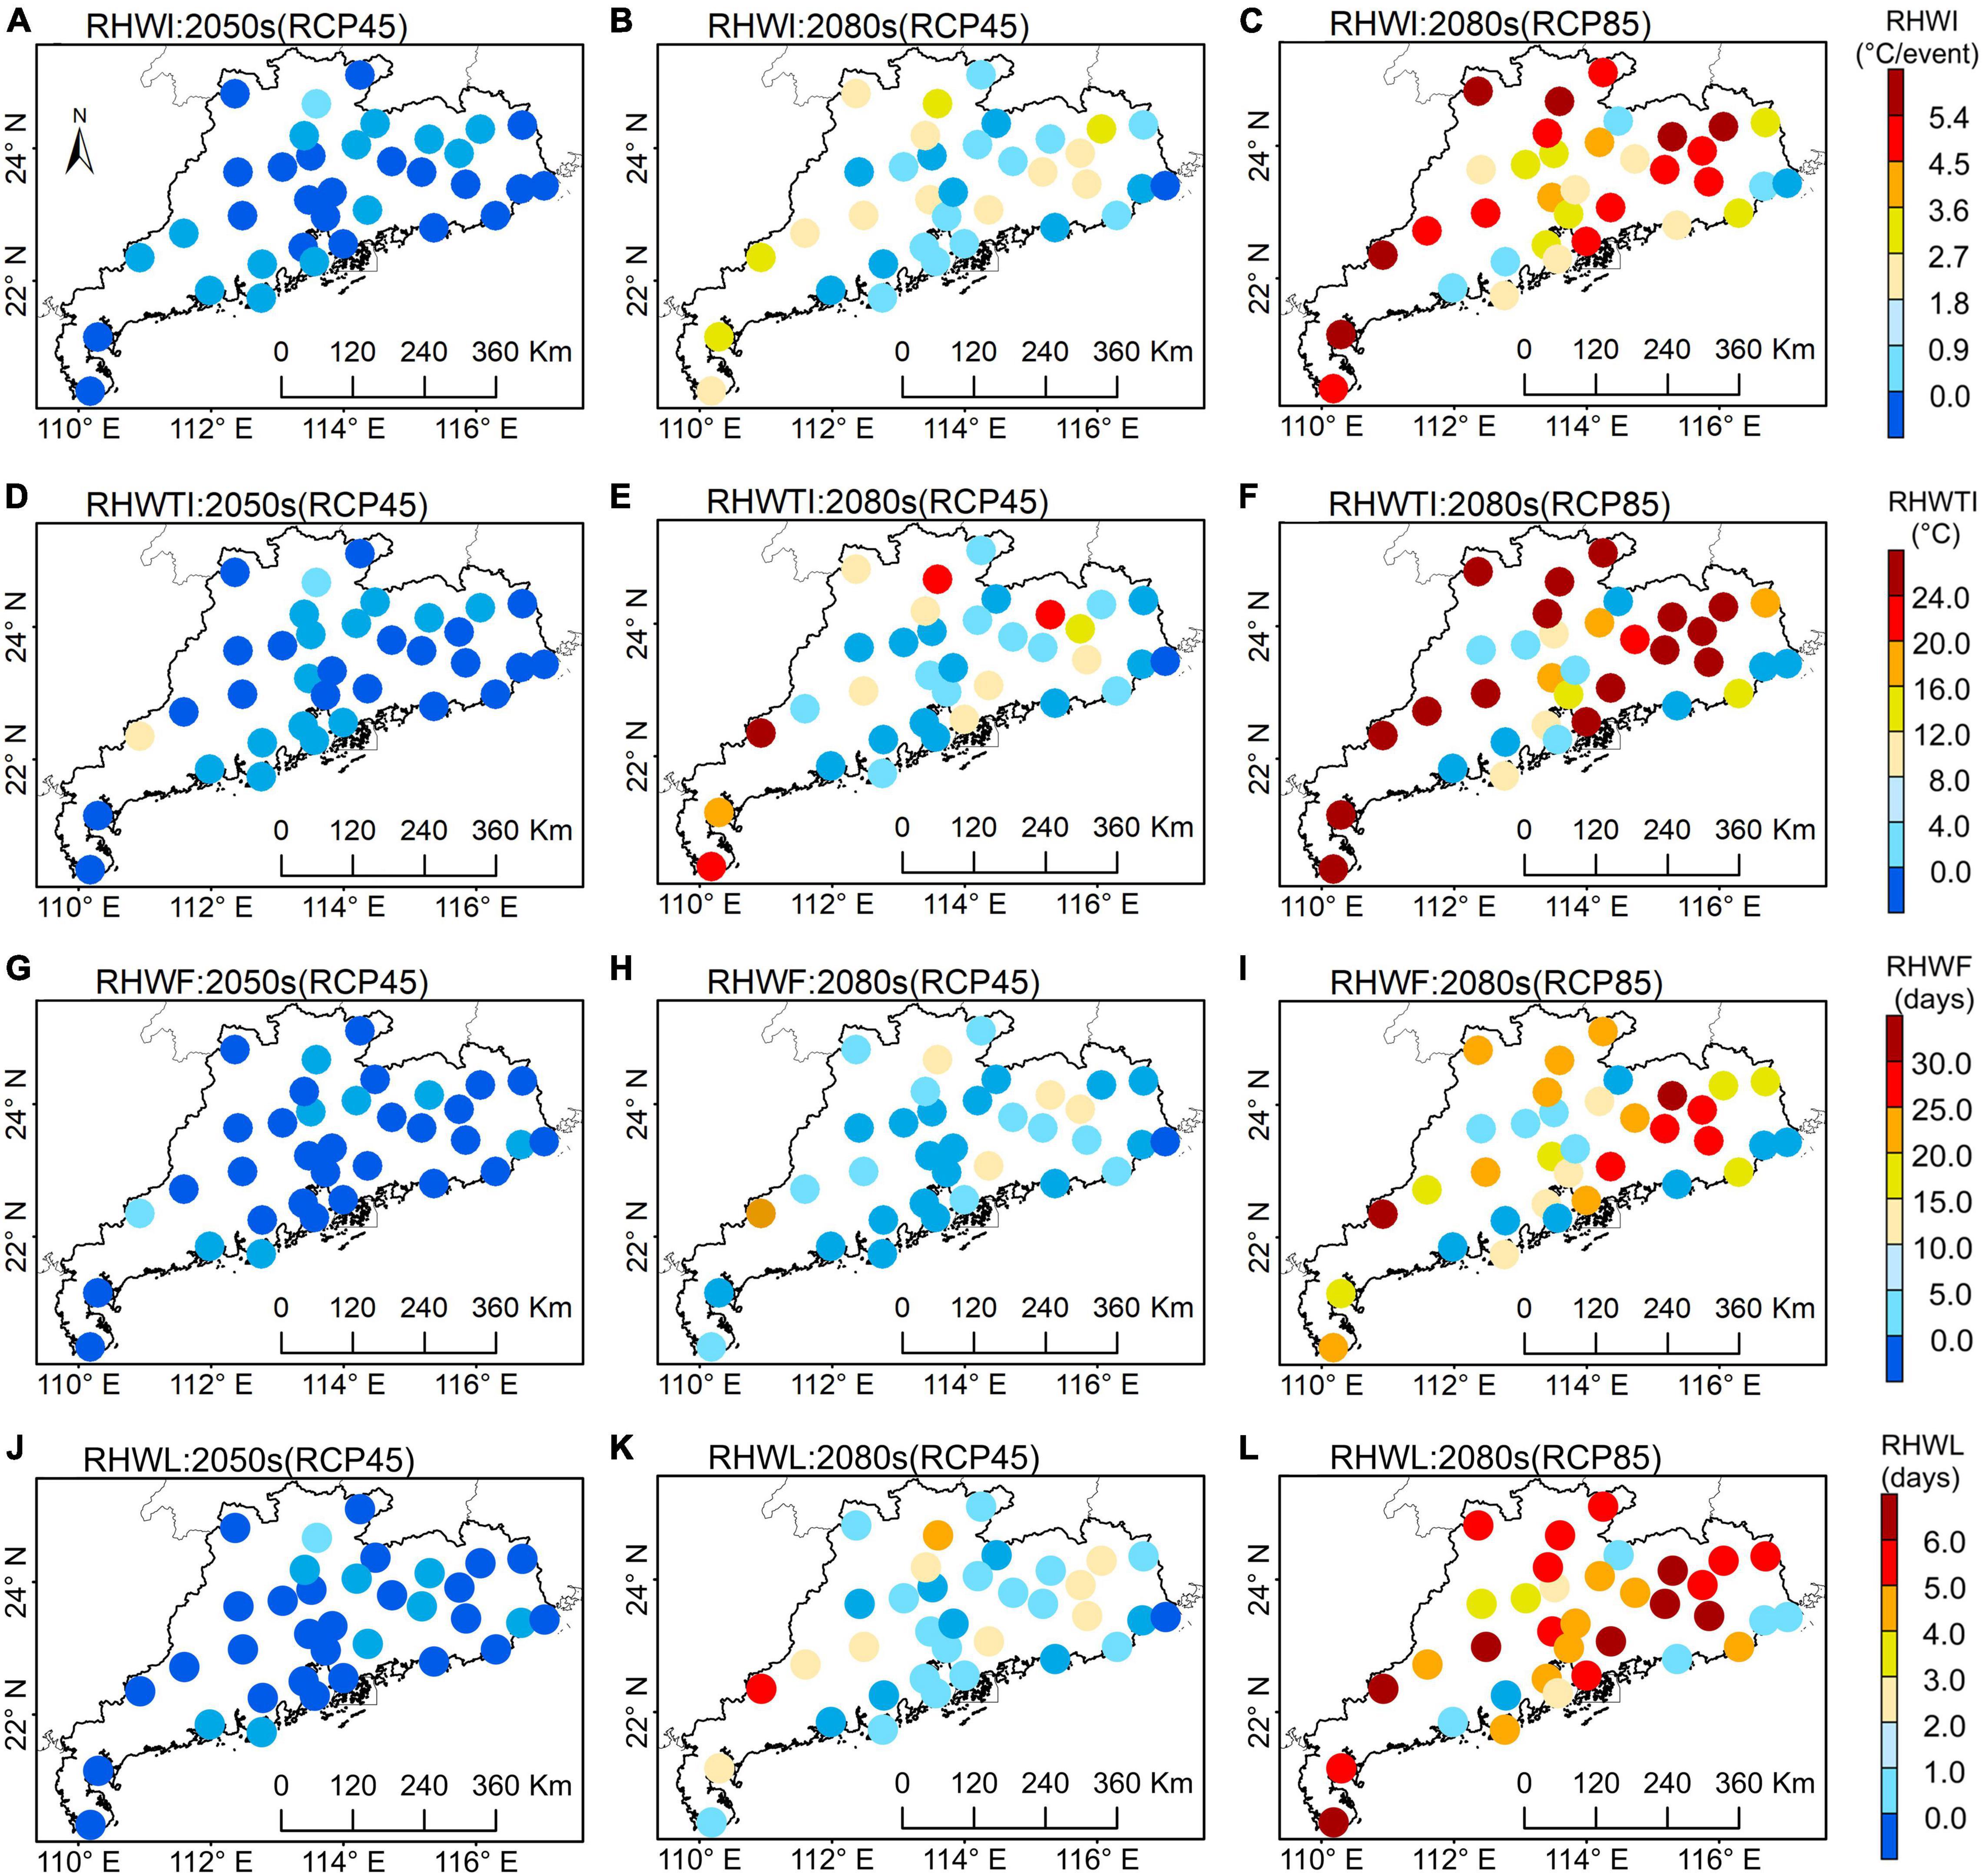
Figure 12. The spatial patterns of the projected changes in relative heat wave indicators [RHWI (A–C, unit: °C/event), RHWTI (D–F, unit: °C), RHWF (G–I, unit: days), and RHWL (J–L, unit: days)] over Guangdong for the 2050s, 2080s driven by multi-GCMs under RCP4.5 and RCP8.5 scenarios (color dots represent average change value).
With the increase of emission concentration (i.e., from RCP4.5 to RCP8.5), the projected changes of RHW in Guangdong will gradually increase from the 2050s to 2080s, especially over the northern, southern, and eastern Guangdong. For example, the projected changes of RHWI in Guangzhou (i.e., central Guangdong) are most likely to be -0.36°C per event (lower than 0°C per event) in the 2050s under RCP4.5, 1.81°C per event in the 2080s under RCP4.5, and 4°C per event to the end of this century (i.e., in the 2080s under RCP8.5) (Figures 12A–C). However, the annual average variation of RHWI in Shaoguan (i.e., northern Guangdong) is likely to be 1.6°C per event (surpassing 0°C per event) in the 2050s under RCP4.5, while the change value of projected RHWI in the 2080s under RCP4.5 is expected to be 3.14°C per event, and this would be as high as 6.1°C per event (surpassing 5.4°C per event) under RCP8.5 in the coming decades. In addition, there is a similarly increasing tendency in the ensemble simulations for RHWTI over Guangdong (Figures 12D–F). It is interesting to find that the annual average of projected variations of RHWTI across all Guangdong except the central region is more likely to exceed 24°C in the 2080s under RCP8.5.
In addition, the results of model ensemble reveal that there is an apparent increase in the spatial variations of RHWF and RHWL for all weather stations from 2050s to 2080s under two RCPs over Guangdong (Figures 12G–L). In detail, during the 2050s under RCP4.5, the projected variation values of RHWF are likely to range from -0.19 to 6.79 days, and the projected range of RHWL would be between -0.46 and 1.3 days. When it comes to the 2080s under RCP4.5, the projected changes of RHWF and RHWL are expected to expand to -0.08–20.65 and -0.12–5.28 days, respectively. It is clear that the higher change value centers of RHWF and RHWL are mainly distributed in the southwestern (e.g., Xinyi) and eastern (e.g., Wuhua) Guangdong. Consistent projected increases in RHWF and RHWL over Guangdong are found during the 2080s under RCP8.5. The distribution of RHWF shows that more frequent RHW is expected to occur in the eastern Guangdong under RCP8.5, with the maximum increase of up to 31.92 days in the Longchuan station. More than 71% stations of Guangdong would also likely to experience longer-lasting heat waves with the RHWL variation exceeding 4 days under higher emission concentration. This is consistent with the observed values of severe heat waves over Guangdong in recent years (Luo and Lau, 2018; Wang et al., 2018), which are mainly due to influences of El Niño (Luo and Lau, 2018), while the lowest variation of RHWL is projected to be occurred along the western coast (i.e., Taishan) where the value is likely to be as low as 0.98 days in the 2080s under RCP8.5.
Interannual Variations of Future Heat Waves in Guangdong
To explore the interannual variations of RHW, the annual time series are constructed for each heat wave indicator (i.e., RHWI, RHWTI, RHWF, and RHWL) and subsequently averaged over Guangdong. The annual trends of RHW are estimated based on the Sen’s slope estimator, and then, these, during the historical (i.e., 1976–2005) and future (i.e., 2066–2095) periods are compared to explore the possible contribution of global warming. In this study, at the 95% confidence level, the statistical significance of the change trends in annual heat waves is estimated through the MK test (Mann, 1945; Kendall, 1948). The obtained slope values for each indicator are illustrated in Figure 13.
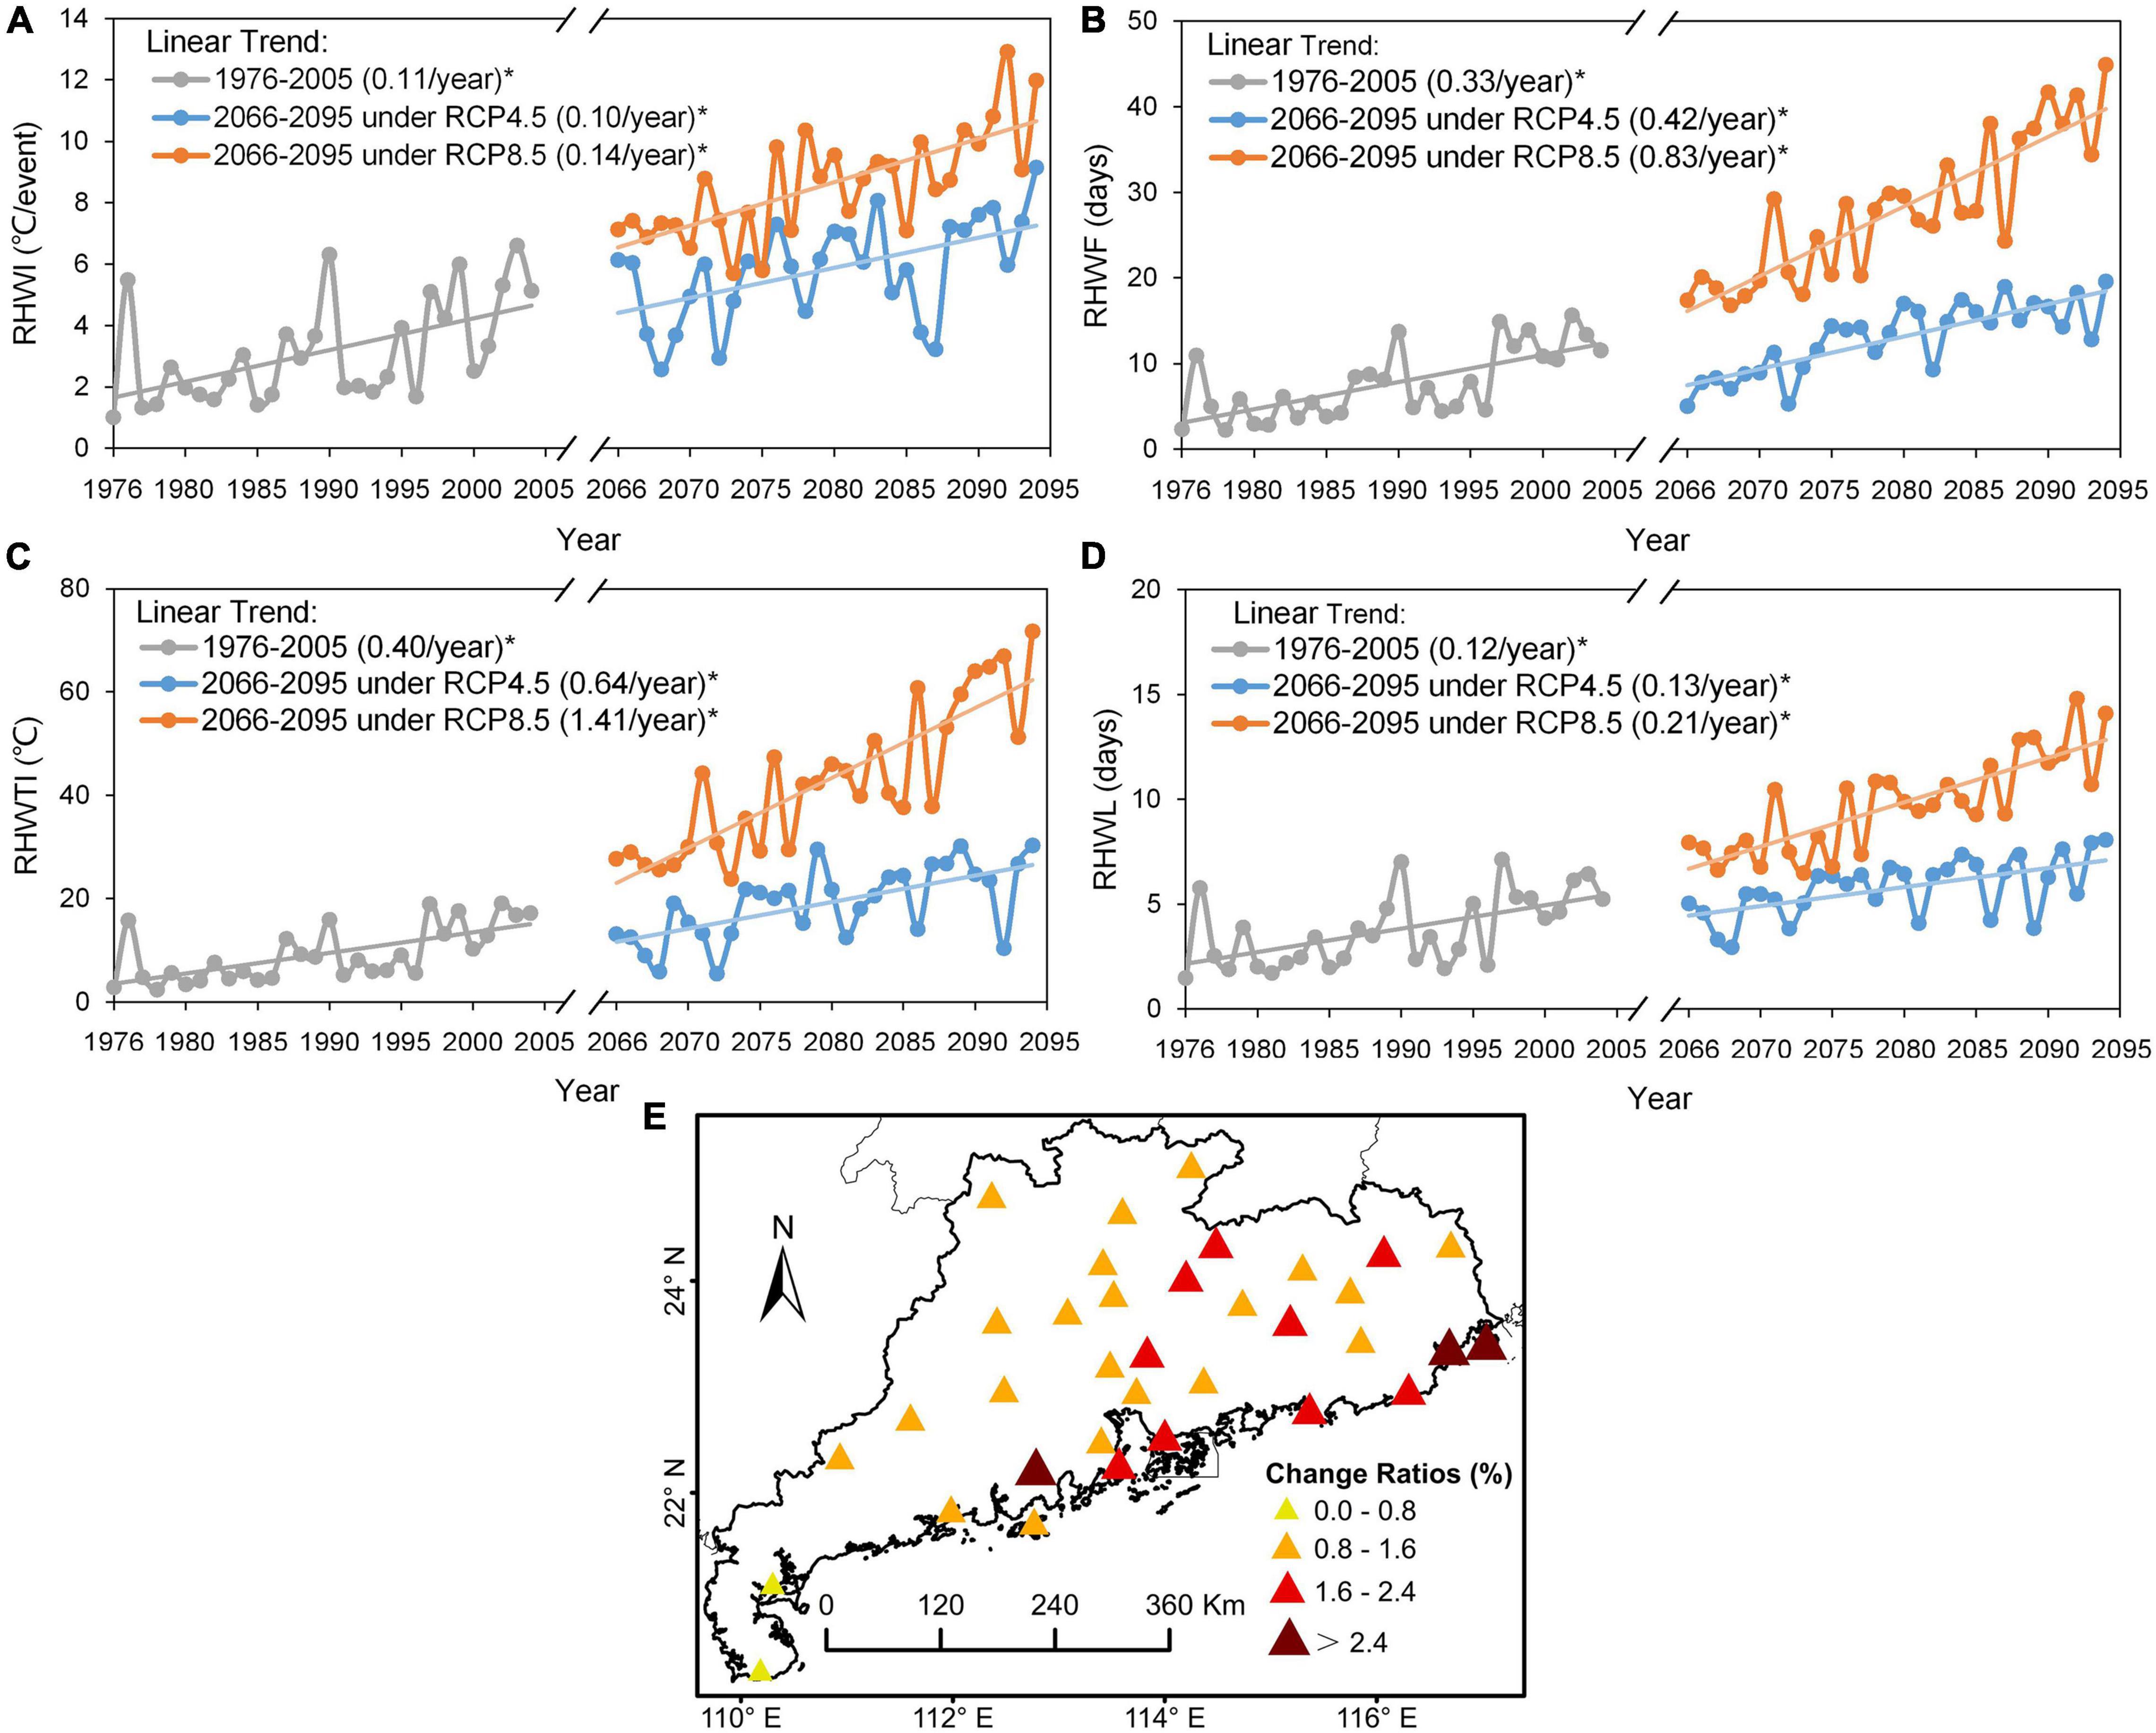
Figure 13. Linear and scatter plots present the annual variations of averaged relative heat wave indicators across all of Guangdong during the historical period (1976–2005) and the future period (2066–2095) under RCP4.5 and RCP8.5 scenarios (A–D). Panels (A–D) provided the relative heat wave indicators, consisting of intensity (i.e., RHWI), frequency (i.e., RHWF), accumulated intensity (i.e., RHWTI), and the longest duration (i.e., RHWL). Linear annual trends were estimated based on the Sen’s slope estimator, and statistical significance in trends was determined based on the MK test. The numbers in the bracket represent the estimated slope, and the asterisks denote statistically significant trends (at the 95% confidence level). The spatial distribution of the projected change ratios [(2080s under RCP8.5 minus historical)/historical] for different categories of relative heat wave intensity from the model ensemble (E). The categories are denoted as mild (change ratio < 0.8), moderate (0.8 ≤ change ratio < 1.6), severe (1.6 ≤ change ratio < 2.4), and extreme (change ratio ≥ 2.4) variations.
All the indicators of RHW over Guangdong present clear interannual variations and show a significant (at the 95% confidence level) increasing trend during the historical and future periods. Among all the indicators, RHWI demonstrates the smallest increase (Figure 13A). Specifically, the average time series of RHWI reflect a remarkable increase in the historical period (0.11°C per event per year). However, in the 2080s, under RCP4.5, RHWI shows a slight increase trend (0.1% per year) lower than that of the observation. When it comes to the 2080s under RCP8.5, RHWI increases at 0.14°C per event per year. As for RHWTI, the Sen’s slope estimator of the observation has the largest increase compared with the other three indicators, for which the increment varied at a rate of 0.4°C per year during 1976–2005. In addition, RHWTI is also likely to experience most significant increase in the future under two RCPs. In detail, RHWTI would display the greatest increase of 1.41°C per year in the 2080s under RCP8.5, and 0.64°C per year under RCP4.5. The observed RHWF has a significantly increasing trend at a rate of 0.33% per year during the historical period. During 2066–2095, a rate of increment of RHWF under RCP8.5 (0.83% per year) almost doubles of that (0.42% per year) under RCP4.5. Similarly, for RHWL, the observed estimated slope shows an increase of 0.12% per year from 1976 to 2005, while a slightly higher rate of that (0.13% per year) is simulated in the 2080s under RCP4.5. The average time series of RHWL depict a noticeable increase (0.21% per year) to the end of this century under RCP8.5. Both intensity and frequency of heat waves are found to be increased substantially during the historical period. This is consistent with previous studies that Guangdong has suffered significantly high temperature and heat wave events over the past 64 years (especially after 2000) (Zeng et al., 2006; Luo and Lau, 2017; Zhang P. et al., 2018). These results reveal that warming has a significant and consistent impact on the increases of RHW across Guangdong. Moreover, all the four heat wave indicators present significant increasing trends in the future period (especially under RCP8.5), and those trends are also expected to increase greatly compared to the historical period. This further corroborates the results demonstrated in Figure 12, indicating that the climate change would also has a substantial impact on future heat waves.
To specifically evaluate the future variations of RHW with different intensities, in this study, the heat wave is classified into four categories based on the change ratio [(2080s under RCP8.5 minus historical)/historical] of RHWTI. The classification is denoted as mild (change ratio < 0.8), moderate (0.8 ≤ change ratio < 1.6), severe (1.6 ≤ change ratio < 2.4), and extreme (change ratio ≥ 2.4) variations. This classification is similar to many previous studies (Wang et al., 2018; Shiva et al., 2019; Woolway et al., 2021). The spatial distribution of the four RHW variational categories is shown in Figure 13E.
Among the four classifications, the projected change ratio presents that 60% weather stations over Guangdong would undergo the moderate variations of RHWs to the end of this century under RCP8.5 (Figure 13E), which are mainly distributed in the western half of Guangdong. Mild variation of RHWs is expected to occur in the most southwestern Guangdong (i.e., Zhanjiang and Xuwen) (Figure 13E), which may be due to the high total intensity of RHW in both the historical and future periods (Figures 10, 12). The changes of RHW are comparatively severe and extreme in the eastern and coastal Guangdong, contrary to the results in Figure 12, which may be related to the low observed RHWTI during the historical period (Figure 10). The results depict a challenging situation that the projected change ratios from mild to extreme heat wave events are likely to increase significantly in the future, in the context of a dramatic increase in extremely high temperature in the coming decades (Figures 6, 7 and Table 2). Therefore, more attention should be paid to these regions on the adaption strategies as impacts from serious heat wave events are usually devastating, especially when they occur in populated regions and ecologically fragile areas (Cavanagh et al., 2016; Luo and Lau, 2017; Jos et al., 2018; Vogel et al., 2019).
Conclusion and Discussion
In this study, a stepwise-clustered simulation approach driven by multiple GCMs is developed for high-resolution projections of relative heat waves at station scale in the context of Guangdong. The evaluation results concluded that the developed approach performed very well in reproducing Tmax (R2 > 0.95), and the model ensemble of four GCMs was superior to any single GCM in capturing the main features of current climatology. Subsequently, the model ensemble of 16 weather stations was selected to analyze the characteristics of projected Tmax, and then the assessment of temporal-spatial changes of projected RHW was extended to cover 35 weather stations in entire Guangdong, aiming to provide valuable information for mitigating the potential impact of severe heat waves.
The results suggest that Guangdong would experience a warmer climate in the coming decades under two RCPs. On the annual scale, the 16 selected weather stations would suffer a consistent increasing trend under RCP4.5 (i.e., 0.016–0.030°C per year) and RCP8.5 (i.e.,0.027–0.057°C per year). The most noteworthy seasonal increase was detected in spring. The highest monthly increase of Tmax was up to 1.474°C (2.985°C) in November (December) at Shaoguan (Lianzhou) under RCP4.5 (RCP8.5). The ability of the developed approach to reproduce the present heat wave was also evaluated, suggesting that the model ensemble can well capture the spatial distribution of RHW. Four indicators (i.e., RHWI, RHWTI, RHWF, and RHWL) were then used to evaluate the variations of RHW. The spatial patterns and interannual trends displayed that Guangdong would undergo severe RHW. The higher projected changes of RHW would be concentrated in eastern Guangdong under two RCPs, and Guangdong would experience the largest significant increase in RHWTI with 1.41 days per year under RCP8.5. Meanwhile, the variations of RHW were also quantitated into four categories (i.e., mild, moderate, severe, and extreme variations) based on the projected change ratio of RHWTI [(2080s under RCP8.5 minus historical)/historical]. Over 60% weather stations of Guangdong would suffer moderate variations in the 2080s under RCP8.5, followed by severe and extreme changes. Much more attention should be raised to those areas to adopt such variations.
Overall, the developed approach driven by multiple GCMs performed well in the high-resolution projections of RHW, while there is a certain bias in the simulation of extreme variables (e.g., temperature). Techniques to improve the projected quality of such a variable should be further investigated, such as considering the input of more GCMs or improving the downscaling approach. The results of this study can provide helpful information for policymakers and stakeholders to assess the impact of heat waves due to their devastating consequences for social, economic, and ecological sectors under global warming (Zhang L. et al., 2018; Vogel et al., 2019; Liu et al., 2020; Sun et al., 2020; Woolway et al., 2021). The assessment of the impact of heat waves on social-economical-related sectors (e.g., human health, water resources, and energy demand) is supported by a lot of pieces of scientific evidence (Yang et al., 2013; Zhu et al., 2014; Xie et al., 2017; Zampieri et al., 2017; Mukherjee et al., 2020; Tian et al., 2021), which quantifies the negative or positive impact of heat waves on a regional or global scale. Moreover, heat waves (or temperature extremes) have also and will continue to have direct or indirect impacts on terrestrial and marine ecosystems (e.g., the carbon cycle, vegetation productivity, and global biodiversity), and disrupt the sustainable supply of ecological services and goods, thus affect the human well-beings (Zhou L. et al., 2014; Yuan et al., 2016; Jos et al., 2018; Smale et al., 2019; Wang et al., 2019; Zanatta et al., 2020; Liu et al., 2021). For example, exposure to heat waves would result in a decrease in vegetation productivity, crop yield, as well as weaken the terrestrial carbon sink (Zampieri et al., 2017; Wang et al., 2019; Font et al., 2021). Similarly, the widespread mortality of a diversity of taxa in the Mediterranean has also linked to the marine heat waves, which simplified the structure of critical habitats, destroyed the local biodiversity, and reduced the efficiency of natural carbon sequestration (Garrabou et al., 2009; Smale and Wernberg, 2013; Messori et al., 2020). Hundreds of millions of people benefit from these ecosystems; their services have considerable socioeconomic benefits (Cavanagh et al., 2016). Guangdong mangroves have the largest distribution in China; they play an irreplaceable role in protecting wetland ecosystems (Yu et al., 2007; Yang et al., 2018). The composition, structure, growth, and distribution of which are extremely sensitive to temperature (Yang et al., 2018). Discrete extreme events (such as heat waves) are beginning the key to shaping ecosystems through driving the sudden and drastic variations in the structure and function of the ecosystem (Smale et al., 2019). However, the quantitative exploration of the impact of heat waves on the ecosystem is still limited at present due to the heterogeneity of the temporal-spatial patterns and formation mechanism of heat waves (Mukherjee and Mishra, 2020; Ridder et al., 2020). The characteristics and variations of heat waves were investigated in this study, while the mechanism of which in Guangdong is needed to be explored. Besides, previous studies demonstrated that heat waves are often related to other heat wave-associated extreme events (e.g., drought) (Wu et al., 2020), the large-scale atmospheric variables (e.g., cloud cover and solar radiation) or teleconnections (e.g., El Nino Southern Oscillation, Pacific Decadal Oscillation, and North Atlantic Oscillation) (Luo and Lau, 2018; Mukherjee et al., 2020; Ridder et al., 2020). Therefore, it is necessary to explore the contribution of these influencing variables to the evolution of heat waves to promote our understanding of the mechanism of heat wave events and to further evaluate the potential impact of heat waves on population and Guangdong’s future related ecosystems such as mangroves to overcome the adverse effects of climate change. These will be the focus of our follow-up research.
Data Availability Statement
The original contributions presented in the study are included in the article/supplementary material, further inquiries can be directed to the corresponding author.
Author Contributions
GH, XZ, and JR conceived and designed the project. JR performed analyses and wrote the manuscript. GH and XZ revised the manuscript critically. YL, JX, ZY, CT, and FW reviewed the manuscript. All authors contributed to the article and approved the submitted version.
Funding
This research was supported by the Natural Sciences Foundation (U2040212 and 51779008), Strategic Priority Research Program of CAS (XDA20060302), MWR/CAS Institute of Hydroecology (1440020035), and the Natural Sciences and Engineering Research Council of Canada.
Conflict of Interest
The authors declare that the research was conducted in the absence of any commercial or financial relationships that could be construed as a potential conflict of interest.
Publisher’s Note
All claims expressed in this article are solely those of the authors and do not necessarily represent those of their affiliated organizations, or those of the publisher, the editors and the reviewers. Any product that may be evaluated in this article, or claim that may be made by its manufacturer, is not guaranteed or endorsed by the publisher.
Acknowledgments
We are grateful to the National Meteorological Information Center for providing the observed daily maximum temperature (http://data.cma.cn), the Working Group of World Climate Research Programme for Global Climate Models (GCMs), and National Centers for Environmental Prediction (NCEP/NCAR) (https://www.esrl.noaa.gov/psd/). We are also very grateful for the helpful inputs from the editor and anonymous reviewers.
Abbreviations
CMIP5, coupled model intercomparison projected phase 5; GCMs, global climate models; RCPs, representative concentration pathways; RHW, relative heat wave; RHWI, average intensity of heat waves within a year; RHWTI, total intensity of heat waves within a year; RHWL, yearly sum of participating heat wave days; RHWF, the length of the longest heat wave event within a year.
Footnotes
References
Adeniyi, M. O. (2016). The consequences of the IPCC AR5 RCPs 4.5 and 8.5 climate change scenarios on precipitation in West Africa. Clim. Chang. 139, 245–263. doi: 10.1007/s10584-016-1774-2
Almazroui, M., Saeed, F., Saeed, S., Ismail, M., Ehsan, M. A., Islam, M. N., et al. (2021). Projected changes in climate extremes using CMIP6 simulations over SREX regions. Earth Syst. Environ. 5, 481–497. doi: 10.1007/s41748-021-00250-5
Araya-Osses, D., Casanueva, A., Román-Figueroa, C., Uribe, J. M., and Paneque, M. (2020). Climate change projections of temperature and precipitation in Chile based on statistical downscaling. Clim. Dyn. 54, 4309–4330. doi: 10.1007/s00382-020-05231-4
Cavanagh, R. D., Broszeit, S., Pilling, G. M., Grant, S. M., Murphy, E. J., and Austen, M. C. (2016). Valuing biodiversity and ecosystem services: a useful way to manage and conserve marine resources? Proc. R. Soc. 283, 1–8. doi: 10.1098/rspb.2016.1635
Chen, H. B., and Fan, X. H. (2007). Some extreme events of weather, climate and related phenomena in 2006. Clim. Environ. Res. 12, 100–112. doi: 10.1002/jrs.1570
Clarke, L., Edmonds, J., Jacoby, H., Pitcher, H., Reilly, J., and Richels, R. (2007). Scenarios of Greenhouse Gas Emissions and Atmospheric Concentrations. Sub-Report 2.1a of Synthesis and Assessment Product 2.1 by the U.S. Climate Change Science Program and the Subcommittee on Global Change Research. Washington, DC: Department of Energy, Office of Biological and Environmental Research, 154.
Ding, T., and Qian, W. H. (2011). Geographical patterns and temporal variations of regional dry and wet heatwave events in China during 1960-2008. Adv. Atmos. Sci. 28, 322–337. doi: 10.1007/s00376-010-9236-7
Du, Y. D., Wang, X. W., Yang, X. F., Ma, W. J., Ai, H., and Wu, X. X. (2013). Impacts of climate change on human health and adaptation strategies in south China. Adv. Clim. Chang. Res. 4, 208–214. doi: 10.3724/sp.j.1248.2013.208
Duan, R. X., Huang, G. H., Li, Y. P., Zhou, X., Ren, J. Y., and Tian, C. Y. (2020). Stepwise clustering future meteorological drought projection and multi-level factorial analysis under climate change: a case study of the pearl river basin, China. Environ. Res. 196, 110368. doi: 10.1016/j.envres.2020.110368
Fan, Y., Huang, G., Li, Y., Wang, X., and Li, Z. (2016). Probabilistic prediction for monthly streamflow through coupling stepwise cluster analysis and quantile regression methods. Water Resou. Manag. 30, 5313–5331. doi: 10.1007/s11269-016-1489-1
Fan, Y. R., Huang, G. H., Li, Y. P., Wang, X. Q., Li, Z., and Jin, L. (2017). Development of PCA-based cluster quantile regression (PCA-CQR) framework for streamflow prediction: application to the Xiangxi River Watershed, China. Appl. Soft Comput. 51, 280–293. doi: 10.1016/j.asoc.2016.11.039
Fan, Y. R., Huang, W., Huang, G. H., Li, Z., Li, Y. P., Wang, X. Q., et al. (2015). A Stepwise-Cluster Forecasting Approach for Monthly Streamflows Based on Climate Teleconnections. Stoch. Environ. Res. Risk Assess. 29, 1557–1569. doi: 10.1007/s00477-015-1048-y
Farooq, I., Shah, A. R., Salik, K. M., and Ismail, M. (2021). Annual, seasonal and monthly trend analysis of temperature in kazakhstan during 1970-2017 using non-parametric statistical methods and GIS technologies. Earth Syst. Environ. 5, 1–21. doi: 10.1007/s41748-021-00244-3
Fenner, D., Holtmann, A., Krug, A., and Scherer, D. (2019). Heat waves in Berlin and Potsdam, Germany–Long-term trends and comparison of heat wave definitions from 1893 to 2017. Int. J. Climatol. 39, 2422–2437. doi: 10.1002/joc.5962
Fewings, M. R., and Brown, K. S. (2019). Regional structure in the marine heat wave of summer 2015 off the western united states. Front. Mar. Sci. 6:564. doi: 10.3389/fmars.2019.00564
Font, R. A., Khamis, K., Milner, A. M., Smith, G., and Ledger, M. E. (2021). Low flow and heatwaves alter ecosystem functioning in a stream mesocosm experiment. Sci. Total. Environ. 777:146067. doi: 10.1016/j.scitotenv.2021.146067
Garrabou, J., Coma, R., Bensoussan, N., Bally, M., Chevaldonn, P., Cigliano, M., et al. (2009). Mass mortality in Northwestern Mediterranean rocky benthic communities: effects of the 2003 heat wave. Glob. Chang. Biol. 15, 1090–1103. doi: 10.1111/j.1365-2486.2008.0-1823.x
Gha, B., Yx, C., Zh, D., Zr, E., Mz, F., Yang, C. G., et al. (2021). The assessment of current mortality burden and future mortality risk attributable to compound hot extremes in China. Sci. Total Environ. 777, 146219. doi: 10.1016/j.scitotenv.2021.146219
Ghatak, D., Zaitchik, B., Hain, C., and Anderson, M. (2017). The role of local heating in the 2015 Indian heat wave. Sci. Rep. 7:7707. doi: 10.1038/s41598-017-07956-5
Gibson, P. B., Perkins-Kirkpatrick, S. E., Alexander, L. V., and Fischer, E. M. (2017). Comparing Australian heat waves in the CMIP5 models through cluster analysis. J. Geophys. Res. Atmos. 122, 3266–3281. doi: 10.1002/2016JD025878
Gu, S. H., Huang, C. R., Bai, L., Chu, C., and Liu, Q. Y. (2016). Heat-related illness in China, summer of 2013. Int. J. Biometeorol. 60, 131–137. doi: 10.1007/s00484-015-1011-0
Guangdong Statistical Yearbook (2020). Composition of Permanent Population. Guangzhou: Guangdong Statistical Yearbook, 103–117.
Guo, J. H., Huang, G. H., Wang, X. Q., Wu, Y. H., Li, Y. P., Zheng, R. B., et al. (2020). Evaluating the added values of regional climate modeling over China at different resolutions. Sci. Total Environ. 718:137350. doi: 10.1016/j.scitotenv.2020.137350
Guo, X., Huang, J., Luo, Y., Zhao, Z., and Xu, Y. (2017). Projection of heat waves over China for eight different global warming targets using 12 CMIP5 models. Theor. Appl. Climatol. 128, 507–522. doi: 10.1007/s00704-015-1718-1
Gupta, S., Goyal, M. K., and Sarma, A. K. (2018). Index-based study of future precipitation changes over Subansiri river catchment under changing climate. J. Environ. Inform. 34, 1–14. doi: 10.3808/jei.201700376
Hauser, M., Orth, R., and Seneviratne, S. I. (2016). Role of soil moisture versus recent climate change for the 2010 heat wave in western Russia. Geophys. Res. Lett. 43, 2819–2826. doi: 10.1002/2016GL068036
He, C. Y., Huang, G. H., Liu, L. R., Li, Y. P., Zhang, X. Y., and Xu, X. L. (2020). Multi -dimensional diagnosis model for the sustainable development of regions facing water scarcity problem: a case study for Guangdong, China. Sci. Total. Environ. 734, 139394. doi: 10.1016/j.scitotenv.2020.139394
He, X. J., Zhang, J. T., Ji, T. Y., Zhong, P., and Wang, W. T. (2012). Study on the sea level rising in the China coast and its adaptation strategy. Mar. Forecasts 29, 84–91.
Hessami, M., Gachon, P., Ouarda, T. B. M. J., and St-Hilaire, A. (2008). Automated regression-based statistical downscaling tool. Environ. Modell. Softw. 23, 813–834. doi: 10.1016/j.envsoft.2007.10.004
Hobday, A., Oliver, E., Sen, G. A., Benthuysen, J., Burrows, M., Donat, M., et al. (2018). Categorizing and naming marine heatwaves. Oceanography 31, 162–173. doi: 10.5670/oceanog.2018.205
Huang, G. H. (1992). A stepwise cluster analysis method for predicting air quality in an urban environment. Atmos. Environ. Part B 26, 349–357. doi: 10.1016/0957-1272(92)90010-P
Huang, G. H., Huang, Y. F., Wang, G. Q., and Xiao, H. N. (2006). Development of a forecasting system for supporting remediation design and process control based on NAPL-biodegradation simulation and stepwise-cluster analysis. Water. Resour. Res. 42, W06413. doi: 10.1029/2005WR004006
Jos, B., Filipe, F., Gardner, T. A., Hicks, C. C., Lennox, G. D., Erika, B., et al. (2018). The future of hyperdiverse tropical ecosystems. Nature 559, 517–526. doi: 10.1038/s41586-018-0301-1
Kalnay, E., Kanamitsu, M., Kistler, R., Collins, W., and Joseph, D. (1996). The ncep reanalysis project. Biol. Am. Meteorol. Soc. 77, 437–472.
Kendall, M. G. (1948). Rank Correlation Methods. Oxford: Griffin, doi: 10.1111/j.2044-8295.1934.tb00727.x
Lewis, S. C., and King, A. D. (2016). Evolution of mean, variance and extremes in 21st century temperatures. Weather Clim. Extremes. 15, 1–10. doi: 10.1016/j.wace.2016.11.002
Li, P., Fang, G., and Huang, G. (1993). Impacts on sea level rising on the economic development of zhujiang delta and countermeasures. Acta Geogr. Sin. 48, 527–534.
Li, Z., Guo, X., Yang, Y., Hong, Y., Wang, Z., and You, L. (2019). Heatwave trends and the population exposure over China in the 21st century as well as under 1.5°C and 2.0°C global warmer future scenarios. Sustainability 11, 1–21. doi: 10.3390/su11123318
Li, Z., Huang, G. H., Han, J. C., Wang, X. Q., Fan, Y. R., Cheng, G. H., et al. (2015). Development of a stepwise-clustered hydrological inference model. J. Hydrol. Eng. 20, 04015008. doi: 10.1061/(ASCE)HE.1943-5584.0001165
Li, Z., Li, J. J., and Shi, X. P. (2020). A two-stage multisite and multivariate weather generator. J. Environ. Inform. 35, 148–159. doi: 10.3808/jei.201900424
Liu, H. M., Ding, S. Y., and Ren, J. Y. (2021). Ecosystem services flow and its coupling evaluate of supply and demand–a case study of yihe river basin. J. Environ. Inform. Lett. 1–11. doi: 10.3808/jeil.202100072
Liu, T., Ren, Z., Zhang, Y., Feng, B., Lin, H., Xiao, J., et al. (2019). Modification effects of population expansion, ageing, and adaptation on heat-related mortality risks under different climate change scenarios in Guangzhou, China. Int. J. Env. Res. Public Health 16, 376. doi: 10.3390/ijerph16030376
Liu, X. C., Huang, G. H., and Chen, J. P. (2020). The development of inexact dual -objective programming for regional energy systems planning in Guang-Fo-Zhao region, China. J. Clean. Prod. 265:121351. doi: 10.1016/j.jclepro.2020.121351
Luo, M., and Lau, N. C. (2017). Heat waves in southern China: synoptic behavior, long-term Change, and urbanization effects. J. Clim. 30, 703–720. doi: 10.1175/JCLI-D-16-0269.1
Luo, M., and Lau, N. C. (2018). Amplifying effect of ENSO on heat waves in China. Clim. Dynam. 52, 3277–3289. doi: 10.1007/s00382-018-4322-0
Ma, D., Jing, Q., Xu, Y., Cannon, A., and Qian, B. (2021). Using ensemble-mean climate scenarios for future crop yield projections: a stochastic weather generator approach. Clim. Res. 83, 161–171. doi: 10.3354/cr01646
Mann, H. B. (1945). Nonparametric tests against trend. Econometrica 13, 245–259. doi: 10.2307/1907187
Messori, G., Bevacqua, E., Caballero, R., Coumou, D., and Zscheischler, J. (2020). Compound climate events and extremes in the midlatitudes: dynamics, simulation, and statistical characterization. Biol. Am. Meteorol. Soc. 102, 1–13. doi: 10.1175/BAMS-D-20-0289.1
Mills, K. E., Pershing, A. J., Brown, C. J., Chen, Y., Chiang, F. S., Holland, D. S., et al. (2013). Fisheries management in a changing climate lessons from the 2012 ocean heat wave in the northwest Atlantic. Oceanography. 26, 191–195. doi: 10.5670/oceanog.2013.27
Morrison, D. F. (1967). Multivariate statistical methods. J. R. Stat. Soc. A Stat. 130, 576. doi: 10.2307/2982527
Mukherjee, S., Ashfaq, M., and Mishra, A. K. (2020). Compound drought and heatwaves at a global scale: the role of natural climate variability-associated synoptic patterns and land-surface energy budget anomalies. J. Geophys. Res. Atmos. 125:E2019JD031943. doi: 10.1029/2019JD031943
Mukherjee, S., and Mishra, A. K. (2020). Increase in compound drought and heatwaves in a warming world. Geophys. Res. Lett. 48, 1–13. doi: 10.1029/2020GL090617
Oliver, E. C. J., Donat, M. G., Burrows, M. T., Moore, P. J., Smale, D. A., Alexander, L. V., et al. (2018). Longer and more frequent marine heatwaves over the past century. Nat. Commun. 9:1324. doi: 10.1038/s41467-018-03732-9
Perkins, S. E. (2015). A review on the scientific understanding of heatwaves-their measurement, driving mechanisms, and changes at the global scale. Atmos. Res. 164, 242–267. doi: 10.1016/j.atmosres.2015.05.014
Perkins, S. E., Alexander, L. V., and Nairn, J. R. (2012). Increasing frequency, intensity and duration of observed global heatwaves and warm spells. Geophys. Res. Lett. 39:L20714. doi: 10.1029/2012GL053361
Pezza, A. B., van Rensch, P., and Cai, W. J. (2012). Severe heat waves in Southern Australia: synoptic climatology and large scale connections. Clim. Dyn. 38, 209–224. doi: 10.1007/s00382-011-1016-2
Pramod, S., Sahib, L., Bibin, B. B., and Venkatachalapathy, R. T. (2021). Analysis of the effects of thermal stress on milk production in a humid tropical climate using linear and non-linear models. Trop. Anim. Health. Prod. 53, 1–7. doi: 10.1007/s11250-020-02525-x
Qian, B., Jing, Q., Smith, W., Grant, B., Cannon, A. J., and Zhang, X. (2020). Quantifying the uncertainty introduced by internal climate variability in projections of Canadian crop production. Environ. Res. Lett. 15:074032. doi: 10.1088/1748-9326/ab88fc
Rahmoun, T., Hassan, M., and Alhasan, W. (2016). Protection strategy for the coastal areas of climate change. Res. J. Appl. Sci. Eng. Technol. 12, 264–271. doi: 10.19026/rjaset.12.2333
Rebetez, M., Dupont, O., and Giroud, M. (2009). An analysis of the July 2006 heatwave extent in Europe compared to the record year of 2003. Theor. Appl. Climatol. 95, 1–7. doi: 10.1007/s00704-007-0370-9
Ren, J. Y., Liu, H. M., Ding, S. Y., and Cao, Z. H. (2021a). Spatio-temporal variation characteristics of water quality and its response to climate: a case study in Yihe River Basin. J. Environ. Inform. Lett. 6, 10–22. doi: 10.3808/jeil.202100070
Ren, J. Y., Huang, G. H., Li, Y. P., Zhou, X., Lu, C., and Duan, R. X. (2021b). Stepwise-clustered heatwave downscaling and projection for Guangdong Province. Int. J. Climatol. doi: 10.1002/joc.7393
Ridder, N. N., Pitman, A. J., Westra, S., Hong, X. D., and Zscheischler, J. (2020). Global hotspots for the occurrence of compound events. Nat. Commun. 11:5956. doi: 10.1038/s41467-020-19639-3
Sen, P. K. (1968). Estimates of the regression coefficient based on Kendall’s tau. J. Am. Stat. Assoc. 63, 1379–1389. doi: 10.1080/01621459.1968.10480934
Shi, X., Xu, X., and Xie, L. (2007). Reliability analyses of anomalies of NCEP/NCAR reanalyzed wind speed and surface air temperature in climate change research in China. Acta. Meteorol. Sin. 21, 320–333. doi: 10.1021/am4044807
Shiva, J. S., Chandler, D. G., and Kunkel, K. E. (2019). Localized changes in heatwave properties across the United States. Earths Future. 7, 300–319. doi: 10.1029/2018EF001085
Simmons, A. J., Jones, P. D., Costa Bechtold, V., Beljaars, A. C. M., Kållberg, P. W., Saarinen, S., et al. (2004). Comparison of trends and low-frequency variability in CRU, ERA-40, and NCEP/NCAR analyses of surface air temperature. J. Geophys. Res. Atmos. 109, 1–18. doi: 10.1029/2004JD005306
Smale, D. A., and Wernberg, T. (2013). Extreme climatic event drives range contraction of a habitat-forming species. Proc. Biol. Sci. 280:20122829. doi: 10.1098/rspb.2012.2829
Smale, D. A., Wernberg, T., Oliver, E. C. J., Thomsen, M., Harvey, B. P., Straub, S. C., et al. (2019). Marine heatwaves threaten global biodiversity and the provision of ecosystem services. Nat. Clim. Chang. 9, 306–312. doi: 10.1038/s41558-019-0412-1
Sun, Q., Wu, Z., and Tan, J. (2012). The relationship between land surface temperature and land use/land cover in Guangzhou, China. Environ. Earth. Sci. 65, 1687–1694. doi: 10.1007/s12665-011-1145-2
Sun, W., Shi, Q., Huang, Y., and Lv, Y. (2019). Ensemble learning enhanced stepwise cluster analysis for river ice breakup date forecasting. J. Environ. Inform. 1, 37–47. doi: 10.3808/jeil.201900005
Sun, X., Luo, X., Cao, G., Zhao, C., Xiao, J., Liu, X., et al. (2020). Associations of ambient temperature exposure during pregnancy with the risk of miscarriage and the modification effects of greenness in Guangdong, China. Sci. Total Environ. 702:134988. doi: 10.1016/j.scitotenv.2019.134988
Sun, Y., Zhang, X., Zwiers, F. W., Song, L. C., Wan, H., Hu, T., et al. (2014). Rapid increase in the risk of extreme summer heat in Eastern China. Nat. Clim. Chang. 4, 1082–1085. doi: 10.1038/nclimate2410
Suryan, R. M., Arimitsu, M. L., Coletti, H. A., Hopcroft, R. R., Lindeberg, M. R., Barbeaux, S. J., et al. (2021). Ecosystem response persists after a prolonged marine heatwave. Sci. Rep. 11:6235. doi: 10.1038/s41598-021-83818-5
Sutton, R. (2009). The potential to narrow uncertainty in regional climate predictions. Biol. Am. Meteorol. Soc. 90, 1095–1108.
Tao, L., Yan, J. X., Yong, H. Z., Yan, Q. H., and Ma, W. J. (2013). Associations between risk perception, spontaneous adaptation behavior to heat waves and heatstroke in Guangdong province, China. BMC. Public Health 13:913. doi: 10.1186/1471-2458-13-913
Tian, C., Huang, G., Lu, C., Zhou, X., and Duan, R. (2021). Development of enthalpy-based climate indicators for characterizing building cooling and heating energy demand under climate change. Renew. Sust. Energ. Rev. 143:110799. doi: 10.1016/j.rser.2021.110799
Vogel, M. M., Zscheischler, J., Wartenburger, R., Dee, D., and Seneviratne, S. I. (2019). Concurrent 2018 hot extremes across northern hemisphere due to human-induced climate change. Earths Future 7, 692–703.
Wang, F., Huang, G. H., Li, Y. P., Xu, J. L., Wang, G. Q., Zhang, J. Y., et al. (2021). A statistical hydrological model for Yangtze River watershed based on stepwise cluster analysis. Front. Earth Sci. 9:742331. doi: 10.3389/feart.2021.742331
Wang, P., Tang, J., Sun, X., Liu, J., and Fang, J. (2018). Spatiotemporal characteristics of heat waves over China in regional climate simulations within the CORDEX-EA project. Clim. Dyn. 52, 799–818. doi: 10.1007/s00382-018-4167-6
Wang, P., Tang, J., Sun, X., Wang, S., Wu, J., Dong, X., et al. (2017). Heat waves in China: definitions, leading patterns, and connections to large-scale atmospheric circulation and SSTs. J. Geophys. Res. Atmos. 122, 10679–10699. doi: 10.1002/2017JD027180
Wang, W. W., Zhou, W., Wang, X., Fong, S. K., and Leong, K. C. (2013). Summer high temperature extremes in southeast China associated with the East Asian jet stream and circumglobal teleconnection. J. Geophys. Res. Atmos. 118, 8306–8319. doi: 10.1002/jgrd.50633
Wang, X., Huang, G., Baetz, B., and Zhao, B. (2017). Probabilistic projections of regional climatic changes over the great lakes basin. Clim. Dynam. 49, 2237–2247. doi: 10.1007/s00382-016-3450-7
Wang, X. Q., and Huang, G. H. (2015). Impacts assessment of air emissions from point sources in Saskatchewan, Canada – a spatial analysis approach. Environ. Prog. Sustain. Energy. 34, 304–313. doi: 10.1002/ep.11948
Wang, X. Q., Huang, G. H., Lin, Q. Y., Nie, X. H., Cheng, G. H., and Fan, Y. R. (2013). A stepwise cluster analysis approach for downscaled climate projection – a Canadian case study. Environ. Modell. Softw. 49, 141–151. doi: 10.1016/j.envsoft.2013.08.006
Wang, X. R., Qiu, B., Li, W. K., and Zhang, Q. (2019). Impacts of drought and heatwave on the terrestrial ecosystem in China as revealed by satellite solar-induced chlorophyll fluorescence. Sci. Total Environ. 693:133627. doi: 10.1016/j.scitotenv.2019.133627
Webber, H., Ewert, F., Olesen, J. E., Müller, C., Fronzek, S., Ruane, A. C., et al. (2018). Diverging importance of drought stress for maize and winter wheat in Europe. Nat. Commun. 9:4249. doi: 10.1038/s41467-018-06525-2
Wilby, R. L., Dawson, C. W., and Barrow, E. M. (2002). sdsm — a decision support tool for the assessment of regional climate change impacts. Environ. Modell. Softw. 17, 145–157. doi: 10.1016/s1364-8152(01)00060-3
Woolway, R. I., Jennings, E., Shatwell, T., Golub, M., and Maberly, S. C. (2021). Lake heatwaves under climate change. Nature 589, 402–407. doi: 10.1038/s41586-020-03119-1
Wu, H., Chen, B., Snelgrove, K., and Lye, L. M. (2017). Quantification of uncertainty propagation effects during statistical downscaling of precipitation and temperature to hydrological modeling. J. Environ. Inform. 34, 139–148. doi: 10.3808/jei.201600347
Wu, X. Y., Hao, Z. C., Tang, Q. H., Singh, V. P., Zhang, X., and Hao, F. H. (2020). Projected increase in compound dry and hot events over global land areas. Int. J. Climatol. 41, 393–403. doi: 10.1002/joc.6626
Wu, Y., Tang, G., Gu, H., Liu, Y., Yang, M., and Sun, L. (2019). The variation of vegetation greenness and underlying mechanisms in Guangdong province of China during 2001–2013 based on MODIS data. Sci. Total Environ. 653, 536–546. doi: 10.1016/j.scitotenv.2018.10.380
Xie, Y., Crary, D., Bai, Y., Cui, X., and Zhang, A. (2017). Modeling grassland ecosystem responses to coupled climate and socioeconomic influences in multi-spatial-and-temporal scales. J. Environ. Inform. 33, 37–46. doi: 10.3808/jei.201600337
Xu, L., and Wang, A. (2019). Application of the bias correction and spatial downscaling algorithm on the temperature extremes from CMIP5 multimodel ensembles in China. Earth Space Sci. 6, 2508–2524. doi: 10.1029/2019EA000995
Xu, Y., and Ding, Y. (2001). Confidence analysis of NCEP/NCAR 50-year global reanalyzed data in climate change research in China. J. Appl. Meter. 2001, 337–347.
Yang, J., Liu, H. Z., Ou, C. Q., Lin, G. Z., Qin, Z., Shen, G. C., et al. (2013). Global climate change: impact of diurnal temperature range on mortality in Guangzhou, China. Environ. Pollut. 175, 131–136. doi: 10.1016/j.envpol.2012.12.021
Yang, J., Yuhua, H., Luo, Y., and Xue, C. (2018). Study on the distribution and dynamic change of mangrove in Guangdong. Forestry Environ. Sci. 34, 24–27.
Yu, X., Shen, M., Wang, D., and Imwa, B. T. (2019). Does the low-carbon pilot initiative reduce carbon emissions? Evidence from the application of the synthetic control method in Guangdong province. Sustainability 11:3979. doi: 10.3390/su11143979
Yu, Y., Liang, J. Y., Li, J. L., Xiao, Y. B., Qian, G. M., and Lv, Y. P. (2007). Assessment report on climate change of Guangdong(selection). Guangdong Meteorol. 29, 1–6.
Yuan, W., Cai, W., Chen, Y., Liu, S., Dong, W., Zhang, H., et al. (2016). Severe summer heatwave and drought strongly reduced carbon uptake in Southern China. Sci. Rep. 6:18813. doi: 10.1038/srep18813
Zampieri, M., Ceglar, A., Dentener, F., and Toreti, A. (2017). Wheat yield loss attributable to heat waves, drought and water excess at the global, national and subnational scales. Environ. Res. Lett. 12:064008. doi: 10.1088/1748-9326/aa723b
Zanatta, F., Engler, R., Collart, F., Broennimann, O., Mateo, R. G., Papp, B., et al. (2020). Bryophytes are predicted to lag behind future climate change despite their high dispersal capacities. Nat. Commun. 11:5601. doi: 10.1038/s41467-020-19410-8
Zeng, X., Qian, G. M., Chen, T. G., Zhang, J. Y., and Yu, K. F. (2006). Characteristics of urban heat-island effect in the coastal cities of Guangdong. Meteorological 11, 94–97. doi: 10.1111/j.1744-7917.2006.00098.x
Zhai, Y., Huang, G., Wang, X., Zhou, X., Lu, C., and Li, Z. (2019). Future projections of temperature changes in Ottawa, Canada through stepwise clustered downscaling of multiple GCMs under RCPs. Clim. Dynam. 52, 3455–3470. doi: 10.1007/s00382-018-4340-y
Zhang, L., Zhao, Z., Ye, T., Zhou, M., Wang, C., Yin, P., et al. (2018). Mortality effects of heat waves vary by age and area: a multi-area study in China. Environ. Health 17, 54. doi: 10.1186/s12940-018-0398-6
Zhang, P., Yan, J., Li, Y., Tang, B., and Wang, W. (2018). A study on the heatwave of Guangdong province and Guangxi in summer from 1960 to 2015. J. Zhejiang Univ. (Science Edition) 45, 73–81.
Zhang, Y., Nitschke, M., Krackowizer, A., De Ar, K., Pisaniello, D., Weinstein, P., et al. (2017). Risk factors for deaths during the 2009 heat wave in Adelaide, Australia: a matched case-control study. Int. J. Biometeorol. 61, 35–47. doi: 10.1007/s00484-016-1189-9
Zhao, C., Liu, B., Piao, S. L., Wang, X. H., Lobell, D. B., Huang, Y., et al. (2017). Temperature increase reduces global yields of major crops in four independent estimates. Proc. Natl. Acad. Sci. U.S.A. 114:9326. doi: 10.1073/pnas.1701762114
Zheng, S. G., Huang, G. H., Zhou, X., and Zhu, X. H. (2019). Climate-change impacts on electricity demands at a metropolitan scale: a case study of Guangzhou, China. Appl. Energ. 261:114295. doi: 10.1016/j.apenergy.2019.114295
Zhou, B. T., Wen, Q. Z., Xu, Y., Song, L. C., and Zhang, X. B. (2014). Projected changes in temperature and precipitation extremes in China by the CMIP5 multimodel ensembles. J. Clim. 27, 6591–6611. doi: 10.1175/JCLI-D-13-00761.1
Zhou, L., Tian, Y., Myneni, R. B., Ciais, P., Saatchi, S., Liu, Y. Y., et al. (2014). Widespread decline of Congo rainforest greenness in the past decade. Nature 509, 86–90. doi: 10.1038/nature13265
Zhou, X., Huang, G. H., Wang, X. Q., and Cheng, G. H. (2018). Future changes in precipitation extremes over Canada: driving factors and inherent mechanism. J. Geophys. Res. Atmos. 123, 5783–5803. doi: 10.1029/2017JD027735
Zhou, X., Huang, G. H., Li, Y. P., Lin, Q. G., Yan, D. H., and He, X. J. (2021). Dynamical downscaling of temperature variations over the canadian prairie provinces under climate change. Remote Sens. 13:4350. doi: 10.3390/rs13214350
Zhu, J. X., Huang, G. H., Wang, X. Q., Cheng, G. H., and Wu, Y. H. (2018). High-resolution projections of mean and extreme precipitations over China through PRECIS under RCPs. Clim. Dyn. 50, 4037–4060. doi: 10.1007/s00382-017-3860-1
Zhu, Q., Liu, T., Lin, H., Xiao, J., Luo, Y., Zeng, W., et al. (2014). The spatial distribution of health vulnerability to heat waves in Guangdong province, China. Glob. Health Action. 7:25051. doi: 10.3402/gha.v7.25051
Keywords: heat wave, heat wave downscaling, future projection, climate variation, ecosystem
Citation: Ren J, Huang G, Li Y, Zhou X, Xu J, Yang Z, Tian C and Wang F (2021) A Stepwise-Clustered Simulation Approach for Projecting Future Heat Wave Over Guangdong Province. Front. Ecol. Evol. 9:761251. doi: 10.3389/fevo.2021.761251
Received: 19 August 2021; Accepted: 17 November 2021;
Published: 14 December 2021.
Edited by:
Shan Zhao, Shandong University, ChinaReviewed by:
Dimitrios Melas, Aristotle University of Thessaloniki, GreecePeng Zhang, Fudan University, China
Wei Sun, Sun Yat-sen University, China
Copyright © 2021 Ren, Huang, Li, Zhou, Xu, Yang, Tian and Wang. This is an open-access article distributed under the terms of the Creative Commons Attribution License (CC BY). The use, distribution or reproduction in other forums is permitted, provided the original author(s) and the copyright owner(s) are credited and that the original publication in this journal is cited, in accordance with accepted academic practice. No use, distribution or reproduction is permitted which does not comply with these terms.
*Correspondence: Guohe Huang, aHVhbmdAaXNlaXMub3Jn