 Antonia L. Reinhardt1†
 Thomas Kasper2†
 Maximilian Lochner2†
 Marcel Bliedtner2
 Kim J. Krahn3
 Torsten Haberzettl4
 Lyudmila Shumilovskikh1Jean-Jacques Rahobisoa5Roland Zech2Charly Favier6Hermann Behling1Laurent Bremond6
 Gerhard Daut2*‡
 Vincent Montade6*‡
- 1Department of Palynology and Climate Dynamics, Albrecht-von-Haller-Institute for Plant Sciences, University of Goettingen, Göttingen, Germany
- 2Physical Geography, Institute of Geography, Friedrich Schiller University Jena, Jena, Germany
- 3Institute of Geosystems and Bioindication, Technische Universität Braunschweig, Braunschweig, Germany
- 4Physical Geography, Institute for Geography and Geology, University of Greifswald, Greifswald, Germany
- 5Department of Earth Sciences, Faculty of Sciences, University of Antananarivo, Antananarivo, Madagascar
- 6ISEM, Univ Montpellier, CNRS, IRD, Montpellier, France
Madagascar houses one of the Earth’s biologically richest, but also one of most endangered, terrestrial ecoregions. Although it is obvious that humans substantially altered the natural ecosystems during the past decades, the timing of arrival of early inhabitants on Madagascar as well as their environmental impact is still intensively debated. This research aims to study the beginning of early human impact on Malagasy natural ecosystems, specifically on Nosy Be island (NW Madagascar) by targeting the sedimentary archive of Lake Amparihibe, an ancient volcanic crater. Based on pollen, fungal spore, other non-pollen palynomorph, charcoal particle and diatom analyses combined with high-resolution sediment-physical and (in)organic geochemical data, paleoenvironmental dynamics during the past three millennia were reconstructed. Results indicate a major environmental change at ca. 1300 cal BP characterized by an abrupt development of grass (C4) dominated and fire disturbed landscape showing the alteration of natural rain forest. Further, increased soil erodibility is suggested by distinct increase in sediment accumulation rates, a strong pulse of nutrient input, higher water turbidity and contemporaneous increase in spores of mycorrhizal fungi. These parameters are interpreted to show a strong early anthropogenic transformation of the landscape from rain forest to open grassland. After ca. 1000 cal BP, fires remain frequent and vegetation is dominated by forest/grassland mosaic. While natural vegetation should be dominated by rain forest on Nosy Be, these last results indicate that human continuously impacted the landscapes surrounding the lake. At a local scale, our data support the “subsistence shift hypothesis” which proposed that population expansion with development of herding/farming altered the natural ecosystems. However, a precise regional synthesis is challenging, since high-resolution multi-proxy records from continuous sedimentary archives as well as records located further north and in the hinterland are still scarce in Madagascar. The lack of such regional synthesis also prevents precise comparison between different regions in Madagascar to detect potential (dis)similarities in climate dynamics, ecosystem responses and anthropogenic influences at the island’s scale during the (late) Holocene.
Introduction
Environmental change is a consequence of various kinds of causes. For one thing, natural factors are driving climate and environmental dynamics, however mostly on longer (millennial/orbital) time-scales. These natural, long-term dynamics are recently challenged by a global overprint of direct human impact on all compartments of nature, most obviously seen in increasing rates of loss in biodiversity. Also during past millennia, human impact has triggered environmental change and biodiversity loss, however only on local or regional scale. In this context the conservation of natural ecosystems and biodiversity is one of the greatest challenges of the 21st century (IPCC, 2021). The key to estimate future developments of ecosystems and to improve conservation strategies is, to study and disentangle past human impact and natural factors of climate and environmental dynamics. This is especially important in “closed” and “isolated” environments such as islands which generally harbor endemic and vulnerable biodiversity (Nogué et al., 2017, 2021; Whittaker et al., 2017; Wood et al., 2017). In tropical to subtropical regions, islands and their ecosystems were frequently impacted by human colonization (Burney, 1997; Kahn et al., 2015; Gosling et al., 2017; Castilla-Beltrán et al., 2019; de Nascimento et al., 2020). Without written archives, paleorecords (e.g., from lake sediments, speleothems, peatbogs) are one of the best tools to assess human impact in the past (Battarbee and Bennion, 2011; Garcin et al., 2018a; Wang et al., 2019). However, the distinction between natural and human induced ecosystem shifts within these archives can be challenging. Human activities, such as deforestation or artificial fire, which lead to a loss of trees can easily be mixed up with natural effects like very dry climatic conditions (e.g., Clist et al., 2018; Garcin et al., 2018b; Maley et al., 2018; Bayon et al., 2019). Madagascar, characterized by one of the world’s biologically richest ecosystems, does not deviate from this rule. Early human colonization and its impact on natural environmental changes of this island has been intensively debated for decades (Burney et al., 2003; Virah-Sawmy et al., 2010; Dewar et al., 2013; Anderson et al., 2018; Anderson, 2019; Godfrey et al., 2019; Crowley et al., 2021). Whereas initial settlement of Madagascar prior to 2000 cal BP still remains poorly resolved (Dewar et al., 2013; Anderson et al., 2018; Hansford et al., 2018; Douglass et al., 2019), recent studies on speleothems from northwestern Madagascar suggested that a major ecosystem shift, recorded at ca. 1250-1200 cal BP, was the result of an abrupt transition in human subsistence strategy (Burns et al., 2016; Voarintsoa et al., 2017; Railsback et al., 2020). The “subsistence shift hypothesis,” that consists to the transition from hunting/foraging to herding/farming, has been proposed by Godfrey et al. (2019) to explain the observed changes. Specifically, this transition would have affected habitats by strongly increasing fire frequency which triggered a rapid expansion of grassland at the expense of forest. In addition, population expansion and hence increased anthropogenic impacts, as well as introduction of livestock (Dewar and Wright, 1993) is assumed to have led to destruction of natural wildlife habitats and finally may have caused the extinction of Madagascar’s megafauna (Crowley, 2010). Recent studies on the herbivore’s diet support various competition factors between endemic and introduced fauna superimposed by environmental change as the main reasons for endemic extinctions (Hixon et al., 2021b,a). Despite these significant advances, disagreements still remain between studies from different regions, regarding the timing and intensity of changes, and the respective interrelation between humans and climate (e.g., Burney, 1987; Matsumoto and Burney, 1994; Virah-Sawmy et al., 2010; Anderson et al., 2018; Godfrey et al., 2019). In order to improve our understanding of this critical and complex transition, it is a necessity to increase spatial resolution of paleoenvironmental study sites to provide new data. Furthermore, the reanalyzes of previously studied sites with more detailed analyses are important as they can improve chronologies, add new proxies or increase the spatial or temporal data-resolution.
In this context, the present study focuses on Lake Amparihibe from Nosy Be island first studied by Burney (1999) and Burney et al. (2003). Previous results showed an increase in fire activity with a rise of Sporormiella at 1130 ± 50 14C BP which corresponds to a calibrated age [Calib 8.20 (Stuiver and Reimer, 1993) using the SHCal20 curve (Hogg et al., 2020)] of 1000 +180/–90 cal BP. This was interpreted as human transformation of the local landscape with the development of agriculture (e.g., rice) and first introduction of livestock (cattle, goats and sheep) on Nosy Be by Islamized Indian Ocean traders (Burney et al., 2003; Wright and Radimilahy, 2005). This site therefore represents a key record to illustrate human induced environmental change for the northwestern region of Madagascar and is frequently used as a benchmark for regional comparisons (e.g., Railsback et al., 2020). However, chronological control of this study is quite poor (two radiocarbon dates), and detailed study of sedimentological changes and past vegetation dynamics have not been published. To refine previous analyses and close these obvious gaps, Lake Amparihibe was once more targeted, especially as this site also exhibits excellent conditions to provide a high-resolution record of paleoenvironmental change. Lake Amparihibe represents a deep crater lake (ca. 50 m water depth) making it impervious against desiccation. Thus, it is anticipated that sediments within the lake have continuously recorded past environmental changes in a region where deep lakes are rare, particularly at low elevation. The location of the lake in the northwestern region, close to the coast, makes it also ideal to study initial human impact, since occupation and the establishment of settlements are anticipated to have occurred quite early in this region (Radimilahy, 1997; Dewar et al., 2013; Douglass et al., 2019).
Thus, pollen, fungal spores, other non-pollen palynomorphs (NPPs), macro-charcoal particles and diatom analyses combined with high-resolution sediment-physical and (in)organic geochemical data from Lake Amparihibe will provide an excellent base for comparisons with high-resolution paleoclimate records obtained from speleothems in northwestern Madagascar (Burns et al., 2016; Scroxton et al., 2017; Voarintsoa et al., 2017; Wang et al., 2019; Li et al., 2020; Railsback et al., 2020). Such multiproxy comparisons of different geoarchives are essential for better distinguishing natural from human induced ecosystem shifts in the past.
Environmental Setting
The small island of Nosy Be (320 km2) is located approximately 10 km off the northwestern Madagascar coast (Figure 1A). Nosy Be island is formed by a sedimentary bedrock pierced by volcanic vents and plutonic intrusions during the late Cenozoic and Quaternary (14-0.5 Ma; Cucciniello et al., 2016). This activity resulted in an important volcanic complex surrounding the peak of Mt. Passot (329 m a.s.l., western Nosy Be) with lava flows and tuff rings filled by nine freshwater lakes. The largest of these maar lakes, Lake Amparihibe (-13.32°N, 48.21°E, 71 m a.s.l., 163 ha, Figure 1B), a sub-circular crater of 1.5 km diameter with steep slopes at the lake shore and ca. 50 m water depth (Figures 1B,C), is the target of this study. Its catchment with a size of 713 ha is drained by three major channels, two of them passing the two maar lakes east of the lake (Antsidihy and Maintimaso) and one originating from a third maar lake (Bemapaza). Located on altitudes of 236 m a.s.l. (Bemapaza), 94 m a.s.l. (Antsidihy) and 89 m a.s.l. (Maintimaso) all the lakes are connected hydraulically to Lake Amparihibe forming a lake-cascade and serve as primary sediment traps for a big portion of the catchment (Figure 1B).
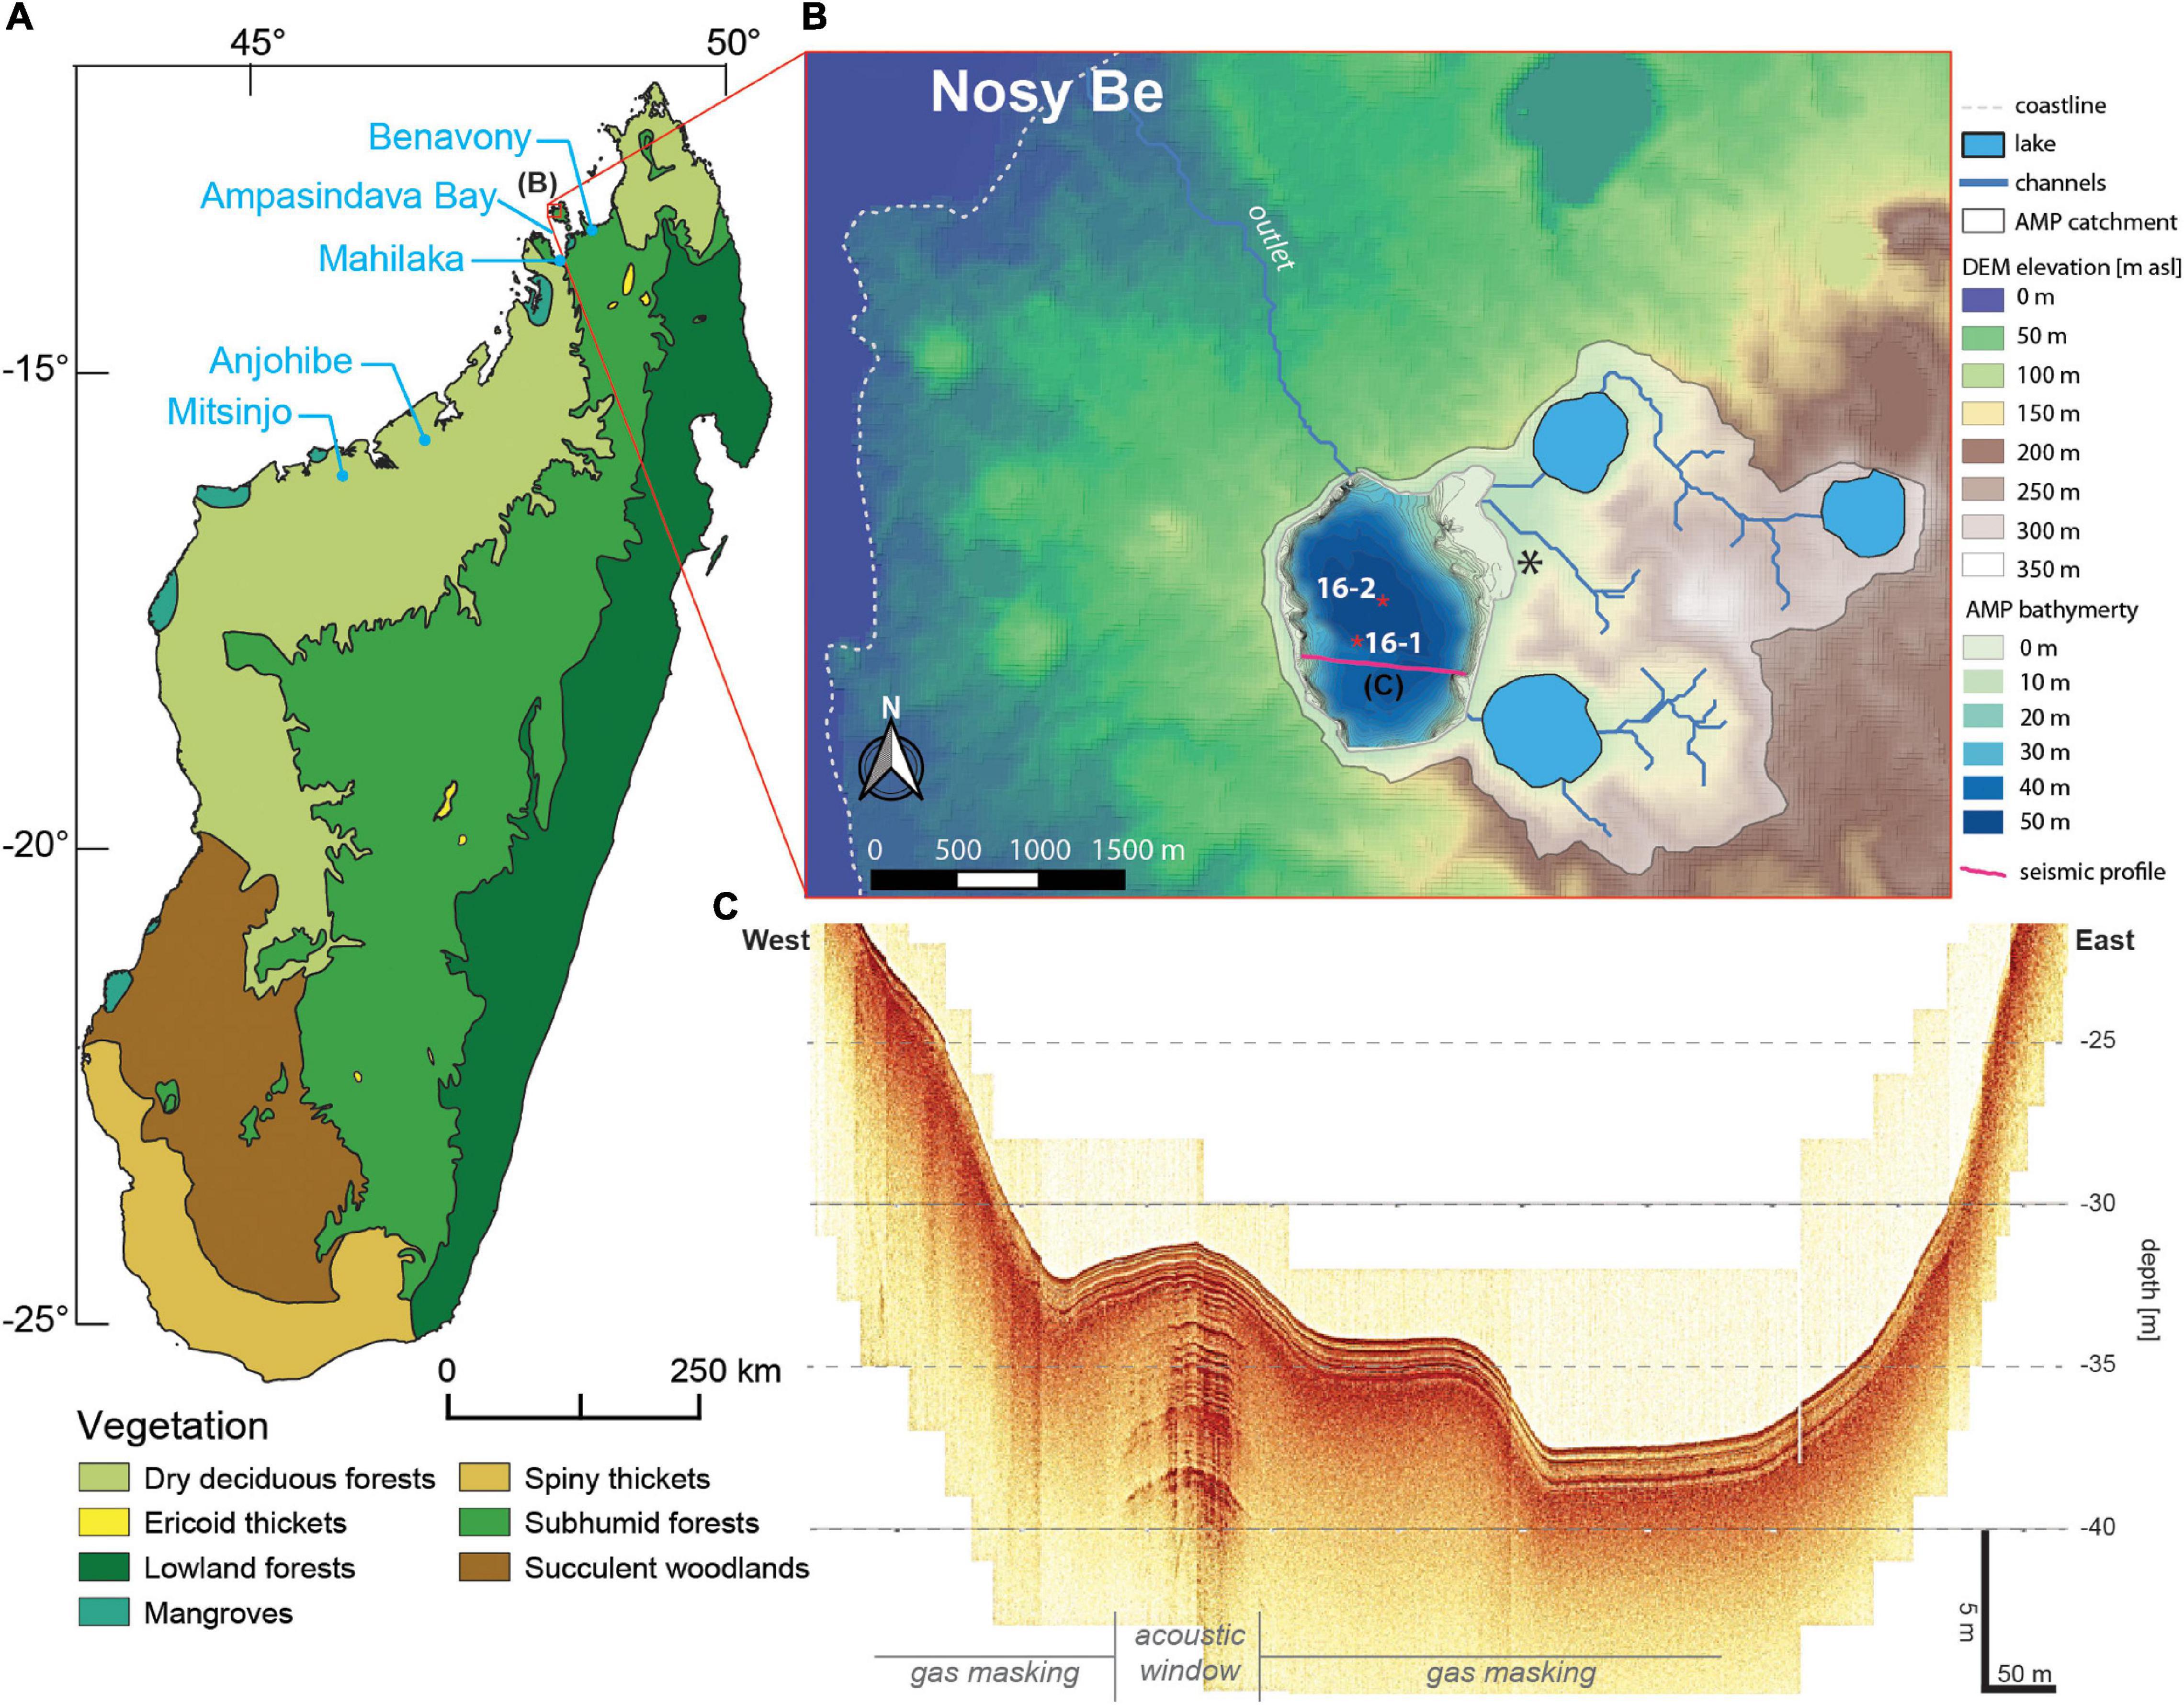
Figure 1. (A) Distribution map of natural biomes in Madagascar (Olson et al., 2001). (B) Close up topography of western Nosy Be including the catchment of Lake Amparihibe (AMP), lake bathymetry, coring positions (red stars) and the location of the seismic profile in the lake (purple line) shown in panel (C), as well as an archeological site (black asterisk; Wright and Radimilahy, 2005) (data source: DEM data derived from SRTM 1 arc-second (06/2021 – https://earthdata.nasa.gov/); bathymetric data based on interpolation of seismic profile lines; map creation with QGIS 3.1). (C) Typical seismic image of Lake Amparihibe. The uppermost ca. 1.5 m of the deposits show clearly layered sediments, further penetration is only possible within acoustic windows, which show well-layered sediments down to at least 10 m sediment depth. The limited penetration results from widely distributed gas in the sediment most likely due to decomposition of organic matter. A clear basement reflector was not detected.
Climate is tropical sub-humid in northwestern Madagascar, the region surrounding Nosy Be and Ampasindava bay and it corresponds to the most humid area of the west coast of Madagascar. Mean annual temperature is around 25°C without major seasonal variability. Due to its location, precipitation at Nosy Be is affected by the proximity to the ocean (Mozambique Channel, Indian Ocean) with mean annual precipitation ranging around 2000 mm (Hijmans et al., 2005). Precipitation rates show a strong seasonality, with a maximum during austral summer (November to April) including strong summer monsoon rainfalls accompanied by frequent tropical storms or cyclones, related to the southern position of the Inter Tropical Convergence Zone. During austral winter, rainfalls are less and generally related to trade winds.
With a dry season almost absent, the natural vegetation is a subhumid rain forest called Sambirano rain forest (Koechlin et al., 1974). This forest is part of the East-West rain forest corridor distributed between northwestern and northeastern Madagascar (Figure 1A). Despite some differences in species composition compared to the forest developed in eastern Madagascar, the main plant families are similar (Koechlin et al., 1974). Among the main tree families are Euphorbiaceae, Rubiaceae, Araliaceae, Ebenaceae, Sapindaceae, Anacardiaceae, Elaeocarpaceae, Lauraceae, Myrtaceae and among the most represented shrub are Ochnaceae, Erythroxylaceae, Myrsinaceae and Celastraceae. Liana and epithetic plants are also well represented by Apocynaceae, Fabaceae, Acanthaceae and Combretaceae. Some families are highly diversified and include many different genera and species, among them are Urticaceae and Melastomataceae. However, due to human impact, natural vegetation on Nosy Be island is now characterized by a secondary complex vegetation including about 14% of rain forest, 41% of wooded savanna, 12% of grasslands and 33% of crops mosaics (Mayaux et al., 2000). Typical trees of secondary forest, such as Trema orientalis are now common in the remaining Sambirano rain forest (Rasoanaivo et al., 2015). Close to the study site, west of Lake Amparihibe, the vegetation is dominated by a wooded grassland-bushland mosaic. To the east, vegetation assemblage shows a succession following an altitude gradient up to the peak of Mt. Passot, with a wide spectrum of species from shrub bushland to rain forest (Koechlin et al., 1974; Moat, 2007).
Materials and Methods
Pre-site Survey/Hydro-Acoustics
Prior to sediment sampling a shallow seismic survey was conducted to map basin morphology, sediment thickness and structures. A parametric sediment echosounder (SES 2000light, Innomar Technologie) with a primary frequency of 100 kHz and a secondary frequency range of 4 – 15 kHz, depending on the desired resolution and penetration depth was applied. Positioning was provided by GPS (Navilock NEO M8U Multi GNSS UDR Receiver). The echosounder was calibrated to a sound velocity of 1460 ms–1 for depth measurements. With these settings, a dense grid of altogether 25 km of profiles were acquired. Final processing of the data was done with the software ISE 2.95 (Innomar Technologie).
Sampling, Water Data, and Chronology
Fieldwork was carried out in November 2016 and based on the shallow seismic survey, two positions within the lake were identified as the most suitable for coring using a gravity coring system (06/20211). AMP16-1 (-13.323917°; 48.209889°) with a total length of 164.5 cm was taken at a water depth of 45 m, ∼300 m apart from AMP16-2 which is 168 cm long and obtained at the deepest part of the lake (-13.322106°; 48.211828°, 50 m water depth) (Figure 1B). Concurrently, vertical in situ water parameter measurements were conducted using a WTW MPP 3430 multi parameter probe for pH, dissolved oxygen, conductivity and temperature next to AMP 16-1 (Figure 1B). Water transparency was assessed with a Secchi disk. Cores were stored under cool (4°C) and dark conditions at the laboratory facilities (Physical Geography department, Friedrich-Schiller-University Jena, Germany) until further processing. Cores were split, photographed and described following standard protocols. Magnetic susceptibility was scanned in 2 mm steps with three replicate measurements using a MS2E surface scanning sensor (Bartington Instruments). Based on the initial description, both cores showed different sediment accumulation rates with AMP 16-1 obviously reaching farther back in time. However, since previous analyses of AMP 16-1 found hints for a reworked upper part of the core (at least uppermost 20 cm; Haberzettl et al., 2021; Supplementary Figure 1), the two cores were aligned and combined to a composite master sequence (“AMP-16”) using lithological description, patterns of magnetic susceptibility, and specific marker layers (Figure 2 and Supplementary Figure 1). The most outstanding marker layer, expressed as a 6 mm thick orange-brown fine-grained layer, exhibiting the maximum value in magnetic susceptibility at 99.4 cm core depth in core AMP 16-1, as well as its equivalent layer at 156 cm depth in core AMP 16-2 (Supplementary Figure 1) was used as transition depth from AMP 16-2 (=upper part of the composite) to AMP 16-1 (=lower part of the composite).
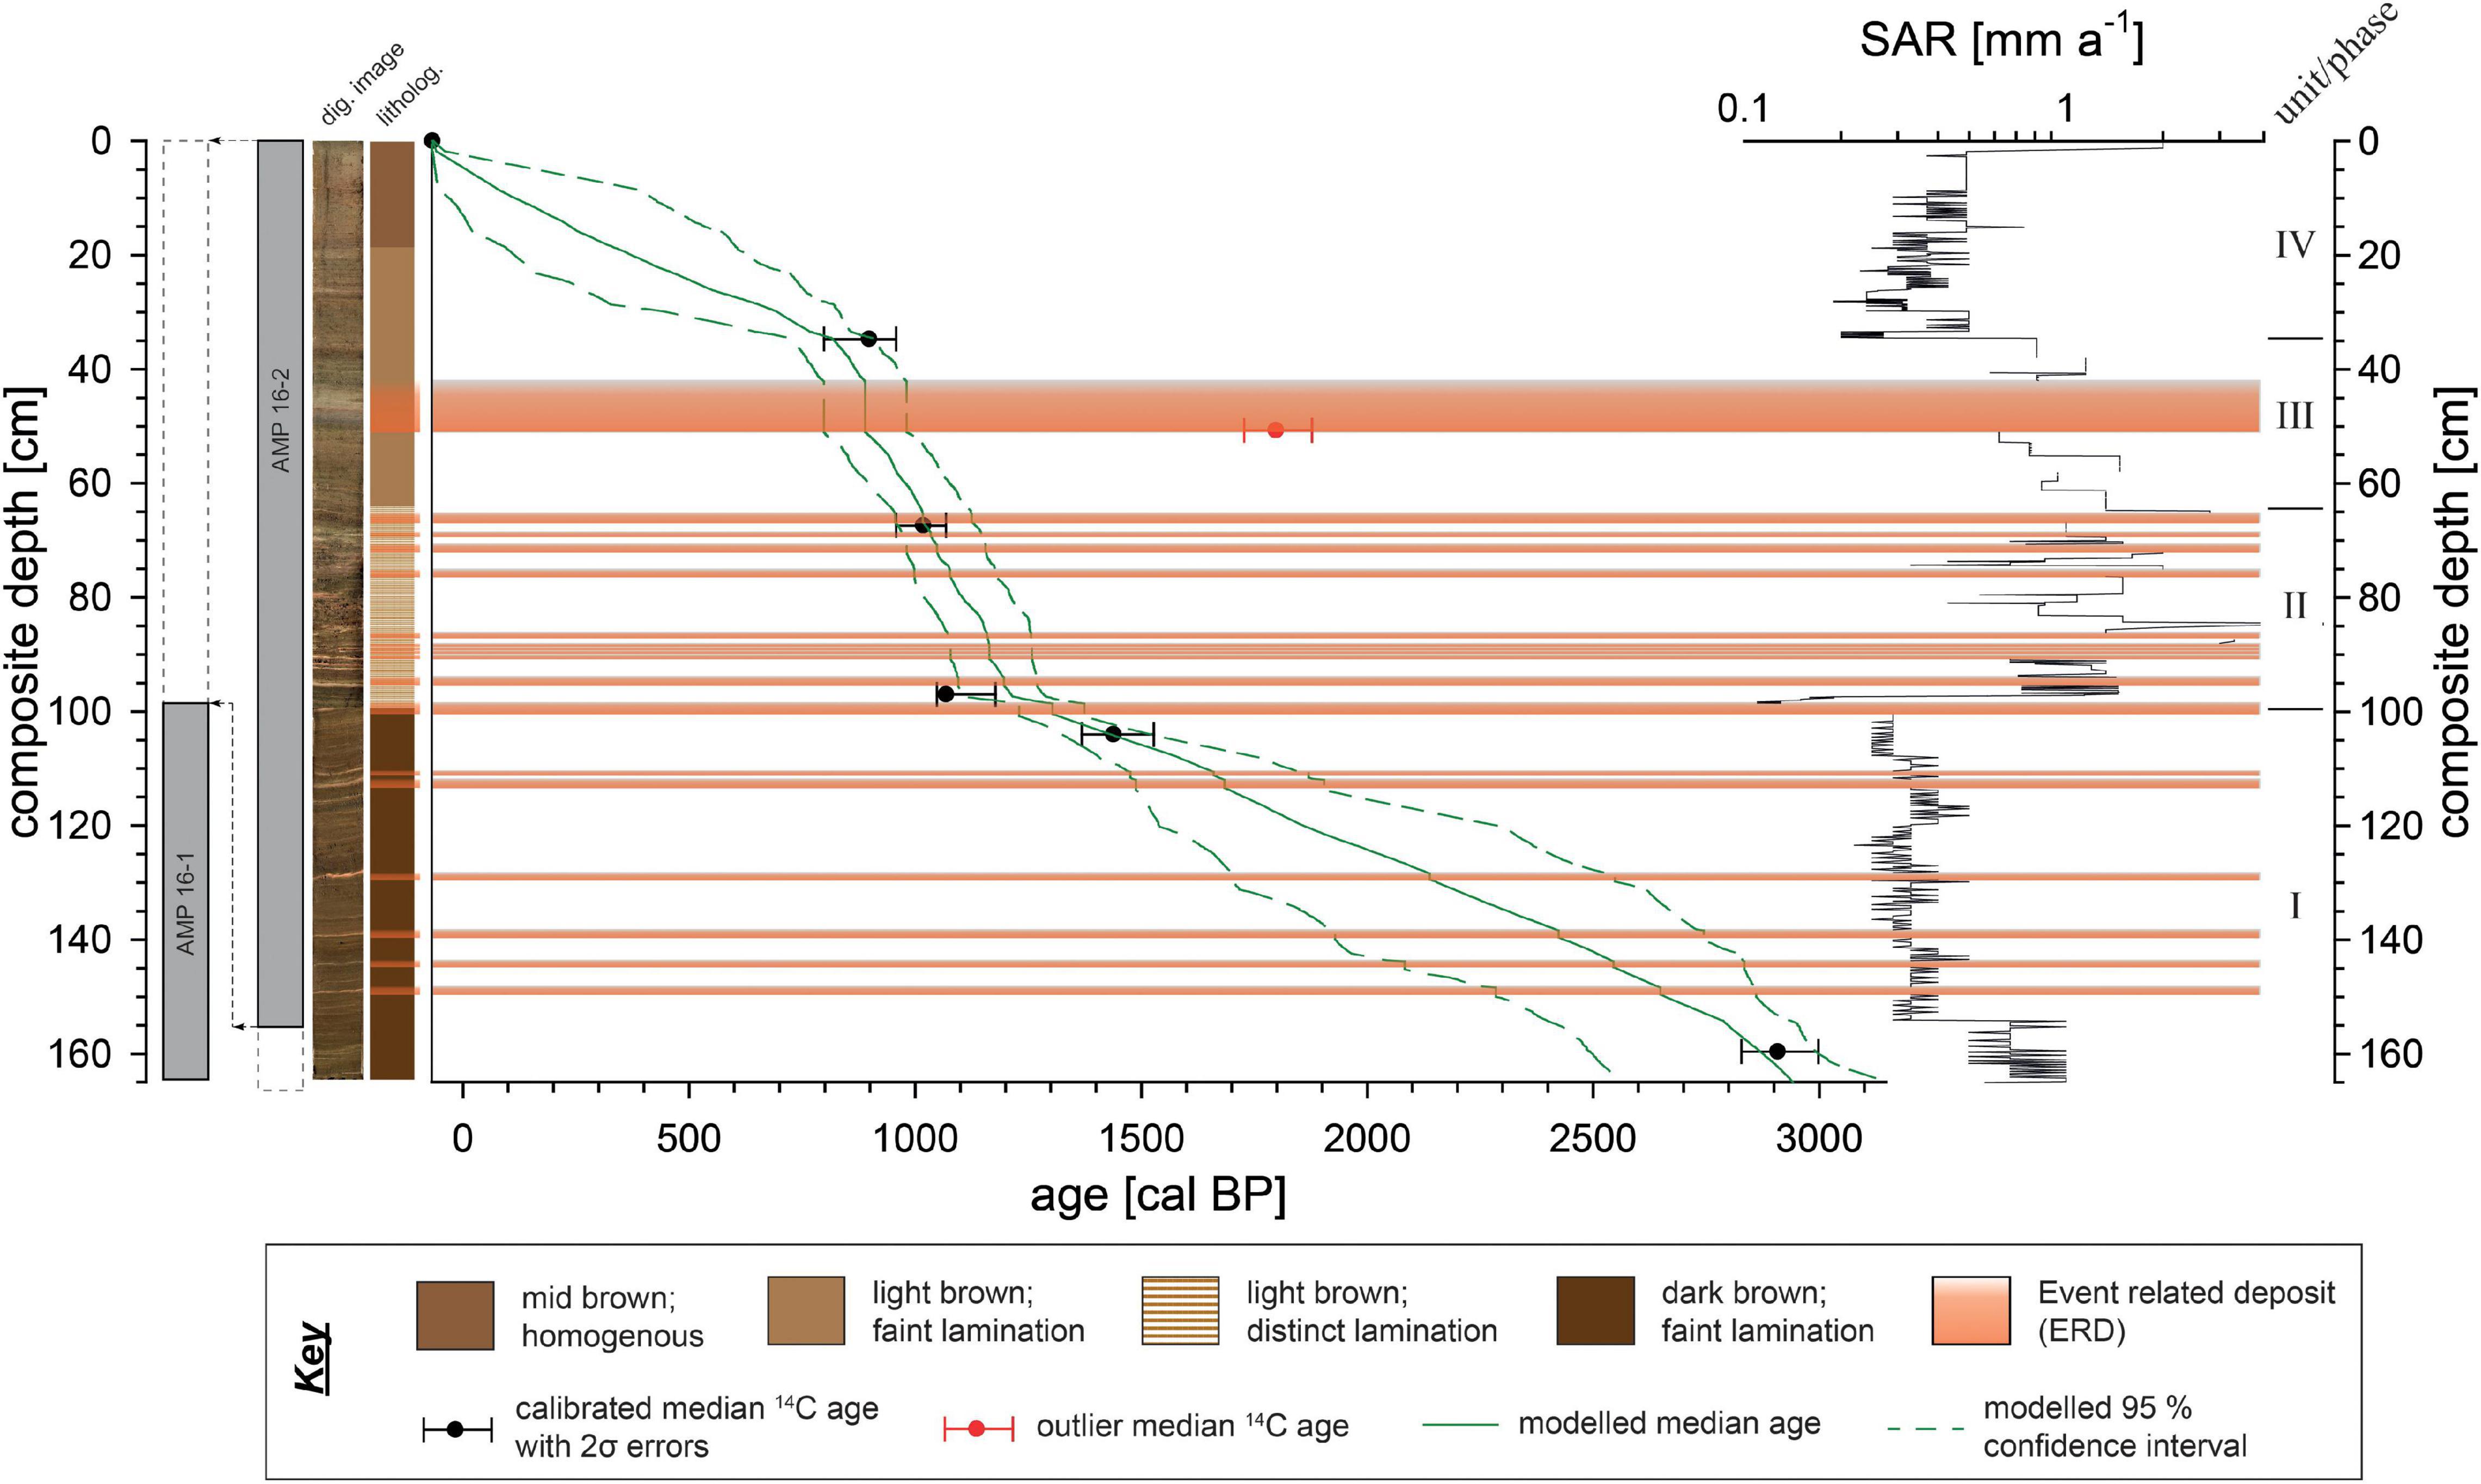
Figure 2. Transition between the sediment cores AMP 16 1 and 16-2, digital image, lithological sketch, age-depth model and sediment accumulation rate (SAR) of composite sequence AMP-16. The composite was established based on parallelization of visual marker layers as well as magnetic susceptibility patterns of the two sediment gravity cores AMP 16-1 and AMP 16-2 (Supplementary Figure 1). Age-depth relation is based on a Bayesian model (Blaauw and Christen, 2011) with medians and the 2σ error ranges of five AMS calibrated 14C ages using the SHCal20 dataset (Hogg et al., 2020). Centimeter-scale SAR variability are an artifact that does not provide a centimeter-scale prediction of SAR but merely a range of possible SAR in different core sections.
Due to the lack of plant macro-remains, the age model relies on AMS radiocarbon dating of three bulk sediment samples from each core, performed at either Beta Analytic Inc. (Miami, FL, United States) or the Poznań Radiocarbon Laboratory (Poznan, Poland) (Table 1). The age of the sediment surface is anticipated to be modern, and was thus set to the year of coring (AD 2016 = −66 cal BP). The age model was performed as a function the composite depth with the RStudio software with the R-package “Bacon” (V. 2.5.6) (Blaauw and Christen, 2011) using SHCal20 calibration curve (Hogg et al., 2020).
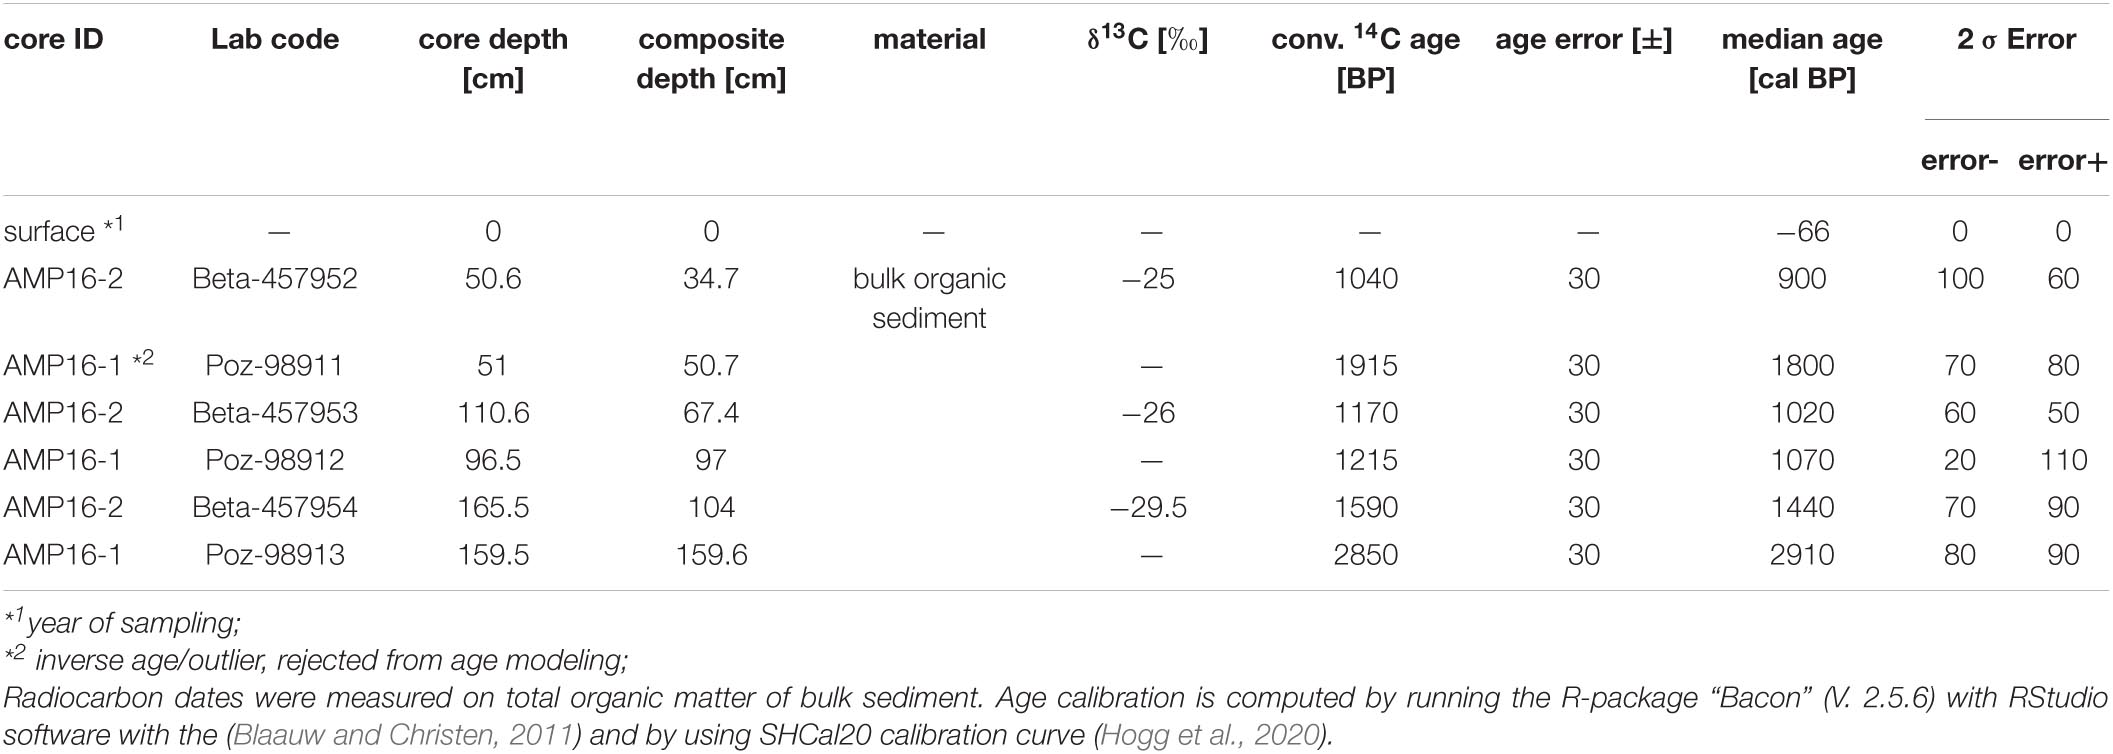
Table 1. Accelerator Mass Spectrometry (AMS) radiocarbon ages of sediment core AMP16-1 and AMP16-2.
Sedimentological and Geochemical Analyses
A total of 46 samples were taken at intervals of 2 to 18 cm depending on sediment layering for grain size analyses. Sample aliquots of ∼1 g were treated with H2O2 (10%, 30%, heated to 80°C for 2 h) to remove organic matter. Subsequently samples were repeatedly washed with deionized water and centrifuged until pH-neutrality. Measurements were carried out using a laser diffraction particle size analyzer (Beckman Coulter LS 13320) applying the Fraunhofer optical model for equivalent particle size diameter calculation. Each sample was measured in seven runs until signal reproducibility. Statistical indices (median size, sorting, particle size fractions) were calculated using a modified version of the MS Excel® Macro Gradistat V4.5s (Blott and Pye, 2001).
A total of 28 samples (ground to particle size < 40 μm) were analyzed at a coarser resolution for Total Carbon (TC), which equals total organic carbon (TOC) since all samples were carbonate free (no reaction with HCl), as well as Total Nitrogen (TN), bulk δ13C and δ15N and biogenic silica (BiSi). For carbon and nitrogen analyses, as well as their stable isotopic signature aliquots of 15 mg were packed into tin-boats and analyzed by an element analyzer (Vario EL Cube, Elementar) coupled to an IRMS (Isoprime Vision, Elementar). Based on triplicate measurements precision is 0.21% for TC and 0.01% for TN. T(O)C and TN were used to calculate the molar C/N. Bulk organic δ13C and δ15N were measured against certified standards (L-Prolin, EDTA and USG65) and reported in standard δ notation (‰) against Vienna Pee Dee Belemnite (VPDB) and Air, respectively. Relative errors based on triplicate measurements are 0.05 ‰ for δ13C and 0.31‰ for δ15N.
The same set of ground samples was analyzed for biogenic silica following a modified protocol of Ohlendorf and Sturm (2008). Sample aliquots of 40 mg were dissolved using 10 ml NaOH (1 mol l–1) supported by 3 min ultrasonic application and subsequent heating at 100°C for 2 h. Si was measured at sample aliquots (pH set between 1 and 3) using an inductively coupled plasma-optical emission spectrometer (ICP-OES 725-ES, Varian). To account for non-biogenic Si, Al was measured as well, and minerogenic Si was subtracted assuming a Si/Al ratio of 1/1 for dissolved clay minerals.
A total of 21 samples were taken for leaf-wax n-alkanes analyses at sampling intervals between 2 and 18 cm. 10 ml dichloromethane (DCM): methanol (MeOH) (9:1) was added to sample aliquots of 1 to 3.4 g dry ground sediments and extraction was carried out using an ultrasonic bath in three 15 min-cycles. The resulting total lipid extract was separated over aminopropyl pipette columns. The n-alkanes were eluted with 4 ml hexane. Measurement was carried out using gas chromatography with flame ionization detection (GC-FID) (7890B-GC System, Agilent Technologies) equipped with a HP5MS column (30 m, 320 μm, 0.25 μm film thickness). For identification and quantification an external n-alkane standard (n-alkane mix nC21 - nC40, Supelco) was used. n-Alkane concentration was calculated as sum of nC21 to nC35. Contributions from aquatic plants can be estimated with the Paq index (C23 + C25)/(C23 + C25 + C29 + C31) following Ficken et al. (2000). The average chain length (ACL), for example based on C27, C29, C31 and C33, can be used to characterize the input from the terrestrial higher plants, with longer chains indicating more input from grasses compared to deciduous trees (Poynter et al., 1989; Zech et al., 2010, 2013a,b; Schäfer et al., 2016). We here also adopt an ACL’ based on C29, C31 and C33, as well as an ACL″ based only on C31 and C33.
Paleoecological Analyses
Paleoecological analyses include palynological analyses [counting of pollen grains, fern spores and non-pollen palynomorphs (NPPs)], counting of sedimentary macro-charcoal particles (>125 μm) and counting of diatoms. All analyses were performed on the composite master sequence AMP-16 except for diatoms performed solely on core AMP 16-2.
Palynological Analyses
For pollen and spore extraction, 22 samples of 0.5 cm3 samples at intervals between 5 and 10 cm were prepared following a standard chemical protocol (Faegri and Iversen, 1975; Daniau et al., 2019). Pollen grains and fern spores were counted using a light microscope (Zeiss) at ×400 magnification, and a minimum sum of 300 terrestrial pollen grains were counted for each sample. The references consulted for identification of pollen and spores included several atlases (Straka and Freidrich, 1989; Gosling et al., 2013; Schüler and Hemp, 2016; Rasoloarijao et al., 2019), the online African Pollen Database (06/20212) and the reference collections of University of Göttingen (06/20213) and ISEM (06/20214). Percentages of pollen and fern spores were computed on the terrestrial pollen sum and the pollen record was subdivided into significant zones by applying a constrained cluster analysis by sum of squares performed with terrestrial pollen (CONISS, Grimm, 1987). Fungal spores were counted on pollen slides at an interval varying between 10 and 30 cm. A minimum fungal spore sum of 100-300 was counted for each sample, except for the depth 96 cm where only 73 spores were found. Fungal spore and other NPP identification are based on NPP Image Database (Shumilovskikh L. S. et al., 2021). Statistical analyses were performed using the RStudio software (Version 1.2.1335) with the package “Rioja” (Version 0.9-21) (Juggins, 2015).
Sedimentary Macro-Charcoal Particles
For macro-charcoal counting a total of 220 contiguous sediment samples of 0.5 cm3 were retrieved. The extraction of sedimentary macro-charcoal particles followed the standard protocol from Stevenson and Haberle (2005). Macro-charcoal particles were counted using a digital microscope at 5.0 magnification (Zeiss) and wooden and grass-based charcoal were distinguished following morphological description from Enache and Cumming (2006). Macro-charcoal concentration (particles cm–3) and macro-charcoal influx (particles cm–2 year–1) were computed for each sample.
High Resolution Pollen and Macro-Charcoal Particles Counting From Core AMP16-1
To reconstruct the ecological shift occurring at the transition between the two sediment cores with high precision, Poaceae pollen and macro-charcoal particle were counted on 15 contiguous additional samples from core AMP16-1 that encompasses this transition between the depth 110 and 96 cm. These detailed analyses performed every centimeter (for pollen and macro-charcoals) allow to trace environmental changes with high precision, without any potential disturbance from the switch between the two sediment cores in the composite master sequence AMP16 (Figure 2 and Supplementary Figure 1). For these contiguous samples, the same previously mentioned chemical treatment for pollen and macro-charcoal particle extraction were used. To obtain Poaceae percentages, a minimum of 100 terrestrial pollen grains were counted among which only Poaceae was identified.
Diatom Analyses
Diatom analyses were performed every 6-10 cm. Sample preparation and concentration assessment were conducted following standard procedures (Kalbe and Werner, 1974; Battarbee and Bennion, 2011). If possible, a minimum of 400 valves was identified in each sample. In samples with very low diatom concentration, analyses were stopped when 1000 microspheres had been counted. A simple preservation index was tested by counting at least 100 specimens of Aulacoseira granulata and differentiate between intact and broken valves (ratio I/B). Permanent slides for light microscopy were prepared using Naphrax® as a mounting medium. Slides analyses was performed using a Leica DM 5000 B light microscope with differential interference contrast, equipped with a ProgRes® CT5 camera, under oil immersion at ×1000 magnification. Identification is mainly based on (Krammer and Lange-Bertalot, 1986, 1988, 1991a,b), Houk and Klee (2007); Houk et al. (2010), Lange-Bertalot et al. (2017) and other relevant taxonomic publications (e.g., Klee et al., 2000). Stratigraphic diatom zones (DZ) were defined by hierarchical cluster analysis of taxa occurring with > 1% using PAST ver. 4.04 (Hammer et al., 2001). Down-core changes in diatom results were visualized using C2 software version 1.7.7. (Juggins, 2007).
Results
Bathymetry and Seismic Survey
The basin morphology (Figure 1B) is characterized by steep slopes, both on shore and under water. An asymmetric shape in W-E direction might result from a former mass movement at the western side of Lake Amparihibe. A rather shallow-water area is notable in the NE. It may, alternatively, represent an alluvial fan due to river inflow and deposition of sediments from the catchment or result from a fossil mass movement deposit, probably due to a slope failure from a crater wall of the lake located to north/east of Lake Amparihibe.
Seismic survey of sedimentary structures shows typically well layered and undisturbed deposits within the upper ca. 1.5 m followed by a reflector that does not allow further penetration (Figure 1C). This behavior can be explained by natural gas within the sediment that prevents the acoustic waves from further penetration. Only rare acoustic windows containing less gas give further insight into the sedimentary structure and show that the deeper infill consists of well layered sediments as well, at least down to ca. 8 m sediment depth. This represents a minimum thickness of the sedimentary infill, as gas occurrence prevents further penetration here as well. Thus, a hard-rock basement has not been detected so far.
Lake Water Characteristics
Lake Amparihibe is alkaline (pH ∼8.7) and dissolved oxygen values of surface waters are about 7.9 mg L–1 (∼103%), while vertical water parameter measurements confirm anoxic bottom waters (Supplementary Figure 2). Water temperature is high and decreases with depth from 29.3°C to 27.2°C. Temperature depth profile shows that the lake was thermally stratified in November 2016. Electrical conductivity is around 245 μS cm–1 and Secchi depth about 2.5 m.
Sedimentology and Chronology
Sediment core parallelization using magnetic susceptibility patterns of both cores resulted in an almost perfect fit with a correlation coefficient of r = 0.83 (Supplementary Figure 1). According to this fit, the composite record has a total length of 164.5 cm. The lower part of the composite is represented by the lower section of AMP 16-1 from 164.5 to 99.4 cm, whereas the upper 99.4 cm are represented by the compressed core AMP 16-2 from 156.2 to 0 cm (Figure 2 and Supplementary Figure 1).
The composite record generally exhibits dark to light brownish sediments with various light grayish to reddish intercalated 1 mm- to 15 mm-thick layers. Sediments are mainly composed of clayey silts with only little portions of sand (max. 5.6%, see Supplementary Figure 3). From 164.5 to 99.5 cm the record shows general dark brownish colors and only few intercalated grayish and reddish faint layers. Six of the intercalated layers are outstanding since they are quite distinct, exhibit reddish color and show higher proportions of sand. Between 99.5 and 64 cm lamination is much more distinct, layer thickness varies between 1 and 5 mm, and the overall sediment color is brighter. Between 64 and 21.5 cm sediment color and texture differ from the lower parts. Color changes to light brown and particles are distinctively finer with higher proportions of clay. Aside of an indistinct lamination, an 8.7 cm thick grayish layer with a dark, coarse base a reddish center and a fining upward trend is outstanding from 50.8 to 42.1 cm composite depth. In the uppermost unit, the color changes to homogenous slightly darker brown.
The outstanding layers with a minimum thickness > 4 mm, showing both a particle size fining upward trend and peaks in magnetic susceptibility, were interpreted as Event Related Deposits (ERDs) (Figure 2). Assuming a quick (hours to days) sedimentation as turbidity currents, these ERD layers were omitted for age modeling. One of the dated samples shows an inverse age, since it was taken from the base of an ERD, and was thus rejected from age-modeling (Figure 2 and Table 1). The model is thus based on five radiocarbon ages in stratigraphic order and reveals a basal age of 2940 cal BP. This chronology refines a paleomagnetic-supported age model previously published for AMP 16-1 (Haberzettl et al., 2021).
Sediment Accumulation Rate (SAR) is variable ranging between 0.1 and 4 mm a–1. At the lowermost part of the record (164.5 to 97 cm) SAR is low ranging between 0.1 and 0.6 mm a–1. At 97 cm composite depth, SAR dramatically increases to values ranging around 1.3 mm a–1 and remains on this high level until 61.2 cm, showing some major peaks of up to 4 mm a–1. Between 61.2 and 34.5 cm, a slight declining trend to 0.8 mm a–1 on average is notable. At 34.5 cm a distinct shift to low values ranging around 0.4 mm a–1 occurs. A very slight increment tendency is visible toward the top of the record with SARs up to 0.5 mm a–1, while within the uppermost 0.5 cm of the record the value increases to 2 mm a–1, which is likely an artifact of age modeling.
Based on lithological properties, the age-depth model, as well as the SAR, four sedimentary units (phases) were assigned, i.e., unit I from the base of the record to 99.5 cm (2940 – 1300 cal BP), unit II from 99.5 to 64 cm (1300 to 1000 cal BP), unit III from 64 to 35 cm (1000 – 820 cal BP), and unit IV from 35 cm to the top of the record (820 cal BP - today).
Physical Sediment Properties
Magnetic Susceptibility
The composite magnetic susceptibility pattern shows values between 86 and 7035 × 10–6 SI (Figure 3) with noticeable distinct narrow peaks matching the light grayish and reddish ERDs (Supplementary Figure 1). These peaks also represent the maximum values in the record. In unit I (2940 to 1300 cal BP) values are generally on a low level of around 600 × 10–6 SI. Values drop down from around 1800 × 10–6 SI in unit II (1300 to 1000 cal BP) to ca. 1000 × 10–6 SI at 1000 cal BP in unit III (1000 to 820 cal BP). They distinctly increase at 890 cal BP to 3400 × 10–6 SI and decline steadily thereafter until the top of unit III (820 cal BP) reflecting the uppermost ERD. Unit IV (820 cal BP - today) shows further declining magnetic susceptibility values with some internal variation to 800 × 10–6 SI at 500 cal BP. After another broad peak centered at ca. 430 cal BP showing values of ca. 1600 × 10–6 SI, the remaining record reveals fairly stable values ranging around 1100 × 10–6 SI. However, the distinct minimum during the youngest part of the record (after 10 cal BP) is likely attributed to measurement edge effects.
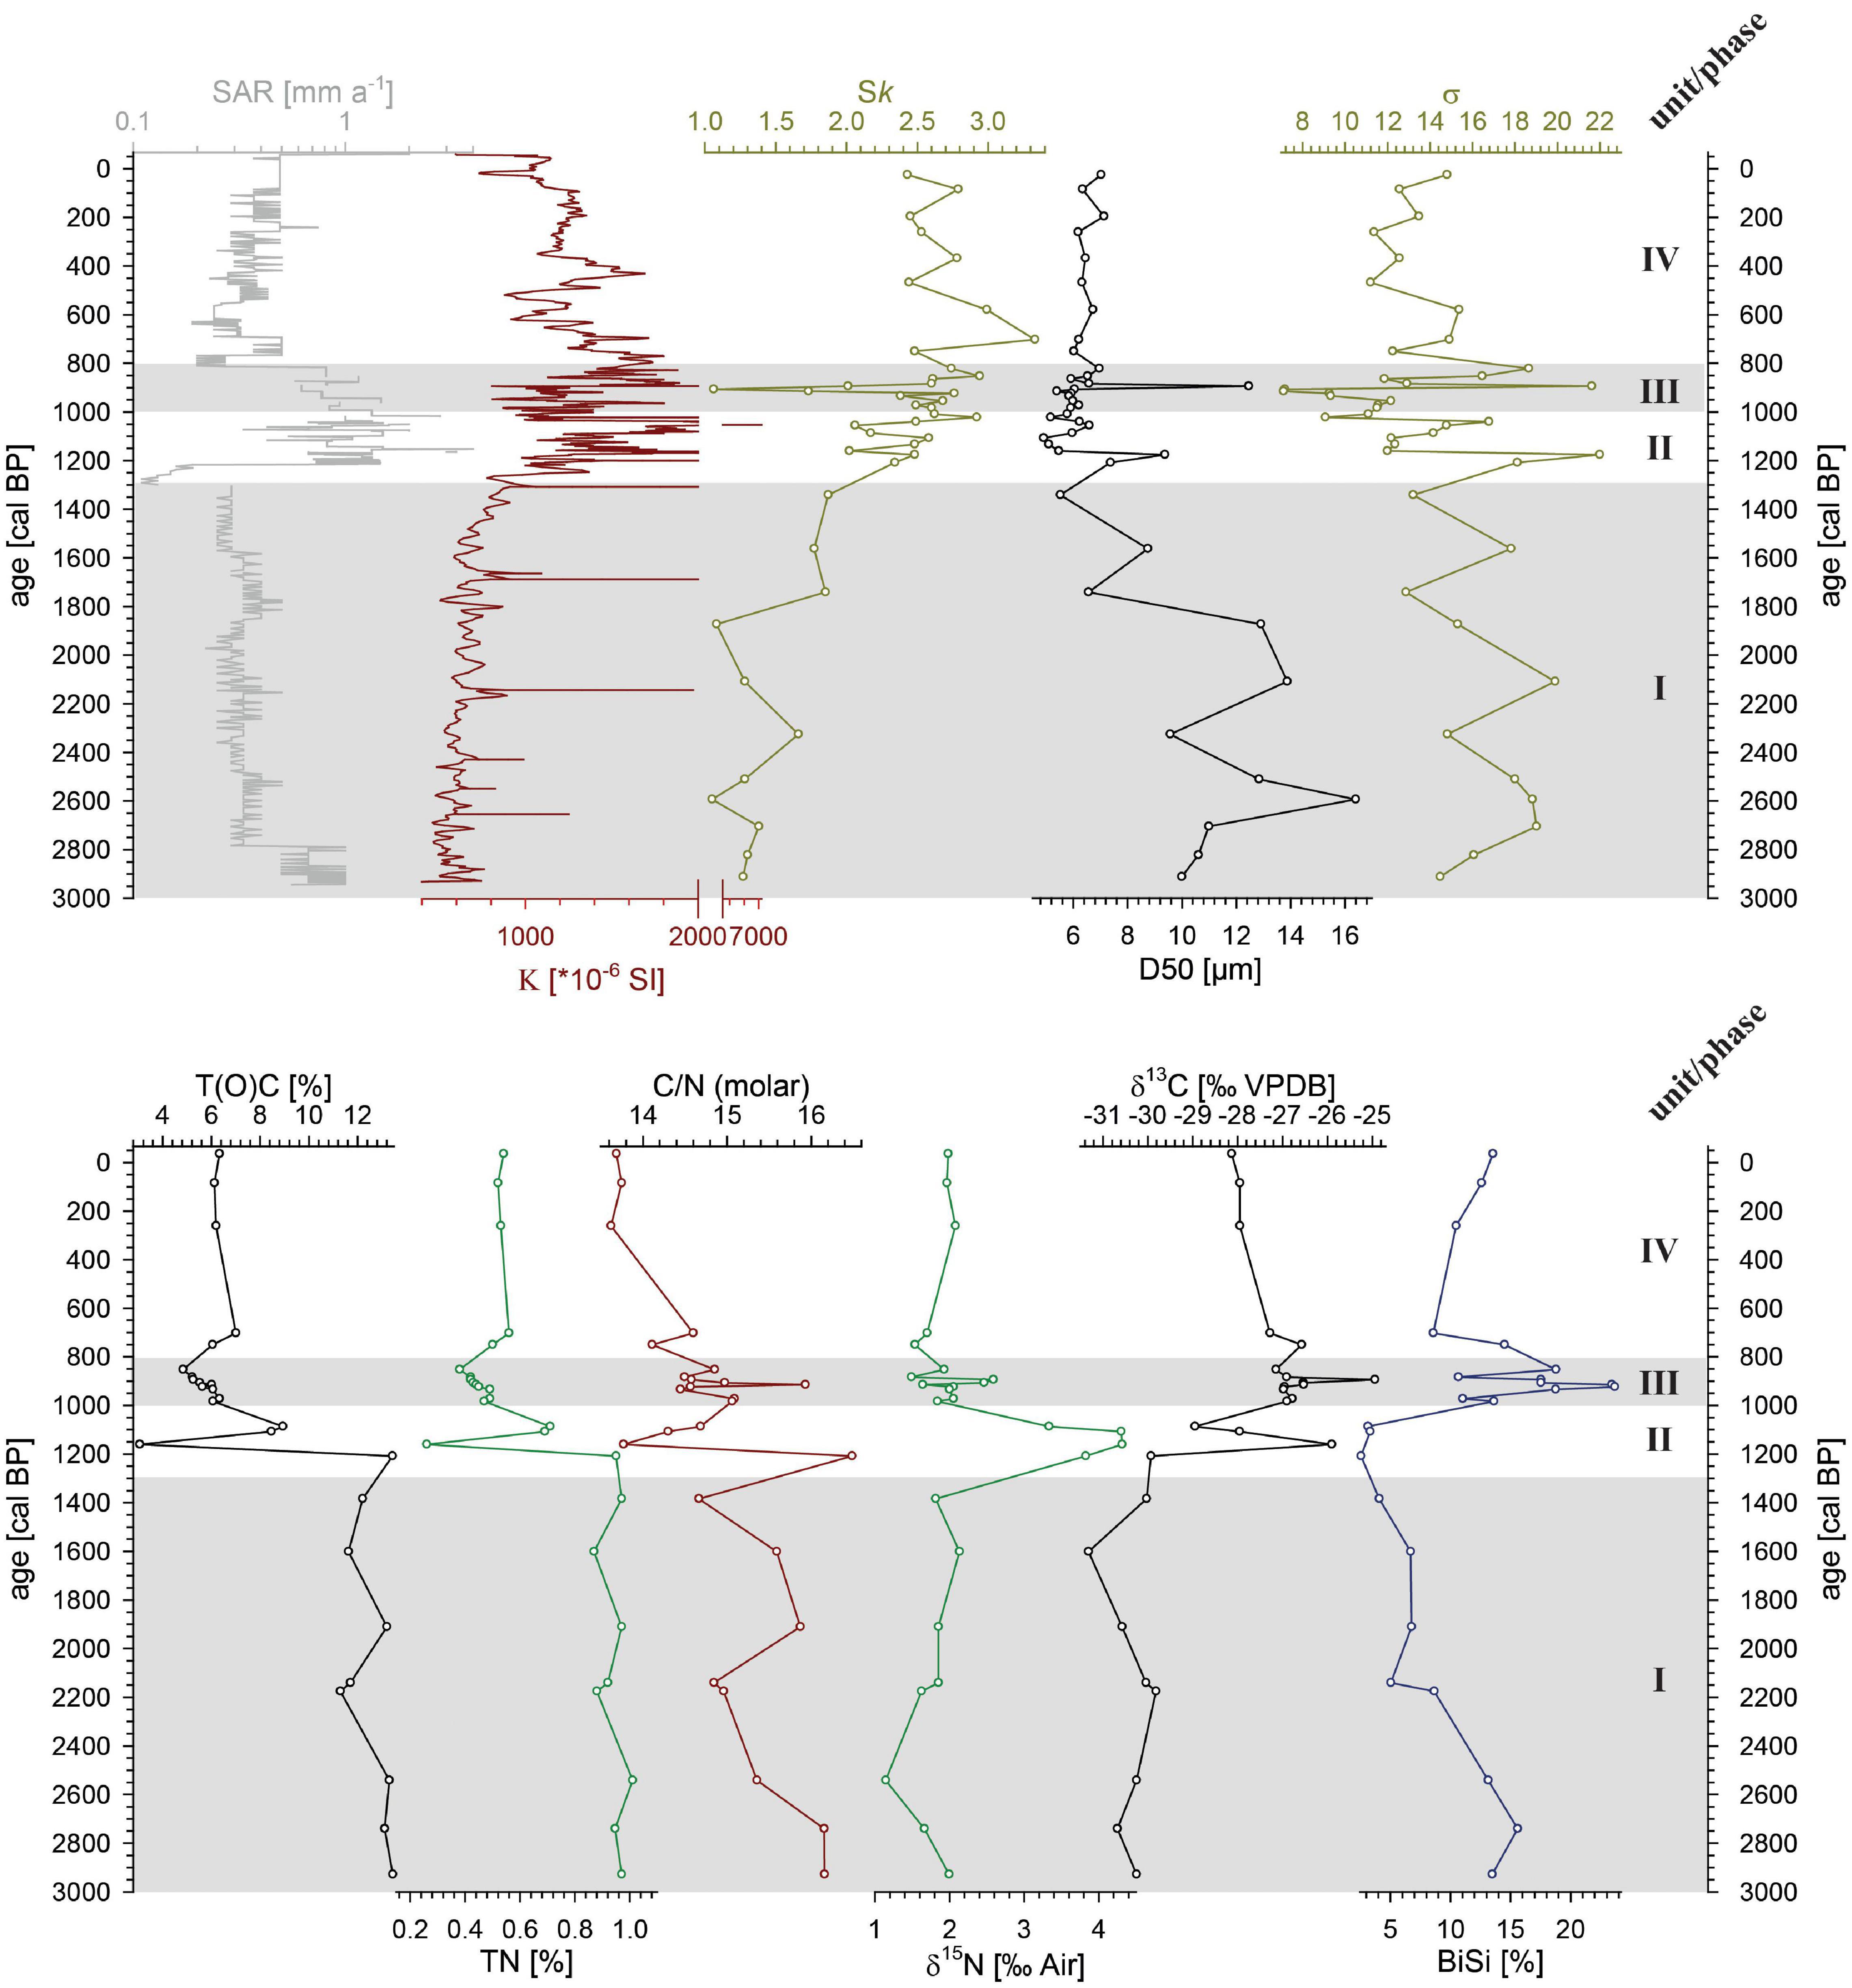
Figure 3. Sedimentological parameters of composite record AMP-16. Upper panel: sediment accumulation rate (SAR), magnetic susceptibility (K), particle size distribution skewness (Sk), particle size median (D50) and particle sorting (σ). Lower panel: total (organic) carbon (T(O)C), total nitrogen (TN), molar C/N-ratio, δ15N and δ13C measured on the bulk organic faction, and biogenic silica content (BiSi). Gray shaded areas demarcate sedimentological units (I to IV).
Particle Size Characteristics
Grain size distributions in all samples are characterized as bi- to polymodal and poorly sorted (Figure 3 and Supplementary Figure 3). Median grain size ranges between 4.9 and 16.4 μm. Unit I (2940 to 1300 cal BP) displays the occurrence of coarser particles between 6.6 and 16.4 μm, with a general fining trend. Particle size median (D50) is distinctively smaller 4.9 and 9.4 μm after 1300 cal BP and shows no grading trend and only minor variability. Particle sorting (σ), however generally described as poor, is quite variable over the entire covered time span. In unit I, deposits are very poorly sorted. From 1300 to 820 cal BP (unit II and III) sorting tends to be better, but highly variable and remains quite stable afterward in unit IV (820 cal BP - today). Skewness (Sk) in the distribution of all samples is positive, but comparable to the sorting showing internal variability. In the older deposits (unit I, 2940 to 1300 cal BP) Sk reveals lower values with some variability and an increasing trend. In unit II and III, from 1300 to 820 cal BP, Sk is on an intermediate level with high internal variability and remains on a high positive level toward the top of the record (unit IV).
Geochemical Characterization
T(O)C, TN as well as the C/N ratio follow the units of the AMP-16 record, but unit II and III (1300 to 820 cal BP) are merged (Figure 3). In general, TC varies between 2.1 and 13.4%, and TN shows contents from 0.2 to 1%. Stable, high amounts of TC and TN are observed within unit I (2940 to 1300 cal BP). In unit II (1300 to 1100 cal BP), TC and TN drop distinctly and remain low and relatively stable, particularly during unit IV (after 820 cal BP). The C/N ratio drops from relatively high values, partly exceeding 16 in unit II (at 1200 cal BP), to values below 14 in the units above. δ13C reveals the most negative values of around -30.3 ‰ in unit I (2940-1300 cal BP), a shift to more positive values (>-27 ‰) in unit II and III (until 820 cal BP), and values stabilize around -28 ‰ in unit IV (after 820 cal BP) (Figure 3). Stable values for δ15N of around 1.8 ‰ occur in unit I (2940 to 1300 cal BP) as well as in untis II and IV (after 1000 cal BP), but reveals a distinct enrichment of up to 4.3 ‰ in unit II (Figure 3).
Biogenic silica (BiSi) contents range between 2.6 and 23.7% (Figure 3). The amount shows a decreasing trend during unit I and unit II until 1100 cal BP, when it reaches its minimum. Contents are dramatically increasing to the maximum thereafter and are again decreasing at ca. 700 cal BP, however remaining on a constant intermediate level of ca. 12% toward the top.
n-Alkanes occur in all investigated samples, and the chromatograms show the odd over even predominance typical for plant-derived leaf-waxes (e.g., Schäfer et al., 2016). Because of the low concentrations of the even n-alkanes and insufficient peak separation from other aliphatic compounds, we quantified only the more abundant odd n-alkanes. The sum of the odd n-alkanes (nC21 to nC35) reaches 20 μg g–1 dry sediment in unit I (2940 to 1300 cal BP), drops below 10 μg g–1 in unit II and III (1300 to 820 cal BP), and increases again over the last few centuries (Figure 4). The Paq is low at ca. 0.1 in unit I, increases to values > 0.2 in unit II and III, and exceeds values > 0.4 in unit IV. The ACL mirrors this trend, starting with values around 30.5, dropping in unit II and III, and reaching values < 29.5 in unit IV. Excluding C27, or even C27 and C29, for the calculation of the ACL′ and ACL″, respectively, of course increases the values, but it also reduces and even removes the trend toward shorter chain length. The remaining feature of the ACL″ is a pronounced maximum in unit II.
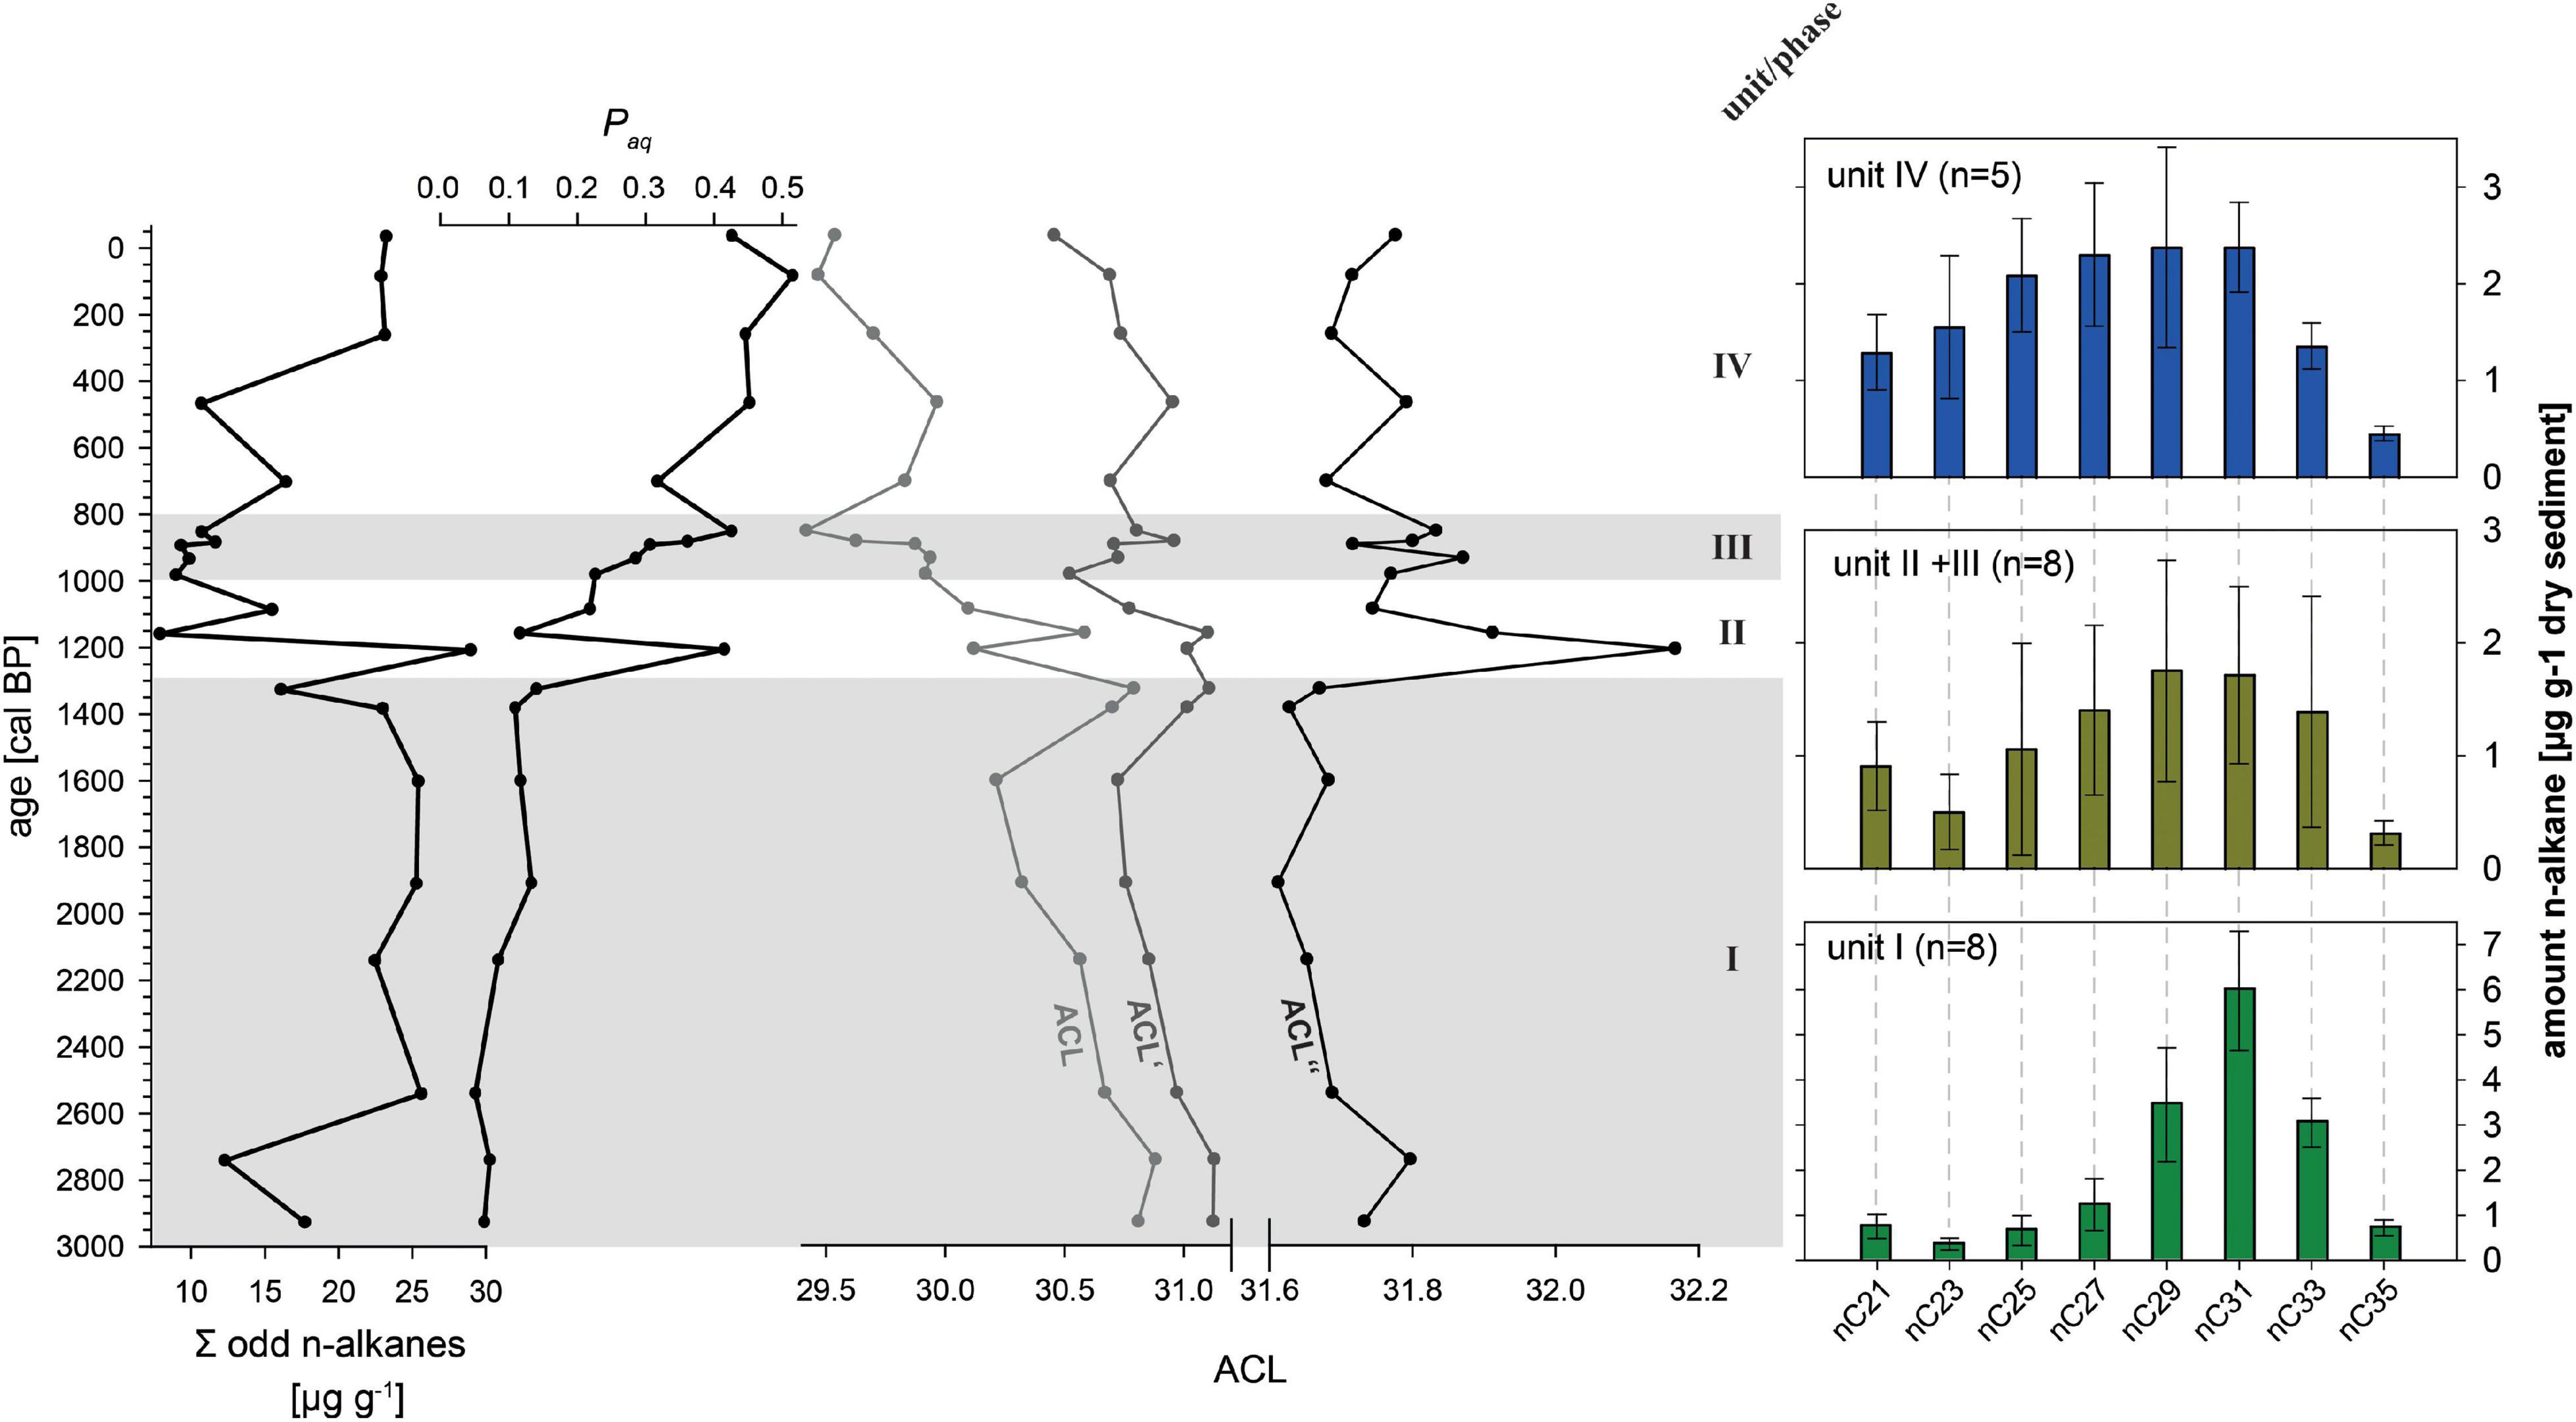
Figure 4. Left plane: Leaf-wax n-alkane indices of composite record AMP-16. Sum of odd n-alkanes (nC21 to nC35), Paq, and average chain length ACL, ACL′(nC39-33), and ACL″(nC31,33). Right plane: mean n-alkane distribution patterns in respect to the sedimentological units (note that unit II and III were merged due to very similar distribution patterns).
Paleoecological Analyses
Palynological Analyses
A total of 93 different pollen and spore taxa and 89 NPP types have been identified. Based on the cluster analysis (CONISS) the pollen diagram is subdivided into three significant pollen zones (PZ, Figure 5).
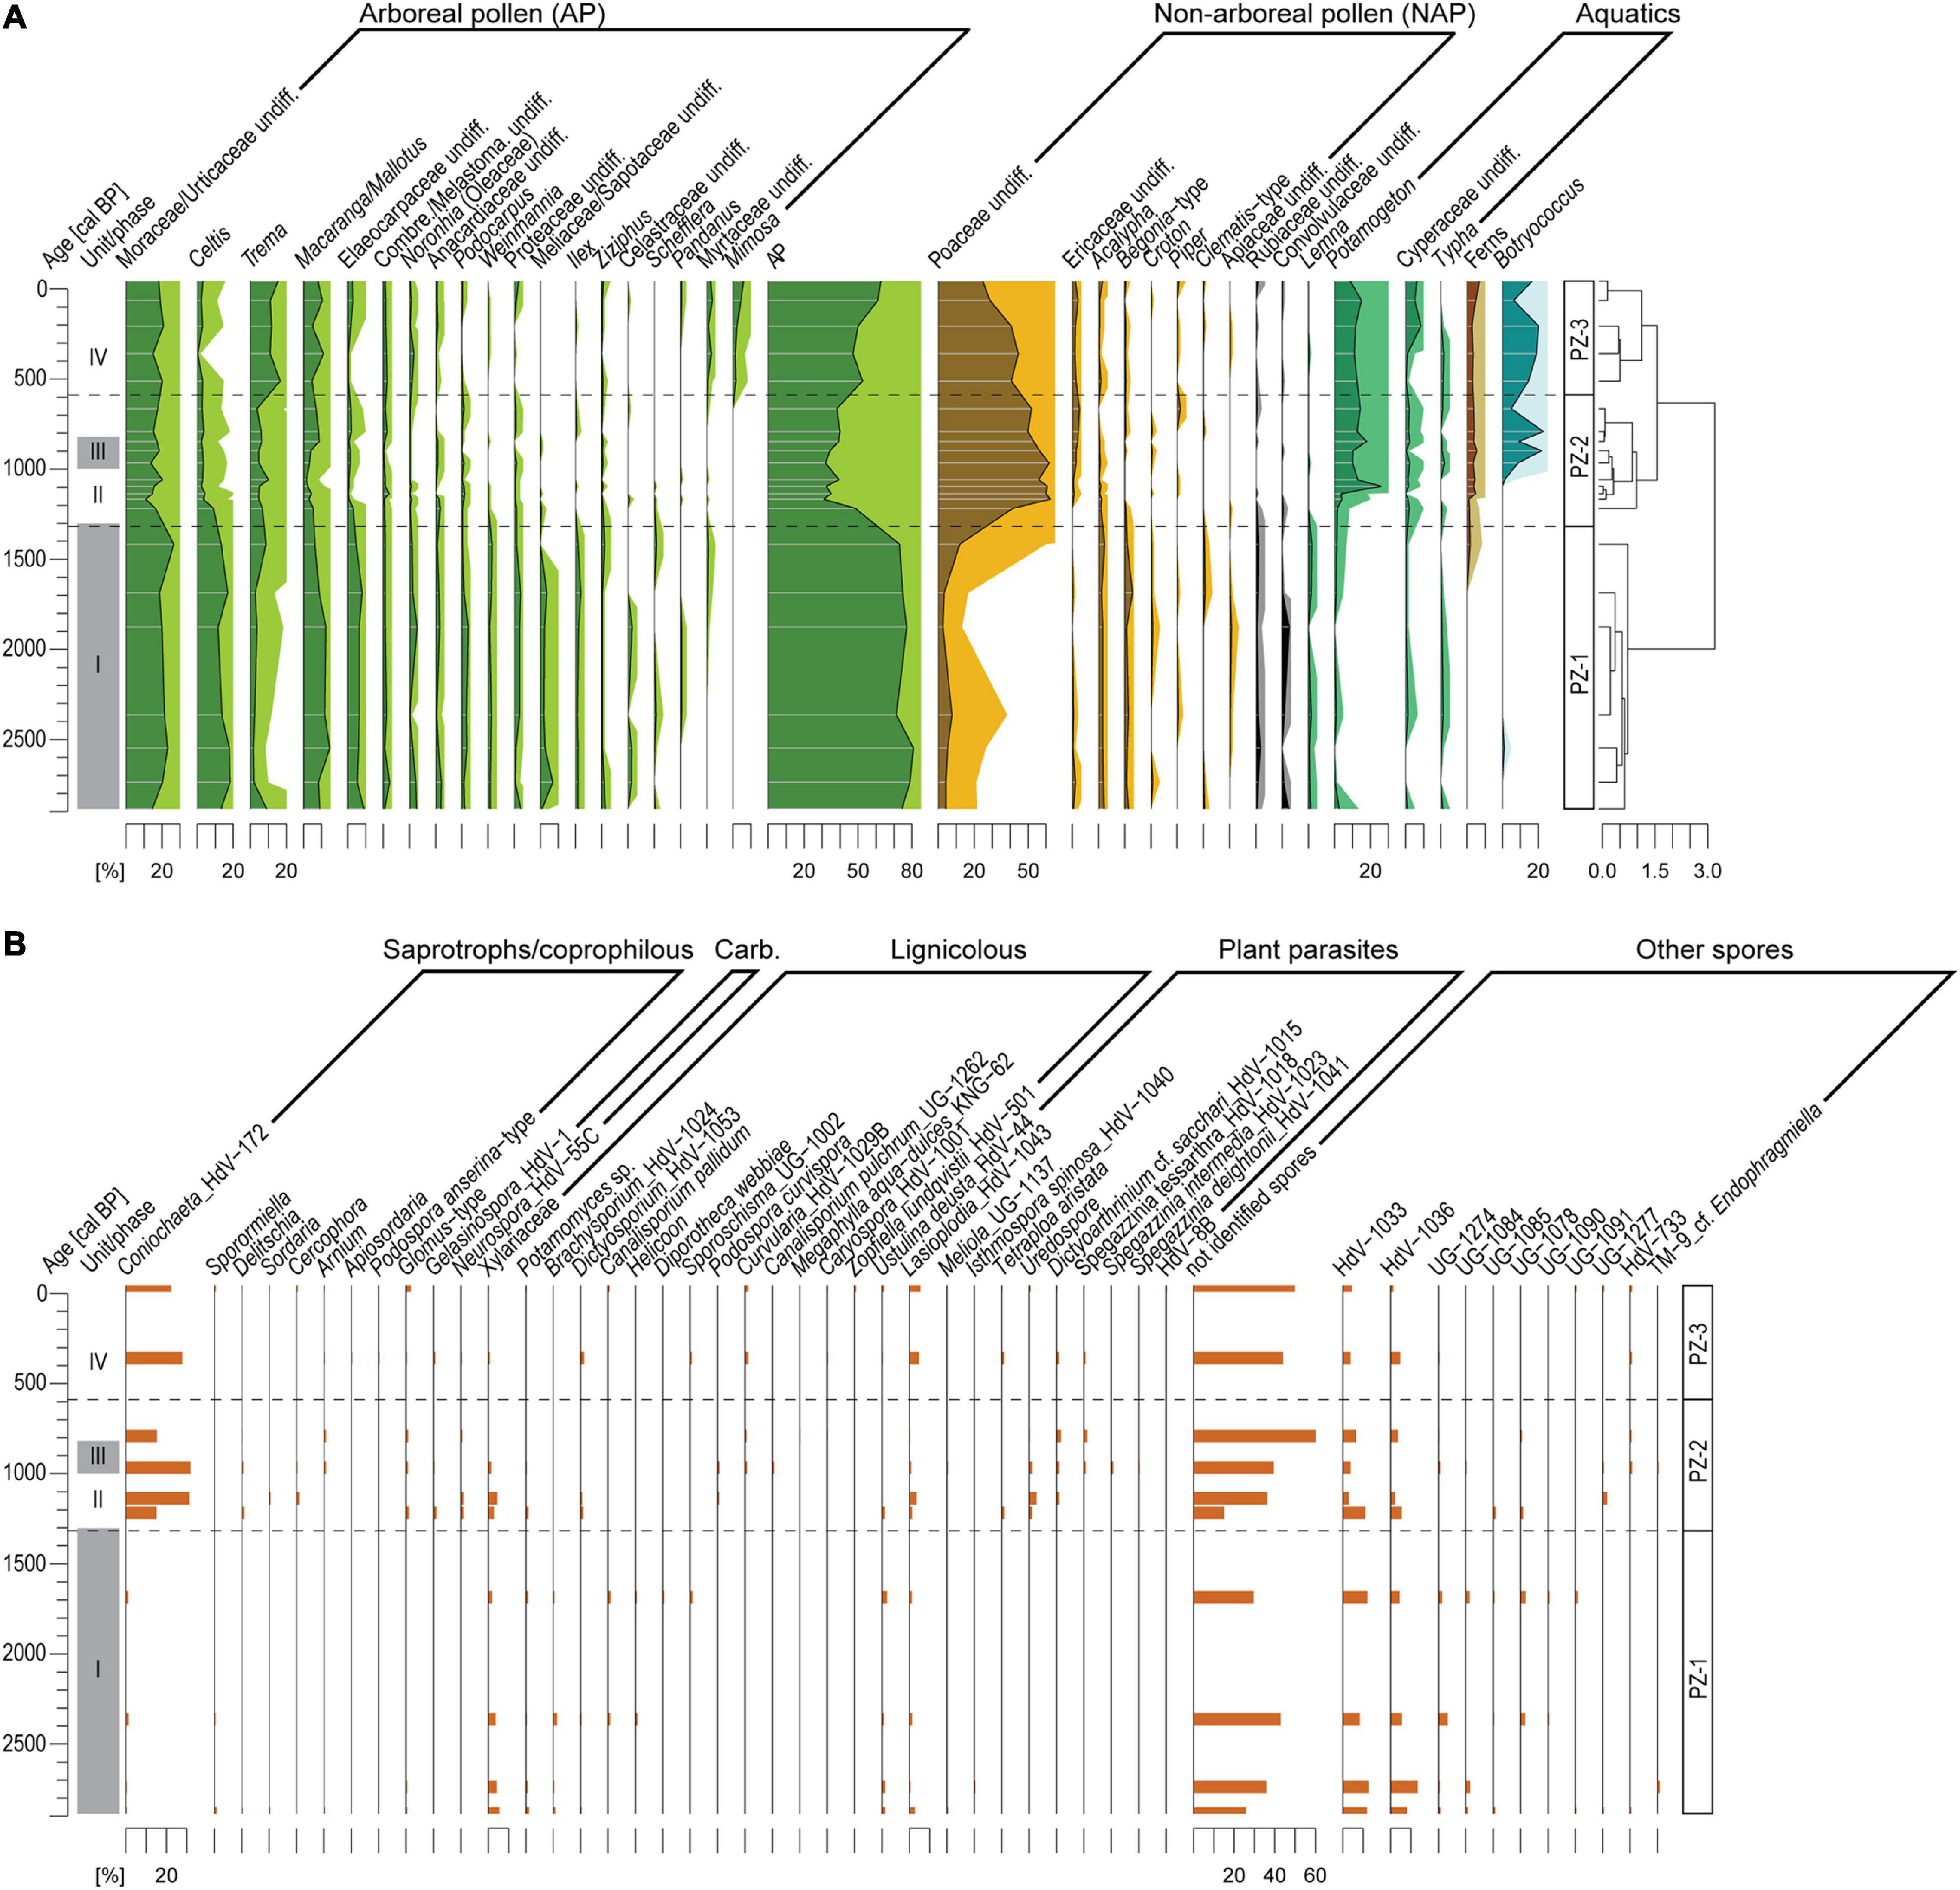
Figure 5. (A) Pollen and fern spore records of composite record AMP16 retrieved from Lake Amparihibe (Nosy Be, Madagascar) plotted on an age scale. Percentages of pollen and fern spores were calculated on the terrestrial pollen sum. Pollen zone (PZ) indicated by dashed lines were identified by a cluster analysis (CONISS, Grimm, 1987). The light-colored pollen curves correspond to exaggerated curves by a factor 5. (B) Fungal spore record plotted on an age scale of composite record AMP-16. Percentages are calculated based on total count of fungal spores. Gray shaded areas demarcate sedimentological units.
PZ-1 (165-100 cm/2940-1300 cal BP/unit I): Pollen assemblages mainly consist of arboreal pollen (AP 80-90%) and show a high tree diversity. The most abundant AP correspond to Moraceae/Urticaceae (20-30%), Celtis (ca. 20%), Macaranga/Mallotus (ca. 10%) and Elaeocarpaceae (ca. 10%). Other AP with low values (< 5%) are also characteristic for this zone such as Podocarpus, Weinmannia, Ilex, Meliaceae/Sapotaceae, Anacardiaceae, Noronhia, Proteaceae and Ilex. Non-Arboreal Pollen (NAP) corresponding to herbs and shrubs show low values (5-15%) and are mainly characterized by a steady occurrence of Poaceae (5-10%), Acalypha (ca. 2%) and Begoniaceae (ca. 2%). Aquatic pollen taxa do not exceed 10% and fern spores are absent. Lignicolous fungal spore assemblage is diverse and presented by Xylariaceae, Potamomyces, Brachysporium, Dictyosporium, Canalisporium pallidum. Plant pathogens are presented by Ustulina deusta and Lasioplodia. Saprotrophs/coprophilous spore assemblage is poor. Among unknown NPPs, HdV-1033 and HdV-1036 are dominant.
PZ-2 (100-27 cm/1300-600 cal BP/units II, III and IV): AP diversity decreases as well as AP percentages that drop abruptly to 30%, then increase progressively up to 40% at the end of the PZ. Among AP, only percentages of Trema increase slightly (up to 5-10%). Moraceae/Urticaceae (ca. 15-30%) and Macaranga/Mallotus (ca. 5%) still remain among the dominant AP. Poaceae pollen increase abruptly up to 60% then decrease progressively and reach 50% at the end of the PZ showing an opposite trend to AP. Other NAPs remain with low values. Ericaceae percentages show a slight increase (up to ca. 5%) and slight percentage decreases are recorded for Acalypha (<2%) and Begoniaceae (<2%). Percentages of aquatic pollen are characterized by an important increase in Potamogeton, a slight increase in Cyperaceae and Lemna is not recorded anymore. A steady occurrence of fern spores is recorded but with low values (< 3%) and the algae Botryococcus shows an increase at ca. 20% from ca. 1000 cal BP. Considerable changes in fungal spores are indicated by a sharp increase in Coniochaeta ligniaria associated with Delitschia, Cercophora and Sordaria. Spores of pyrophilous fungi Gelasinospora and Neurospora occur, while diversity of lignicolous assemblage decreases. Plant pathogens are presented by Lasioplodia, Tetraploa aristata, Dictyoarthrinium cf. sacchari and rusts uredospores.
PZ-3 (27-0 cm/from 600 cal BP/unit IV): The progressive increase in AP which started in PZ-2, continues in this zone with AP reaching 70%. AP are mainly dominated by Moraceae-Urticaceae (20-30%), Macaranga/Mallotus (5-10%) and Trema (20%). This zone is also characterized by the occurrence of new AP taxa such as Mimosa (up to 5%) or Myrtaceae (up to 3%) while several taxa characteristic of the first zone such as Podocarpus, Weinmannia, Ilex or Meliaceae/Sapotaceae are almost not recorded anymore. Among the NAP, only Poaceae pollen indicate significant changes characterized by a progressive decreasing trend from 45% to 25%. At ca. 10 cm depth an increase in the aquatic pollen Cyperaceae (up to 8%) is recorded. The other aquatic pollen, fern spores and Botryococcus do not show marked changes. PZ-3 is characterized by a further increase in diversity of coprophilous assemblages by Arnium, Apiosordaria and Podospora anserina-type. Chlamydospores Glomus-type occur constantly. Assemblage of lignicolous fungi change to Curvularia, Podospora curvispora, Canalisporium pulchrum, Megalohypha aqua-dulces, Caryospora, Zopfiella lundquistii. Plant pathogens diversity increase by several Spegazzinia species. Diversity of other spores decreases.
Sedimentary Macro-Charcoal Particles
Prior to 1300 cal BP, macro-charcoal particles occur in every sample, but concentrations and influx remain very low (Figures 6A,B). Following morphological descriptions from Enache and Cumming (2006), most macro-charcoal particles are wood-based. At ca. 1300 cal BP (unit II, 1300 to 1000 cal BP), a marked increase of concentration and influx is recorded with peaks exceeding 300 particles cm–3 and 40 particles cm–2 year–1, respectively. Grass-based charcoal particles increase at the same time with percentages varying around 30% and peaks exceeding 40%. Subsequently, percentages decrease after 1000 cal BP and remain generally below 30%. From 1000 cal BP (unit III and IV, 1000 cal BP to today), macro-charcoal concentration and influx also tend to decrease. After a last peak above 300 particle cm–3, between 820 and 750 cal BP, concentrations fluctuate around 100 particles cm–3. Macro-charcoal influx indicates a progressive decreasing trend from 1000 cal BP and values stabilize from ca. 750 cal BP varying around 5 particles cm–2 year–1. This decrease in influx is partly the result of the decrease in SAR (Figure 2).
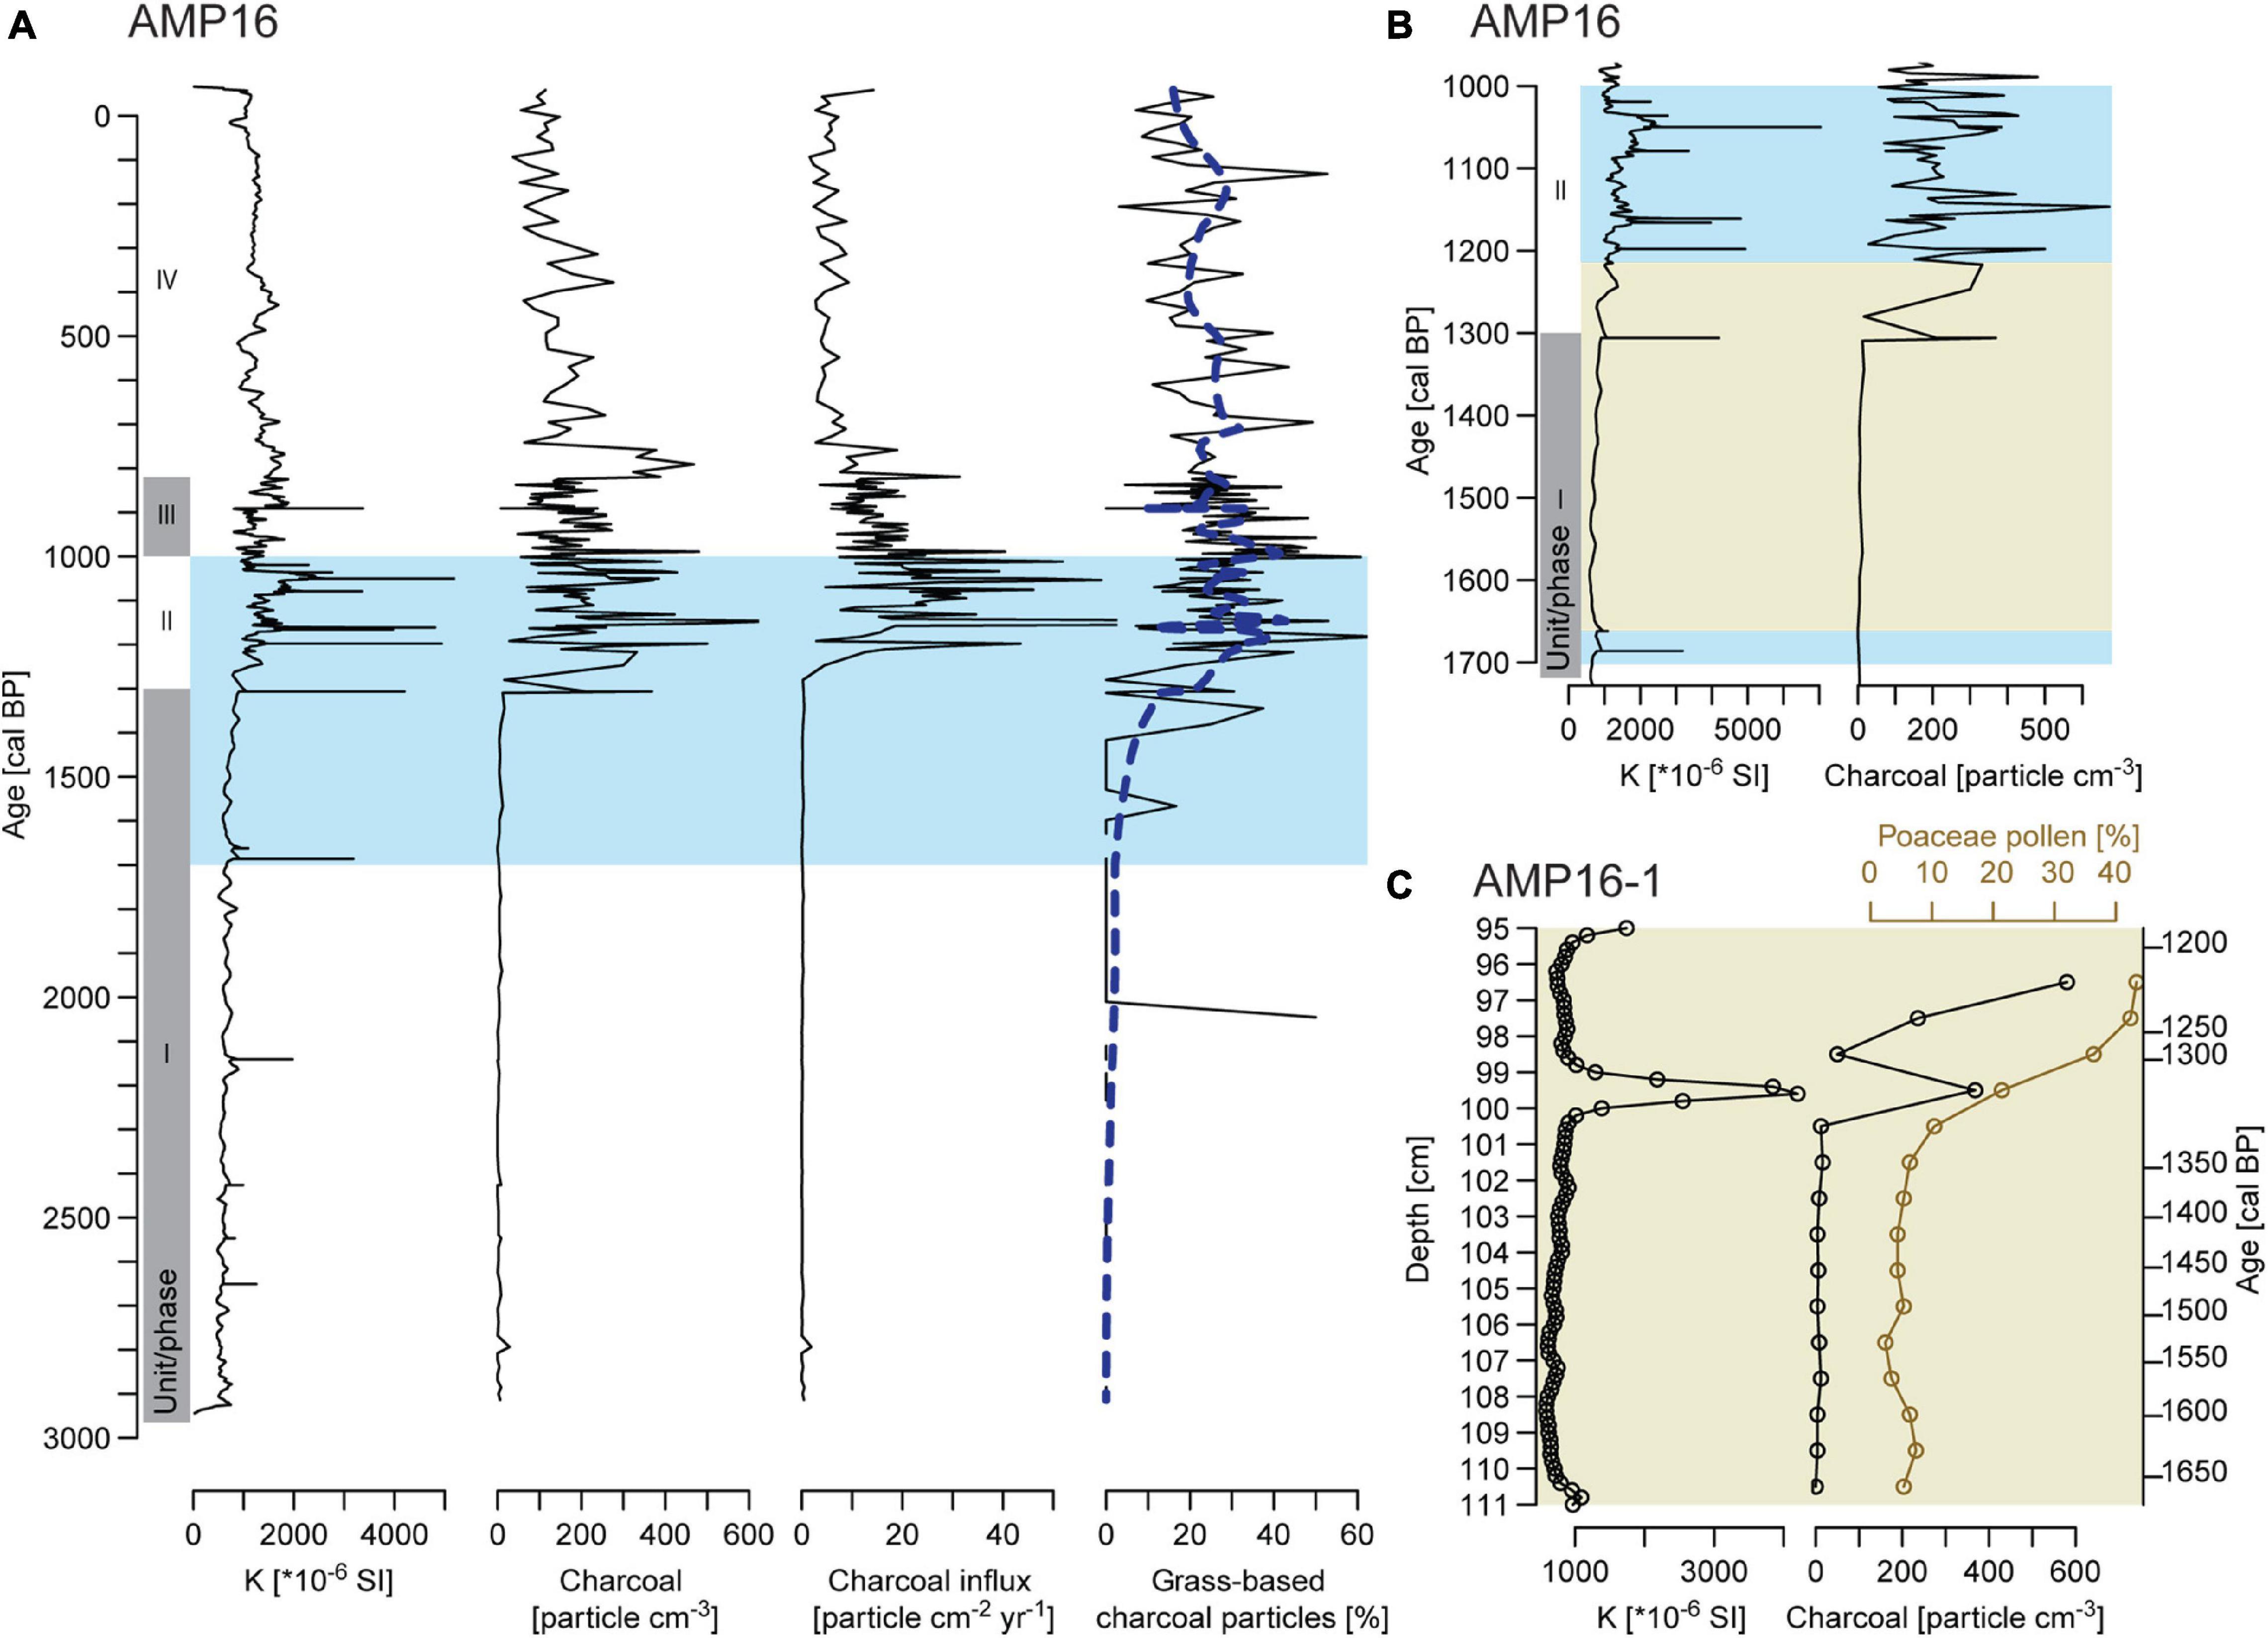
Figure 6. (A) Comparison between records of magnetic susceptibility (K), macro-charcoal concentration, macro-charcoal influx and percentage of grass-based charcoal particles of composite record AMP-16. Blue dashed line represents the evolution of the proportion of grass-based macro-charcoal along depth estimated by applying a binomial generalized additive model smoother with a 25-degree-of-freedom thin plate regression spline basis (gam function in mgcv R package) to the dataset composed of each macro-charcoal depth and a value 0 for a wooden-based charcoal or 1 for a grass-based one. The blue area indicates the period selected in panel (B) showing precise comparison between magnetic susceptibility and macro-charcoal concentration of composite record AMP-16. The light green area indicates the period selected in panel (C) showing the transition zone recorded from core AMP16-1 and comparing magnetic susceptibility, macro-charcoal concentration and pollen percentages of Poaceae. Gray shaded areas on panels (A,B) demarcate sedimentological units.
High Resolution Data From Core AMP16-1 (110-96 Cm Depth; Ca. 1640 to 1200 Cal BP)
Between 110 and 100 cm (ca. 1640-1300 cal BP) low percentages of Poaceae (<10%) and macro-charcoal (max. 16 particles cm–3) are recorded (Figure 6C). Above 100 cm (<1300 cal BP), Poaceae show a continuous increase and reach 40% at 97 cm (ca. 1200 cal BP). Macro-charcoal particles show two important increases above 100 cm depth. The first increase corresponds to a peak at 99 cm and maximum concentration (368 particles cm–3, ca.1300 cal BP) is reached in the sample where Poaceae percentage shows the first marked increase. This macro-charcoal peak at 99 cm occurs contemporaneously to a peak in magnetic susceptibility. The second increase starts at 97 cm (ca. 1200 cal BP) and macro-charcoal concentration reaches ca. 580 particles cm–3 at 96 cm.
Diatom Analyses
A total of 30 diatom species have been identified in the sequence. Overall, two planktonic taxa, Discostella cf. mascarenica (Klee, Houk and Bielsa) Houk & Klee and Aulacoseira granulata (Ehrenberg) Simonsen agg., clearly dominate the low diversity assemblages (Figure 7). Most samples yield high diatom concentrations [up to 60 × 108 valves g–1 dry weight (DW)]. However, between 1310-1040 cal BP, diatom concentration was low and valve preservation poor (ratio I/B: 0.6-0.7). Hierarchical cluster analysis identified three major diatom zones (DZ-1 - DZ-3) and three subzones (DZ3a-c).
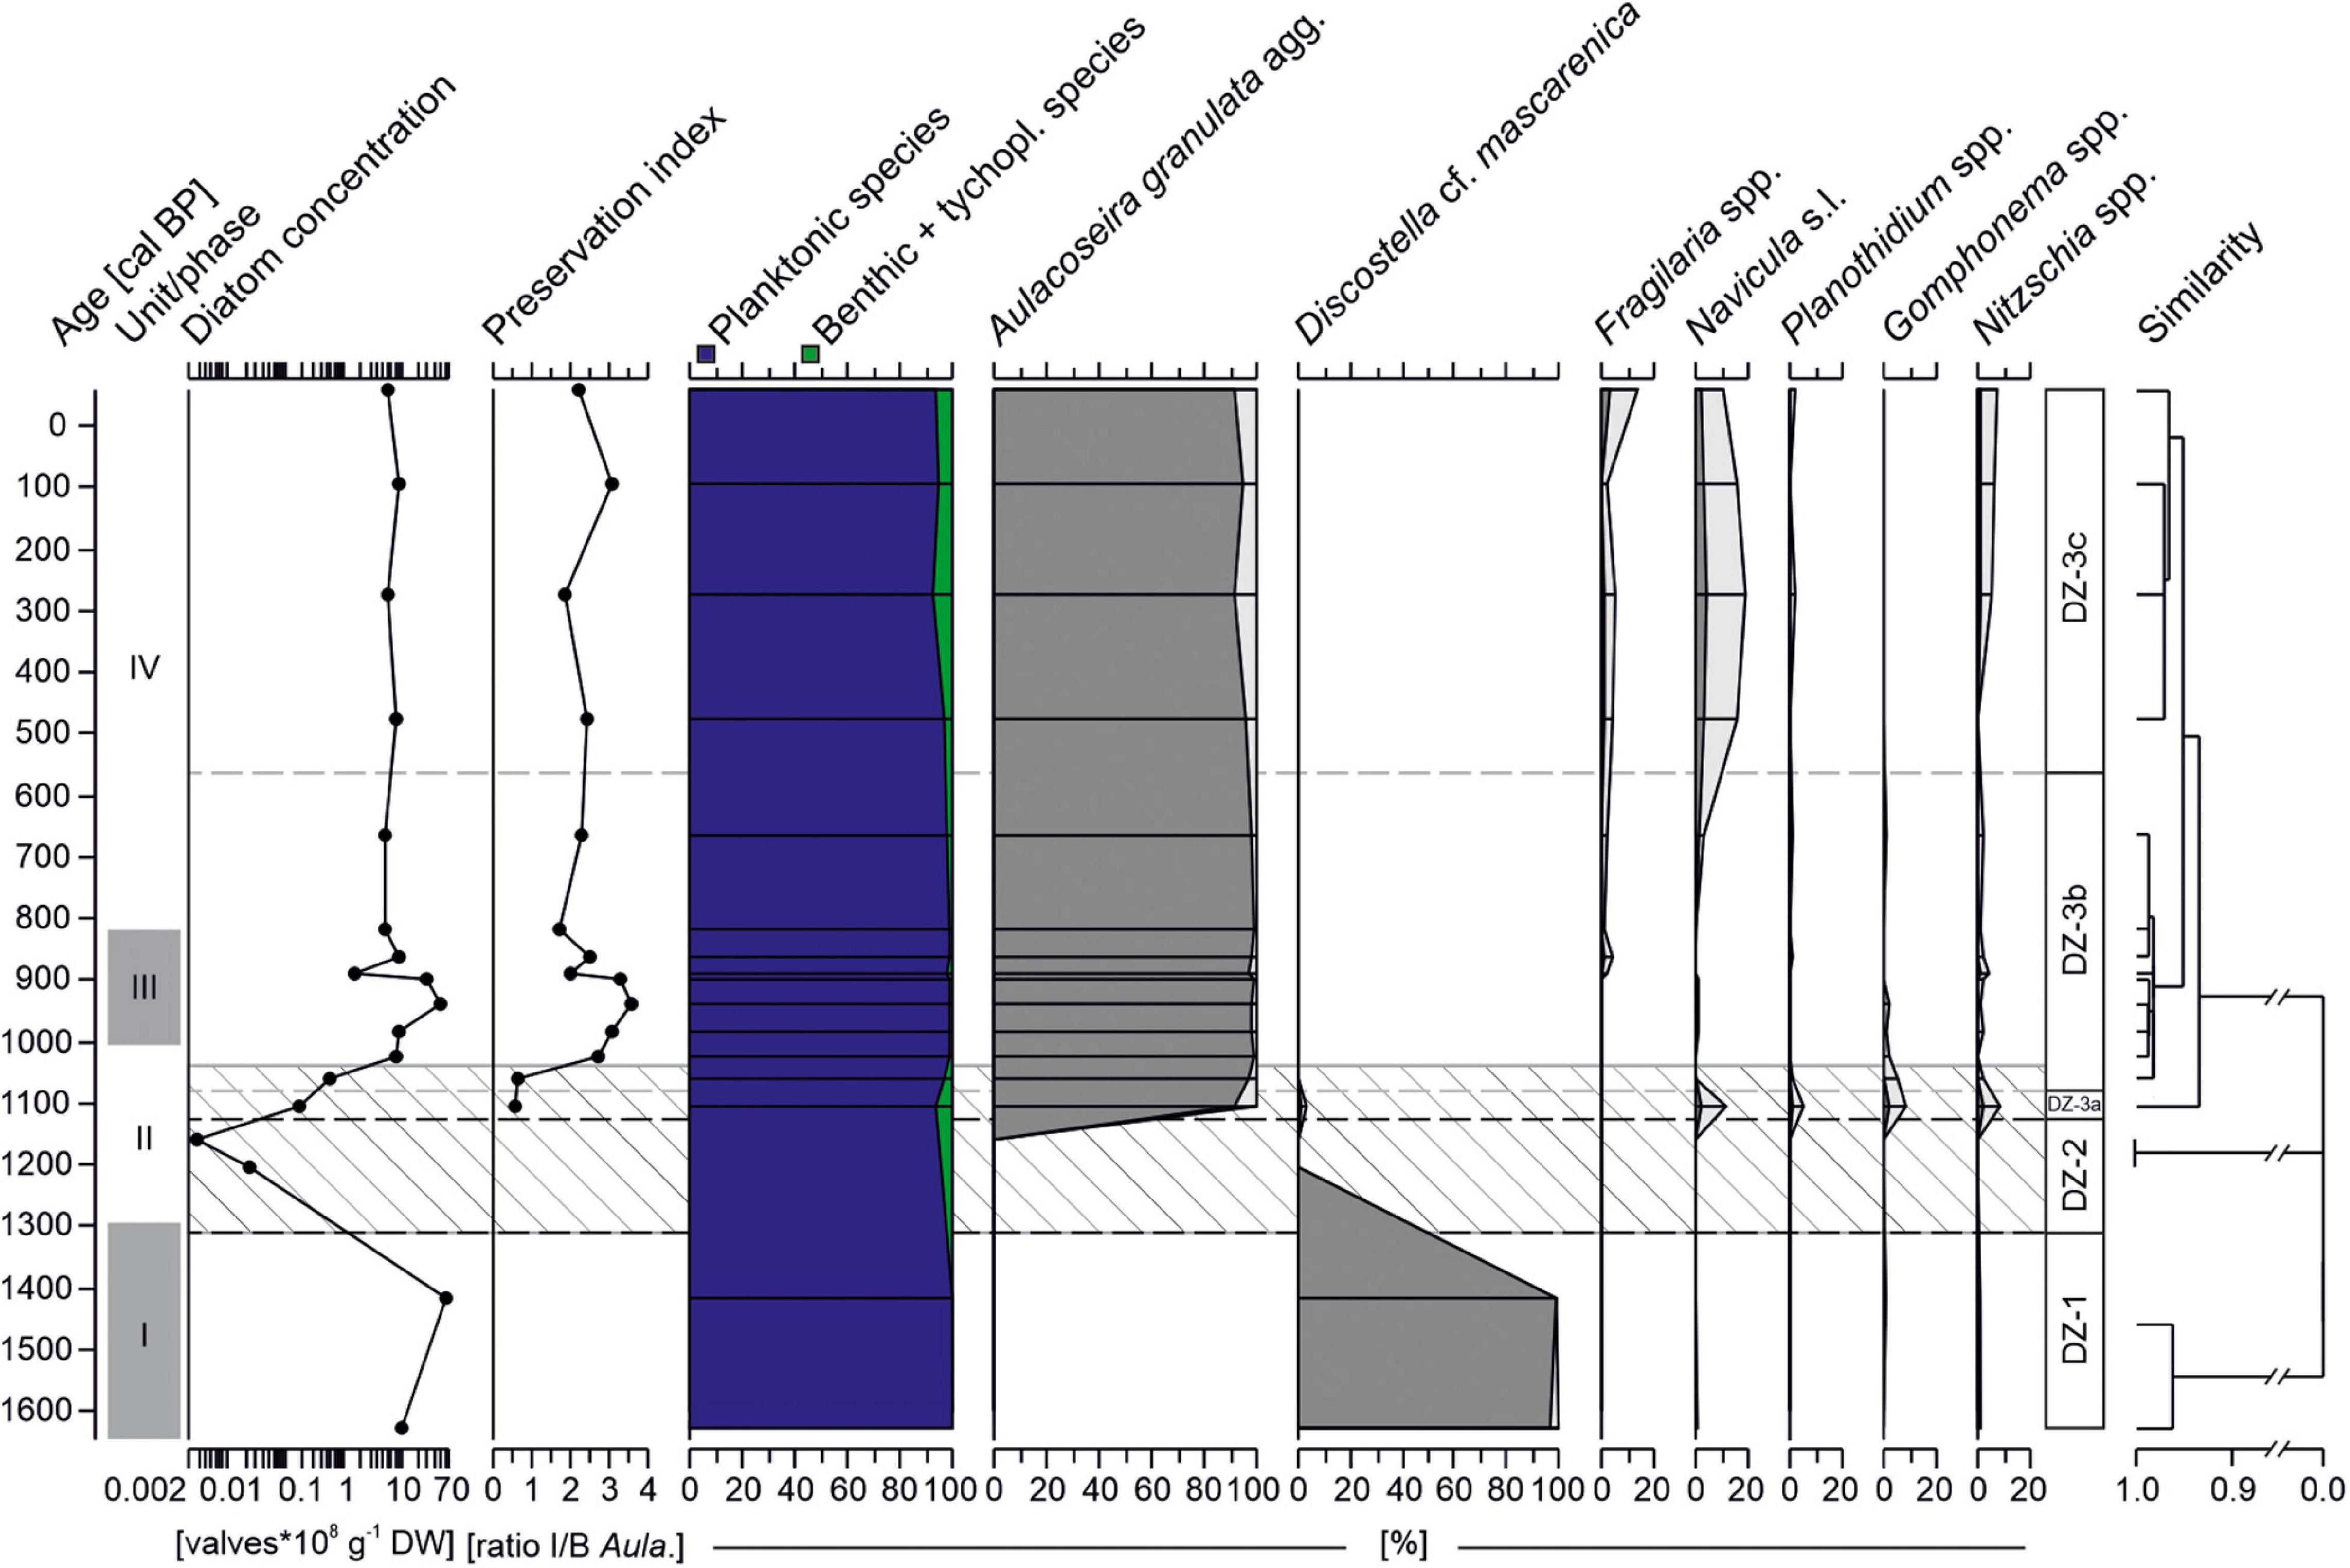
Figure 7. Diatom record from core AMP 16-2 retrieved from Lake Amparihibe plotted on an age scale with relative abundances taxa (>1%), diatom concentration (DW: dry weight), preservation index (ratio intact to broken valves of Aulacoseira granulata) and abundances of benthic + tychoplanktonic and planktonic taxa. Samples with less than 15 valves counted were excluded from abundance plots. Diatom zone (DZ) indicated by dashed lines were identified by a hierarchical cluster analysis. The lighter colored diatom curves correspond to exaggerated curves by a factor 5. Hatched area indicates zone of lowest diatom concentration and poorer valve preservation. Gray shaded areas on the left demarcate sedimentological units (I to IV).
In the oldest part of the core (DZ-1, 1630-1310 cal BP), diatom concentrations are high with values between 11 × 108 to 60 × 108 valves g–1 DW. Planktonic species Discostella cf. mascarenica is by far the most abundant species (> 96%) and almost no benthic taxa are observed. The following zone (DZ-2, 1310-1130 cal BP) is distinguished by almost sterile samples with < 0.025 × 10⁸ valves g–1 DW. First and frequent occurrences of Aulacoseira granulata together with a minor proportion (6.8%) of benthic and epiphytic taxa such as Navicula Bory de Saint-Vincent s.l., Nitzschia Hassall spp. and Gomphonema Ehrenberg spp. characterize DZ-3a (1130-1080 cal BP). Discostella cf. mascarenica is barely present anymore. Although diatom concentration is still low in the lowermost part of zone DZ-3b (1080-570 cal BP), numbers quickly increase up to 49 × 108 valves g–1 DW. Assemblages almost exclusively consist of Aulacoseira granulata agg. (>96%). The uppermost part of the sequence (DZ-3c, from 570 cal BP) is still overall dominated by Aulacoseira granulata agg. (91-96%) but benthic and tychoplanktonic taxa slightly increase in abundances (up to 7.3%) compared to the previous subzone DZ-3b.
Discussion
Local Environmental Changes
Initial Environmental Conditions Prior 1300 cal BP
Between 2940 and 1300 cal BP, sedimentological and vegetation data do not show major changes (Figures 3, 5A). The high dominance of tree taxa suggests a large area of forest. Most tree taxa that are described as typical of rain forest in modern and fossil pollen samples from Madagascar are well represented in this period (e.g., Moraceae/Urticaceae, Celtis, Elaeocarpaceae, Macaranga/Mallotus and Podocarpus; Burney, 1988; Gasse and Van Campo, 2001). This suggests that the dense and humid rain forest was the dominant vegetation prior to 1300 cal BP on Nosy Be. The low fire activity during the same time confirms the occurrence of rain forest developed under humid environmental conditions and low disturbance regime (Figure 6A). Furthermore, the presence of a wide variety of lignicolous fungi indicate the availability of dead wood substrate in the lake catchment as well (Figure 5B).
Sedimentological and geochemical results are consistent with the dominance of rain forest prior 1300 cal BP. Relatively low SAR supports the assumption of dense vegetation stabilizing the topsoils in the catchment (Figure 2). The comparably coarse particle median (Figure 3) might either be indicative for lacking grasses and thus a missing “filter” for larger minerogenic particles flushing into the lake by inflowing water, or coarser particles might point to comparably moist conditions with higher amounts of precipitation and thus higher transport energy of the inflows (Conroy et al., 2008). High organic carbon contents, high C/N-ratios, and high amounts of leaf-wax n-alkanes during this phase further suggest high productivity within the catchment and input of terrestrial organic matter (Meyers and Ishiwatari, 1993; Figures 3, 4). The depleted δ13C values of the bulk organic matter point to predominantly C3 vegetation (Figure 3; Farquhar et al., 1989; Meyers, 1994; Diefendorf et al., 2010).
The n-alkane patterns show a dominance of nC29, nC31, and nC33, and the Paq is accordingly very low. This indicates a dominant input from higher terrestrial plants over input from aquatic sources (Eglinton and Hamilton, 1967; Zech et al., 2010). Distinguishing between input from grasses and herbs versus deciduous trees, as has been done in other studies (e.g., Zech et al., 2013b; Schäfer et al., 2016), needs to take into account that common plants of rain forests synthesize high amounts of nC31 and nC33 (Gnecco et al., 1989; Abas and Simoneit, 1998; Li et al., 2016; Teunissen van Manen et al., 2019). The high ACL values in comparison to northern mid-latitude locations (e.g., Europe) thus reflect the local rain forest signal, and should not be mis-interpreted to indicate dominant input from grasses and herbs.
Ecosystem Shift From 1300 to 1000 Cal BP
From 1300 cal BP, most tree taxa decrease and some of them almost entirely disappear (e.g., Podocarpus, Weinmannia, Ilex, Meliaceae/Sapotaceae, Figure 5A). Inversely, an increase of herbs (mainly Poaceae) is observed. Together with an enrichment in δ13C of the bulk organic fraction further suggesting a shift from C3 to more C4 vegetation (Farquhar et al., 1989; Meyers, 1994; Diefendorf et al., 2010), this points to the development of a mosaic of grassland and forest (Figure 3). Combined with the increase in macro-charcoal mainly associated with increased grass-based charcoal particles (Figure 6A), our results suggest an abrupt development of grasses dominated and fire disturbed landscape and confirm the alteration of the rain forest. High-resolution paleoecological analyses during that critical transition (see Figure 6C) reveal that grassland developed within few decades and occurs simultaneously with increases of fires. The co-occurrence between the first peak of macro-charcoal particles and the peak of magnetic susceptibility indicate that fires were local to the catchment and led to the observed forest alteration and initiated the increase of soil erosion. Similar observations were made at Laguna Potrok Aike, Patagonia where increased frequency dependent magnetic susceptibility and increased charcoal accumulation rates indicated the destruction of the vegetation cover by fire leading to enhanced soil erosion (Haberzettl et al., 2006).
Vegetation changes are also evidenced by the considerable development of saprophilous/coprophilous fungal spores (Figure 5B), that generally develop on decaying plant remains (e.g., litter) and/or herbivore livestock dung (e.g., Krug et al., 2004; Shumilovskikh L. et al., 2021; van Asperen et al., 2021). Plant parasitic fungi such as Tetraploa aristata, Spegazzinia sp., Dictyoarthrinium cf. sacchari indicate wide spread of herbaceous monocots and dicots as well while lignicolous fungi such as Xylariaceae decrease after 1100 cal BP (Shumilovskikh L. et al., 2021). Therefore, this complete rearrangement of lignicolous and plant parasites fungal spores confirms an important forest dieback at the expense of grassland. In addition to vegetation changes, enhanced soil erosion is also indicated by Glomus-type (Figure 5B), representing chlamydospores of the arbuscular mycorrhizal fungi growing symbiotically on plant roots (van Geel et al., 1989).
Sediment physical and organic characteristics are altered at this transition and SAR is increasing by almost one order of magnitude, supporting the pronounced decrease in tree cover associated with increased vulnerability of the soils to erosion. This is also visible in the higher frequency of ERDs occurring within the deposits (Figure 2). Following a short-term coarsening of the particles between 1300 and 1200 cal BP, the fining of the minerogenic particles accompanied by slightly better sorting and a more positive skewness of the distributions is observed at ca. 1150 cal BP (Figure 3). These changes suggest a selective deposition based on alteration of transport processes, i.e., lower amount of transport energy or shielding (McLaren, 1981; McLaren and Bowles, 1985). In this context, the development of Potamogeton from 1150 cal BP onward as an emergent aquatic plant, which likely covered the shallow (near shore/littoral) water areas, might have acted as sediment trap for larger particles. A lake level increase could have provided shallow water areas for macrophytes growth, since this would inundate the northwestern area of the catchment leading to the formation of a larger shallow water area, with emerging aquatic vegetation acting consequently as source of aquatic biomass and as sink for coarse minerogenic particles. A comparable process has been observed recently using aerial imagery (Supplementary Figure 4). The lake level increase might also be associated with enhanced nutrient supply, which, in combination, most likely explain the rise of aquatic vegetation and algae which is also supported by a distinct shift to rather low C/N-ratios (Meyers and Ishiwatari, 1993). The exceptional enrichment in δ15N during this phase might support the enhanced nutrient supply through the input of isotopically enriched N with either topsoil (Ochiai et al., 2015), or distinctive input from anthropogenic/livestock sources (sewage) (Enters et al., 2010). Alternatively, denitrification of the system due to tenacious anoxic conditions at the lake floor might be an explanation for the high δ15N (Enters et al., 2010).
This increase of soil erosion impacted lake ecosystem dynamics by increasing nutrient discharges which probably contributed to the development of the aquatic plant Potamogeton followed by the development of the green algae Botryococcus. A change in lake ecosystem dynamic is further supported by the diatom record characterized by minimum concentration values between 1300 and 1040 cal BP (concentration minimum peaking at 1160 cal BP) and minimum valve preservation at ca. 1100 cal BP (Figure 7). Low concentration values are likely caused by enhanced catchment erosion and input of minerogenic material into the lake with associated dilution of autochthonous material. Additionally, the low valve preservation is suggested to be linked to both, mechanical breakage in a high dynamic (energy) environment, and potentially to an increase in pH (Flower and Ryves, 2009). A distinct shift in the dominating planktonic diatom species from Discostella cf. mascarenica to Aulacoseira granulata agg. further proofs a change in the lake ecosystem following the transitional phase. Discostella mascarenica is a rare species and only little is known on its distribution and ecological preferences. It was described from a small, alkaline, eutrophic freshwater pond on Réunion island, situated 800 km to the east of Madagascar (Klee et al., 2000). Aulacoseira granulata occurs worldwide in a wide range of trophic conditions but is often associated with more eutrophic waters. Moreover, it is frequent under turbulent conditions, capable to survive in higher turbid waters, has high growth demands for silica and has also been connected to phases of increased erosion (Kilham et al., 1986; Costa-Böddeker et al., 2012; Bicudo et al., 2016; Nardelli et al., 2016). Shifts among Discostella and Aulacoseira have been associated with physical restructuring of the water column, whereby small cyclotelloid species like Discostella benefit from a strongly stratified water column and larger-celled Aulacoseira taxa are favored by strong vertical mixing (Rühland et al., 2015). Thus, the change from Discotella cf. mascarenica to Aulacoseria granulata agg. in Lake Amaprihibe supports the assumption of a catchment alteration leading to increased turbulence and turbidity.
The distinctive decrease in leaf-wax n-alkane amount, the shift to shorter chain n-alkane predominance and the marked increase in Paq further supports the emergence of aquatic vegetation (Ficken et al., 2000; Aichner et al., 2010; Castañeda and Schouten, 2011) as the result of a change in nutrient supply to the lake. Decreasing ACL values document the input of shorter homologs. In order to evaluate and reduce a potential bias of aquatic and emergent plants (likely also producing C27 and C29 to some degree), the modified ACL′ and ACL″ is applied. The increase at 1300 cal BP in these modified indices point to enhanced input of long-chain C33 likely originating from grasses. This would also support the increase in δ13C of the bulk organic fraction, which suggest a shift to higher amounts of C4 vegetation.
Development Toward Modern Vegetation Conditions
After 1000-900 cal BP, a slow and progressive forest recovery is evidenced by slight decrease of Poaceae pollen percentages and slight reduction of fire activity, while pioneer tree taxa (e.g., Macaranga/Mallotus) tend to increase (Figures 5A, 6). The coeval pronounced increase in biogenic silica (BiSi) until 820 cal BP (Figure 3), coinciding with high diatom concentrations, especially of the heavily silicified species Aulacoseira granulata, however indicates an enhanced nutrient input (Ferris and Lehman, 2007). The further lowering in C/N as well as the high Paq afterward also suggest a predominance of aquatic (macrophyte and algae) biomass production (Meyers, 1994, 2003; Figures 3, 4). Forest recovery and the decrease in fire occurrences continues after 600 cal BP, evidenced by still decreasing Poaceae pollen percentages, moderate high charcoal concentration and a slight depletion trend in the δ13C record toward C3 vegetation endmember. However, pollen assemblages reveal a different tree composition than in rain forest prior to 1300 cal BP. Pioneer tree taxa characterized by fast recovery after disturbance (Trema, Macaranga/Mallotus) are more abundant, while several tree taxa do not recover (Podocarpus, Weinmannia, Ilex, Meliaceae/Sapotaceae or Schefflera) and new ones appear (Myrtaceae and Mimosa). This new tree assemblage points to the development toward modern vegetation conditions which are characterized by a secondary complex vegetation including rain forest, wooded savanna and grasslands with crops mosaics (Mayaux et al., 2000). The result of this substantial change of the landscape is also evidenced by a stable intermediate SAR and the deposition of constantly small minerogenic particles with a sorting and a distribution skewness on a stable but very different level, compared to the initial phase (unit I, Figures 2, 3). Magnetic susceptibility on a quite stable intermediate level suggests a constant input of soil material, which is likely originating from farming activities in the catchment of the lake.
Regional Implications in Northwestern Madagascar
Several studies proposed that human arrival in Madagascar occurred during the early or mid-Holocene (Dewar et al., 2013; Hansford et al., 2018). However, timing and modality of these early occupations are still debated. Except for cut marks on bones, no direct human evidence (archeological artifacts) has been described for the early Holocene (Hansford et al., 2018), while for the mid-Holocene, radiocarbon dating are controversial (Anderson et al., 2018; Anderson, 2019). The recent synthesis of Douglass et al. (2019) suggests that hunters/foragers populations inhabited the island at least since 2000 cal BP. Such activities generally consisting of ephemeral occupations are challenging to record with paleoecological archives since environmental impact is assumed to have been relatively low. Indeed, the vegetation surrounding Lake Amparihibe was mainly dominated by rain forest without major vegetation/environmental changes between 2940 and 1300 cal BP (Figure 8A). Consequently, if humans were inhabiting Nosy Be prior to 1300 cal BP, human activity was not strong enough to alter the vegetation composition, or at least, not strong enough to be detected with the applied paleoenvironmental proxies.
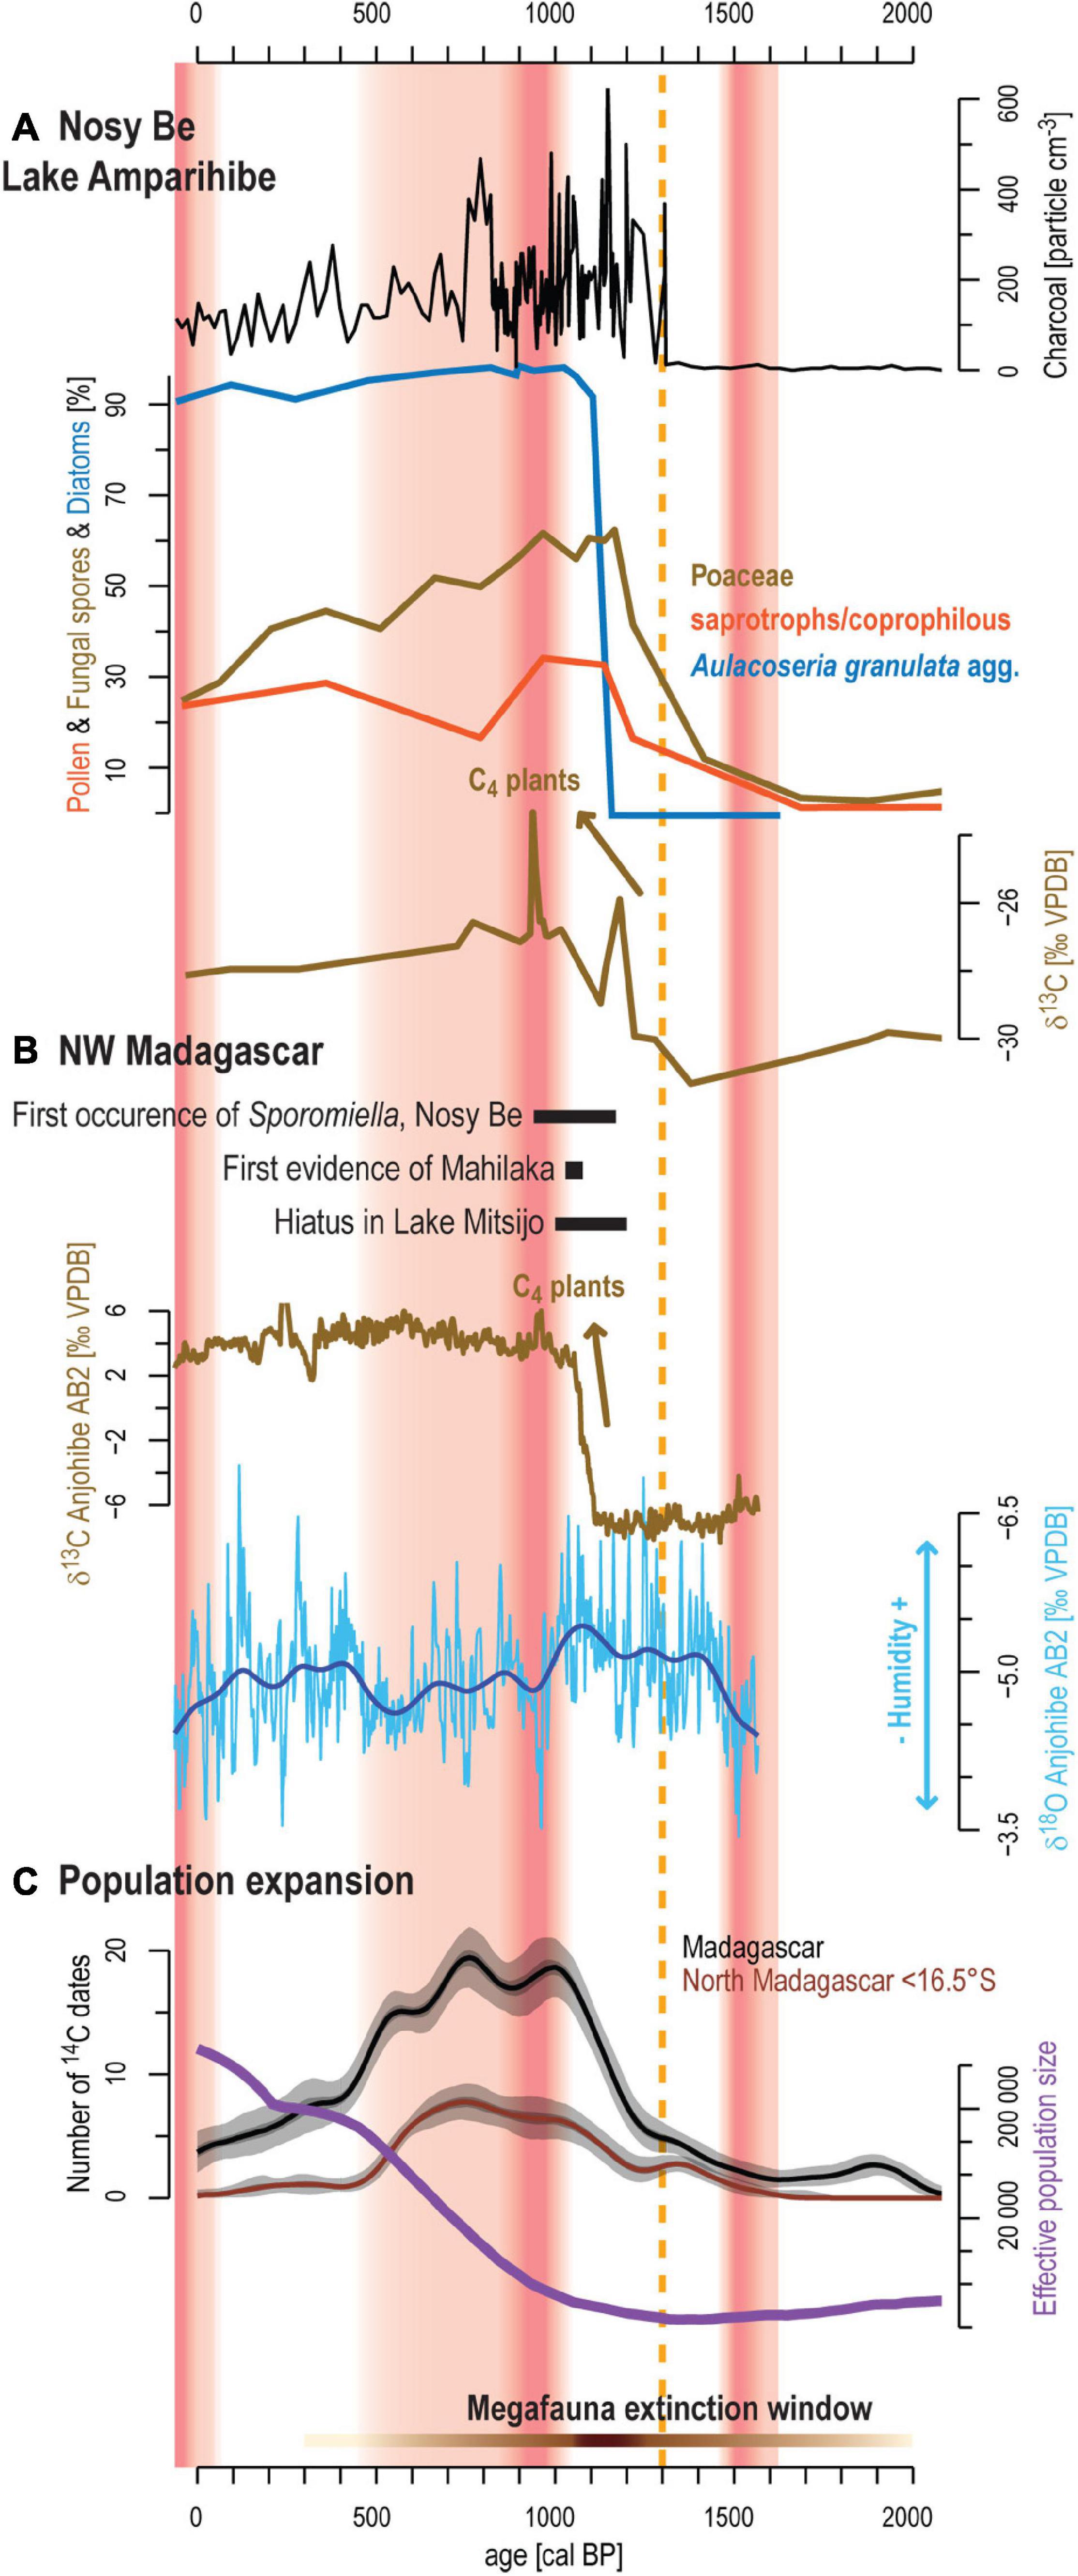
Figure 8. Synthesis of environmental changes in northwestern Madagascar during the past 2000 years. (A) main results from sediment sequence AMP16 showing macro-charcoal concentration, percentages of Poaceae, saprotrophs/coprophilous fungal spores and diatom from Aulacoseria granulata agg. and the δ13C signal. (B) Evidence of initial human occupation on Nosy Be (Burney et al., 2003) and Mahilaka (Crowther et al., 2016). Hiatus in Lake Mitsijo interpreted as a dry period (Matsumoto and Burney, 1994) and δ13C and δ18O speleothem profiles from Anjohibe cave showing C3/C4 vegetation and dynamic and precipitation changes (Scroxton et al., 2017). (C) Black curve and brown curve represent the number of 14C dated archeological samples obtained from Douglass et al. (2019) for the whole island and north of 16.5°S. For each 14C date, 1000 calibrated dates were drawn according to their probability distribution following calibration with the SHcal20 calibration curve (Hogg et al., 2020). Kernel density estimation with a bandwidth of 60 years was applied to each 1000 calibrated dataset and the median curve and the 5% and 95% percentiles computed. Purple curve shows the estimated changes in the effective population size after Pierron et al. (2017). The orange dashed line shows the main environmental change recorded on Nosy Be. The horizontal brown bar with varying saturation intensity shows timelines of pace megafaunal decline in Madagascar (Godfrey et al., 2019). The red shaded areas correspond to the dry periods defined by the δ18O measured on the speleothem and varying saturation intensity to red marks high values within these periods.
Previous Paleoecological Study From Lake Amparihibe
The previous study conducted on Lake Amparihibe by Burney et al. (2003) sets the date for the first occurrence of livestock and initial human impact to 1000 +180/–90 cal BP (calibrated age from original publication), by moderating the occurrence of Sporormiella and an increase in sedimentary macro-charcoal particles. Our results suggest a major transformation of rain forest vegetation, to an open, fire disturbed, landscape, but starting somewhat earlier at 1306 ± 70 cal BP (Figure 8A). The rapid development of grasses (within several decades), coupled with peaks of macro-charcoal particles and saprotrophs/coprophilous fungal spores shows the first detectable human impact in northwestern Madagascar. These results illustrate the development of agriculture likely related to fire for pasture. Human impact has altered the environment and led to a major impact on the sediment accumulation increasing by one order of magnitude (0.13 to 1.3 mm a–1) within less than 100 years. The lake system reacted with changes in the trophic status on this sudden release of nutrients transferred with the eroded soils.
Surprisingly, we were not able to confirm the predicted increase of Sporormiella in our record. After 1300 cal BP, a spore of Sporormiella has been counted only once on the top core while Burney et al. (2003) show that Sporormiella appear at the same time that macro-charcoal particles increase. Raper and Bush (2009) demonstrated that Sporormiella concentration declines from the shoreline across the first 100 m of a lake surface, highlighting the importance of the lake size and its changes in the interpretation of paleoecological records of Sporormiella abundance. Although both coring locations are in the central part of the lake, slight differences of distances from the shoreline might be an explanation since Sporormiella occur in low numbers (<2%) in Burney et al. (2003). However, evaluation of this effect in Nosy Be requires more research and other factors might also contribute to the different results (e.g., chemical treatments, spore identifications). Despite this difference, the entire assemblage of the saprotrophic/coprophilous fungi in our record strongly suggests presence of grazing around the lake (Shumilovskikh and van Geel, 2020; van Asperen et al., 2021), confirming previous results (Burney et al., 2003). By reaching the same conclusion, but with some difference in the results, we demonstrate that this is crucial to not only focus on one taxon, but to focus on the whole assemblages of fungal spores.
Local and Regional Comparison With Archeological Data
Comparison with archeological data reported by Douglass et al. (2019) reveals that this early human impact documented by our results on Nosy Be fits well with the major increase of radiocarbon dates in Madagascar and the maximum pace of megafauna extinction (Figure 8C). Demography history based on genomic data also revealed the same pattern with a major population expansion starting between 1250 and 750 cal BP (Figure 8C; Pierron et al., 2017). On Nosy Be, archeological surveys have shown first villages and hamlets on the western coast and overlooking Lake Amparihibe and Lake Anjavibe (Dewar and Wright, 1993; Wright and Radimilahy, 2005). Settlements from the coast had evidence of fishing activities while the interior settlements must have concerned solely with swidden cultivation of rice and the herding of cattle, goats and sheep (Wright and Radimilahy, 2005). Consequently, the establishment of such village or hamlet at 1300 cal BP, might be the best fit to explain our findings. Unfortunately, from these archeological surveys, no archeological remains (fish, turtle bones or mammal bones, carbonized coconut shells and local ceramics) have been dated on Nosy Be. However, ceramics are indistinguishable from those found during in Mahilaka, which corresponds to the oldest town described on Madagascar (Dewar and Wright, 1993; Radimilahy, 1997; Figure 1A). Mahilaka was an Islamic port located at 40 km south of Nosy Be in Ampasindava Bay and it formed, together with the Comoro islands, an important hub in the Indian Ocean trade network with several thousand inhabitants (Radimilahy, 1997; Crowther et al., 2016). Study of Crowther et al. (2016) dating rice remains in the area revealed that Comoro islands and Mahilaka were occupied at least from ca. 1250 cal BP (8th century) and from ca. 1000 cal BP (10th century), respectively. In this context, significant human impact at 1300 cal BP on Nosy Be island off the mouth off Ampasindava Bay certainly marks initial settlement of these populations in the region. After ca. 600 cal BP, human occupation declines and Mahilaka and surrounding villages in Ampasindava Bay including Nosy Be were abandoned (Dewar and Wright, 1993; Radimilahy, 1997). The reasons for this abandonment remain unclear (Wright and Radimilahy, 2005). Although recovery of forest and decrease of fires evidenced by our study may reflect this population decline, the continuous occurrences of macro-charcoal particles show that Nosy Be has certainly not been entirely deserted.
Climate Variability
To better understand the impact of these populations on natural ecosystems it is crucial to consider the potential contribution of natural factors such as climatic changes and provide robust comparisons with paleoclimate and paleoenvironmental records available in the region. Specifically, several speleothems from northwestern Madagascar help to address past variability of precipitation in this region (Figures 1A, 8B). These records show that the mid- to late Holocene was characterized by a general drying trend punctuated by decadal-to-multidecadal megadroughts or prominent droughts (Wang et al., 2019; Li et al., 2020). A common feature revealed by these speleothems during the past 3000 years is an important megadrought centered around 900 cal BP (Scroxton et al., 2017; Voarintsoa et al., 2017; Wang et al., 2019; Li et al., 2020). Human impact and associated main environmental changes observed on Nosy Be at ca. 1300 cal BP occur earlier than this megadrought (Figure 8). Consequently, this drought cannot be considered as the main trigger of the ecosystem shift during the past millennium. A similar pattern is also recorded by δ13C from the same speleothems showing the replacement of C3 woodland habitat with C4 grasslands preceding the megadrought. To explain this transition, Godfrey et al. (2019) proposed the “subsistence shift hypothesis” which suggests a shift from hunting/foraging to herding/farming between 1250 and 1050 cal BP. During this interval, settlement of new immigrant groups, concomitant expansion of human population on Madagascar combined with spread of pastoralism altered natural ecosystems and accelerated the pace of megafaunal decline on Madagascar (Godfrey et al., 2019; Li et al., 2020; Hixon et al., 2021b). Our data support this assumption on Nosy Be, that development of herding/farming activities from 1300 to 1000 cal BP fragmented the rain forest. At ca. 900 cal BP, our results indicate the largest ERD recorded during the past 3000 years and the maximum value of δ13C of the bulk organic fraction (Figure 2 and Supplementary Figure 1). This 8.7 cm thick layer might be related to a lake level decrease during the megadrought and it could explain the observed reworked material and the outlier radiocarbon date (Table 1). However, one must remain careful with the interpretation of this layer because humans were already settled in the vicinity of the lake and distinguishing the effect of human impact and climate change on ecosystems is challenging in this context. Additional study sites or precipitation-related proxy are therefore necessary to confirm this hypothesis. After ca. 500 cal BP, more humid conditions are evidenced by speleothems (Scroxton et al., 2017) and may have also contributed to the observed forest recovery on Nosy Be (Figure 5). However, except for the well constrained megadrought at 900 cal BP, speleothem records are partly showing contradicting precipitation trends, despite most of them originate from the same cave (Supplementary Figure 3 in Supplementary Material from Li et al., 2020), which makes them rather debatable.
In northwestern Madagascar, other study provided paleoecological data (Figure 8B). Lake Mitsinjo sediments (Figure 1A) recorded significant grassland development and an increase in charcoal particles occurred from ca. 1000-900 cal BP, that was preceded by a hiatus in sediment deposition (Matsumoto and Burney, 1994; Burney, 1999). In Benavony (Figure 1A), a marshy meadow, the first significant peak of macro-charcoal occurred even later at ca. 800 cal BP (Burney, 1999). Age uncertainties may be responsible for these discrepancies but small-scale spatial differences in the onset and intensity of human activities may also have played a role. Furthermore, influence of climatic changes cannot entirely be excluded, since vegetation changes in northwestern Madagascar occurred in the context of a multimillennial drying trend and several megadroughts occurred during the Holocene (Li et al., 2020). Resilience of every vegetation type in this region (dry deciduous forest, semi-deciduous forest, rain forest or montane vegetation) may have been altered differently to these climatic changes and to the increase of human activities. In this context, without additional and high-resolution paleoecological records it will further remain a matter of discussion to which extent megadroughts affected human impact on natural ecosystem alteration during the past millennium.
Conclusion
In this study, we investigated vegetation changes, fire regime, and various sedimentological proxies on the lake system of Lake Amparihibe on Nosy Be, an island located in northwestern Madagascar, which serves as a natural geoarchive. The lacustrine sediments provide insight into environmental dynamics of the past three millennia using multiple paleoenvironmental proxies. Paleoecological results indicate an ecosystem shift at 1300 cal BP characterized by a fragmentation of rain forest related to local fire intensification with development of herding and farming on Nosy Be island. This major ecological change also facilitated distinctively enhanced erosion of the local soils and thus strong sediment and nutrient input into the lacustrine system, resulting in significant aquatic community alterations. Our data confirm a first and strong human impact via agriculture and fire clearance starting at 1300 cal BP on Nosy Be. This supports the “subsistence shift hypothesis,” at a local scale, which proposed that population expansion and intensification of human activities from 1250-1050 cal BP significantly altered the natural ecosystems (Godfrey et al., 2019). However, robust comparison to investigate if this significant and early human impact, after 1300 cal BP, altered ecosystems at a larger scale and not only on the coastal sites still requires high resolution multi-proxy records from continuous sedimentary geoarchives as well as records located further north and in the hinterland. Lack of such data also prevents precise comparison in Madagascar between different regions to discern different or common features of climatic changes, ecosystem responses and anthropogenic influences at the island’s scale during the late Holocene. Provide paleoecological data beyond the late Holocene is also strongly recommended to document the influence of natural climate change on ecosystems dynamics and to understand the current state of Malagasy biodiversity (Teixeira et al., 2021). According to the shallow seismic survey and the age model Lake Amparihibe could fill this gap and contribute environmental data for at least the past 8000 years. Previous studies already recommended environmental and human history detailed investigations focusing on different regions of Madagascar (Dewar, 1997). This recommendation is still very relevant today and high-resolution paleoenvironmental data such as the ones provided here, or from new sites, are strongly needed to better understand current biodiversity and to help appropriate management and conservation of Madagascar’s unique biomes.
Data Availability Statement
The original contributions presented in the study are included in the article/Supplementary Material, further inquiries can be directed to the corresponding author/s.
Author Contributions
GD, VM, and TK designed the study. GD, J-JR, and KK organized and conducted the fieldwork. AR, ML, TK, MB, TH, LS, KK, and VM were responsible for laboratory analyses and data interpretation. AR and VM jointly wrote the first draft of the manuscript. ML, TK, RZ, CF, LS, LB, GD, and KK added sections to the manuscript. All authors discussed the manuscript and approved the submitted version.
Funding
We acknowledge support by the German Research Foundation (project BE2116/30-1) and the Open Access Publication Fund of the Thueringer Universitaets- und Landesbibliothek Jena Projekt-Nr. 433052568.
Conflict of Interest
The authors declare that the research was conducted in the absence of any commercial or financial relationships that could be construed as a potential conflict of interest.
Publisher’s Note
All claims expressed in this article are solely those of the authors and do not necessarily represent those of their affiliated organizations, or those of the publisher, the editors and the reviewers. Any product that may be evaluated in this article, or claim that may be made by its manufacturer, is not guaranteed or endorsed by the publisher.
Acknowledgments
We thank the Regional Directorate of Water, Sanitation and Hygiene in Antsiranana and local maire for supporting the field work as well as the locals to give access to the holy site. We also thank David A. Burney and Henry T. Wright for personal discussion about their previous researches on northwestern Madagascar. We are thankful to Denis Pierron and his co-authors to share their data for the effective population size. Further, we like to thank emer. Roland Mäusbacher (Friedrich Schiller University Jena) and Antje Schwalb (Technische Universität Braunschweig) for co-financing field investigations of this pilot study. We are also thankful to Carlos Wetzel for taking SEM pictures of the Discostella species. Finally, we acknowledge William D. Gosling and Henry Lamb whose comments on the previous version improved the quality of this paper substantially.
Supplementary Material
The Supplementary Material for this article can be found online at: https://www.frontiersin.org/articles/10.3389/fevo.2021.783770/full#supplementary-material
Footnotes
- ^ http://www.uwitec.at
- ^ http://apd.sedoo.fr/accueil.htm
- ^ https://www.uni-goettingen.de/en/databases+and+collections/97306.html
- ^ https://data.oreme.org/palyno/palyno_gallery
References
Abas, M. R., and Simoneit, B. R. T. (1998). Wax lipids from leaf surfaces of some common plants of Malaysia. Pertanika J. Sci. Technol. 6, 171–182.
Aichner, B., Herzschuh, U., Wilkes, H., Vieth, A., and Böhner, J. (2010). δD values of n-alkanes in Tibetan lake sediments and aquatic macrophytes – a surface sediment study and application to a 16ka record from Lake Koucha. Org. Geochem. 41, 779–790. doi: 10.1016/j.orggeochem.2010.05.010
Anderson, A. (2019). Was there mid Holocene habitation in Madagascar? A reconsideration of the OSL dates from Lakaton’i Anja. Antiquity 93, 478–487. doi: 10.15184/aqy.2018.161
Anderson, A., Clark, G., Haberle, S., Higham, T., Nowak-Kemp, M., Prendergast, A., et al. (2018). New evidence of megafaunal bone damage indicates late colonization of Madagascar. PLoS One 13:e0204368. doi: 10.1371/journal.pone.0204368
Battarbee, R. W., and Bennion, H. (2011). Palaeolimnology and its developing role in assessing the history and extent of human impact on lake ecosystems. J. Paleolimnol. 45, 399–404. doi: 10.1007/s10933-010-9423-7
Bayon, G., Schefuß, E., Dupont, L., Borges, A. V., Dennielou, B., Lambert, T., et al. (2019). The roles of climate and human land-use in the late Holocene rainforest crisis of Central Africa. Earth Planet. Sci. Lett. 505, 30–41. doi: 10.1016/j.epsl.2018.10.016
Bicudo, D. C., Tremarin, P. I., Almeida, P. D., Zorzal-Almeida, S., Wengrat, S., Faustino, S. B., et al. (2016). Ecology and distribution of Aulacoseira species (Bacillariophyta) in tropical reservoirs from Brazil. Diatom Res. 31, 199–215. doi: 10.1080/0269249X.2016.1227376
Blaauw, M., and Christen, J. A. (2011). Flexible paleoclimate age-depth models using an autoregressive gamma process. Bayesian Anal. 6, 457–474. doi: 10.1214/11-BA618
Blott, S. J., and Pye, K. (2001). GRADISTAT: a grain size distribution and statistics package for the analysis of unconsolidated sediments. Earth Surf. Process. Landf. 26, 1237–1248. doi: 10.1002/esp.261
Burney, D. A. (1987). Late Holocene vegetational change in central Madagascar. Quat. Res. 28, 130–143. doi: 10.1016/0033-5894(87)90038-X
Burney, D. A. (1988). Modern pollen spectra from Madagascar. Palaeogeogr. Palaeoclimatol. Palaeoecol. 66, 63–75. doi: 10.1016/0031-0182(88)90081-8
Burney, D. A. (1997). Tropical islands as paleoecological laboratories: gauging the consequences of human arrival. Hum. Ecol. 25, 437–457. doi: 10.1023/A:1021823610090
Burney, D. A. (1999). “Rates, patterns, and processes of landscape transformation and extinction in Madagascar,” in Extinctions in Near Time: Causes, Contexts, and Consequences Advances in Vertebrate Paleobiology, ed. R. D. E. MacPhee (Boston, MA: Springer US), 145–164. doi: 10.1007/978-1-4757-5202-1_7
Burney, D. A., Robinson, G. S., and Burney, L. P. (2003). Sporormiella and the late Holocene extinctions in Madagascar. Proc. Natl. Acad. Sci. U.S.A. 100, 10800–10805. doi: 10.1073/pnas.1534700100
Burns, S. J., Godfrey, L. R., Faina, P., McGee, D., Hardt, B., Ranivoharimanana, L., et al. (2016). Rapid human-induced landscape transformation in Madagascar at the end of the first millennium of the Common Era. Quat. Sci. Rev. 134, 92–99. doi: 10.1016/j.quascirev.2016.01.007
Castañeda, I. S., and Schouten, S. (2011). A review of molecular organic proxies for examining modern and ancient lacustrine environments. Quat. Sci. Rev. 30, 2851–2891. doi: 10.1016/j.quascirev.2011.07.009
Castilla-Beltrán, A., de Nascimento, L., Fernández-Palacios, J. M., Fonville, T., Whittaker, R. J., Edwards, M., et al. (2019). Late Holocene environmental change and the anthropization of the highlands of Santo Antão Island, Cabo Verde. Palaeogeogr. Palaeoclimatol. Palaeoecol. 524, 101–117. doi: 10.1016/j.palaeo.2019.03.033
Clist, B., Bostoen, K., de Maret, P., Eggert, M. K. H., Höhn, A., Mindzié, C. M., et al. (2018). Did human activity really trigger the late Holocene rainforest crisis in Central Africa? Proc. Natl. Acad. Sci. U.S.A. 115, E4733–E4734. doi: 10.1073/pnas.1805247115
Conroy, J. L., Overpeck, J. T., Cole, J. E., Shanahan, T. M., and Steinitz-Kannan, M. (2008). Holocene changes in eastern tropical Pacific climate inferred from a Galápagos lake sediment record. Quat. Sci. Rev. 27, 1166–1180. doi: 10.1016/j.quascirev.2008.02.015
Costa-Böddeker, S., Bennion, H., de Jesus, T. A., Albuquerque, A. L. S., Figueira, R. C. L., de, C., et al. (2012). Paleolimnologically inferred eutrophication of a shallow, tropical, urban reservoir in southeast Brazil. J. Paleolimnol. 48, 751–766. doi: 10.1007/s10933-012-9642-1
Crowley, B. E. (2010). A refined chronology of prehistoric Madagascar and the demise of the megafauna. Quat. Sci. Rev. 29, 2591–2603. doi: 10.1016/j.quascirev.2010.06.030
Crowley, B. E., Godfrey, L. R., Hansford, J. P., and Samonds, K. E. (2021). Seeing the forest for the trees—and the grasses: revisiting the evidence for grazer-maintained grasslands in Madagascar’s Central Highlands. Proc. R. Soc. B Biol. Sci. 288:20201785. doi: 10.1098/rspb.2020.1785
Crowther, A., Lucas, L., Helm, R., Horton, M., Shipton, C., Wright, H. T., et al. (2016). Ancient crops provide first archaeological signature of the westward Austronesian expansion. Proc. Natl. Acad. Sci. U.S.A. 113, 6635–6640. doi: 10.1073/pnas.1522714113
Cucciniello, C., Tucker, R. D., Jourdan, F., Melluso, L., and Morra, V. (2016). The age and petrogenesis of alkaline magmatism in the Ampasindava Peninsula and Nosy Be Archipelago, northern Madagascar. Mineral. Petrol. 110, 309–331. doi: 10.1007/s00710-015-0387-1
Daniau, A.-L., Desprat, S., Aleman, J. C., Bremond, L., Davis, B., Fletcher, W., et al. (2019). Terrestrial plant microfossils in palaeoenvironmental studies, pollen, microcharcoal and phytolith. Towards a comprehensive understanding of vegetation, fire and climate changes over the past one million years. Rev. Micropaléontol. 63, 1–35. doi: 10.1016/j.revmic.2019.02.001
de Nascimento, L., Nogué, S., Naranjo-Cigala, A., Criado, C., McGlone, M., Fernández-Palacios, E., et al. (2020). Human impact and ecological changes during prehistoric settlement on the Canary Islands. Quat. Sci. Rev. 239:106332. doi: 10.1016/j.quascirev.2020.106332
Dewar, R. E. (1997). “Were people responsible for the extinction of Madagascar’s subfossils, and how will we ever know?,” in Natural Change and Human Impact in Madagascar, eds S. M. Goodman and B. D. Patterson (Washington, DC: Smithsonian Institution Press), 364–377.
Dewar, R. E., Radimilahy, C., Wright, H. T., Jacobs, Z., Kelly, G. O., and Berna, F. (2013). Stone tools and foraging in northern Madagascar challenge Holocene extinction models. Proc. Natl. Acad. Sci. U.S.A. 110, 12583–12588. doi: 10.1073/pnas.1306100110
Dewar, R. E., and Wright, H. T. (1993). The culture history of Madagascar. J. World Prehist. 7, 417–466. doi: 10.1007/BF00997802
Diefendorf, A. F., Mueller, K. E., Wing, S. L., Koch, P. L., and Freeman, K. H. (2010). Global patterns in leaf 13C discrimination and implications for studies of past and future climate. Proc. Natl. Acad. Sci. U.S.A. 107, 5738–5743.
Douglass, K., Hixon, S., Wright, H. T., Godfrey, L. R., Crowley, B. E., Manjakahery, B., et al. (2019). A critical review of radiocarbon dates clarifies the human settlement of Madagascar. Quat. Sci. Rev. 221:105878. doi: 10.1016/j.quascirev.2019.105878
Eglinton, G., and Hamilton, R. J. (1967). Leaf epicuticular waxes. Science 156, 1322–1335. doi: 10.1126/science.156.3780.1322
Enache, M. D., and Cumming, B. F. (2006). Tracking recorded fires using charcoal morphology from the sedimentary sequence of Prosser Lake, British Columbia (Canada). Quat. Res. 65, 282–292. doi: 10.1016/j.yqres.2005.09.003
Enters, D., Kirilova, E., Lotter, A. F., Lücke, A., Parplies, J., Jahns, S., et al. (2010). Climate change and human impact at Sacrower See (NE Germany) during the past 13,000 years: a geochemical record. J. Paleolimnol. 43, 719–737. doi: 10.1007/s10933-009-9362-3
Farquhar, G. D., Hubick, K. T., Condon, A. G., and Richards, R. A. (1989). “Carbon isotope fractionation and plant water-use efficiency,” in Stable Isotopes in Ecological Research Ecological Studies, eds P. W. Rundel, J. R. Ehleringer, and K. A. Nagy (New York, NY: Springer), 21–40. doi: 10.1007/978-1-4612-3498-2_2
Ferris, J. A., and Lehman, J. T. (2007). Interannual variation in diatom bloom dynamics: roles of hydrology, nutrient limitation, sinking, and whole lake manipulation. Water Res. 41, 2551–2562. doi: 10.1016/j.watres.2007.03.027
Ficken, K. J., Li, B., Swain, D. L., and Eglinton, G. (2000). An n-alkane proxy for the sedimentary input of submerged/floating freshwater aquatic macrophytes. Org. Geochem. 31, 745–749. doi: 10.1016/S0146-6380(00)00081-4
Flower, R. J., and Ryves, D. (2009). Diatom preservation: differential preservation of sedimentary diatoms in two saline lakes. Acta Bot. Croat. 68, 381–399.
Garcin, Y., Deschamps, P., Ménot, G., de Saulieu, G., Schefuß, E., Sebag, D., et al. (2018a). Early anthropogenic impact on Western Central African rainforests 2,600 y ago. Proc. Natl. Acad. Sci. U.S.A. 115, 3261–3266. doi: 10.1073/pnas.1715336115
Garcin, Y., Deschamps, P., Ménot, G., de Saulieu, G., Schefuß, E., Sebag, D., et al. (2018b). Reply to Giresse et al.: no evidence for climate variability during the late Holocene rainforest crisis in Western Central Africa. Proc. Natl. Acad. Sci. U.S.A. 115, E6674–E6675. doi: 10.1073/pnas.1808481115
Gasse, F., and Van Campo, E. (2001). Late Quaternary environmental changes from a pollen and diatom record in the southern tropics (Lake Tritrivakely, Madagascar). Palaeogeogr. Palaeoclimatol. Palaeoecol. 167, 287–308. doi: 10.1016/S0031-0182(00)00242-X
Gnecco, S., Bartulin, J., Becerra, J., and Marticorena, C. (1989). N-alkanes from Chilean Euphorbiaceae and compositae species. Phytochemistry 28, 1254–1256. doi: 10.1016/0031-9422(89)80222-5
Godfrey, L. R., Scroxton, N., Crowley, B. E., Burns, S. J., Sutherland, M. R., Pérez, V. R., et al. (2019). A new interpretation of Madagascar’s megafaunal decline: the “Subsistence Shift Hypothesis”. J. Hum. Evol. 130, 126–140. doi: 10.1016/j.jhevol.2019.03.002
Gosling, W. D., de Kruif, J., Norder, S. J., de Boer, E. J., Hooghiemstra, H., Rijsdijk, K. F., et al. (2017). Mauritius on fire: tracking historical human impacts on biodiversity loss. Biotropica 49, 778–783. doi: 10.1111/btp.12490
Gosling, W. D., Miller, C. S., and Livingstone, D. A. (2013). Atlas of the tropical West African pollen flora. Rev. Palaeobot. Palynol. 199, 1–135. doi: 10.1016/j.revpalbo.2013.01.003
Grimm, E. (1987). CONISS: a FORTRAN 77 program for stratigraphically constrained cluster analysis by the method of incremental sum of squares. Comput. Geosci. 13, 13–35. doi: 10.1016/0098-3004(87)90022-7
Haberzettl, T., Kasper, T., Stoner, J. S., Rahobisoa, J. J., and Daut, G. (2021). Extending and refining the paleomagnetic secular variation database for south-eastern Africa (Madagascar) to 2500 cal BP. Earth Planet. Sci. Lett. 565:116931. doi: 10.1016/j.epsl.2021.116931
Haberzettl, T., Wille, M., Fey, M., Janssen, S., Lücke, A., Mayr, C., et al. (2006). Environnemental change and fire history of southern Patagonia (Argentina) during the last five centuries. Quat. Int. 158, 72–82.
Hammer, O., Harper, D., and Ryan, P. (2001). PAST: paleontological statistics software package for education and data analysis. Palaeontol. Electron. 4, 1–9.
Hansford, J., Wright, P. C., Rasoamiaramanana, A., Pérez, V. R., Godfrey, L. R., Errickson, D., et al. (2018). Early Holocene human presence in Madagascar evidenced by exploitation of avian megafauna. Sci. Adv. 4:eaat6925. doi: 10.1126/sciadv.aat6925
Hijmans, R. J., Cameron, S. E., Parra, J. L., Jones, P. G., and Jarvis, A. (2005). Very high resolution interpolated climate surfaces for global land areas. Int. J. Climatol. 25, 1965–1978. doi: 10.1002/joc.1276
Hixon, S. W., Curtis, J. H., Brenner, M., Douglass, K. G., Domic, A. I., Culleton, B. J., et al. (2021a). Drought coincided with, but does not explain, late Holocene megafauna extinctions in SW Madagascar. Climate 9:138. doi: 10.3390/cli9090138
Hixon, S. W., Douglass, K. G., Crowley, B. E., Rakotozafy, L. M. A., Clark, G., Anderson, A., et al. (2021b). Late Holocene spread of pastoralism coincides with endemic megafaunal extinction on Madagascar. Proc. R. Soc. B Biol. Sci. 288:20211204. doi: 10.1098/rspb.2021.1204
Hogg, A. G., Heaton, T. J., Hua, Q., Palmer, J. G., Turney, C. S., Southon, J., et al. (2020). SHCal20 Southern hemisphere calibration, 0–55,000 years cal BP. Radiocarbon 62, 759–778. doi: 10.1017/RDC.2020.59
Houk, V., and Klee, R. (2007). Atlas of freshwater centric diatoms with a brief key and descriptions. Part II. Melosiraceae and Aulacoseiraceae (Supplement of Part I). Fottea 7, 85–255.
Houk, V., Klee, R., and Tanaka, H. (2010). Atlas of freshwater centric diatoms with a brief key and descriptions, Part III. Stephanodiscaceae A, Cyclotella, Tertiarius, Discostella. Fottea 10, 1–498.
Juggins, P. S. (2015). rioja: Analysis of Quaternary Science Data. Available online at: http://eprints.ncl.ac.uk. Available online at: http://eprints.ncl.ac.uk/pub_details2.aspx?pub_id=222467 (accessed January 24, 2017).
Juggins, S. (2007). User Guide C2 Software for Ecological and Palaeoecological Data Analysis and Visualization, User Guide Version 1.5. Newcastle upon Tyne: Department of Geography. University of Newcastle.
Kahn, J. G., Nickelsen, C., Stevenson, J., Porch, N., Dotte-Sarout, E., Christensen, C. C., et al. (2015). Mid- to late Holocene landscape change and anthropogenic transformations on Mo‘orea, Society Islands: a multi-proxy approach. Holocene 25, 333–347. doi: 10.1177/0959683614558649
Kalbe, L., and Werner, H. (1974). Das sediment des Kummerower Sees. Untersuchungen des chemismus und der diatomeenflora. Int. Rev. Gesamten Hydrobiol. Hydrogr. 59, 755–782. doi: 10.1002/iroh.19740590603
Kilham, P., Kilham, S. S., and Hecky, R. E. (1986). Hypothesized resource relationships among African planktonic diatoms. Limnol. Oceanogr. 31, 1169–1181. doi: 10.4319/lo.1986.31.6.1169
Klee, R., Houk, V., and Bielsa, S. (2000). Cyclotella mascarenica nov. spec., a new stelligeroid Cyclotella (Bacillariophyceae) from a pond of the Réunion Island (France). Algol. Stud. Hydrobiol. 98, 7–25. doi: 10.1127/algol_stud/98/2000/7
Koechlin, J., Guillaumet, J.-L., and Morat, P. (1974). Flore et Végétation de Madagascar. Vaduz: Cramer.
Krammer, K., and Lange-Bertalot, H. (1986). “Bacillariophyceae. 1. Teil: Naviculaceae,” in Süßwasserflora von Mitteleuropa, Band 2/1, eds H. Ettl, J. Gerloff, H. Heynig, and D. Mollenhauer (Stuttgart: Gustav Fischer Verlag), 876.
Krammer, K., and Lange-Bertalot, H. (1988). “Bacillariophyceae. 2. Teil: Bacillariaceae. Epithemiaceae, Surirellaceae,” in Süßwasserflora von Mitteleuropa, Band 2/2, eds H. Ettl, J. Gerloff, H. Heynig, and D. Mollenhauer (Stuttgart: Gustav Fischer Verlag), 612.
Krammer, K., and Lange-Bertalot, H. (1991a). “Bacillariophyceae. 3. Teil: Centrales, Fragilariaceae, Eunotiaceae,” in Süßwasserflora von Mitteleuropa, Band 2/3, eds H. Ettl, J. Gerloff, H. Heynig, and D. Mollenhauer (Stuttgart: Gustav Fischer Verlag), 576.
Krammer, K., and Lange-Bertalot, H. (1991b). “Bacillariophyceae. 4. Teil: Achnanthaceae. Kritische Erganzungen zu Navicula (Lineolatae) und Gomphonema,” in Süßwasserflora von Mitteleuropa, Band 2/4, eds H. Ettl, J. Gerloff, H. Heynig, and D. Mollenhauer (Stuttgart: Gustav Fischer Verlag), 437.
Krug, J. C., Benny, G. L., and Keller, H. W. (2004). “Coprophilous fungi,” in Biodiversity of Fungi. Inventory and Monitoring Methods, eds G. M. Mueller, D. F. Bills, and M. S. Foster (Burlington, MA: Academic Press), 467–499.
Lange-Bertalot, H., Hofmann, G., Werum, M., and Cantonati, M. (2017). Central Europe: Over 800 Common Species Used in Ecological Assessment. Schmitten-Oberreifenberg: Koeltz Botanical Books.
Li, H., Sinha, A., André, A. A., Spötl, C., Vonhof, H. B., Meunier, A., et al. (2020). A multimillennial climatic context for the megafaunal extinctions in Madagascar and Mascarene Islands. Sci. Adv. 6:eabb2459. doi: 10.1126/sciadv.abb2459
Li, Y., Yang, S., Wang, X., Hu, J., Cui, L., Huang, X., et al. (2016). Leaf wax n-alkane distributions in Chinese loess since the Last Glacial Maximum and implications for paleoclimate. Quat. Int. 399, 190–197. doi: 10.1016/j.quaint.2015.04.029
Maley, J., Doumenge, C., Giresse, P., Mahé, G., Philippon, N., Hubau, W., et al. (2018). Late Holocene forest contraction and fragmentation in central Africa. Quat. Res. 89, 43–59. doi: 10.1017/qua.2017.97
Matsumoto, K., and Burney, D. A. (1994). Late Holocene environments at Lake Mitsinjo, northwestern Madagascar. Holocene 4, 16–24. doi: 10.1177/095968369400400103
Mayaux, P., Gond, V., and Bartholome, E. (2000). A near-real time forest-cover map of Madagascar derived from SPOT-4 VEGETATION data. Int. J. Remote Sens. 21, 3139–3144. doi: 10.1080/01431160050145018
McLaren, P. (1981). An interpretation of trends in grain size measures. J. Sediment. Res. 51, 611–624. doi: 10.1306/212F7CF2-2B24-11D7-8648000102C1865D
McLaren, P., and Bowles, D. (1985). The effects of sediment transport on grain-size distributions. J. Sediment. Res. 55, 457–470. doi: 10.1306/212F86FC-2B24-11D7-8648000102C1865D
Meyers, P. A. (1994). Preservation of elemental and isotopic source identification of sedimentary organic matter. Chem. Geol. 114, 289–302. doi: 10.1016/0009-2541(94)90059-0
Meyers, P. A. (2003). Applications of organic geochemistry to paleolimnological reconstructions: a summary of examples from the Laurentian Great Lakes. Org. Geochem. 34, 261–289. doi: 10.1016/S0146-6380(02)00168-7
Meyers, P. A., and Ishiwatari, R. (1993). Lacustrine organic geochemistry—an overview of indicators of organic matter sources and diagenesis in lake sediments. Org. Geochem. 20, 867–900. doi: 10.1016/0146-6380(93)90100-P
Nardelli, M. S., Bueno, N. C., Ludwig, T. A. V., and Guimarães, A. T. B. (2016). Structure and dynamics of the planktonic diatom community in the Iguassu River, Paraná State, Brazil. Braz. J. Biol. 76, 374–386. doi: 10.1590/1519-6984.16114
Nogué, S., de Nascimento, L., Froyd, C. A., Wilmshurst, J. M., de Boer, E. J., Coffey, E. E. D., et al. (2017). Island biodiversity conservation needs palaeoecology. Nat. Ecol. Evol. 1:0181. doi: 10.1038/s41559-017-0181
Nogué, S., Santos, A. M. C., Birks, H. J. B., Björck, S., Castilla-Beltrán, A., Connor, S., et al. (2021). The human dimension of biodiversity changes on islands. Science 372, 488–491. doi: 10.1126/science.abd6706
Ochiai, S., Nagao, S., Yonebayashi, K., Fukuyama, T., Suzuki, T., Yamamoto, M., et al. (2015). Effect of deforestation on the transport of particulate organic matter inferred from the geochemical properties of reservoir sediments in the Noto Peninsula, Japan. Geochem. J. 49, 513–522. doi: 10.2343/geochemj.2.0379
Ohlendorf, C., and Sturm, M. (2008). A modified method for biogenic silica determination. J. Paleolimnol. 39, 137–142. doi: 10.1007/s10933-007-9100-7
Olson, D. M., Dinerstein, E., Wikramanayake, E. D., Burgess, N. D., Powell, G. V. N., Underwood, E. C., et al. (2001). Terrestrial ecoregions of the world: a new map of life on earth: a new global map of terrestrial ecoregions provides an innovative tool for conserving biodiversity. Bioscience 51, 933–938.
Pierron, D., Heiske, M., Razafindrazaka, H., Rakoto, I., Rabetokotany, N., Ravololomanga, B., et al. (2017). Genomic landscape of human diversity across Madagascar. Proc. Natl. Acad. Sci. U.S.A. 114, E6498–E6506.
Poynter, J. G., Farrimond, P., Robinson, N., and Eglinton, G. (1989). “Aeolian-derived higher plant lipids in the marine sedimentary record: links with palaeoclimate,” in Paleoclimatology and Paleometeorology: Modern and Past Patterns of Global Atmospheric Transport NATO ASI Series, eds M. Leinen and M. Sarnthein (Dordrecht: Springer Netherlands), 435–462. doi: 10.1007/978-94-009-0995-3_18
Radimilahy, C. (1997). “Mahilaka, an eleventh to fourteenth century Islamic port: the first impact of urbanism in Madagascar,” in Natural Change and Human Impact in Madagascar, eds S. M. Goodman and B. D. Patterson (Washington, DC: Smithsonian Institution Press), 342–377.
Railsback, L. B., Dupont, L. A., Liang, F., Brook, G. A., Burney, D. A., Cheng, H., et al. (2020). Relationships between climate change, human environmental impact, and megafaunal extinction inferred from a 4000-year multi-proxy record from a stalagmite from northwestern Madagascar. Quat. Sci. Rev. 234:106244. doi: 10.1016/j.quascirev.2020.106244
Raper, D., and Bush, M. (2009). A test of Sporormiella representation as a predictor of megaherbivore presence and abundance. Quat. Res. 71, 490–496. doi: 10.1016/j.yqres.2009.01.010
Rasoanaivo, N., Tahinarivony, J., Ranirison, P., Edmond, R., and Gautier, L. (2015). Dynamique post-culturale de la végétation dans la presqu’île d’Ampasindava, Domaine du Sambirano, Nord-ouest de Madagascar. Malagasy Nat. 9, 1–14.
Rasoloarijao, T. M., Ramavovololona, P., Ramamonjisoa, R., Clemencet, J., Lebreton, G., and Delatte, H. (2019). Pollen morphology of melliferous plants for Apis mellifera unicolor in the tropical rainforest of Ranomafana National Park, Madagascar. Palynology 43, 292–320. doi: 10.1080/01916122.2018.1443980
Rühland, K. M., Paterson, A. M., and Smol, J. P. (2015). Lake diatom responses to warming: reviewing the evidence. J. Paleolimnol. 54, 1–35. doi: 10.1007/s10933-015-9837-3
Schäfer, I. K., Lanny, V., Franke, J., Eglinton, T. I., Zech, M., Vysloužilová, B., et al. (2016). Leaf waxes in litter and topsoils along a European transect. Soil 2, 551–564. doi: 10.5194/soil-2-551-2016
Schüler, L., and Hemp, A. (2016). Atlas of pollen and spores and their parent taxa of Mt Kilimanjaro and tropical East Africa. Quat. Int. 425, 301–386. doi: 10.1016/j.quaint.2016.07.038
Scroxton, N., Burns, S. J., McGee, D., Hardt, B., Godfrey, L. R., Ranivoharimanana, L., et al. (2017). Hemispherically in-phase precipitation variability over the last 1700 years in a Madagascar speleothem record. Quat. Sci. Rev. 164, 25–36. doi: 10.1016/j.quascirev.2017.03.017
Shumilovskikh, L., O’Keefe, J. M. K., and Marret, F. (2021). An overview of the taxonomic groups of non-pollen palynomorphs. Geol. Soc. Lond. Spec. Publ. 511:13. doi: 10.1144/SP511-2020-65
Shumilovskikh, L. S., and van Geel, B. (2020). “Non-pollen palynomorphs,” in Handbook for the Analysis of Micro-Particles in Archaeological Samples, ed. A. Henry (Cham: Springer), 65–94. doi: 10.1007/978-3-030-42622-4_4
Shumilovskikh, L. S., Shumilovskikh, E. S., Schlütz, F., and van Geel, B. (2021). NPP-ID: Non-Pollen Palynomorph Image Database as a research and educational platform. Veg. Hist. Archaeobot. doi: 10.1007/s00334-021-00849-8
Stevenson, J., and Haberle, S. (2005). Macro Charcoal Analysis: A Modified Technique Used by the Department of Archaeology and Natural History, Palaeoworks Technical Papers. Canberra, ACT: Department of Archaeology & Natural History, Research School of Pacific & Asian Studies, Coombs Building, Australian National University, 200.
Straka, H., and Freidrich, B. (1989). Palynologia madagassica et mascarenica. Trop. Subtrop. Pflanzcnwelt. 72, 1–106.
Stuiver, M., and Reimer, P. J. (1993). Extended 14C database and revised CALIB radiocarbon program. Radiocarbon 35, 215–230.
Teixeira, H., Montade, V., Salmona, J., Metzger, J., Bremond, L., Kasper, T., et al. (2021). Past environmental changes affected lemur population dynamics prior to human impact in Madagascar. Commun. Biol. 4:1084. doi: 10.1038/s42003-021-02620-1
Teunissen van Manen, M. L., Jansen, B., Cuesta, F., León-Yánez, S., and Gosling, W. D. (2019). Leaf wax n-alkane patterns of six tropical montane tree species show species-specific environmental response. Ecol. Evol. 9, 9120–9128. doi: 10.1002/ece3.5458
van Asperen, E. N., Perrotti, A., and Baker, A. (2021). Coprophilous fungal spores: non-pollen palynomorphs for the study of past megaherbivores. Geol. Soc. Lond. Spec. Publ. 511, 245–267. doi: 10.1144/SP511-2020-41
van Geel, B., Coope, G. R., and Van Der Hammen, T. (1989). Palaeoecology and stratigraphy of the lateglacial type section at Usselo (the Netherlands). Rev. Palaeobot. Palynol. 60, 25–129. doi: 10.1016/0034-6667(89)90072-9
Virah-Sawmy, M., Willis, K. J., and Gillson, L. (2010). Evidence for drought and forest declines during the recent megafaunal extinctions in Madagascar. J. Biogeogr. 37, 506–519. doi: 10.1111/j.1365-2699.2009.02203.x
Voarintsoa, N. R. G., Wang, L., Railsback, L. B., Brook, G. A., Liang, F., Cheng, H., et al. (2017). Multiple proxy analyses of a U/Th-dated stalagmite to reconstruct paleoenvironmental changes in northwestern Madagascar between 370CE and 1300CE. Palaeogeogr. Palaeoclimatol. Palaeoecol. 469, 138–155. doi: 10.1016/j.palaeo.2017.01.003
Wang, L., Brook, G. A., Burney, D. A., Voarintsoa, N. R. G., Liang, F., Cheng, H., et al. (2019). The African Humid Period, rapid climate change events, the timing of human colonization, and megafaunal extinctions in Madagascar during the Holocene: evidence from a 2m Anjohibe Cave stalagmite. Quat. Sci. Rev. 210, 136–153. doi: 10.1016/j.quascirev.2019.02.004
Whittaker, R. J., Fernández-Palacios, J. M., Matthews, T. J., Borregaard, M. K., and Triantis, K. A. (2017). Island biogeography: taking the long view of nature’s laboratories. Science 357:eaam8326. doi: 10.1126/science.aam8326
Wood, J. R., Alcover, J. A., Blackburn, T. M., Bover, P., Duncan, R. P., Hume, J. P., et al. (2017). Island extinctions: processes, patterns, and potential for ecosystem restoration. Environ. Conserv. 44, 348–358. doi: 10.1017/S037689291700039X
Wright, H. T., and Radimilahy, C. (2005). L’évolution des systèmes d’installation dans la baie d’Ampasindava et à Nosy-Be. Taloha 14:15.
Zech, M., Buggle, B., Leiber, K., Marković, S., Glaser, B., Hambach, U., et al. (2010). Reconstructing Quaternary vegetation history in the Carpathian Basin, SE-Europe, using n-alkane biomarkers as molecular fossils: problems and possible solutions, potential and limitations. EG Quat. Sci. J. 58, 148–155. doi: 10.3285/eg.58.2.03
Zech, M., Krause, T., Meszner, S., and Faust, D. (2013a). Incorrect when uncorrected: reconstructing vegetation history using n-alkane biomarkers in loess-paleosol sequences – a case study from the Saxonian loess region, Germany. Quat. Int. 296, 108–116. doi: 10.1016/j.quaint.2012.01.023
Zech, R., Zech, M., Marković, S., Hambach, U., and Huang, Y. (2013b). Humid glacials, arid interglacials? Critical thoughts on pedogenesis and paleoclimate based on multi-proxy analyses of the loess–paleosol sequence Crvenka, Northern Serbia. Palaeogeogr. Palaeoclimatol. Palaeoecol. 387, 165–175. doi: 10.1016/j.palaeo.2013.07.023
Keywords: maar lake, soil erosion, palynology, charcoal, diatom, sedimentology, leaf-wax n-alkanes, paleoenvironment
Citation: Reinhardt AL, Kasper T, Lochner M, Bliedtner M, Krahn KJ, Haberzettl T, Shumilovskikh L, Rahobisoa J-J, Zech R, Favier C, Behling H, Bremond L, Daut G and Montade V (2022) Rain Forest Fragmentation and Environmental Dynamics on Nosy Be Island (NW Madagascar) at 1300 cal BP Is Attributable to Intensified Human Impact. Front. Ecol. Evol. 9:783770. doi: 10.3389/fevo.2021.783770
Received: 26 September 2021; Accepted: 29 December 2021;
Published: 04 February 2022.
Edited by:
Simon Haberle, Australian National University, AustraliaReviewed by:
Henry Lamb, Aberystwyth University, United KingdomWilliam Daniel Gosling, University of Amsterdam, Netherlands
Copyright © 2022 Reinhardt, Kasper, Lochner, Bliedtner, Krahn, Haberzettl, Shumilovskikh, Rahobisoa, Zech, Favier, Behling, Bremond, Daut and Montade. This is an open-access article distributed under the terms of the Creative Commons Attribution License (CC BY). The use, distribution or reproduction in other forums is permitted, provided the original author(s) and the copyright owner(s) are credited and that the original publication in this journal is cited, in accordance with accepted academic practice. No use, distribution or reproduction is permitted which does not comply with these terms.
*Correspondence: Gerhard Daut, Z2VyaGFyZC5kYXV0QHVuaS1qZW5hLmRl; Vincent Montade, dmluY2VudC5tb250YWRlQHVtb250cGVsbGllci5mcg==
†These authors share first authorship
‡These authors share last authorship