Abstract
Urbanization leads to changes in land use, and the expansion of impervious surfaces leads to an increase in flood vulnerability. Predicting and analyzing these landscape pattern changes are important in the early stages of urban planning. In practice, the threshold for obtaining comprehensive and detailed hydrological and meteorological data is high, which makes it difficult for landscape and urban planners to quickly evaluate urban floods. To compensate for these trends, we took Nanjing, China, as the study site and discussed the leading flood vulnerability landscape patterns based on quantitative assessments. We introduced catastrophe theory to integrate three indicators and seven subfactors for flood vulnerability assessment: exposure, including precipitation; sensitivity, including elevation, slope, soil and drainage density; and adaptability, including land use and forest coverage. Then, we calculated the landscape pattern metrics (shape index, fractal dimension index, related circumscribing circle, contiguity index and landscape division index) at the class level. Finally, we divided the city into four subregions, established regression models for the subregions and the whole city, and deduced the leading flood vulnerability landscape patterns in each region and the whole city. We found that the leading landscape patterns varied among different regions. According to the research results, the landscape pattern indexes identified in this paper can be interpreted intuitively, which can provide a reference for modifying the planning layout of regional green infrastructure, optimizing the vulnerability of urban floods, and providing a basis for further improving Nanjing urban planning and alleviating the urban flood vulnerability. The methods proposed herein also will benefit land use and green infrastructure management in other regions lacking meteorological and hydrological data.
Introduction
Rapid urbanization not only has promoted the development of the regional economy but also has led to changes in urban land use. With accelerating land use changes, the original hydrological cycles and hydrological patterns of cities are greatly affected. Original permeable surfaces, such as cultivated lands, woodlands and wetlands, have been largely replaced by impermeable surfaces (Vörösmarty et al., 2000; Yuan et al., 2015; Martinez-Grana et al., 2016). The flood retention and storage capacities of these permeable surfaces have thus been greatly weakened, rainwater runoff has increased, and surface runoff has accelerated; these processes seriously affect the natural infiltration process of rainwater. As a result, cities are more susceptible to floods from heavy rainfall, and their vulnerability to these floods increases (Balica et al., 2012; Su et al., 2018). A series of flood disasters, such as those from the torrential rains that occurred in Zhengzhou in 2021, have undoubtedly sounded the alarm for flood and drainage management in cities (Chen et al., 2015).
Urban flood control has attracted much attention and research, yielding an abundance of results and providing references for urban management. Most of the existing research has focused on two perspectives: planning concepts and practical measures. Research on planning concepts mainly considers the concepts of sponge cities (Chan et al., 2018; Liang et al., 2020; Qin et al., 2021) and low-impact development (Neupane et al., 2021; Zhou Q. et al., 2021). Research on practical measures, mainly includes traditional “hard” engineering measures, such as building dams, strengthening riverbanks and upgrading urban drainage networks. Other scholars have also focused on using “soft” measures, such as rain gardens, ecological dry streams, green roofs, and soil conservation, to try to control the runoff process (Huang, 2015; Bekin et al., 2021; Patel et al., 2021; Sharma and Malaviya, 2021; Xia and Chen, 2021). Extensive research has focused on specific measures to address urban flooding, but traditional engineering measures are plagued by high costs and long construction periods, while soft measures are characterized by limited space and difficult maintenance of the overall management system. Urban flood control is a systematic project that requires attention not only to its detailed construction measures but also to the macroscale of the city to evaluate the influencing factors of urban floods more accurately (Balica et al., 2012; Kazakis et al., 2015; Tang et al., 2021).
On the macro level, many scholars choose to focus on hydrological processes and build urban hydrological models to assist in the study of urban rain and flood control. Many hydrological models have different applications ranging from small catchments to global models (Devia et al., 2015). In the application of runoff simulation, SWAT (Jodar-Abellan et al., 2019; Ji et al., 2021), SCS-CN (Khzr et al., 2022), MIKE SHE (Zhang et al., 2021), TOPMODEL (Anwar and Diallo, 2021; Beven et al., 2021) and other models have been widely used. These models are based on data including urban land use, multiyear rainfall data over, multiyear runoff data, physical and chemical soil components, ground water aquifer characteristics, and urban pipe networks to simulate the hydrological processes and further explore the optimization of floods (Devia et al., 2015; Salvadore et al., 2015; Francesconi et al., 2016). These methods are objective and accurate and can help urban planners to more accurately propose optimization schemes (Devia et al., 2015). However, these hydrological models need accurate multisite and multiyear hydrological and meteorological measured data and accurate soil composition data. In China, where scientific research data such as hydrology and meteorology are strictly controlled, it is not easy to obtain sufficient comprehensive and accurate data. Moreover, hydrological models are based primarily on the watershed scale, and their applicability to the administrative scale is limited. In addition, the workflow for modeling and calibration of these models is complicated (Devia et al., 2015; Salvadore et al., 2015). Therefore, their application has a higher threshold and a greater degree of restriction for landscape and urban planning workers. We intend to explore this issue by utilizing multicriteria decision analysis (MCDA), which is easier to operate in areas lacking information for landscape planning, and model urban flood vulnerability to help promote planning strategies.
The Delphi method and the analytic hierarchy process (AHP) are most commonly used in existing MCDA research (Ouma and Tateishi, 2014; Liang et al., 2020; Koc et al., 2021; Rehman et al., 2021; Sadeghi et al., 2021; Wu et al., 2021). However, the different subjective opinions of experts lead to evaluation results that also are often subjective (Singh et al., 2018). In terms of evaluation factors, macrolevel evaluation analysis research, such as landscape pattern research, has been limited. Therefore, in this paper, we introduce a more objective method called catastrophe theory to assess flood vulnerability, and landscape patterns are used to analyze it.
Landscape patterns are important for landscape ecology research; they refer to the spatial arrangement and combination of landscape patches with different attributes, sizes and shapes, and they determine the distribution form and combination of resources and environmental processes in a research area, ultimately forming a spatially heterogeneous landscape area (Bailey et al., 2007; Peng et al., 2019; Sohn et al., 2021). In recent years, many scholars have studied landscape patterns and green infrastructure (GI) using geographic information systems and remote sensing technology (Sharma and Malaviya, 2021; Sohn et al., 2021). GI includes all types of green open spaces and natural areas, such as cultivated lands, water bodies, wetlands, forests, and grasslands, and it characterizes an interconnected network of green spaces. From the landscape ecology perspective, GI construction can integrate and connect various broken patches, optimize landscape patterns, promote the exchange of materials and energy, and improve the urban environment (Tzoulas et al., 2007; Sohn et al., 2021). There have been some related studies on the effect of rainwater storage in green space (Berland et al., 2017; Sharma and Malaviya, 2021; Ureta et al., 2021), but little research has explored the relationship between GI landscape patterns and urban flooding. The selected indicators have mostly been related to area and scale, while less research has examined shape-related indicators. In addition, related research has primarily focused on individual built-up urban areas, while different urban subregions have received less attention (Su et al., 2018; Peng et al., 2019; Bae et al., 2021). In view of these limitations, it is necessary to explore the relationship between flood vulnerability and regional and subregional perspectives based on shape-related landscape pattern indexes.
In summary, this paper takes Nanjing, a highly urbanized metropolis with a dense population, developed economy and limited space, as the research object. Catastrophe technology is used to comprehensively assess and map the flood vulnerability of the whole Nanjing region and its subregions. Then, we calculate the shape indexes of landscape patterns at the class level. Finally, regression models are established to analyze and discuss the relationships between flood vulnerability and landscape patterns and to summarize the leading landscape patterns. This study attempts to explore the following questions: (A) Can the urban flood vulnerability modeled by the catastrophe technique accurately reflect the urban flood problems? (B) Do shape-related GI landscape patterns impact the vulnerability patterns of urban rain and floods? (C) Are the leading landscape patterns the same among different urban areas? (D) How can landscape patterns be optimized, GI be improved and vulnerability to urban rain and floods in a highly developed metropolis be reduced? By answering the above questions, the thesis can provide an easy-operating and fast tool for the flood vulnerability assessment in urbanized areas, and the constructed model in this paper can provide a basis for further improving the urban planning of Nanjing and other highly developed cities and alleviating the urban flood vulnerability. In addition, the MCDA method based on catastrophe theory adopted in this paper is easy to operate, and it is convenient for planners to carry out preliminary planning and research in areas lacking data, thus optimizing regional flood vulnerability and promoting residents’ wellbeing.
Materials and methods
Study area and data collection
Nanjing is located in East China, in the middle and lower reaches of the Yangtze River (31°14′ N to 32°36′ N, 117°22′ E to 119°14′ E). It is one of the most rapidly urbanizing cities in East China and was selected as a supercity by the State Council of China in September 2021. Nanjing is a metropolis with a population of 9.31 million people, including 11 municipal districts and one national-level new district, with a total area of 6,587.02 km2. According to the results of the seventh national census, Nanjing’s urbanization rate is 86.8%, which is characteristic of a typical city that has completed urbanization and entered the post-urbanization stage (Figure 1).
FIGURE 1
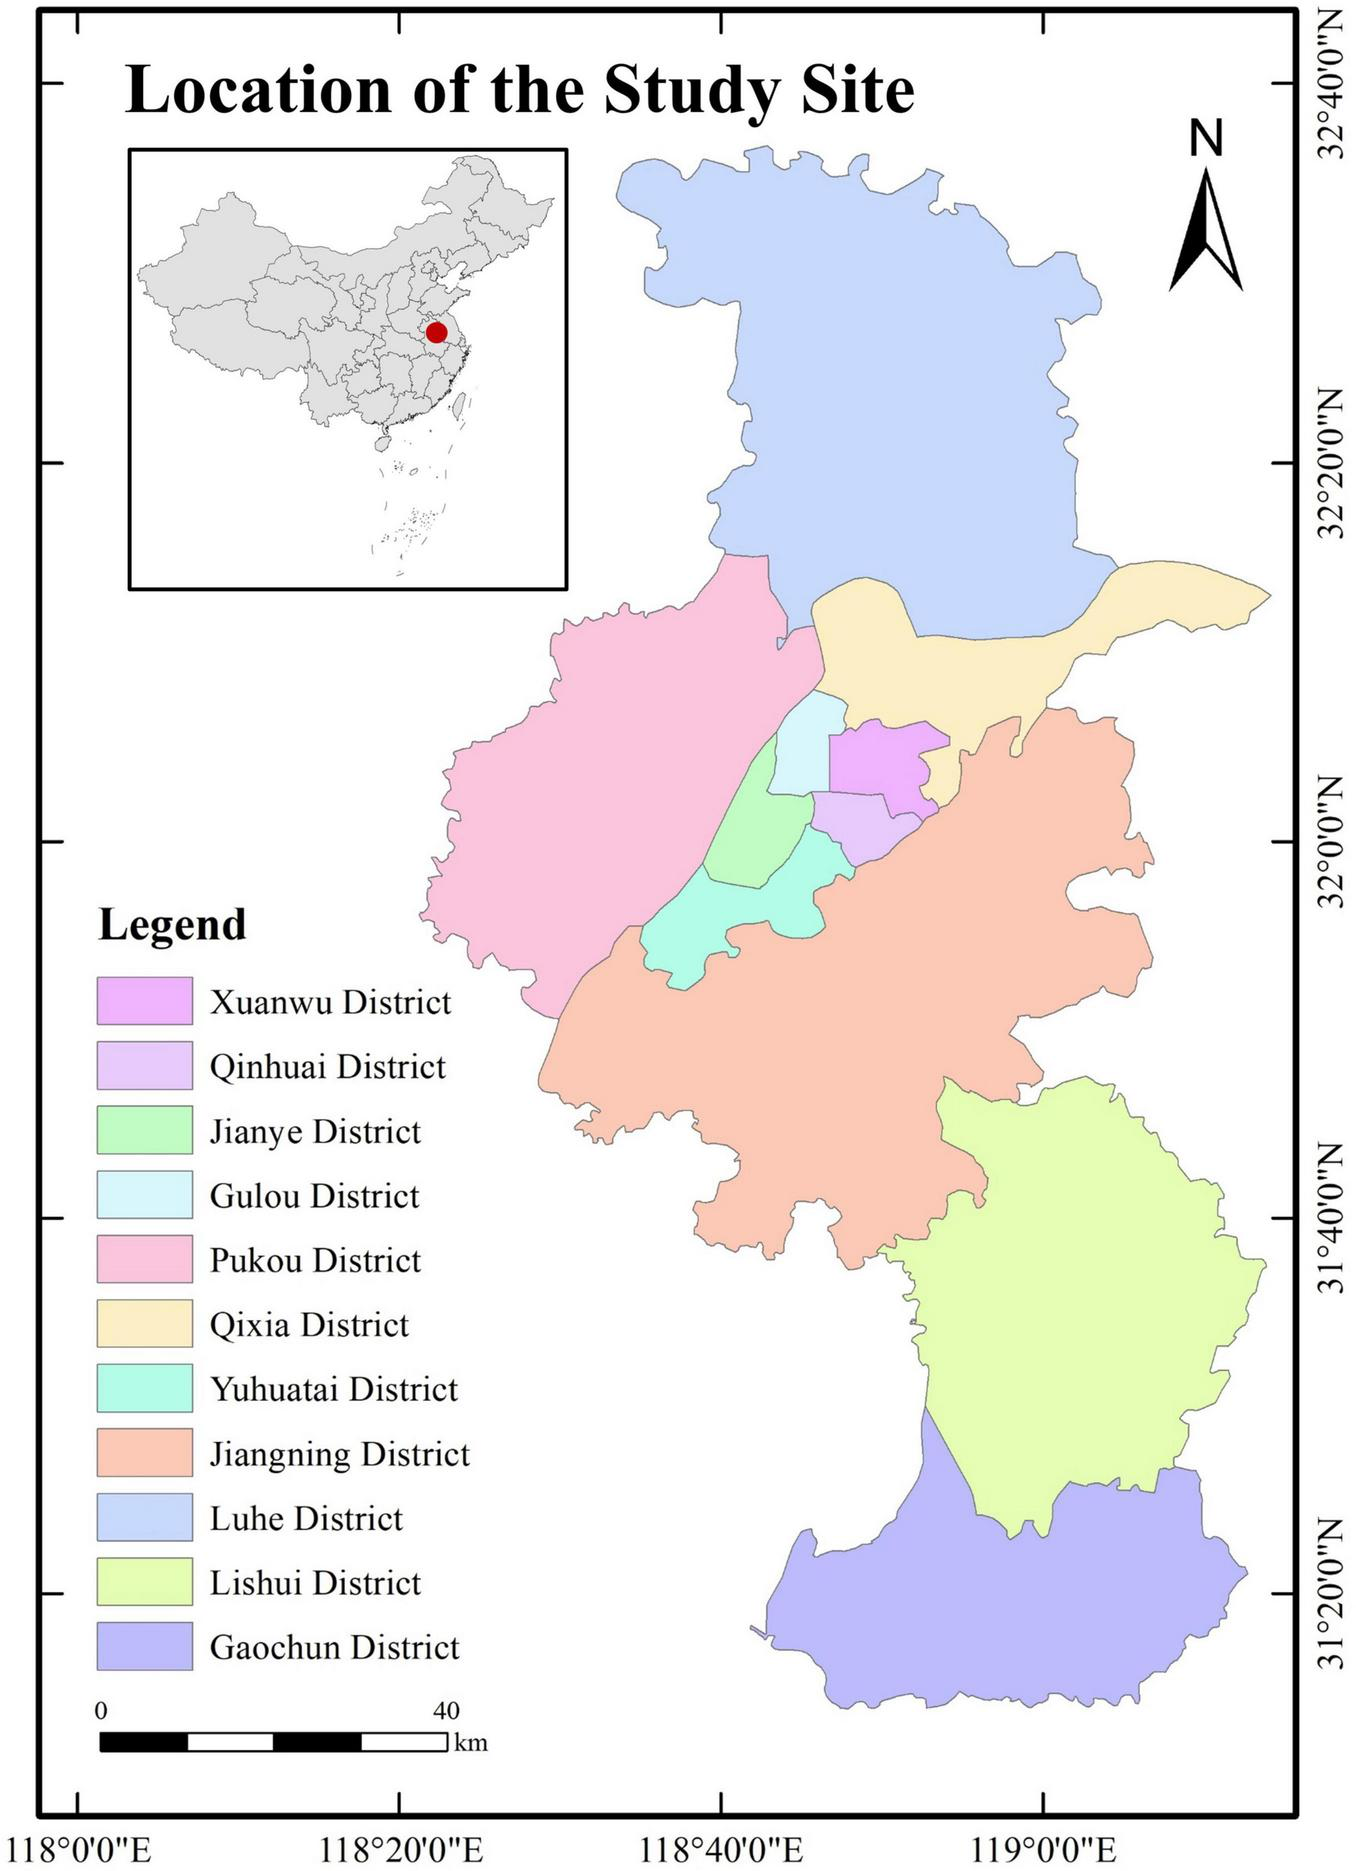
Location of the study site.
Nanjing is located in the subtropical southeast monsoon region; in this area, the southeast monsoon blowing from the Pacific Ocean brings much warm and humid airflow, which frequently meets cold air sourced from the subpolar westerlies, thus providing favorable conditions for the formation of heavy rain (Cao and Zhao, 2020; Pu et al., 2020). In June and July, the Yangtze River basin experiences a long period of continuous rainy days, with long rainfall duration and heavy precipitation (Fan et al., 2014; Zhou T. et al., 2021). In August and September, the study area is subjected to typhoons that form over the Pacific Ocean and cause heavy rains and floods (Fan et al., 2014; Wang et al., 2021). Uncontrolled population growth has occurred over many years, which has resulted in high-intensity urban construction. Moreover, the lack of forward-looking ecological land use planning has caused tremendous negative impacts on the natural ecological stability and natural hydrological cycle. The combination of the above factors results in flooding disasters every year, giving rise to substantial losses of urban wealth, seriously affecting travel safety and leading to negative social repercussions (Yi and Zhai, 2012; Chen et al., 2021). In June 2015, Nanjing suffered a severe flood disaster in which the total monthly rainfall exceeded 660 mm, far above the average level of 186 mm recorded in previous years. In July 2020, Nanjing suffered another catastrophic flood and recorded 20 days of precipitation, the highest number of days since 1961. Moreover, the ever-expanding artificial surfaces in the city are impervious to rainwater, and so quick diversion of the runoff resulting from short-term heavy rainfall caused by strong convective weather is impossible, which leads to frequent urban waterlogging. Therefore, there is an urgent need to propose targeted planning strategies to address these problems.
For this study, data obtained from different sources are processed in a geographic information system (GIS) platform and remote sensing (RS) image processing software. All data were sampled at a resolution of 30 m, and the images were projected and resampled in ArcGIS software before further analysis. The data characterizing the annual spatial distribution of precipitation were obtained from the National Earth System Science Data Center at the National Science & Technology Infrastructure of China.1 The images from which elevation and slope were extracted and the hydrological analysis was performed came from the Advanced Spaceborne Thermal Emission and Reflection Radiometer global digital elevation map version 2 (ASTER GDEM V2), which was jointly released by the National Aeronautics and Space Administration (NASA) and the Ministry of Economy, Trade and Industry of Japan. The soil type spatial distribution map was obtained from the Soil Science Database. The land use map of the study area was taken and clipped from GlobeLand30 V2020, which was provided by the Ministry of Natural Resources of China. The normalized difference vegetation index (NDVI) data were calculated using 59 Landsat-8 Operational Land Imager (OLI) images taken in 2020.
Methods
This thesis reports on the correlation between urban flood vulnerability assessment results and landscape patterns and proposes planning strategies based on the results. To achieve this goal, this study utilizes the three methodological steps listed in Figure 2.
FIGURE 2
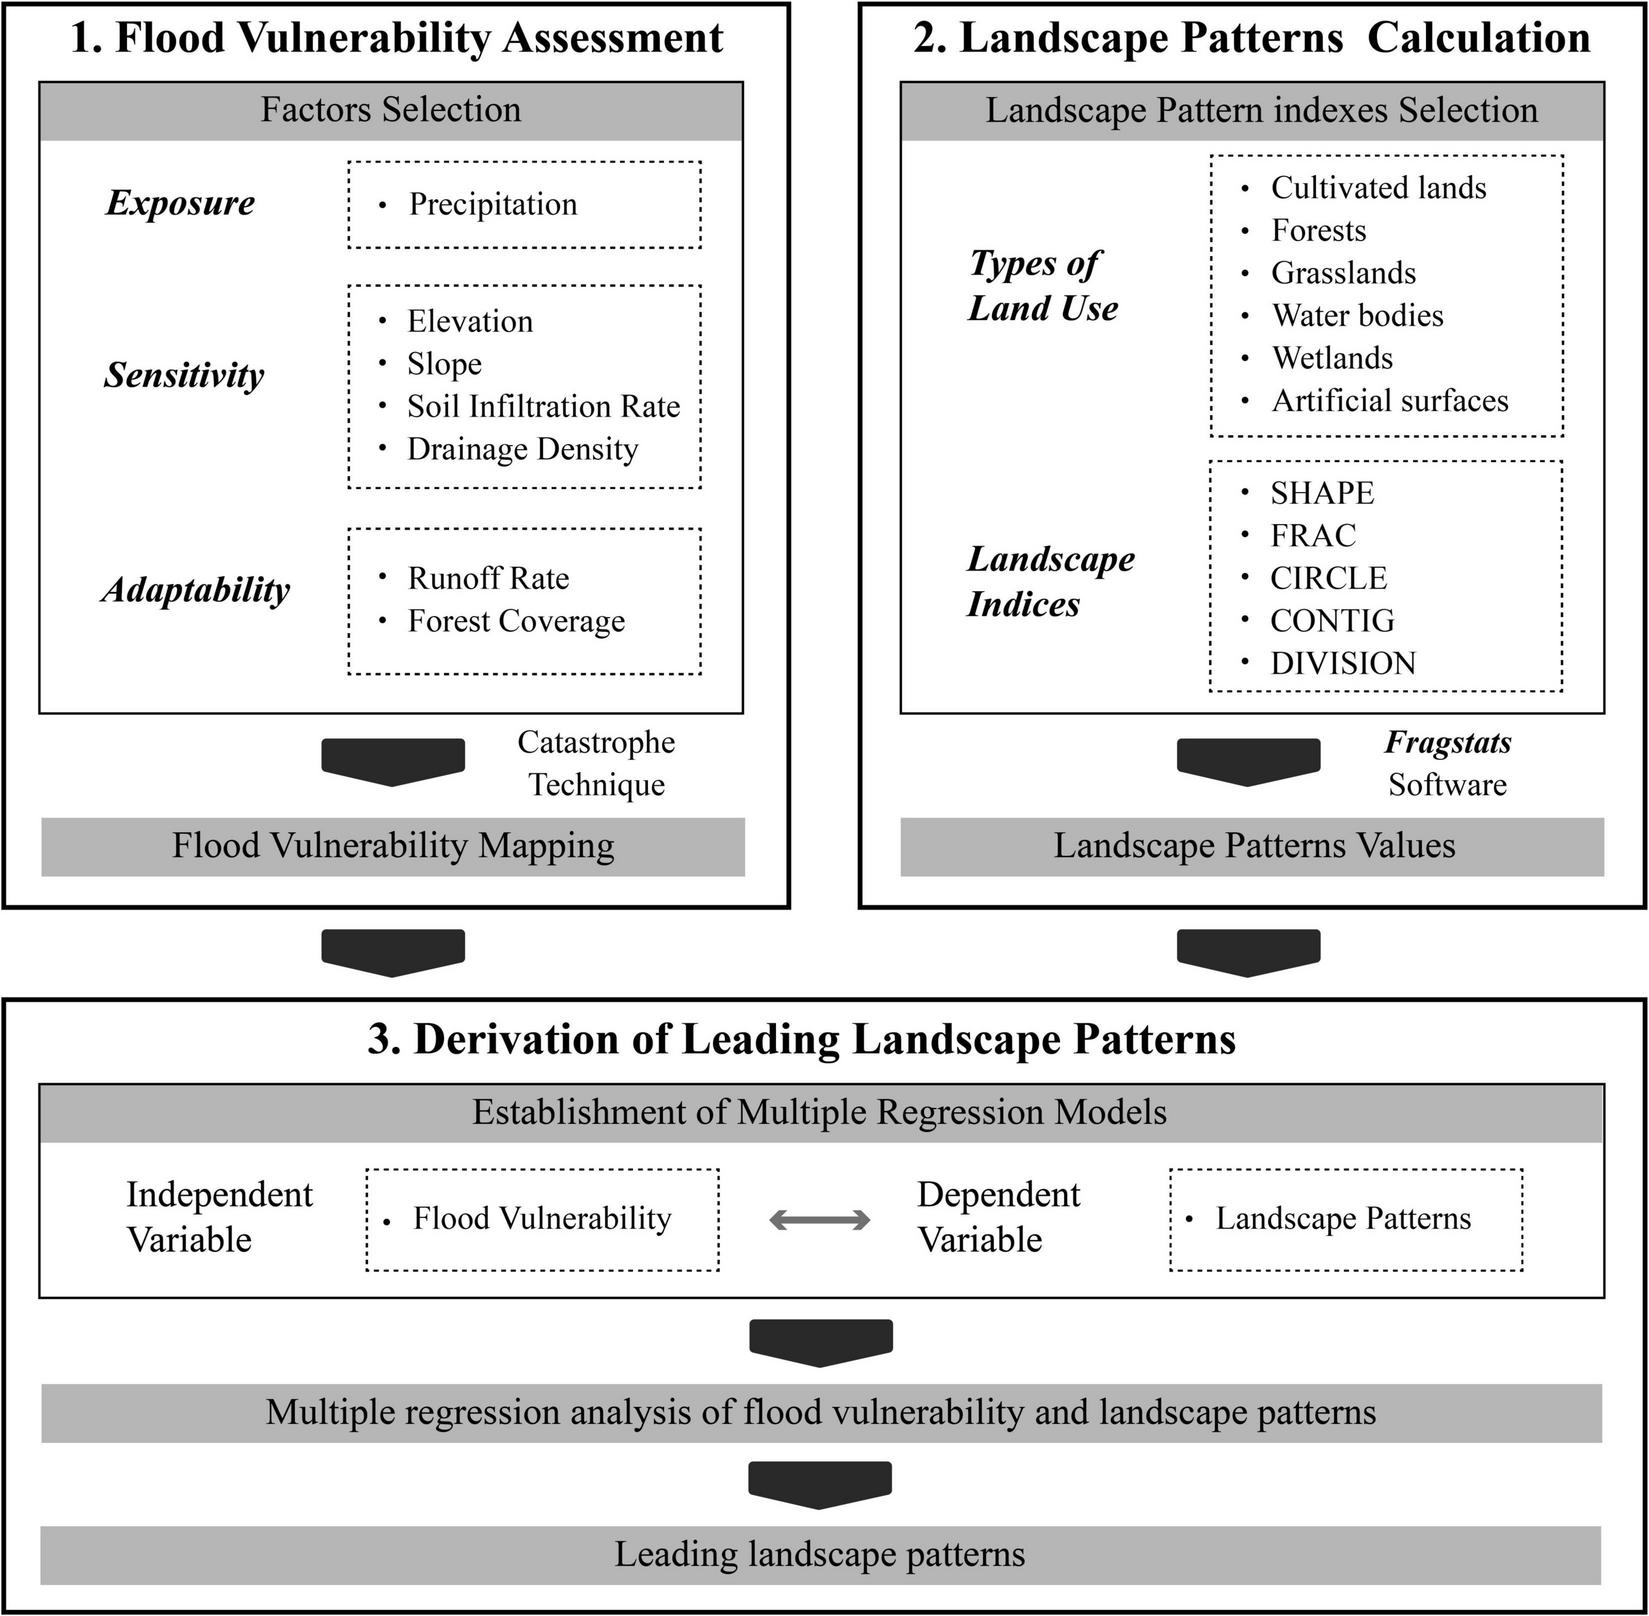
Research framework.
First, evaluation indexes are selected to establish an evaluation hierarchy system, and catastrophe theory is applied to overlay this system and measure the flood vulnerability spatial distribution. Second, land use types related to flooding conditions are selected, and landscape pattern indexes are calculated at the class level. Finally, a regression model is established based on the results obtained from the above steps, and a multiple regression analysis is carried out to acquire the leading landscape patterns across the whole study area and in the subregions. At the end of the thesis, the relationship and landscape pattern optimization strategies are analyzed.
Selection of flood vulnerability evaluation factors
As mentioned in the Introduction, this paper does not choose to model and analyze the hydrological processes but uses a more convenient MCDA tool (Catastrophe method) to superimpose the evaluation factors, to quickly assess flood vulnerability. We analyzed the city of Nanjing from ecological, geographical and practical perspectives, formulated a hierarchical evaluation factor system, and evaluated flood vulnerability by combining quantitative analysis methods with qualitative analysis methods. According to the concept defined by the Intergovernmental Panel on Climate Change (IPCC), flood vulnerability is composed of three dimensions: exposure, sensitivity and adaptability (Ouma and Tateishi, 2014; Yang et al., 2018). Exposure refers to the rainfall to which the study area is exposed, as rainfall is the direct disaster-causing flood condition. Sensitivity includes the natural, geographical, or artificial variables characterizing the study area that can increase the possibility of flooding, such as elevation, slope, soil and so on (Kim et al., 2021). Adaptability contains factors that can reveal the ability of the corresponding area to prevent or mitigate flood risks (Yang et al., 2018; Kim et al., 2021). In this study, catastrophe theory, a quantitative analysis method, was used to integrate evaluation indexes into the evaluation system, calculate the overall regional flood vulnerability, and draw a regional flood vulnerability map.
In this paper, annual precipitation was selected as the exposure factor. Precipitation is the main factor causing floods. We selected spatially gridded annual precipitation data recorded from 2015 to 2020 provided by the National Earth System Science Data Center of China and used these data to calculate the average annual precipitation from 2015 to 2020 and draw the thematic map (Figure 3A).
FIGURE 3
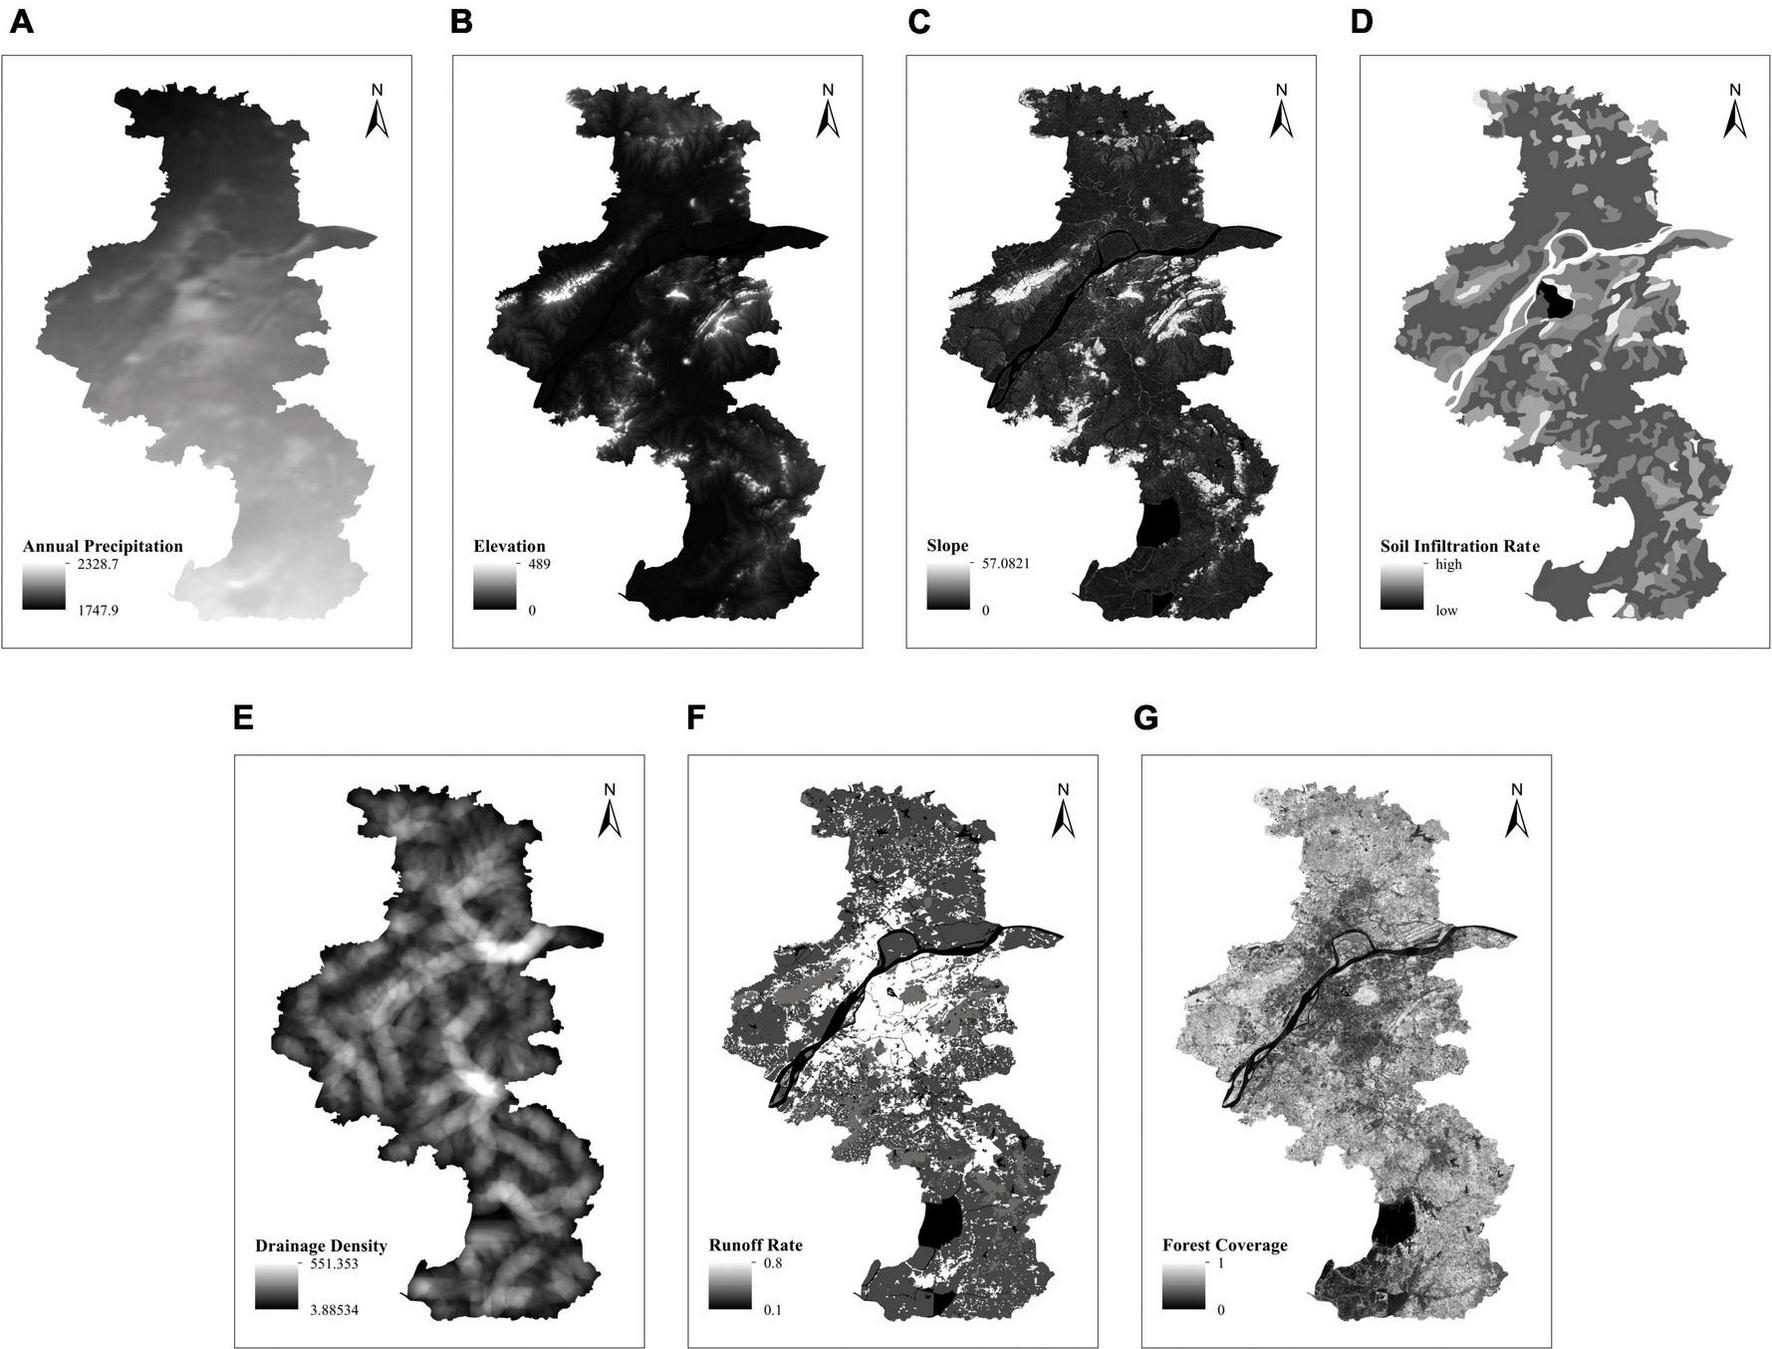
Thematic maps of evaluation factors. (A) Precipitation, (B) elevation, (C) slope, (D) soli infiltration rate, (E) drainage density, (F) runoff rate, and (G) forest coverage.
Elevation, slope, soil and drainage density are selected to be involved in the measurement of flood sensitivity. Elevation (Figure 3B) and slope (Figure 3C) can affect the surface runoff direction and drainage rate. Low-elevation areas are more likely to accumulate rainwater, and higher-slope areas have larger surface runoff velocities (Tsou et al., 2017; Shanableh et al., 2018; Zheng et al., 2019). Furthermore, different soil types correspond to different infiltration rates, and the physical and chemical properties of soils have important impacts on runoff formation and confluence (Nuottimaki and Jarva, 2015; Peijiang et al., 2018; Kim et al., 2021). In this study, a soil infiltration rate map (Figure 3D) was derived as a thematic soil map according to the soil infiltration influence values of different soil types (Cao, 2015; Peijiang et al., 2018). To evaluate flood vulnerability in Nanjing, we also established a drainage density map (Figure 3E) based on the DEM.
Adaptability includes two factors in this study: land use and land cover (LULC) and forest coverage. Different land use types have different reduction effects for rainwater runoff and different reduction ratios. Artificial surfaces are impermeable and have lower water permeability and higher runoff coefficients, while surfaces covered by soils and vegetation have higher water permeability and lower runoff coefficients (Hu et al., 2020; Kim et al., 2021). Therefore, the land use runoff rate map is drawn accordingly (Figure 3F). Vegetation can intercept rainwater, but the land use map fails to show any forest (or vegetation) density in the study region, and their interception effect on rainwater thus cannot be further measured using this map (Morawitz et al., 2006; Powell et al., 2014; Gao et al., 2020). Among all vegetation types, the ability of forests to block precipitation and runoff is the strongest, so it is selected as the representative index of vegetation. We use NDVI images to calculate forest coverage (Figure 3G), whose values can reflect the spatial coverage of vegetation in the region and can also reflect the ability to reduce runoff generated by rainwater to a certain extent.
Flood vulnerability evaluation by catastrophe theory
Catastrophe theory, developed by the French scientist Rene Thom in the 1960s, is a special branch of dynamical systems theory that is helpful for explaining the catastrophe and discontinuity behaviors caused by tiny changes in various systems (Singh et al., 2018). When applying the catastrophe technique, there is no need to give each index a weight artificially. Only the relative importance among indexes needs to be considered to determine their responses to changes in the internal values of each factor through the characteristics of the catastrophe method itself. As a new technology that takes into account both expert decision-making and objective quantitative evaluations, catastrophe theory has been widely used to study coal mining safety and to identify and divide potential groundwater areas on GIS platforms (Zhang et al., 2009; Jenifer and Jha, 2017; Kaur et al., 2020). Practice has proven that this method is convenient to operate, has a simple operation and produces reliable results. However, existing applications of this technology for evaluating flood vulnerability are quite limited. In this study, we plan to introduce catastrophe theory techniques to evaluate and verify flood vulnerability.
In catastrophe theory, the dependence of the state variable on the control variables is determined by the catastrophe fuzzy membership function (Zhang et al., 2009; Singh et al., 2018). Combining the catastrophe fuzzy membership function with catastrophe theory and fuzzy mathematics, the total membership function is finally obtained through a normalization formula, and this function can be used in the subsequent analysis and evaluation. Compared with the AHP, which is commonly used to study rain or flooding disasters, the application of the catastrophe method not only introduces the relative importance of the adopted indicators but also reduces the instability and subjective influence induced by the use of subjective weights in the AHP (Jenifer and Jha, 2017). To establish a flood vulnerability evaluation system based on catastrophe theory, an overall evaluation index should first be established; then, this index should be decomposed into several subindexes, and all the indexes should be grouped according to their corresponding evaluation purposes. These indexes are layered and mutually exclusive (Zhang et al., 2009; Singh et al., 2018). All index levels constitute different catastrophe systems. There are four common catastrophe types: fold catastrophes, cusp catastrophes, swallowtail catastrophes and butterfly catastrophes; their expression levels are shown in Table 1 (Zhang et al., 2009; Ahmed et al., 2015).
TABLE 1
| Catastrophe types | Potential functions | Number of control variables |
| Fold catastrophe | V(x) =x3+ax | 1 |
| Cusp catastrophe | V(x) =x4+ax2+bx | 2 |
| Swallowtail catastrophe | V(x) =x5+ax3+bx2+cx | 3 |
| Butterfly catastrophe | V(x) =x6+ax4+bx3+cx2+dx | 4 |
Catastrophe types and potential functions.
According to catastrophe theory, the potential function described above is set as f(x). By finding the first and second derivatives of f(x), the equilibrium surface equation and singular point set of all critical points, respectively, are obtained. The bifurcation set equation of each catastrophe system is obtained by eliminating x by f(x)′ = 0 and f(x)″ = 0. If each control variable satisfies the bifurcation set equation, a catastrophe suddenly occurs. The normalization formula of each system can be deduced by decomposing the bifurcation set, as shown in Table 2 (Zhang et al., 2009; Ahmed et al., 2015).
TABLE 2
| Catastrophe types | Formulas | Number of control variables |
| Fold catastrophe | 1 | |
| Cusp catastrophe | , | 2 |
| Swallowtail catastrophe | , | 3 |
| Butterfly catastrophe | , | 4 |
Catastrophe types and normalization formulas.
where xa, xb, xc, and xd are normalized values corresponding to factor a, b, c, and d.
Different factors adopt different dimensions, so it is necessary to conduct a standardization treatment on the factor values. In this study, the standardization equation applied for the “smaller the better” indexes is as follows:
The equation used to standardize the “larger the better” indexes is as follows:
where yi refers to the standardized value; xi refers to the original value of index i; and xi(max) and xi(min) refer to the maximum and minimum values of index i.
The catastrophe progression of each control variable can be computed using the initial fuzzy subordinate function based on the normalization formulas provided above. In this process, two principles must be followed: the complementarity and non-complementarity principles. The non-complementarity principle means that the control variables of a system cannot cancel each other out, and the smallest state variable value corresponding to the control variables is selected as the state variable value of the whole system during the calculation process. The complementarity principle means that the control variables complement each other, and the average control variable values are taken as the state variable values of the whole system in the calculation process (Zhang et al., 2009; Ahmed et al., 2015; Singh et al., 2018).
Finally, all the factors are integrated with the fuzzy membership functions in ArcGIS software, and a flood vulnerability map is finally obtained. In this study, the “precipitation” factor was used to generate the “exposure” theme by fold catastrophe, the “elevation,” “slope,” “soil,” and “drainage density” factors were used to generate the “sensitivity” theme by butterfly catastrophe, and the “land use,” and “forest coverage” were used to generate the “adaptability” theme through cusp catastrophe. The state variables corresponding to all indicators can complement each other and adopt the complementarity principle. Then, by adopting the complementarity principle, the above three results were integrated with the swallowtail catastrophe type, and finally, the total catastrophe membership function value could be calculated, thus obtaining the spatial pattern distribution map of flood vulnerability; subsequently, the accuracy of this flood vulnerability map could be verified by utilizing the success rate curve method.
Flood vulnerability assessment by catastrophe theory
We quantify the landscape pattern index of each land use type by using Fragstats 4.3 software. The cultivated lands, forests, water bodies, grasslands, wetlands and artificial surfaces represented in the GlobeLand30 V2020 land use data are selected to determine the landscape pattern indexes on the class scale. To analyze the relationships between landscape patterns and flood vulnerability, five landscape pattern indexes are selected as the basis, including the shape index, fractal dimension, related circumscribing circle, contiguity index and landscape division index. The formulas of these indexes are shown in Table 3.
TABLE 3
| Metrics | Formula |
| Shape index (SHAPE) | SHAPE = |
| Fractal dimension index (FRAC) | FRAC = |
| Related circumscribing circle (CIRCLE) | CIRCLE = |
| Contiguity index (CONTIG) | CONTIG = |
| Landscape division index (DIVISION) | DIVISION = |
Formulas of the landscape metrics used in this study.
Based on the government planning in the Master Plan of Nanjing (2018–2035) and the situation of the city, we divide Nanjing city into four subregions: the urban center area, urban subcenter area, northern suburbs and southern suburbs. The urban center area includes the four districts of the main city, namely, Xuanwu District, Gulou District, Qinhuai District, and Jianye District. In these areas, the urbanization process is complete, and the proportions of impervious surfaces in these areas are the highest within the city. The urban subcenter areas include Yuhuatai District, Jiangbei New District, Qixia District, and Jiangning District, all of which have reached a certain degree of urbanization and have formed core urbanization areas. The noncore areas of these districts still retain a large number of eco-substrates, such as cultivated lands and forests, but these areas constitute the main reserve lands for the further expansion of Nanjing, and the ecological environments in these regions thus face great risks. The northern suburbs includes Luhe District and Pukou District, while the southern suburbs includes Gaochun District and Lishui District. These areas are far from the core development space of Nanjing and have relatively low urbanization, thus having the lowest risk of ecological damage among all the districts. We set up regression models for the whole city and five subregions based on the administrative division scale of townships and towns (Xiangzhen in Chinese) and subdistricts (Jiedao in Chinese) in Nanjing. All independent variables (landscape pattern indexes) and dependent variables (flood vulnerability) are analyzed by the stepwise regression method, and the landscape patterns that reduce urban flood vulnerability are derived.
Results
Flood vulnerability evaluation results
In this study, flood vulnerability is determined by the method described above, and the research area is divided into five flood vulnerability levels by the Jenks method in ArcGIS software. The vulnerability levels are clearly marked as “very high,” “high,” “moderate,” “low,” and “very low” (Figure 4). Approximately 23.2% of the whole city is identified as having “very high” flood vulnerability, and these areas substantially overlap with the built-up areas of the urban center areas and other subareas. In addition, the cultivated lands in the southern part of the city also show “very high” flood vulnerability. The “high” flood vulnerability areas account for the highest proportion, at approximately 32.0%, are mainly distributed on the periphery of the urban built-up areas and are widely distributed in the vast cultivated land areas in the central and southern parts of the city. Nearly 23.5% of the city areas show “moderate” flood vulnerability, mainly distributed along the boundaries of urban built-up areas and in the areas north of the Yangtze River. The “very low” and “low” flood vulnerability areas comprise nearly 5.9 and 15.4% of Nanjing, respectively, and are mainly distributed in the northern part of the city apart from the water bodies. Therefore, we argue that Nanjing is faced with severe flooding risks: the “very low” and “low” flood vulnerability areas together account for only approximately one-fifth of the whole city, while the “very high” and “high” areas together take up more than half of the whole city, showing a considerable discrepancy in comparison.
FIGURE 4
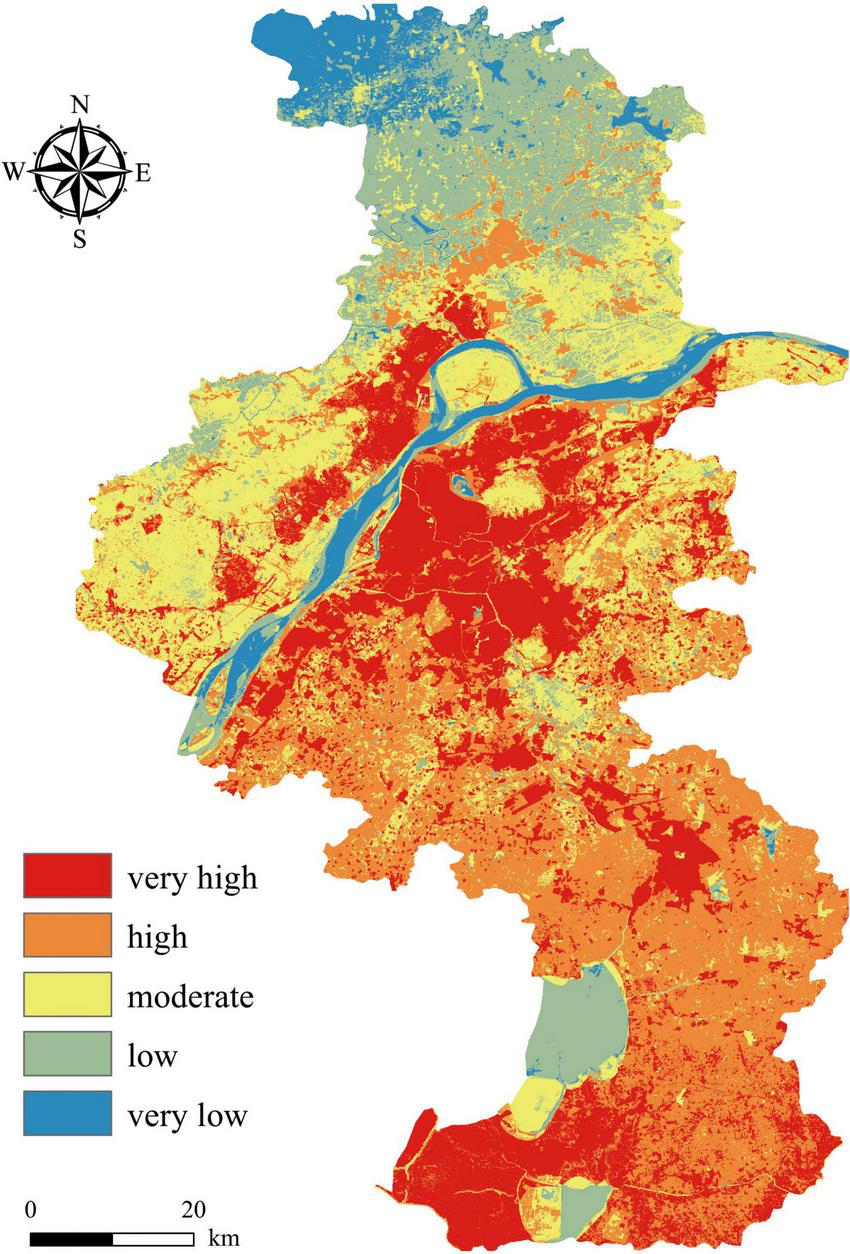
The results of the flood vulnerability assessment.
Then, flood vulnerability maps of the subregions were extracted from the map of the whole city, and the flood vulnerability map of each subregion was reclassified by the Jenks method (Figures 5–8). Next, we compare the vulnerability areas shown as “high” and “very high.” Consistent with the conclusions of many studies, the flood vulnerability in urban built-up areas is generally high (Yang et al., 2018; Kim et al., 2021; Rehman et al., 2021), but surprisingly, the cultivated lands in the suburbs also are facing high flood risks; this result has rarely been acquired in previous urban flooding studies. For a long time, most research on cultivated lands and relevant government policies has focused on protecting cultivated land areas from decreasing and has seldom used macroscopic research tools such as landscape patterns to study flood vulnerability in cultivated lands or their surrounding areas. Therefore, in addition to developing urban planning and policies with reference to flood vulnerability maps, it is also necessary to study the relationship between urban landscape patterns and flood vulnerability and then propose more targeted planning strategies to optimize the spatial pattern of urban flood vulnerability with more pertinence and efficiency (Kim et al., 2021).
FIGURE 5
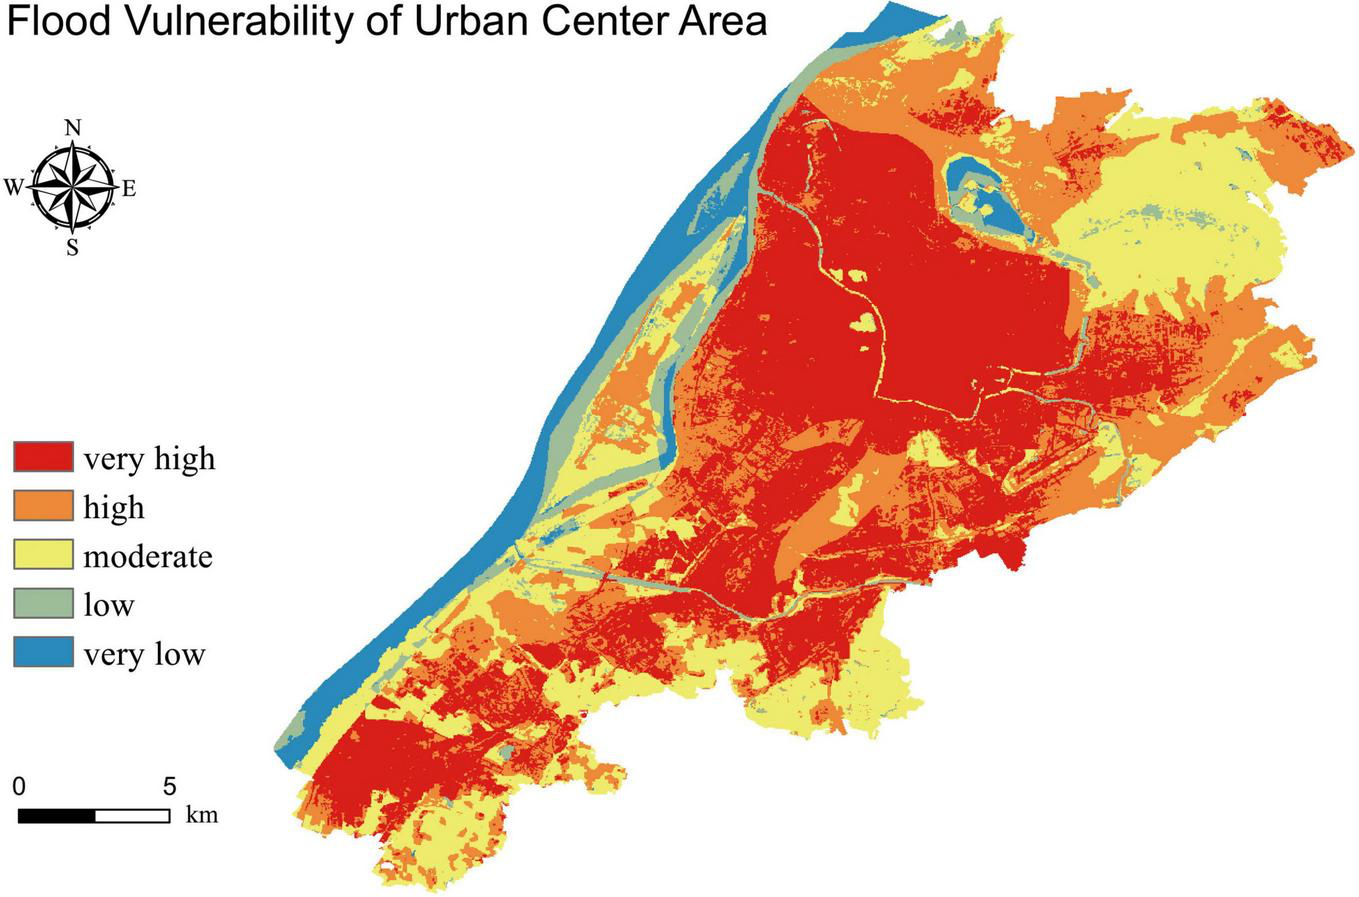
The flood vulnerability levels of urban center area.
FIGURE 6
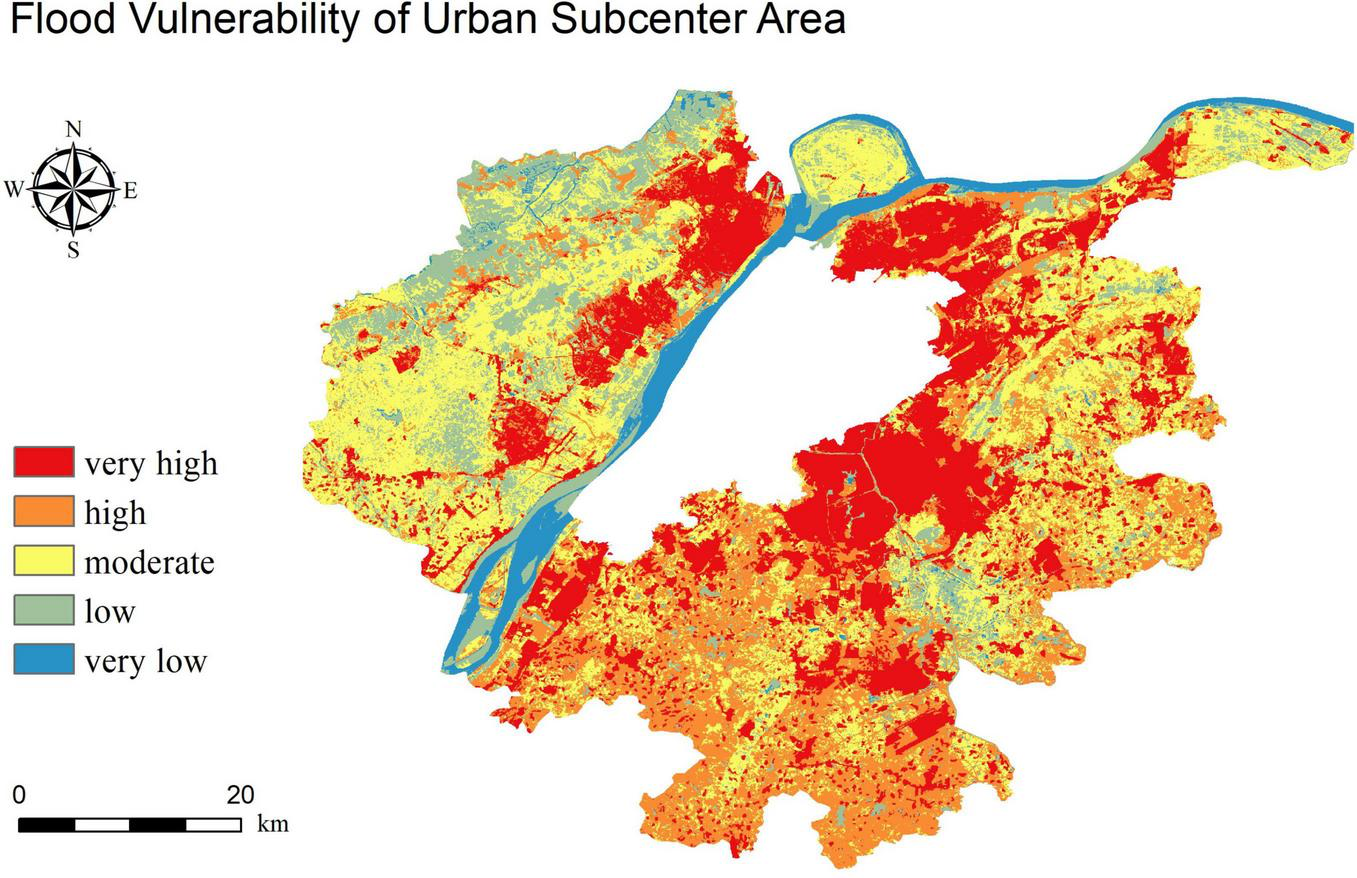
The flood vulnerability levels of urban subcenter area.
FIGURE 7
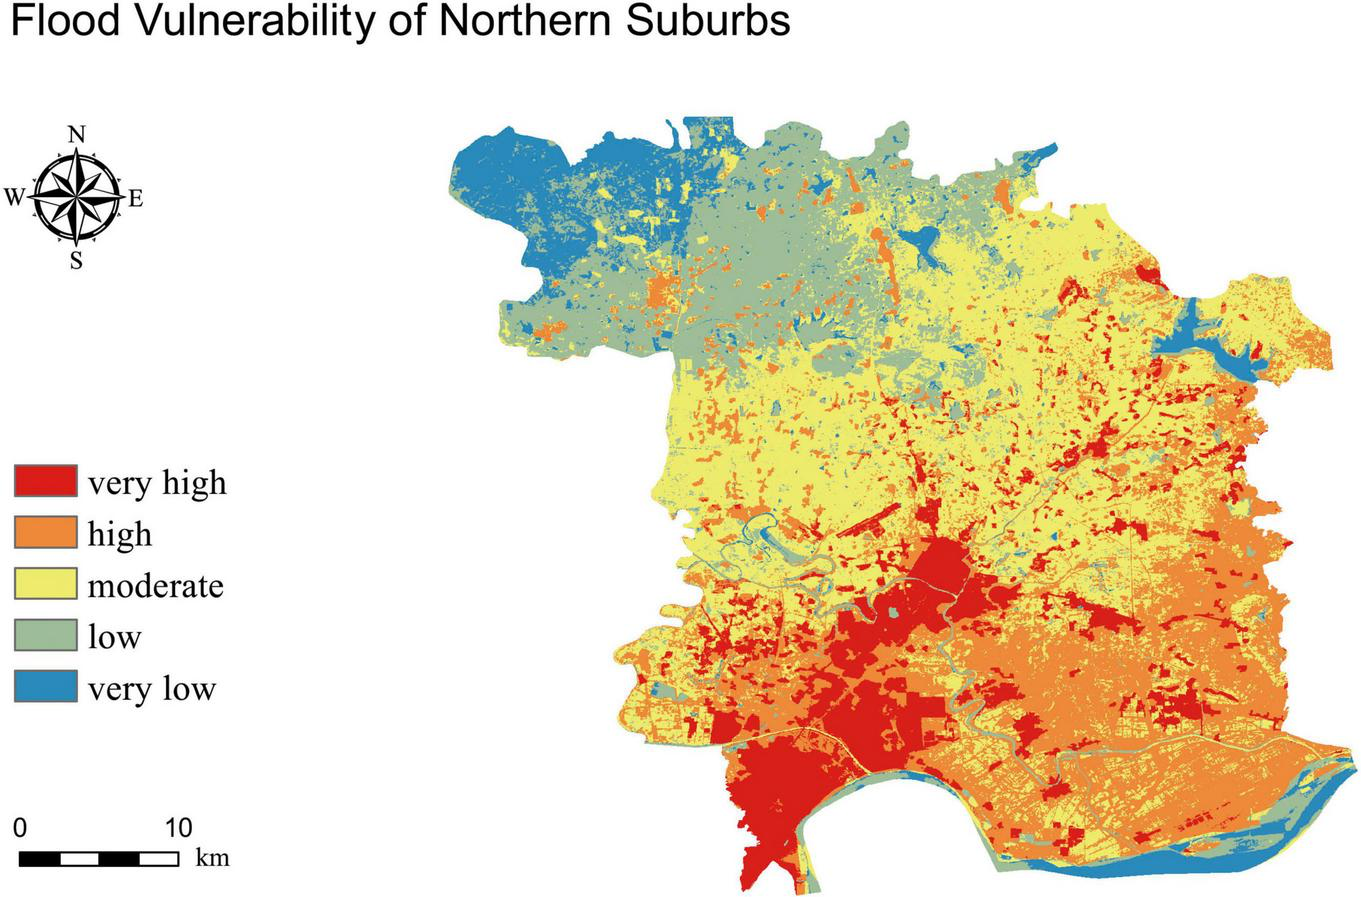
The flood vulnerability levels of northern suburbs.
FIGURE 8
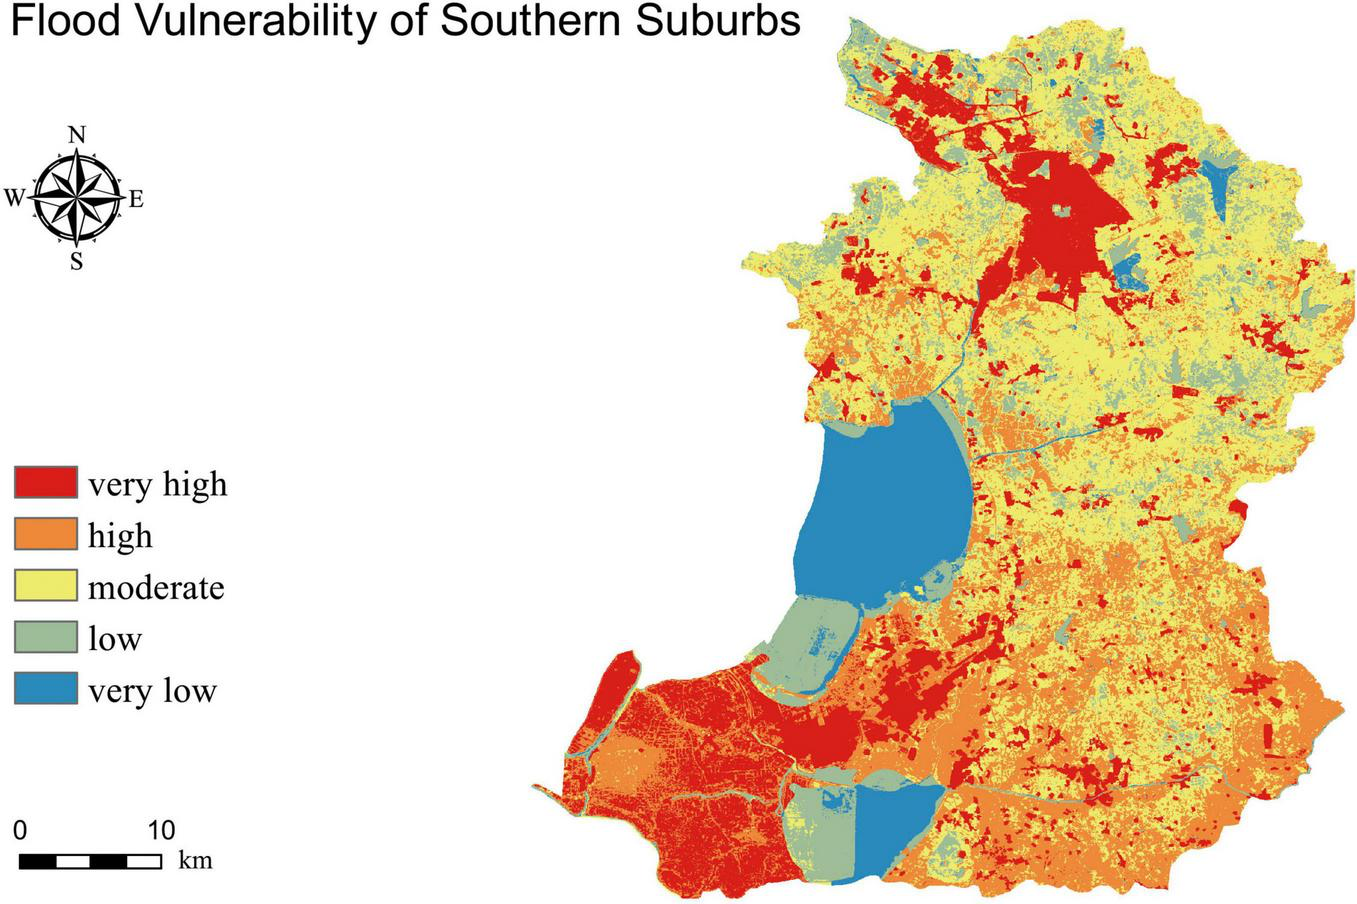
The flood vulnerability levels of southern suburbs.
Derivation of leading landscape patterns for flood vulnerability in Nanjing subregions
We obtain the leading landscape patterns affecting flood vulnerability in each subregion from multiple regression analysis models of flood vulnerability and landscape pattern indexes for each subregion.
Among the indexes (variables) listed in the table above (Table 4), DIVISION_As (the landscape division index of artificial surfaces), CONTIG_AM_As (the area-weighted mean of contiguity index of artificial surfaces), SHAPE_AM_As (the area-weighted mean of shape index of artificial surfaces), CIRCLE_MD_Wtl (the median of related circumscribing circle of wetlands), CIRCLE_CV_Grs (the coefficient of variation of related circumscribing circle of grasslands), and CONTIG_RA_Cvl (the range of contiguity index of cultivated lands) positively impact flood vulnerability, while SHAPE_CV_Grs (the coefficient of variation of shape index of grasslands), CIRCLE_SD_Cvl (the standard deviation of related circumscribing circle of cultivated lands), and CIRCLE_MD_Frs (the median of related circumscribing circle of forests) negatively impact flood vulnerability.
TABLE 4
| Land use type | Variables | Statistics |
R 2 | Adjusted R2 | ||||
| B | β | t | P | VIF | ||||
| Artificial surfaces | DIVISION_As | 0.000 | 0.203 | 3.309 | <0.05 | 7.386 | 0.998 | 0.997 |
| CONTIG_AM_As | 0.017 | 0.492 | 13.434 | <0.01 | 2.638 | |||
| SHAPE_AM_As | 0.000 | 0.430 | 10.080 | <0.01 | 3.586 | |||
| Wetland | CIRCLE_MD_Wtl | 0.002 | 0.444 | 16.722 | <0.01 | 1.390 | ||
| Grassland | CIRCLE_CV_Grs | 1.640E-005 | 0.679 | 14.539 | <0.01 | 4.294 | ||
| SHAPE_CV_Grs | −5.460E-005 | −0.461 | −10.173 | <0.01 | 4.044 | |||
| Cultivated land | CONTIG_RA_Cvl | 0.001 | 0.341 | 4.914 | <0.01 | 9.482 | ||
| CIRCLE_SD_Cvl | −0.001 | −0.131 | −2.667 | <0.05 | 4.757 | |||
| Forest | CIRCLE_MD_Frt | 0.000 | −0.063 | −2.494 | <0.05 | 1.249 | ||
Multiple regression analysis results obtained for the leading landscape patterns in the urban center area.
In the models established in the subcenter area (Table 5), the effects of SHAPE_RA_Cvl (the range of shape index of cultivated lands), CONTIG_CV_Frs (the coefficient of variation of contiguity index of forests), CONTIG_AM_Wtl (the area-weighted of contiguity index of wetlands), CONTIG_RA_Grs (the range of contiguity index of grasslands) and CONTIG_MD_Grs (the median of contiguity index of grasslands) on the dependent variable are positive, while the effects of SHAPE_SD_Cvl (the standard deviation of shape index of cultivated lands) and SHAPE_AM_Grs (the area-weighted mean of shape index of grasslands) on the dependent variable are negative.
TABLE 5
| Land use type | Variables | Statistics |
R 2 | Adjusted R2 | ||||
| B | β | t | P | VIF | ||||
| Cultivated lands | SHAPE_RA_Cvl | 0.001 | 0.930 | 10.873 | <0.01 | 4.648 | 0.958 | 0.947 |
| SHAPE_SD_Cvl | −0.005 | −0.311 | −4.071 | <0.01 | 3.715 | |||
| Forests | CONTIG_CV_Frs | 3.003E-005 | 0.226 | 4.421 | <0.01 | 1.658 | ||
| Grasslands | CONTIG_RA_Grs | 0.009 | 0.434 | 4.915 | <0.01 | 4.957 | ||
| SHAPE_AM_Grs | −0.004 | −0.472 | −4.009 | <0.01 | 8.823 | |||
| CONTIG_MD_Grs | 0.010 | 0.177 | 2.504 | <0.05 | 3.159 | |||
| Wetlands | CONTIG_AM_Wtl | 0.010 | 0.203 | 4.701 | <0.01 | 1.184 | ||
Multiple regression analysis results obtained for the leading landscape patterns in the urban subcenter area.
Table 6 summarizes the relationships between the flood vulnerability of northern suburbs and the leading landscape pattern indexes. According to the regression analysis results obtained for the northern suburbs, the independent variable related to cultivated lands is SHAPE_AM_Cvl (the area-weighted of shape index of cultivated lands), and the index related to wetlands is FRAC_AM_Wtl (the area-weighted of fractal dimension index of wetlands). Both of these indexes positively impact the dependent variable; that is, an increase in these indicators leads to an increase in regional flood vulnerability. In the southern suburbs, the indicators selected as leading landscape patterns are shown in Table 7. CONTIG_RA_Wtb (the range of contiguity index of water bodies), CONTIG_RA_As (the range of contiguity index of artificial surfaces) and CONTIG_CV_Cvl (the coefficient of variation of contiguity index of cultivated lands) have positive effects on the dependent variable, while CONTIG_CV_Wtb (the coefficient of variation of contiguity index of water bodies) and FRAC_AM_As (the area-weighted of fractal dimension index of artificial surfaces) have negative effects on the dependent variable.
TABLE 6
| Land use type | Variables | Statistics |
R 2 | Adjusted R2 | ||||
| B | β | t | P | VIF | ||||
| Cultivated lands | SHAPE_AM_Cvl | 0.002 | 0.783 | 7.884 | <0.01 | 1.076 | 0.789 | 0.771 |
| Wetlands | FRAC_AM_Wtl | 0.005 | 0.259 | 2.610 | <0.05 | 1.076 | ||
Multiple regression analysis results obtained for the leading landscape patterns in the northern suburbs.
TABLE 7
| Land use type | Variables | Statistics |
R 2 | Adjusted R2 | ||||
| B | β | t | P | VIF | ||||
| Cultivated lands | CONTIG_CV_Cvl | 3.460E-005 | 0.238 | 2.171 | <0.05 | 1.830 | 0.901 | 0.868 |
| Water bodies | CONTIG_RA_Wtb | 0.015 | 0.961 | 6.927 | <0.01 | 2.924 | ||
| CONTIG_CV_Wtb | −5.447E-005 | −0.317 | −2.687 | <0.05 | 2.118 | |||
| Artificial surfaces | CONTIG_RA_As | 0.004 | 0.312 | 2.708 | <0.05 | 2.021 | ||
| FRAC_AM_As | −0.007 | −0.362 | −3.137 | <0.05 | 2.025 | |||
Multiple regression analysis results obtained for the leading landscape patterns in the southern suburbs.
Derivation of leading landscape patterns for flood vulnerability at the city scale
Table 8 shows that SHAPE_RA_Cvl (the range of shape index of cultivated lands), CONTIG_RA_Grs (the range of contiguity index of grasslands), CONTIG_RA_Wtb (the range of contiguity index of water bodies), DIVISION_Wtl (the landscape division index of wetlands), SHAPE_RA_Wtb (the range of shape index of water bodies), and SHAPE_RA_As (the range of shape index of artificial surfaces) have positive effects on the dependent variable; in other words, an increase in any of these indexes leads to an increase in the flood vulnerability. The effects of SHAPE_SD_As (the standard deviation of shape index of artificial surfaces), CIRCLE_SD_Wtb (the standard deviation of related circumscribing circle of water bodies), and SHAPE_CV_Wtb (the coefficient of variation of shape index of water bodies) on the dependent variable are negative, i.e., an increase in any of these indicator values leads to a reduction in flood vulnerability.
TABLE 8
| Land use type | Variables | Statistics |
R 2 | Adjusted R2 | ||||
| B | β | t | P | VIF | ||||
| Cultivated lands | SHAPE_RA_Cvl | 0.001 | 0.383 | 5.021 | <0.01 | 4.955 | 0.866 | 0.856 |
| Grasslands | CONTIG_RA_Grs | 0.015 | 0.961 | 6.927 | <0.01 | 2.924 | ||
| Wetlands | DIVISION_Wtl | 0.004 | 0.129 | 3.569 | <0.01 | 1.108 | ||
| Water bodies | CONTIG_RA_Wtb | 0.007 | 0.429 | 4.719 | <0.01 | 7.044 | ||
| CIRCLE_SD_Wtb | −0.0007 | −0.150 | −2.086 | <0.05 | 4.405 | |||
| SHAPE_RA_Wtb | 0.001 | 0.347 | 3.983 | <0.01 | 6.466 | |||
| SHAPE_CV_Wtb | −8.717E-005 | −0.281 | −2.777 | <0.01 | 8.707 | |||
| Artificial surfaces | SHAPE_SD_As | −0.005 | −0.315 | −4.253 | <0.01 | 4.671 | ||
| SHAPE_RA_As | 0.001 | 0.249 | 2.579 | <0.05 | 7.966 | |||
Multiple regression analysis results obtained for the leading landscape patterns at the city scale.
Discussions
Validation of the multiple regression models
The above section shows the regression analysis results obtained for various urban subregions, including the urban center area, urban subcenter area, northern suburbs, and southern suburbs. First, the decision coefficients (adjusted R2) of the models are all greater than 0.6, indicating that the models have good fitting effects and can accurately explain the flood vulnerability in the analyzed regions. Second, the p-values of all independent variables in the models are less than 0.05, and the p-values of some independent variables are less than 0.01, indicating that their possibility is quite great. In addition, the variance inflation factor (VIF) values of these independent variables are less than 10, demonstrating that the multicollinearity of each variable is low. Based on the above analysis, it can be considered that the multiple regression model established in this paper has good accuracy and can be further analyzed and discussed.
Analysis of leading landscape patterns for flood vulnerability in Nanjing subregions
Leading landscape patterns in the urban center area
According to the results of regression analysis, the optimization strategies of this area can be diagrammed as shown in Figure 9.
FIGURE 9
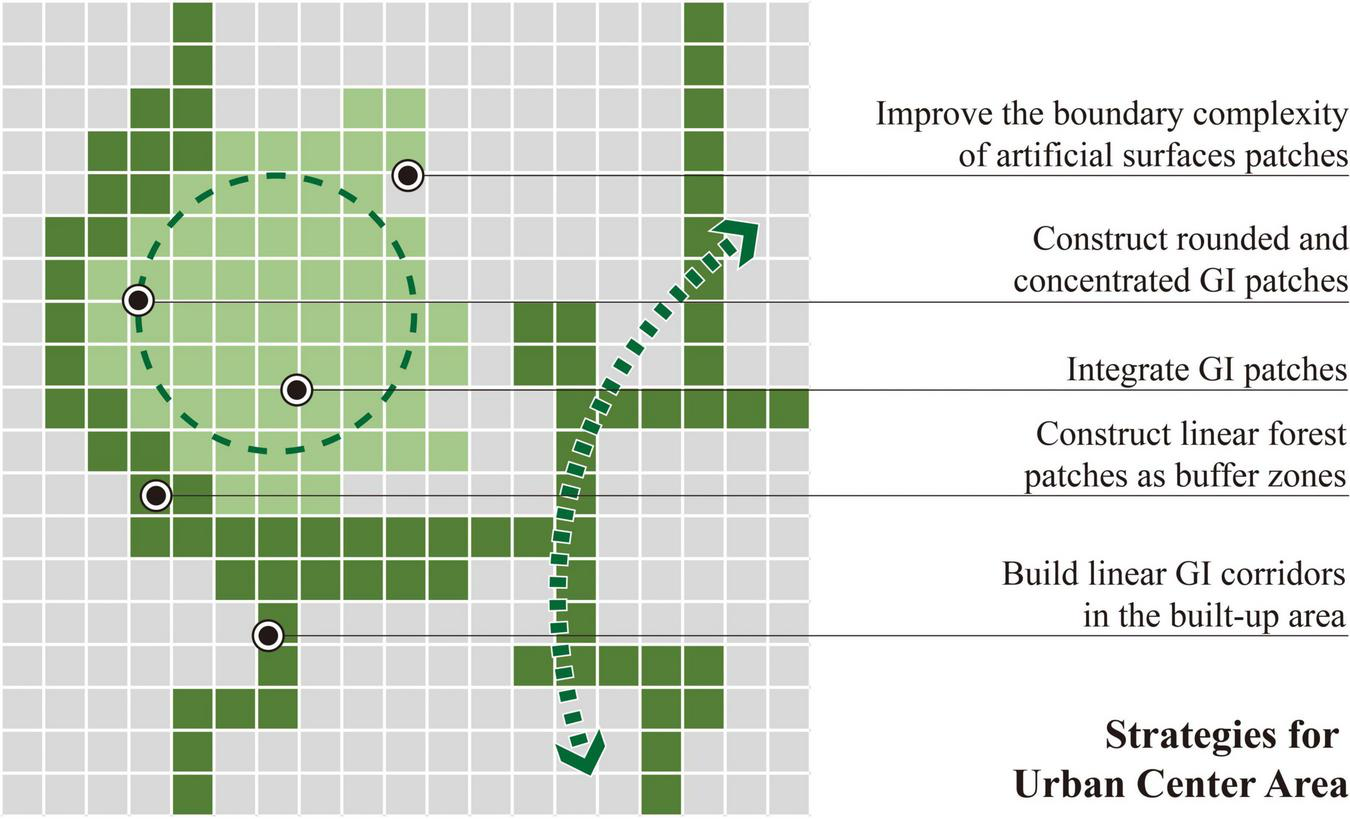
Strategies for urban center area.
First, from the analysis results of the urban center area, it can be seen that increases in linear patches of grasslands and wetlands in this region lead to an increase in flood vulnerability. Therefore, it is necessary to build more round, concentrated and complete grassland and wetland patches, taking into consideration the size and shape of lawns and water areas when planning and constructing new urban parks or green spaces. Second, we propose that linear forests need to be constructed in this region. A considerable number of forest patches in the urban center area appear in the built-up area in a linear way; these linear patches can play a great role in intercepting surface runoff in the built-up area, and the water circulation in the multicorridor connection region is more efficient than that in the isolated areas (Johnson et al., 2016). Existing orbicular forest patches only need to be protected and maintained without undergoing major changes. Particularly revealing is that forests and water bodies are better able to store rainwater and flood waters than grasslands and wetlands of the same size. Therefore, when planning a GI network, we should make overall arrangements that combine grasslands with forests and wetlands with water bodies.
The leading landscape patterns in the Nanjing urban center area also include landscape pattern indexes for cultivated lands. In this subregion, cultivated lands are mainly distributed along the edges, with small areas and scattered overall distribution (Li et al., 2021). The flood vulnerability of the cultivated land patches in this region is mostly caused by the disorderly expansion of urban built-up areas and the encroachment of built-up areas on cultivated lands and the surrounding green spaces. Consequently, GI patches that can reduce flood risks, such as forests and water bodies, should be built around cultivated lands to reduce regional flood vulnerability, to guarantee the safety of regional rainwater and flood carrying capacity and mitigate damage to cultivated lands. Based on the extent of artificial surfaces, strategies to concentrate patches instead of dispersing them should be adopted to reduce flood vulnerability. In practice, the urban center area is the most developed region in the city, so it is unrealistic to reduce the area of artificial surfaces in this region. Improving the complexity of the boundary areas and actively constructing grasslands, forests and water bodies around the built-up area are good ways to divert rainwater and reduce flood vulnerability. Furthermore, low-impact development (LID) facilities, such as infiltration ditches, rain gardens and roof gardens can be built to improve regional flood resistance (Kim et al., 2021; Koc et al., 2021).
Low-impact development is a GI planning technique in which the design of rainwater and flood control facilities are integrated throughout the whole process of urban planning. Decentralized small-scale technical measures are adopted to control the source of rainwater runoff. The main engineering measures of LID include the construction of rainwater retention facilities and infiltration facilities, such as rainwater gardens, roof gardens, and ecological parking lots, to absorb the runoff generated by local impermeable water surfaces, thus reducing the infrastructure construction costs, realizing control and management at the runoff source, and lessening the impacts of floods on the environment while developing the site (Dietz, 2007; Elliott and Trowsdale, 2007; Koc et al., 2021). When LID is applied to the Nanjing center area, in addition to construction measures, it is necessary to connect LID with a GI network, reshape and strengthen the circulation processes of natural water bodies, and thus enhance the flood control capacity in this subregion.
Leading landscape patterns in the urban subcenter area
Based on the results of regression analysis, the strategies for the urban subcenter area are diagrammed in Figure 10.
FIGURE 10
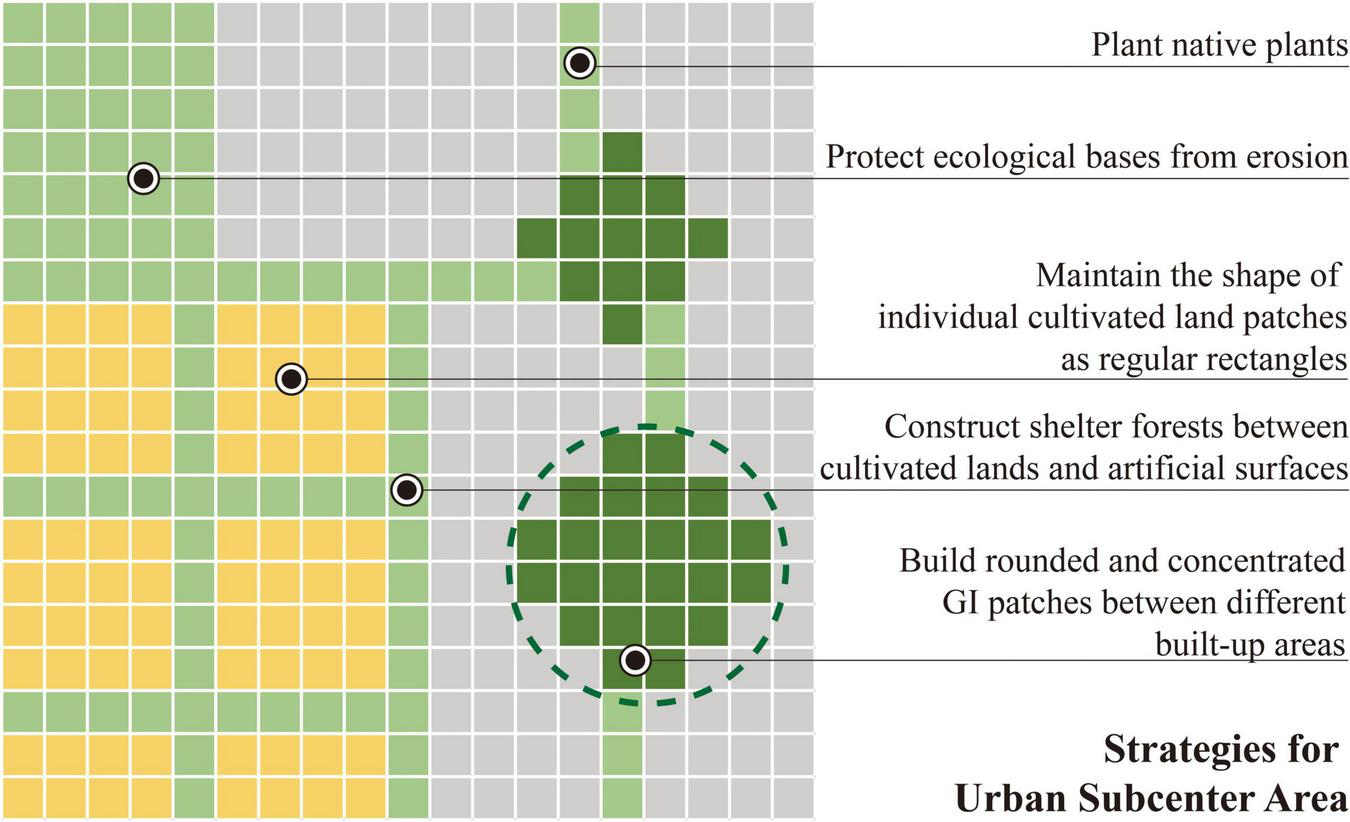
Strategies for urban subcenter area.
The urban subcenter area is the main area experiencing further expansion in Nanjing; thus, this area is tasked with further urbanization of Nanjing and faces the risk of further flood vulnerability deterioration. Based on the multiple regression analysis results, we know that the cultivated land use type is the most significant factor affecting flood vulnerability in this region, suggesting the need to focus on and protect cultivated lands. In the past, less attention and optimization strategies have been given to cultivated lands in such studies; thus, these regions deserve attention in this study. Compared with the urban center area, the cultivated land patches in this area are mostly concentrated in groups and composed of paddy fields, which have a certain but limited capacity to store rainwater and relieve surface runoff. Moreover, in the cultivated land groups, the patches that are not occupied by urban built-up areas are mostly square-shaped. When the expansion of urban built-up areas (i.e., artificial surfaces) erodes part of these cultivated land patches, the main consequence is an increase in the flood vulnerability in the corresponding areas, leading to more complexity in the shape of the cultivated land patches. Constructing GI patches such as forests as buffers at the junction of cultivated lands and artificial surfaces and maintaining the shape of individual cultivated land patches as regular rectangles are effective ways to reduce flood vulnerability in these and surrounding areas.
There are still many eco-substrates located in the subcenter area of the city; these regions mainly come from long ecological succession processes and can be regarded as an ecological shelter around the city. These eco-substrates, including grasslands, wetlands and forests, have regular shapes and flat boundaries, are less affected by human activities, and still maintain a good ability to intercept rainwater and floods. Therefore, flood vulnerability is relatively low in areas where such patches exist. However, due to the influx of a multitude of migrants, the built-up areas have been further expanded, and the original natural habitats have been occupied to build residential buildings, commercial districts and other supporting facilities, resulting in great risks to these ecological shelters, the destruction of the homogenous patch shapes and an increase in the vulnerability of this subregion to rain and floods. Moreover, unlike the urban center area, forest patches in this area are characterized by lumpy patch formations, and their shapes are mostly planar rather than linear. Therefore, the flood vulnerability planning strategy in the urban subcentral area should focus on the prevention of further deterioration and necessitates the protection and maintenance of the existing green infrastructure areas in this subregion. First, it is necessary to prevent the disorderly expansion of urban artificial surfaces in these regions. When building gray infrastructure, round, green infrastructure patches such as grasslands and woodlands should be built between artificial surface patches, and shelter forests should be built in areas bordering cultivated land patches. In addition, we also consider the need to actively plant native tree species in areas with low habitat destruction risk, amend the patch shapes of wetlands and grasslands, and build rain and flood protection barriers.
Leading landscape patterns in the northern suburbs and southern suburbs
The strategies for the northern suburbs and southern suburbs are diagrammed in Figures 11, 12.
FIGURE 11
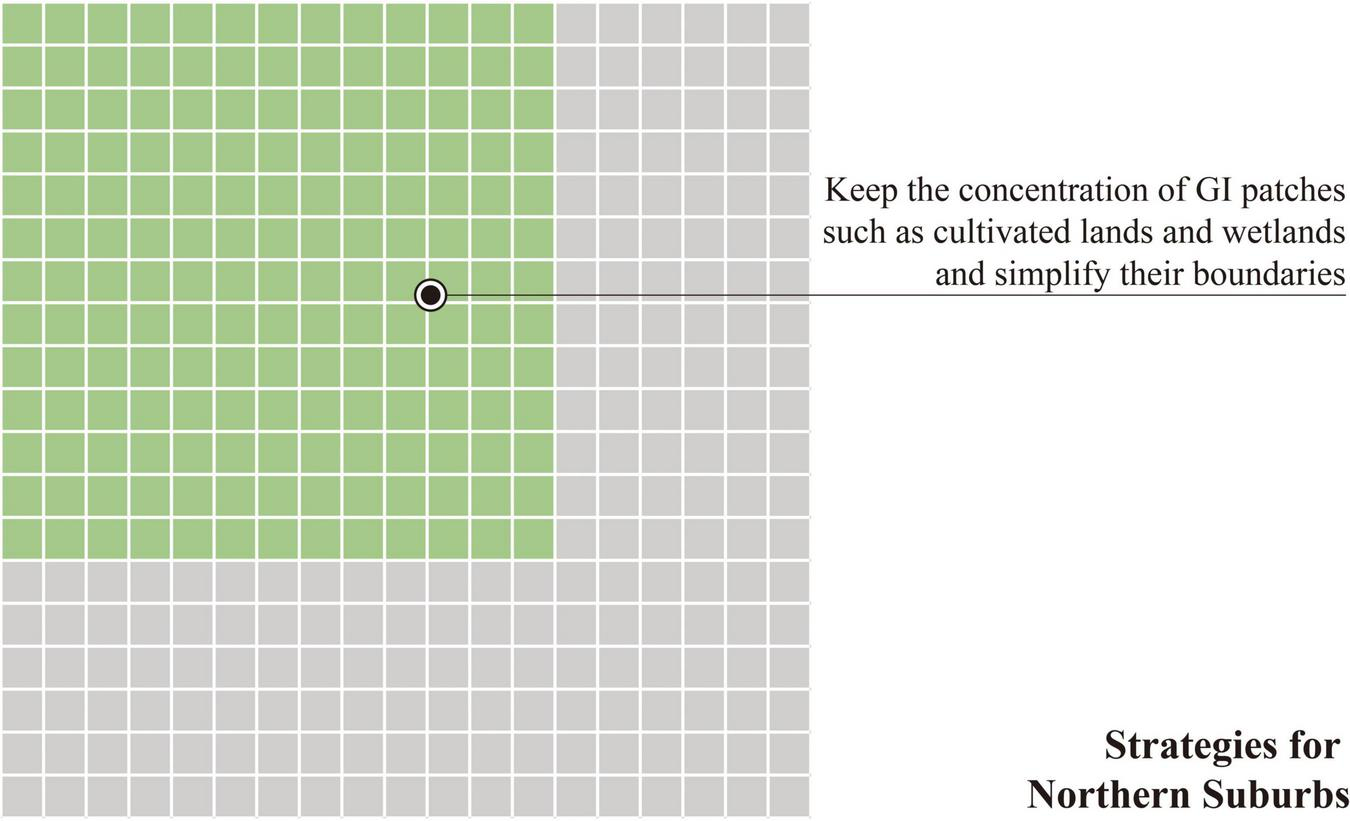
Strategies for northern suburbs.
FIGURE 12
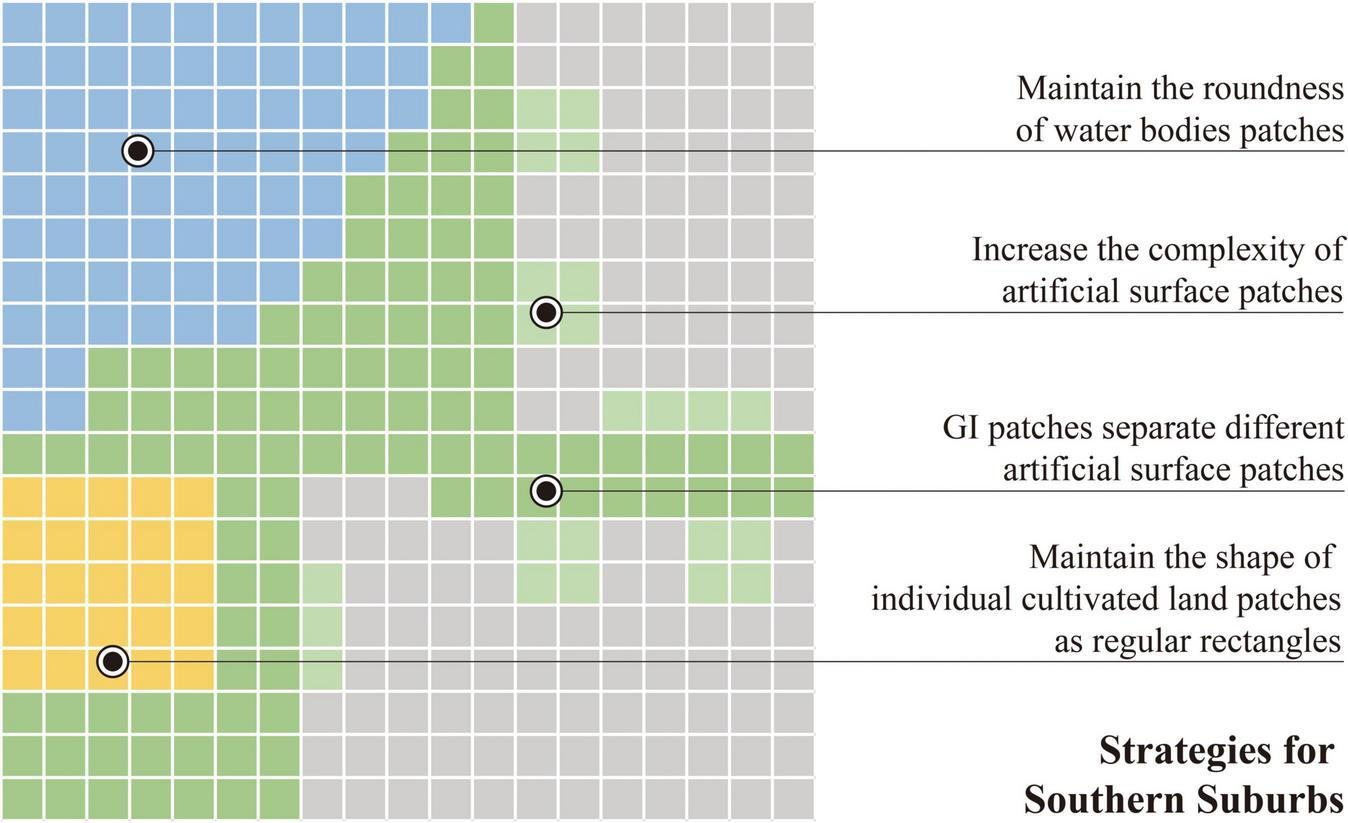
Strategies for southern suburbs.
Obviously, the construction strategy of northern suburbs lies in maintaining the integrity and concentration of cultivated lands and wetlands patches, and the boundary should be as simple as possible, which is caused by the relatively low proportion of the built-up area in this area and the relatively high proportion of cultivated land, water bodies, wetlands and other GI land types. The southern suburbs are shown as one of the highest flood vulnerability levels in Nanjing. Compared with the northern suburbs, the water bodies and artificial surfaces in the southern suburbs are the most influential factors affecting the regional flood vulnerability. In this area, water bodies are generally large and present areal shapes (such as lakes and ponds), and their flood vulnerability is relatively low. Although linear water bodies (such as streams and rivers) can help alleviate surface runoff, the flood vulnerability in their corresponding distribution areas is significantly higher than that in large water areas. Therefore, from the regression analysis results, contrary to other regions, if the water bodies in this region tend to be linear, they do not ease flood vulnerability. If artificial surface patches are separated, they help reduce the rain and flood vulnerability. Additionally, the complexity of artificial surface patches reduces the flood vulnerability in this subregion because the presence of more complicated artificial surface patches means that more built-up areas are exposed to land cover types with flood control functions, thus alleviating the risk of rainwater runoff and floods. To reduce the flood vulnerability in the southern suburb subregion, there is an urgent need to maintain the patch sizes of the existing planar water bodies and transform the linear water bodies into planar water bodies, maintain the scale of cultivated lands, adjust the shapes of these cultivated lands to rectangles, and build GI patches around these areas to alleviate flood vulnerability. Although the feasibility of reducing the scale of the built-up area is low, it is still possible to separate the artificial surface patches by maintaining a dynamic balance within the built-up areas or by increasing the floor area ratio to build green infrastructure such as banded water bodies and forests between patches. Moreover, the application of LID facilities in built-up areas can reduce rain and flood vulnerability.
Analysis of leading landscape patterns for flood vulnerability at the city scale
Water bodies, grasslands, wetlands and cultivated lands in the studied city are all GI land use types that can reduce flood vulnerability, but their functions differ due to the region in which they are located and their surrounding environments.
First, in the same area, the ability of water bodies with complex boundaries to intercept surface runoff and collect rainwater is inferior to that of water bodies with simpler boundaries. Especially for the water body patches located close to artificial surfaces around urban built-up areas, complex boundaries mean that the area of contact with the built-up area is larger, thus diverting more surface runoff from the built-up area and reducing the flood risk in the city. Simply speaking, increasing the complexity of the shorelines of water bodies around built-up areas in the city simplifies the complexity of water bodies in other areas and makes them more orbicular, thereby representing optimization strategies for water bodies.
Second, similar to water bodies, grassland patches with excessively complicated shapes have a weak ability to store rainwater, leading to an increase in flood vulnerability. In contrast to forests, grasslands have relatively low vegetation coverage, so their ability to intercept rainfall and block surface runoff is insufficient. Moreover, unlike water bodies and wetlands, grasslands abilities to collect rainwater and intercept surface runoff are also weak. Therefore, to optimize the flood vulnerability of Nanjing city, the protection of grasslands in urban non-built areas should be considered. If permitted, trees can be replanted, or water bodies can be excavated to improve the local ability to resist rainwater and flooding risks. On artificial surfaces, when planning to build new urban parks, the boundaries of grassland patches should be designed to be flat. Similarly, we can help reduce flood vulnerability by planting trees around the open lawns of parks or by digging landscape water bodies.
Third, the more scattered the wetland patches are at the city scale, the higher the flood vulnerability is in the corresponding areas. The main reason for this is that the scale of a single wetland patch in Nanjing is relatively small, and the more concentrated wetland patches appear, the more floodwater can be stored. Wetlands usually appear with water bodies, forests and grasslands. The more concentrated wetlands there are, the lower the flood vulnerability is. Notably, wetlands play important roles in storing water, regulating river runoff, replenishing groundwater and maintaining the regional water balance. They are natural “sponges” for water storage and flood control and can temporally and spatially distribute uneven precipitation and prevent floods and droughts by regulating water inflows and outflows. Therefore, protecting wetlands, establishing more intensive wetland patches such as wetland bubbles, and constructing any other GI that can help reduce flood risk represent critical planning strategies for optimizing wetland landscape patterns at the Nanjing city scale.
From the results listed in the table above and the analysis results obtained for relevant cultivated land indicators in each subregion, it can be seen that when planning cultivated lands, the patch shapes of cultivated lands should be as close as possible to regular shapes, such as rectangles or circles, to improve the ability of these areas to cope with rainwater. However, China’s arable land policy is strict, and the minimum amount of arable land throughout the country is set at 1,200,000 km2; exceeding this scope is forbidden when planning and constructing cities. The central government of China requires all localities to accurately allocate land use when making adjustments to cultivated lands. Therefore, when planning overall GI landscape patterns in Nanjing, the regulation of cultivated land areas should be considered, and a balance between occupation and compensation should be strictly implemented to ensure that cultivated lands can be adjusted without reducing the total cultivated land area. Obviously, regions with more complex artificial surface patches are less vulnerable to floods, as explained above. GI components do not exist alone but influence each other and jointly compose an overall organic system. Therefore, planners should complicate the boundaries of urban built-up areas and simultaneously build cohesive and complex grasslands and water bodies around built-up areas to allow the land types that can alleviate rain and floods to be in contact with more urban built-up areas, thus achieving the purpose of reducing regional flood vulnerability.
Limitations and further research
Urban floods are not only processes but also the results of processes. In contrast to hydrology research, which focuses on the mechanism and process of urban floods, this paper focuses on the results of and explores the relationship between urban floods and landscape patterns by means of statistical analysis. This study provides a new research approach for urban floods, and the index system utilized herein can provide a reference for such research. This thesis can help landscape and urban planners in planning, but there are also some limitations.
The regression analysis results may vary according to various study sites, and the differences in the economic development status of different cities may cause the evaluation index system to not be universal, so establishing different models to evaluate different regions of different cities is indispensable. In addition, this thesis focuses on the result of flood phenomena without too much consideration of hydrological processes, so hydrological information including runoff depth, rainfall recurrence interval, etc., are not taken into account, which need to be considered in further research.
In future research, first, we can build models for different types of cities and perform evaluations according to local conditions. Second, we can take more cities as research objects and simultaneously analyze the commonalities and differences among individual categories; we can also propose a more universal evaluation index system, determine common problems among cities according to the regression analysis results, and propose a more universal planning strategy. Third, the following research is bound to include the analysis of hydrological processes. Hydrological analysis can be regarded as a step in the evaluation system or results as evaluation factors, and it can also be used as a reference for validating the modeling results. At the same time, as a holistic and systematic project, rainwater and flood control must be actively integrated into relevant disciplines while deeply analyzing flood vulnerability to promote interdisciplinary cooperation overall.
Conclusion
Determining how to better control floods in a highly developed city, which lacks hydrological and meteorological information, is an enormous challenge and is of great significance for solving urban flooding problems in entire city regions. In this thesis, an urban flood vulnerability assessment method based on catastrophe theory and GIS technology is proposed, and Nanjing is selected as the study area. Three components, exposure, sensitivity and adaptability, are adopted in the factor selection process, and seven subfactors, precipitation, slope, soil, runoff density, land use and forest coverage, are superimposed to obtain the spatial distribution of flood vulnerability in the study area. In the multicriteria decision-making analysis (MCDA) and flood vulnerability mapping process in Nanjing, catastrophe theory shows advantages such as objectivity and ease of use compared to traditional methods; the evaluation results are accurate and reliable and can be used as a basis for urban flood management and control decision-making. A multiple regression model with flood vulnerability as the independent variable and shape-related landscape pattern indexes as the dependent variables is established, showing that shape-related landscape pattern indexes can be used as a reference to optimize urban flood vulnerability. The leading landscape patterns of each region derived by multiple regression models is summarized in Table 9.
TABLE 9
| Region | Land use type | Variables | Variables (unabbreviated form) | Function |
| Urban center area | Artificial surfaces | DIVISION_As | The landscape division index of artificial surfaces | Positive |
| CONTIG_AM_As | The area-weighted mean of contiguity index of artificial surfaces | Positive | ||
| SHAPE_AM_As | The area-weighted mean of shape index of artificial surfaces | Positive | ||
| Wetland | CIRCLE_MD_Wtl | The median of related circumscribing circle of wetlands | Positive | |
| Grassland | CIRCLE_CV_Grs | The coefficient of variation of related circumscribing circle of grasslands | Positive | |
| SHAPE_CV_Grs | The coefficient of variation of shape index of grasslands | Negative | ||
| Cultivated land | CONTIG_RA_Cvl | The range of contiguity index of cultivated lands | Positive | |
| CIRCLE_SD_Cvl | The standard deviation of related circumscribing circle of cultivated lands | Negative | ||
| Forest | CIRCLE_MD_Frt | The median of related circumscribing circle of forests | Negative | |
| Urban subcenter area | Cultivated lands | SHAPE_RA_Cvl | The range of shape index of cultivated lands | Positive |
| SHAPE_SD_Cvl | The standard deviation of shape index of cultivated lands | Negative | ||
| Forests | CONTIG_CV_Frs | The coefficient of variation of contiguity index of forests | Positive | |
| Grasslands | CONTIG_RA_Grs | The range of contiguity index of grasslands | Positive | |
| SHAPE_AM_Grs | The area-weighted mean of shape index of grasslands | Negative | ||
| CONTIG_MD_Grs | The median of contiguity index of grasslands | Positive | ||
| Wetlands | CONTIG_AM_Wtl | The area-weighted of contiguity index of wetlands | Positive | |
| Northern suburbs | Cultivated lands | SHAPE_AM_Cvl | The area-weighted of shape index of cultivated lands | Positive |
| Wetlands | FRAC_AM_Wtl | The area-weighted of fractal dimension index of wetlands | Positive | |
| Southern suburbs | Cultivated lands | CONTIG_CV_Cvl | The coefficient of variation of contiguity index of cultivated lands | Positive |
| Water bodies | CONTIG_RA_Wtb | The range of contiguity index of water bodies | positive | |
| CONTIG_CV_Wtb | The coefficient of variation of contiguity index of water bodies | Negative | ||
| Artificial surfaces | CONTIG_RA_As | The range of contiguity index of artificial surfaces | Positive | |
| FRAC_AM_As | The area-weighted of fractal dimension index of artificial surfaces | Negative |
Leading landscape patterns of each region derived by multiple regression models.
From the results of the multiple regression analysis, it can be seen that the leading landscape patterns of flood vulnerability vary at different scales and among different urban areas, and the optimization priorities of landscape patterns in different regions are also quite different. Therefore, when an optimization strategy for alleviating urban rain and flood vulnerability is proposed, it should be comprehensively discussed in combination with the landscape patterns dominant in various regions. This study provides a new research approach for helping reduce urban floods, and the index system utilized herein can provide a reference for such research and is worth further study. Compared with the methods like SWAT, SCS-CN and other models, the research methods proposed in this study is simpler and more convenient, and it is suitable for rapid assessment of flood vulnerability in areas lacking data, and provides a faster decision-making tool for urban planning.
Statements
Data availability statement
The original contributions presented in this study are included in the article/supplementary material, further inquiries can be directed to the corresponding author.
Author contributions
JX: intellectual concept of the manuscript, methodology, data analysis, and writing. JY: writing-reviewing and editing, manuscript review, and funding. CC: data analysis. All authors made significant individual contributions to this manuscript.
Funding
This work was supported by the Construction Project of Brand Specialty in Jiangsu Colleges and Universities (PPZY2015A063), a project funded by the Priority Academic Program Development of Jiangsu Higher Education Institutions.
Acknowledgments
We are grateful for the data support from the “National Earth System Science Data Center, National Science & Technology Infrastructure of China (http://www.geodata.cn).” In addition, we would like to thank the editors and reviewers for taking the time to review this manuscript.
Conflict of interest
The authors declare that the research was conducted in the absence of any commercial or financial relationships that could be construed as a potential conflict of interest.
Publisher’s note
All claims expressed in this article are solely those of the authors and do not necessarily represent those of their affiliated organizations, or those of the publisher, the editors and the reviewers. Any product that may be evaluated in this article, or claim that may be made by its manufacturer, is not guaranteed or endorsed by the publisher.
Footnotes
References
1
Ahmed K. Shahid S. bin Harun S. Ismail T. Nawaz N. Shamsudin S. (2015). Assessment of groundwater potential zones in an arid region based on catastrophe theory.Earth Sci. Inform.8539–549. 10.1007/s12145-014-0173-3
2
Anwar S. A. Diallo I. (2021). The influence of two land-surface hydrology schemes on the terrestrial carbon cycle of Africa: a regional climate model study.Int. J. Climatol.41E1202–E1216. 10.1002/joc.6762
3
Bae J. Sohn W. Newman G. Gu D. Woodruff S. Van Zandt S. et al (2021). A longitudinal analysis of green infrastructure conditions in Coastal Texan cities.Urban For. Urban Green.65:127315. 10.1016/j.ufug.2021.127315
4
Bailey D. Herzog F. Augenstein I. Aviron S. Billeter R. Szerencsits E. et al (2007). Thematic resolution matters: indicators of landscape pattern for European agro-ecosystems.Ecol. Indic.7692–709. 10.1016/j.ecolind.2006.08.001
5
Balica S. F. Wright N. G. van der Meulen F. (2012). A flood vulnerability index for coastal cities and its use in assessing climate change impacts.Nat. Hazards6473–105. 10.1007/s11069-012-0234-1
6
Bekin N. Prois Y. Laronne J. B. Egozi R. (2021). The fuzzy effect of soil conservation practices on runoff and sediment yield from agricultural lands at the catchment scale.Catena207:105710. 10.1016/j.catena.2021.105710
7
Berland A. Shiflett S. A. Shuster W. D. Garmestani A. S. Goddard H. C. Herrmann D. L. et al (2017). The role of trees in urban stormwater management.Landsc. Urban Plann.162167–177. 10.1016/j.landurbplan.2017.02.017
8
Beven K. J. Kirkby M. J. Freer J. E. Lamb R. (2021). A history of TOPMODEL.Hydrol. Earth System Sci.25527–549. 10.5194/hess-25-527-2021
9
Cao B. (2015). The Parameters Regionalization Research of the Excess Storage and Excess Infiltration Simultaneously Model (in Chinese).Ph.D. thesis. Zhengzhou: Zhengzhou University.
10
Cao J. Zhao H.-K. (2020). Distinct response of Northern Hemisphere land monsoon precipitation to transient and stablized warming scenarios.Adv. Clim. Change Res.11161–171. 10.1016/j.accre.2020.09.007
11
Chan F. K. S. Griffiths J. A. Higgitt D. Xu S. Zhu F. Tang Y.-T. et al (2018). “Sponge City” in China—A breakthrough of planning and flood risk management in the urban context.Land Use Policy76772–778. 10.1016/j.landusepol.2018.03.005
12
Chen W. Yang F. Song L. (2015). Countermeasures against Rainstorm and Flood in High-density Cities —— Enlightenment from “July 20th” Heavy Rainstorm in Zhengzhou (in Chinese).China Water Resour.202118–23.
13
Chen Y. Liu T. Ge Y. Xia S. Yuan Y. Li W. et al (2021). Examining social vulnerability to flood of affordable housing communities in Nanjing, China: building long-term disaster resilience of low-income communities.Sust. Cities Soc.71:102939. 10.1016/j.scs.2021.102939
14
Devia G. K. Ganasri B. P. Dwarakish G. S. (2015). A review on hydrological models.Aquat. Proc.41001–1007. 10.1016/j.aqpro.2015.02.126
15
Dietz M. E. (2007). Low impact development practices: a review of current research and recommendations for future directions.Water Air Soil Pollut.186351–363. 10.1007/s11270-007-9484-z
16
Elliott A. Trowsdale S. (2007). A review of models for low impact urban stormwater drainage.Environ. Model. Softw.22394–405. 10.1016/j.envsoft.2005.12.005
17
Fan P. XiBa T. ShouTing G. ZheXian L. (2014). A comparative study of the atmospheric circulations associated with rainy-season floods between the Yangtze and Huaihe River Basins.Sci. China Earth Sci.571464–1479. 10.1007/s11430-013-4802-3
18
Francesconi W. Srinivasan R. Pérez-Miñana E. Willcock S. P. Quintero M. (2016). Using the Soil and Water Assessment Tool (SWAT) to model ecosystem services: a systematic review.J. Hydrol.535625–636. 10.1016/j.jhydrol.2016.01.034
19
Gao Y. Chen J. Luo H. Wang H. (2020). Prediction of hydrological responses to land use change.Sci. Total Environ.708:134998. 10.1016/j.scitotenv.2019.134998
20
He Y. Kusiak A. (2017). Performance assessment of wind turbines: data-derived quantitative metrics.IEEE Trans. Sustain. Energy965–73.
21
Hu S. Fan Y. Zhang T. (2020). Assessing the effect of land use change on surface runoff in a rapidly urbanized city: a case study of the central area of Beijing.Land9:17. 10.3390/land9010017
22
Huang Y. (2015). “Integrated water resources management using engineering measures,” in Hydrological Sciences and Water Security: Past, Present and Future, edsCudennecC.DemuthS.MishraA.YoungG. (Wallingford: International Association of Hydrological Sciences), 54–63.
23
Jenifer M. A. Jha M. K. (2017). Comparison of analytic hierarchy process, catastrophe and entropy techniques for evaluating groundwater prospect of hard-rock aquifer systems.J. Hydrol.548605–624. 10.1016/j.jhydrol.2017.03.023
24
Ji G. Lai Z. Xia H. Liu H. Wang Z. (2021). Future runoff variation and flood disaster prediction of the yellow river basin based on CA-Markov and SWAT.Land10:421. 10.3390/land10040421
25
Jodar-Abellan A. Valdes-Abellan J. Pla C. Gomariz-Castillo F. (2019). Impact of land use changes on flash flood prediction using a sub-daily SWAT model in five Mediterranean ungauged watersheds (SE Spain).Sci. Total Environ.6571578–1591. 10.1016/j.scitotenv.2018.12.034
26
Johnson S. E. Amatangelo K. L. Townsend P. A. Waller D. M. (2016). Large, connected floodplain forests prone to flooding best sustain plant diversity.Ecology973019–3030. 10.1002/ecy.1556
27
Kaur L. Rishi M. S. Singh G. Nath Thakur S. (2020). Groundwater potential assessment of an alluvial aquifer in Yamuna sub-basin (Panipat region) using remote sensing and GIS techniques in conjunction with analytical hierarchy process (AHP) and catastrophe theory (CT).Ecol. Indic.110:105850. 10.1016/j.ecolind.2019.105850
28
Kazakis N. Kougias I. Patsialis T. (2015). Assessment of flood hazard areas at a regional scale using an index-based approach and analytical hierarchy process: application in Rhodope–Evros region, Greece.Sci. Total Environ.538555–563. 10.1016/j.scitotenv.2015.08.055
29
Khzr B. O. Ibrahim G. R. F. Hamid A. A. Ail S. A. (2022). Runoff estimation using SCS-CN and GIS techniques in the Sulaymaniyah sub-basin of the Kurdistan region of Iraq.Environ. Dev. Sustainabil.242640–2655. 10.1007/s10668-021-01549-z
30
Kim M. Song K. Chon J. (2021). Key coastal landscape patterns for reducing flood vulnerability.Sci. Total Environ.759:143454. 10.1016/j.scitotenv.2020.143454
31
Koc K. Ekmekcioglu O. Ozger M. (2021). An integrated framework for the comprehensive evaluation of low impact development strategies.J. Environ. Manage.294:113023. 10.1016/j.jenvman.2021.113023
32
Li G. Cao Y. He Z. He J. Wang J. Fang X. (2021). Understanding the diversity of urban-rural fringe development in a fast urbanizing region of China.Remote Sens.13:2373. 10.3390/rs13122373
33
Li H. (2022a). Short-term wind power prediction via spatial temporal analysis and deep residual networks.Front. Energy Res.10:920407. 10.3389/fenrg.2022.920407
34
Li H. (2022b). SCADA data based wind power interval prediction using LUBE-based deep residual networks.Front. Energy Res.10:920837. 10.3389/fenrg.2022.920837
35
Liang C. Zhang X. Xu J. Pan G. Wang Y. (2020). An integrated framework to select resilient and sustainable sponge city design schemes for robust decision making.Ecol. Indic.119:106810. 10.1016/j.ecolind.2020.106810
36
Martinez-Grana A. M. Boski T. Goy J. L. Zazo C. Dabrio C. J. (2016). Coastal-flood risk management in central Algarve: vulnerability and flood risk indices (South Portugal).Ecol. Indic.71302–316. 10.1016/j.ecolind.2016.07.021
37
Morawitz D. F. Blewett T. M. Cohen A. Alberti M. (2006). Using NDVI to assess vegetative land cover change in central puget sound.Environ. Monit. Assess.11485–106. 10.1007/s10661-006-1679-z
38
Neupane B. Vu T. M. Mishra A. K. (2021). Evaluation of land-use, climate change, and low-impact development practices on urban flooding.Hydrol. Sci. J.661729–1742. 10.1080/02626667.2021.1954650
39
Nuottimaki K. Jarva J. (2015). A qualitative approach for identifying areas prone to urban floods with the support of LiDAR.GFF137373–382. 10.1080/11035897.2015.1055512
40
Ouma Y. Tateishi R. (2014). Urban flood vulnerability and risk mapping using integrated multi-parametric AHP and GIS: methodological overview and case study assessment.Water61515–1545. 10.3390/w6061515
41
Patel P. Karmakar S. Ghosh S. Aliaga D. G. Niyogi D. (2021). Impact of green roofs on heavy rainfall in tropical, coastal urban area.Environ. Res. Lett.16:074051. 10.1088/1748-9326/ac1011
42
Peijiang W. Haifeng Z. Zhibin R. Dan Z. Chang Z. Zhixia M. et al (2018). Effects of urbanization, soil property and vegetation configuration on soil infiltration of Urban Forest in Changchun, Northeast China.Chin. Geogr. Sci.28482–494. 10.1007/s11769-018-0953-7
43
Peng Y. Wang Q. Wang H. Lin Y. Song J. Cui T. et al (2019). Does landscape pattern influence the intensity of drought and flood?Ecol. Indic.103173–181. 10.1016/j.ecolind.2019.04.007
44
Powell S. J. Jakeman A. Croke B. (2014). Can NDVI response indicate the effective flood extent in macrophyte dominated floodplain wetlands?Ecol. Indic.45486–493. 10.1016/j.ecolind.2014.05.009
45
Pu K. Liu X. Wu Y. Hu S. Liu L. Gao T. (2020). A comparison study of raindrop size distribution among five sites at the urban scale during the East Asian rainy season.J. Hydrol.590:125500. 10.1016/j.jhydrol.2020.125500
46
Qin Z. Yao Y. Zhao J. Fu H. Zhang S. Qiu L. (2021). Investigation of migration rule of rainwater for sponge city roads under different rainfall intensities.Environ. Geochem. Health[Epub ahead of print]. 10.1007/s10653-021-01104-9
47
Rehman S. Ul Hasan M. S. Rai A. K. Avtar R. Sajjad H. (2021). Assessing flood-induced ecological vulnerability and risk using GIS-based in situ measurements in Bhagirathi sub-basin, India.Arab. J. Geosci.14:1520. 10.1007/s12517-021-07780-2
48
Sadeghi J. Oghabi M. Sarvari H. Sabeti M.-S. Kashefi H. Chan D. (2021). Identification and prioritization of seismic risks in urban worn-out textures using fuzzy delphi method.Environ. Eng. Manag. J.201035–1046.
49
Salvadore E. Bronders J. Batelaan O. (2015). Hydrological modelling of urbanized catchments: a review and future directions.J. Hydrol.52962–81. 10.1016/j.jhydrol.2015.06.028
50
Shanableh A. Al-Ruzouq R. Yilmaz A. G. Siddique M. Merabtene T. Imteaz M. A. (2018). Effects of land cover change on urban floods and rainwater harvesting: a case study in Sharjah, UAE.Water10:631. 10.3390/w10050631
51
Sharma R. Malaviya P. (2021). Management of stormwater pollution using green infrastructure: the role of rain gardens.Wiley Interdiscip. Rev. Water8:e1507. 10.1002/wat2.1507
52
Singh L. K. Jha M. K. Chowdary V. M. (2018). Assessing the accuracy of GIS-based Multi-Criteria Decision Analysis approaches for mapping groundwater potential.Ecol. Indic.9124–37. 10.1016/j.ecolind.2018.03.070
53
Sohn W. Bae J. Newman G. (2021). Green infrastructure for coastal flood protection: the longitudinal impacts of green infrastructure patterns on flood damage.Appl. Geogr.135:102565. 10.1016/j.apgeog.2021.102565
54
Su M. Zheng Y. Hao Y. Chen Q. Chen S. Chen Z. et al (2018). The influence of landscape pattern on the risk of urban water-logging and flood disaster.Ecol. Indic.92133–140. 10.1016/j.ecolind.2017.03.008
55
Tang J. Li Y. Cui S. Xu L. Hu Y. Ding S. et al (2021). Analyzing the spatiotemporal dynamics of flood risk and its driving factors in a coastal watershed of southeastern China.Ecol. Indic.121:107134. 10.1016/j.ecolind.2020.107134
56
Tsou J. Y. Gao Y. Zhang Y. Sun G. Ren J. Li Y. (2017). Evaluating urban land carrying capacity based on the ecological sensitivity analysis: a case study in Hangzhou, China.Remote Sens.9:529. 10.3390/rs9060529
57
Tzoulas K. Korpela K. Venn S. Yli-Pelkonen V. Kaźmierczak A. Niemela J. et al (2007). Promoting ecosystem and human health in urban areas using Green Infrastructure: a literature review.Landsc. Urban Plann.81167–178. 10.1016/j.landurbplan.2007.02.001
58
Ureta J. Motallebi M. Scaroni A. E. Lovelace S. Ureta J. C. (2021). Understanding the public’s behavior in adopting green stormwater infrastructure.Sust. Cities Soc.69:102815. 10.1016/j.scs.2021.102815
59
Vörösmarty C. J. Green P. Salisbury J. Lammers R. B. (2000). Global water resources: vulnerability from climate change and population growth.Science289284–288. 10.1126/science.289.5477.284
60
Wang Q. Xu Y. Cai X. Tang J. Yang L. (2021). Role of underlying surface, rainstorm and antecedent wetness condition on flood responses in small and medium sized watersheds in the Yangtze River Delta region, China.Catena206:105489. 10.1016/j.catena.2021.105489
61
Wu C.-F. Chen S.-H. Cheng C.-W. Trac L. V. T. (2021). Climate justice planning in global south: applying a coupled nature-human flood risk assessment framework in a case for ho chi minh City, Vietnam.Water13:2021. 10.3390/w13152021
62
Xia J. Chen J. (2021). A new era of flood control strategies from the perspective of managing the 2020 Yangtze River flood.Sci. China Earth Sci.641–9. 10.1007/s11430-020-9699-8
63
Yang W. Xu K. Lian J. Bin L. Ma C. (2018). Multiple flood vulnerability assessment approach based on fuzzy comprehensive evaluation method and coordinated development degree model.J. Environ. Manag.213440–450. 10.1016/j.jenvman.2018.02.085
64
Yi B. Zhai G. (2012). “The study on the acceptable flood risk in nanjing China,” in Innovative Theories and Methods for Risk Analysis and Crisis Response, edsHuangC. F.ZhaiG. F. (Paris: Atlantis Press), 329–334.
65
Yuan J. Cohen M. J. Kaplan D. A. Acharya S. Larsen L. G. Nungesser M. K. (2015). Linking metrics of landscape pattern to hydrological process in a lotic wetland.Landsc. Ecol.301893–1912. 10.1007/s10980-015-0219-z
66
Zhang J. Zhang M. Song Y. Lai Y. (2021). Hydrological simulation of the Jialing River Basin using the MIKE SHE model in changing climate.J. Water Clim. Change122495–2514. 10.2166/wcc.2021.253
67
Zhang T.-J. Ren S. Li S. Zhang T.-C. Xu H. (2009). Application of the catastrophe progression method in predicting coal and gas outburst.Mining Sci. Technol.19430–434. 10.1016/S1674-5264(09)60080-6
68
Zheng Y. Lan S. Chen W. Y. Chen X. Xu X. Chen Y. et al (2019). Visual sensitivity versus ecological sensitivity: an application of GIS in urban forest park planning.Urban For. Urban Green.41139–149. 10.1016/j.ufug.2019.03.010
69
Zhou J. Wei J. Yang T. Zhang P. Liu F. Chen J. (2021). Seepage channel development in the crown pillar: insights from induced microseismicity.Int. J. Rock Mech. Mining Sci.145:104851.
70
Zhou Q. Luo J. Qin Z. Su J. Ren Y. (2021). Conceptual planning approach of low impact developments for combined water quality-quantity control at an urban scale: a case study in Southern China.J. Flood Risk Manag.15:e12760. 10.1111/jfr3.12760
71
Zhou T. Ren L. Zhang W. (2021). Anthropogenic influence on extreme Meiyu rainfall in 2020 and its future risk.Sci. China Earth Sci.641633–1644. 10.1007/s11430-020-9771-8
Summary
Keywords
landscape patterns, flood vulnerability, catastrophe method, urban green infrastructure, flood control, spatial statistics
Citation
Xue J, Yan J and Chen C (2022) Combining catastrophe technique and regression analysis to deduce leading landscape patterns for regional flood vulnerability: A case study of Nanjing, China. Front. Ecol. Evol. 10:1002231. doi: 10.3389/fevo.2022.1002231
Received
24 July 2022
Accepted
25 August 2022
Published
03 October 2022
Volume
10 - 2022
Edited by
Yusen He, Grinnell College, United States
Reviewed by
Yahui Zhang, Sophia University, Japan; Jiahao Deng, DePaul University, United States
Updates
Copyright
© 2022 Xue, Yan and Chen.
This is an open-access article distributed under the terms of the Creative Commons Attribution License (CC BY). The use, distribution or reproduction in other forums is permitted, provided the original author(s) and the copyright owner(s) are credited and that the original publication in this journal is cited, in accordance with accepted academic practice. No use, distribution or reproduction is permitted which does not comply with these terms.
*Correspondence: Jun Yan, yanjun1st@njfu.edu.cn
This article was submitted to Environmental Informatics and Remote Sensing, a section of the journal Frontiers in Ecology and Evolution
Disclaimer
All claims expressed in this article are solely those of the authors and do not necessarily represent those of their affiliated organizations, or those of the publisher, the editors and the reviewers. Any product that may be evaluated in this article or claim that may be made by its manufacturer is not guaranteed or endorsed by the publisher.