 Jiawei Wu
 Chonggang Liu
 Wei Sun
- 1Key Laboratory of Watershed Geographic Sciences, Nanjing Institute of Geography and Limnology, Chinese Academy of Sciences, Nanjing, China
- 2University of Chinese Academy of Sciences, Beijing, China
Construction land expansion and use efficiency are tied to the promotion of sustainable cities and communities. This article explores how and why the spatiotemporal variation of construction land use efficiency (CLUE) evolved in the Yangtze River Delta (YRD), China between 2000 and 2020. Our descriptive results show that county-level regions with higher CLUE are concentrated in major cities in the core YRD, as well as ecologically sensitive regions in the peripheral YRD. Although CLUE improvement in peripheral regions has been more remarkable since the early 2010s, the efficiency gap in construction land use between the core YRD (central cities) and the peripheral YRD (suburban counties) has doubled. The modeling results indicate the temporally and spatially heterogeneous impacts of various factors related to economic incentives and eco-environmental constraints on the uneven CLUE. Economic level and ecological sensitivity are positively associated with regional CLUE. The continuing growth of service industries and the spatial agglomeration of knowledge-intensive and foreign-invested firms are increasingly vital for CLUE improvement in the core YRD, while the prosperity of manufacturing industries is more important for the peripheral YRD. The “crowding out effect” of environmental pollution on CLUE could be proved in the peripheral rather than the core YRD. Our findings suggest that proper policies should be tailored to specific places to coordinate construction land use, economic growth, and eco-environmental sustainability.
Introduction
Global construction land (i.e., built-up area) has experienced a rapid increase in the last century, largely resulting from population urbanization and economic agglomeration (Lambin and Meyfroidt, 2011; Liu et al., 2020; Mahtta et al., 2022). Unordered land sprawl and inefficient land use, meanwhile, generated various negative impacts including eco-environmental degradation and cultivated land shrinking at multiple spatial scales (Estoque et al., 2021). An increasingly intensive contradiction between land shortage and inefficient use was observed worldwide, especially in the Global South and developing economies (Liu et al., 2014; Fetzel et al., 2016). Rational and efficient land use become the key to achieving sustainable cities and communities (UN-Habitat, 2016; Akuraju et al., 2020; Rahman and Szabó, 2021). The spatiotemporal variations and determinants of construction land-use efficiency (CLUE) have attracted much attention from scholars and policy-makers.
A large body of literature has focused on the driving forces of uneven CLUE from the perspective of locally socioeconomic and institutional contexts (Wu et al., 2017; Masini et al., 2019). The impacts of economic incentives, such as income growth, technical progress, and industrial upgrading, on CLUE have been well-studied empirically (Koroso et al., 2020; Yue et al., 2022; Zhang et al., 2022). To our knowledge, the aggregate movements of the economy at the macro-level are mainly driven by firm-specific changes (Capasso et al., 2015). However, attempts to address the influences of firm heterogeneities, including firm size, industrial attribute, and ownership structure, at the micro-level on CLUE are thin on the ground. In addition, following the social-ecological systems framework, land-use practices should be viewed as the feedback of changes in ecosystem goods and services (Lambin and Meyfroidt, 2010). There is a vast literature focusing on the implications of land-use transition (e.g., efficiency improvement) for global and regional eco-environmental status (Lambin and Meyfroidt, 2010; Searchinger et al., 2018). In contrast, with few exceptions (Peng et al., 2017; Wang K. et al., 2021), researches on the driving mechanisms of eco-environmental constraints behind land-use efficiency are quite limited.
China’s rapid urbanization and industrialization provide a rich context. The high-growth and resource-intensive developmental trajectory that China pursued has led to a series of eco-environmental issues related to the irrational use of construction land (Liu et al., 2014; Dong et al., 2020), especially in socioeconomically developed metropolises and urban agglomerations (Gao et al., 2020; Ning et al., 2022). This forces the Chinese government to further strengthen natural resource supervision and pay more attention to sustainable use. Therefore, construction land expansion has been increasingly restricted by local eco-environment and relevant regulations (Xie et al., 2021). Promoting industrial agglomeration and upgrading has become an important measure for the intensive use of construction land (Liu J. et al., 2021; Zhang et al., 2022). The investigation and interpretation of geographically uneven CLUE in China need to take local eco-environmental constraints and industrial dynamics into account, however, the number of empirical researches on relevant issues, particularly at finer spatial scales, is still small.
To fill the aforementioned research gaps, this article aims to examine the spatiotemporal variation of CLUE and its driving forces in regional China, with particular attention given to local eco-environmental constraints and economic incentives. Taking the Yangtze River Delta (YRD), one of the emerging global city-region in China, as a case study, we focus on two interrelated research questions: (1) How have the spatiotemporal patterns of CLUE changed between 2000 and 2020? (2) What factors drive the changes in CLUE, and how has the relative importance of driving forces differed across regions and changed over time? Regional corporate demography, namely the range, structure, and diversity of corporate organizations in a specific place (Carroll and Hannan, 2000), and spatial dynamics of firms are used to measure economic incentives at the micro-level in this study. Empirical results will advance our understanding of the uneven CLUE under different eco-environmental systems and socioeconomic contexts at regional or local scale. Our findings on the changes in the economic performance of construction land use in regional China can generate policy implications for sustainable land use and urbanization in other emerging economies.
Literature review and conceptual framework
Given the importance of CLUE improvement in achieving sustainable cities and communities, the definition and measurement of CLUE have been profoundly discussed in the literature from the perspective of “input-output system” (Chen et al., 2019; Masini et al., 2019; Zhu et al., 2019). CLUE is usually defined as the economic output or population carried by built-up areas (Wu et al., 2017; He et al., 2020; Koroso et al., 2020; Estoque et al., 2021). Inputs (e.g., labor and capital) in addition to land, as well as unexpected outputs including environmental pollution and ecological degradation, have been increasingly considered in the calculation of CLUE (Yu et al., 2019; Liu S. et al., 2021; Zhang et al., 2021). Previous studies demonstrated that construction land use practices and efficiency significantly differ across continents, countries, regions, and cities (He et al., 2020; Jiao et al., 2020; Estoque et al., 2021; Schiavina et al., 2022). Scholars largely attributed this phenomenon to place-specific disparities in socioeconomic contexts and eco-environmental conditions. Based on seminal works and the Chinese contexts, we develop a conceptual framework to explain spatiotemporal variations of CLUE at a finer geographical scale, with particular attention given to the effects of microeconomic incentives, eco-environmental constraints, and relevant regulations (see Figure 1).
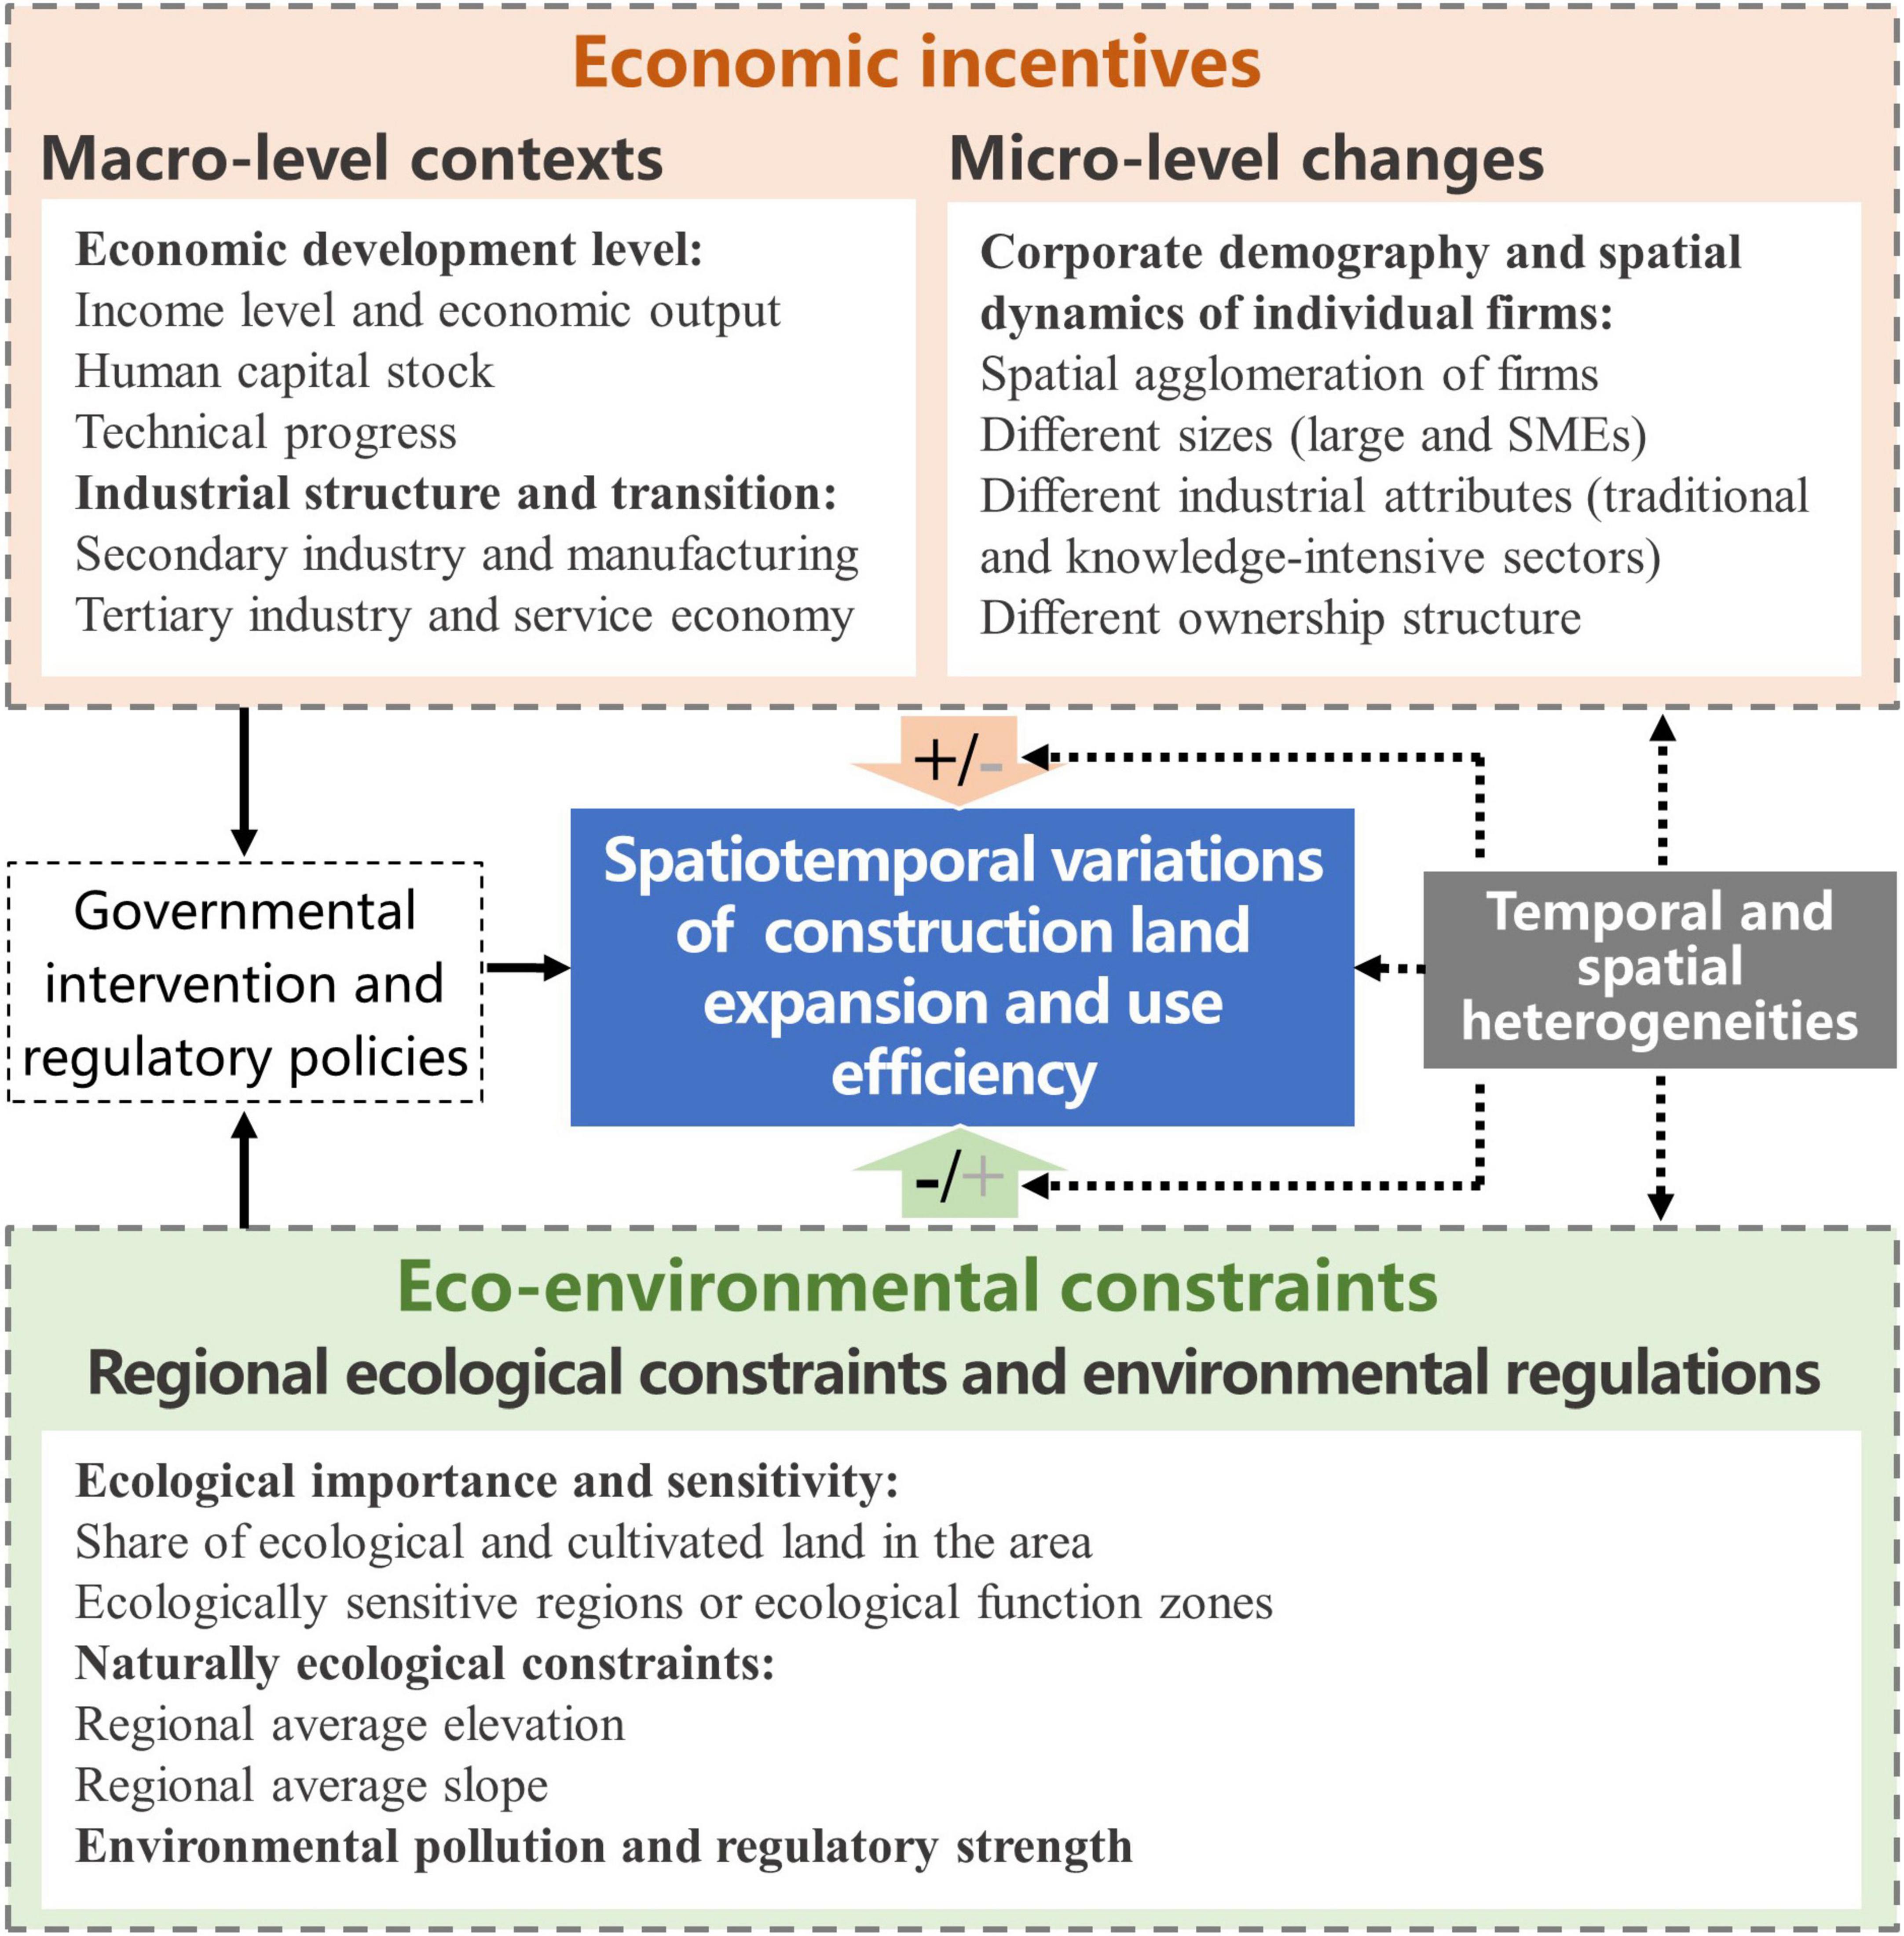
Figure 1. Conceptual framework of construction land expansion and use efficiency in China.
Socioeconomic contexts, corporate demography, and land use efficiency
A large body of literature has examined the impacts of socioeconomic contexts on changing spatial patterns of CLUE across places (Masini et al., 2019; He et al., 2020; Zhang et al., 2022). There is a consensus that regional differences in construction land use performance are tightly associated with economic incentives, such as population agglomeration, industrial structure optimization, and technological progress (Chen et al., 2018; Mahtta et al., 2022). Better economic performance of construction land use tends to be observed in places with higher income level and stronger innovative capability (Masini et al., 2019). Industrial transformation and relocation, especially the exit of traditional manufacturing and the entry of high-tech industries, play a vital role in improving CLUE (Liu J. et al., 2021; Yue et al., 2022). Existing studies mainly examined the effects of economic incentives at the macro-level, however, the relationship between microeconomic incentives (e.g., firm-specific changes) and CLUE has been largely ignored in the literature.
The unique transitional contexts, including globalization, marketization, decentralization, and urbanization (Gao et al., 2014; Wu et al., 2017), should be taken into account to understand better China’s construction land use. Particularly, China’s developmental model has been gradually shifting from high-growth and resource-intensive to high-quality oriented and innovation-driven (Chen et al., 2016; Wu et al., 2016). China tends to be more active in promoting efficient and intensive utilization of land resources. For instance, policy instruments related to technical innovation and industrial upgrading have been issued by Chinese central and local governments to improve CLUE, and relevant research largely confirmed the positive effects of these policies (Peng et al., 2017; Wu et al., 2017; Li J. et al., 2021). To our knowledge, economic transition, industrial restructuring, and technical progress largely result from firm-specific changes (Capasso et al., 2015). Research on the relationship between economic incentives and uneven CLUE should consider regional corporate demography or spatial dynamics of firms.
To be specific, the spatial agglomeration of corporate organizations and their businesses is tightly associated with economic density and land use efficiency, and variegated features such as size, industrial attribute, and ownership structure of firms matter. Compared with middle and small-sized enterprises (SMEs), large firms with advanced technologies and value-added businesses are capable of using resources efficiently. Land use performance of the “new economy,” especially producer service and knowledge-intensive industries, may be better than that of traditional manufacturing. Moreover, foreign-invested enterprises (FIEs) are more likely to show superior performance in land use than domestic enterprises in China due to their advanced technologies and management experiences (Yue et al., 2022).
Eco-environmental conditions, regulations, and land use efficiency
Seminal works based on the social-ecological system framework indicated that regional eco-environmental systems and regulatory policies are important for understanding land-use transition (Lambin and Meyfroidt, 2010, 2011). Land use practices, especially urban land expansion, are severely confined by natural resources endowment, and eco-environmental capacity at regional or local scale (Bryan et al., 2015; Liu et al., 2017; Yang et al., 2022). Relationships between eco-environmental constraints and CLUE have received particular attention in the literature (Lu et al., 2018; Tang et al., 2021; Zhang et al., 2021). Environmental pollution and deterioration may have a significant “crowding out effect” on CLUE (Peng et al., 2017), and CLUE improvement would contribute to pollution reduction (Dong et al., 2020; Li et al., 2021). Relevant institutional settings and policies also matter (Tu et al., 2014; Wang Q. et al., 2021). The implementation of more strict natural resources supervision and environmental regulation would improve CLUE (Wang K. et al., 2021; Zhang et al., 2021). However, attempts to examine the potential impacts of regional eco-environmental conditions and regulations, by contrast with socioeconomic variables, on CLUE are quite limited.
Eco-environmental carrying capacity, territorial exploiting suitability, and regulatory policies significantly vary across the Chinese regions. This largely leads to regional disparities in construction land expansion and use efficiency. On the one hand, land resources available for industrialization and urbanization are even scarcer in China. By implementing rigid zoning plans and regulations, the protection of natural cover and ecological space has taken priority over urban and industrial expansion, especially in ecologically sensitive regions. This enforces local governments to pay more attention to facilitating efficient use of existing construction land to stabilize economic growth. On the other hand, environmental pollution and degeneration in China partly attribute to rapid expansion and inefficient use of construction land. In addition to environmental laws and regulations, optimizing land use practice and performance is also an effective means to solve pollution problems under China’s low-carbon or sustainable developmental strategies. It should be noted that the demand for CLUE improvement in metropolises or developed regions where eco-environmental constraints and agglomeration diseconomies presented earlier is more urgent. In contrast, socioeconomic development in lower-tier cities or less-developed regions relies more on cheaper productive elements and looser environmental regulations, probably resulting in inefficient use of land resources.
Research materials and methodologies
Study area: The Yangtze River Delta
Located in eastern coastal China, the YRD is an emerging global city-region around the world. With only 3.7% of China’s territory, the YRD carries 16.7% of China’s population and 24.1% of China’s gross domestic product (GDP) in 2020. The YRD is selected as the study area according to the following considerations: First, as the epitome of China’s industrialization and urbanization, the YRD has been experiencing an unpredictable process of economic growth and urban expansion, which resulted in serious eco-environmental deterioration, since the start of Reform and Opening-Up. The YRD accounts for 11.7% of COD emissions and 8.7% of SO2 emissions in China in 2020. The contradiction between urbanization, economic development, and eco-environmental protection is more prominent in the YRD, forcing local governments to become more active in promoting sustainable and efficient utilization of natural resources (e.g., land). Second, although the YRD has advantages in population, GDP, and urban size, it still lags far behind the recognized global-city-regions in the USA and Europe in terms of economic efficiency and innovative capability. The growth trajectories and predicaments of the YRD are more similar to those of emerging economies. Third, the regional difference in eco-environmental condition and socioeconomic development level is a vital feature of the YRD, as in most emerging economies. Land use practice and performance are no exception to that feature. Therefore, we believe that the evidence from the YRD can serve as a strong reference for China and a large number of emerging economies (or global-city regions).
Figure 2 presents the location of the YRD, as well as the spatial pattern of construction land expansion. The YRD includes four province-level regions, namely Shanghai, Jiangsu, Zhejiang, and Anhui. To examine the spatiotemporal variation of CLUE at a finer geographical scale, we group the YRD into core (central city) or peripheral (suburban) subregions according to their administrative affiliations, eco-environmental conditions, and socioeconomic levels. Urban districts are merged and defined as the central city areas to distinguish them from suburban counties. We find that the total area of construction land in the YRD has increased from 30,498.8 km2 in 2000 to 39,425.8 km2 and 57,586.7 km2 in 2010 and 2020, respectively. The expansion of construction land significantly differed across regions and changed over time. The growth rate of construction land area in the core YRD was higher than that in the peripheral YRD during 2000–2010 and 2010–2020. However, this gap has been narrowed due to the rapid expansion of construction land in the peripheral YRD. The growth rates of construction land area in the central cities and counties of the peripheral YRD, respectively increased from 30.22 and 16.17% during 2000–2010 to 51.23 and 38.08% during 2010–2020.
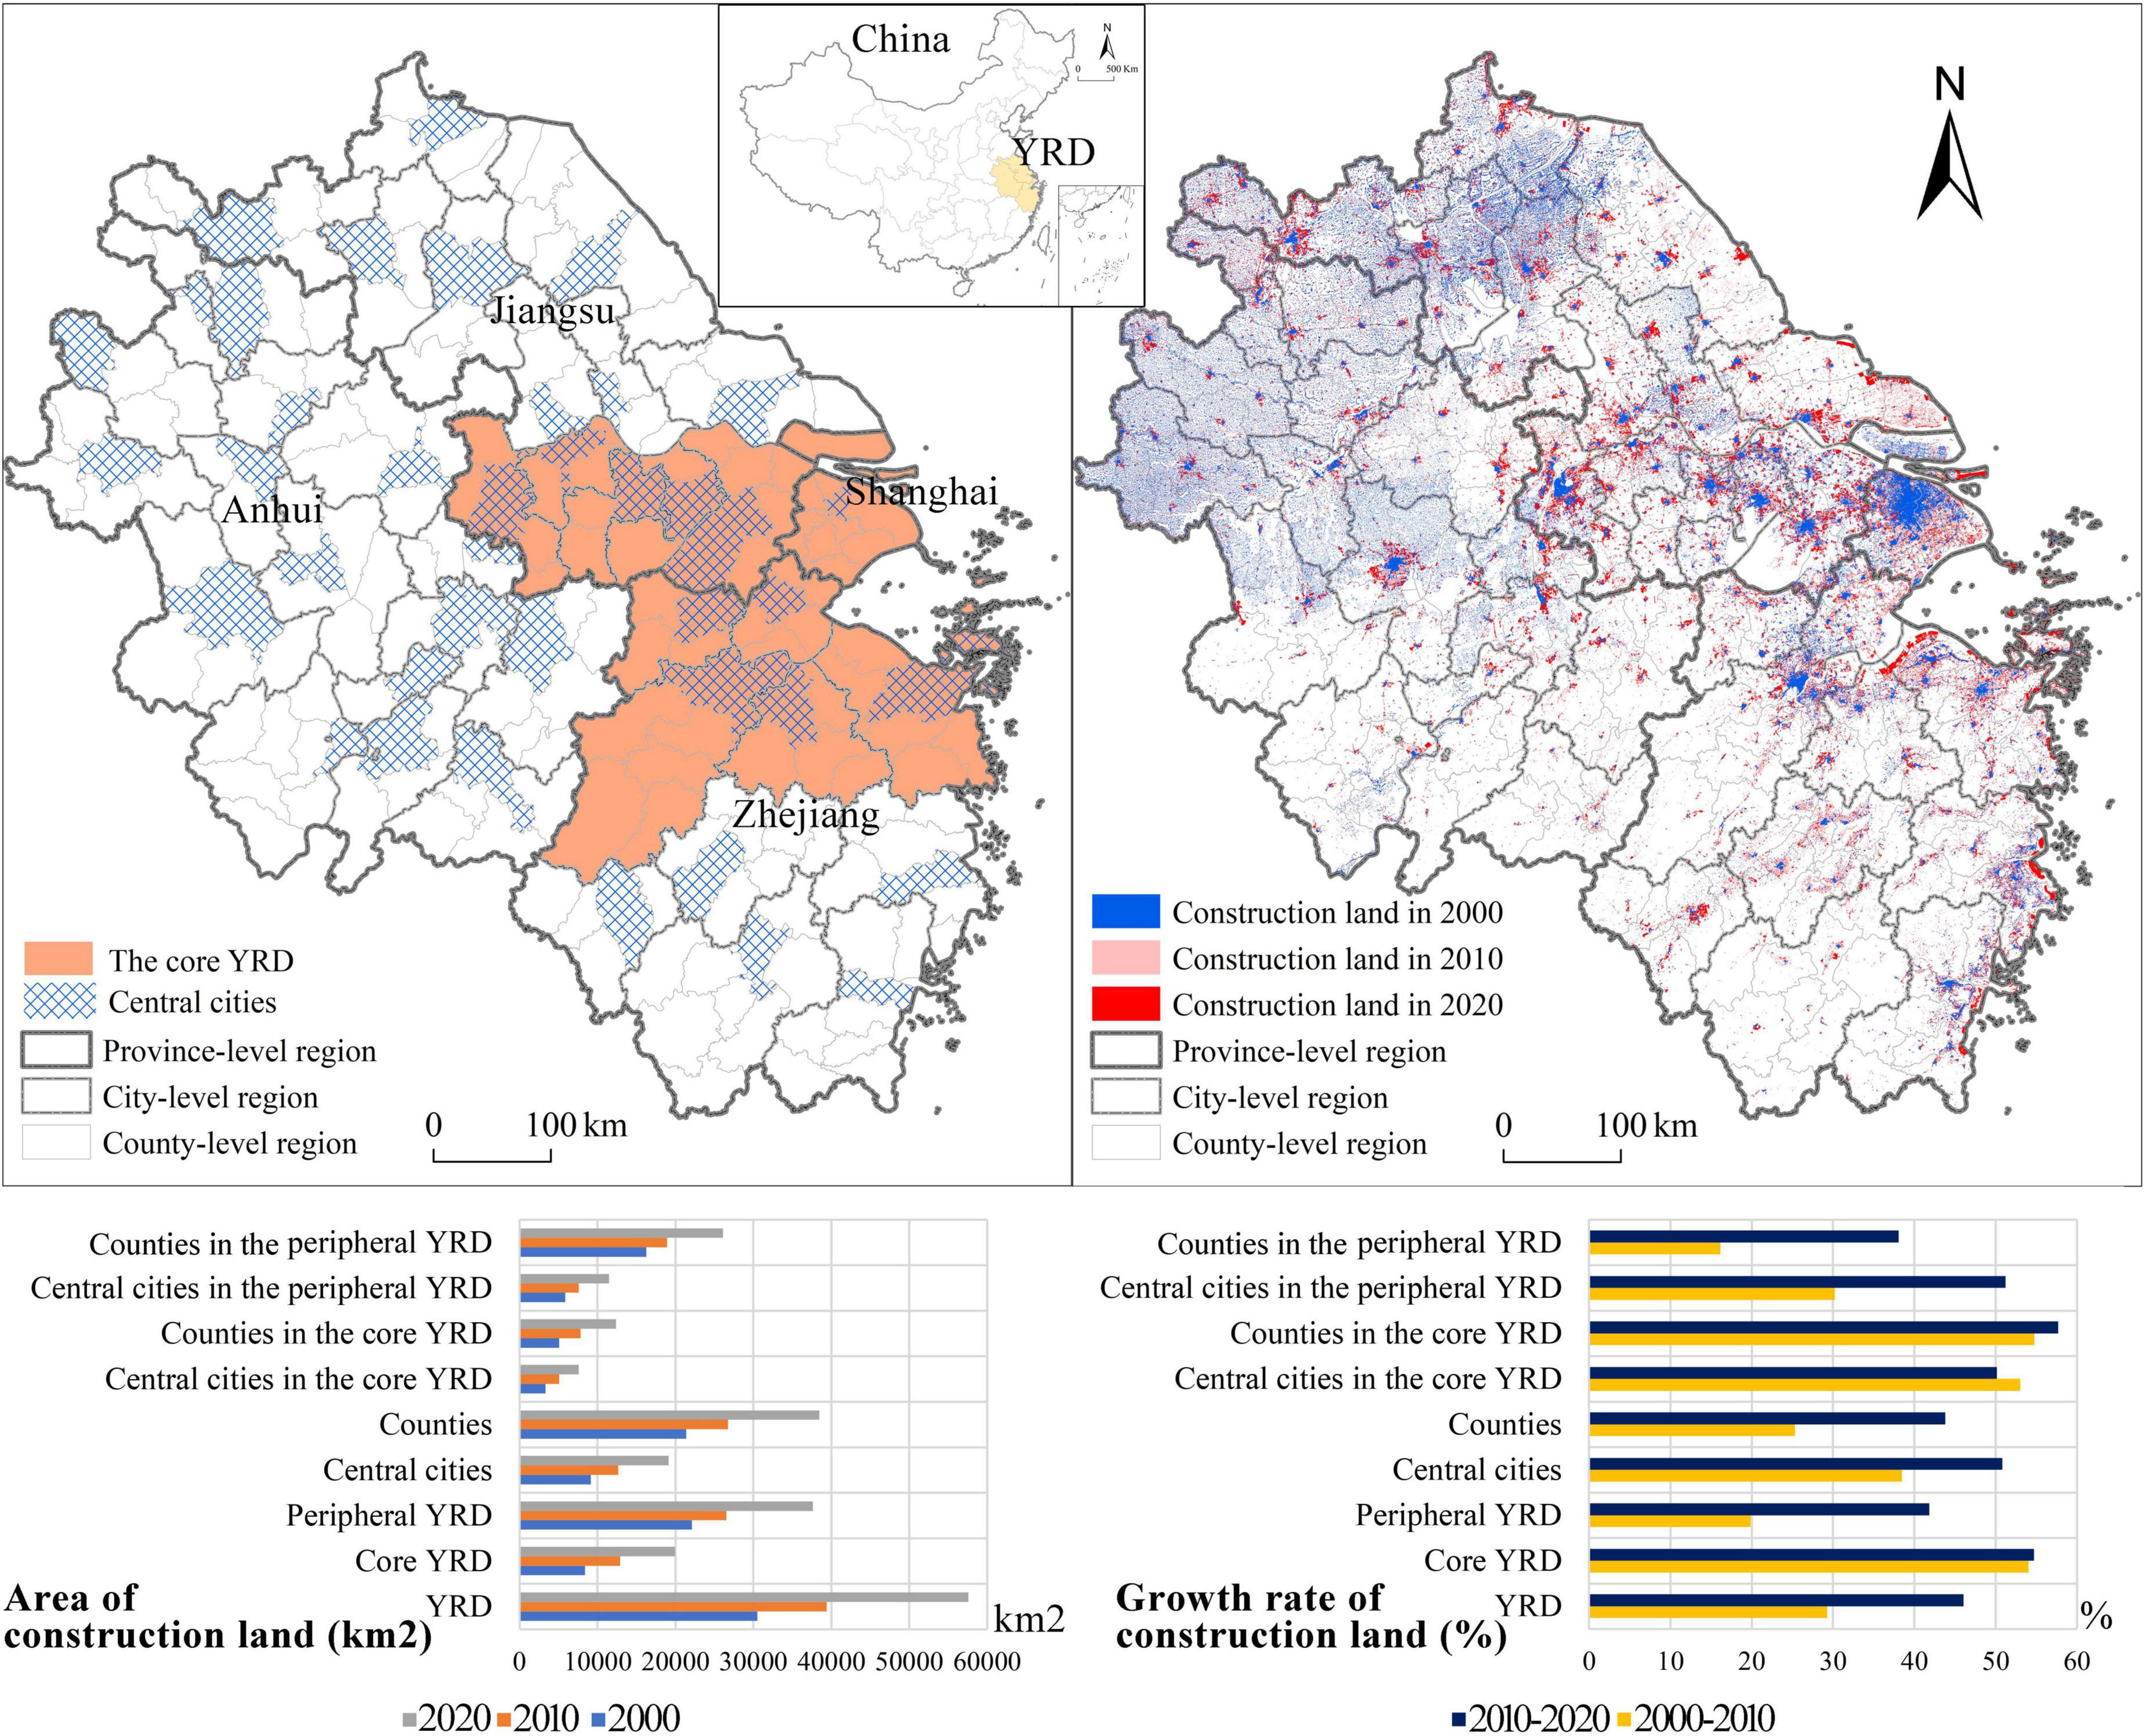
Figure 2. Location and construction land expansion of the study area.
Data source and processing
Construction land and natural cover data for analysis are drawn from Chinese 30 m GlobalLand30 datasets (2000, 2010, and 2020). GlobalLand30 comprises datasets collected at 30-m resolution, which are valuable for monitoring environmental (or land use) changes and for resource management at multiple spatial scales (Jun et al., 2014). GlobalLand30 is the first global geo-information public product provided by China to the United Nations with extensive use1, and it can be obtained online for free. Based on ten types of land cover in the GlobalLand30 datasets, the artificial surface is regarded as construction land or built-up area in this study.
In addition, the datasets of fine particulate matter (PM2.5) originated from the Atmospheric Composition Analysis Group (van Donkelaar et al., 2021). We acquire socioeconomic developmental statistics, especially the total output value of the secondary and tertiary industries, from the China City Statistical Yearbook (CCSY) and published statistical materials of relevant provinces or cities. The data relating to industrial output value are calculated based on the year 2000 constant price to eliminate the influences of currency inflation. We collect the data on the size, industrial attributes, and ownership structures of individual firms in a specific place from Qichacha, which is one of the authoritative inquiry systems of corporate credit and information in China.
Methodologies
Measurement of construction land-use efficiency
According to the existing literature, economic output per unit of land is an effective or comparable indicator that can directly estimates land-use performance (Wu et al., 2017; Chen et al., 2018; Masini et al., 2019). Considering the non-agricultural socioeconomic activities carried by built-up area, we apply the total output value of secondary and tertiary industries per hectare of construction land to measure CLUE:
where, IOVit is the total output value of secondary and tertiary industries of research unit i in year t.CLAit is the total construction land area of research unit i in year t.
Spatial autocorrelation and clustering analysis
The Global Moran’s I (GMI) and the Local Moran’s I (LMIi), which are used to investigate the spatial autocorrelation of CLUE in the YRD, can be defined as equations (2) and (3), respectively.
where, Xi and Xj are CLUE of research units i and j, respectively. stands for the average CLUE by research units in the YRD. n is the number of research units. wij represents the spatial adjacency matrix. According to the result of LMIi, the spatial pattern of CLUE can be described by four types of research units, namely high-high (H-H), high-low (H-L), low-high (L-H), and low-low (L-L). For instance, the H-H indicates that the CLUE of regions surrounding regions with high CLUE is relatively high.
In addition, the Hot Spot analysis tool (Getis-Ord Gi* statistic) is applied to explore the spatial clustering dynamics of CLUE changes. The standardized can be calculated as:
where, C_Xj is the increase or decrease of CLUE of research unit j from year t to year t + 1. and S, respectively stand for the average increase/decrease and standard deviation of CLUE by research units. The research unit, which has a high (low) C_X value and is surrounded by other units with relatively high (low) C_X values, can be grouped as a statistically significant hot (cold) spot.
Regression model and variable specification
OLS and spatial regression models are applied to uncover the driving forces of the spatiotemporal variation of CLUE. OLS regression model can be estimated as:
where, yi represents the dependent variable (CLUEi). xik and βk stand for the observed value of independent variable k and its regression coefficient. m is the number of independent variables. β0 and εi are the constant term and the error term, respectively.
The spatial lag model (SLM) and spatial error model (SEM), which are used to avoid the potential deviation of estimation based on the OLS model, can be built as follows:
where, y and xk represent the dependent variable and independent variable, respectively. βk is the estimated coefficient of the independent variable. ε and μ are error terms. ρ and γ stand for the estimated coefficients of the spatial lag term of dependent variable and spatial autocorrelation error term (ε). w and wε are the spatial matrix of the dependent variable and residual error, respectively. Lagrange Multiplier (LM) test and Robust LM test of OLS regression residuals are taken to check the suitability of SLM and SEM.
Furthermore, we apply the geographically weighted regression (GWR) model to uncover the spatial effects of influential factors on CLUE in different research units. The GWR model can be built as follows:
where, yi and xik are dependent variable and independent variable k of research unit i. (ui,vi) indicates the spatial location of research unit i, and εi stands for error term.
According to our conceptual framework and previous studies, we model the CLUE as the function of variables related to economic incentives and eco-environmental constraints. Per capita GDP, which is positively correlated with regional advantages in economic output, human capital stock, and technological progress (Cheung and Ping, 2004; Tahir et al., 2020), is used to measure economic development level. We use the share of the output value of secondary/tertiary industry to GDP to represent the transition of regional industrial structure. The effects of regional corporate demography and spatial dynamics of firms are measured by firm density, as well as a set of location quotient indexes related to the amount of large, knowledge-intensive, and foreign-invested enterprises. Place-specific ecological importance and sensitivity are measured by the share of ecological land (e.g., forest, grassland, shrubland, wetland, and tundra) and cultivated land in the area. The effects of ecological constraints on construction land expansion and use efficiency are modeled by regional average elevation and slope. The regional annual average PM2.5 concentration is applied to measure the level of environmental pollution and regulatory strength. The definitions and descriptions of independent variables are presented in Table 1.
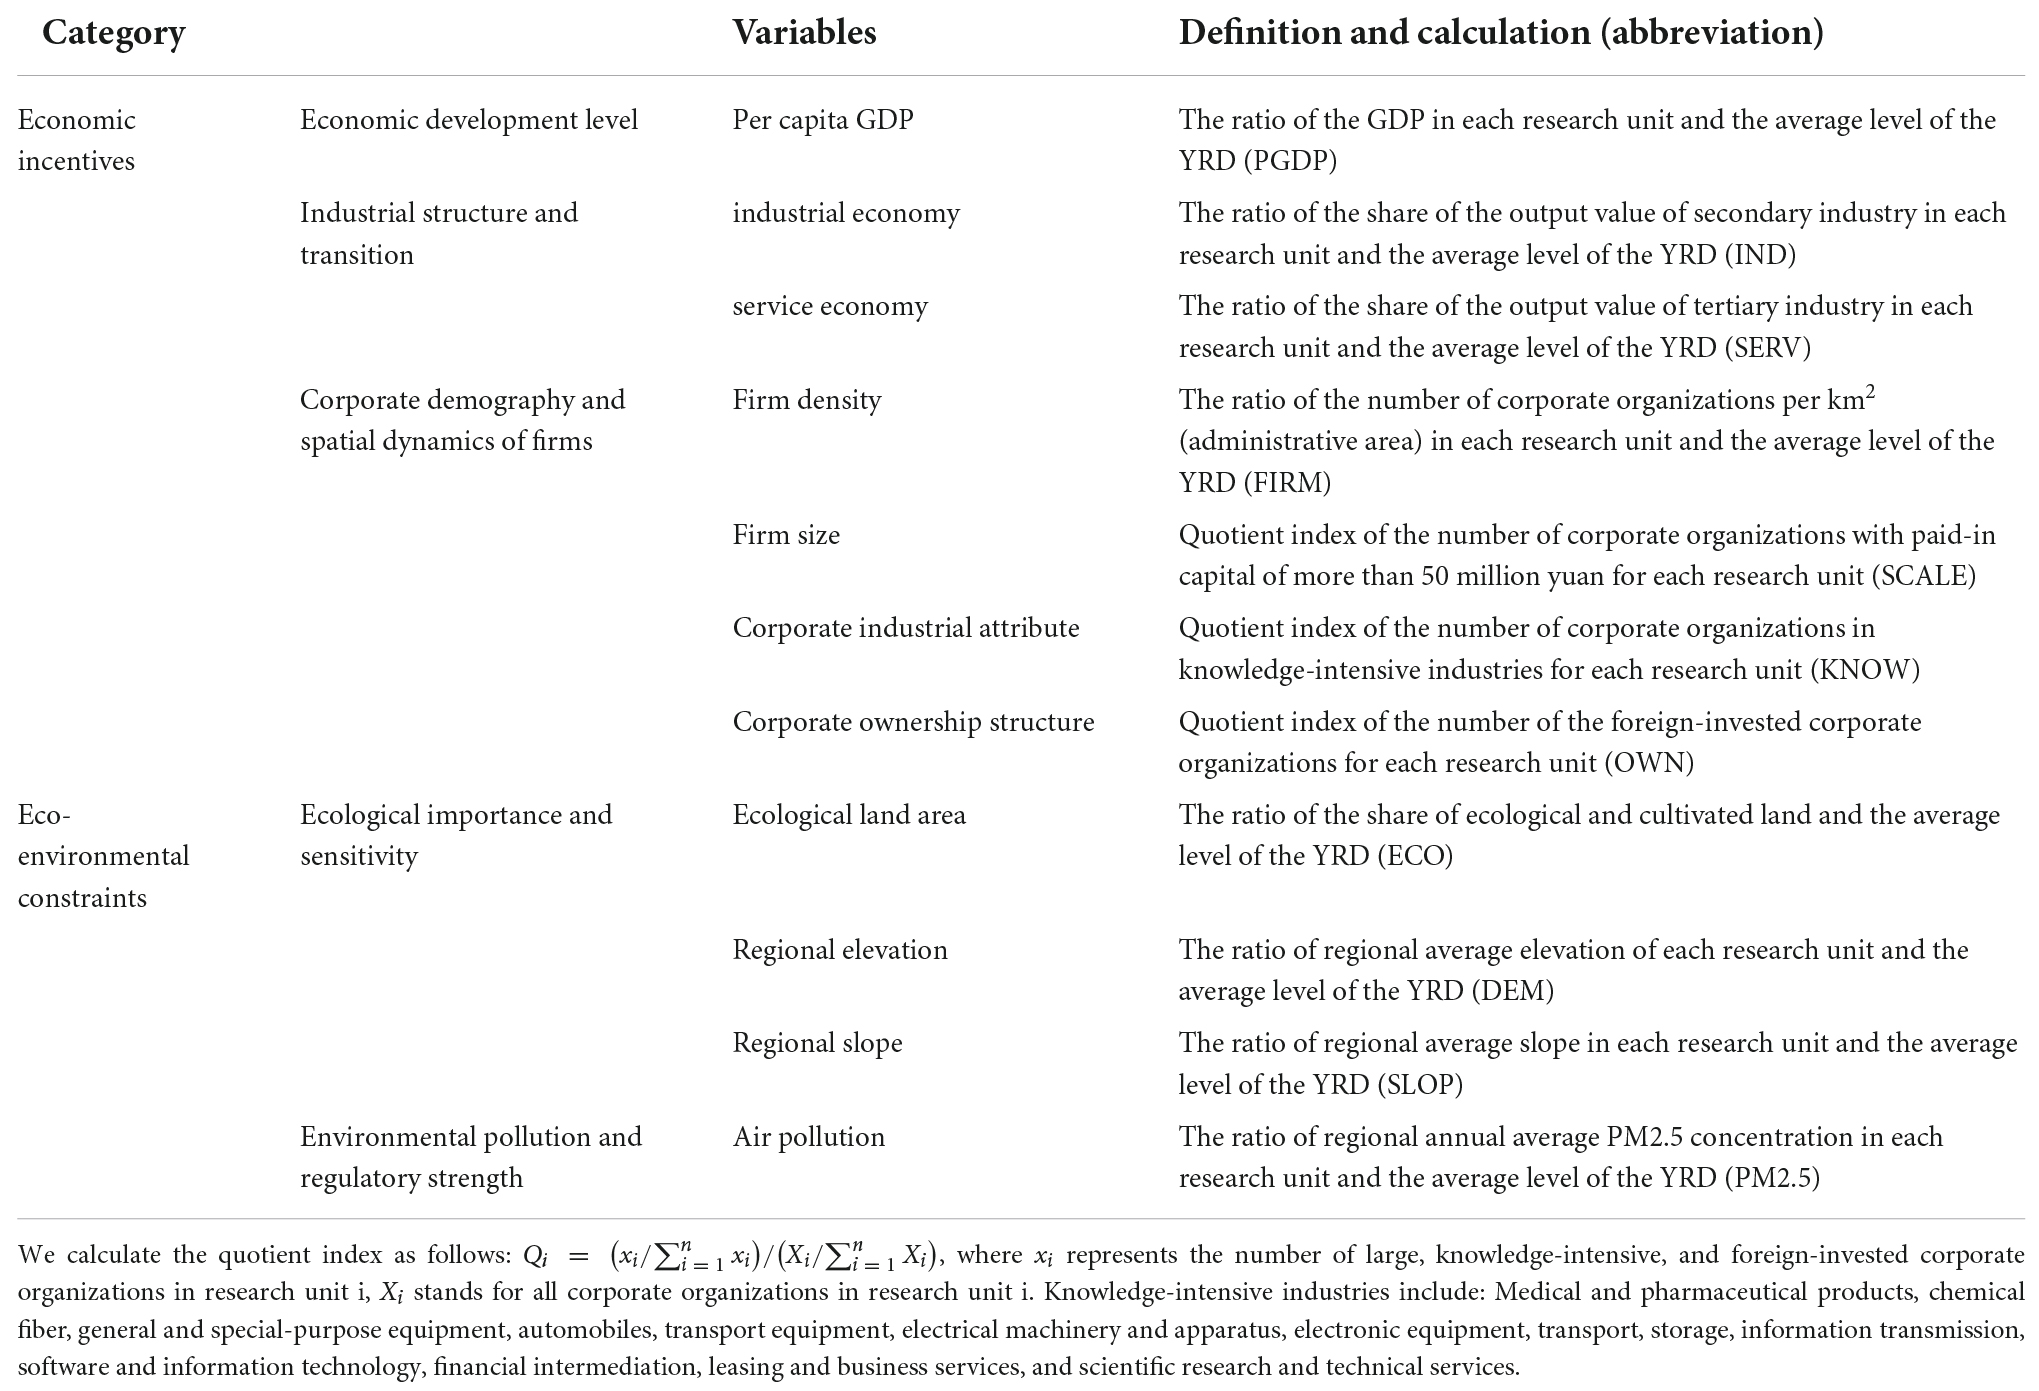
Table 1. The definitions of independent variables.
Empirical results and interpretation
Spatiotemporal variations of construction land use efficiency in the Yangtze River Delta
Spatiotemporal characteristics of construction land use efficiency
Figure 3 shows the overall changing trends of CLUE in the YRD. The CLUE of the YRD increased from 0.65 million RMB per hectare in 2000 to 1.92 million and 2.60 million RMB per hectare in 2010 and 2020, respectively. The annual growth rate of CLUE (7.1%) was higher than that of the construction land area (3.2%). More than 95% of research units have experienced CLUE growth. These results indicate that the economic performance of construction land use in the YRD has been significantly improved since the early 2000s. However, the upper quartile of CLUE by county-level regions and the number of places with CLUE greater than five million RMB per hectare decreased from 2010 to 2020. Moreover, the standard deviation of CLUE by county-level regions increased from 0.89 in 2000 to 1.93 and 2.10 in 2010 and 2020, respectively. These results imply that the economic performance of construction land use might vary across regions in the YRD.
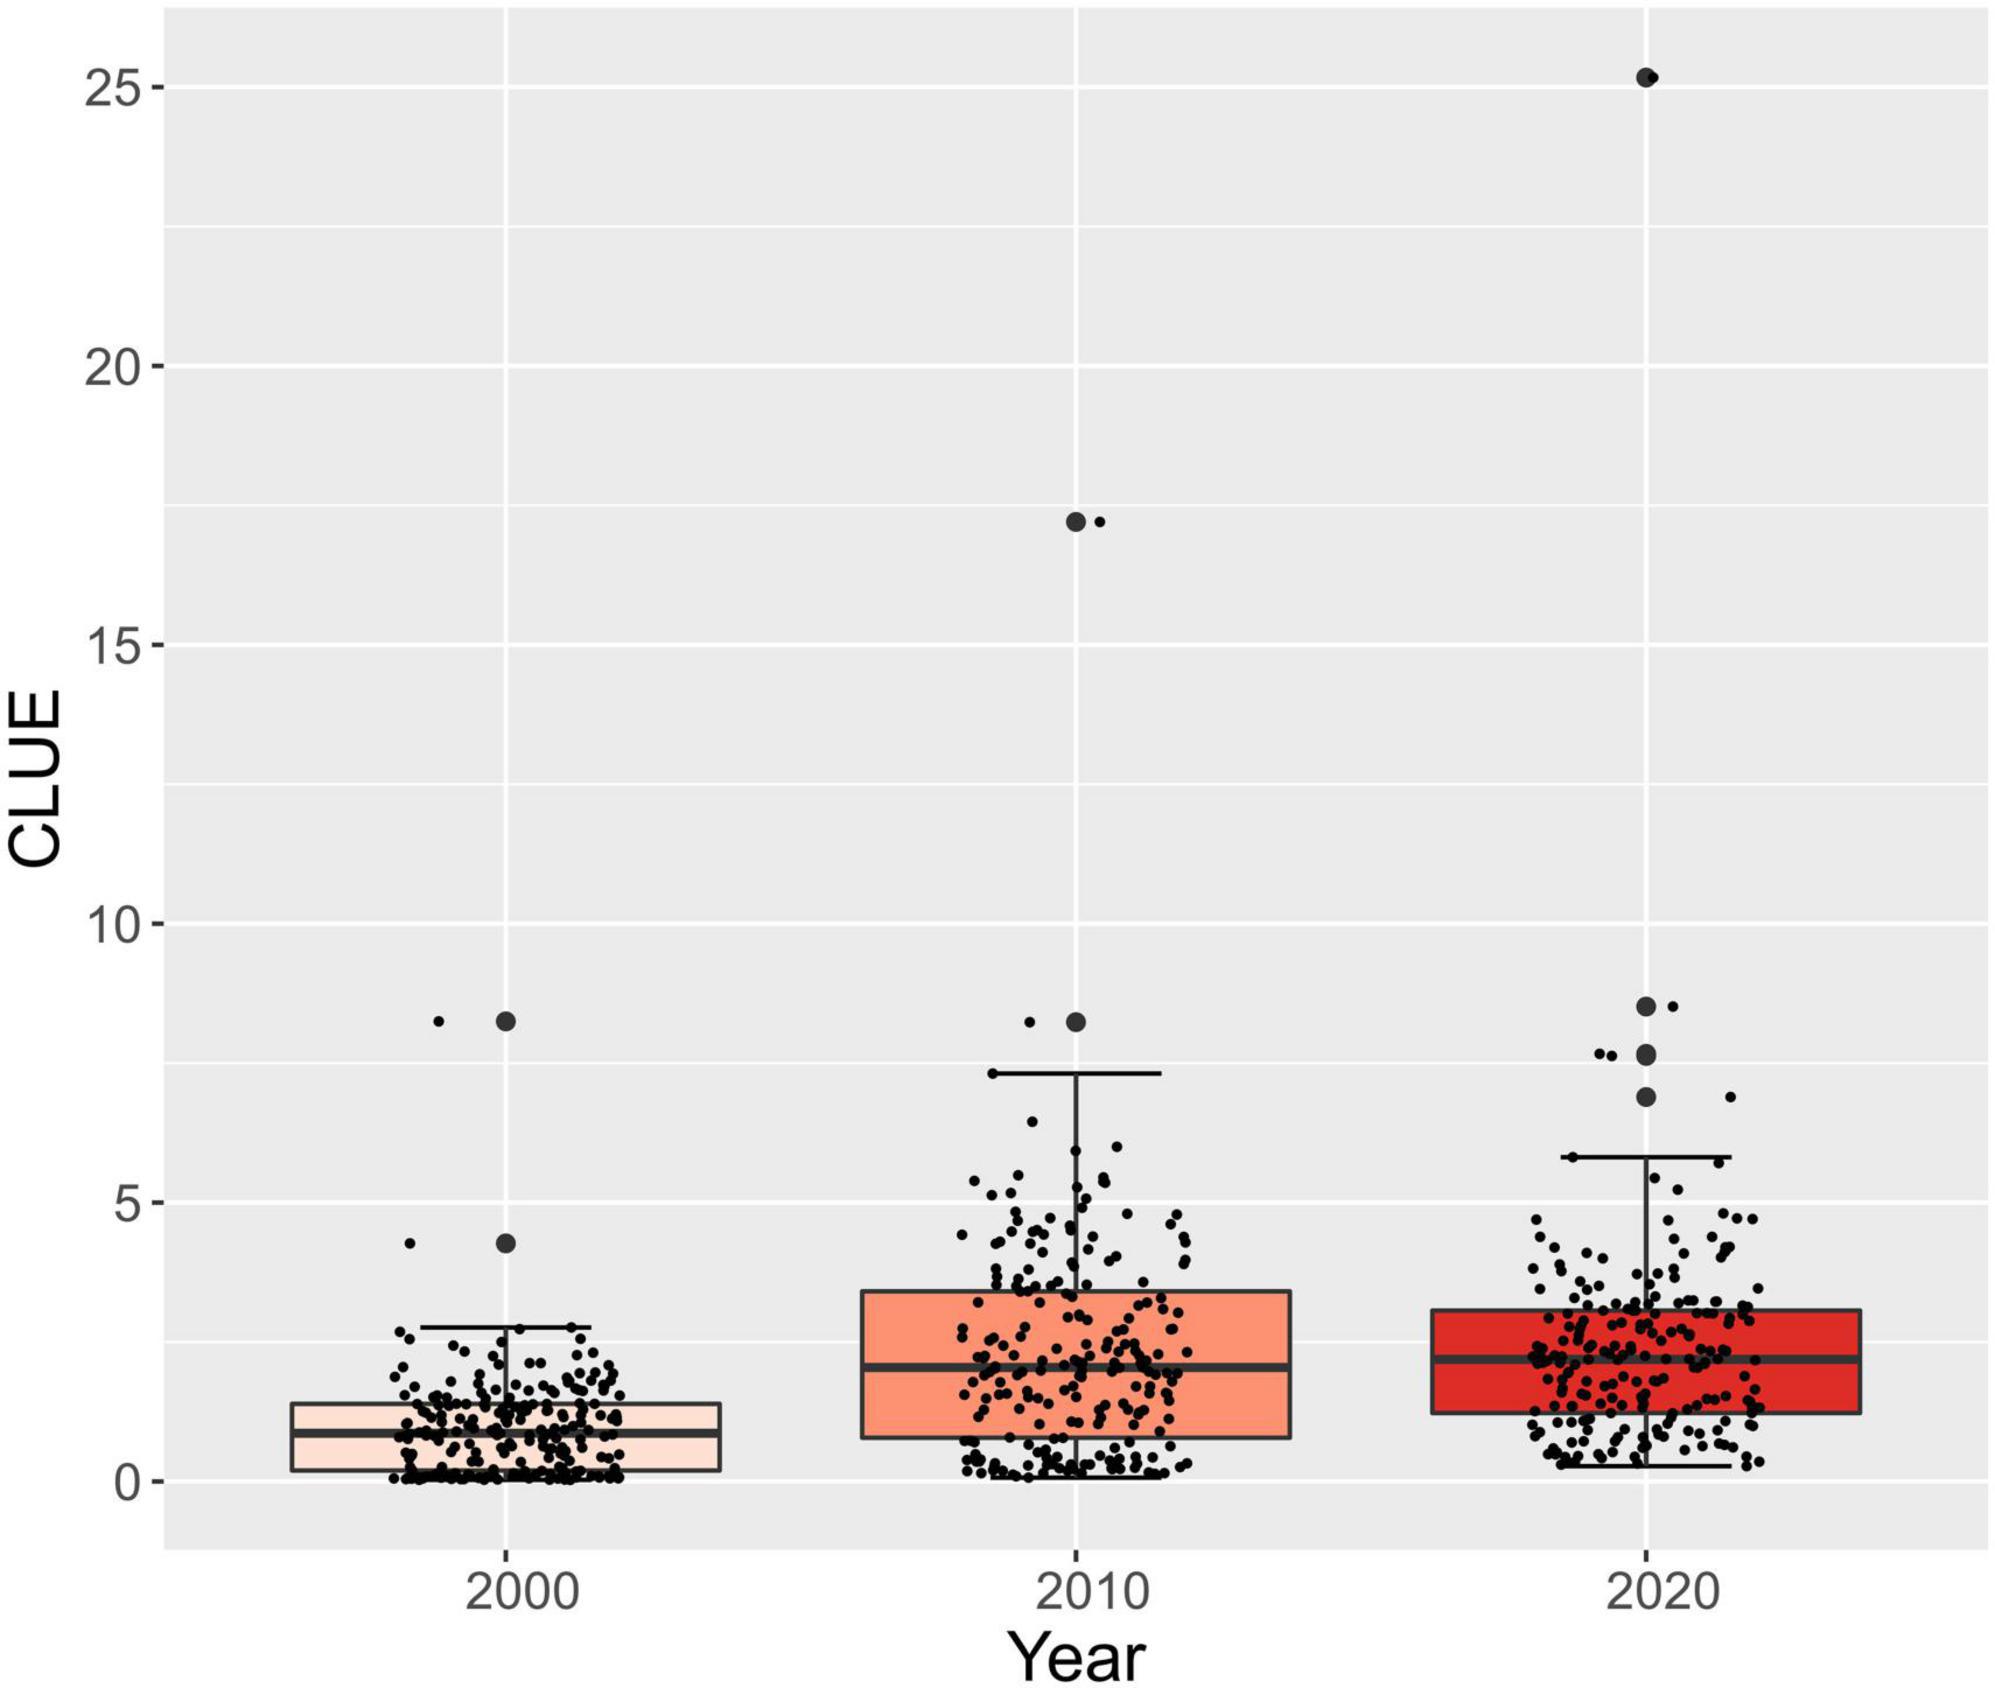
Figure 3. Boxplot of the changing trends of CLUE (million RMB per hectare) in the YRD in 2000, 2010, and 2020.
As Figure 4 illustrates, the spatial pattern of CLUE significantly changed over time in the YRD. Except for the central city of Shanghai and a few counties in Southern Zhejiang, CLUE of county-level regions in the YRD was relatively low in 2000. Particularly, CLUE in 50% of counties located in Anhui province and central and Northern Jiangsu was less than 0.3 million RMB per hectare. We observed a markable improvement of county-specific CLUE in 2010. CLUE improvements in central cities and counties in Shanghai, Southern Jiangsu, and Northern and Southwestern Zhejiang were the most prominent, while that of county-level regions in Northern Jiangsu and Northern Anhui was not obvious. In 2020, central cities of metropolises presented better performance of construction land use. CLUE of the central cities of Shanghai, Nanjing, Hangzhou, Hefei, Suzhou, and Wuxi all exceeded 5 million RMB per hectare. Figure 4 also shows that the GMI indexes were significantly positive and kept rising from 2000 to 2020. Moreover, the H-H county-level regions of CLUE were largely distributed in Shanghai, Southern Jiangsu, and Southwestern Zhejiang, while the L-L county-level regions were mainly located in Northern Jiangsu and Northern Anhui. These results signify that places with relatively higher or lower CLUE tended to spatially agglomerate in the YRD, which is largely associated with the spatial autocorrelation and spillover effect of land use practice at the regional scale.
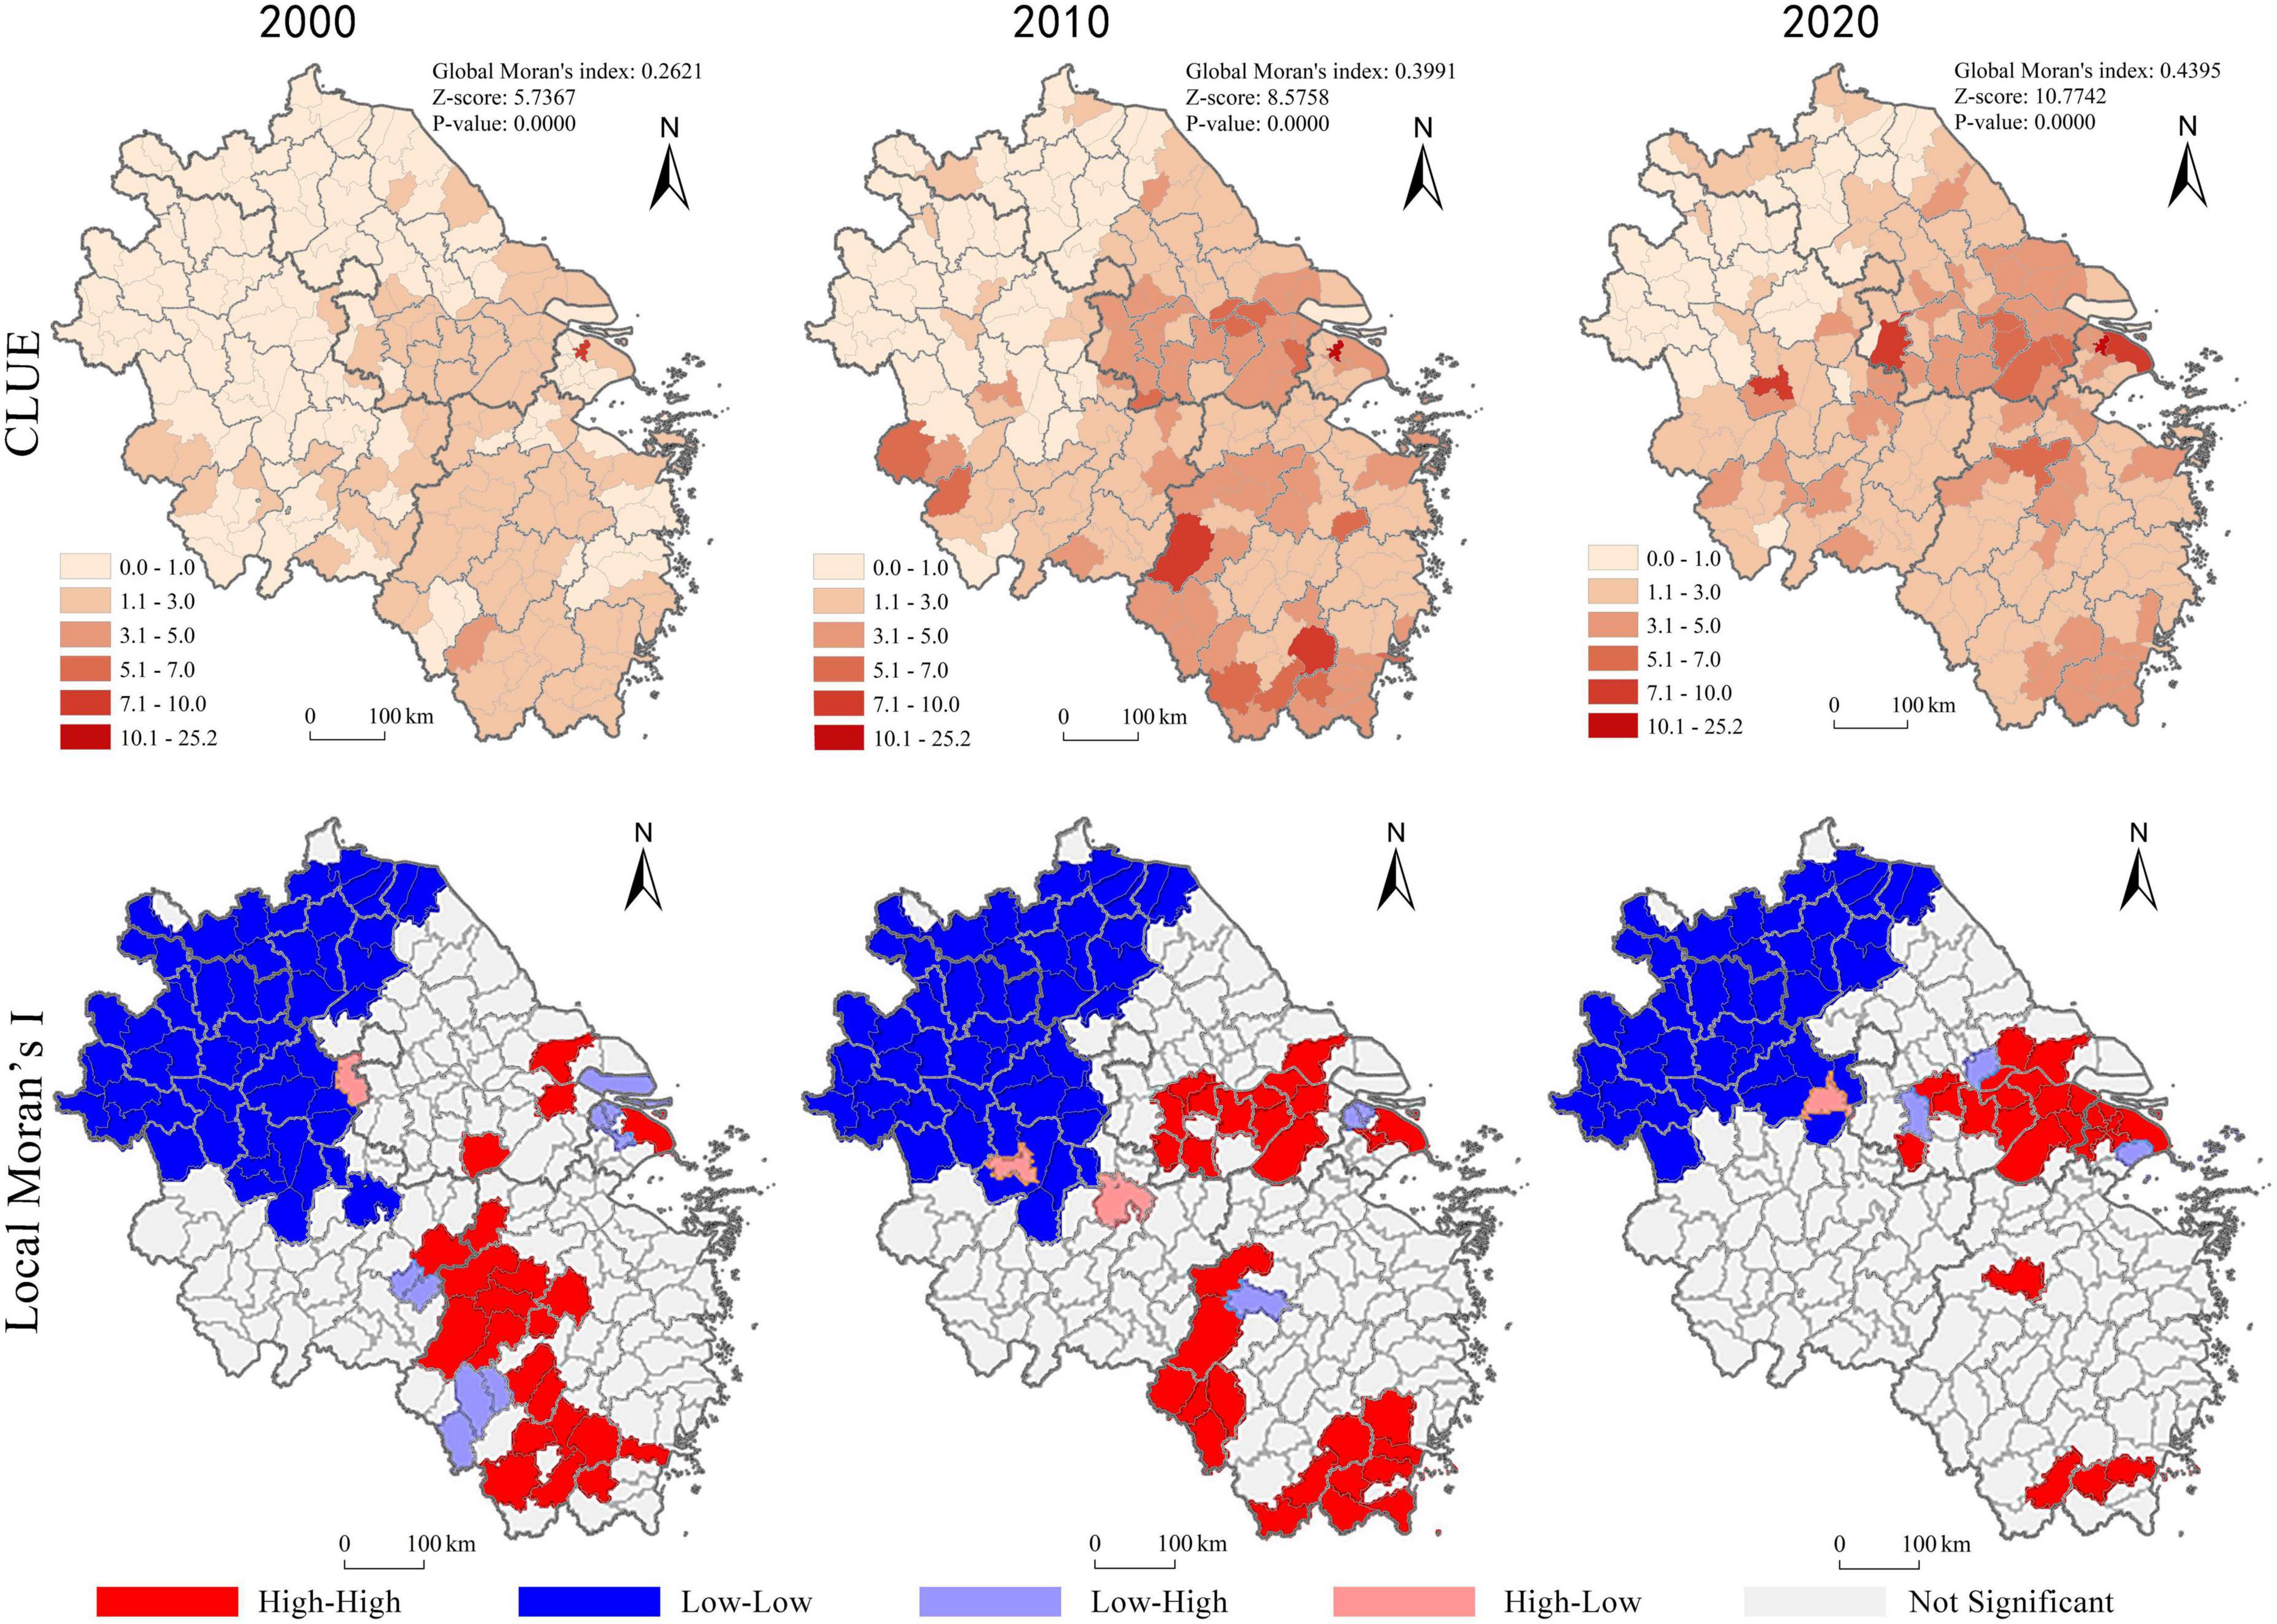
Figure 4. The spatial patterns of CLUE (million RMB per hectare) in the YRD in 2000, 2010, and 2020.
Spatial clustering of construction land use efficiency changes
Figure 5 shows the results of the Hot Spot analysis based on CLUE increase or decrease by county-level regions in the YRD. Between 2000 and 2010, hot spots were largely located in Shanghai, Southern Jiangsu, and Southwestern Zhejiang, while cold spots were in Northern Jiangsu and Northern Anhui; CLUE of county-level regions located in Shanghai and Southern Jiangsu has increased by an average of 2 million RMB per hectare. Between 2010 and 2020, hot spots were mainly distributed in Shanghai, Hefei, and their surrounding regions, while cold spots were transferred to Southwestern Zhejiang and Southern Anhui; It is noteworthy that CLUE of some counties located in Southwestern YRD, which is an ecologically important and sensitive region, experienced a significant decline.
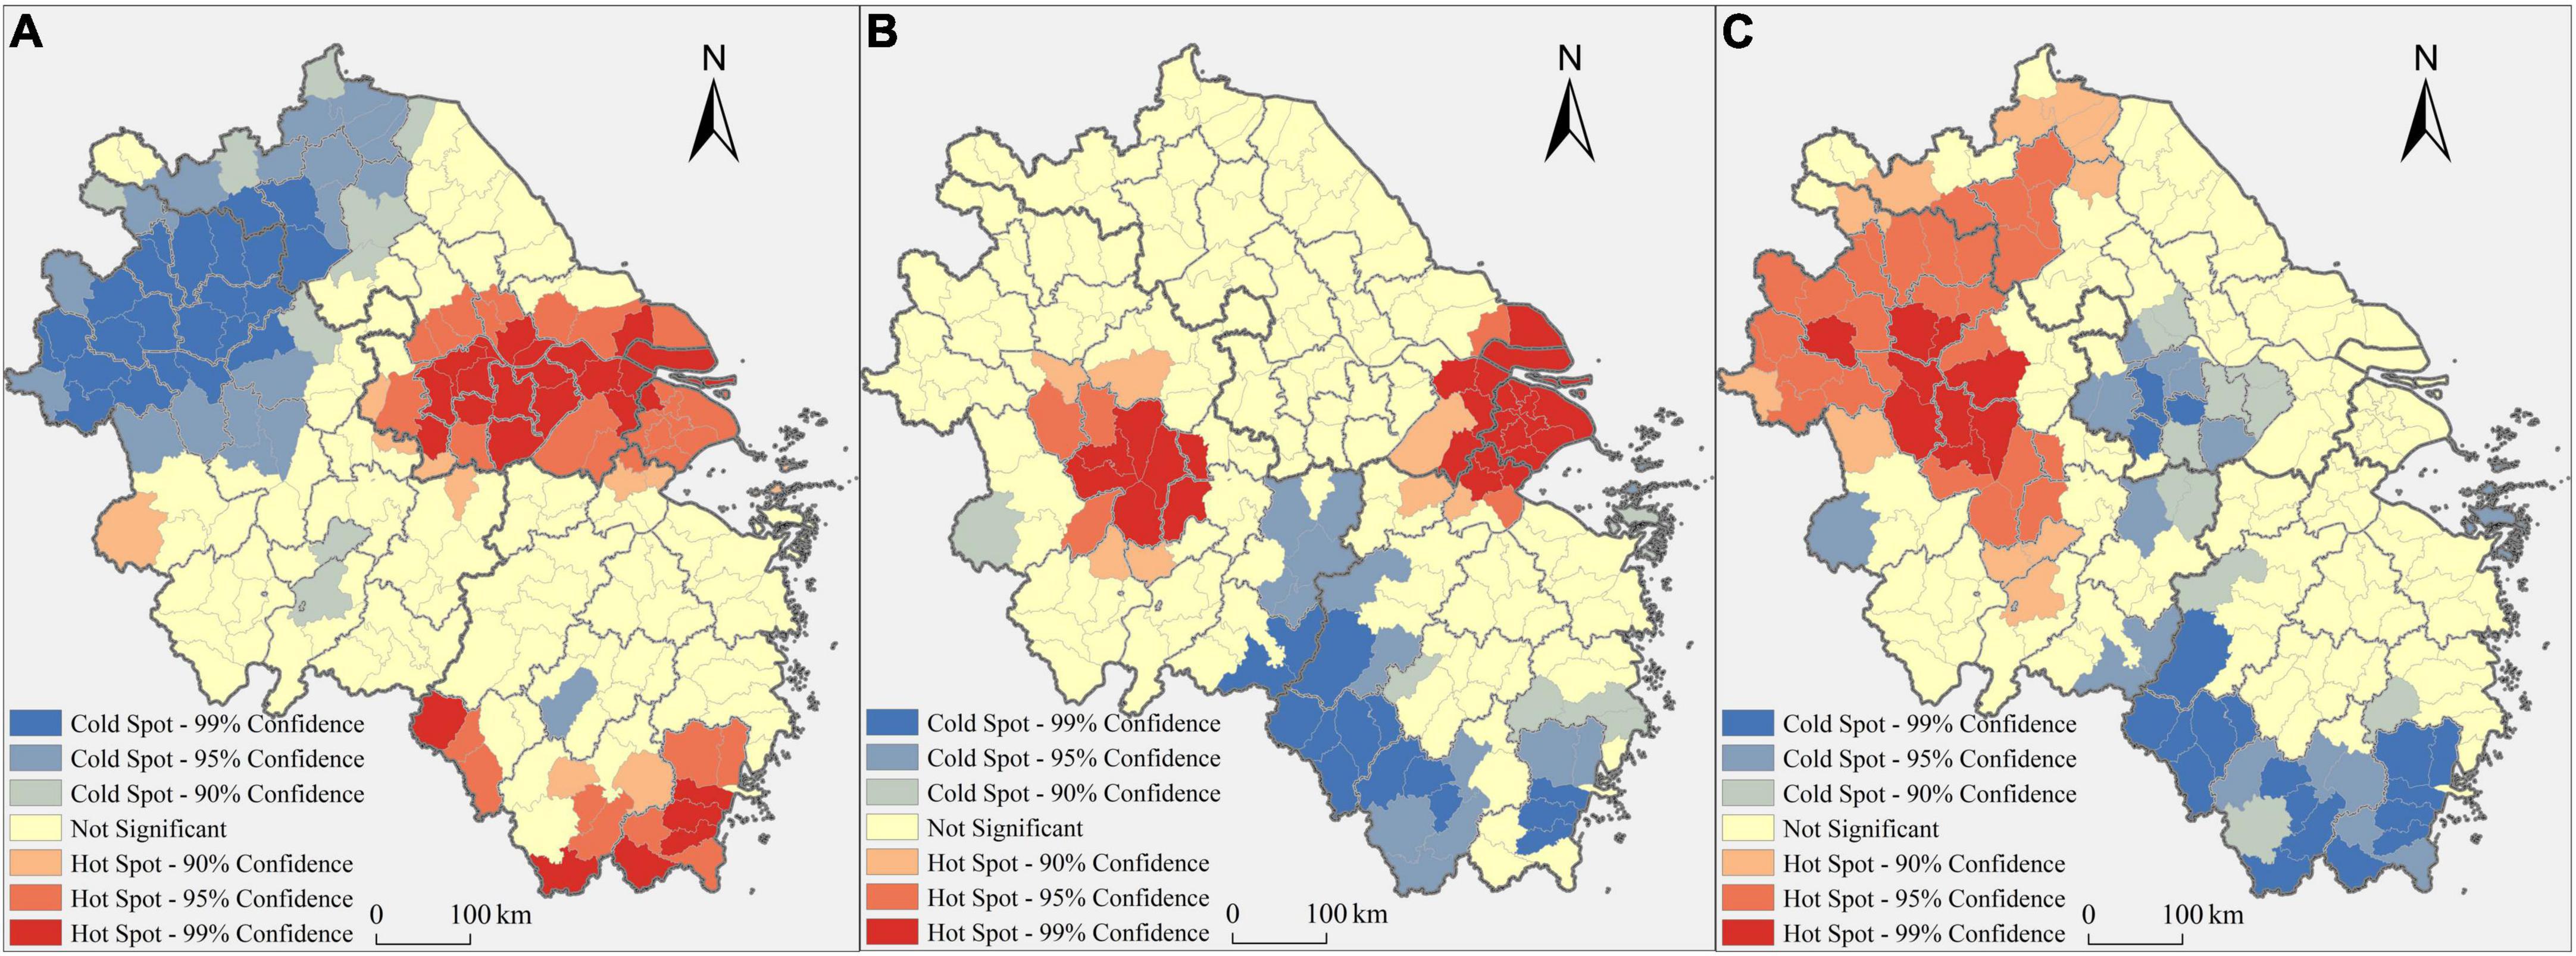
Figure 5. The spatial clusters of CLUE changes in the YRD from 2000 to 2020. (A) During 2000–2010. (B) During 2010–2020. (C) Annual changing differentials between the two periods.
Comparing the increase or decrease of CLUE by county-level regions during 2000–2010 and 2010–2020, Figure 5C presents the spatial restructuring of CLUE changing clusters in the YRD. On the one hand, hot spots were mainly in the peripheral regions, especially Hefei, Northern Anhui, and Northern Jiangsu, signifying that CLUE improvement in the peripheral YRD was more markable during 2010–2020. On the other hand, cold spots were largely located in Southern Jiangsu, and Southern and Western Zhejiang, indicating that the growth rate of CLUE in suburban counties of major cities and ecologically sensitive regions was relatively low during 2010–2020. Some suburban counties of major cities (e.g., Nanjing, Suzhou, Hangzhou, and Ningbo) even experienced a decline in CLUE from 2010 to 2020, probably because industrial and population agglomeration in relevant suburbs were lower than expected under the rapid expansion of construction land. These results suggest that the hot spots of CLUE growth tend to shift from the core YRD and ecologically sensitive regions to central cities in the peripheral YRD since the early 2010s.
Regional group differences in construction land use efficiency
Figure 6 reports the differences in CLUE among eight groups, which are divided by the core YRD (central cities) and peripheral YRD (counties). The median, upper quartile, and lower quartile of CLUE in groups related to central cities showed a trend of continuing increase from 2000 to 2020. In contrast, the upper quartile of CLUE in other groups, especially the counties in the core YRD, underwent a significant decline from 2010 to 2020. Moreover, the average CLUE of the central cities in the core YRD was the highest, followed by that of the counties in the core YRD, while that of the counties in the peripheral YRD was the lowest. Although the average CLUE of the core and peripheral YRD has increased significantly, the gap in CLUE between the core and peripheral YRD doubled during 2000–2020. A similar result can be drawn from the comparison of CLUE between the central cities and counties. These results indicate that construction land use in the central cities shows better economic performance than that in the suburbs and peripheral counties, even more, this gap has been widening in the YRD since the early 2010s.
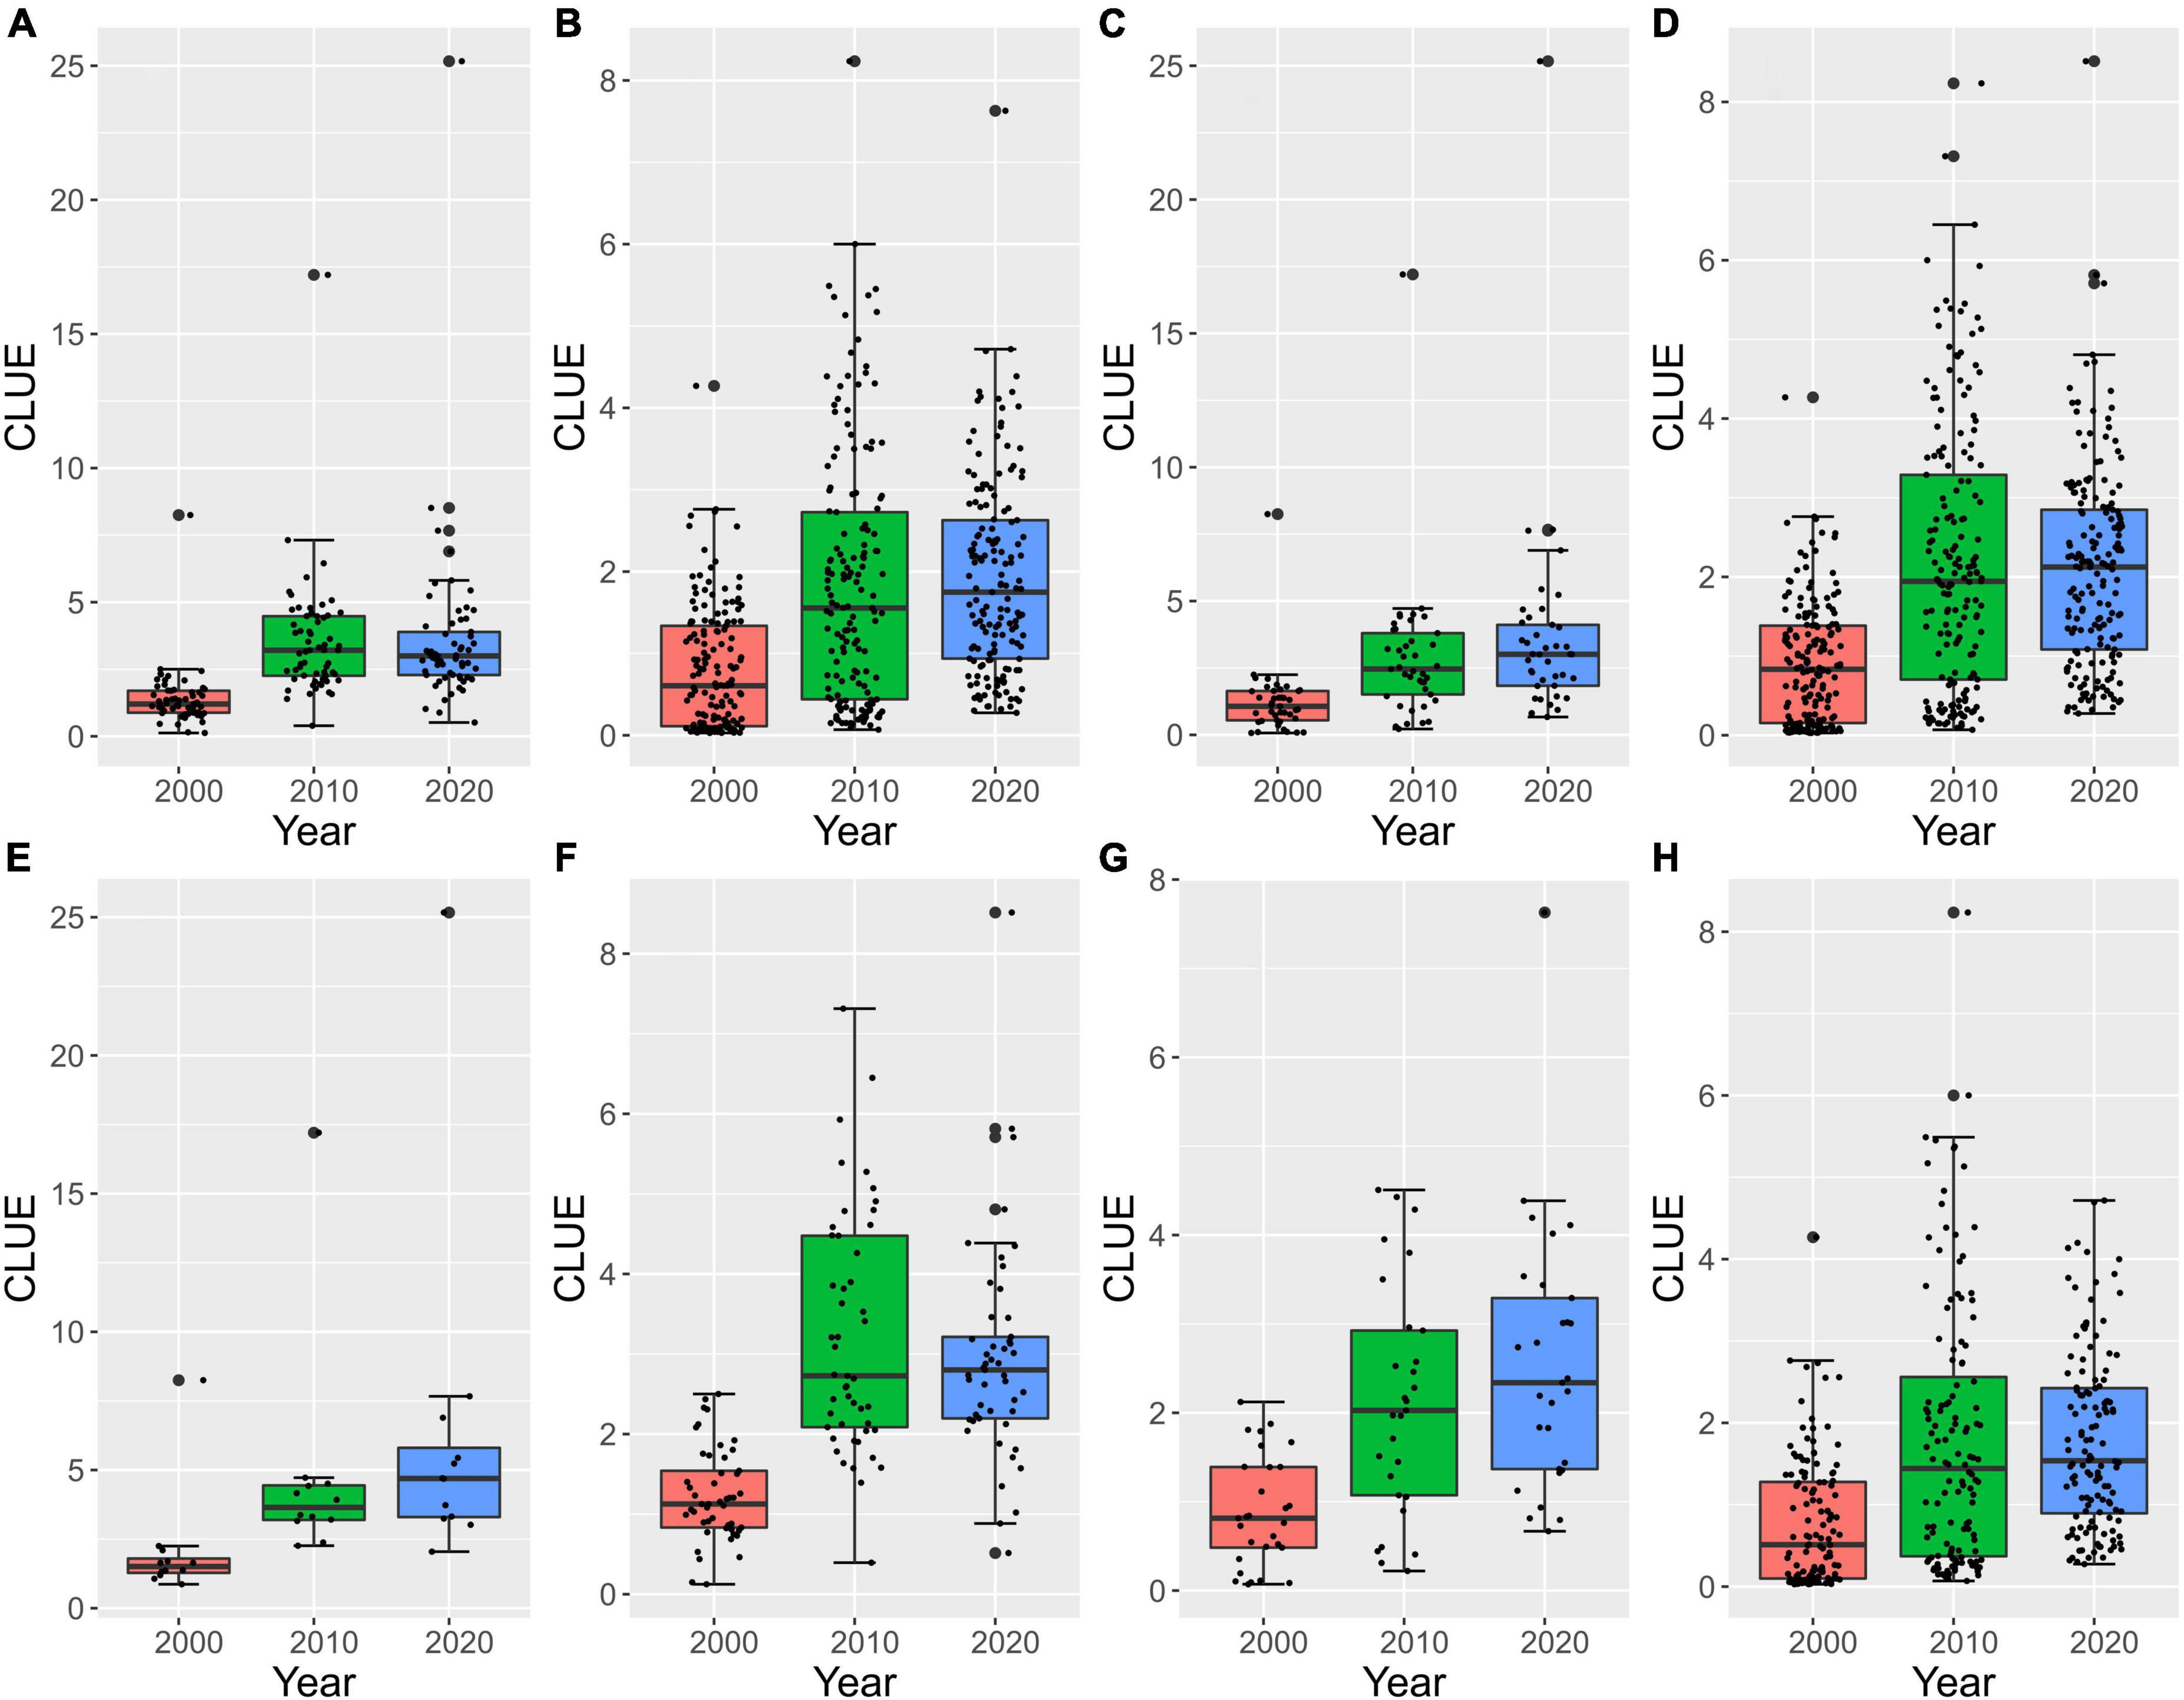
Figure 6. Regional group differences in CLUE (million RMB per hectare) in the YRD between 2000 and 2020. (A) The core YRD; (B) the peripheral YRD; (C) all central cities; (D) all counties; (E) all central cities in the core YRD; (F) all counties in the core YRD; (G) all central cities in the peripheral YRD; (H) all counties in the peripheral YRD.
With regard to the standard deviation of CLUE by research units, a trend of continuing growth can be found in the groups of the core YRD and the central cities, while the groups of the peripheral YRD and counties presented a rising trend at first and then fell from 2000 to 2020. Moreover, regional differences in CLUE between the central cities and counties within the core YRD were more significant than that within the peripheral YRD during 2000–2020. These results indicate that interregional gaps of CLUE within the core YRD or the central cities have been widening, while that within the groups of the peripheral YRD or counties was the opposite since the early 2010s.
Driving forces of uneven construction land use efficiency in the Yangtze River Delta
Land use efficiency is largely affected by various exogenous factors (Lambin and Meyfroidt, 2011; Wang Q. et al., 2021; Zhang et al., 2022), indicating that spatial dependence of the error term should be taken in modeling. Insignificant coefficients for LM-lag or Robust LM-lag confirm that the estimated models of SEM have a higher fitting degree than that of SLM (see Appendix A). According to the results of the variance inflation factor (VIF), DEM and SLOP are put into the models separately to avoid the potential problems of multicollinearity. The regression results of OLS, SEM, and GWR models are presented in Table 2. On the one hand, the estimated coefficients and their signs of most variables changed over time, implying that the driving forces of CLUE are temporally heterogeneous. On the other hand, the median, maximum and minimum values of coefficients for each variable are different in GWR models (see Appendix B), signifying that the determinants of CLUE have significantly spatial heterogeneities.
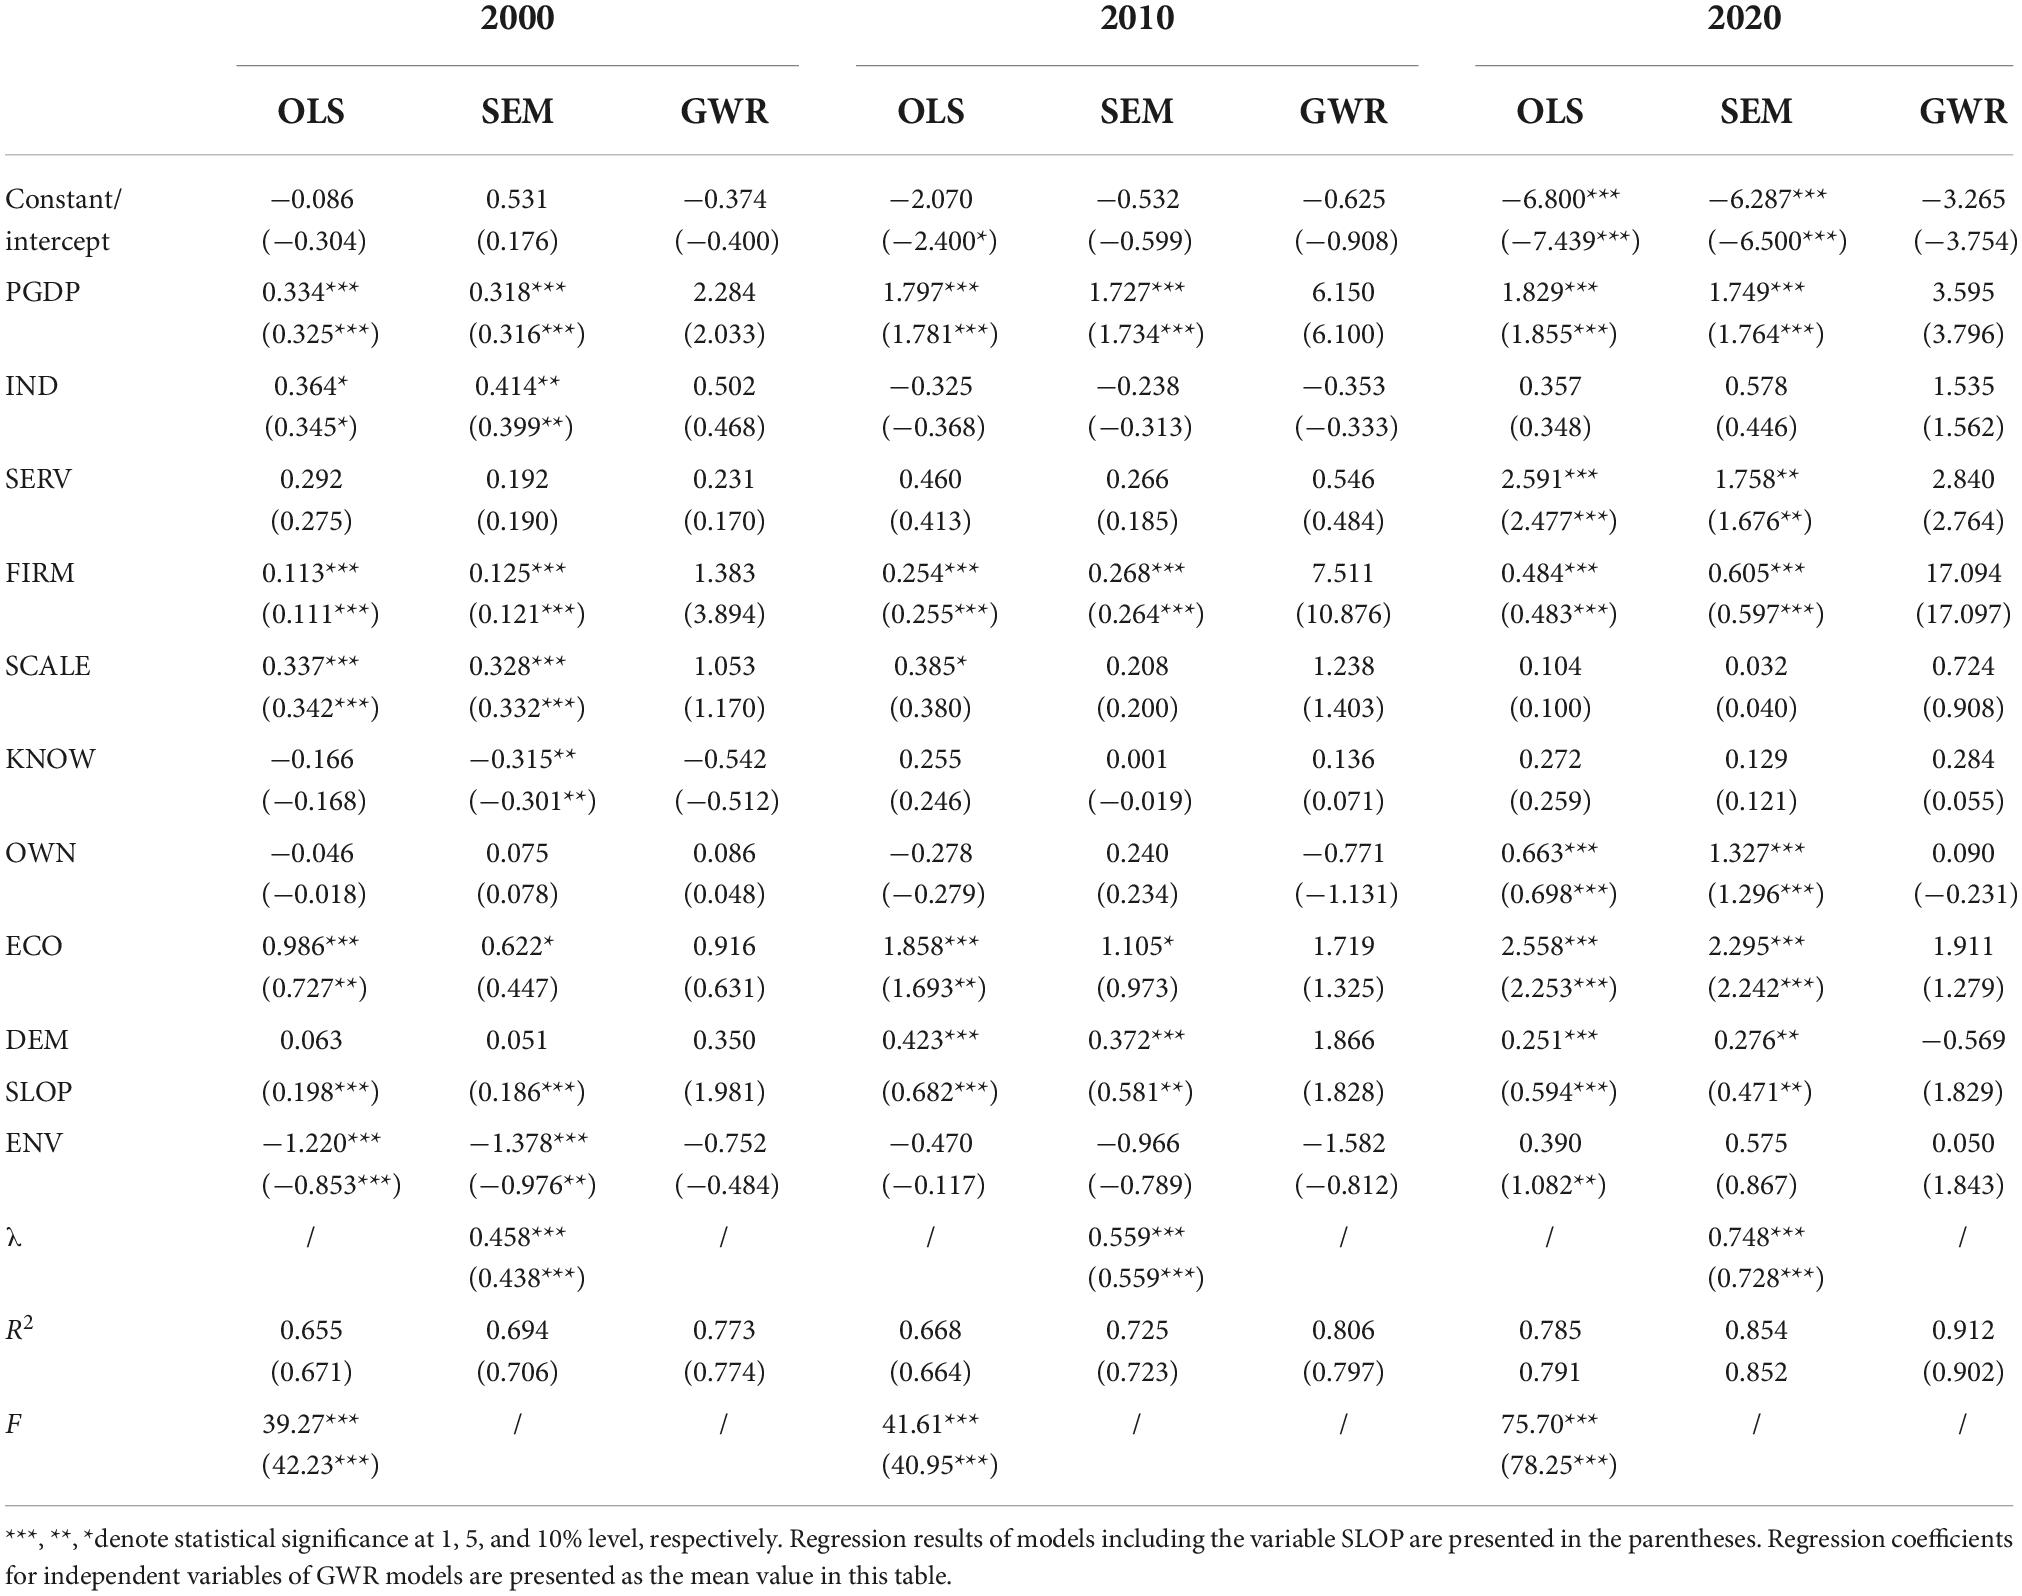
Table 2. Regression results of OLS, SEM, and GWR models.
Impacts of regional economic incentives and firm dynamics
The estimated results imply that regional disparities in economic development level and industrial structure play a vital role in the spatiotemporal variation of CLUE, which is in line with the findings documented by previous studies (Peng et al., 2017; Chen et al., 2019; Yu et al., 2019). The coefficients for PGDP are positive and significant in all models, indicating that construction land use in economically developed regions (e.g., central cities in the core YRD) might show better economic performance. Particularly, regional innovative milieu and technical progress are positively associated with place-specific CLUE (Chen et al., 2019). The effects of industrial structure and transition are mixed. The coefficients for IND and SERV are, respectively significantly and insignificantly positive in models for 2000, however, the results are opposite in models for 2020. This suggests that, concerning CLUE improvement, regional advantages in the service economy are more influential than the spatial agglomeration of the industrial economy in recent YRD. This is probably because industrial upgrading that local governments pursued has facilitated the transition of economic structure from industry-led to service-led, especially in central cities with relatively high CLUE, in the YRD since the early 2010s. Our finding tallies with the existing studies that highlighted the impacts of industrial agglomeration and transformation on land use efficiency (Chen et al., 2018; Liu J. et al., 2021).
Corporate demography, as well as spatial dynamics of individual firms, are valuable in explaining the spatiotemporal variation of CLUE at the regional scale. The coefficients for FIRM are significantly positive in all models, signifying that the spatial agglomeration of corporate organizations, activities, and functions is positively associated with relatively higher CLUE. The coefficients for SCALE are positive and significant in models for 2000, but insignificant in models for 2010 and 2020. This indicates that the spatial agglomeration of large firms could notably improve CLUE in the early 2000s, however, this relationship has become unclear since the early 2010s. This is partly because some counties, especially in ecologically sensitive regions, with few larger firms show relatively higher CLUE in the YRD. The coefficients for KNOW show positive signs in models for 2010 and 2020. This is partly because the spatial agglomeration of knowledge-intensive enterprises, which largely represents a stronger regional innovative capability, plays an increasingly important role in improving local CLUE. Therefore, a series of regulations related to pollution control and energy conservation have been carried out by local governments to facilitate the relocation of traditional manufacturers and inefficient firms, and then provide space for high-tech firms. Furthermore, the coefficients for OWN are ambiguous in models for 2000 and 2010, but significantly positive in models for 2020. This may suggest that the spatial agglomeration of FIEs, which is closely related to the continuing opening up and export-oriented economic growth, will contribute to the improvement of CLUE in the YRD.
Impacts of regional ecological constraints and environmental regulations
The regression results suggest that regional ecological sensitivity and constraints are positively associated with the economic performance of construction land use in the YRD. The coefficients for ECO, DEM, and SLOP are significantly positive in most models, indicating that county-level regions with a larger proportion of ecological and cultivated land, as well as higher elevation and steeper slope, tend to have higher CLUE than other regions. It is acknowledged that, by prioritizing ecological benefits and green development, the Chinese government has issued a series of policies for pollution prevention, ecological restoration, and economic transition since the early 2010s. According to the national major function-oriented zoning, ecologically sensitive counties located in Southwestern YRD have been zoned for eco-environmental conservation and food production. Economic activities, especially those with negative impacts on the eco-environmental system, are limited or even prohibited in the planned ecological function and restricted development zones. Regional ecological constraints and strict regulations restrain urban sprawl and land expansion on one hand, and force local governments to efficiently use the limited construction land resources on the other hand. This is partly because, in addition to eco-environmental benefits, regional economic development and social welfare improvement still play an important role in the evaluation and promotion of local officials in China.
The coefficients for ENV are negative and significant in OLS and SEM models for the year 2000, indicating that the poor regional environmental quality is not conducive to improving CLUE. This result is consistent with the finding of Peng et al. (2017), who suggested that environmental pollution has a “crowding out effect” on urban land use efficiency. However, ENV’s coefficients are insignificant in models for the years 2010 and 2020 and even appear positive signs. With the aggravation of environmental deterioration, Chinese central and local governments have devoted substantial efforts to pursuing cleaner production and to reducing pollution since the early 2010s. A series of regulations related to resource conservation and intensive utilization have therefore been implemented, resulting in an increasing level of natural resources supervision and environmental stringency (Zhu et al., 2014; Wang K. et al., 2021). Our results indicate that rising environmental standards and regulations, particularly in developed regions and major cities, might weaken the “crowding out effect” of pollution on land use efficiency at the regional scale.
Spatial heterogeneity of influential factors and driving mechanisms
Considering the spatial clustering and spillover of uneven CLUE in the YRD, it is essential to examine the spatially heterogeneous effects of influential factors. Figure 7 shows the changing spatial patterns of the estimated coefficients for independent variables, such as IND, SERV, KNOW, OWN, and ENV, in GWR models.
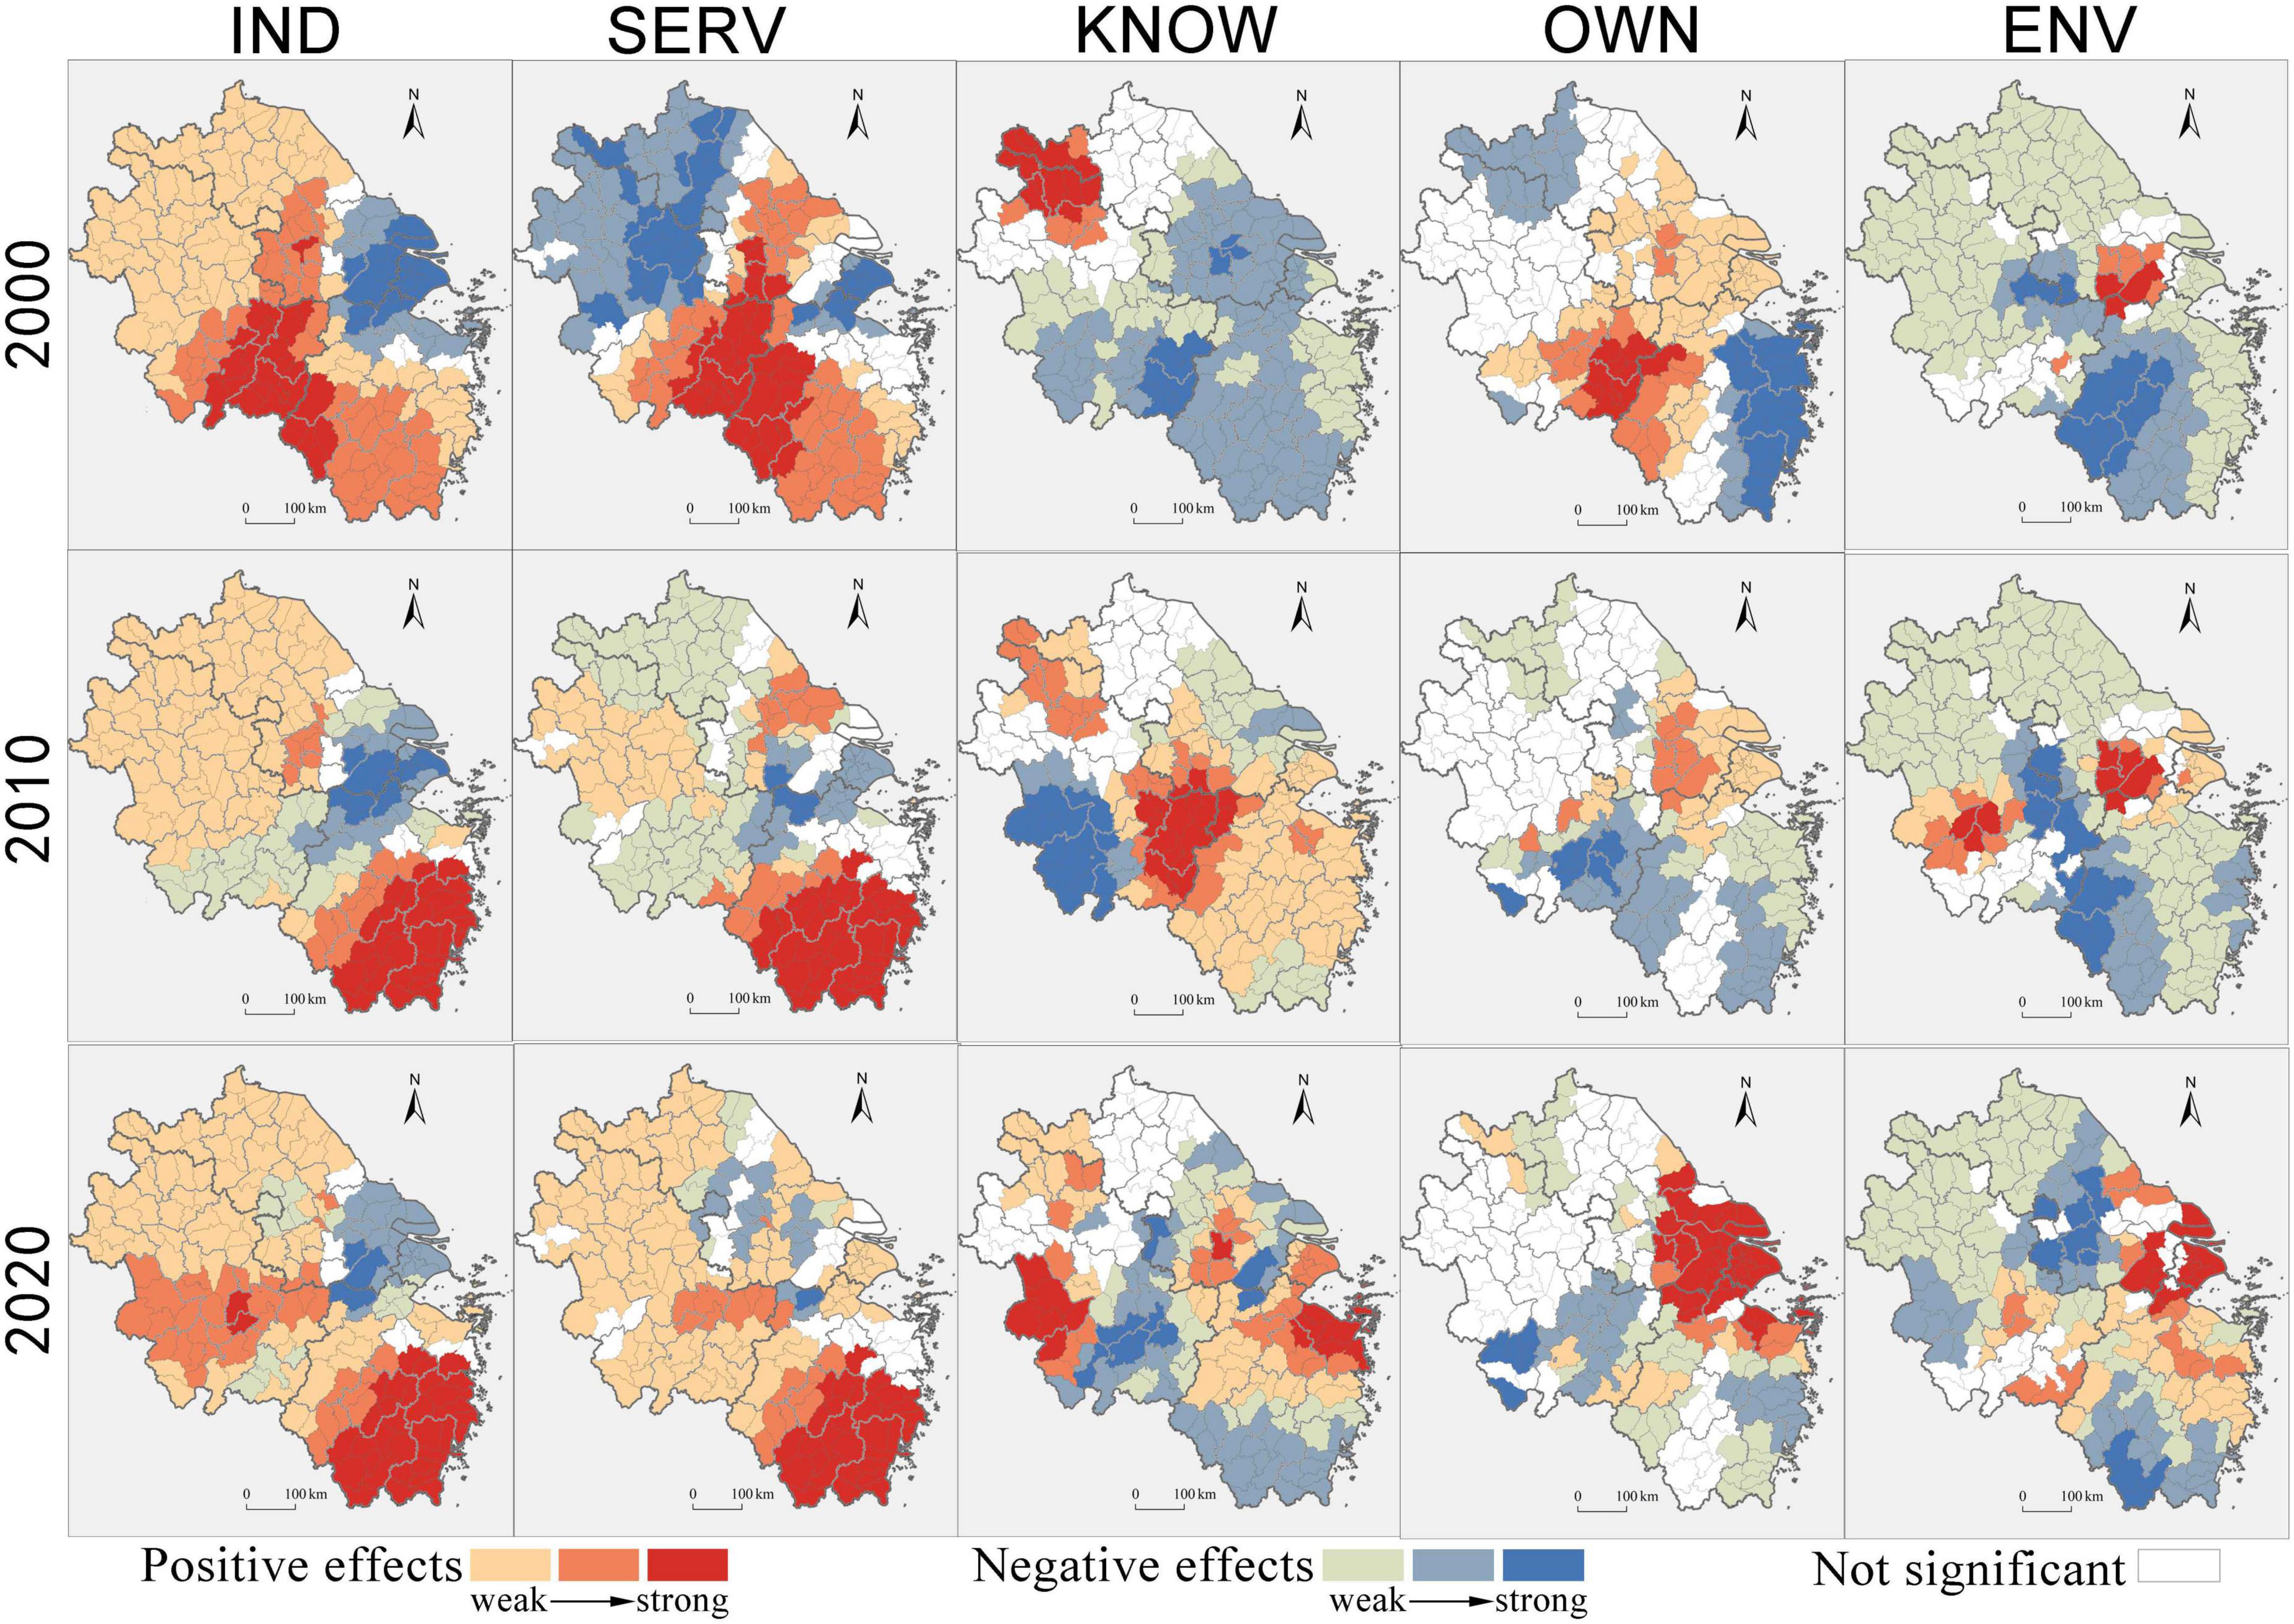
Figure 7. GWR estimated coefficients for independent variables in 2000, 2010, and 2020 (the estimated coefficients with p-values less than 0.1 are considered significant).
Expect for Shanghai and its neighboring regions, the local coefficients for IND are positive and significant. This implies that a larger proportion of the industrial economy in GDP would be positively associated with higher CLUE, especially in the peripheral YRD. Our findings suggest that promoting manufacturing agglomeration, as well as the undertaking of industrial transfer from developed regions, should be an important way for less-developed regions to improve land use efficiency. In contrast, the positive influence of SERV on CLUE has been increasingly strengthening across the YRD, particularly in Shanghai and its neighboring regions, since the early 2010s. This signifies that the higher CLUE in major cities is largely dependent on place-specific advantages in producer and consumer services. With the rapid expansion of urban residential and commercial land, local governments in major cities are concerned more about the critical role played by the service economy in improving CLUE. We can conclude that the impacts of economic structure on CLUE differ between developed and less-developed regions, which is related to their respective industrial restructuring paths.
Figure 7 presents that the negative coefficients for KNOW and the positive coefficients for OWN played a leading role in the YRD in 2000. At the early stage of industrialization in the YRD, traditional manufacturing, township industries, and low-value production dominated regional economic development, and advanced technologies and management experiences were mainly introduced or controlled by FIEs. The spatial agglomeration of FIEs might be positively associated with higher CLUE. Since the early 2010s, the number of county-level regions with positive coefficients for KNOW has increased significantly, especially in the core YRD. With the continuing industrial upgrading, the Chinese government has issued a series of incentive policies to support the promotion of strategic emerging industries and technical innovation. In addition to the service economy, the spatial agglomeration of knowledge-intensive industries is increasingly vital to CLUE improvement in the YRD. However, negative coefficients for KNOW and OWN can still be found in some peripheral counties, this is partly because the attraction of high-tech industries and high-quality FIEs in less-developed regions is largely limited by their location, agglomeration economies, and doing business environment.
Figure 7 shows that the negative effect of ENV on CLUE played a leading role in the peripheral YRD, especially in Northern Jiangsu, Southern Zhejiang, and Anhui province. This may indicate that environmental pollution has a stronger “crowding out effect” on the economic performance of construction land use in less-developed regions. Our findings suggest that promoting economic development and improving CLUE in less-developed regions cannot be at the expense of ecosystem and environmental quality. “Left behind” regions should avoid becoming pollution heavens when undertaking industrial transfer from developed regions. In contrast, the positive effect of ENV played a leading role in the core YRD, especially in cities (e.g., Suzhou, Wuxi, and Shanghai) with relatively higher CLUE. The increasing pollution problems in major cities enforce environmental regulations and standards more stringent, which could effectively facilitate technical innovation, clean production, and intensive utilization of natural resources at the firm- and regional level.
Discussion and conclusion
Discussion
Construction land expansion and use efficiency are tied to the promotion of sustainable cities and communities around the world (UN-Habitat, 2016; Akuraju et al., 2020; Estoque et al., 2021). Although there is a large body of literature on the driving forces and implications of the spatiotemporal variation of CLUE, however, we know little about how socioeconomic contexts and eco-environmental constraints work together for CLUE at a finer geographical scale. Particularly, previous studies paid insufficient attention to the impacts of economic incentives at the micro-level, such as the spatial dynamics of individual firms, on local land use efficiency. Urbanization, economic development, and corporate strategy in emerging economies (e.g., China) will predict a substantial transition in the near future (Zhu et al., 2014; Chen et al., 2016; Tang et al., 2021), and how changes in economic dynamics and eco-environmental regulations affect land use practice and performance in relevant countries or regions will deserve more scholarly investigation.
Focusing on the aforementioned research gaps, this study will contribute to the literature on land use efficiency in the following aspects. First, a conceptual framework of the spatiotemporal variation of construction land expansion and use efficiency in transitional China is developed, with particular attention to regional eco-environmental constraints and regulations, as well as economic incentives driven by firm-specific changes. By highlighting the direct influences of regional corporate demography and the spatial dynamics of firms on CLUE, this study will advance our understanding of the microcosmic dynamics underlying the relationships between economic incentives and land use efficiency. Our conceptual framework can provide an alternative and effective theoretical perspective for relevant research, especially on land use transition in emerging economies. Second, this study examines the changing “core-periphery” pattern of CLUE at the sub-national scale through distinguishing the central city and suburban county. Uncovering the spatiotemporal variation of CLUE at a finer geographical scale, this study might be an important supplement to the existing studies that focus on global, national, provincial, and urban scales. Third, taking the YRD, one of the emerging global city-regions in the Global South, as a case, this article discusses the changes in construction land use practice and performance under new-type urbanization and economic transition during the past three decades. Such empirical research and related evidence can assist in uncovering the driving forces of uneven CLUE in places within extensive emerging economies or global city-regions, which calls for more attention from scholars and policy-makers.
Our findings can also generate several policy implications for improving CLUE under sustainable urbanization in China and other emerging economies. First, the central cities of metropolises, as well as developed regions, should promote urban renewal and stock construction land vitalization to provide sufficient space for the “new economy” and knowledge-intensive firms. Second, with the rapid expansion of construction land, urban suburbs should actively facilitate population and industrial agglomeration to avoid the inefficient sprawl of built-up areas. Third, in the process of improving CLUE, the peripheral and less-developed regions should not only promote the spatial agglomeration of manufacturing industries but also control pollution resulting from undertaking industrial transfer through implementing proper regulations. Additionally, incentive policies to encourage the development of pollution-free and low-carbon industries should be issued by ecologically sensitive regions to improve the economic performance of construction land use.
This article has twofold limitations. On the one hand, this article only examines the effects of eco-spatial area, elevation, and slope, a few facets of the regional ecological system, on uneven CLUE. The role played by other facets that can embody regional ecological importance and sensitivity need more research attention. Regional disparities in the strength of resources supervision and environmental regulation are difficult to quantify, and their influences on uneven CLUE have not been investigated in this study. On the other hand, our analysis did not distinguish the difference in use efficiency between construction land in urbanized areas, small towns, and villages due to data availability. The regression models did not include variables that directly measure technological progress due to the lack of relevant data (e.g., patent and R&D) at the county-level in 2000. Data constraints also force us to measure regional corporate demography only by the number of corporate organizations rather than output value. We leave these issues for future studies.
Conclusion
This article examines the spatiotemporal variation of CLUE and its driving forces in the YRD, China. We depicted the changing spatial pattern, including spatial clustering and regional group differences, of CLUE between 2000 and 2020. Then, temporal and spatial heterogeneities of the impacts of economic incentives and eco-environmental constraints on uneven CLUE have been measured in the YRD.
The descriptive results indicate that, with rapid industrialization and urbanization, CLUE in the YRD has increased significantly since the early 2000s. It should be noted that the CLUE and its changing trends and magnitudes differ across county-level regions. The CLUE in the central cities, especially those located in the core YRD, is higher than that in peripheral counties, indicating a significant “core-periphery” spatial pattern. County-level regions with remarkable improvement of CLUE have been increasingly concentrated in the central cities of major cities. The efficiency gap in construction land use between the core and peripheral YRD, as well as the central cities and suburban counties, has widened since the early 2010s. It is also found that the economic performance of construction land use in some counties located in Southwestern Zhejiang and Southwestern Anhui, which are ecologically sensitive regions, is relatively better. Furthermore, the improvement of CLUE in peripheral regions such as Northern Jiangsu and Northern Anhui from 2010 to 2020 was more markable than that during 2000–2010, but it was the opposite in Southwestern Zhejiang. To some extent, these trends will restructure the “core-periphery” pattern of CLUE in the YRD.
The regression results signify that uneven CLUE is closely associated with spatiotemporal heterogeneities in socioeconomic contexts and eco-environmental constraints across the YRD. On the one hand, regional disparities in economic incentives, such as economic level, industrial transformation, and firm-specific dynamics, are the main drivers of the spatiotemporal variation of CLUE. The spatial agglomeration of the “new economy” and capable corporations, especially service industries, knowledge-intensive firms, and FIEs, have been playing an increasingly important role in improving CLUE since the early 2010s. On the other hand, factors related to regional ecological constraints show positive effects on CLUE. We can conclude that regional ecological constraints (e.g., large eco-spatial area, high elevation, and steep slope) severely restrict the expansion of the urban built-up area, but this forces local governments and market entities to make efficient use of the limited construction land resources. Furthermore, the modeling results imply that the influences of driving forces, such as industrial structure and environmental quality, vary across regions. The positive effects of service and knowledge-intensive industries, as well as FIEs, on CLUE are strengthening in the core YRD, while CLUE improvement in the peripheral YRD will rely more on the continuing growth of manufacturing industries. We also find a stronger “crowding out effect” of environmental pollution on CLUE in the peripheral YRD, however, this relationship does not exist in most county-level regions located in the core YRD.
Data availability statement
The raw data supporting the conclusions of this article will be made available by the authors, without undue reservation.
Author contributions
JW and WS designed the research. JW drafted and revised the manuscript. JW and CL analyzed the data and prepared figures. WS discussed the results and revised the manuscript. All authors contributed to the article and approved the submitted version.
Funding
This research was funded by the National Natural Science Foundation of China (grant number: 41871119), and Jiangsu R&D Special Fund for Carbon Peaking and Carbon Neutrality (grant number: BK20220014).
Conflict of interest
The authors declare that the research was conducted in the absence of any commercial or financial relationships that could be construed as a potential conflict of interest.
Publisher’s note
All claims expressed in this article are solely those of the authors and do not necessarily represent those of their affiliated organizations, or those of the publisher, the editors and the reviewers. Any product that may be evaluated in this article, or claim that may be made by its manufacturer, is not guaranteed or endorsed by the publisher.
Footnotes
References
Akuraju, V., Pradhan, P., Haase, D., Kropp, J. P., and Rybski, D. (2020). Relating SDG11 indicators and urban scaling – An exploratory study. Sustain. Cities Soc. 52:101853. doi: 10.1016/j.scs.2019.101853
Bryan, B. A., Crossman, N. D., Nolan, M., Li, J., Navarro, J., Connor, J. D., et al. (2015). Land use efficiency: Anticipating future demand for land-sector greenhouse gas emissions abatement and managing trade-offs with agriculture, water, and biodiversity. Glob. Change Biol. 21, 4098–4114. doi: 10.1111/gcb.13020
Capasso, M., Stam, E., and Cefis, E. (2015). Industrial dynamics and economic geography. Region. Stud. 49, 5–9. doi: 10.1080/00343404.2014.982440
Carroll, G. R., and Hannan, M. T. (2000). Why corporate demography matters: Policy implications of organizational diversity. Calif. Manag. Rev. 42, 148–163. doi: 10.2307/41166046
Chen, M., Liu, W., and Lu, D. (2016). Challenges and the way forward in China’s new-type urbanization. Land Use Policy 55, 334–339. doi: 10.1016/j.landusepol.2015.07.025
Chen, W., Chen, W., and Ning, S. (2019). Exploring the industrial land use efficiency of China’s resource-based cities. Cities 93, 215–223. doi: 10.1016/j.cities.2019.05.009
Chen, W., Shen, Y., Wang, Y., and Wu, Q. (2018). The effect of industrial relocation on industrial land use efficiency in China: A spatial econometrics approach. J. Clean. Product. 205, 525–535. doi: 10.1016/j.jclepro.2018.09.106
Cheung, K., and Ping, L. (2004). Spillover effects of FDI on innovation in China: Evidence from the provincial data. China Econ. Rev. 15, 25–44. doi: 10.1016/S1043-951X(03)00027-0
Dong, Y., Jin, G., and Deng, X. (2020). Dynamic interactive effects of urban land-use efficiency, industrial transformation, and carbon emissions. J. Clean. Product. 270:122547. doi: 10.1016/j.jclepro.2020.122547
Estoque, R. C., Ooba, M., Togawa, T., and Hijioka, Y. (2021). Monitoring global land-use efficiency in the context of the UN 2030 agenda for sustainable development. Habitat Int. 115:102403. doi: 10.1016/j.habitatint.2021.102403
Fetzel, T., Niedertscheider, M., and Haberl, H. (2016). Patterns and changes of land use and land-use efficiency in Africa 1980–2005: An analysis based on the human appropriation of net primary production framework. Region. Environ. Change 16, 1507–1520. doi: 10.1007/s10113-015-0891-1
Gao, J., Wei, Y. D., and Chen, W. (2014). Economic transition and urban land expansion in provincial China. Habitat Int. 44, 461–473. doi: 10.1016/j.habitatint.2014.09.002
Gao, X., Zhang, A., and Sun, Z. (2020). How regional economic integration influence on urban land use efficiency? A case study of Wuhan metropolitan area, China. Land Use Policy 90:104329. doi: 10.1016/j.landusepol.2019.104329
He, S., Yu, S., and Li, G. (2020). Exploring the influence of urban form on land-use efficiency from a spatiotemporal heterogeneity perspective: Evidence from 336 Chinese citie. Land Use Policy 95:104576. doi: 10.1016/j.landusepol.2020.104576
Jiao, L., Xu, Z., and Xu, G. (2020). Assessment of urban land use efficiency in China: A perspective of scaling law. Habitat Int. 99:102172. doi: 10.1016/j.habitatint.2020.102172
Jun, C., Ban, Y., and Li, S. (2014). Open access to earth land-cover map. Nature 514, 434–434. doi: 10.1038/514434c
Koroso, N. H., Zevenbergen, J. A., and Lengoiboni, M. (2020). Urban land use efficiency in Ethiopia: An assessment of urban land use sustainability in Addis Ababa. Land Use Policy 99:105081. doi: 10.1016/j.landusepol.2020.105081
Lambin, E. F., and Meyfroidt, P. (2010). Land use transitions: Socio-ecological feedback versus socio-economic change. Land Use Policy 27, 108–118. doi: 10.1016/j.landusepol.2009.09.003
Lambin, E. F., and Meyfroidt, P. (2011). Global land use change, economic globalization, and the looming land scarcity. Proc. Natl. Acad. Sci. U.S.A. 108, 3465–3472. doi: 10.1073/pnas.1100480108
Li, Q., Wang, Y., and Chen, W. (2021). Does improvement of industrial land use efficiency reduce PM2.5 pollution? Evidence from a spatiotemporal analysis of China. Ecol. Indic. 132:108333. doi: 10.1016/j.ecolind.2021.108333
Liu, J., Hou, X., and Wang, Z. (2021). Study the effect of industrial structure optimization on urban land-use efficiency in China. Land Use Policy 105:105390. doi: 10.1016/j.landusepol.2021.105390
Liu, J., Li, J., and Qin, K. (2017). Changes in land-uses and ecosystem services under multi-scenarios simulation. Sci. Total Environ. 586, 522–526. doi: 10.1016/j.scitotenv.2017.02.005
Liu, S., Lin, Y., and Ye, Y. (2021). Spatial-temporal characteristics of industrial land use efficiency in provincial China based on a stochastic frontier production function approach. J. Clean. Product. 295:126432. doi: 10.1016/j.jclepro.2021.126432
Liu, X., Huang, Y., and Xu, X. (2020). High-spatiotemporal-resolution mapping of global urban change from 1985 to 2015. Nat. Sustain. 3, 564–570. doi: 10.1038/s41893-020-0521-x
Liu, Y., Fang, F., and Li, Y. (2014). Key issues of land use in China and implications for policy making. Land Use Policy 40, 6–12. doi: 10.1016/j.landusepol.2013.03.013
Lu, X., Kuang, B., and Li, J. (2018). Regional difference decomposition and policy implications of China’s urban land use efficiency under the environmental restriction. Habitat Int. 77, 32–39. doi: 10.1016/j.habitatint.2017.11.016
Mahtta, R., Fragkias, M., Güneralp, B., Mahendra, A., Reba, M., Wentz, E. A., et al. (2022). Urban land expansion: the role of population and economic growth for 300+ cities. NPJ Urban Sustain. 2:5. doi: 10.1038/s42949-022-00048-y
Masini, E., Tomao, A., Barbati, A., Corona, P., Serra, P., Salvati, L., et al. (2019). Urban Growth, Land-use Efficiency and Local Socioeconomic Context: A comparative analysis of 417 Metropolitan Regions in Europe. Environ. Manag. 63, 322–337. doi: 10.1007/s00267-018-1119-1
Ning, Q., Ouyang, X., and Liu, S. (2022). Spatio-temporal evolution and quality analysis of construction land in urban agglomerations in central China. Front. Ecol. Evolut. 10:912127. doi: 10.3389/fevo.2022.912127
Peng, C., Xiao, H., Liu, Y., and Zhang, J. (2017). Economic structure and environmental quality and their impact on changing land use efficiency in China. Front. Earth Sci. 11, 372–384. doi: 10.1007/s11707-016-0596-x
Rahman, M. M., and Szabó, G. (2021). Multi-objective urban land use optimization using spatial data: A systematic review. Sustain. Cities Soc. 74:103214. doi: 10.1016/j.scs.2021.103214
Schiavina, M., Melchiorri, M., Freire, S., Florio, P., Ehrlich, D., Tommasi, P., et al. (2022). Land use efficiency of functional urban areas: Global pattern and evolution of development trajectories. Habitat Int. 123:102543. doi: 10.1016/j.habitatint.2022.102543
Searchinger, T. D., Wirsenius, S., Beringer, T., and Dumas, P. (2018). Assessing the efficiency of changes in land use for mitigating climate change. Nature 564, 249–253. doi: 10.1038/s41586-018-0757-z
Tahir, M., Hayat, A., Rashid, K., Afridi, M. A., and Tariq, Y. B. (2020). Human capital and economic growth in OECD countries: some new insights. J. Econ. Administ. Sci. 36, 367–380. doi: 10.1108/JEAS-07-2019-0073
Tang, Y., Wang, K., Ji, X., Xu, H., and Xiao, Y. (2021). Assessment and spatial-temporal evolution analysis of urban land use efficiency under green development orientation: Case of the Yangtze River Delta Urban Agglomerations. Land 10:715. doi: 10.3390/land10070715
Tu, F., Yu, X., and Ruan, J. (2014). Industrial land use efficiency under government intervention: Evidence from Hangzhou, China. Habitat Int. 43, 1–10. doi: 10.1016/j.habitatint.2014.01.017
UN-Habitat (2016). Indicator 11.3.1: Ratio of land consumption rate to population growth rate. Kenya: UN-Habitat.
van Donkelaar, A., Hammer, M. S., Bindle, L., Brauer, M., Brook, J. R., Garay, M. J., et al. (2021). Monthly global estimates of fine particulate matter and their uncertainty. Environ. Sci. Technol. 55, 15287–15300. doi: 10.1021/acs.est.1c05309
Wang, K., Li, G., and Liu, H. (2021). Does natural resources supervision improve construction land use efficiency: Evidence from China. J. Environ. Manag. 297:113317. doi: 10.1016/j.jenvman.2021.113317
Wang, Q., Wang, Y., Chen, W., Zhou, X., and Zhao, M. (2021). Factors affecting industrial land use efficiency in China: Analysis from government and land market. Environ. Devel. Sustain. 23, 10973–10993. doi: 10.1007/s10668-020-01100-6
Wu, C., Wei, Y. D., Huang, X., and Chen, B. (2017). Economic transition, spatial development and urban land use efficiency in the Yangtze River Delta China. Habitat Int. 63, 67–78. doi: 10.1016/j.habitatint.2017.03.012
Wu, Y., Luo, J., Zhang, X., and Skitmore, M. (2016). Urban growth dilemmas and solutions in China: Looking forward to 2030. Habitat Int. 56, 42–51. doi: 10.1016/j.habitatint.2016.04.004
Xie, X., Fang, B., Xu, H., He, S., and Li, X. (2021). Study on the coordinated relationship between Urban Land use efficiency and ecosystem health in China. Land Use Policy 102:105235. doi: 10.1016/j.landusepol.2020.105235
Yang, D., Lou, Y., Zhang, P., and Jiang, L. (2022). Spillover effects of built-up land expansion under ecological security constraint at multiple spatial scales. Front. Ecol. Evolut. 10:907691. doi: 10.3389/fevo.2022.907691
Yu, J., Zhou, K., and Yang, S. (2019). Land use efficiency and influencing factors of urban agglomerations in China. Land Use Policy 88:104143. doi: 10.1016/j.landusepol.2019.104143
Yue, L., Miao, J., Ahmad, F., Draz, M. U., Guan, H., Chandio, A. A., et al. (2022). Investigating the role of international industrial transfer and technology spillovers on industrial land production efficiency: Fresh evidence based on directional distance functions for Chinese provinces. J. Clean. Product. 340:130814. doi: 10.1016/j.jclepro.2022.130814
Zhang, W., Wang, B., Wang, J., Wu, Q., and Dennis Wei, Y. (2022). How does industrial agglomeration affect urban land use efficiency? A spatial analysis of Chinese cities. Land Use Policy 119:106178. doi: 10.1016/j.landusepol.2022.106178
Zhang, X., Lu, X., Chen, D., Zhang, C., Ge, K., Kuang, B., et al. (2021). Is environmental regulation a blessing or a curse for China’s urban land use efficiency? Evidence from a threshold effect model. Growth Change 52, 265–282. doi: 10.1111/grow.12465
Zhu, S., He, C., and Liu, Y. (2014). Going green or going away: Environmental regulation, economic geography and firms’ strategies in China’s pollution-intensive industries. Geoforum 55, 53–65. doi: 10.1016/j.geoforum.2014.05.004
Zhu, X., Li, Y., and Zhang, P. (2019). Temporal–spatial characteristics of urban land use efficiency of China’s 35mega cities based on DEA: Decomposing technology and scale efficiency. Land Use Policy 88:104083. doi: 10.1016/j.landusepol.2019.104083
Appendix
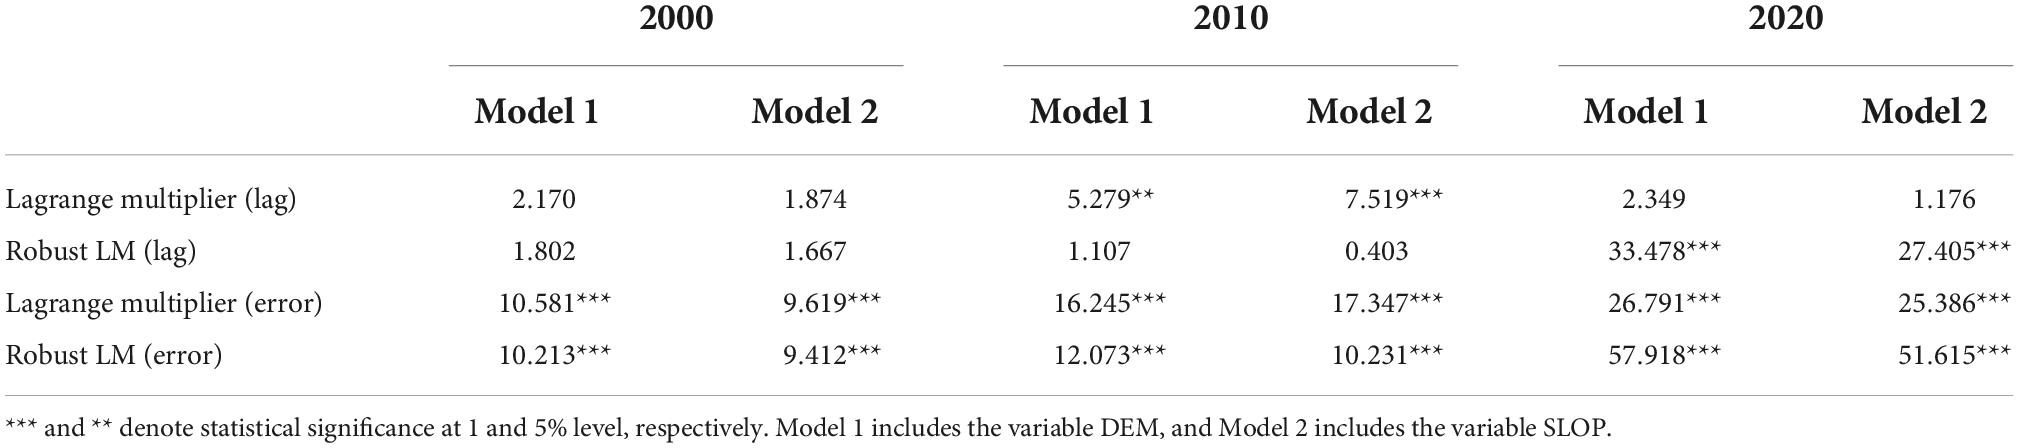
Appendix A. Results of lagrange multiplier test.
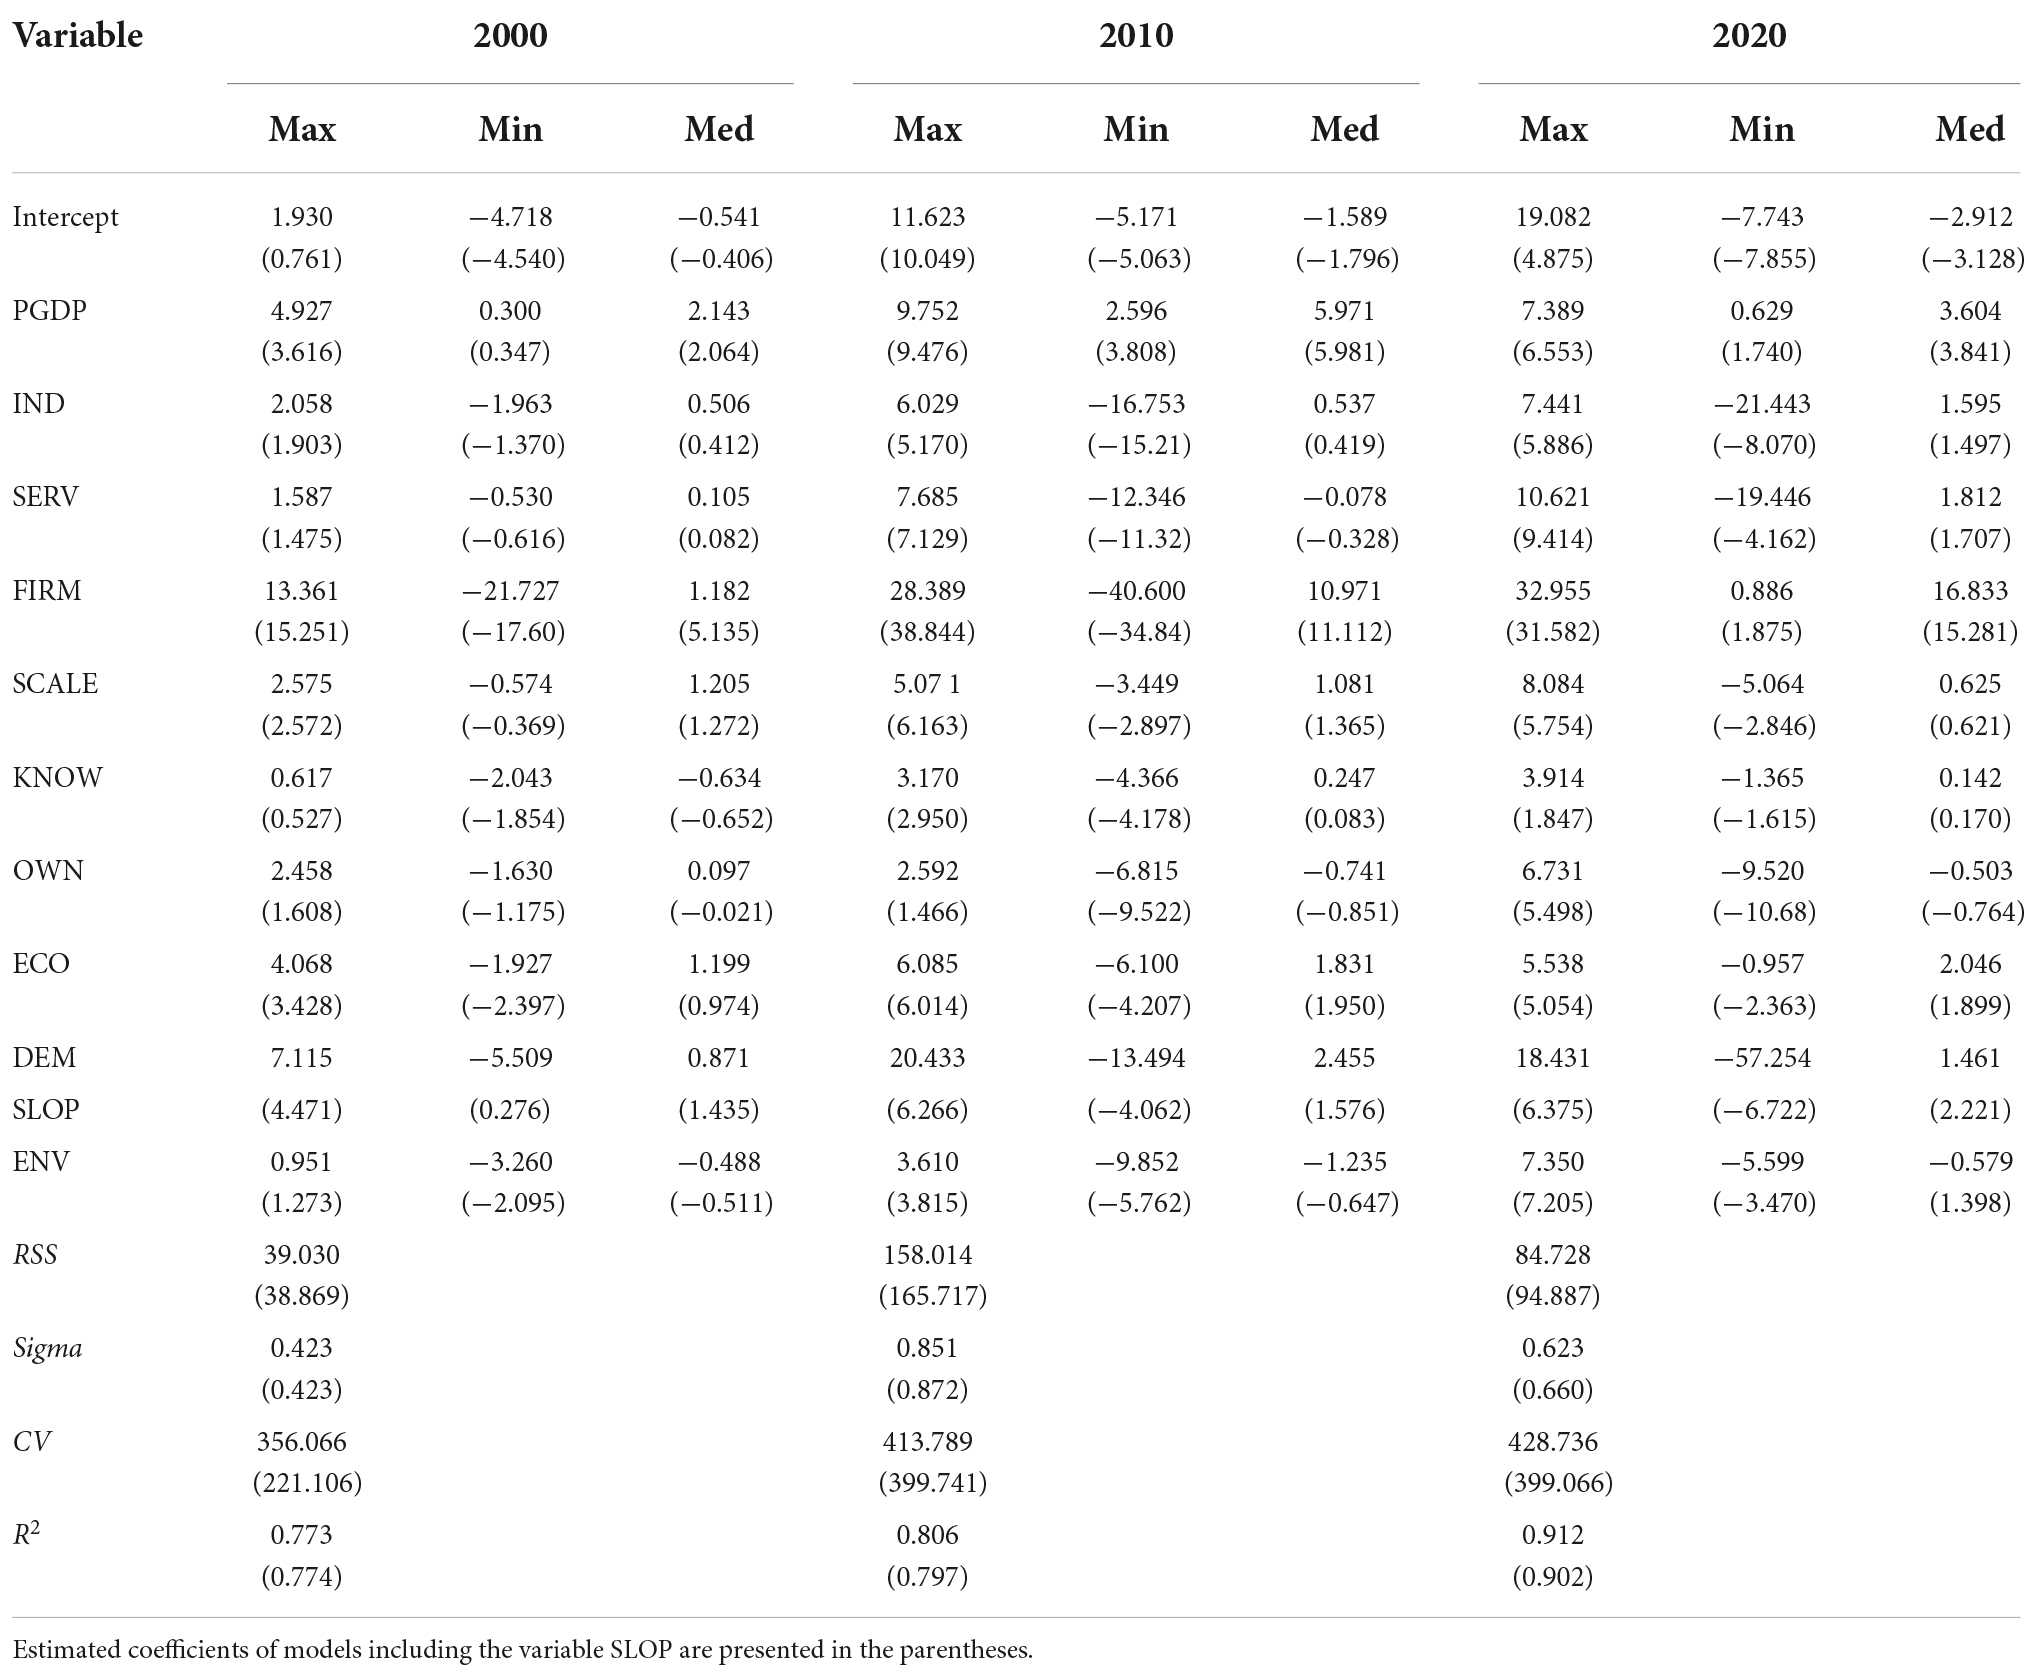
Appendix B. Descriptive statistics of the estimated coefficients for variables in GWR.
Keywords: land use transition, economic transition, eco-environmental system, regional sustainable development, regional inequality, China
Citation: Wu J, Liu C and Sun W (2022) Eco-environmental constraints, economic incentives, and spatiotemporal variations of construction land use efficiency in regional China. Front. Ecol. Evol. 10:1017728. doi: 10.3389/fevo.2022.1017728
Received: 12 August 2022; Accepted: 12 October 2022;
Published: 03 November 2022.
Edited by:
Bing Xue, Institute for Advanced Sustainability Studies (IASS), GermanyReviewed by:
Zaijun Li, Yangzhou University, ChinaSanwei He, Zhongnan University of Economics and Law, China
Copyright © 2022 Wu, Liu and Sun. This is an open-access article distributed under the terms of the Creative Commons Attribution License (CC BY). The use, distribution or reproduction in other forums is permitted, provided the original author(s) and the copyright owner(s) are credited and that the original publication in this journal is cited, in accordance with accepted academic practice. No use, distribution or reproduction is permitted which does not comply with these terms.
*Correspondence: Wei Sun, d3N1bkBuaWdsYXMuYWMuY24=