 Shuai Yuan
 Hao-Ting Zhang
 Xin Li
 Xiu-Xian Yue4
 He-Ping Fu
- 1College of Grassland, Resources and Environment, Inner Mongolia Agricultural University, Hohhot, China
- 2Key Laboratory of Grassland Rodent Ecology and Pest Controlled, Hohhot, China
- 3Key Laboratory of Grassland Resources of the Ministry of Education, Hohhot, China
- 4Institute of Forestry Monitoring and Planning of Inner Mongolia Autonomous Region, Hohhot, China
Ecosystem stability has been of increasing interest in the past several decades as it helps predict the consequences of anthropogenic disturbances on ecosystems. A wild rodent community under reclamation and different grazing disturbances in the Alxa Desert was investigated using live trapping from 2006 to 2011. We studied the rodent community composition, community diversity, and variability of different life history strategies. These results showed that reclamation reduced rodent community stability by increasing temporal variability of community, reducing rodent community resistance as shown by decreasing dominance of KSS strategists, and increased the resistance variability of the rodent community by increasing the variability of abundance and richness for KSS strategists. Grazing reduced rodent community resilience by reducing the dominance of rRF strategists, and increased the resilience variability of the rodent community by increasing the variability of abundance and richness for rRF strategists. Those results may answer the three ecological questions about how ecosystems respond to disturbances from a diversity perspective. The ecosystems with intermediate disturbance are more stable, in other words, with higher resistance and resilience. The increase of KSS strategists means the increase of resistance of the community. The increase of rRF strategists means the increase of community resilience.
1. Introduction
Disturbances are an essential component of desert ecosystems. While they play an important role in desert renewal and diversification, disturbances can generate profound changes in desert composition and structure. With the global environmental change, the occurrence and severity of biotic and abiotic disturbances have increased, affecting desert ecosystems around the world (Grimm and Fisher, 1989; Frank et al., 2013). Such alterations in disturbance regimes may change desert responses to disturbances, resulting in altered ecosystems and affecting their function and provision of services (Eldridge et al., 2009; Quoreshi et al., 2019). The concept of ecological disturbance originated from ecological studies at the community level, and the influence of interference on this scale was obvious. Many species groups are closely related to the disturbance, and one prominent function of the disturbance is to lead to the change of various resources in the ecosystem and the reorganization of the ecosystem structure leading to the formation of heterogeneous environment (Chen and Fu, 2000). Two major foci of ecological research involve reciprocal views of the relationship between biodiversity and disturbance: Disturbance determines community diversity or diversity determines realized disturbance severity. A largely separate body of ecological research has examined how biodiversity affects community or ecosystem properties. Experimental explorations of the biodiversity–stability relationship often focus on the effect of diversity on community response to specific disturbance events, revealing several sound theoretical and biological mechanisms by which diversity might influence the magnitude of loss to (resistance) or rate of recovery from (resilience) disturbance (Sánchez-Pinillos et al., 2019).
Understanding desert responses to disturbances requires considering the mechanisms that enhance ecosystems to persist through time around an equilibrium state subjected to disturbances (Scheffer et al., 2012; Willis et al., 2018). Several studies recognize the important insights gained by considering resistance and resilience as related but distinct measurable components of ecosystem responses to disturbances (Hodgson et al., 2015; Nimmo et al., 2015). Resistance can be defined as the ability of ecological systems to persist through the disturbance event (Tilman and Downing, 1994; Connell and Ghedini, 2015), while resilience is the ecosystem’s capacity to recover or “bounce back” after the disturbance has been alleviated (Gunderson, 2000). Given the variety of meanings around these broad concepts, it is important to establish procedures to specifically measure these two properties when assessing responses of natural communities to disturbances (Hodgson et al., 2015; Nimmo et al., 2015). The resistance of an ecosystem to a given disturbance can be measured by the change in ecosystem structure and composition caused by the disturbance agent and can be estimated by comparing ecosystem characteristics before and immediately after the disturbance. Measuring resilience requires considering changes over a longer post-disturbance period to evaluate the degree to which an ecosystem returns to pre-disturbance conditions (Díaz-Delgado et al., 2002; Bagchi et al., 2017).
Desert resistance and resilience to disturbances depend on multiple variables acting at different levels of organization. Species responses to disturbances mediate changes in their abundance, affecting the composition and structure of the entire community, and therefore, forest functioning as well (Oliver et al., 2015). Different quantitative indices have been successfully applied to identify such variables and to compare forests based on their species responses (Bruelheide and Luginbuhl, 2009; Sánchez-Pinillos et al., 2019). While useful, the simplification inherent in quantitative, univariate indices does not capture the complexity of the entire system (Quinlan et al., 2016). Further insights into desert resistance and resilience can be gained by combining quantitative indicators based on cross-scale temporal dynamics with descriptive analyses of post-disturbance ecosystem-level variants. This approach allows us to comprehensively compare the responses of desert while assessing potential factors affecting resistance and resilience.
Stability may be caused in two ways: through the pattern of interaction between species in the community, or through the inherent stability of the species (MacArthur, 1955). Much subsequent research focused on the first pathway, namely the relationship between diversity and stability as well as the interaction between species (Hairston et al., 1968; Pimm, 1984), while less research has focused on the inherent stability of species. McCann (2000) suggested that the ability of a community to accommodate species or functional groups with different responsiveness limits stability. Functional and compositional stabilities were two aspects of stability in ecological communities (Huelsmann and Ackermann, 2022). In previous studies, life history characteristics are often used as the main indicators of community functional (Kirwan et al., 2009; Rodríguez and Ojeda, 2014; Lin et al., 2022). Life history theory (Stearns, 1992) predicts that certain environments favor specific suites of traits. Species with different life history strategies take different behavioral responses to environmental changes, which can adapt quickly to environmental changes to survive. While other species have taken non-adaptive responses to human disturbances which not encountered in their evolutionary history (Ghalambor et al., 2007). Reducing population density or lead to extinction in non-suitable habitats by emigration or death (Badyaev, 2005), and non-adaptive responses leading to changes in species distribution, diversity and community patterns (Tuomainen and Candolin, 2011). MacArthur and Wilson (1967) introduced r-K theory to account for linkages between life history strategies and specific environmental conditions. The r-K model suggests that life history strategies represent a continuum bounded by two end points: The r-strategy, characteristic of small, high-fecundity animals, and the K strategy, characteristic of large, low-fecundity animals. The model implies moving from disturbed environments. The increase in K strategists in a community imply an increase in community resistance, whereas an increase in r strategists implies an increase in community resilience (Lepš et al., 1982). Studying how different systems are dominated by animals with different life history strategies can help us solve the problem of resistance and resilience (Pimm, 1984).
Alxa desert is located in the Gobi and Karakum regions of Asia. It is an interior continental desert far away from the ocean and receiving air that has been depleted of moisture. This desert and the Great Basin of North America exemplify interior continental deserts (Kelt, 2011). In the 1990s, a large agricultural population migrated to the Alxa desert. With the increase in the agricultural population, land reclamation and heavy grazing became the main human disturbances affecting this desert ecosystem. Rodents are an important part of the environment, and an important indicator of environmental change in desert ecosystems (Jones and Longland, 1999; Flowerdew et al., 2004). Studies of rodents have contributed significantly to the development of desert ecology theory and to understanding animal adaption to arid environments (Ojeda and Tabeni, 2009). Understanding the mechanisms involved in rodent community stability has great significance for further evaluation of the stability of desert ecosystems subjected to human disturbance. However, studies on Chinese desert rodent community stability are not common.
In this study, based on Pianka’s classification principle for r and K strategists (Pianka, 1970) and Harvey’ classification principle (Read and Harvey, 2009) for fast-slow life history strategies, we further divided rodents into different life history strategies. Then we adapted a method of measuring and assessing ecosystem resistance and resilience to disturbances by comparing species composition and structure among different strategies, combining dissimilarity indices from ecosystem composition and structure with variability analyses of these descriptors in different disturbances. This method can help to answer three questions considered essential in the understanding of ecosystem responses to disturbances (see for example Willis et al., 2018): (i) Which types of ecosystems are the most resistance and resilience (ii), what factors contribute to resistance and resilience, or (iii) how prone is an ecosystem to losing resilience? In this article, we evaluate rodent community stability subjected to different grazing patterns and to land reclamation in the Alxa desert, investigating species diversity, resilience, resistance, and variability of the rodent community. Specifically, we assume that: (1) Land reclamation and heavy grazing would decrease rodent community stability by reducing rodent community diversity; and (2) Land reclamation and grazing change resilience, resistance or variability of the desert rodent community by regulating the composition of different bionomic strategists in the community.
2. Materials and methods
2.1. Study site
This study was conducted in the southern part of Alxa Zuo Qi at the eastern edge of the Tengger Desert, Inner Mongolia, China (E104°10′–105°30′, N37°24′–38°25′), from April to October each year between 2006 and 2011. Our study area has a continental climate with cold and dry winters and warm summers. Annual temperatures range from −36 to 42°C with a mean of 8.3°C. Annual precipitation ranges from 45 to 215 mm, but about 70 percent falls from June to September. Potential evaporation ranges from 3,000 to 4,700 mm, and the annual frost-free period is 156 days. Approximately 5–15% of the ground is covered with shrubs, forbs, and some gramineous plants. Shrubs mainly consist of Zygophyllum xanthoxylon, Nitraria tangutorum, Caragana brachypoda, Ceratoides latens, Oxytropis aciphylla, Artemisia sphaerocephala, and Artemisia xerophytica with Reaumuria soongorica as the dominant species. The major grasses/forbs species are Cleistogenes squarosa, Peganum nigellastrum, Cynanchum komarovii, Salsola pestifer, Suaeda glauca, Bassia dasyphylla, Corispermum mongolicum, Artemisia dubia, and Plantago lessingii (Yuan et al., 2018).
2.2. Methods
The experiment, established in 2006, adopted a randomized block design with three blocks and four treatments, including light sheep grazing, heavy sheep grazing, grazing exclusion and land reclamation, to assess the effect livestock grazing and agricultural reclamation on small mammal communities. Each block encompassed 240 ha and each treatment unit was 60 ha. The two grazing treatments and grazing exclusion were established with standard sheep fencing (110 cm high). In the light grazing sites, sheep grazing intensity was controlled within the range of 0.83–1.00 sheep per ha. In the heavy grazing sites, sheep grazing intensity was controlled within the range of 3.75–4.23 sheep per ha. This was close to the common grazing intensity in the study area, but significantly higher than the Inner Mongolia government standards, which ranged from 0.603 to 1.120 sheep per ha in the study area. The land reclamation plots previously had plant species similar to the grazing exclusion plots, but were reclaimed in 1994 by planting saxaul (Haloxylon ammodendron), sunflowers (Helianthus annuns), and maize (Zea mays). A 7 × 8 trapping grid (0.96 ha) at a 15 m inter-trap distance was established at the center of each treatment unit. Twelve trapping grids were established in the study area. One wire-mesh live trap (42 cm × 17 cm × 13 cm) was placed at each trap station.
2.3. Trapping of rodents
Rodents were live trapped for four consecutive days at 4-week intervals from April 2006 to October 2011. Trapping was not run during winter (from November to March). Traps were baited with fresh peanuts, and checked twice (morning and afternoon) each day. Considering that the average survival time of jerboa was greater than that of other non-jerboa species in our study areas. The life span of jerboa is longer than 2 years, and the average life span of non-jerboa species is shorter than 2 years. The electronic chips be used have a life span of 2 years. Each captured jerboa individual was sexed, marked with a 1.5 g aluminum leg ring (0.4 cm diameter) with a unique identification number (ID) attached to the left hind foot, and weighed to the nearest 1 g. Each captured non-jerboa individual was sexed, marked with a electronic chip with a unique identification number (ID). The sex, capture station, body mass, and reproductive condition of each capture were recorded. Males were considered in reproductive condition if they had scrotal testes. Females were considered reproductive if they possessed enlarged nipples surrounded with white mammary tissue, or a bulging abdomen. In order to avoid accidental death, traps were closed on extremely warm or rainy days, and trapping time was extended after extremely warm or rainy days to ensure 4 days of trapping in each month (Wu et al., 2016).
To assess the effectiveness of the aluminum leg rings, whether the leg rings are lost, we conducted another experiment in 2018 and 2019. In April and May 2018, both the leg rings and electronic chips were used to mark jerboas at the same time, and the loss of the leg rings and electronic chip was recorded in September of the same year. At the beginning of this pre-experiment, we captured and marked 21 Northern three-toed Jerboa (NTJ, Dipus sagitta) individuals and 15 Mongolian five-toed Jerboa (MFJ, Orientallactaga sibirica) individuals in 2018. In September of 2019, six NTJ marked individuals and seven MFJ marked individuals were recaptured. And there was no loss of leg rings or chips.
In this study we calculated population abundance of rodent with a minimum number known to be alive (MNA) (Krebs, 1966; Hilborn et al., 1976).
2.4. Vegetation sampling
We conducted vegetation sampling monthly from April 2006 to October 2011. During each month’s sampling, we randomly selected three 100-m2 plots within each treatment unit to sample shrubs. Within each 100-m2 plot, we randomly selected three individuals of small, medium, and large size of each species of shrub present. We removed a tenth of aboveground material (decided by cover) from the three shrubs and airdried samples. We then calculated the biomass of a shrub species using the formula TB = 10×DW×D/100, where DW is mean dry weight of 1–10th of aboveground material averaged over the three individuals, D is the density of a shrub species (individuals/100 m2), and TB is total aboveground standing biomass (g/m2) (Yuan et al., 2018).
Within each 100-m2 plot, we randomly placed three 1-m2 quadrats to sample grasses and forbs. We clipped aboveground plant material of grasses and forbs within each 1-m2 quadrat. We air-dried all aboveground plant material for >30 days until there were no changes in dry weight. We weighed dry plant material to the nearest 0.01 g to estimate aboveground standing biomass of grasses and forbs with an electronic balance (Model TD5002, Jingnuo, Yuyao, China) (Yuan et al., 2018).
2.5. Community diversity
There is no one indicator that can be used to evaluate stability (Sutherland, 1981; Pimm, 1984). In order to understand the effect of different disturbances on desert rodent community stability, our study analyzed the disturbed rodent community from the aspects of community diversity, variability of species richness and population abundance, community resistance and community resilience.
Species richness, Shannon–Wiener index, Pielou evenness index, and Simpson’s diversity index were calculated by years and treatments. These indices were analyzed using a mixed effects model (Proc mixed, SAS9.2) with a significance level of α = 0.05, using Tukey’s test for means comparison. Blocks and years were set as random effects. All values are given as the mean ± 1 standard error of mean (sem), unless otherwise noted.
2.6. Community resistance and resilience: Segmentation by bionomic strategies
Based on Pianka’s classification principle for r and K strategists (Pianka, 1970) and Harvey’ classification principle (Read and Harvey, 2009) for fast-slow life history strategies, statistical analysis was applied to six biological indicators, i.e., body length, litters, litter size, pregnancy, reproductive period, and longevity (Zhang and Wang, 1998; Wu et al., 2009; Table 1).
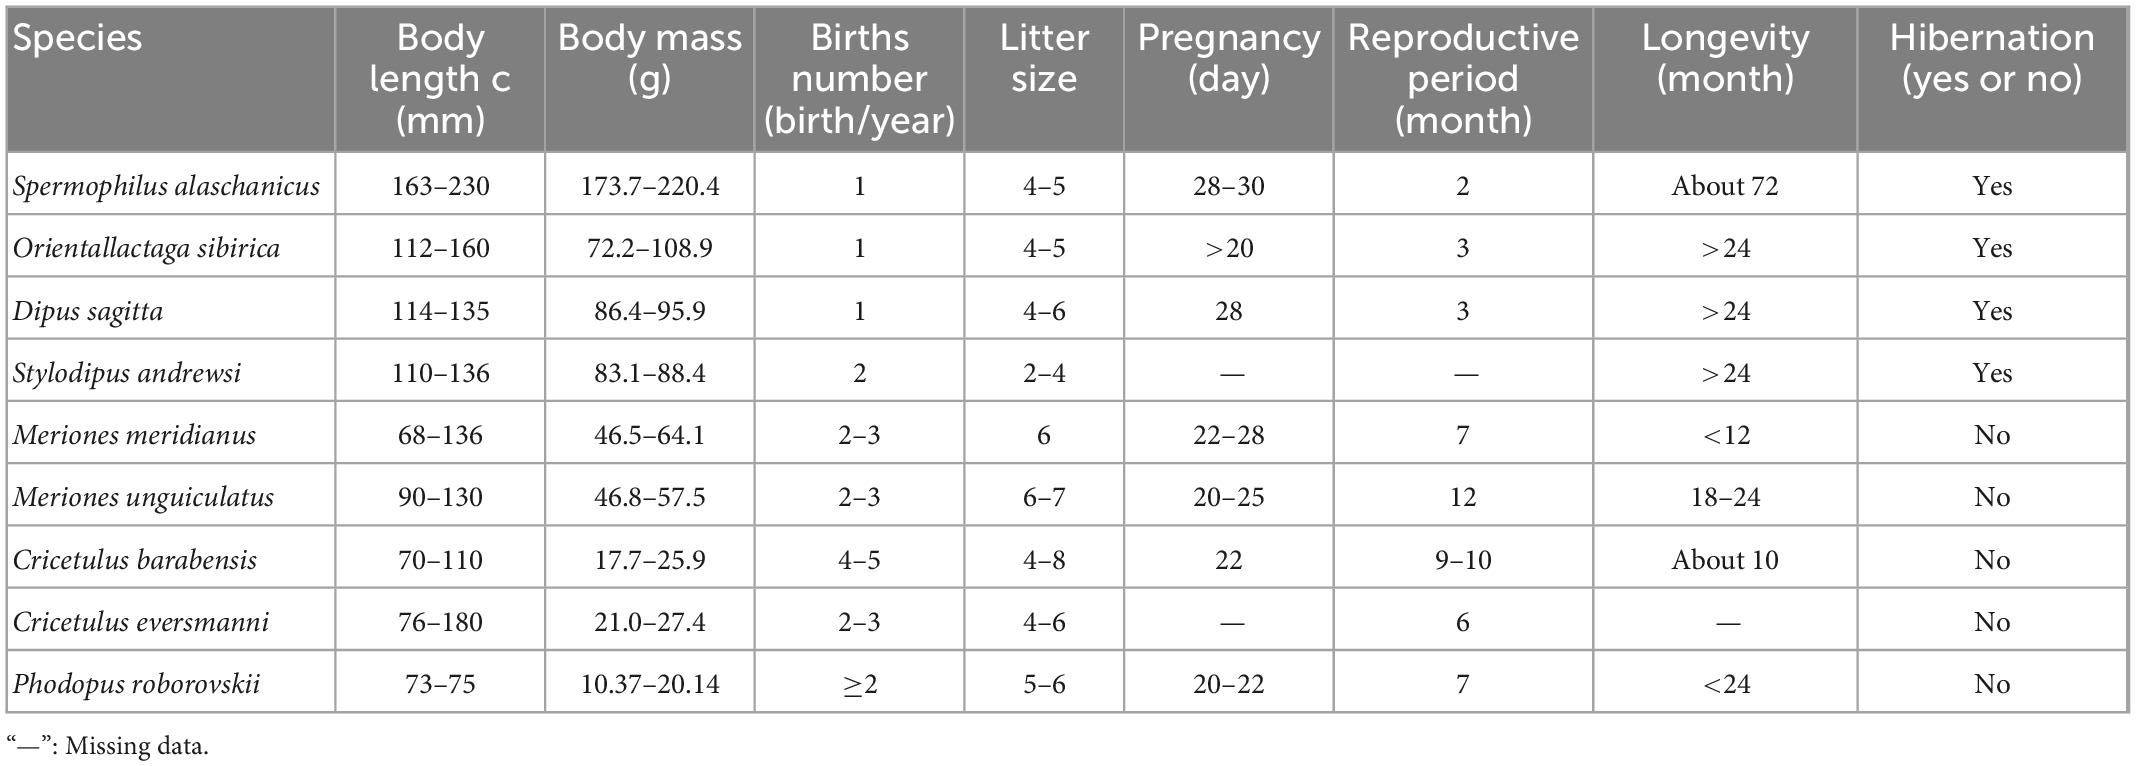
Table 1. Biological features of captured rodent species in different treatments in Alxa desert, Inner Mongolia, China, from April 2006 to October 2011.
Cluster analysis was performed using the unweighted pair-group method with arithmetic means (due to incomplete data on individual species, pregnancy was not included, Table 1). In high latitude areas, hibernation contributes significantly to the survival rate of species under adverse environmental conditions (Bakran-Lebl et al., 2011; Bieber et al., 2012; Armitage, 2017). Hence, whether a species hibernates or not was added into the classification index (Armitage, 2017). The result of cluster analysis suggested that rodents could be divided into two categories. The Alashan ground squirrel (AGS, Spermophilus alaschanicus), MFJ, NTJ, and Mongolian thick-tailed three-toed jerboa (MTTJ, Stylodipus andrewsi), with larger body size, long longevity, short reproductive period and relatively weak fecundity, were clustered into one category. We defined this category as K-stress tolerant slow strategists (KSS). Other rodent species with smaller body size, short longevity, long reproductive period, and high fertility were clustered into the other category, and, were categorized as r-ruderal-fast strategists (rRF) (Figure 1). According to the classification by bionomic strategy, we calculated the species richness and community structure of rodents with different bionomic strategies in different disturbed habitats. We defined a community with more KSS strategists dominance shows greater resistance, while a community with more rRF strategists dominance shows greater resilience.
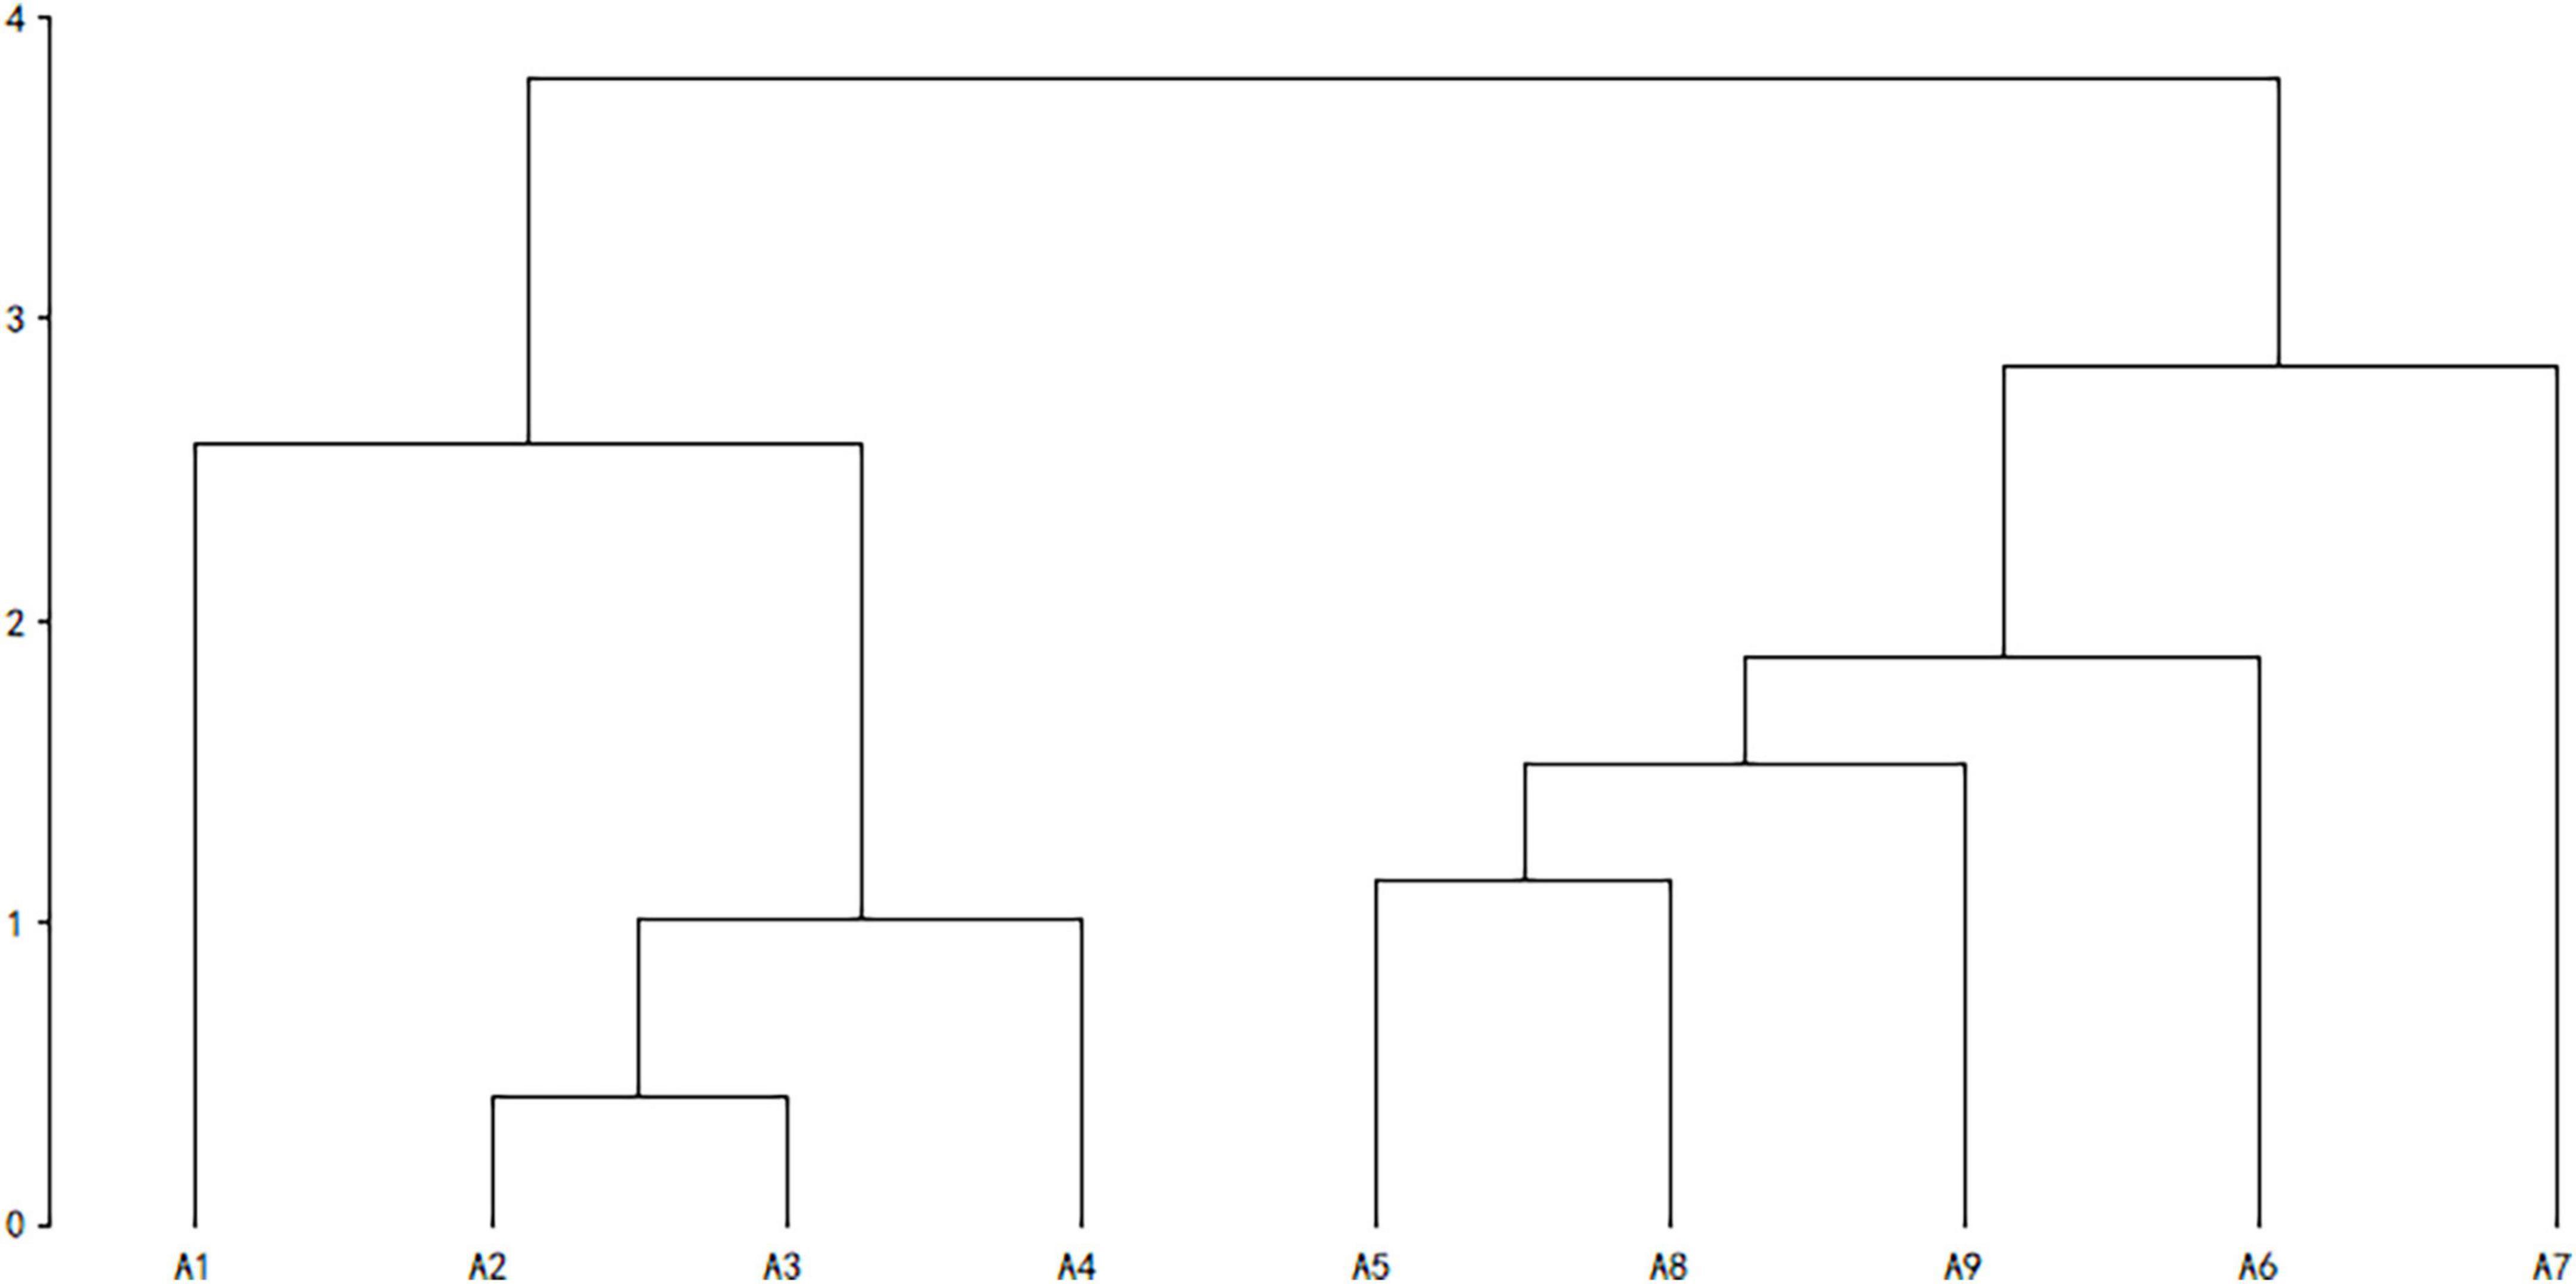
Figure 1. Cluster analysis of rodents with different bionomic strategies. Cluster analysis was performed using UPGMA, A1–A9 indicate, respectively: Alashan ground Squirrel (Spermophilus alaschanicus), Mongolian five-toed jerboa (Orientallactaga sibirica), Northern three-toed jerboa (Dipus sagitta), Mongolian thick-tailed three-toed jerboa (Stylodipus andrewsi), Midday gerbil (Meriones meridianus), Mongolian gerbil (Meriones unguiculatus), Chinese hamster (Cricetulus barabensis), Eversmann’s hamster (Cricetulus eversmanni), and Desert hamster (Phodopus roborovskii).
2.7. W-statistic calculation
We also used the W-statistic to analyze the dominance of different life strategists in different treatments, using the formula as follows (Clarke, 1990):
Where S is the number of species in the community, bj is the cumulative biomass ratio of the j species before order by biomass from the highest to the lowest; aj is the cumulative abundance ratio of the j species before order by abundance from the highest to the lowest. When W is close to 1, the biomass of the community is gradually dominated by a single species, while the abundance of each species tends to be the same. When W approaches −1, the opposite situation is indicated.
Species richness, capture rate, proportion of captured rodents with different bionomic strategies and W-values were calculated by years and treatments. These indices were analyzed using a mixed effects model (Proc mixed, SAS9.2) with a significance level of α = 0.05, and using Tukey’s test for means comparison. Blocks and years were set as random effects.
2.8. Community variation
The community stability is expressed by temporal variability of community (Thebault and Loreau, 2005). The coefficient of variation (C.V.) is usually taken as an indicator of temporal variability of community (Bai and Chen, 2000; Thebault and Loreau, 2005). Lower temporal variability of community indicates higher community stability (Yang et al., 2022).
2.9. Habitat suitability
Habitat suitability was investigated in different treatments. Habitat suitability refers to the possibility of an animal taking advantage of a particular habitat (Wang et al., 2008). Vegetation characteristics are often used as indicators of the suitability or quality of small mammal habitats (Jorgensen, 2002). Habitat suitability in different treatments were evaluated from the aspects of productivity, disturbance intensity and habitat shelter. Habitat productivity was defined as the total biomass of plants (i.e., the sum of above ground shrub biomass and herbaceous biomass). Habitat disturbance intensity was measured using stocking capacity, grazing frequency, human activity, and plant diversity in different treatments. Habitat shelter was measured using plant height, coverage and density.
Total biomass and Shannon–Wiener index of plant species, shrub height, and coverage, density and biomass of shrubs and herbaceous plants in different treatments were investigated. These indices were also analyzed by the mixed effects model (Proc mixed, SAS9.2) with a significance level of α = 0.05, using Tukey’s test for means comparison, with blocks and years set as random effects.
3. Results and analysis
3.1. Habitat suitability
Total plant biomass of the reclamation area was significantly higher than that of the other three disturbed areas [F(3, 687) = 48.91, P < 0.001, Table 2]. Total biomass in the grazing areas were lower than in the grazing exclusion area, although there were no statistically significant differences (Table 2). The nutrition balanced value of Reaumuria soongorica was lower than that of other plants (Wu et al., 2010), and R. soongorica was not main food for desert rodents in our study area (Wu et al., 2009). There were significant differences in total biomass removed R. soongorica, which followed in the order: Grazing exclusion area > light grazing area > heavy grazing area [F(2, 513) = 61.77, P < 0.001, Table 2].
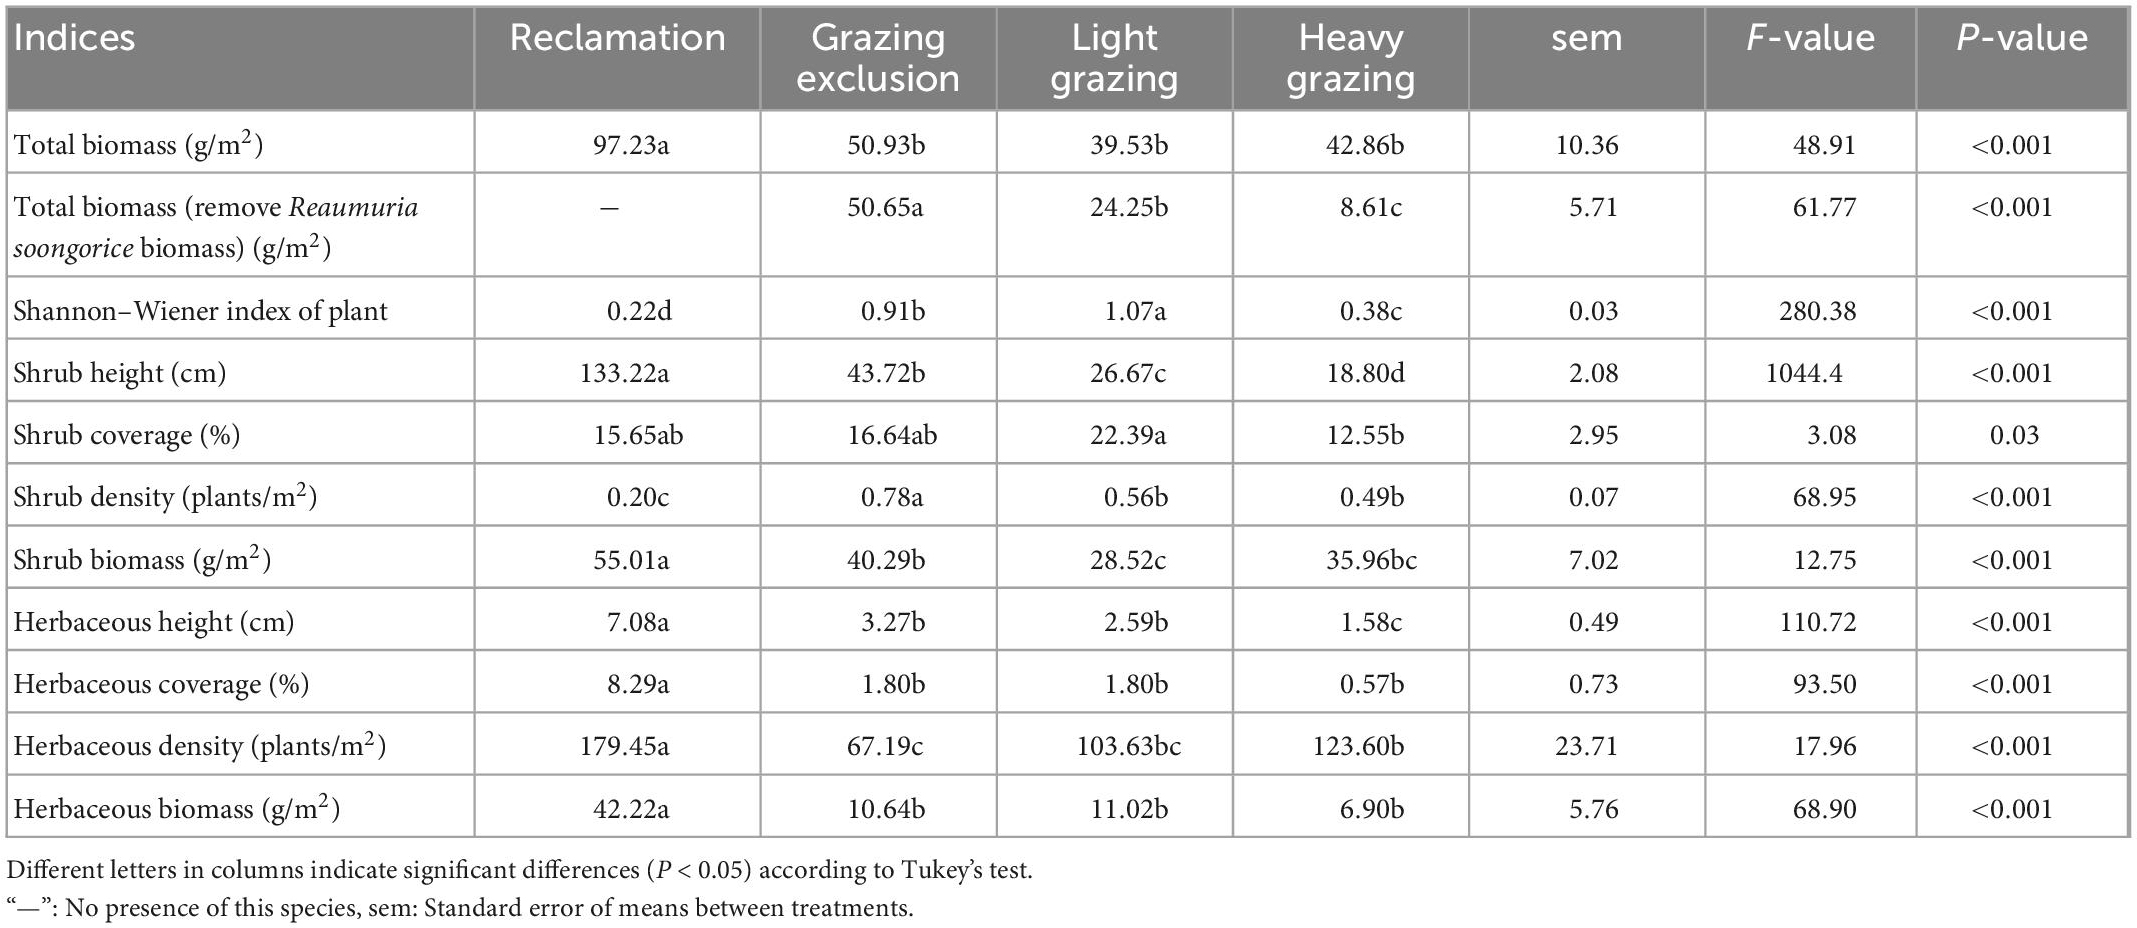
Table 2. Vegetation characteristics in different treatments in the Alxa desert, Inner Mongolia, China, from April 2006 to October 2011.
We measured the degree of habitat disturbance using stocking capacity and plant diversity. Stocking capacity in each habitat were described above, and analysis focused on the plant diversity of disturbed habitats. The Shannon–Wiener index of shrubs showed a significant difference among different treatments [F(3, 706) = 280.38, P < 0.001, Table 2].
There were significant differences in height, coverage and density of plants in different treatments. Shrub height followed a significant order: Reclamation area > grazing exclusion area > light grazing area > heavy grazing area [F(3, 687) = 1044.47, P < 0.001, Table 2). Shrub coverage was highest in the light grazing area, and was lowest was in the heavy grazing area [F(3, 687) = 3.08, P < 0.05, Table 2). Shrub density in grazing exclusion area was significantly higher than that in light grazing area, heavy grazing area, and reclamation area. Reclamation decreased shrub density significantly than other treatments [F(3, 691) = 68.95, P < 0.001, Table 2). Herbaceous height was higher significantly in reclamation than that in other treatment areas, while the lowest was in the grazing exclusion area [F(3, 691) = 110.72, P < 0.001, Table 2). Herbaceous coverage in the reclamation area was significantly higher than that in the other three disturbed habitats [F(3, 460) = 93.50, P < 0.001, Table 2). Herbaceous coverage in the grazing exclusion area and light grazing area were higher than that in the heavy grazing area, although there was no significant difference in herbaceous coverage among different grazing habitats.
3.2. Rodent community structure and diversity
We captured 5,129 rodent individuals belonging to nine species, seven genus, and three families in 6 years. There were three species of Dipodidae, including NTJ, MFJ, and MTTJ; five species of Cricetidae, including midday gerbil (MIG, Meriones meridianus), Mongolian gerbil (MOG, Meriones unguiculatus), desert hamster (DH, Phodopus roborovskii), Chinese hamster (CH, Cricetulus barabensis), and Eversmann’s hamster (EH, Cricetulus eversmanni); one species of Sciuridae: Alashan ground squirrel (S. alaschanicus). The total capture rates both in grazing exclusion area and light grazing area were significantly higher than that in the reclamation area [F(3, 15) = 13.40, P < 0.001, Figure 2]. The reclamation area had a rodent community dominated by MIG [F(4, 20) = 9.48, P < 0.001, Table 3]. NTJ and MIG were the dominant species in the grazing exclusion area [F(6, 30) = 10.77, P < 0.001, Table 3]. Rodent communities in the light grazing [F(6, 30) = 11.43, P < 0.001] and heavy grazing areas were dominated by NTJ and MFJ [F(8, 40) = 18.78, P < 0.001, Table 3].
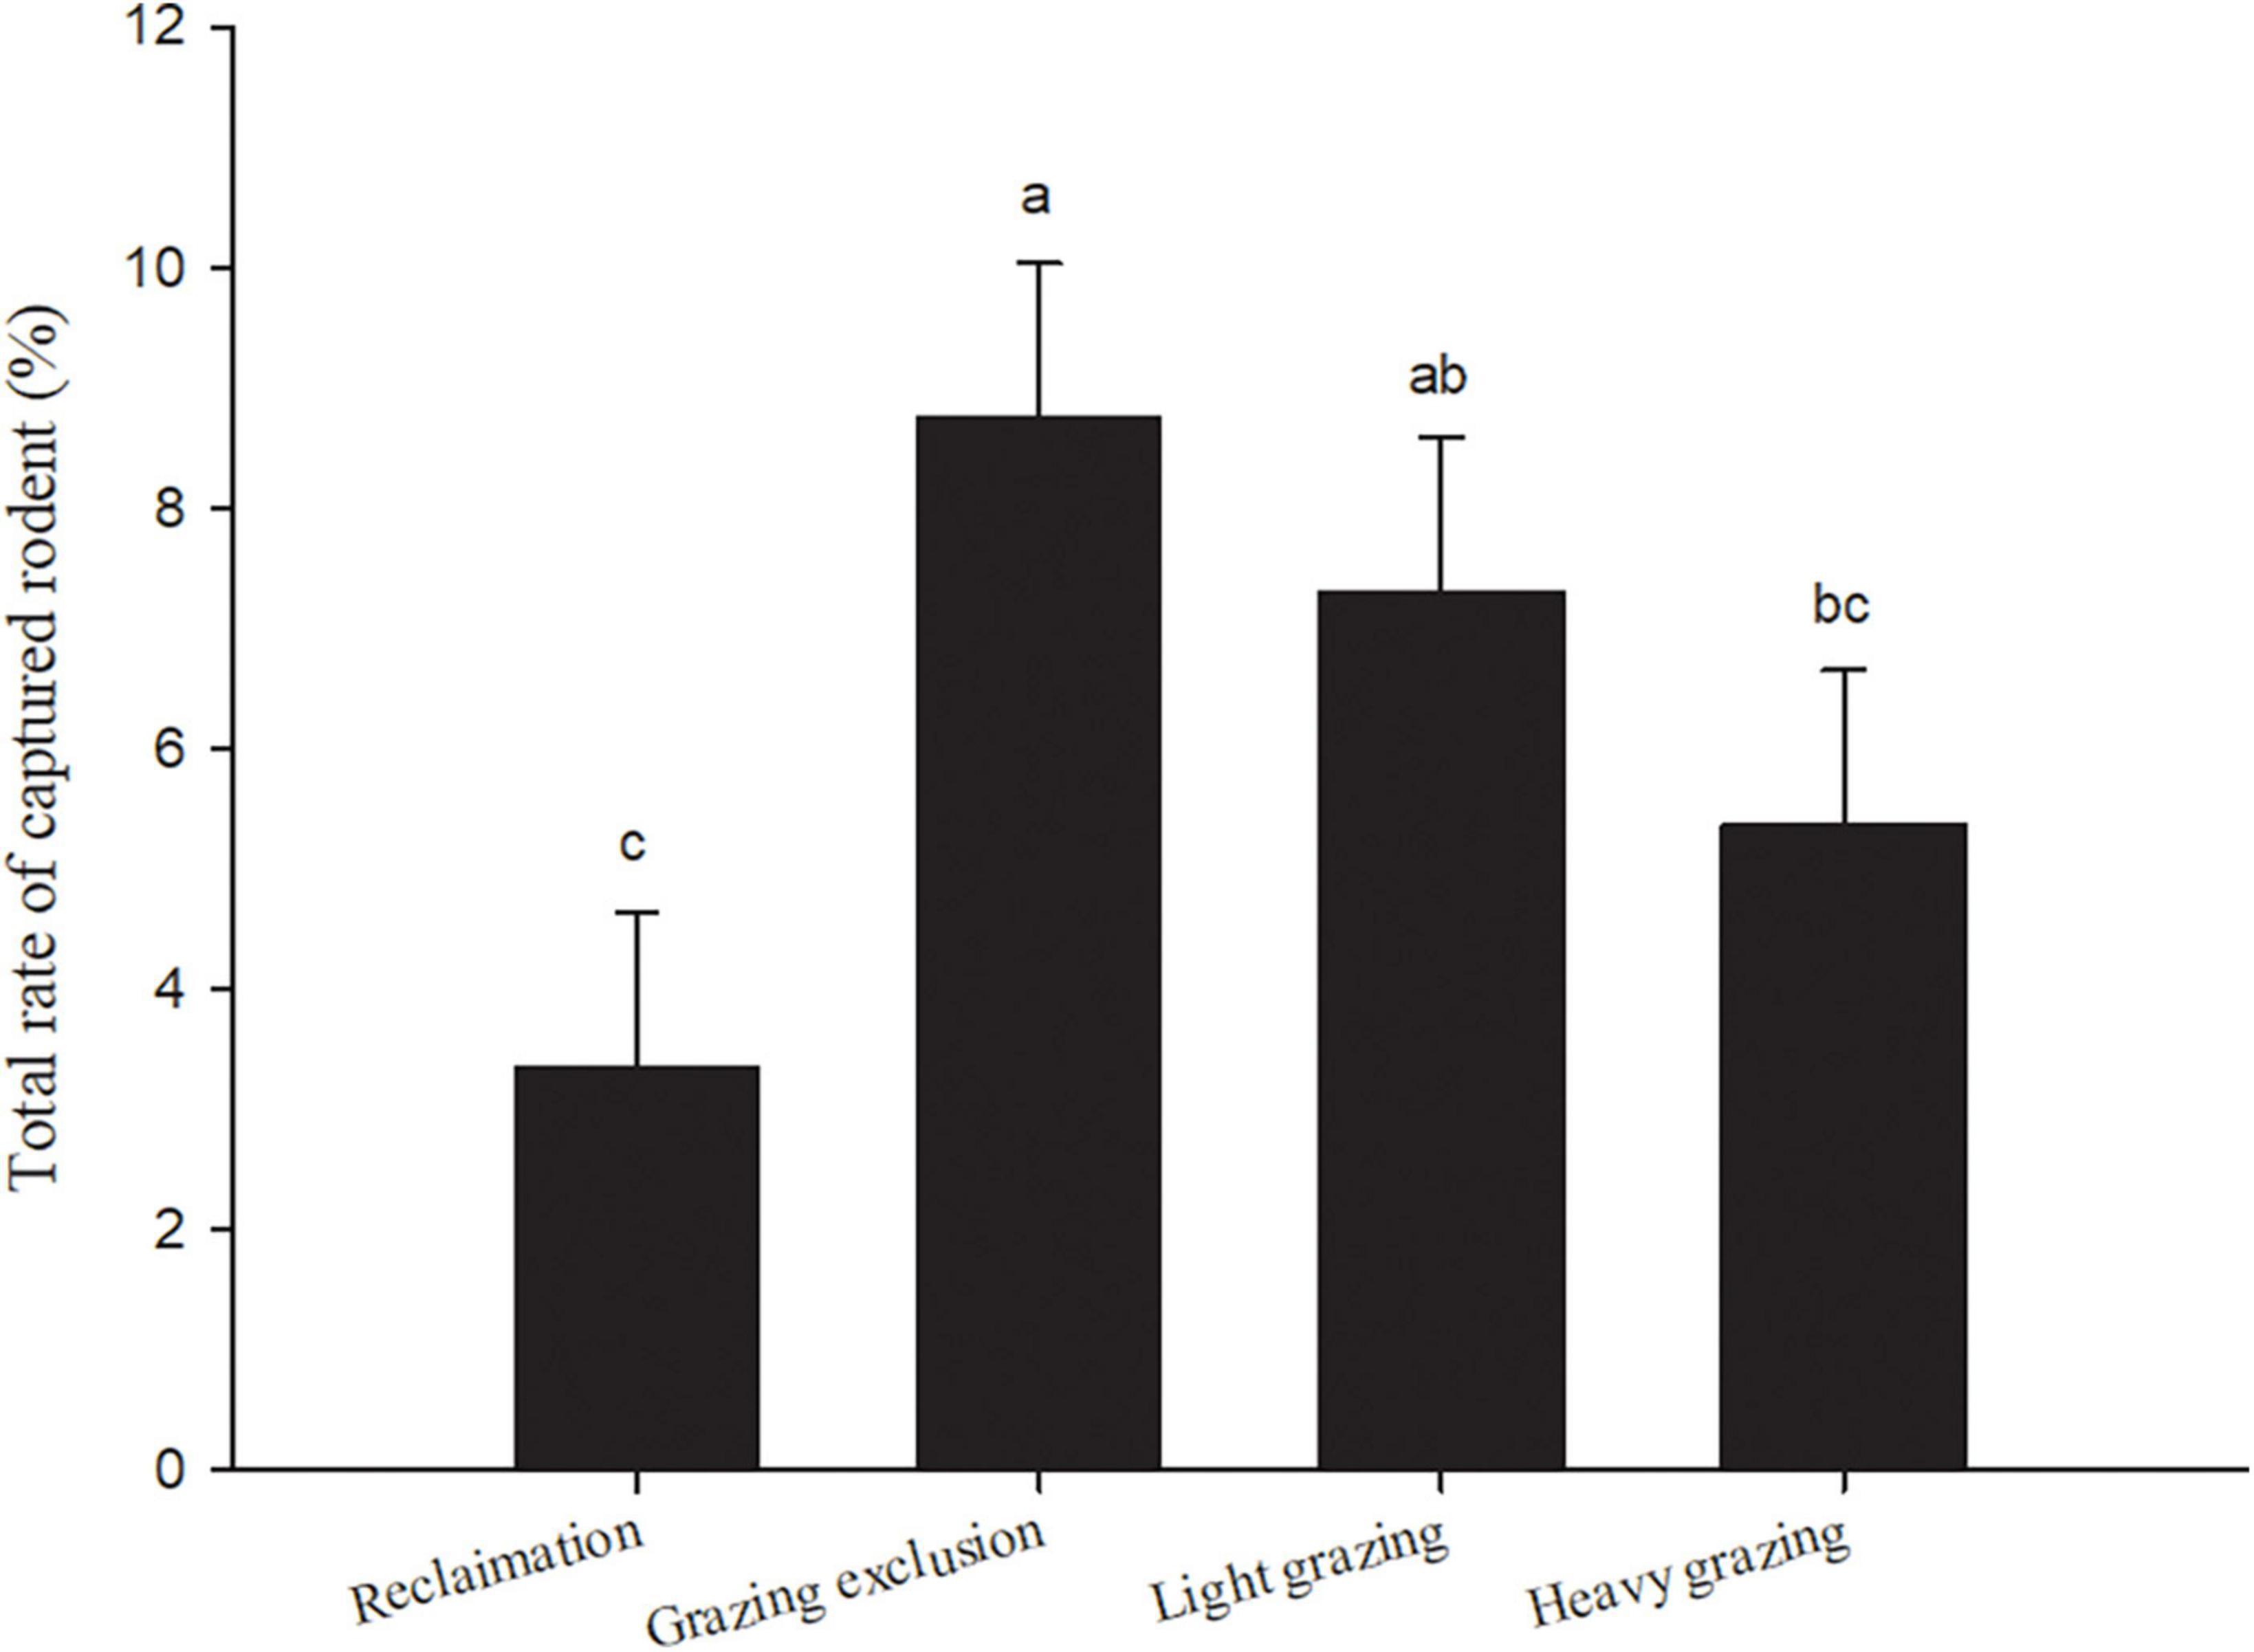
Figure 2. Total rate of captured rodents (means + sem) in different treatments in Alxa desert, Inner Mongolia, China, from April 2006 to October 2011. Different lowercase letters indicate significant differences (p < 0.05) among treatments, according to Tukey’s test.
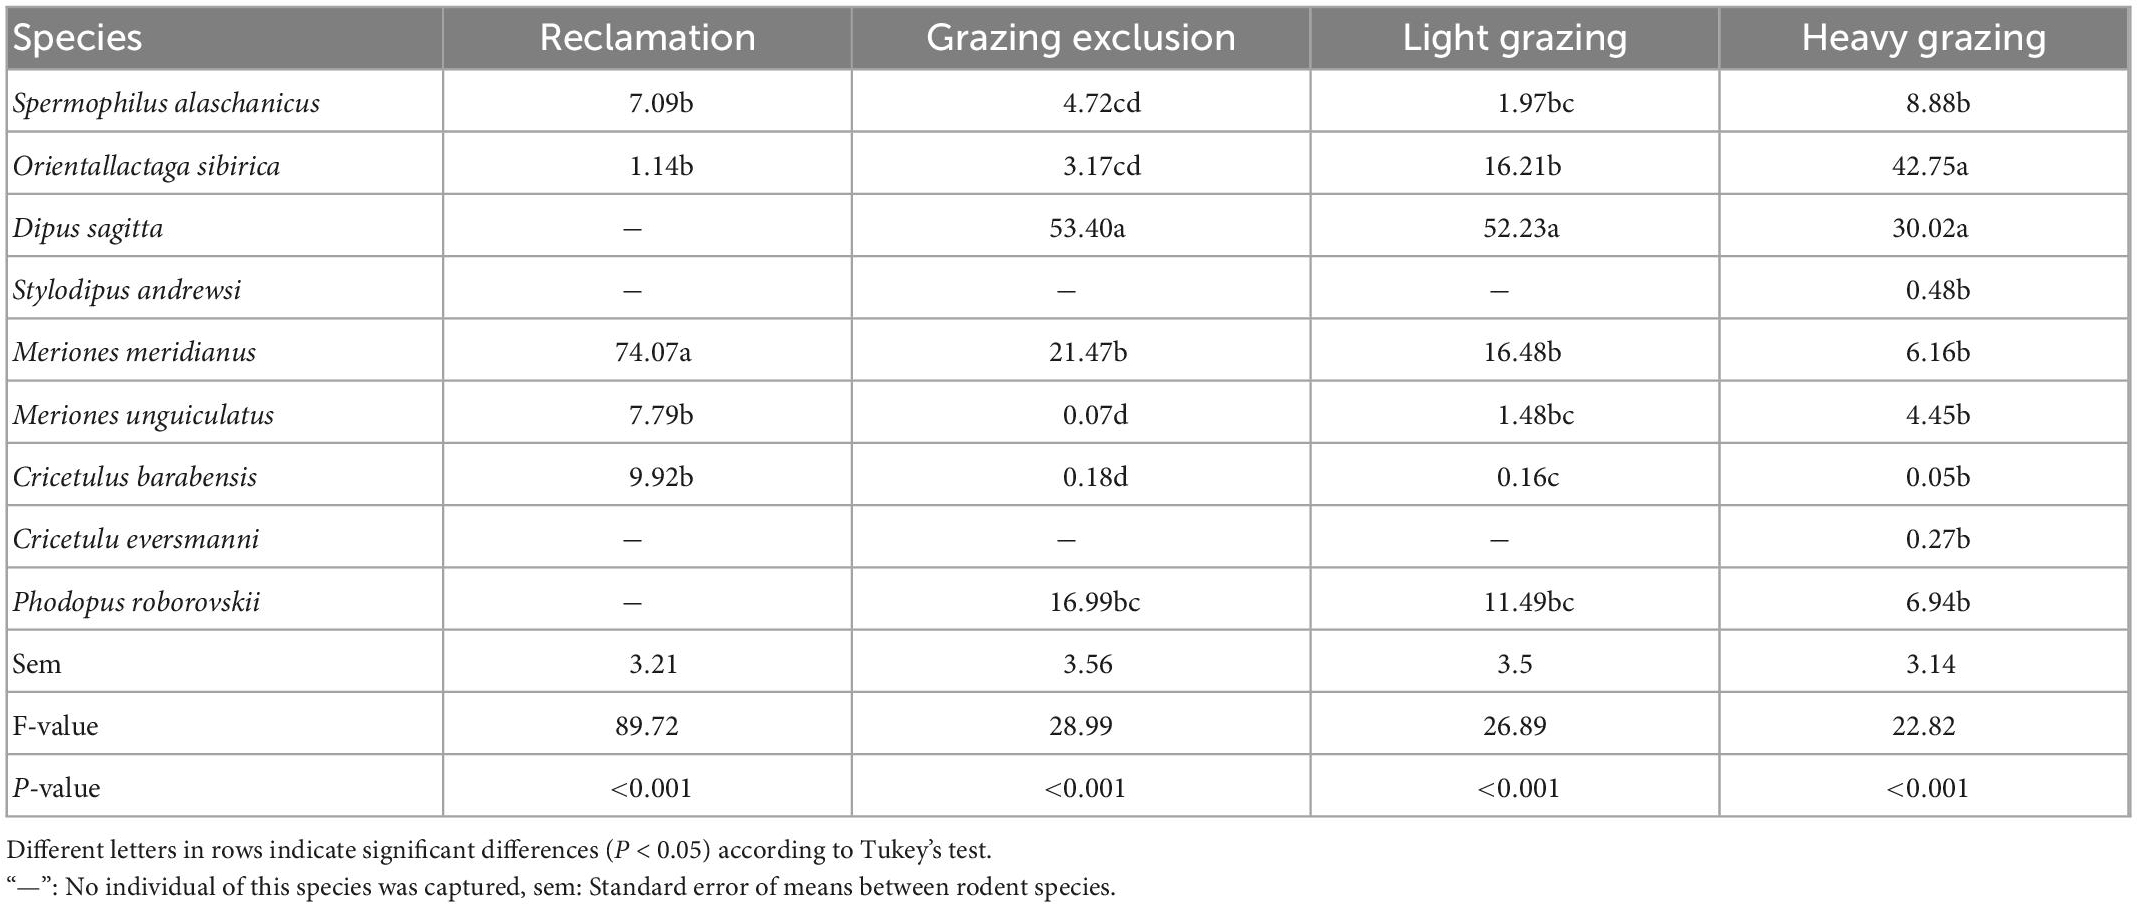
Table 3. Total proportion (%, means + sem) of each rodent species in the rodent community in different treatments in the Alxa desert, Inner Mongolia, China, from April 2006 to October 2011.
Species richness in the reclamation area was significantly lower than in the other three treatments [F(3, 15) = 20.76, P < 0.001), but there was no significant difference between the grazing exclusion area, light grazing area and heavy grazing area (Table 4). Shannon–Wiener index [F(3, 15) = 10.19, P < 0.01) and Simpson’s diversity index [F(3, 15) = 9.09, P < 0.01, Table 4] of the rodent community in the reclamation area were significantly lower than in the other treatments. Both indices showed the following order: Grazing exclusion < light grazing < heavy grazing treatment, although the differences were not statistically significant. The evenness index was not significantly different between the four disturbances (Table 4).
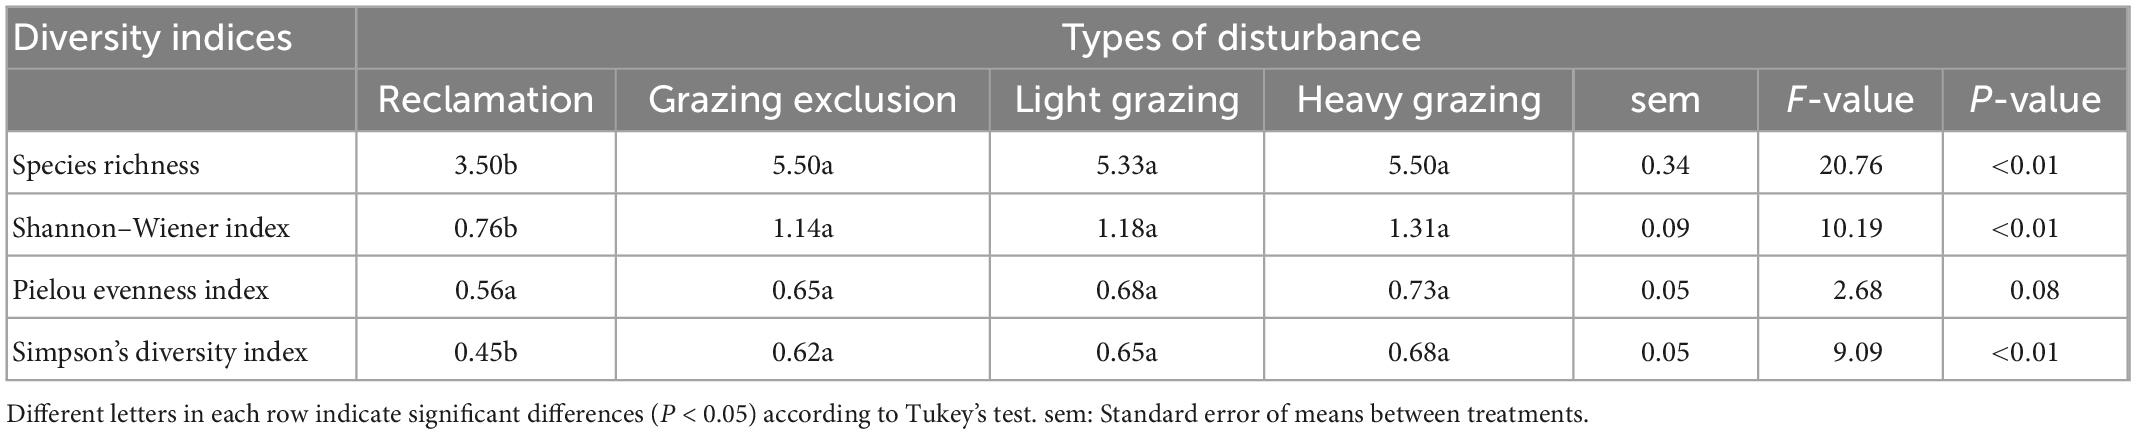
Table 4. Rodent community diversity (means + sem) in different treatments in the Alxa desert, Inner Mongolia, China, from April 2006 to October 2011.
3.3. The composition of life history strategists in different disturbed communities
The species richness of rRF strategists was significantly greater than that of KSS strategists in the reclamation area [F(1, 10) = 19.29, P < 0.01, Figure 3A]. Reclamation decreased KSS strategists’ species richness significantly (F(3, 15) = 58.85, P < 0.001), but did not decrease rRF strategists’ species richness (Figure 4A). KSS strategists had higher species richness than rRF strategists in the other three treatments, although there was no significant difference between the species richness of rRF strategists and KSS strategists in the other three treatments (Figure 3A).
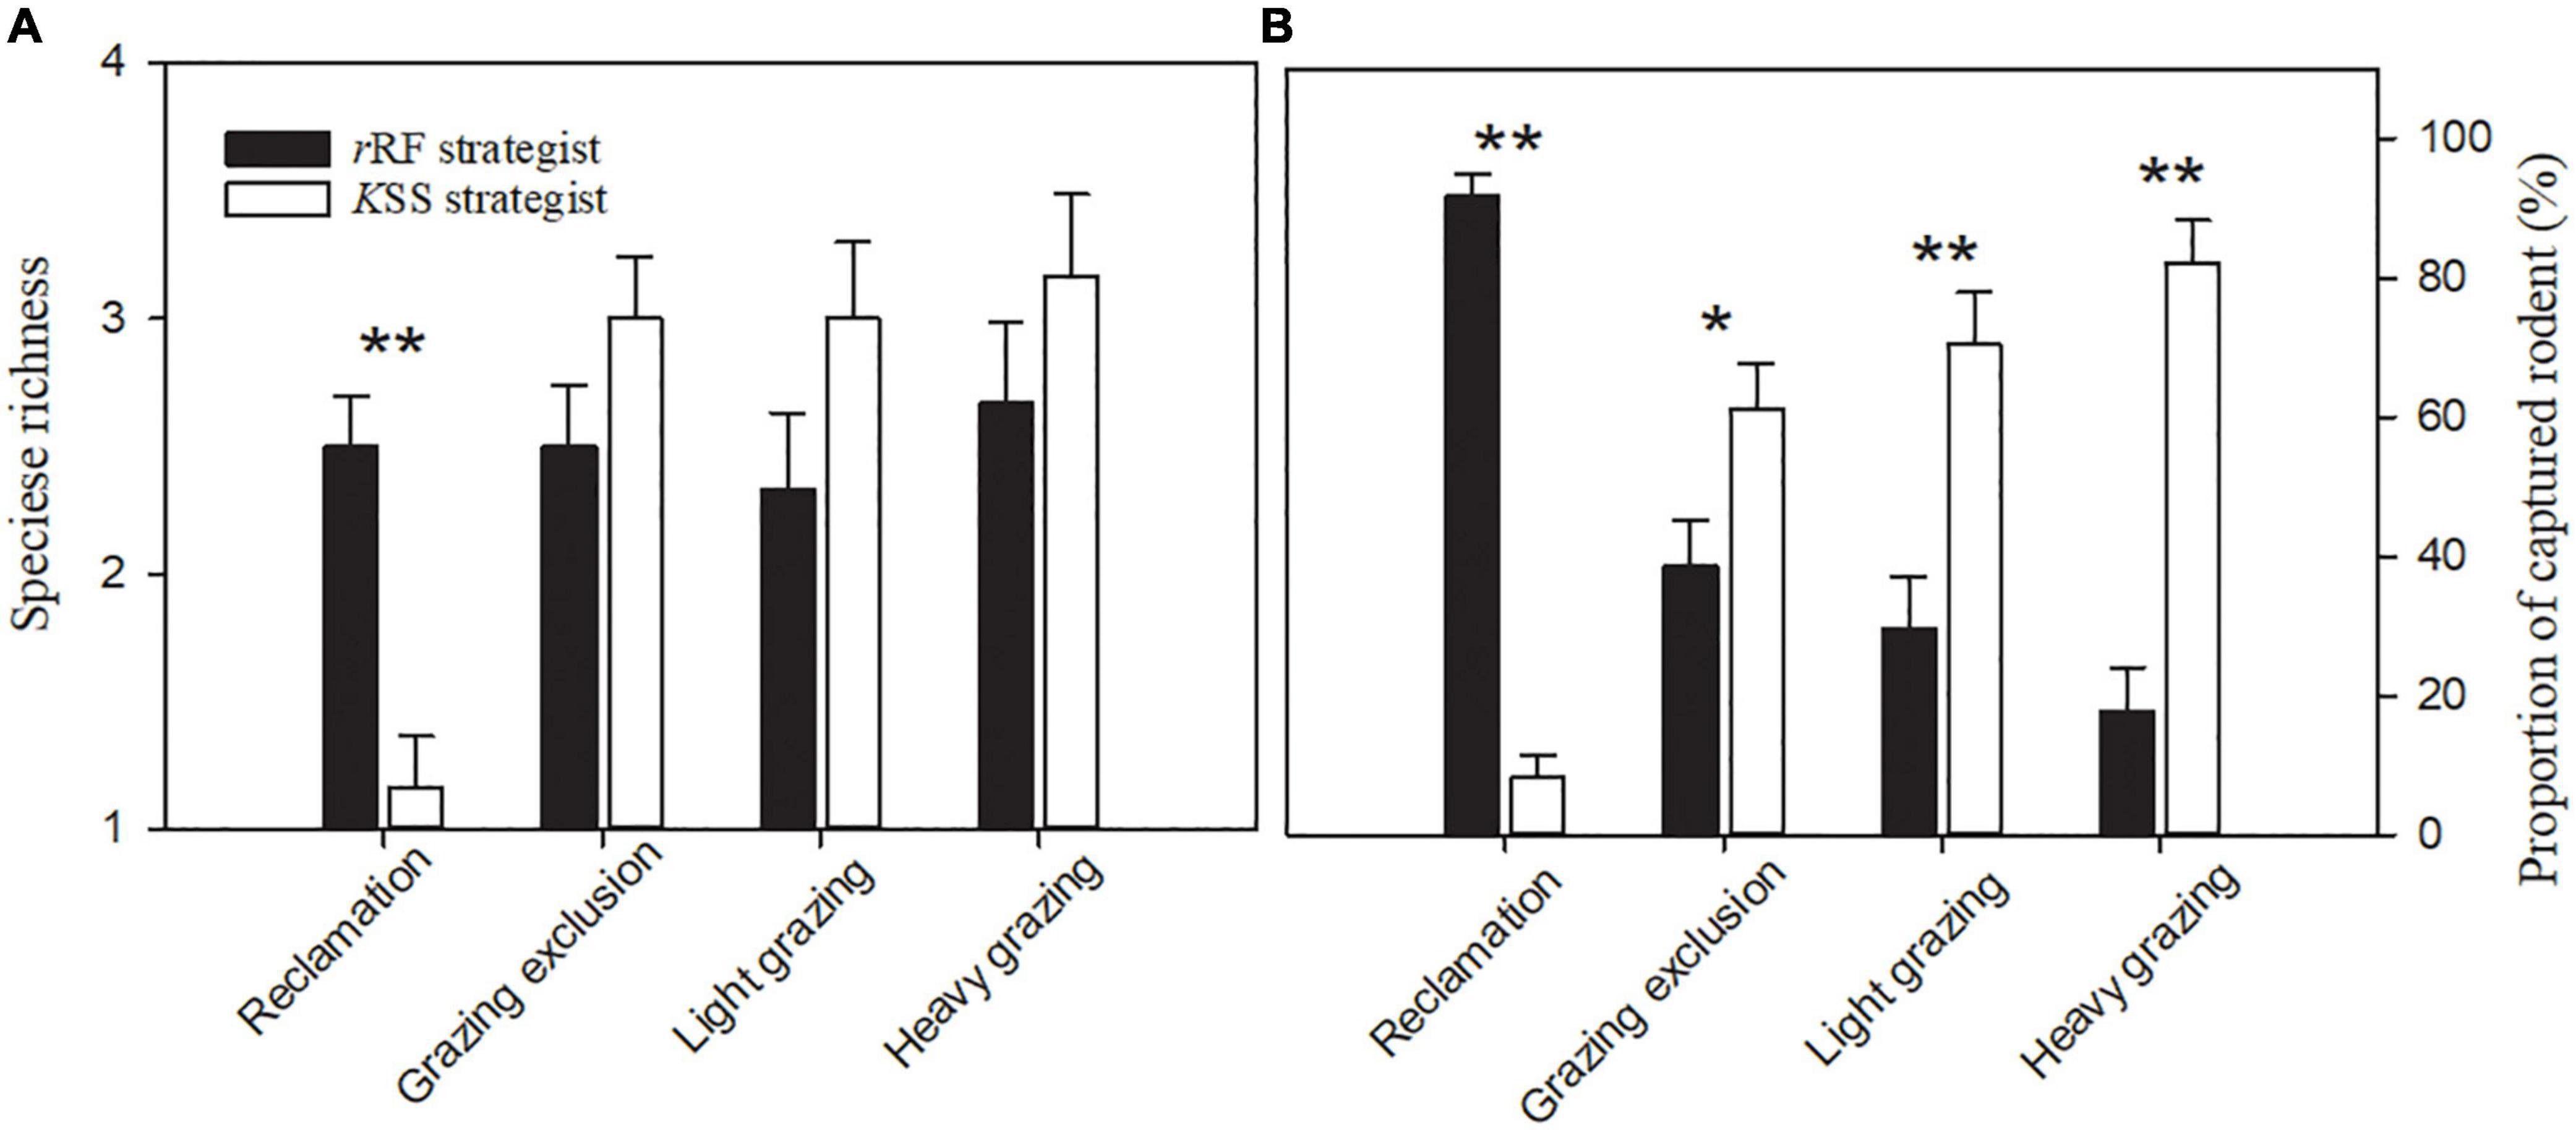
Figure 3. Species richness (A) and proportion of captured rodents (B) (means + sem) with different bionomic strategies in the same treatment in Alxa desert, Inner Mongolia, China, from April to October, 2006 to 2011. Asterisks indicate significant differences (*P < 0.05; **P < 0.01) according to Tukey’s test.
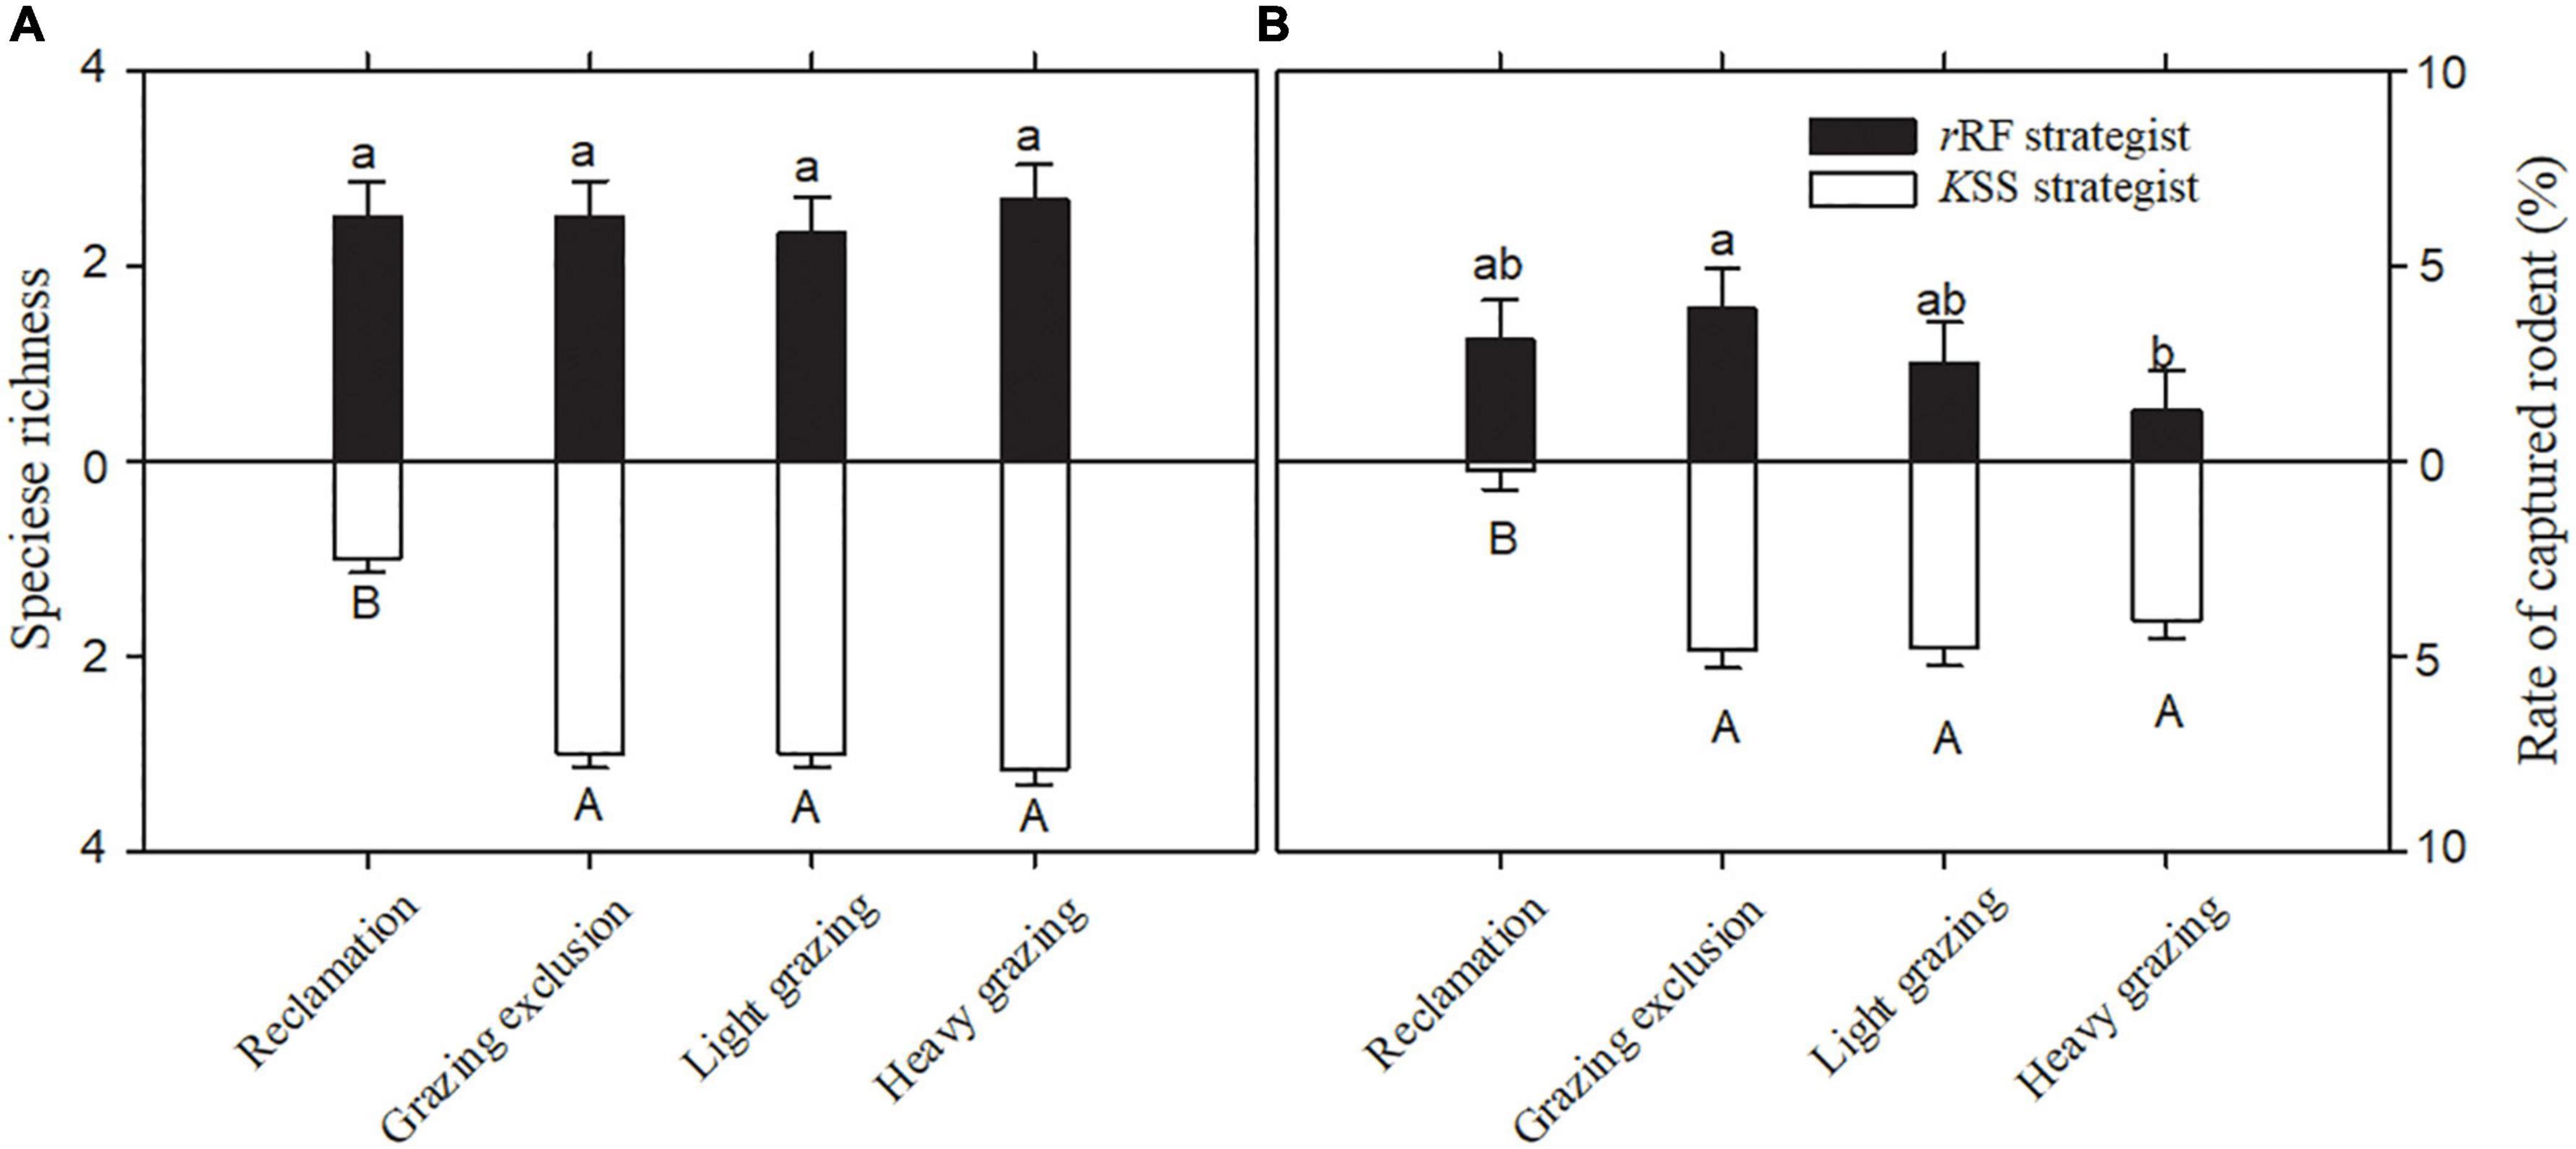
Figure 4. Speciese richness (A) and rate of captured rodents (B) (means + sem) with the same bionomic strategy in different treatments in Alxa desert, Inner Mongolia, China, from April 2006 to October 2011. Different letters indicate significant differences (P < 0.05) of rRF (lowercase letters) and KSS (capital letters) according to Tukey’s test.
The proportion of rRF strategists was significantly higher than that of KSS strategists in the reclamation area [F(1, 10) = 334.86, P < 0.001, Figure 3B], while the opposite was the case in the other three areas [grazing exclusion: F(1, 10) = 5.99, P < 0.05, light grazing: F(1, 10) = 14.81, P < 0.01, heavy grazing: F(1, 10) = 54.59, P < 0.001, Figure 3B], and the proportion of KSS-strategists significantly increased with grazing intensity [P = 0.034, 0.003, 0.0001, Figure 3B]. The capture rate of rRF strategists in the grazing exclusion areas was the highest among all treatments, while the lowest was in the heavy grazing treatment [F(3, 15) = 67.36, P < 0.001, Figure 4B]. The capture rate of KSS strategists in the reclamation area was the lowest among all treatments [F(3, 15) = 67.35, P < 0.001, Figure 4B]. There was no significant effect of grazing on the KSS strategist capture rate (Figure 4B).
3.4. Rodent community stability
The W-statistic values in the reclamation area and heavy grazing area fluctuated greatly, but the fluctuation in the light grazing area and grazing exclusion area were smaller than in the other areas (Figure 5). The analysis of variance showed that the W-statistic values in the heavy grazing treatment were significantly higher than that in the reclamation area [F(3, 20) = 4.58, P < 0.05, Figure 5]. The W-statistic value in the reclamation area was less than 0 in most years, but was greater than 0 in most years in the other treatments. The cumulative biomass dominance of the rodent community in the grazing exclusion, light grazing, and heavy grazing treatments were dominated by individual species, while the cumulative abundance dominance of the rodent community was influenced by multiple species. However, the opposite result was observed in the reclamation area (Figure 5).
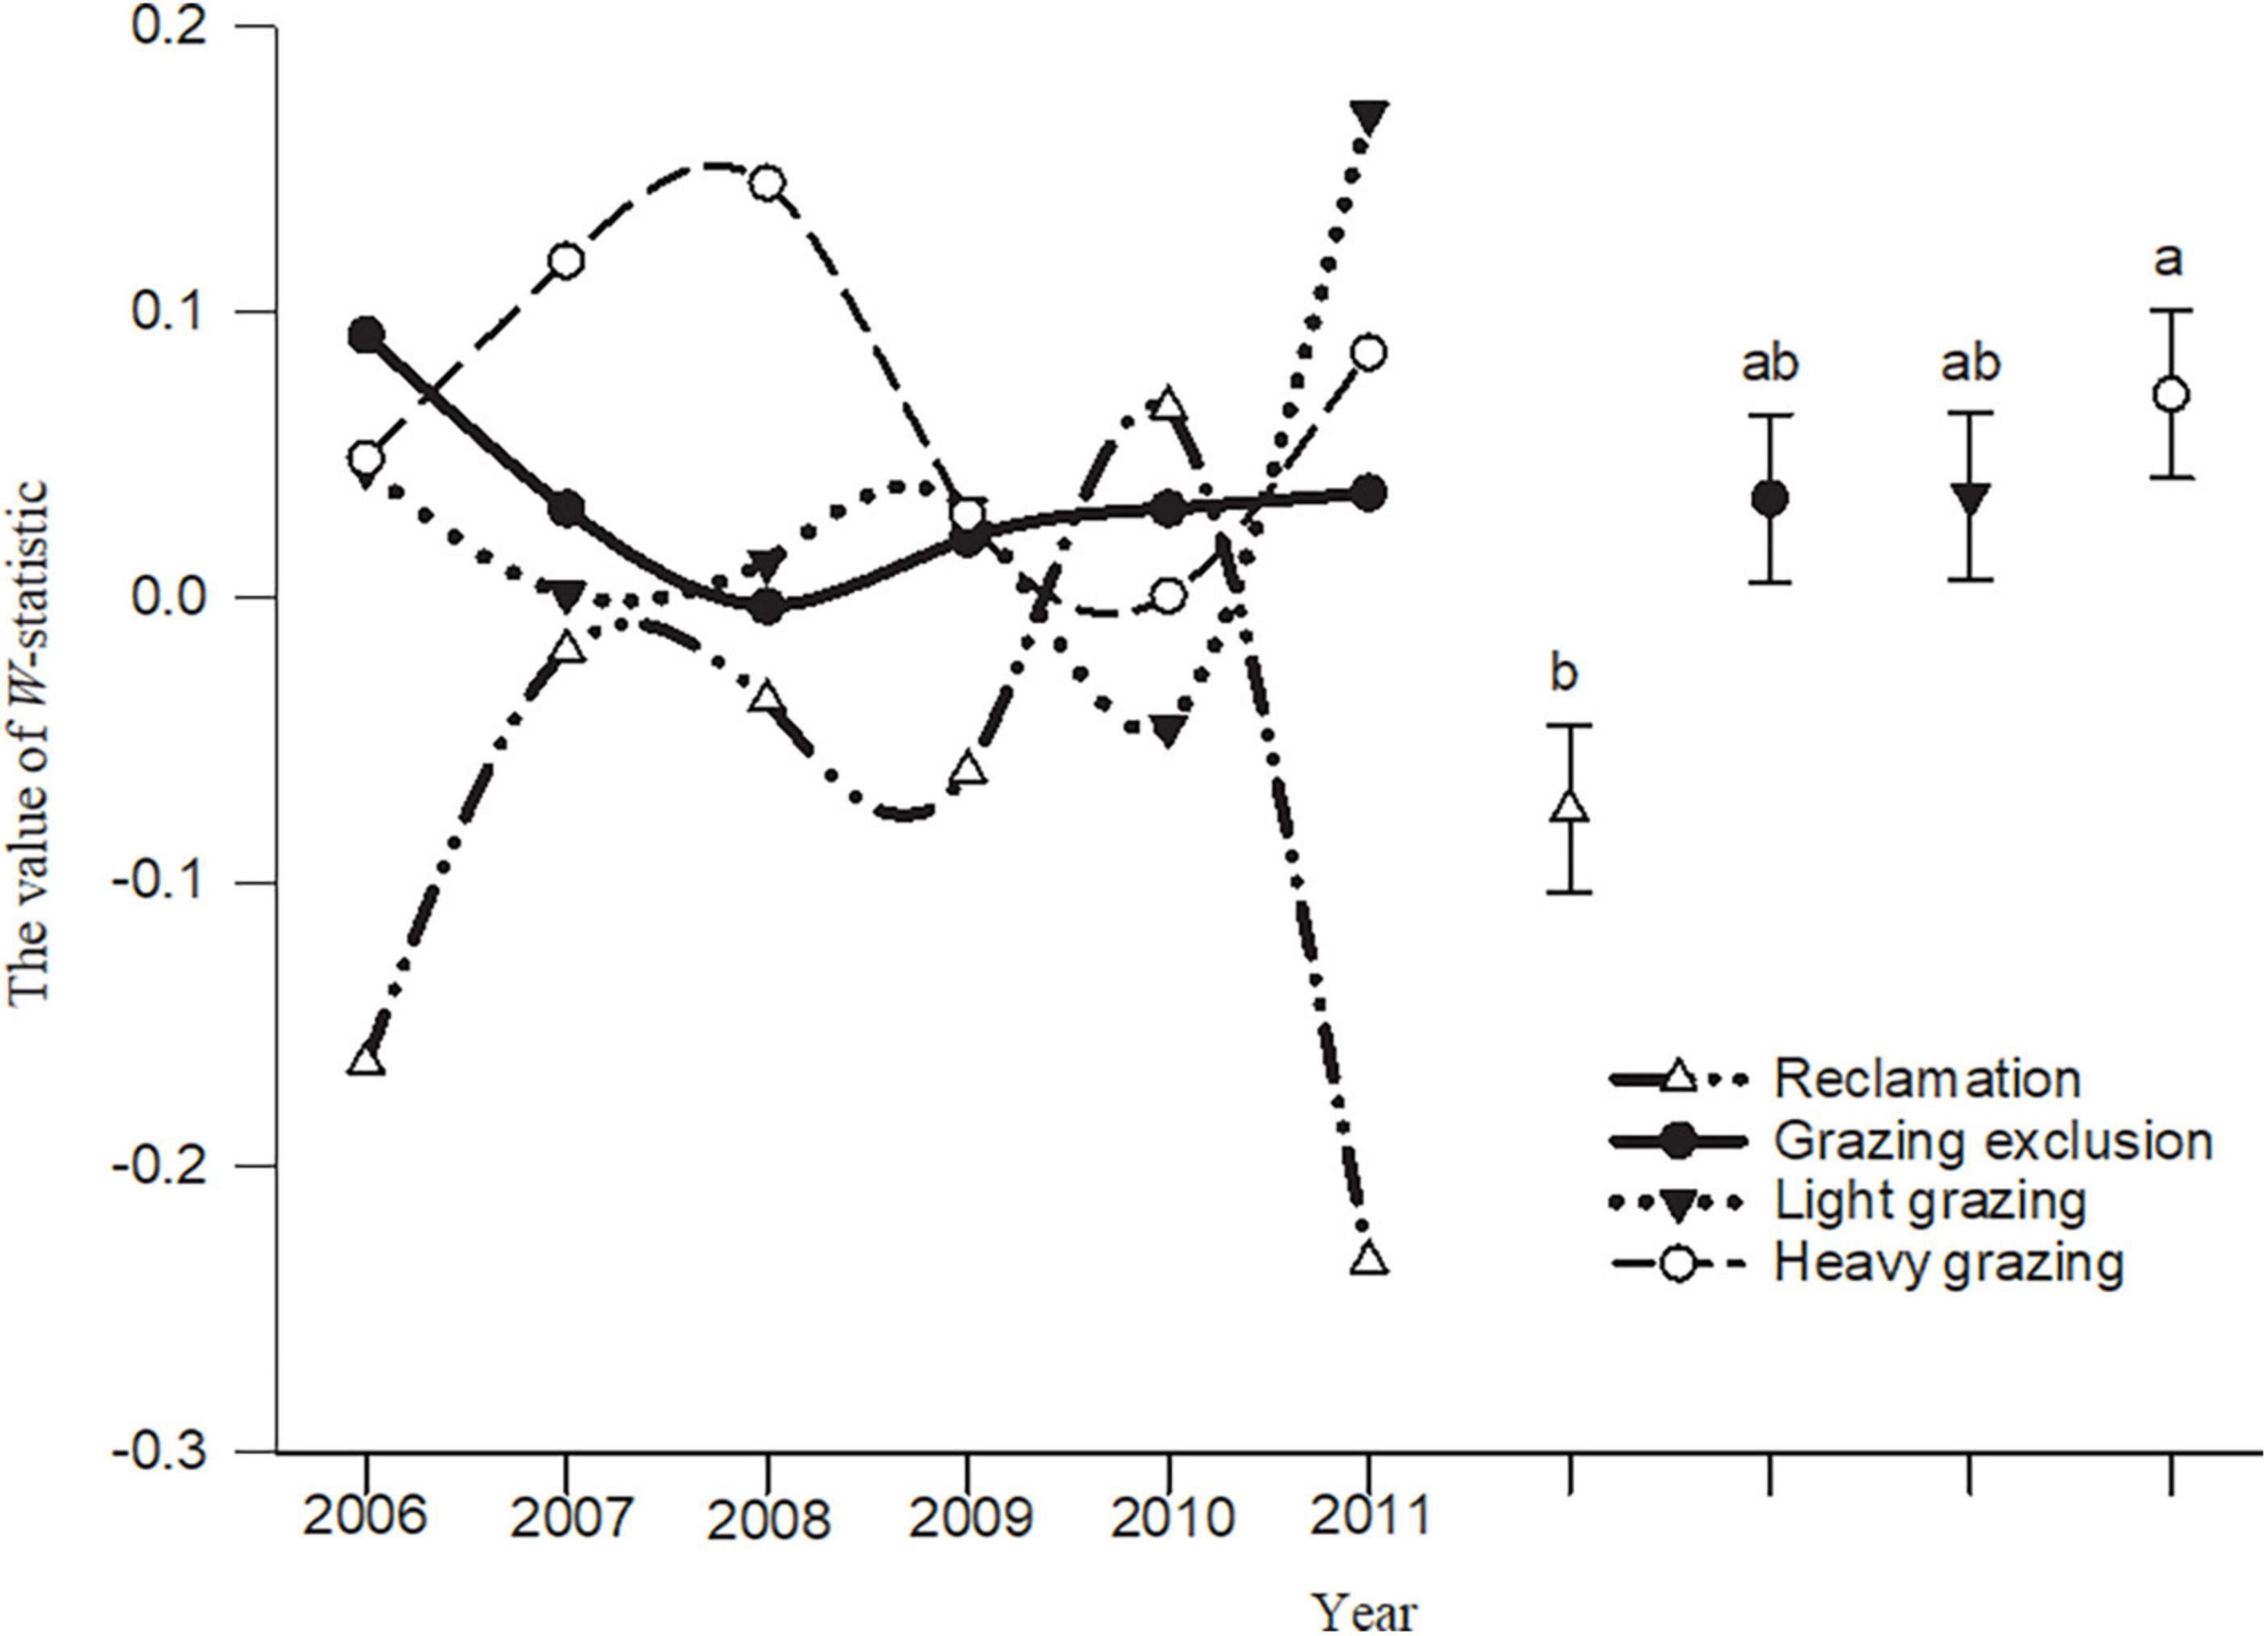
Figure 5. W-statistic dynamic and mean comparison (means ± sem) in different treatments in Alxa desert, Inner Mongolia, China, from April 2006 to October 2011. Different letters indicated significant differences (P < 0.05) according to Tukey’s test.
Regardless of treatment, variability of dominant species richness in all rodent communities was the lowest, while the richness of the non-dominant species showed stronger variability (Table 5). In the grazing exclusion, light grazing and heavy grazing treatments, rodent species with larger body size had a low variation coefficient, and large variation mainly occurred in rodent species with smaller body size (Table 5). In the reclamation treatment, variability of all rodents was high (>70%, Table 5). S. andreusi and C. eversmanni were rare species in the study sites, with a low capture rate, reflected in greater variability (Table 5). Variability of total abundance in reclamation treatment was the highest (Table 5).
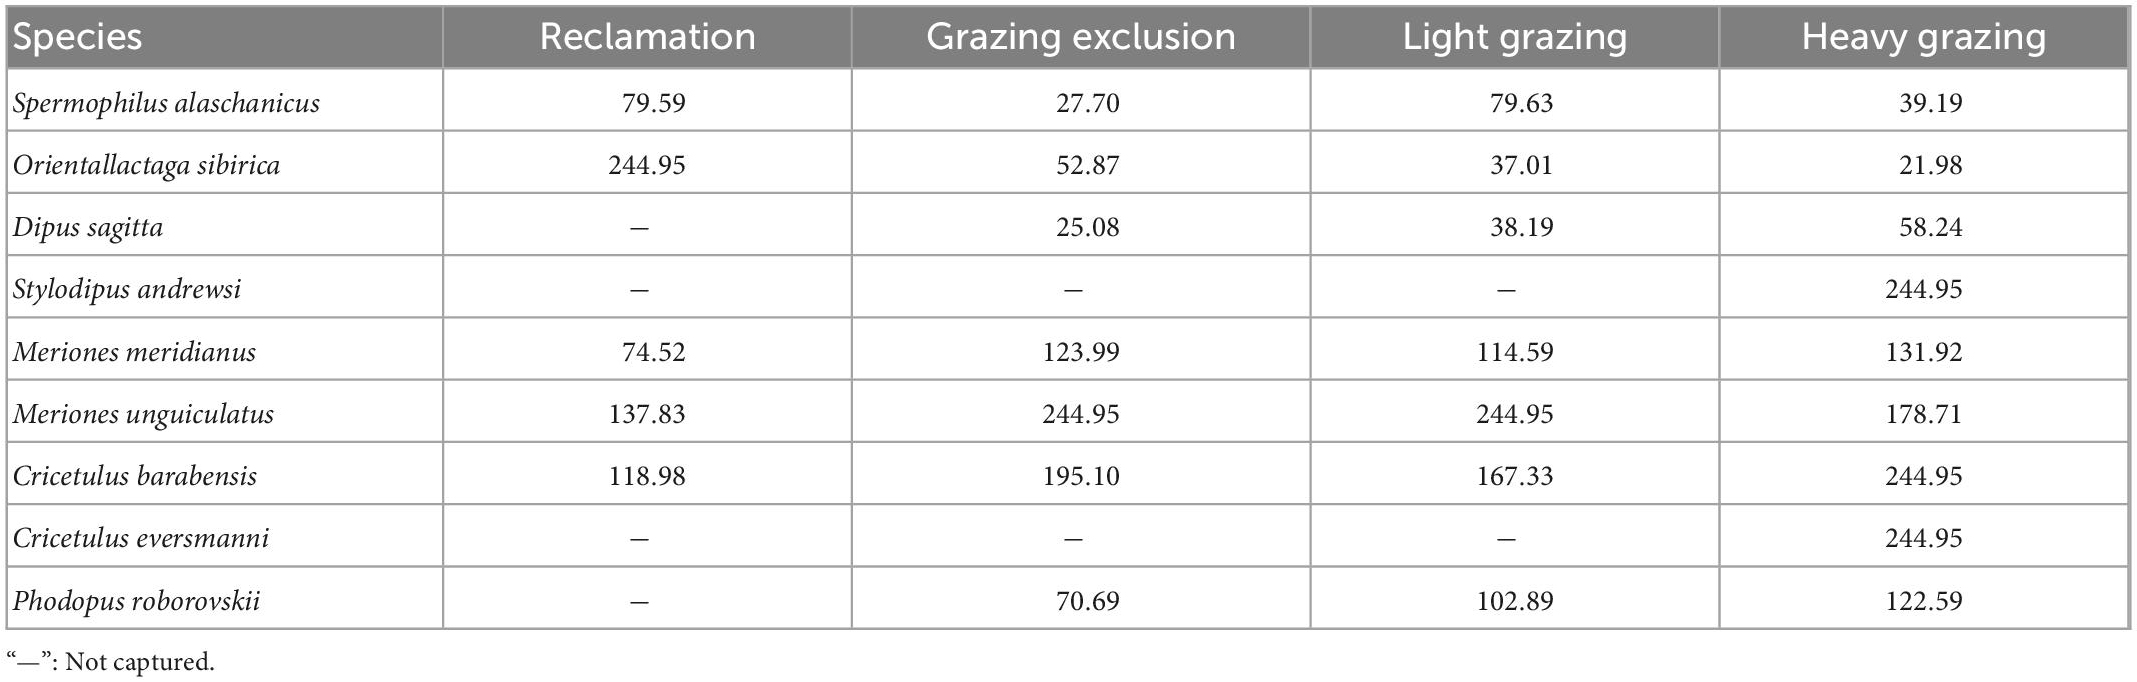
Table 5. Variability of rodent populations subjected to different disturbances (%) in Alxa desert, Inner Mongolia, China, from April 2006 to October 2011.
Regarding the community structure of different strategists, variation in the population abundance, and species richness of KSS strategists in the reclamation area was greater than that of rRF strategists, but in other treatments the opposite was found (Table 6). The variability of population abundance and species richness of KSS strategists in the grazing exclusion area were the lowest (Table 6). The abundance variability of rRF strategists in the heavy grazing area was the highest (Table 6). The species richness variability of rRF strategists in the grazing exclusion and light grazing areas were the highest (Table 6). The maximum variation of rodent total abundance was in the reclamation area, while the minimum was in the light grazing sites (Table 6). The maximum variation of total species richness was in the light grazing treatment, while the minimum was in the grazing exclusion treatment (Table 6).

Table 6. Variability of rodent communities subjected to different disturbances (%) in Alxa desert, Inner Mongolia, China, from April 2006 to October 2011.
4. Discussion and conclusion
4.1. Habitat suitability
The relationship between stability and disturbance may depend on productivity (Fränzle, 1979). The plant productivity of the reclamation area was the highest compared to the other areas. There was no significant difference in productivity among the grazing exclusion areas and grazing areas, but heavy grazing significantly reduced the biomass of plants with higher nutrient value. This indicates that grazing did not affect plant total biomass but did affect plants with high nutritional value. Studies have shown that herbivorous feeders are selective to the forage due to the characteristics of growth and development and nutritional of the plants (Nagaishi and Takemoto, 2018). Some studies have found that livestock in grassland tend to choose high-quality plants rather than plants with low palatability (Peco et al., 2005). Fleischner (1994) also argued that heavy grazing results in a decline in pasture quality, so plant species that are resistant to grazing become dominant. Therefore, our results support the view that livestock grazing affected plant quality rather than plant total biomass. Heavy grazing reduced the shrub height and coverage of plant. Plant diversity indicates that the intensity of interference was the largest in the reclamation area, followed by the heavy grazing area, light grazing area and grazing exclusion area (Table 2 and Figure 6). According to habitat productivity, plant quality and animal shelter, rodents in the heavy grazing area faced the greatest environmental pressure, followed by the light grazing area, grazing exclusion area, and reclamation area (Figure 6). The intermediate disturbance hypothesis suggests that moderate interference suppresses competitive exclusion of dominant species and thus has a higher diversity than under severe and mild interference (Connell, 1978). There are some evidences from previous studies that moderate disturbance increases rodent diversity in forest ecosystems (Sullivan et al., 2000; Yang et al., 2018, 2022). However, we did not observed higher diversity of rodents in light grazing area, and dominant species was not suppressed under light grazing. These results may be caused by the differences from disturbance type, species in desert ecosystem. Disturbances cause habitat fragmentation, which will reduce the number of species and species diversity (Krishna et al., 2008; Hagen et al., 2012). According to human activities, rodent in reclamation area experience more disturbance from various farming activities than that in grazing area, and the habitat is completely changed, therefore the rodent number and diversity rate at the minimum level in the reclamation area.
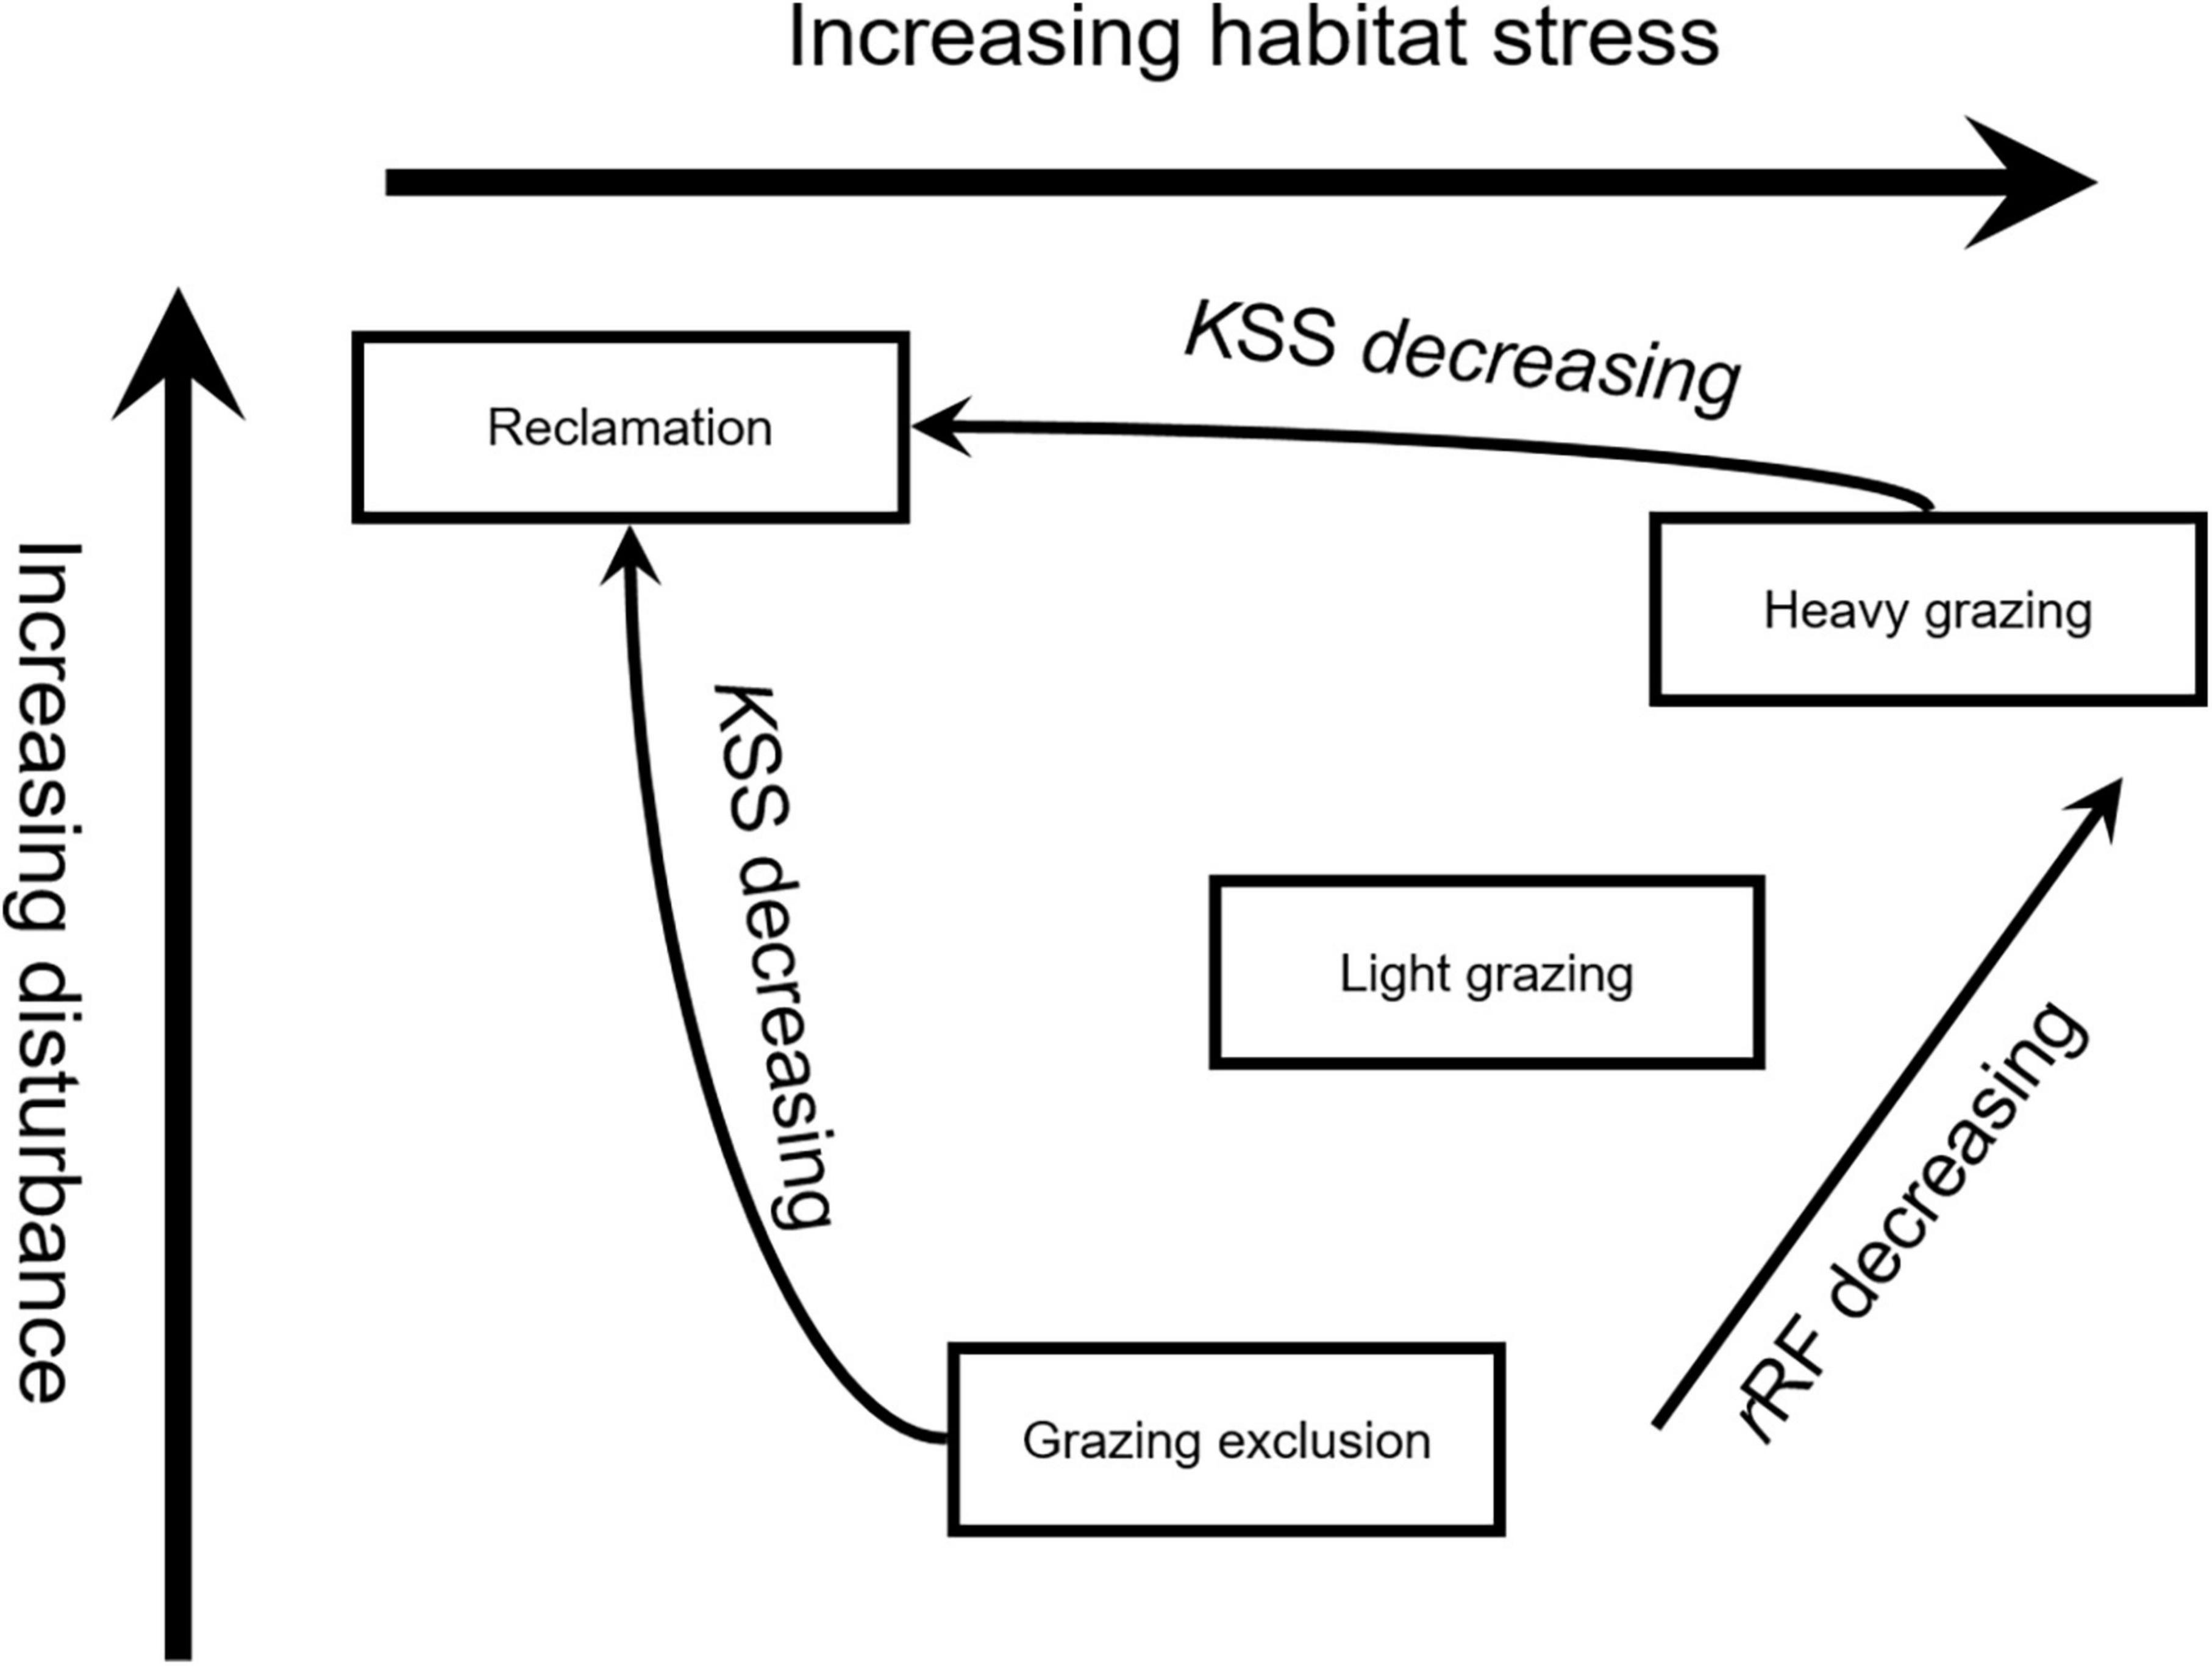
Figure 6. Effect of disturbances on rodents with different bionomic strategies.
4.2. Stability and diversity
In our study, the reclamation area had a significantly lower rodent community diversity. Reclamation reduced community stability by increasing temporal variability of community. The relationship between diversity and stability has been debated for a long time (Hu et al., 2022). The diversity-stability hypothesis suggested that the higher the species diversity in a community, the more stable the community (MacArthur, 1955). May has also argued that simple communities are more stable (May, 1973). However, some scholars believe that these two views are not in conflict. Tilman (1995) suggested that when external interference damages some species, the number of other non-injured species who are competing with the injured species in the community will increase. This compensation can increase community total biomass stability, but also cause variation in species abundance. He argued that this conclusion not only supported May’s consideration of the impact of diversity on the population, but also applied the diversity-stability hypothesis to community and ecology processes. McCann (2000) showed that diversity usually contributes to stability, but that diversity is not the driving force of stability. Grazing did not make significant difference in the diversity of rodent community, but, changed the dominant species among different grazing disturbances. The effect of grazing on the rodent community stability may come from the response of species or functional groups with different responsiveness to disturbances (de Valpine, 2000). Life history characteristics are often used as the main indicators of community functional (Kirwan et al., 2009; Rodríguez and Ojeda, 2014; Lin et al., 2022). Functional stability was one of the important aspects of stability in ecological communities (Huelsmann and Ackermann, 2022).
From the habitat suitability and the characteristics of different strategists, we can understand the different changes in the reclamation and grazing areas among different strategists. For animals, habitat shelter has an important impact on habitat selection, and predation risk may result in the specialization of smaller mammals in habitats with excellent shelter. The reclamation areas with high shrub height, herbaceous height, herbaceous coverage, and herbaceous density, these conditions provided excellent shelter for rRF strategists with small body size (Cui et al., 2005). On the other hand, rRF strategists with a higher reproductive rate and a longer reproductive period, which is beneficial to increase the population in a short time. Studies have shown that when habitat heterogeneity occurs and the original ecosystem becomes less stable, a higher population size is better able to cope with the impact of heterogeneity (Shadrina and Vol’pert, 2016). Above, we can understand the changes in the reclaimed areas among different strategists. Grazing areas have higher biodiversity than reclaimed areas, which means they have higher stability. How do these communities acquire the stability in response to disturbances? It is universally acknowledged that increase in animal body size reduces environmental resistance in many ways. It maybe that there is an increase in the number of KSS strategists in the community, the increased resistance of the community. In our study, our proposed hypothesis was verified. At the same time, our research may answer these three questions from the respect of life history strategy. From a diversity perspective, the ecosystems with intermediate disturbance are more stable, in other words, with higher resilient and resilient.
4.3. Stability and resistance, resilience, and variability
McNaughton (1977) argued that species with different adaptation patterns, whose abundance is volatile, may be a mechanism for the community to remain stable in a volatile environment. The adaptation patterns here were likely to be related to life history strategies of the species (McNaughton, 1977). Studying how different systems are dominated by animals with different life history strategies can help us solve the problem of resistance and resilience (Pimm, 1984).
Pianka (1970) argued that increase in animal body size reduces environmental resistance in many ways. Animals with larger body size have fewer potential predators, and more adaptable to the environment (Meador and Brown, 2015). The creatures living longer than 1 year have to deal with physical or biological conditions of the whole range in order to survive, while those living less than 1 year will only experience part of that range during their short- life time. So animals with longer longevity and larger size can better buffer changes in the environment, and their population is not subject to such dramatic change as relatively smaller and shorter-lived animals. A stable population also provides the necessary conditions for a stable community. Studies in the same study area have shown that the survival rate of the large jerboas is less affected by grazing than MIG which is smaller in size (Yuan, 2013). Mammals with a fast strategy have relatively higher reproductive elasticity and lower adult survival elasticity, while mammals with a slow strategy have lower reproductive elasticity and higher adult or juvenile survival elasticity. Since the decline in adult survival is not conducive to the slow strategy mammalian population, the resilience of the slow strategist will be slower once the outside interference exceeds its ability to resist environmental resistance (Heppell et al., 2000). MacArthur and Wilson (1967) argued that high-fecundity strategists can recover from frequent density independent deaths through higher population growth rates. Therefore, KSS strategists have higher resistance and lower resilience to external environmental changes. The rRF strategists have lower resistance and higher resilience to external environment changes (MacArthur and Wilson, 1967; Pianka, 1970; Heppell et al., 2000). Lepš et al. (1982) argued that two different aspects of stability may be determined by life strategy and external variables of the dominant species. The increase in KSS strategists in a community imply an increase in community resistance, whereas an increase in rRF strategists implies an increase in community resilience. Variability in community stability reflects the effect of external variables on the community (Lepš et al., 1982). In our study, the reclamation disturbance significantly reduced species richness, the capture ratio, and the capture rate of KSS strategists. Therefore, reclamation had a significant negative effect on KSS strategists, so the reclamation area had lower community resistance. The resistance variability of rodent community in reclamation was also greater than in the other three disturbed areas. So reclamation reduced rodent community resistance. With an increase in grazing intensity, the capture rate of KSS strategists and rRF strategists showed a downward trend, and the declining trend of rRF strategists was more significant, which caused the dominant advantage of KSS strategists in the community to gradually increase. The results from W-values also indicate that KSS strategists in the grazing exclusion area and grazing areas were dominant, particularly in the heavy grazing treatment. So grazing has a greater impact on rRF strategists than on KSS strategists (Figure 6). Because the heavy grazing area had lower rRF strategy abundance than the other treatments, the heavy grazing area had lower community resilience, and resilience variability was higher than in the other three disturbed regions. There was no significant difference in species richness and population abundance for KSS strategists among the heavy grazing area and other areas, and the variability of this resistance was not markedly different among the other three disturbance treatments, so the effect of grazing on community resistance was not significant. Because the heavy grazing area had a lower rRF strategist abundance than the grazing exclusion area, so the heavy grazing area had lower community resilience, and resilience variability was larger than in the other two disturbed areas. Therefore, grazing reduced community resilience.
In summary, the increase of KSS strategists means the increase of resistance of the community. The increase of rRF strategists means the increase of community resilience. Reclamation reduced rodent community stability by increasing temporal variability of community, reducing rodent community resistance as shown by decreasing dominance of KSS strategists, and increased the resistance variability of the rodent community by increasing the variability of abundance and richness for KSS strategists. Grazing reduced rodent community resilience by reducing the dominance of rRF strategists, and increased the resilience variability of the rodent community by increasing the variability of abundance and richness for rRF strategists. Despite the limitations of the theory and data analysis, these findings enhance the understanding of the structure and resilience of ecosystems. Sensitivity to disturbances varies between species, so it is difficult to further explain the hidden mechanisms behind this response (Ma et al., 2004). However, some insights can be gained if sensitive species are classified in terms of bionomic strategy, as this helps elucidate which kind of bionomic strategy sensitive species take when subject to varying disturbances.
Data availability statement
The datasets analyzed for this study can be found in the Science DB: https://doi.org/10.57760/sciencedb.07040.
Ethics statement
This animal study was reviewed and approved by the Research Ethics Review Committee of Inner Mongolia Agricultural University (NND2017012).
Author contributions
SY, H-PF, and X-DW designed the experiments and mapped out the manuscript. SY analyzed the data and wrote the initial draft of the manuscript. H-TZ, XL, and X-XY were responsible for the majority of data collection and assisted with revisions of the manuscript. All authors contributed to the article and approved the submitted version.
Funding
This experiment was funded by Program for improving the Scientific Research Ability of Youth Teachers of Inner Mongolia Agricultural University (BR220106), the National Natural Science Foundation of China (32060256 and 32060395), Science and Technology Project of Inner Mongolia Autonomous Region (2021GG0108), the 2022 Inner Mongolia Autonomous Region Youth Science and Technology Talent Development Plan (NJYT22044), Major Science and Technology Project of Inner Mongolia Autonomous Region (2021ZD0006), and Grassland Ecological Protection and Restoration Treatment Subsidy.
Acknowledgments
We wish to acknowledge Andreas Wilkes and Prof. G. D. Han for revising the manuscript. Thanks are also due to M. H. Cha, Y. J. Han, F. S. Zhang, E. Jin, and S. N. Ji for data collection, G. H. Zhuang, H. J. Gan, G. H. Sang, and M. L. Zhao for assistance in the field.
Conflict of interest
The authors declare that the research was conducted in the absence of any commercial or financial relationships that could be construed as a potential conflict of interest.
Publisher’s note
All claims expressed in this article are solely those of the authors and do not necessarily represent those of their affiliated organizations, or those of the publisher, the editors and the reviewers. Any product that may be evaluated in this article, or claim that may be made by its manufacturer, is not guaranteed or endorsed by the publisher.
References
Armitage, K. B. (2017). Hibernation as a major determinant of life-history traits in marmots. J. Mammal. 98, 321–331. doi: 10.1093/jmammal/gyw159
Badyaev, A. V. (2005). Stress-induced variation in evolution: from behavioural plasticity to genetic assimilation. Proc. Biol. Sci. 272, 877–886. doi: 10.1098/rspb.2004.3045
Bagchi, S., Singh, N. J., Briske, D. D., Bestelmeyer, B. T., McClaran, M. P., and Murthy, K. (2017). Quantifying long-term plant community dynamics with movement models: implications for ecological resilience. Ecol. Appl. 27, 1514–1528. doi: 10.1002/eap.1544
Bai, Y.-F., and Chen, Z.-Z. (2000). Effects of long-term variability of plant species and functional groups on stability of a leymus Chinensis community in the Xilin River Basin, Inner Mongolia. Acta Phytoecol. Sin. 24, 641–647. doi: 10.3321/j.issn:1005-264X.2000.06.001
Bakran-Lebl, K., Bieber, C., Adamík, P., Fietz, J., Morris, P., Pilastro, A., et al. (2011). Survival rates in a small hibernator, the edible dormouse: a comparison across Europe. Ecography 34, 683–692. doi: 10.1111/j.1600-0587.2010.06691.x
Bieber, C., Juskaitis, R., Turbill, C., and Ruf, T. (2012). High survival during hibernation affects onset and timing of reproduction. Oecologia 169, 155–166. doi: 10.1007/s00442-011-2194-7
Bruelheide, H., and Luginbuhl, U. (2009). Peeking at ecosystem stability: making use of a natural disturbance experiment to analyze resistance and resilience. Ecology 90, 1314–1325. doi: 10.1890/07-2148.1
Chen, L.-D., and Fu, B.-J. (2000). Ecological significance, characteristics and types of disturbance. Acta Ecol. Sin. 20, 581–586. doi: 10.3321/j.issn:1000-0933.2000.04.008
Clarke, K. R. (1990). Comparisons of dominance curves. J Exp Mar Biol Ecol. 138, 143–157. doi: 10.1016/0022-0981(90)90181-b
Connell, J. H. (1978). Diversity in tropical rain forests and coral reefs. Science 199, 1302–1310. doi: 10.1126/science.199.4335.1302
Connell, S. D., and Ghedini, G. (2015). Resisting regime-shifts: the stabilising effect of compensatory processes. Trends Ecol. Evol. 30, 513–515. doi: 10.1016/j.tree.2015.06.014
Cui, Q. H., Jiang, Z. G., Lian, X. M., and Su, J. P. (2005). Factors influencing habitat selection of root voles (Microtus oeconomus). Acta Theriol. Sin. 25, 45–51. doi: 10.16829/j.slxb.2005.01.008
de Valpine, P. (2000). A new demographic function maximized by life-history evolution. Proc. Biol. Sci. 267, 357–362. doi: 10.1098/rspb.2000.1009
Díaz-Delgado, R., Lloret, F., Pons, X., and Terradas, J. (2002). Satellite evidence of decreasing resilience in mediterranean plant communities after recurrent wildfires. Ecology 83, 2293–2303.
Eldridge, D. J., Whitford, W. G., and Duval, B. D. (2009). Animal disturbances promote shrub maintenance in a desertified grassland. J. Ecol. 97, 1302–1310. doi: 10.1111/j.1365-2745.2009.01558.x
Fleischner, T. L. (1994). Ecological costs of livestock grazing in Western North America. Conservat. Biol. 8, 629–644. doi: 10.1046/j.1523-1739.1994.08030629.x
Flowerdew, J. R., Shore, R. F., Poulton, S. M. C., and Sparks, T. H. (2004). Live trapping to monitor small mammals in Britain. Mammal Review 34, 31–50. doi: 10.1046/j.0305-1838.2003.00025.x
Frank, A. S., Dickman, C. R., Wardle, G. M., and Greenville, A. C. (2013). Interactions of grazing history, cattle removal and time since rain drive divergent short-term responses by desert biota. PLoS One 8:e68466. doi: 10.1371/journal.pone.0068466
Fränzle, O. (1979). “Comparitive studies on species diversity of plant associations in the U.S.A. and Northern Germany,” in Landscape Ecology/Landschaftsforschung und Ökologie, ed. J. Schmithüsen (Dordrecht: Springer Netherlands), 113–126.
Ghalambor, C. K., McKay, J. K., Carroll, S. P., and Reznick, D. N. (2007). Adaptive versus non-adaptive phenotypic plasticity and the potential for contemporary adaptation in new environments. Funct. Ecol. 21, 394–407. doi: 10.1111/j.1365-2435.2007.01283.x
Grimm, N. B., and Fisher, S. G. (1989). Stability of periphyton and macroinvertebrates to disturbance by flash floods in a desert stream. J. North Am. Benthol. Soc. 8, 293–307. doi: 10.2307/1467493
Gunderson, L. H. (2000). Ecological resilience—in theory and application. Annu. Rev. Ecol. Systemat. 31, 425–439. doi: 10.1146/annurev.ecolsys.31.1.425
Hagen, M., Kissling, W. D., Rasmussen, C., De Aguiar, M. A. M., Brown, L. E., Carstensen, D. W., et al. (2012). “Biodiversity, species interactions and ecological networks in a fragmented world,” in Global Change in Multispecies Systems, Part 1, eds U. Jacob and G. Woodward (Cambridge, MA: Academic Press), 89–210.
Hairston, N. G., Allan, J. D., Colwell, R. K., Futuyma, D. J., Howell, J., Lubin, M. D., et al. (1968). The relationship between species diversity and stability: an experimental approach with protozoa and bacteria. Ecology 49, 1091–1101. doi: 10.2307/1934492
Heppell, S. S., Caswell, H., and Crowder, L. B. (2000). Life histories and elasticity patterns: perturbation analysis for species with minimal demographic data. Ecology 81, 654–665.
Hilborn, R., Redfield, J. A., and Krebs, C. J. (1976). On the reliability of enumeration for mark and recapture census of voles. Can. J. Zool. 54, 1019–1024. doi: 10.1139/z76-114
Hodgson, D., McDonald, J. L., and Hosken, D. J. (2015). What do you mean, ‘resilient’? Trends Ecol. Evol. 30, 503–506. doi: 10.1016/j.tree.2015.06.010
Hu, J., Amor, D. R., Barbier, M., Bunin, G., and Gore, J. (2022). Emergent phases of ecological diversity and dynamics mapped in microcosms. Science 378, 85–89. doi: 10.1126/science.abm7841
Huelsmann, M., and Ackermann, M. (2022). Community instability in the microbial world. Science 378, 29–30. doi: 10.1126/science.ade2516
Jones, A. L., and Longland, W. S. (1999). Effects of cattle grazing on salt desert rodent communities. Am. Midland Natur. 141, 1–11.
Jorgensen, E. E. (2002). Small mammals: consequences of stochastic data variation for modeling indicators of habitat suitability for a well-studied resource. Ecol. Indicat. 1, 313–321. doi: 10.1016/s1470-160x(02)00027-4
Kelt, D. A. (2011). Comparative ecology of desert small mammals: a selective review of the past 30 years. J. Mammal. 92, 1158–1178. doi: 10.1644/10-mamm-s-238.1
Kirwan, L., Connolly, J., Finn, J. A., Brophy, C., Luscher, A., Nyfeler, D., et al. (2009). Diversity-interaction modeling: estimating contributions of species identities and interactions to ecosystem function. Ecology 90, 2032–2038. doi: 10.1890/08-1684.1
Krebs, C. J. (1966). Demographic changes in fluctuating populations of Microtus californicus. Ecol. Monogr. 36, 239–273. doi: 10.2307/1942418
Krishna, A., Guimarães, P. R. Jr., Jordano, P., and Bascompte, J. (2008). A neutral-niche theory of nestedness in mutualistic networks. Oikos 117, 1609–1618. doi: 10.1111/j.1600-0706.2008.16540.x
Lepš, J., Osbornová-Kosinová, J., and Rejmánek, M. (1982). Community stability, complexity and species life history strategies. Vegetatio 50, 53–63. doi: 10.1007/bf00120678
Lin, W. H., Lai, S. M., Davis, A. J., Liu, W. C., and Jordan, F. (2022). A network-based measure of functional diversity in food webs. Biol. Lett. 18:20220183. doi: 10.1098/rsbl.2022.0183
Ma, K.-M., Fu, B.-J., and Chen, J.-D. (2004). “Progresses and perspective of ecological research,” in Research Advances on Contemporary Landscape Ecology, eds W. H. Li and J. Z. Zhao (Beijing: China Meteorological Press), 534–553.
MacArthur, R. (1955). Fluctuations of animal populations and a measure of community stability. Ecology 36, 533–536. doi: 10.2307/1929601
MacArthur, R. H., and Wilson, E. O. (1967). The Theory of Island Biogeography. Princeton, NJ: Princeton University Press.
May, R. M. (1973). Stability in randomly fluctuating versus deterministic environments. Am. Natur. 107, 621–650. doi: 10.1086/282863
McNaughton, S. J. (1977). Diversity and stability of ecological communities: a comment on the role of empiricism in ecology. Am. Natur. 111, 515–525. doi: 10.1086/283181
Meador, M. R., and Brown, L. M. (2015). Life history strategies of fish species and biodiversity in eastern USA streams. Environ. Biol. Fishes 98, 663–677. doi: 10.1007/s10641-014-0304-1
Nagaishi, E., and Takemoto, K. (2018). Network resilience of mutualistic ecosystems and environmental changes: an empirical study. R. Soc. Open Sci. 5:180706. doi: 10.1098/rsos.180706
Nimmo, D. G., Mac Nally, R., Cunningham, S. C., Haslem, A., and Bennett, A. F. (2015). Vive la resistance: reviving resistance for 21st century conservation. Trends Ecol. Evol. 30, 516–523. doi: 10.1016/j.tree.2015.07.008
Ojeda, R. A., and Tabeni, S. (2009). The mammals of the monte desert revisited. J. Arid Environ. 73, 173–181. doi: 10.1016/j.jaridenv.2007.09.008
Oliver, T. H., Heard, M. S., Isaac, N. J. B., Roy, D. B., Procter, D., Eigenbrod, F., et al. (2015). Biodiversity and resilience of ecosystem functions. Trends Ecol. Evol. 30, 673–684. doi: 10.1016/j.tree.2015.08.009
Peco, B., de Pablos, I., Traba, J., and Levassor, C. (2005). The effect of grazing abandonment on species composition and functional traits: the case of dehesa grasslands. Basic Appl. Ecol. 6, 175–183. doi: 10.1016/j.baae.2005.01.002
Pimm, S. L. (1984). The complexity and stability of ecosystems. Nature 307, 321–326. doi: 10.1038/307321a0
Quinlan, A. E., Berbés-Blázquez, M., Haider, L. J., Peterson, G. D., and Allen, C. (2016). Measuring and assessing resilience: broadening understanding through multiple disciplinary perspectives. J. Appl. Ecol. 53, 677–687. doi: 10.1111/1365-2664.12550
Quoreshi, A. M., Suleiman, M. K., Kumar, V., Manuvel, A. J., Sivadasan, M. T., Islam, M. A., et al. (2019). Untangling the bacterial community composition and structure in selected Kuwait desert soils. Appl. Soil Ecol. 138, 1–9. doi: 10.1016/j.apsoil.2019.02.006
Read, A. F., and Harvey, P. H. (2009). Life history differences among the eutherian radiations. J. Zool. 219, 329–353. doi: 10.1111/j.1469-7998.1989.tb02584.x
Rodríguez, D., and Ojeda, R. A. (2014). Scaling functional diversity of small mammals in desert systems. J. Zool. 293, 262–270. doi: 10.1111/jzo.12142
Sánchez-Pinillos, M., Leduc, A., Ameztegui, A., Kneeshaw, D., Lloret, F., and Coll, L. (2019). Resistance, resilience or change: post-disturbance dynamics of boreal forests after insect outbreaks. Ecosystems 22, 1886–1901. doi: 10.1007/s10021-019-00378-6
Scheffer, M., Hirota, M., Holmgren, M., Van Nes, E. H., and Chapin, F. S. III (2012). Thresholds for boreal biome transitions. Proc. Natl. Acad. Sci. U. S. A. 109, 21384–21389. doi: 10.1073/pnas.1219844110
Shadrina, E., and Vol’pert, Y. (2016). Fluctuating asymmetry of craniological features of small mammals as a reflection of heterogeneity of natural populations. Symmetry 8:142. doi: 10.3390/sym8120142
Sullivan, T. P., Sullivan, D. S., and Lindgren, P. M. F. (2000). Small mammals and stand structure in young pine, seed-tree, and old-growth forest, Southwest Canada. Ecol. Appl. 10, 1367–1383.
Sutherland, J. P. (1981). The fouling community at beaufort, North Carolina: a study in stability. Am. Nat. 118, 499–519. doi: 10.1086/283844
Thebault, E., and Loreau, M. (2005). Trophic interactions and the relationship between species diversity and ecosystem stability. Am. Nat. 166, E95–E114. doi: 10.1086/444403
Tilman, D. (1995). Biodiversity: population versus ecosystem stability. Ecology 77, 350–363. doi: 10.2307/2265614
Tilman, D., and Downing, J. A. (1994). Biodiversity and stability in grasslands. Nature 367, 363–365. doi: 10.1038/367363a0
Tuomainen, U., and Candolin, U. (2011). Behavioural responses to human-induced environmental change. Biol Rev. Camb. Philos. Soc. 86, 640–657. doi: 10.1111/j.1469-185X.2010.00164.x
Wang, Y.-H., Yang, K.-C., Bridgman, C. L., and Lin, L.-K. (2008). Habitat suitability modelling to correlate gene flow with landscape connectivity. Landscape Ecol. 23, 989–1000. doi: 10.1007/s10980-008-9262-3
Willis, K. J., Jeffers, E. S., and Tovar, C. (2018). What makes a terrestrial ecosystem resilient? Science 359, 988–989. doi: 10.1126/science.aar5439
Wu, K.-S., Fu, H., Zhang, X.-Y., Niu, D.-C., and Ta, L.-T. (2010). The seasonal dynamics of nutrient contents and the nutrition balanced values in the eight forage species in the Alxa desert grassland. Arid Zone Res. 27, 257–262. doi: 10.13866/j.azr.2010.02.022
Wu, X.-D., Fu, H.-P., and Yang, Z.-L. (2009). Study on Rodents in Typical Semi-Desert and Desert Areas in China. Beijing: China Science Publishing & Media Ltd.
Wu, X.-D., Yuan, S., Fu, H.-P., Zhang, X.-D., Zhang, F.-S., and Gao, Q.-R. (2016). Responses of dominant rodentspecies to climate change in different disturbed habitats in the Alashan desert. Acta Ecol. Sin. 36, 1765–1773. doi: 10.5846/stxb201408061564
Yang, X., Gu, H., Zhao, Q., Zhu, Y., Teng, Y., Li, Y., et al. (2022). High seed diversity and availability increase rodent community stability under human disturbance and climate variation. Front Plant Sci. 13:1068795. doi: 10.3389/fpls.2022.1068795
Yang, X., Yan, C., Zhao, Q., Holyoak, M., Fortuna, M. A., Bascompte, J., et al. (2018). Ecological succession drives the structural change of seed-rodent interaction networks in fragmented forests. Forest Ecol. Manage. 41, 42–50. doi: 10.1016/j.foreco.2018.03.023
Yuan, S. (2013). Response Mechanism of Desert Rodent Community and Dominant Species to Different Disturbances. Ph.D. Dissertation. Inner Mongolia: Inner Mongolia Agricultural University.
Yuan, S., Heping, F., Wu, X., Yang, S., Malqin, X., and Yue, X. (2018). Effects of grazing on the northern three-toed jerboa pre- and post-hibernation: impact of Grazing on Jerboa Overwinter. J. Wildlife Manag. 82, 1588–1597. doi: 10.1002/jwmg.21550
Keywords: life history strategies, community stability, diversity, resistance, resilience, rodent
Citation: Yuan S, Zhang H-T, Li X, Yue X-X, Fu H-P and Wu X-D (2023) The effect of grazing and reclamation on rodent community stability in the Alxa desert. Front. Ecol. Evol. 10:1105297. doi: 10.3389/fevo.2022.1105297
Received: 22 November 2022; Accepted: 28 December 2022;
Published: 18 January 2023.
Edited by:
Wei Wanrong, China West Normal University, ChinaReviewed by:
Zhu Wanlong, Yunnan Normal University, ChinaTongtong Li, Zhejiang University of Technology, China
Xifu Yang, Institute of Zoology (CAS), China
Copyright © 2023 Yuan, Zhang, Li, Yue, Fu and Wu. This is an open-access article distributed under the terms of the Creative Commons Attribution License (CC BY). The use, distribution or reproduction in other forums is permitted, provided the original author(s) and the copyright owner(s) are credited and that the original publication in this journal is cited, in accordance with accepted academic practice. No use, distribution or reproduction is permitted which does not comply with these terms.
*Correspondence: He-Ping Fu,  ZnVoZXBpbmdAMTI2LmNvbQ==; Shuai Yuan, eXVhbnNodWFpMjAyMEAxNjMuY29t
†These authors have contributed equally to this work and share first authorship