 Natalie V. Sánchez
 Luis Sandoval3
 Colleen C. St. Clair
 Erin M. Bayne
- 1Department of Biological Sciences, University of Alberta, Edmonton, AB, Canada
- 2Department of Integrative Biology, University of Windsor, Windsor, ON, Canada
- 3Laboratorio de Ecología Urbana y Comunicación Animal, Escuela de Biología, Centro de Investigación en Biodiversidad y Ecología Tropical, Universidad de Costa Rica, San José, Costa Rica
Anthropogenic noise can create an acoustic environment detrimental for animals that communicate using acoustic signals. Currently, most studies of noise and wildlife come from traffic noise in cities. Less is known about the effects of noise created by industry in natural areas. Songbirds far from cities, but influenced by industry, could be affected by noise, but also are likely to be impacted by changes in vegetation conditions related to industrial development. We described the importance of industrial noise (from facilities and transportation) on occupancy of Lincoln’s Sparrow (Melospiza lincolnii) relative to habitat change caused by vegetation alteration and edge effects. Lincoln’s Sparrows naturally breed in varying seral stages and types of boreal forest. To test the influence of industrial noise, we selected three areas in Northern Alberta, Canada with high, medium, and low levels of industrial development and varying road density. At each area, we deployed a systematic arrangement of autonomous recording units (280 units in total, separated by 600 m) for 3 consecutive days. To measure noise, we developed a method that used the relative noise values extracted from the recordings of 8 frequency-octave bands. We obtained three noise measurements: noise with high energy in the low part of the spectrum (mean 0.5–1 kHz), masking level noise (mean 2–8 kHz), and noise in all frequency octave bands (mean 0.5–16 kHz). Proportion of chronic noise sources explained the highest variation of noise in the environment, and less by traffic noise. We found Lincoln’s Sparrow had a higher occupancy in areas with higher proportion of industrial disturbances, shrubs and grass, and decreased in noisy areas. Masking level noise had a negative effect on Lincoln’s Sparrow occupancy in areas with industrial disturbances, relative to areas with similar changes in vegetation structure, but no noise. Masking noise could indicate limitation in communication as noise increases. Our study amplifies the findings of others that future research should consider not only anthropogenic changes to vegetation in human-altered landscapes, but also human-caused changes to acoustic environments.
Introduction
Anthropogenic noise is a selective pressure on species occupancy, especially for animals that rely on acoustic signals for communication. It has been reported for birds additional responses in terms of species richness, productivity, and abundance. The main driver for the decreases in all these population parameters is the elevated traffic and ambient noise in urban environments (Reijnen et al., 1996; Stone, 2000). In general, species richness and densities of breeding birds decrease close to roads with high traffic volume or in noisy parts of cities (Reijnen et al., 1996; Forman et al., 2002; Perillo et al., 2017; Carral-Murrieta et al., 2020). Other kinds of noise might similarly degrade the quality of habitat for songbirds (Bayne et al., 2008; Francis et al., 2009; Nenninger and Koper, 2018).
Certain types of anthropogenic noise are more likely to overlap spatially and temporally with the morning singing times of songbirds (Slabbekoorn and Ripmeester, 2008). Whereas urban and traffic noise are intermittent, with variation throughout time, industrial noise typically produces constant noise. This means that urban noise can be more or less likely to overlap temporally with the morning singing times of songbirds depending on latitude and time of year. This variation may provide some flexibility to birds in terms of when to sing in order to communicate effectively. By contrast, industrial noise typically produces constant noise across all times of day and year (Bayne et al., 2008; Francis et al., 2009). For example, in the boreal forest of Canada, compressor stations, injection wells, and processing facilities from the oil sands industry creates constant noise (Northrup and Wittemyer, 2013; Nenninger and Koper, 2018) adjacent to breeding bird habitat. Moreover, many forms of chronic industrial noise occur at low frequencies (0–2.5 kHz) with high amplitude levels (75–90 dB at the source), reaching as much as 105 dB at the largest industrial facilities (MacDonald et al., 1996). Despite the potential large effect of such noise in natural areas, chronic noise from compressor stations and processing facilities in conjunction the vehicle traffic to maintain these types of equipment has been less studied than the intermittent traffic noise in urban environments (Slabbekoorn and Ripmeester, 2008; Francis, 2015; Halfwerk and Slabbekoorn, 2015; Shannon et al., 2016).
The limited comparisons of birds in quiet versus noisy areas created by industrial development in wilderness areas have shown species-specific responses. Previous work in Alberta’s boreal forest found lower densities for all birds combined, lower densities for some common species, and reduced occupancy rates for a number of species close to noisy compressor stations relative to silent well sites with similar vegetation disturbance (Bayne et al., 2008). However, not all species showed negative effects, and some showed trends toward being more abundant near noisy compressor stations (Bayne et al., 2008). Similarly, bird assemblages in noisy areas of New Mexico differed in comparison with quiet sites, which were associated with high acoustic masking of certain species close to generators (Francis et al., 2009). A major difference was that the western scrub-jay (Aphelocoma californica), a nest predator, decreased in sites with anthropogenic noise. In turn, lower predation rates for other bird species were observed in noisy areas suggesting a potential benefit of noise for some species (Francis et al., 2009, 2012). For secondary cavity-nesting birds, some species had higher occupancy close to noisy generator, while others had lower occupancies (Kleist et al., 2017). Clearly, the effects of anthropogenic noise on birds are variable and complex, indicating that more studies are needed to understand why species react differently to intermittent and chronic noise in otherwise natural ecosystems, and why some species do or do not react to noise (Francis and Barber, 2013).
The habitat requirements of a species is one potential source of variation that may influence how noise impacts birds. It is well documented that vegetation type influences habitat selection by birds (MacArthur et al., 1962; MacArthur, 1964), but these effects may differ among seral stages. Most of the species studied by Bayne et al. (2008) that were more sensitive to industrial noise also tended to prefer mature forest. Whether species that use early seral habitat and prefer edges react to noise is not well understood. If the human disturbance that creates noise also changes vegetation structure and composition (i.e., through edge effects and creating new early seral vegetation patches), then responses to noise may be confounded by the presence of more suitable habitat closer to noisy areas. Thus, similarly to cities, noisy areas in remote locations may attract more tolerant species (or “urban exploiters” sensu Blair, 1996; McKinney, 2002). Sensitive species that cannot use disturbed or edge vegetation may simply be filtered out by loss of habitat rather these species avoiding noisy areas per se (Blair, 1996; Cardoso et al., 2018). In the boreal forest near industrial facilities associated with oil and gas extraction, there is considerable variation in the state of the vegetation related to natural processes as well as human disturbances, which make it possible to separate the relative importance of habitat change versus noise (Venier and Pearce, 2007; Venier et al., 2014; Dabros et al., 2018).
A fundamental challenge in summarizing studies that purport to study how birds respond to noise is that in some studies, direct measures of noise are not quantified (i.e., Bayne et al., 2008). Instead, surrogate variables (i.e., distance to noise source, noisy vs. quiet, traffic volume) are often used. Quantification of noise measurements are needed to separate the relative importance of noise relative to changes in habitat conditions caused by the disturbances that create noise. At the same time, there are many ways to measure noise and there has been very limited assessment of how birds react to different ways of quantifying noise (Scobie et al., 2016).
An additional factor that is rarely addressed in noise impact studies is the possibility that vegetation conditions interact with noise transmission by altering sound absorption (Martens and Michelsen, 1981). Low-frequency sounds can transmit farther distances in open areas, while denser vegetation can provide a vertical obstruction to the sound waves that can mitigate the distance anthropogenic noise travels (Truax, 1978; Rossing and Fletcher, 2004). Whether different vertical obstructions related to vegetation type make the surrounding habitat more or less suitable for some songbird species because of differences in the way noise transmits in different vegetation types remains poorly studied.
Lincoln’s Sparrow (Melospiza lincolnii) is a common songbird that breeds in many different vegetation types in Alberta’s boreal forest (Alberta Biodiversity Monitoring Institute [ABMI], 2020). Previous work suggests they are more likely to be found near relatively quiet pipelines and well sites with disturbed vegetation than mature forest (Bayne et al., 2016). Studying a species that prefers disturbed areas provides a unique way to test the importance of noise because we know their habitat requirements are met in areas where industrial development is occurring. An additional factor that can mediate the occupancy of the species could be its vocal features. In general, songbirds with low-frequency songs are less abundant or showed lower occupancy in noisy sites than those with higher frequency vocalizations (Proppe et al., 2013; Francis, 2015). Lincoln’s Sparrow songs range from 1.5 to 7.5 kHz (Cicero and Benowitz-Fredericks, 2000; Figure 1C); therefore, its songs are partially overlapping with anthropogenic noise that usually concentrates at low frequencies (<2 kHz; Lohr et al., 2003). We addressed this topic with four primary objectives to: (1) develop a cost-effective way of quantifying noise levels from industrial activities that could be used to statistically separate the effects of noise from vegetation disturbance caused by energy development in natural areas; (2) determine how vegetation structure influences noise transmission in the boreal forest; (3) assess if occupancy of Lincoln’s Sparrow was influenced by noise, vegetation disturbance, or both; and (4) test if different ways of quantifying noise (noiseLOW, noiseHIGH, noiseALL) altered our conclusions.
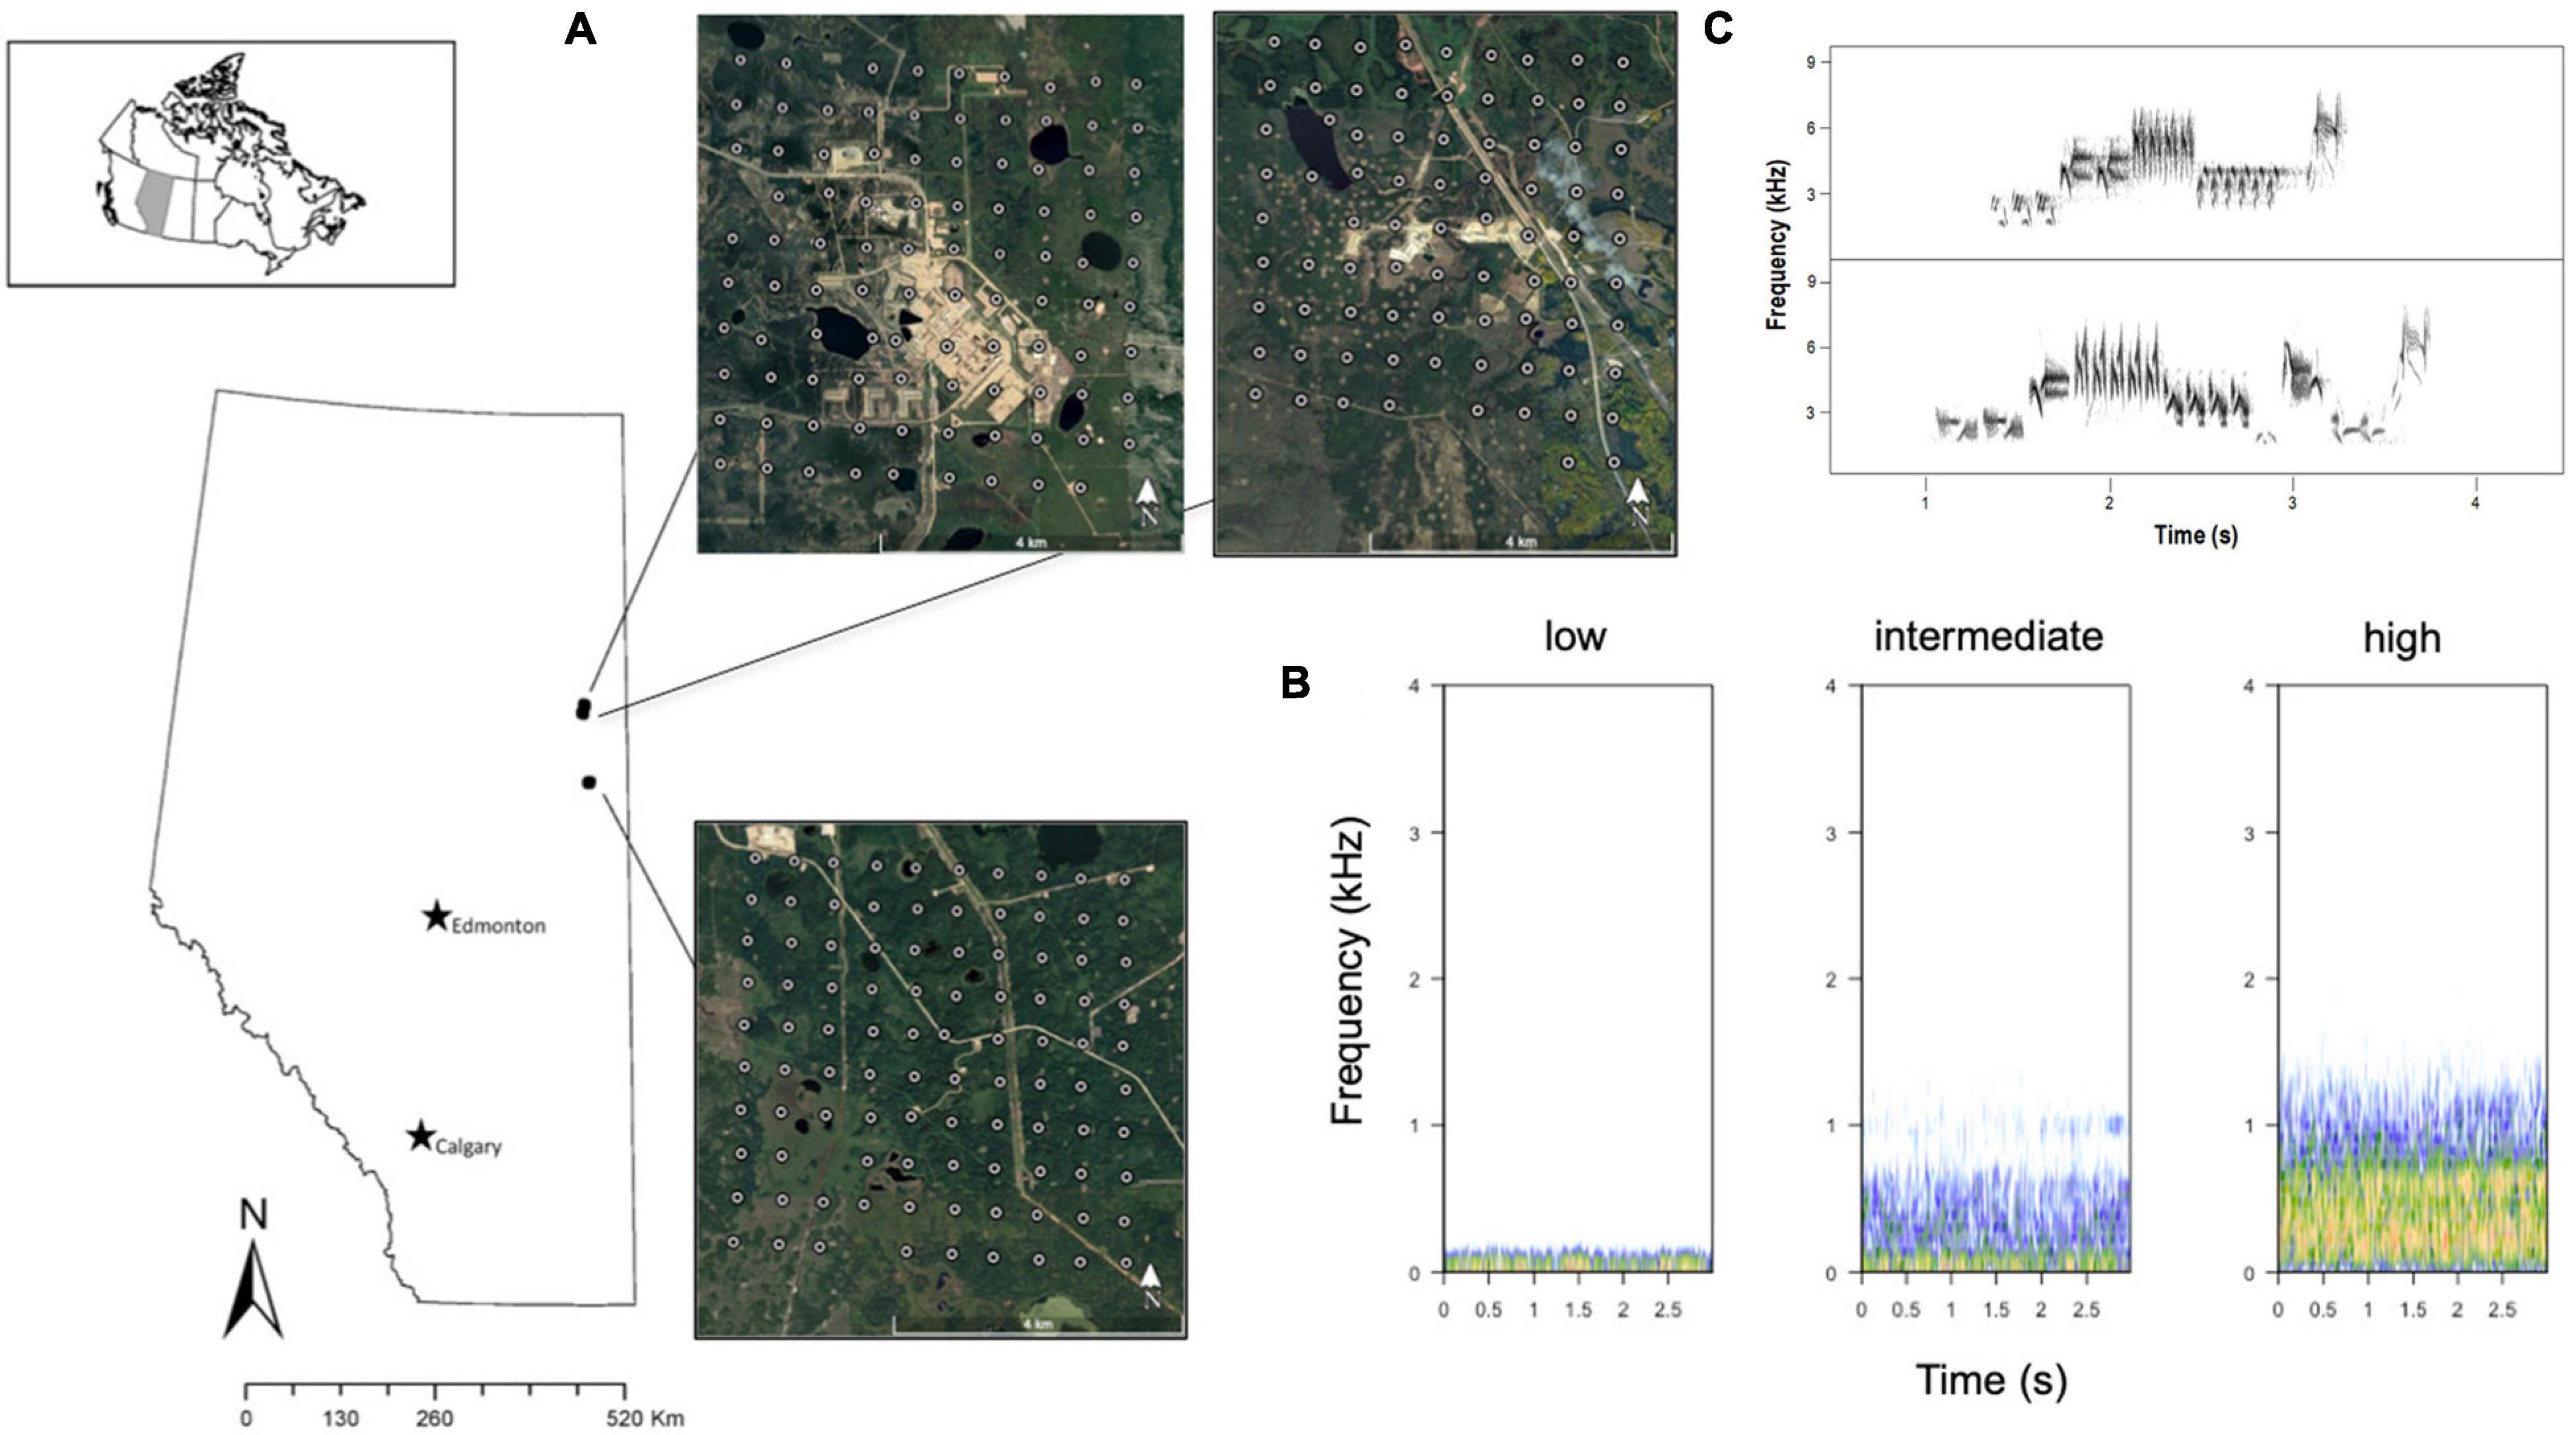
Figure 1. (A) Sample design. Autonomous digital recorders deployed 600 m apart in three areas of industrial disturbances in Northern Alberta, Canada. Upper areas correspond to high and medium industrial settings. Lower area corresponds to low industrial settings. (B) Spectrograms of noise variation at a specific station in the low, intermediate, and high industrial settings areas. (C) Spectrogram of two Lincoln’s Sparrow songs showing the different elements in the song.
Materials and Methods
Study Area
Our study area was located in the boreal forest in Alberta, Canada (Figure 1A), where there is active presence of the energy industries. It is dominated by upland boreal forest with variation in industrial disturbances that creates areas of forest regeneration, edges, seismic lines, among others. It is known that Lincoln’s Sparrow inhabit disturbed areas in the boreal forest (Bayne et al., 2016), providing an opportunity to explore changes in occupancy given the habitat relative to industrial noise. Based on our objectives, we performed the following tests: (1) the influence of vegetation, noise sources, and disturbances on industrial noise (response variable), and (2) the effect of industrial noise on Lincoln’s Sparrow occupancy (response variable).
The data were collected in June 2015 using autonomous recording units (ARUs) deployed at different areas of disturbances created by the oil sands industry in Northern Alberta, Canada. According to the Alberta Biodiversity Monitoring Institute (ABMI) human footprint classification system1, these areas vary considerably in levels of human footprint with some areas containing industrial infrastructure such as processing facilities and compressor stations. All sites also included roads, well sites (active and abandoned), and seismic lines (Dabros et al., 2018; Figure 1A).
In the sampling design, we selected three large areas in which to sample a gradient of industrial disturbances. We defined site as an area of multiple ARUs (n = 98, 83, and 99 ARUs at each of three sites) and a station as one ARU deployed within the site. ARUs were located in grids 600 m from the adjacent recorders, comprising an area of 3,600 ha (Figure 1). The ARUs were originally laid out in systematic grids of 100 units, but recording failures reduced the actual number. These areas comprised a systematic design that was random in location with respect to roads and distance to various noise sources (Supplementary Figure 1).
Acoustic Survey
Recordings were collected with SM2 and SM3 recorders (Wildlife Acoustics) with two omni-directional microphones (SMM-A1 sensitivity: −4 ± 3 dB, 0 dB = 1 V/pa at 1 kHz). Previous to their deployment, we tested the sensitivity of each microphone using an Extech 94 dB sound calibrator. We ensured all ARUs had microphones with gain gaps between the left and right less than 4 dB (Lankau, 2015). We stored all the recordings in SD cards in stereo format (WAV) at a sampling rate of 44.1 kHz and 16-bit resolution. We defined the recording time to be 10 min long at 0500 h, which matches the highest peak of vocal activity of most boreal birds. We attached ARUs to trees with wood screws at 1.5 m height, facing North, for 3–4 consecutive days from May 25 to July 6, 2015. Most of the acoustic data analyzed were from recordings collected in June, which corresponds to the breeding season of the study species.
A group of five expert transcribers in songs and calls of Alberta birds identified the songs and calls in each 10 min recording for the 3 days of the acoustic surveys. We saved all detections including location of the site, weather (presence of rain or wind), and industrial noise classified as low, intermediate, or high, in a database (Figure 1B). We excluded windy and rainy recordings. This classification index provided a reference of noisy and quiet stations at each site at which we then measured noise levels more precisely as described below.
Site Variables
Quantitative Noise Measurements
We defined industrial noise as the sounds generated by industrial equipment, such as machinery, trucks, wells, and compressor stations. This type of noise concentrates the highest amplitude levels in the low frequencies of the acoustic spectrum at less than 2,000 Hz (Nemeth and Brumm, 2010; Luther and Gentry, 2013). We obtained noise measurements in two different ways. First, we used Raven Pro (2019) 1.6 (Cornell Lab of Ornithology 2019) to extract noise values manually at each recording by Natalie V. Sánchez, measuring 1 s sections in the power spectra window of the recordings (Hann window type, 700 samples, and a discrete Fourier transform size of 2,048 samples with a temporal overlap of 50%). We did this at times without bird vocalizations at both the beginning (within minute 0–1) and the end (within minute 9–10) of each 10 min recording. From each 1 s section of the recording, we extracted the relative values of amplitude (average amplitude in FSdB, Raven Pro user manual) for six 1/3-frequency octave bands (500, 1,000, 2,000, 4,000, 8,000, and 16,000 Hz). We defined the low and high frequency limits for each 1/3-frequency octave band following values reported in the literature (Sueur, 2018).
Given that we had recordings for 3 consecutive days at the same ARU stations and the majority of industrial noise is constant, we expected noise levels would be similar between days. We tested this assumption with a repeated measures ANOVA by analyzing noise level over the 3 sample days for five stations that were randomly selected at each site. Average noise levels did not vary between days (F2,267 = 0.344; P = 0.709; Supplementary Figure 2). Consequently, in the following analysis, we only included the average noise level obtained as described above from the six frequency octave bands, which we extracted from the recording on a single day that was selected randomly. It is important to clarify that the ARUs and the microphones were not calibrated to obtain absolute measurements of amplitude, thus noise levels should be viewed as relative amplitude values where the noisy sites had the highest noise values and were closer to 0 while quieter places had more negative values.
We classified the noise measurements from Raven Pro into three noise types: (1) noiseLOW measured low frequency sounds with concentrated energy in 500 and 1,000 Hz frequency octave bands; (2) noiseHIGH was defined as the average values of relative decibels from 2,000 to 8,000 Hz, which is more likely to directly interfere with communication by masking bird songs in the maximum peak of hearing of most passerine birds (Okanoya and Dooling, 1988; Dooling et al., 1992) including our study species (Cicero and Benowitz-Fredericks, 2000); and finally, (3) noiseALL included all frequency octave bands (measurements from 500 to 16,000 Hz). This last measurement can be interpreted as a measurement of total noise since it includes all the frequency octave bands.
The second method was calculated using Kaleidoscope Pro (version 5.2; Wildlife Acoustics Inc., Concord, MA, United States). This was used to obtain measurements of nineteen 1/3 frequency octave bands (from 19.7 to 2,000 Hz). These are the same octave-bands settings used by Marín-Gómez et al. (2020) to assess the effects of anthropogenic noise on occupancy by owls. Both methods showed a high correlation at 500 Hz (r = 0.81, P < 0.0001) and 1,000 Hz (r = 0.83, P < 0.0001) (Supplementary Figure 3). Given the strong correlation, we decided to only use the noise values obtained with Raven Pro in our subsequent analyses since we were more confident those values did not include biotic sounds.
Vegetation
At each station, we calculated the proportion of vegetation within a 150 m radius buffer from the Alberta Vegetation Inventory (AVI). We extracted proportion of conifer forest, deciduous forest, mixed-wood forest, grass, and shrubs. When assessing if noise transmission was influenced by vegetation conditions, we grouped plant species into three categories as follows: (1) conifer: high density conifer stands dominated by black spruce (Picea mariana); (2) mixedwoods: medium density deciduous forest dominated by trembling aspen (Populus tremuloides) or mixed-woods of trembling aspen and white spruce (Picea glauca); and (3) open areas containing shrubs and/or grass. We used ArcGIS 10.6.1 (Environmental Systems Research Institute, Inc., Redlands, CA, United States) to calculate the buffer and to extract the proportion of vegetation.
We extracted the proportion of the 150 m radius buffer that was conifers and mixedwoods by age class (0–19, 20–40, 41–100, and more than 100 years old). Class 20–40 years did not have any values in the three study areas. Therefore, we collapsed 0–19 to 20–40 to a new category 0–40. Then, we created a new categorical variable called “age” with three levels: young forest (0–40 years), mature (40–100 years), and old forest (more than 100 years). Each ARU was placed in an age class based on the age class most common in the buffer. Human disturbance variables were extracted from a 150 m buffer (around each station) using the Human Footprint Inventory GIS layer (see text footnote 1).
Statistical Analysis
Factors Influencing Noise Levels
Our sites were selected based on the amount of energy sector disturbance visible from satellite imagery. Thus, prior to ARU deployment we did not know if noise levels actually differed between sites. To test if our designations of low, moderate, and high footprint sites actually had different noise levels, we used an ANOVA to test if the average noise levels were significantly different between sites (each ARU was treated as a replicate). We ran three separate ANOVAs using noiseLOW, noiseHIGH, and noiseALL, as the response variable. In addition, we tested whether the noise measurements using all the frequency octave-bands had differences in relative amplitude between the sites. We compared the average slopes of noise measurements (response variable) between the three sites (fixed effect), using all the frequency octave bands measurements (obtained with Raven Pro) with a Generalized Linear Mixed Model (GLMM).
We then assessed whether the various noise metrics were associated with different types of energy sector footprint. Using generalized linear models with a Gaussian distribution and identity link, we tested six hypotheses about what the various noise metrics were measuring (see Table 1 for model structure): (1) they described general noise in the environment caused by nuisance factors that vary in some unknown way as a function of forest composition (conifer, mixedwood, open) and age (young, mature, old), but not energy sector footprint (hereafter vegetation); (2) they were correlated with the proportion of total energy footprint within a 150 m buffer (proportion of area disturbed by abandoned well, active well, facility, road, seismic line, and pipeline) with no designation of the type of noise that each footprint is likely to create; (3) they were correlated with purported chronic noise sources like oil sands processing facilities, compressor stations, and active injection wells; (4) they were correlated with intermittent noise sources like roads, abandoned wells, pipelines, and seismic lines that are used to access the energy network via trucks and off-highway vehicles; (5) if both chronic or intermittent contributed to our noise measurement in an additive way; and (6) if chronic versus intermittent noise contributed to noise measurements in an interactive way. Natural variation in environment (vegetation) was included in all models.
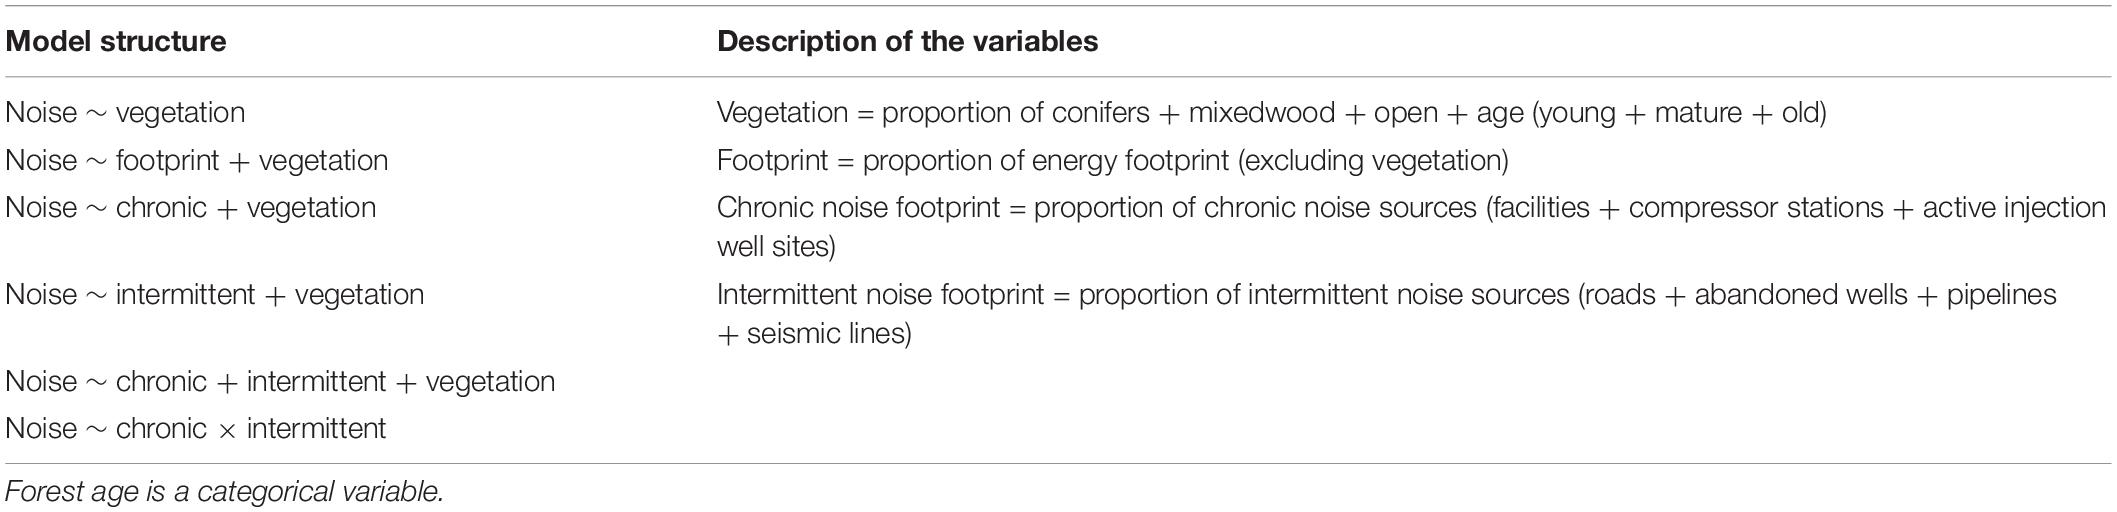
Table 1. Model structure and description of the variables included in the respective model to test the noise hypotheses.
Occupancy Models
We estimated the factors influencing Lincoln’s Sparrow occupancy using the single-season occupancy model framework (MacKenzie et al., 2002). The model estimates the occupancy (psi) and the detection probability (p) based on the detection history of singing birds of 3 consecutive days recorded per station. We generated 42 models that allowed us to test the following hypotheses: (a) any variation in Lincoln’s Sparrow occurrence was simply due to detection error caused by time of sampling (Day of year, hereafter DOY); (b) natural vegetation conditions are the primary driver of occupancy; (c) any type of energy development (footprint) creates altered habitat conditions that influence Lincoln’s Sparrow occupancy; (d) linear features (proportion of area disturbed roads, seismic lines, and pipelines) create edge habitat preferred by Lincoln’s Sparrow; (e) polygonal features (active well, abandoned well, facility) create early seral open habitat preferred by Lincoln’s Sparrow; and (f) both linear and polygonal features create habitat for Lincoln’s Sparrow but at different rates.
To these six basic model structures, we added the three different noise measurements (noiseLOW, noiseHIGH, and noiseALL) to see if we observed different responses on the occupancy side of the equation (24 models). Finally, we evaluated whether the three noise metrics influenced detection across all models under the premise that noise may influence our ability to observe Lincoln’s Sparrow, even when present, because of reduced ability to aurally detect them because of the noise. Day of year was included on the detection side of all models. Time of day was controlled by our experimental design that standardized recording times. The models were ranked using Akaike Information Criteria (AIC, Burnham and Anderson, 2002). The best model had the lowest AIC value. All the occupancy models and model selection analyses were performed with the software RStudio (version 1.4.1106) and the R package “unmarked” (Fiske and Chandler, 2011).
Results
Factors Influencing Noise Levels
We analyzed recordings from 280 stations at sites that we a priori ranked as having high, moderate, and low levels of energy footprint. There were significant differences in average noise for noiseLOW (F2,277 = 44.5, P < 0.0001), noiseHIGH (F2,277 = 15.9, P < 0.0001), and noiseALL (F2,277 = 36.9, P < 0.0001), among sites. Post hoc Tukey’s test for noiseLOW found that the low footprint site had lower noise levels than the moderate (difference: −9.42; −11.88, −06.96 95% CI) or high footprint site (difference: 7.28; 4.71, 9.85 95% CI). Moderate and high footprint sites were similar in term of noise (difference: −2.14; −4.71, 0.43 95% CI) (Figure 2A). noiseLOW contains the higher values of noise; therefore, we considered that this metric reflected the stronger differences between sites. The linear regression of the log transformed relative amplitude values including all the frequency octave bands also showed differences between the slope of both the high site and the intermediate site with the low site (Table 2 and Figure 3).
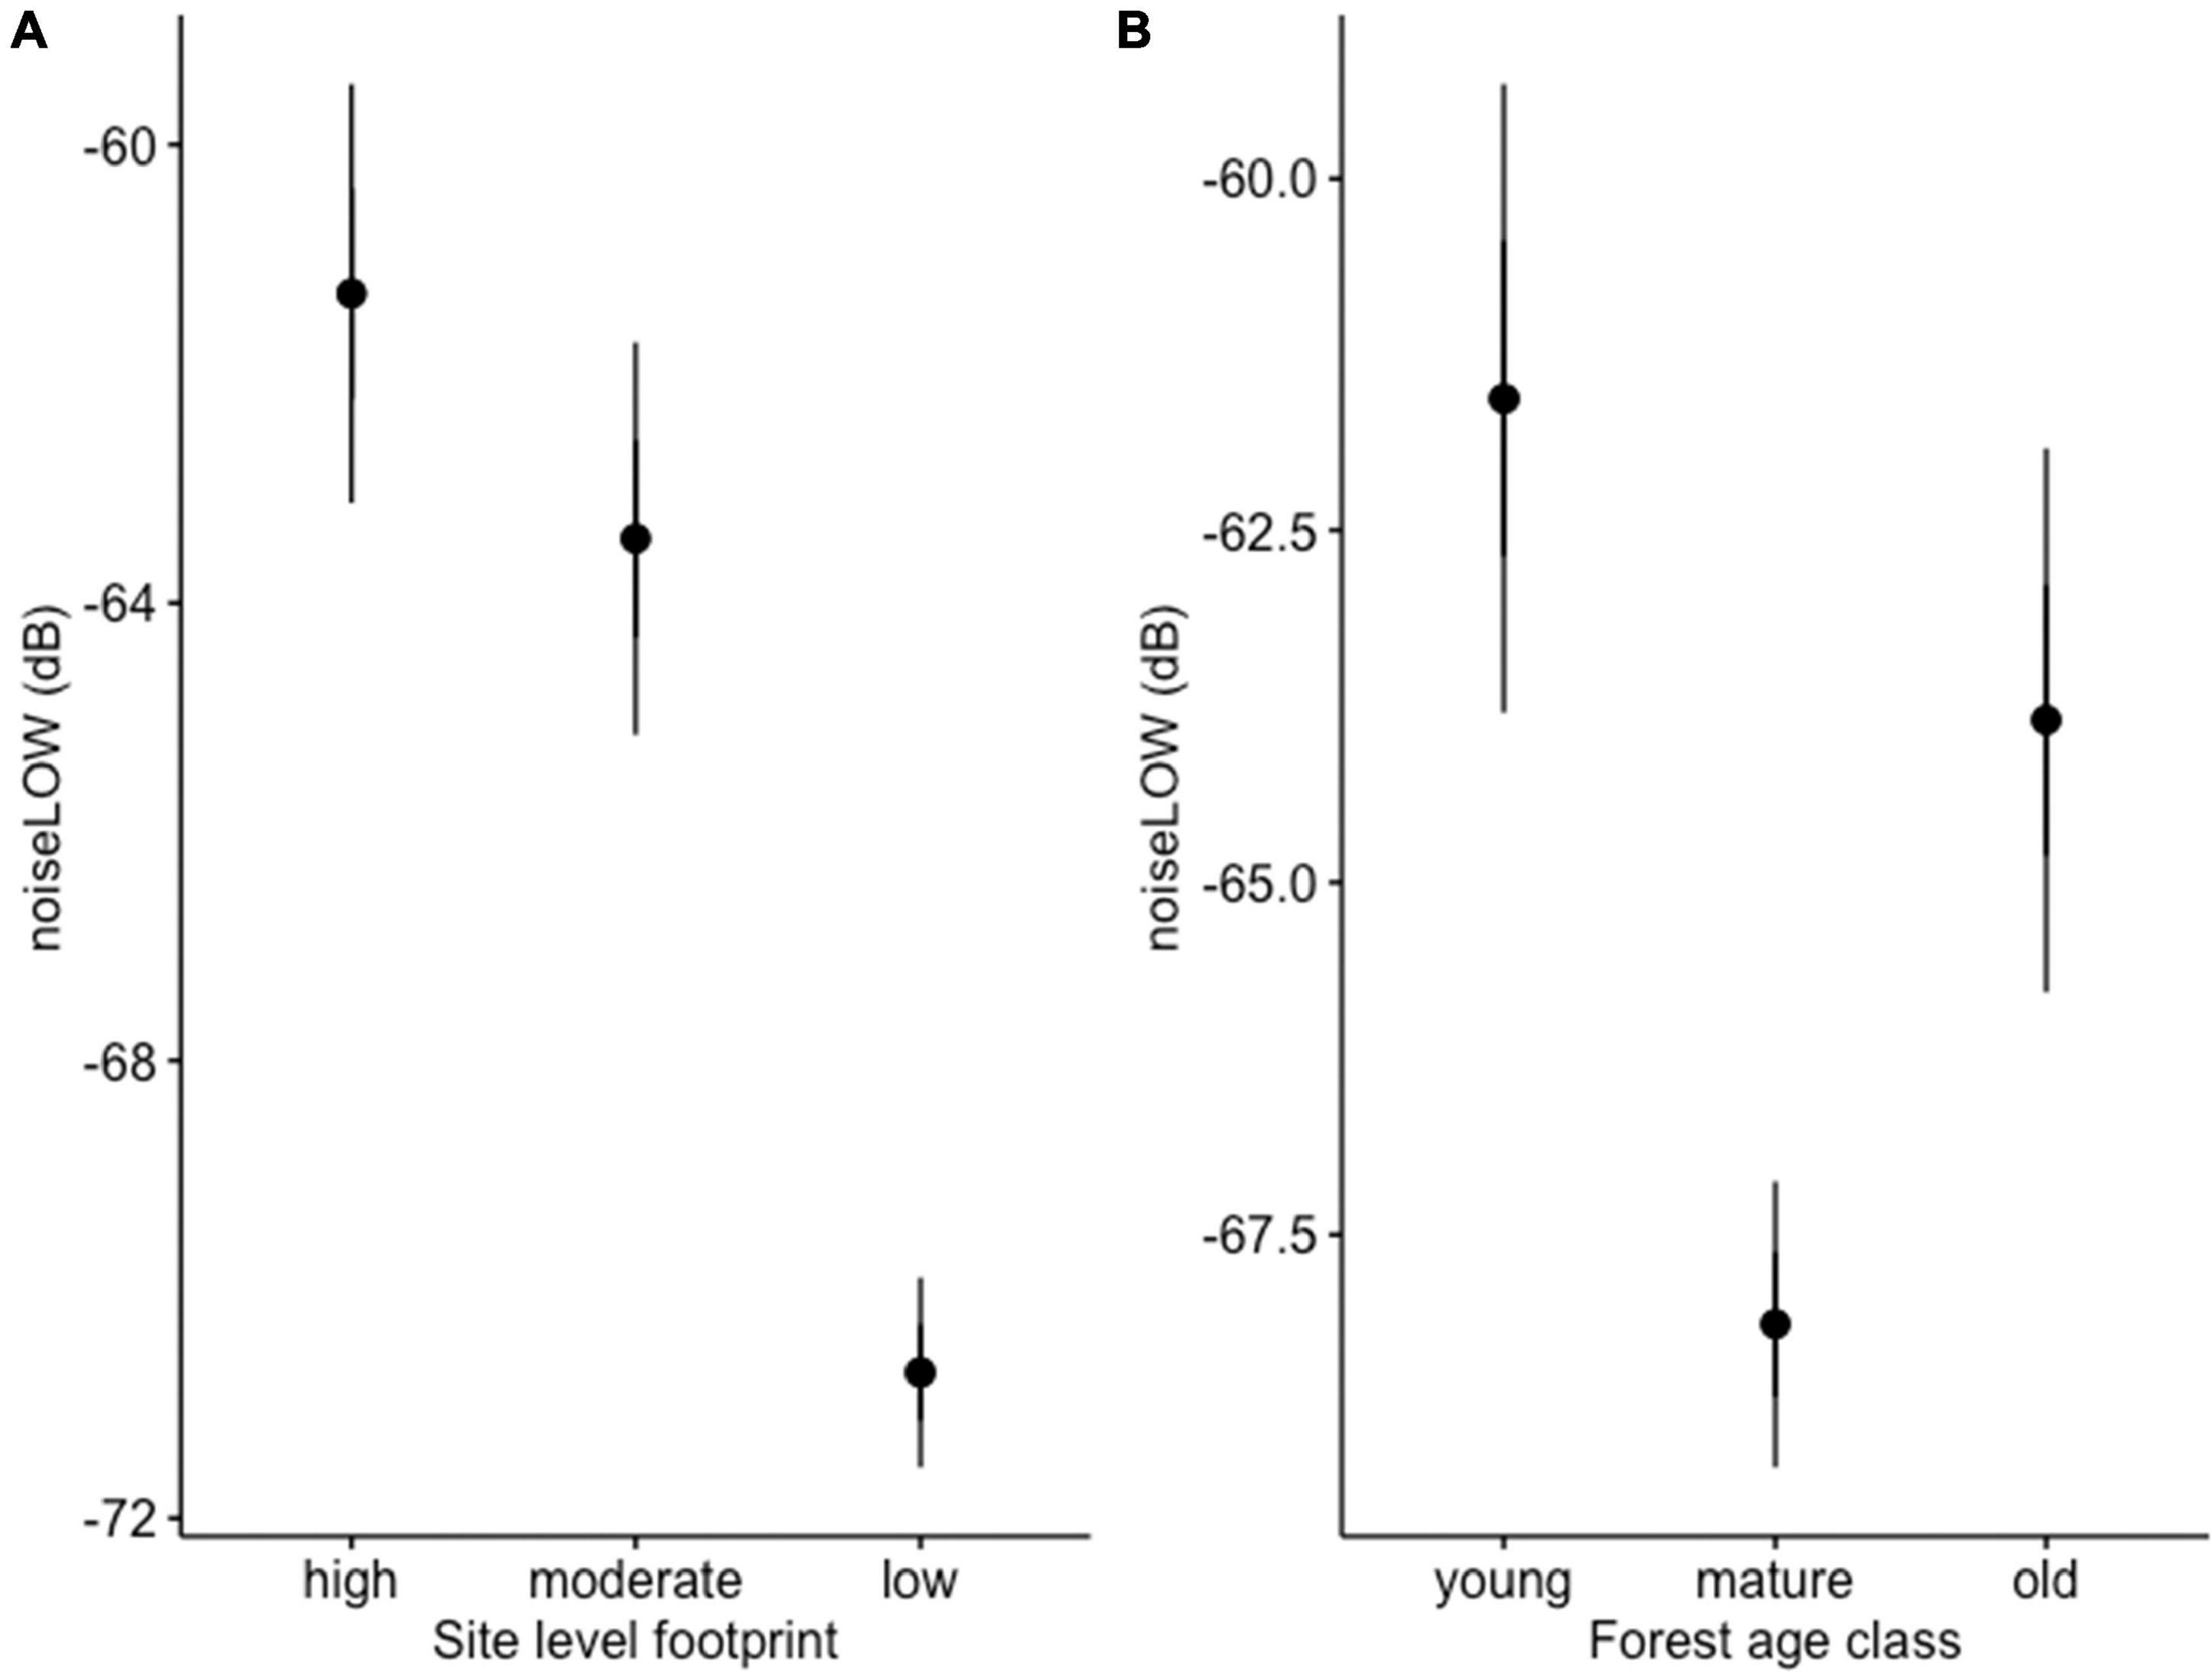
Figure 2. (A) Predicted noise level for noiseLOW at the high, intermediate, and low footprint sites. (B) Predicted average noise levels for noiseLOW in young, mature, and old forest ARU locations. Error bars are 95% CI.
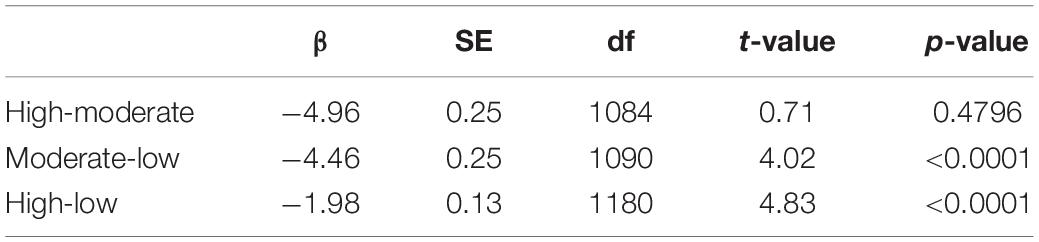
Table 2. Linear regression analysis adjusted testing the differences between measurements of frequency octave band slopes between sites (high, moderate, and low levels of noise).
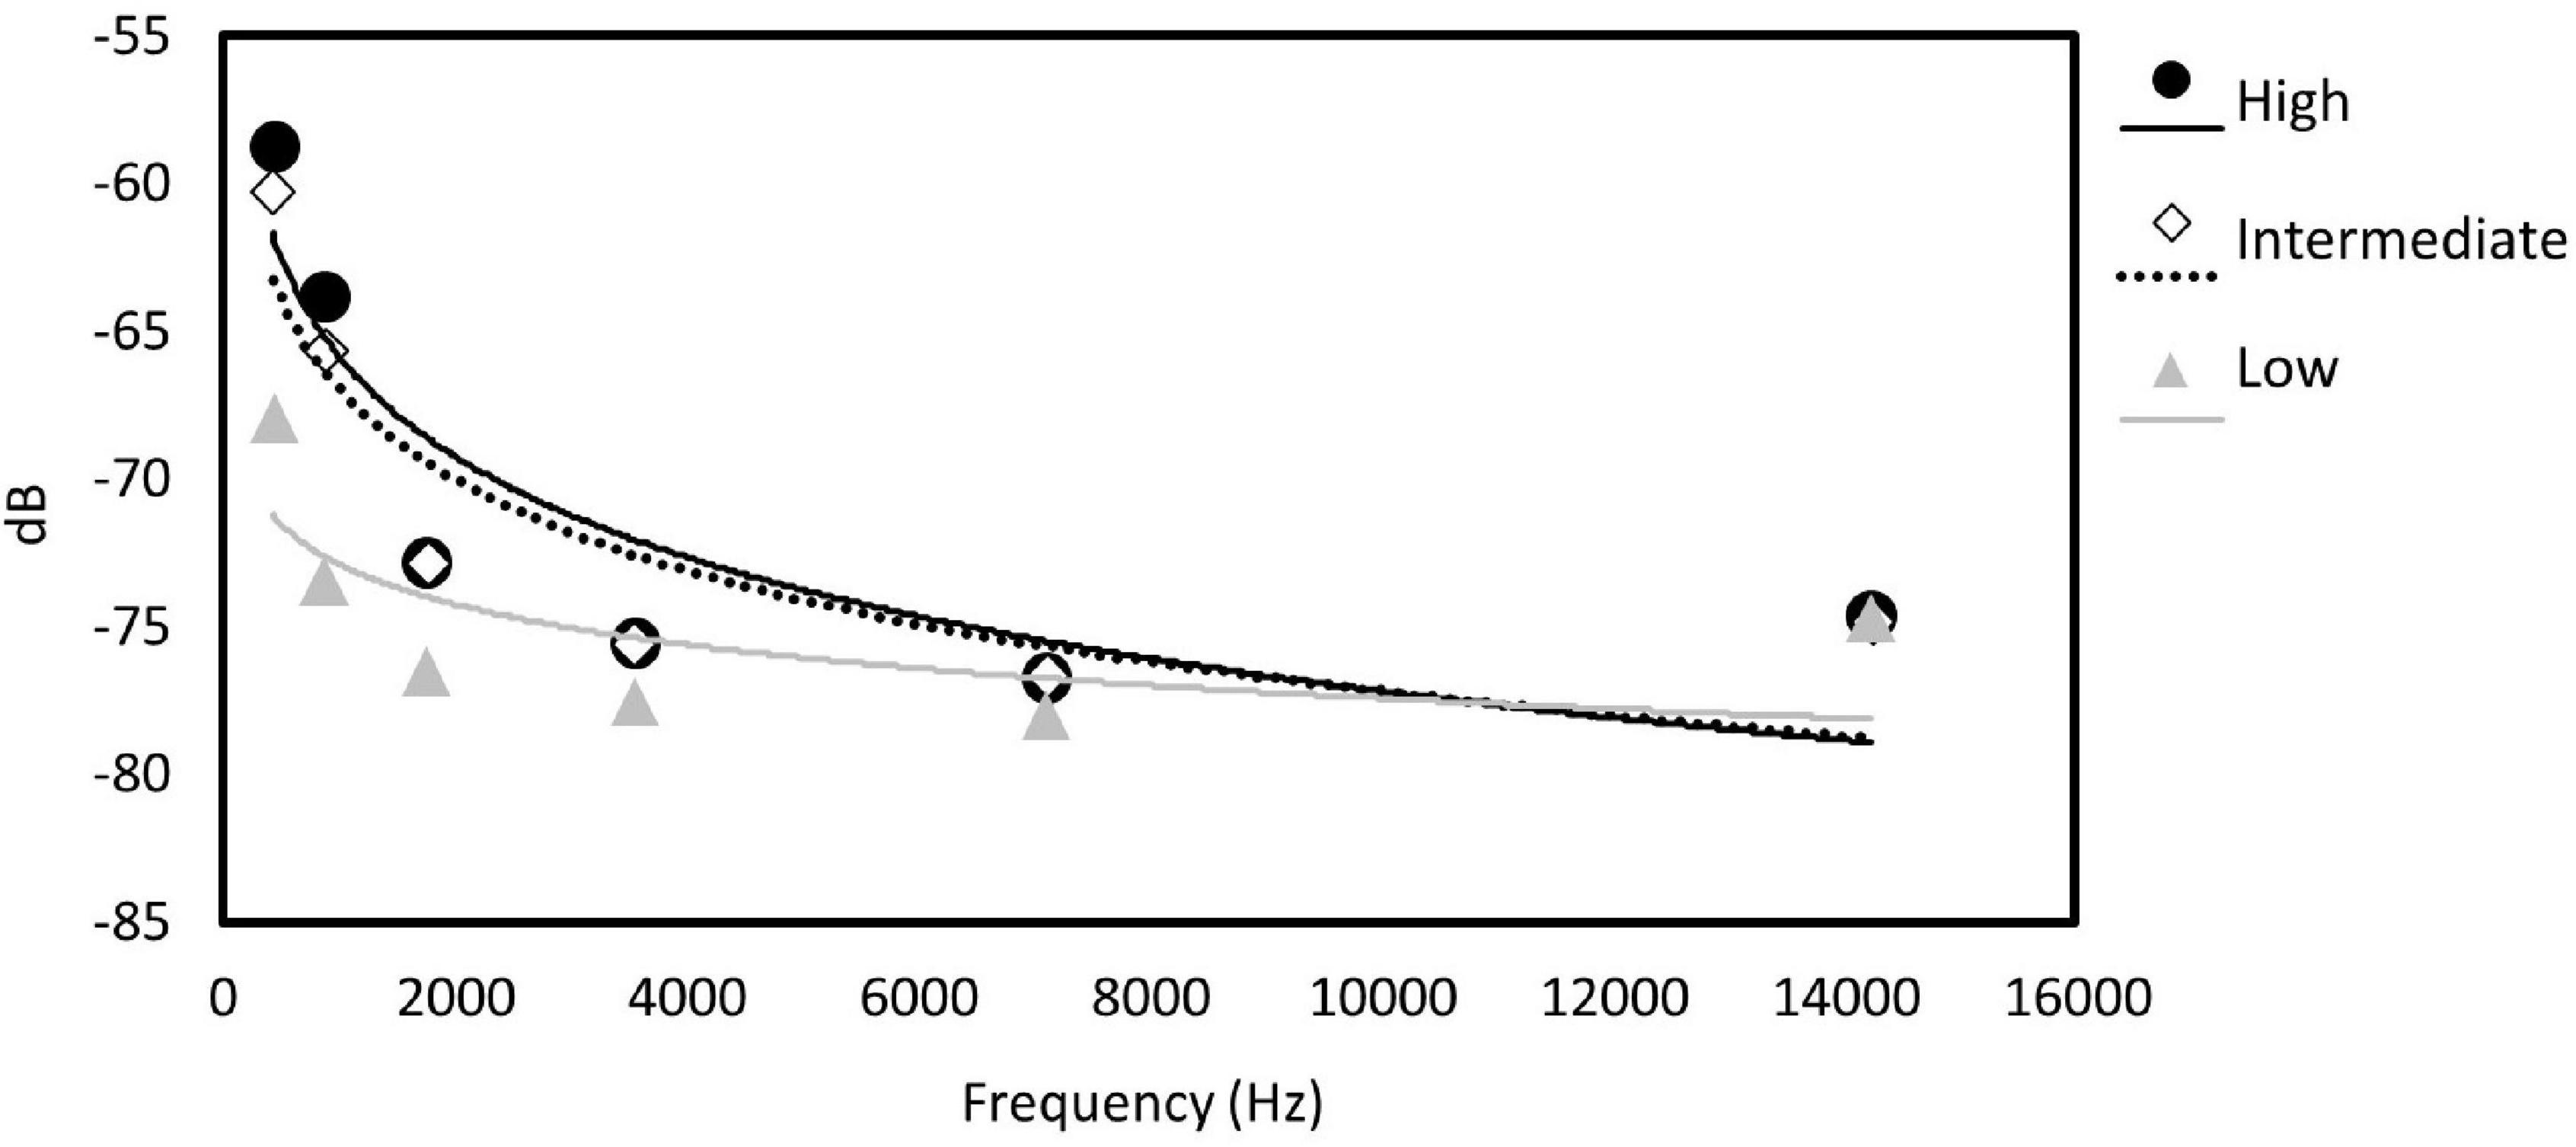
Figure 3. Relative measurements of sound amplitude measured from recordings for the six frequency octave bands per site using Raven Pro software. Sites are represented by symbols and fitted lines. High industrial disturbances, black dots and line; moderate footprint, hollow diamonds and dotted line; low disturbances, gray triangles and line.
The three noise metrics were correlated. The correlation coefficient (r) for the three noise metrics was: noiseLOW vs. noiseHIGH = 0.71, noiseLOW vs. noiseALL = 0.95, noiseHIGH vs. noiseALL = 0.88. The model that best predicted the variation in all three noise measurements was the one including the variables Chronic Noise footprint × Intermittent Noise footprint (Table 3). The AIC weight for this model was 0.99 for three noise metrics. Given the correlation between noise metrics, it was not surprising that the same model was selected as having the best fit, but there were some distinct differences in beta estimates (Table 4). Across all models, age of forest showed the same effect on noise level with the lowest noise level in mature forests. Based on 95% confidence intervals, this was lower than old forests, which had intermediate noise levels. Young forest had the highest noise levels and the 95% CI do not overlap with mature forest, but did overlap with old forest (Figure 2B).
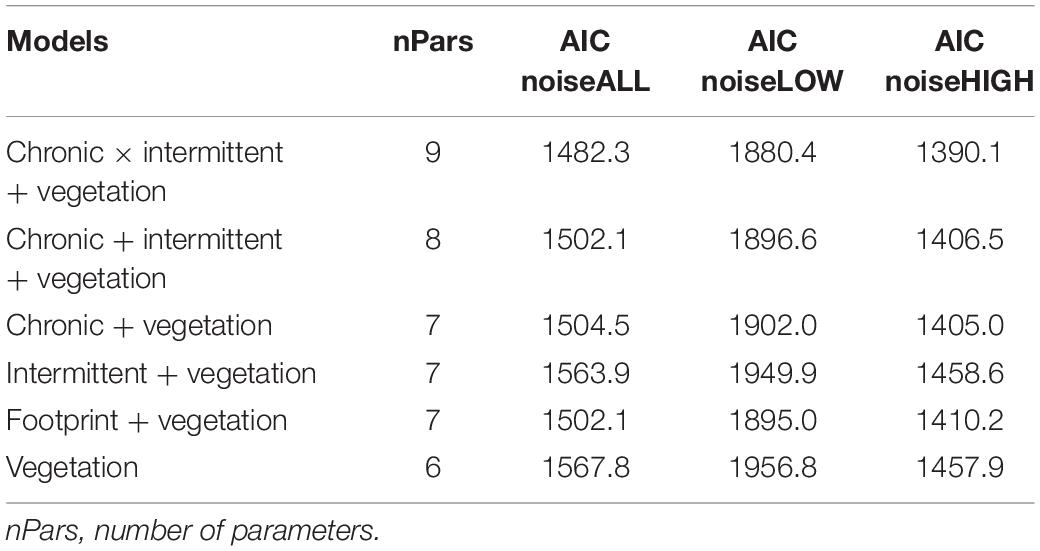
Table 3. Results from AIC comparisons of generalized linear models that predict how the three noise metrics respond to various models of vegetation conditions (vegetation = conifer, mixedwood, and open as continuous variables, and age class as categorical variable) and type of energy footprint (Chronic noise = facilities + active well + road; Intermittent noise = abandoned well + seismic line + pipeline), and total footprint (footprint).
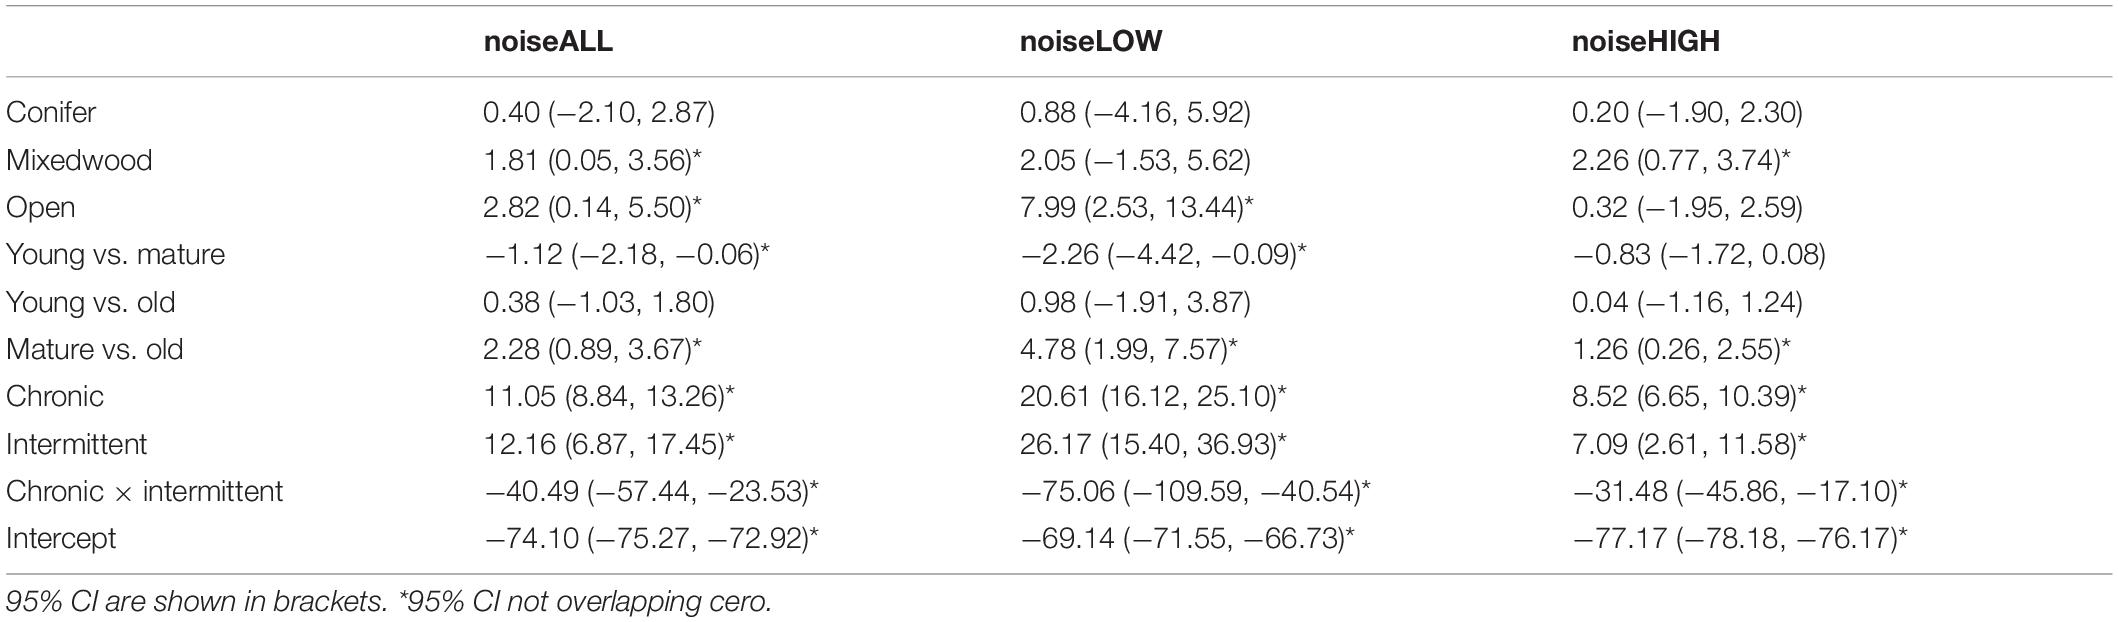
Table 4. Model parameters from the best-fitting models that predict the three different noise metrics as a function of vegetation and energy footprint variables.
There was a variation in how proportion of forest had an influence on the different noise measurements. For noiseLOW, conifer and mixedwood had beta values that included zero based on 95% CI, and the more open habitat had the loudest noiseLOW scores (Figure 4). For noiseALL, conifer had beta values that included zero indicating no change in noiseALL controlling for other variables. NoiseALL increased as mixedwood increased, but not as steeply as in open vegetation (Figure 4). When there is an natural open area surrounding a chronic noise source, noiseALL reached at the ARUs is higher than in less open areas (Figure 5). NoiseHIGH showed a very different pattern. Conifer and open had 95% CI that included zero while there was an increase in noiseHIGH as mixedwood increased (Figure 4).

Figure 4. Predicted noise levels from the three noise metrics with increasing proportions of conifer, mixedwood, and open habitats. Error bands are 95% confidence intervals. *Indicates a significant relationship.
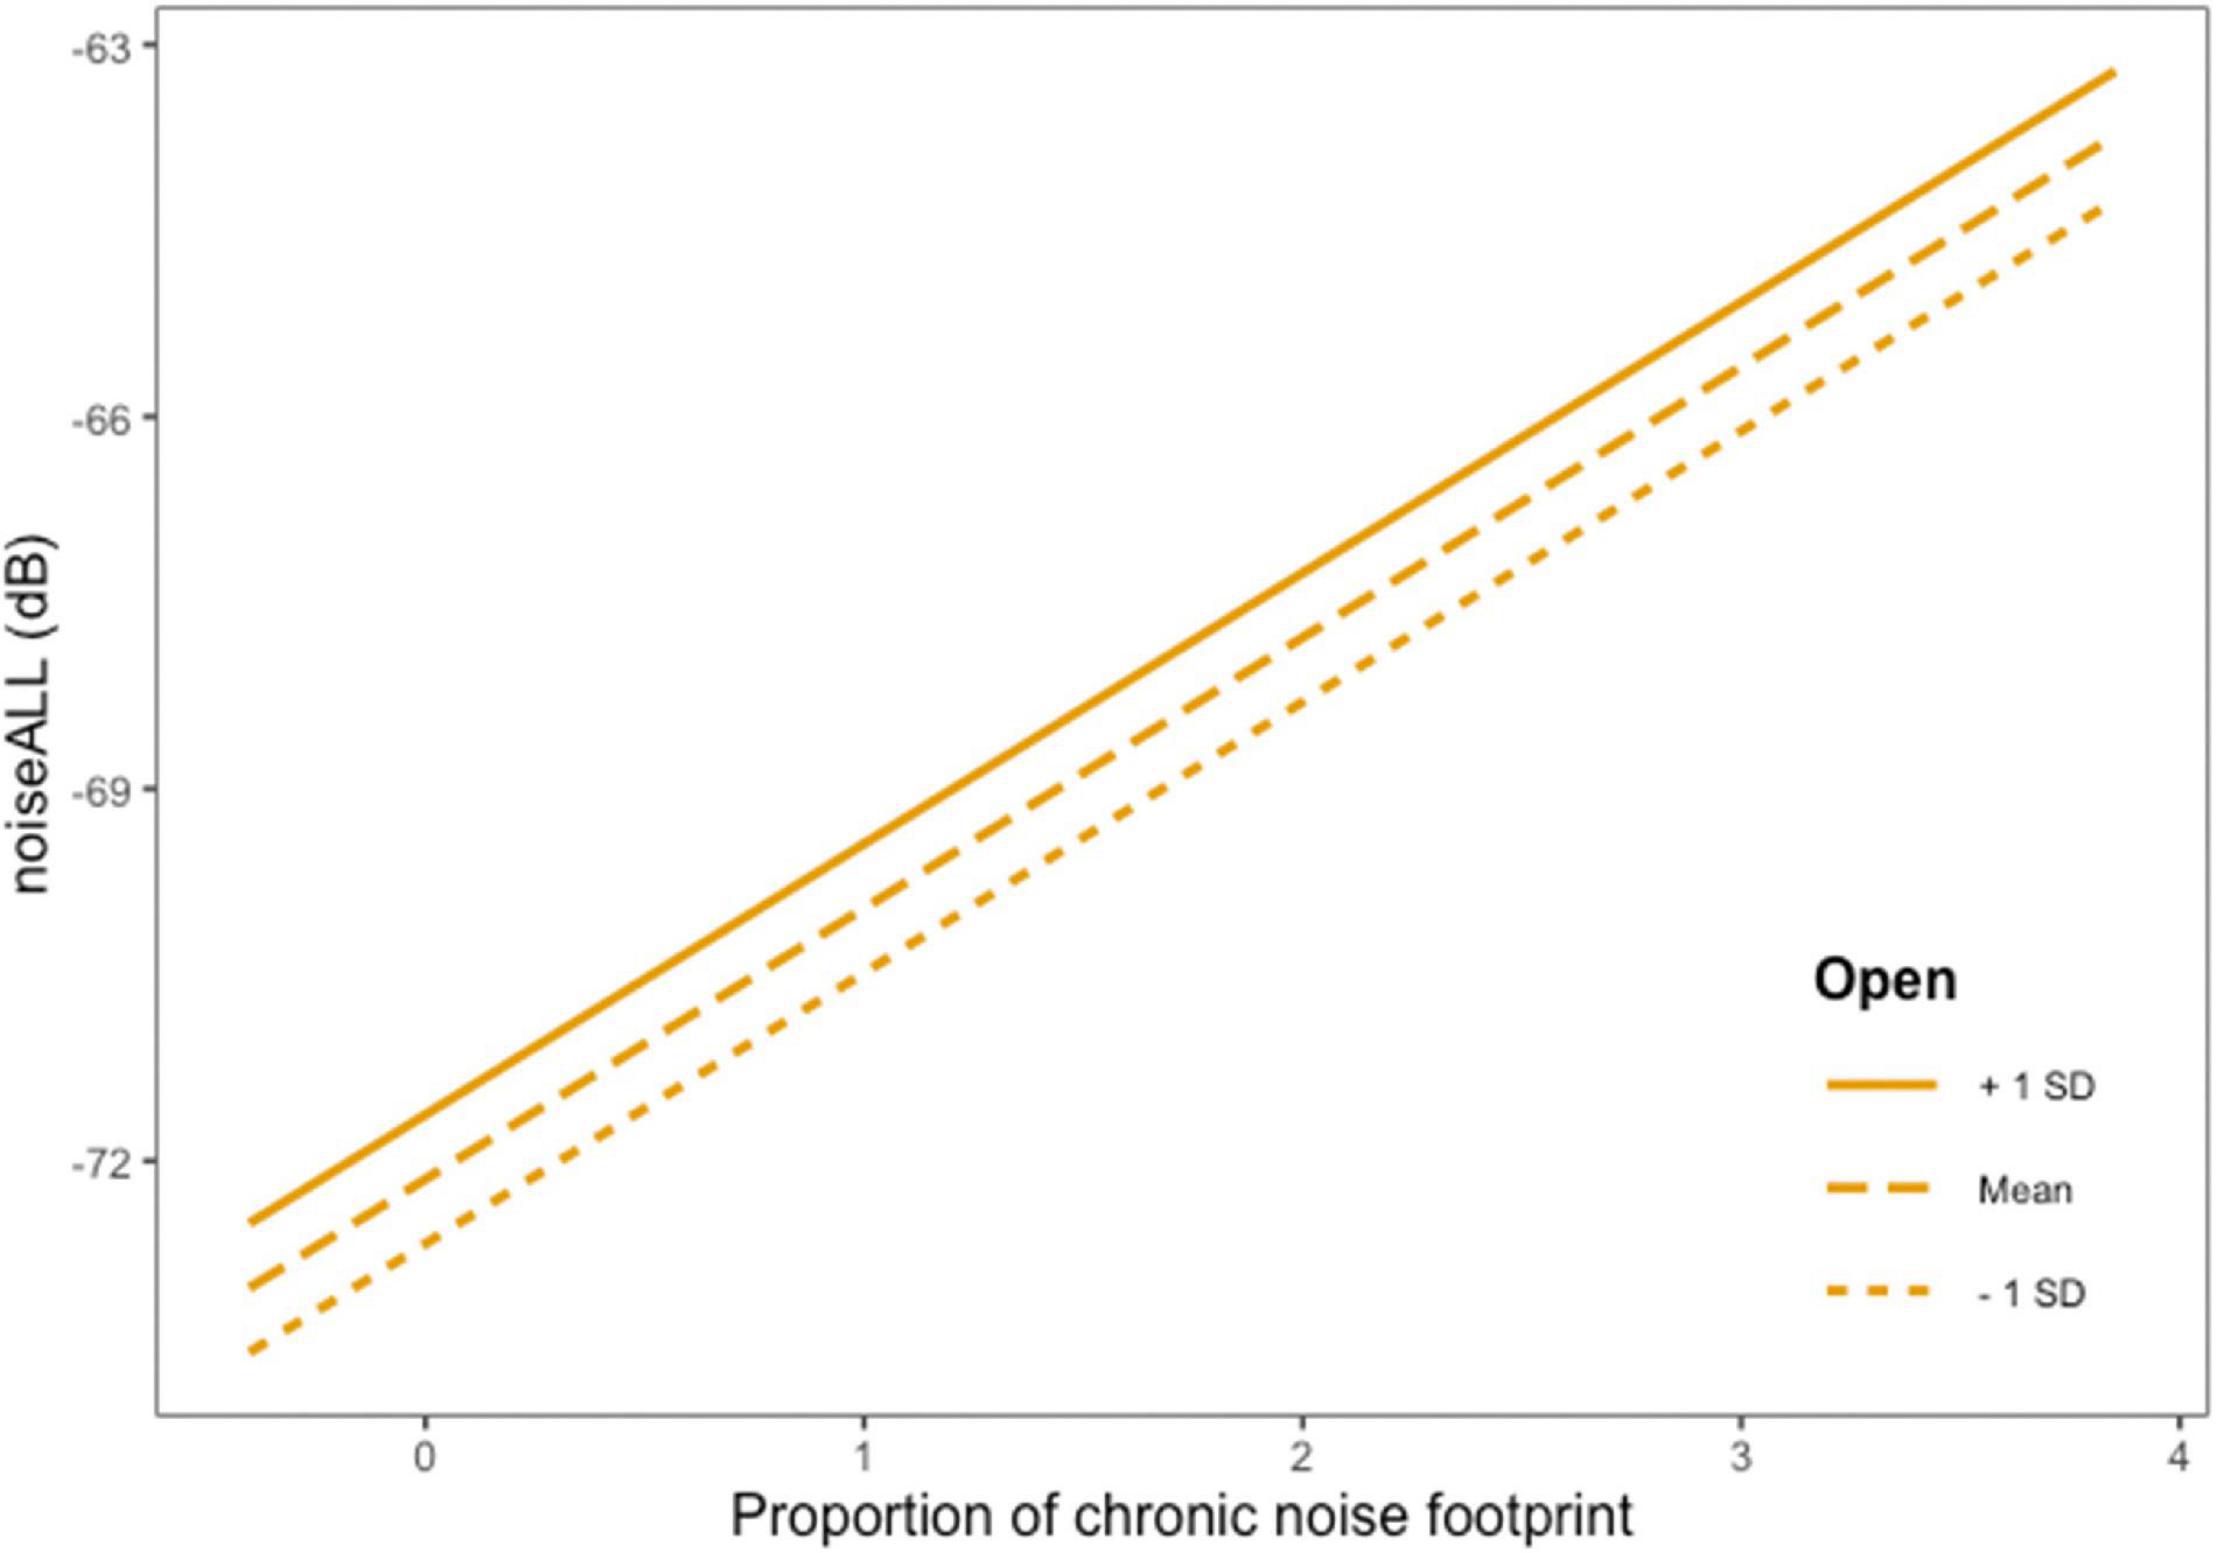
Figure 5. Graphical representation of model predictions of the relationship between noiseALL and proportion of footprint though to create chronic noise as influenced by proportion of open habitat. Proportion of chronic footprint is centered to observe in detail changes in values higher than the mean.
In all models, the interactive model between chronic noise footprint and intermittent noise footprint was a far better fit than the additive model. The patterns were the same across all noise metrics (Figure 6). When the proportion of chronic noise footprint increased and intermittent noise footprint was low, noise was the highest. NoiseHIGH and noiseLOW represented the higher levels of noise considering chronic noise and intermittent noise sources (Figure 6).
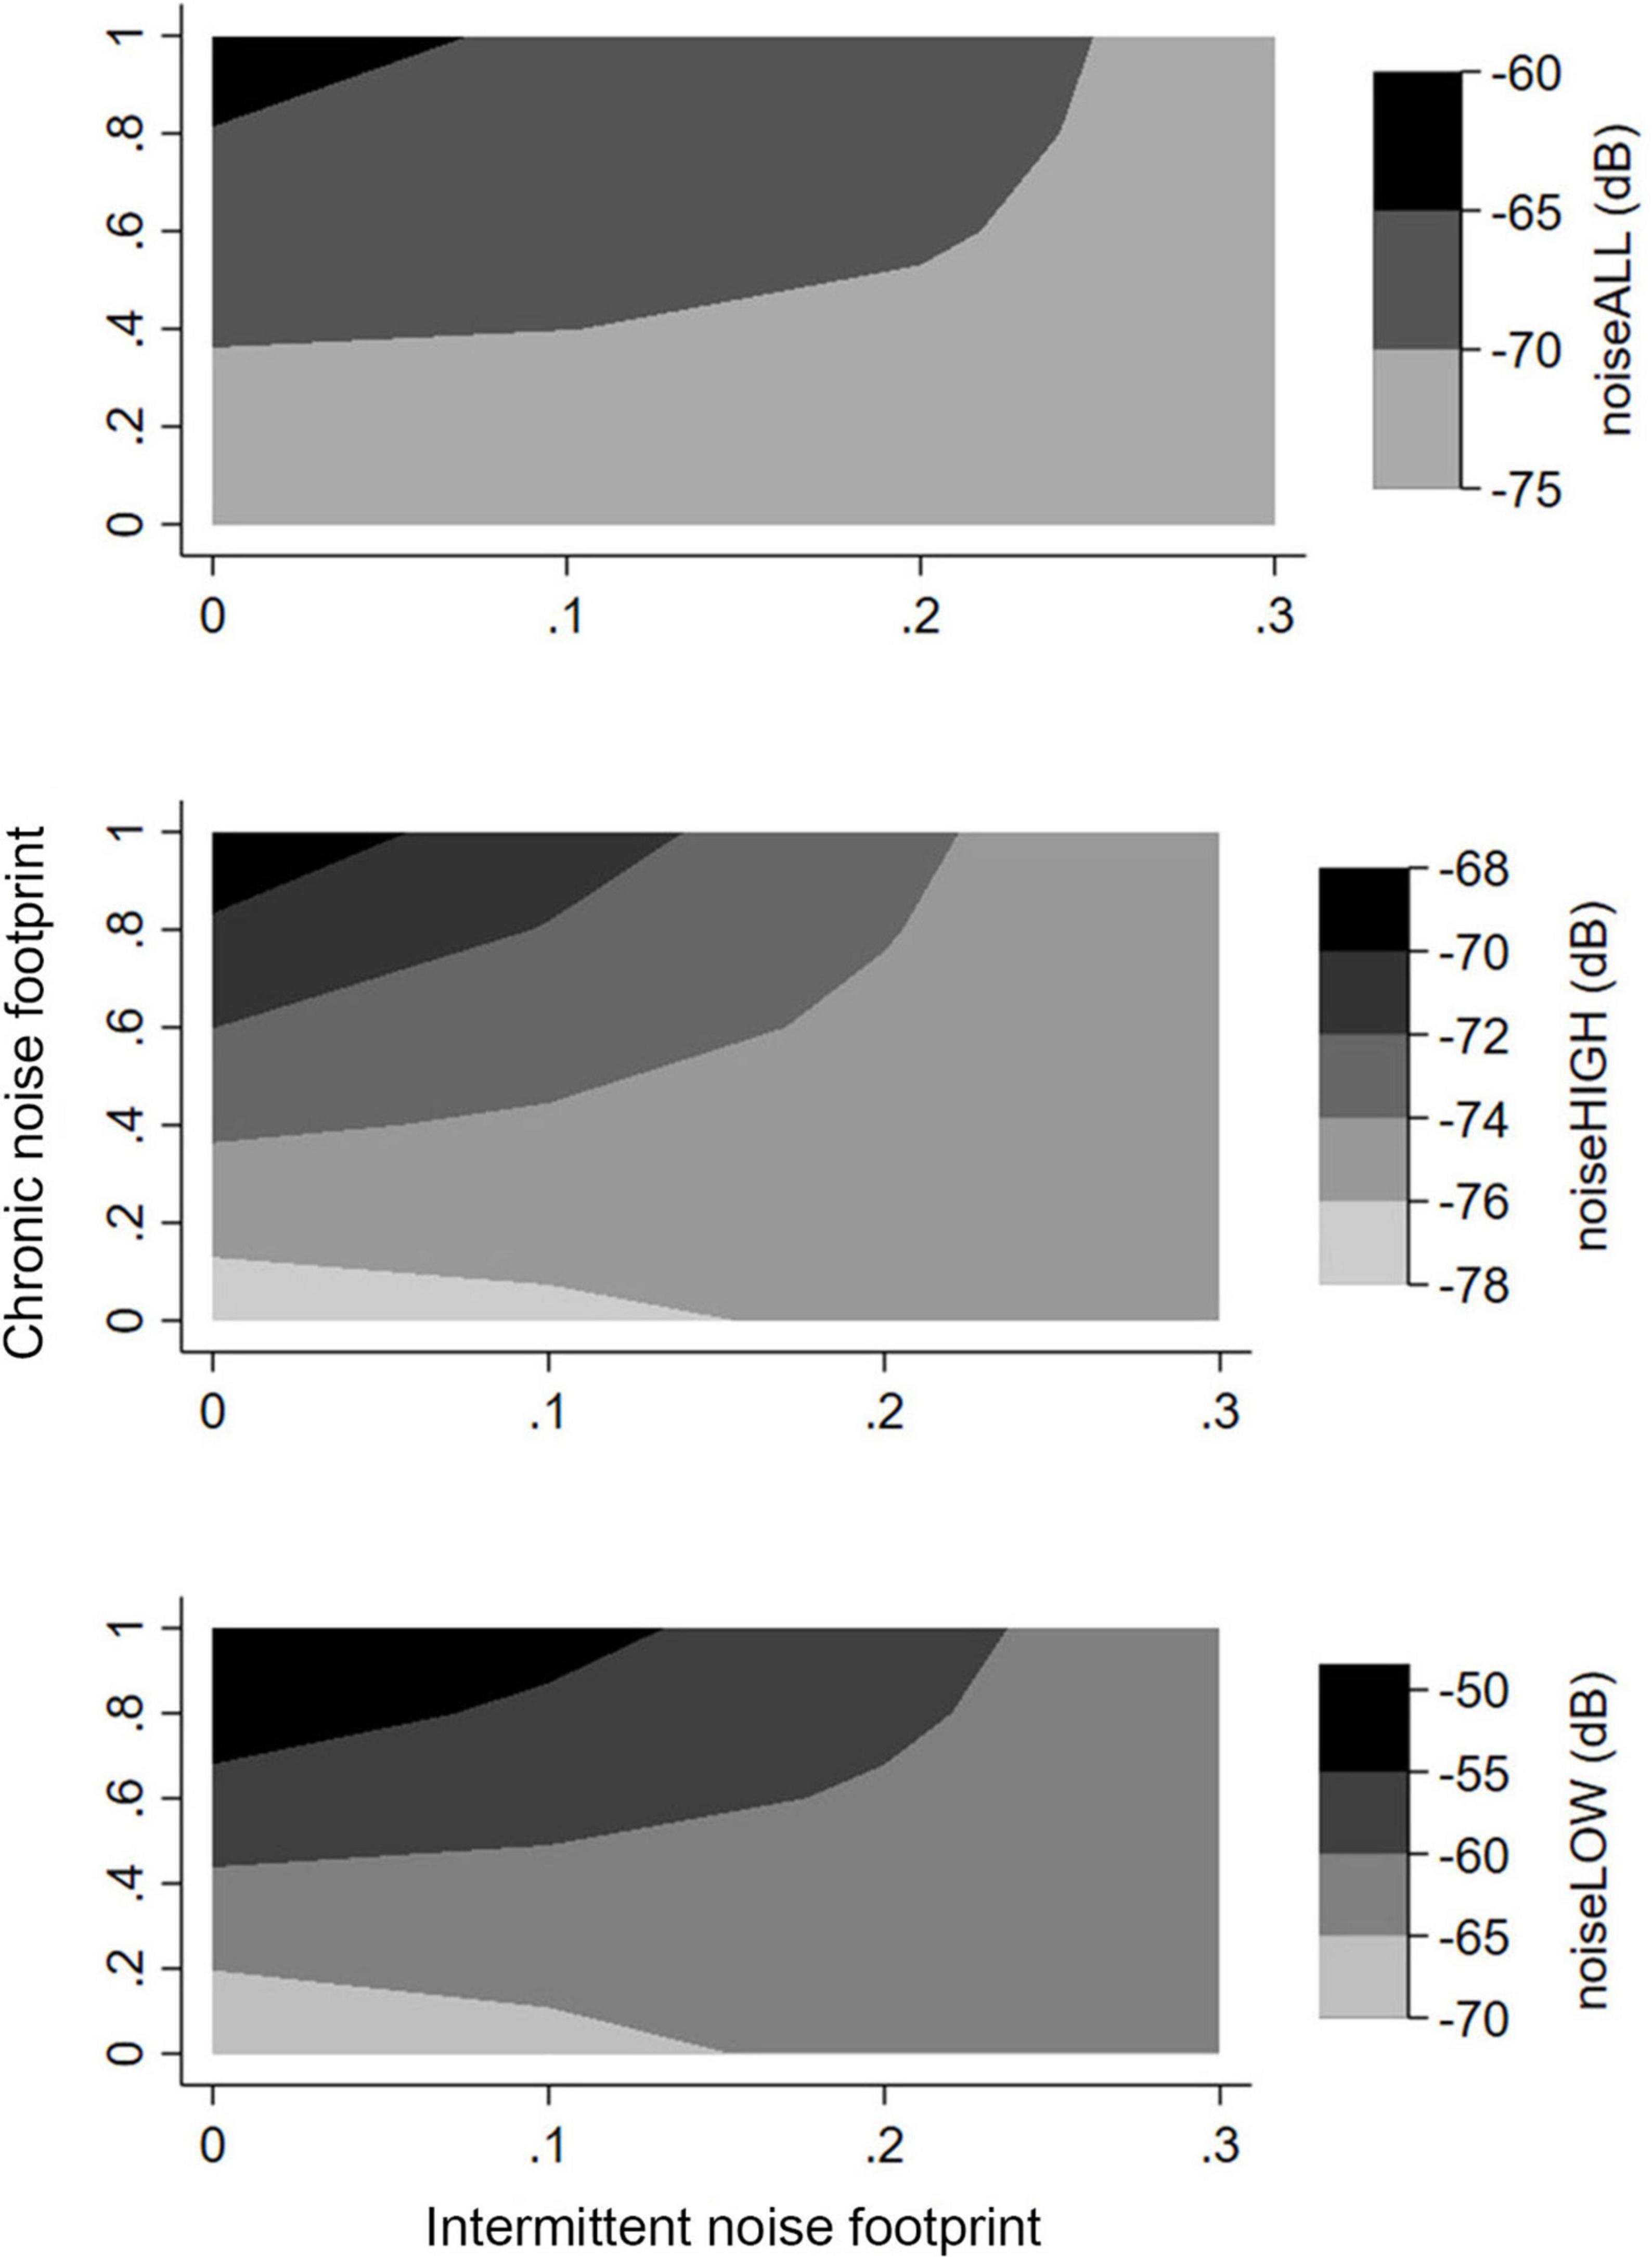
Figure 6. Change in noise metrics represented in 3-D contour plots showing predicted noise level as an interactive function of proportion of area covered by footprint thought to generate chronic noise vs. proportion of area covered by footprint thought to generate intermittent noise. Graphs shows for noiseALL, noiseLOW, and noiseHIGH.
Occupancy Models
Lincoln’s Sparrow was detected at 123 of 280 stations (at 55 of 98, 45 of 83, and 23 of 99 stations grouped as sites: high, moderate, and low industrial sites, respectively); the naïve occupancy estimate was 0.48. Along the noise gradient, Lincoln’s Sparrow occupancy was best explained by proportion of total disturbances, proportion of open areas, and masking noise levels (noiseHIGH) in the range 2,000–8,000 Hz frequency octave bands (Table 5 and Figure 7). The beta estimates of the best model indicated a positive effect of the total footprint, and open areas. Lincoln’s Sparrow had higher occupancy in sites with greater proportion of industrial settings, regenerating vegetation, such as grass and shrubs, and young forest stands (Figures 7A,B,D). Masking noise (noiseHIGH) showed change on Lincoln’s Sparrow occupancy, decreasing as noise increased. However, there is a high variation in the occupancy estimate as noise increased (Figure 7C).
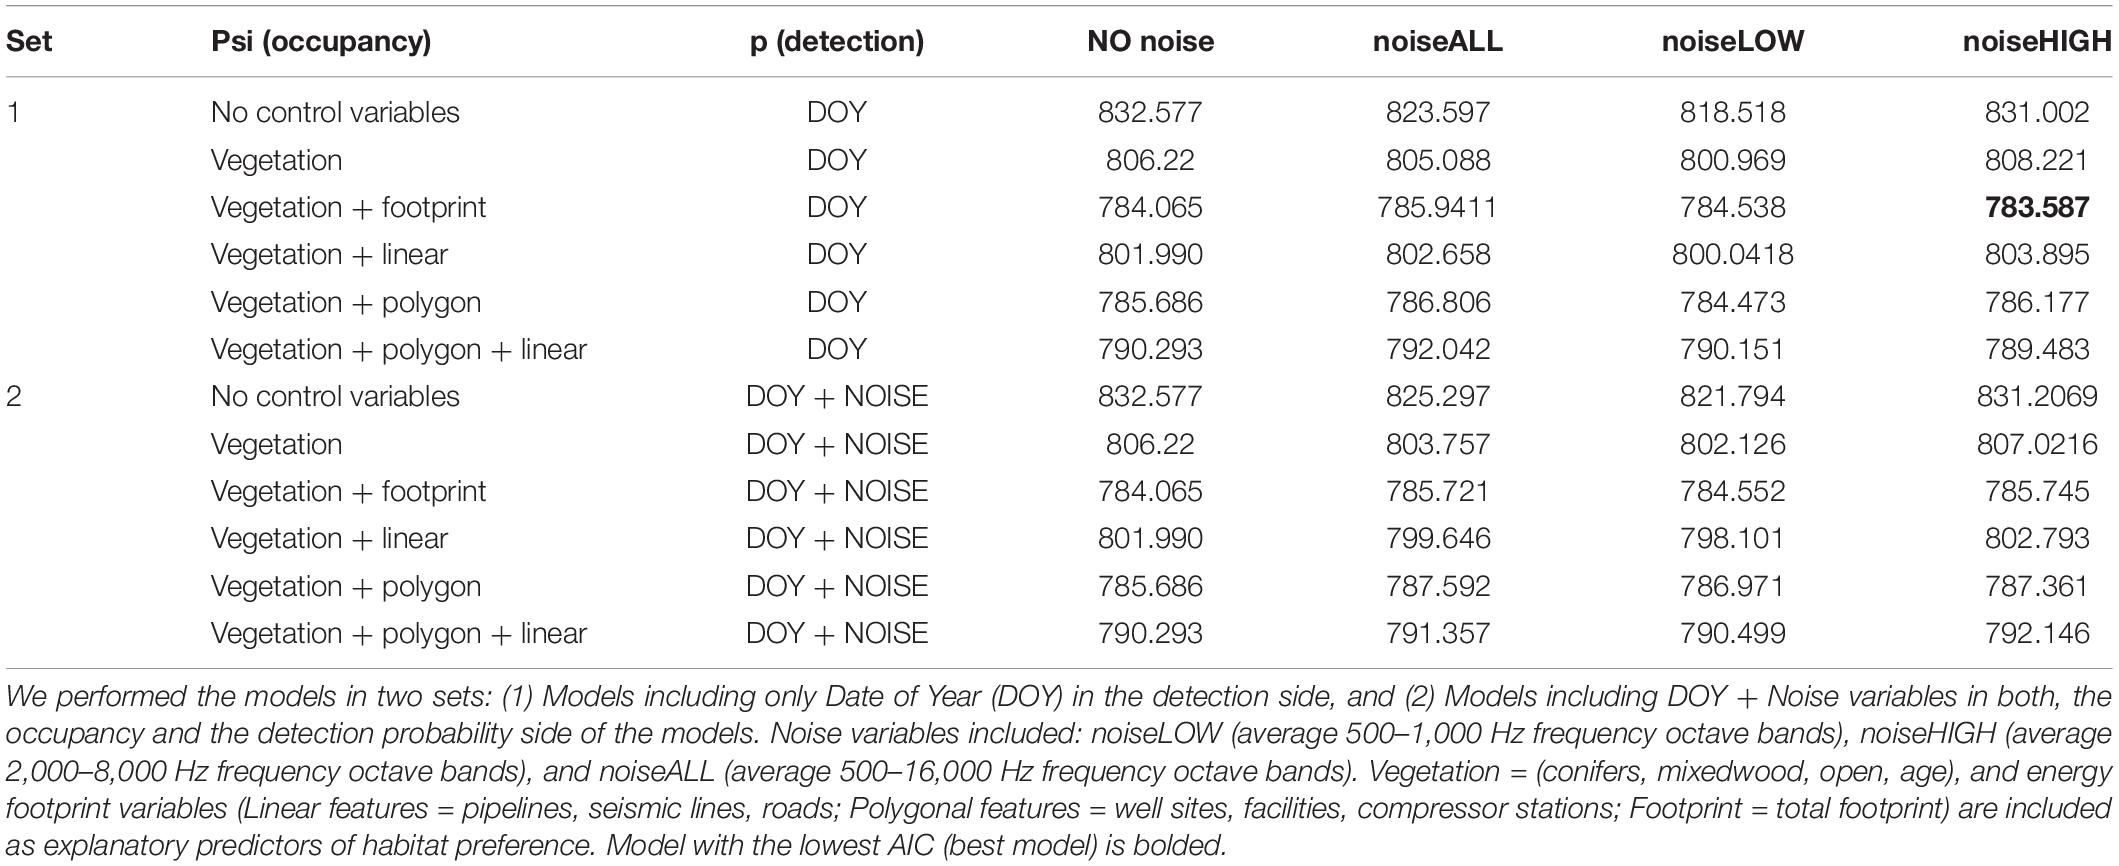
Table 5. Occupancy and detection probability models (AIC values) explaining Lincoln’s Sparrow variation.
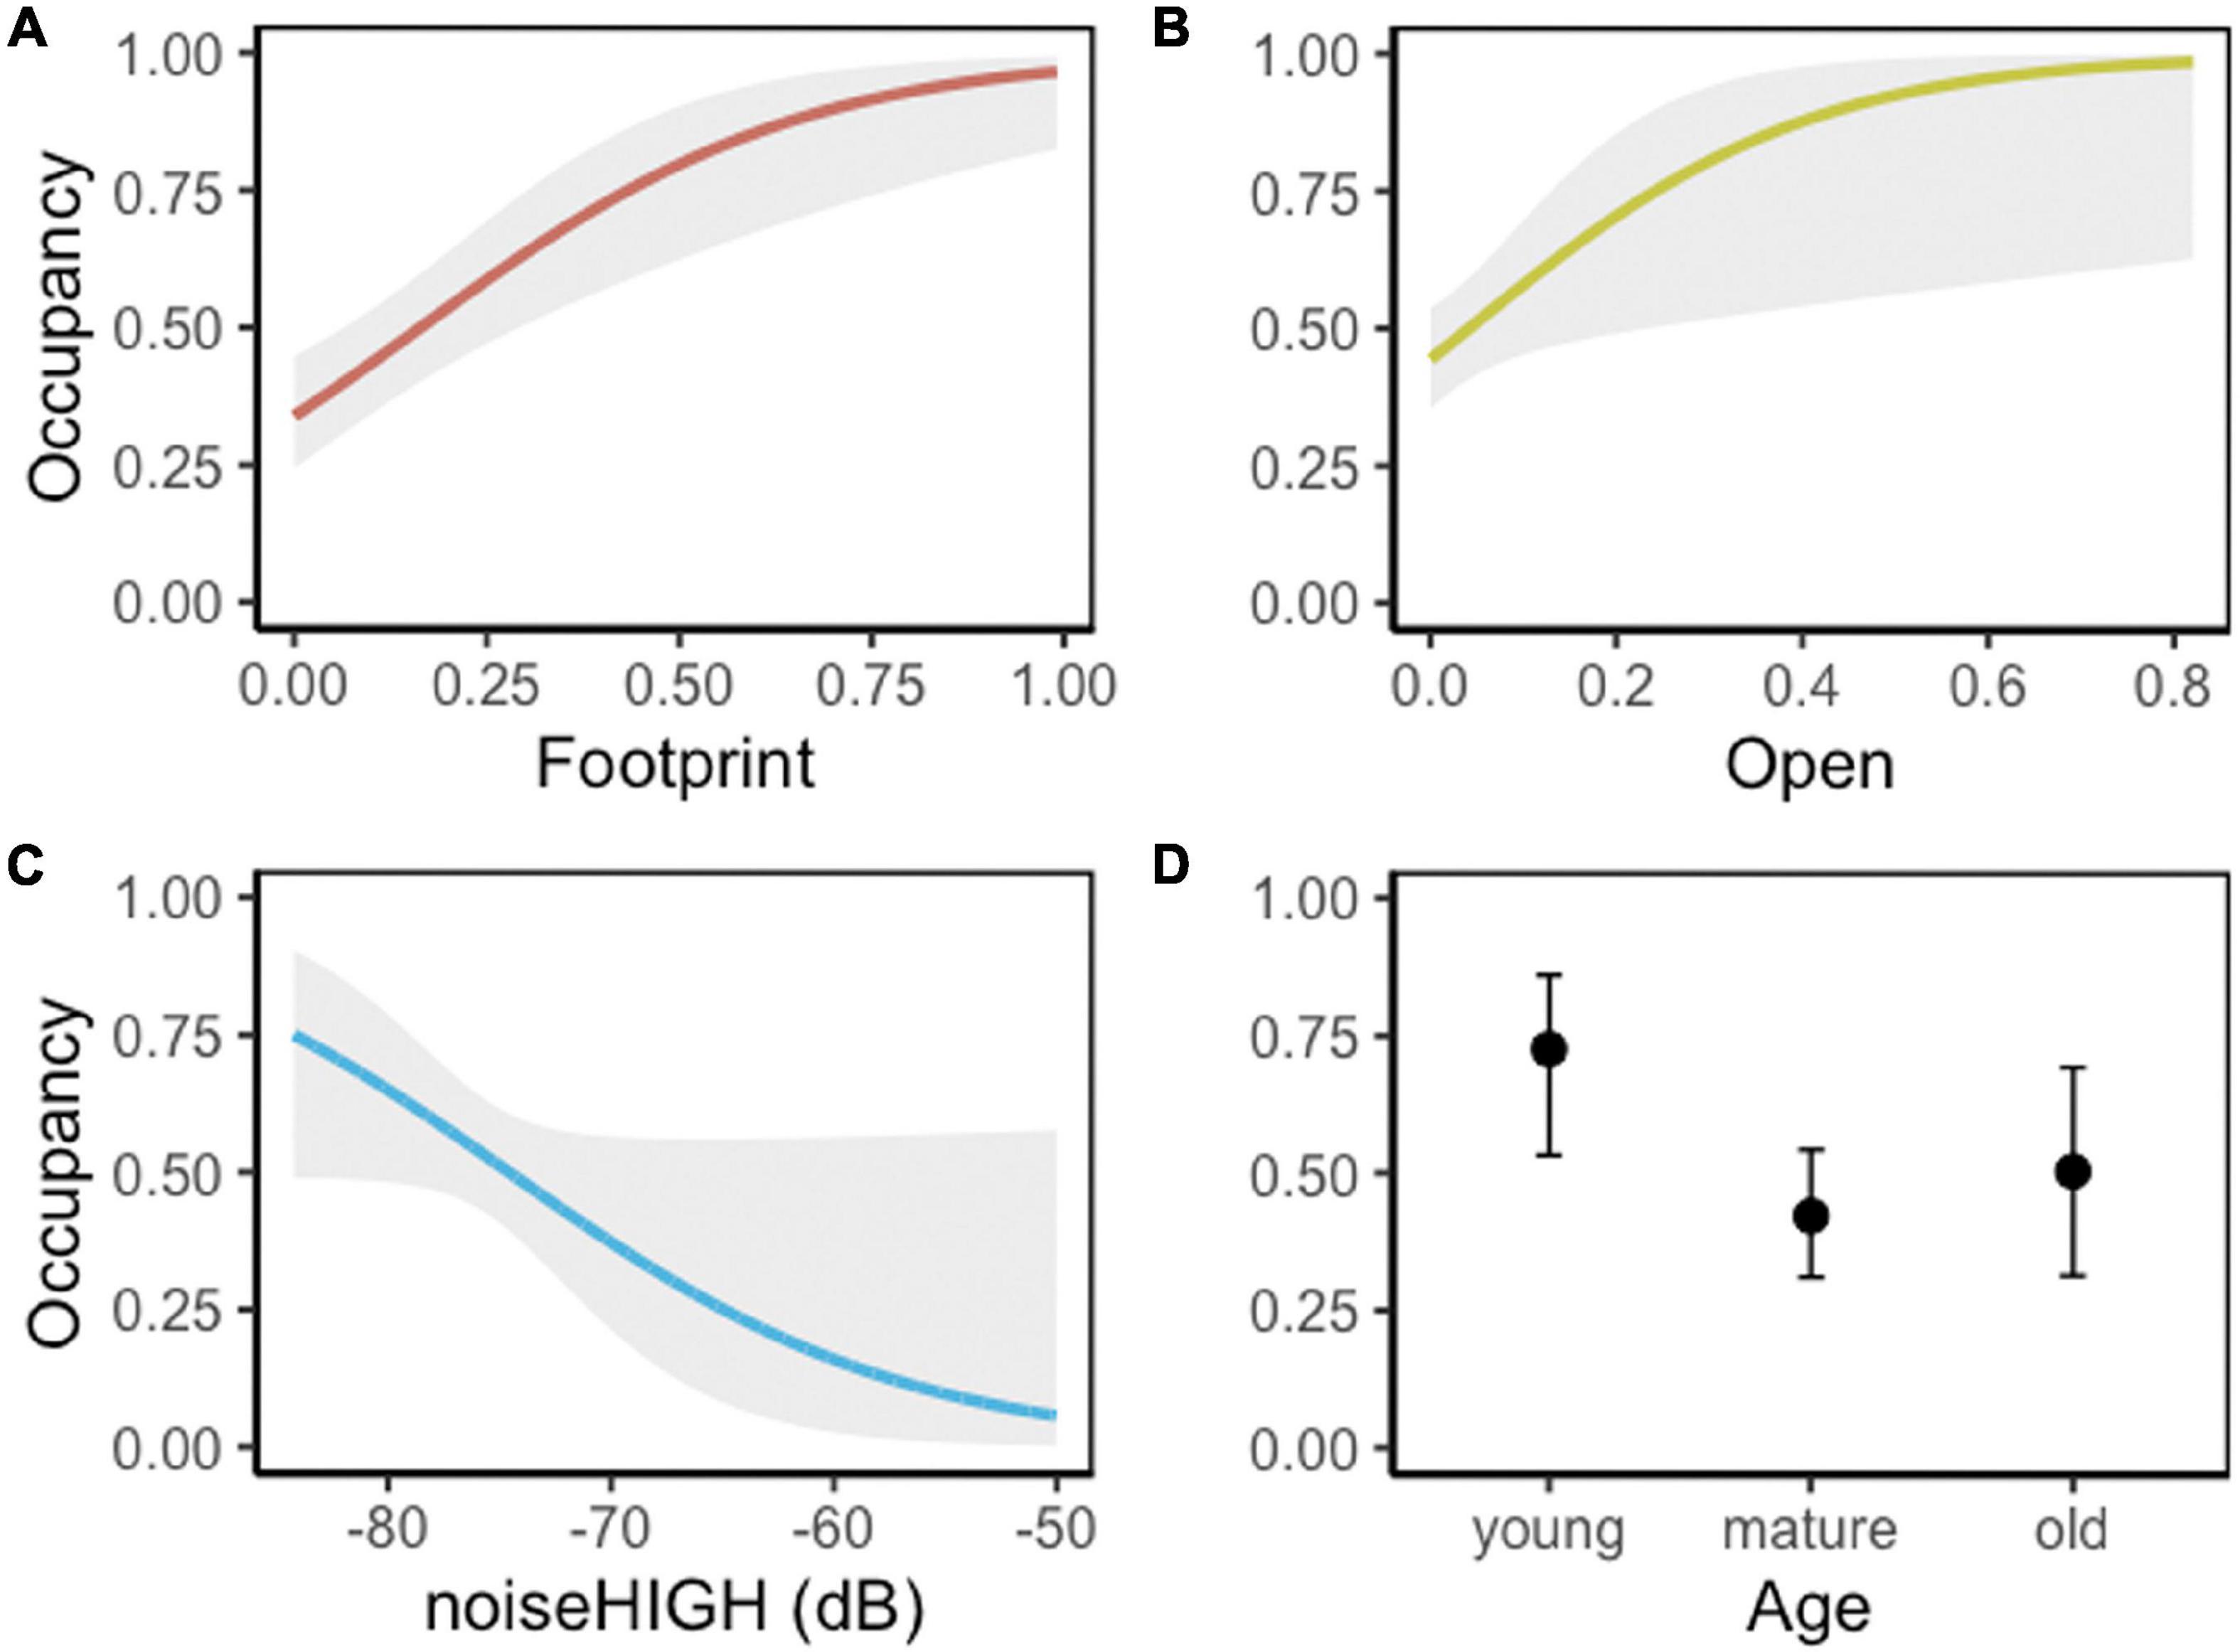
Figure 7. Lincoln’s Sparrow occupancy predicted values (95% CI, gray shade) explained by (A) proportion of footprint, (B) proportion of open areas (grass and shrubs), (C) industrial noise values (average dB from 2,000 to 8,000 Hz frequency octave bands), and (D) forest age class. Confidence intervals for noise are shown in Figure 8.
Variation in occupancy was observed within the three noise measurements. For noiseLOW frequency octave bands (500 and 1,000 Hz) and noiseALL, predicted occupancy was positive as noise increased and it changed to neutral when we included vegetation and footprint as predictors. A different pattern was observed using masking noise (2,000–8,000 Hz; noiseHIGH); it changed from slightly positive to neutral with vegetation, and to a slight negative response when we included vegetation and footprint as predictors (Table 6 and Figure 8).
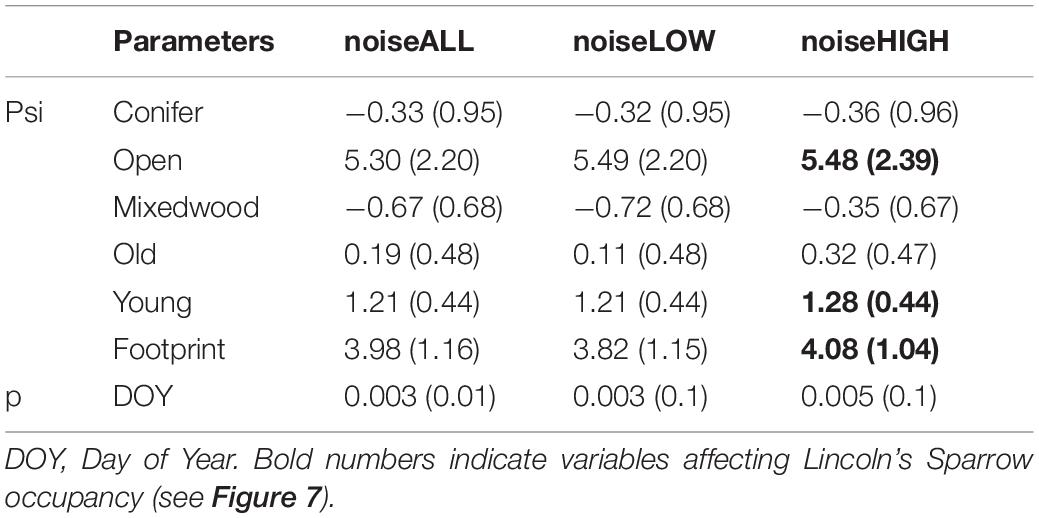
Table 6. Beta estimates (±SE) of best occupancy model including the three different noise metrics. The best model included noiseHIGH.
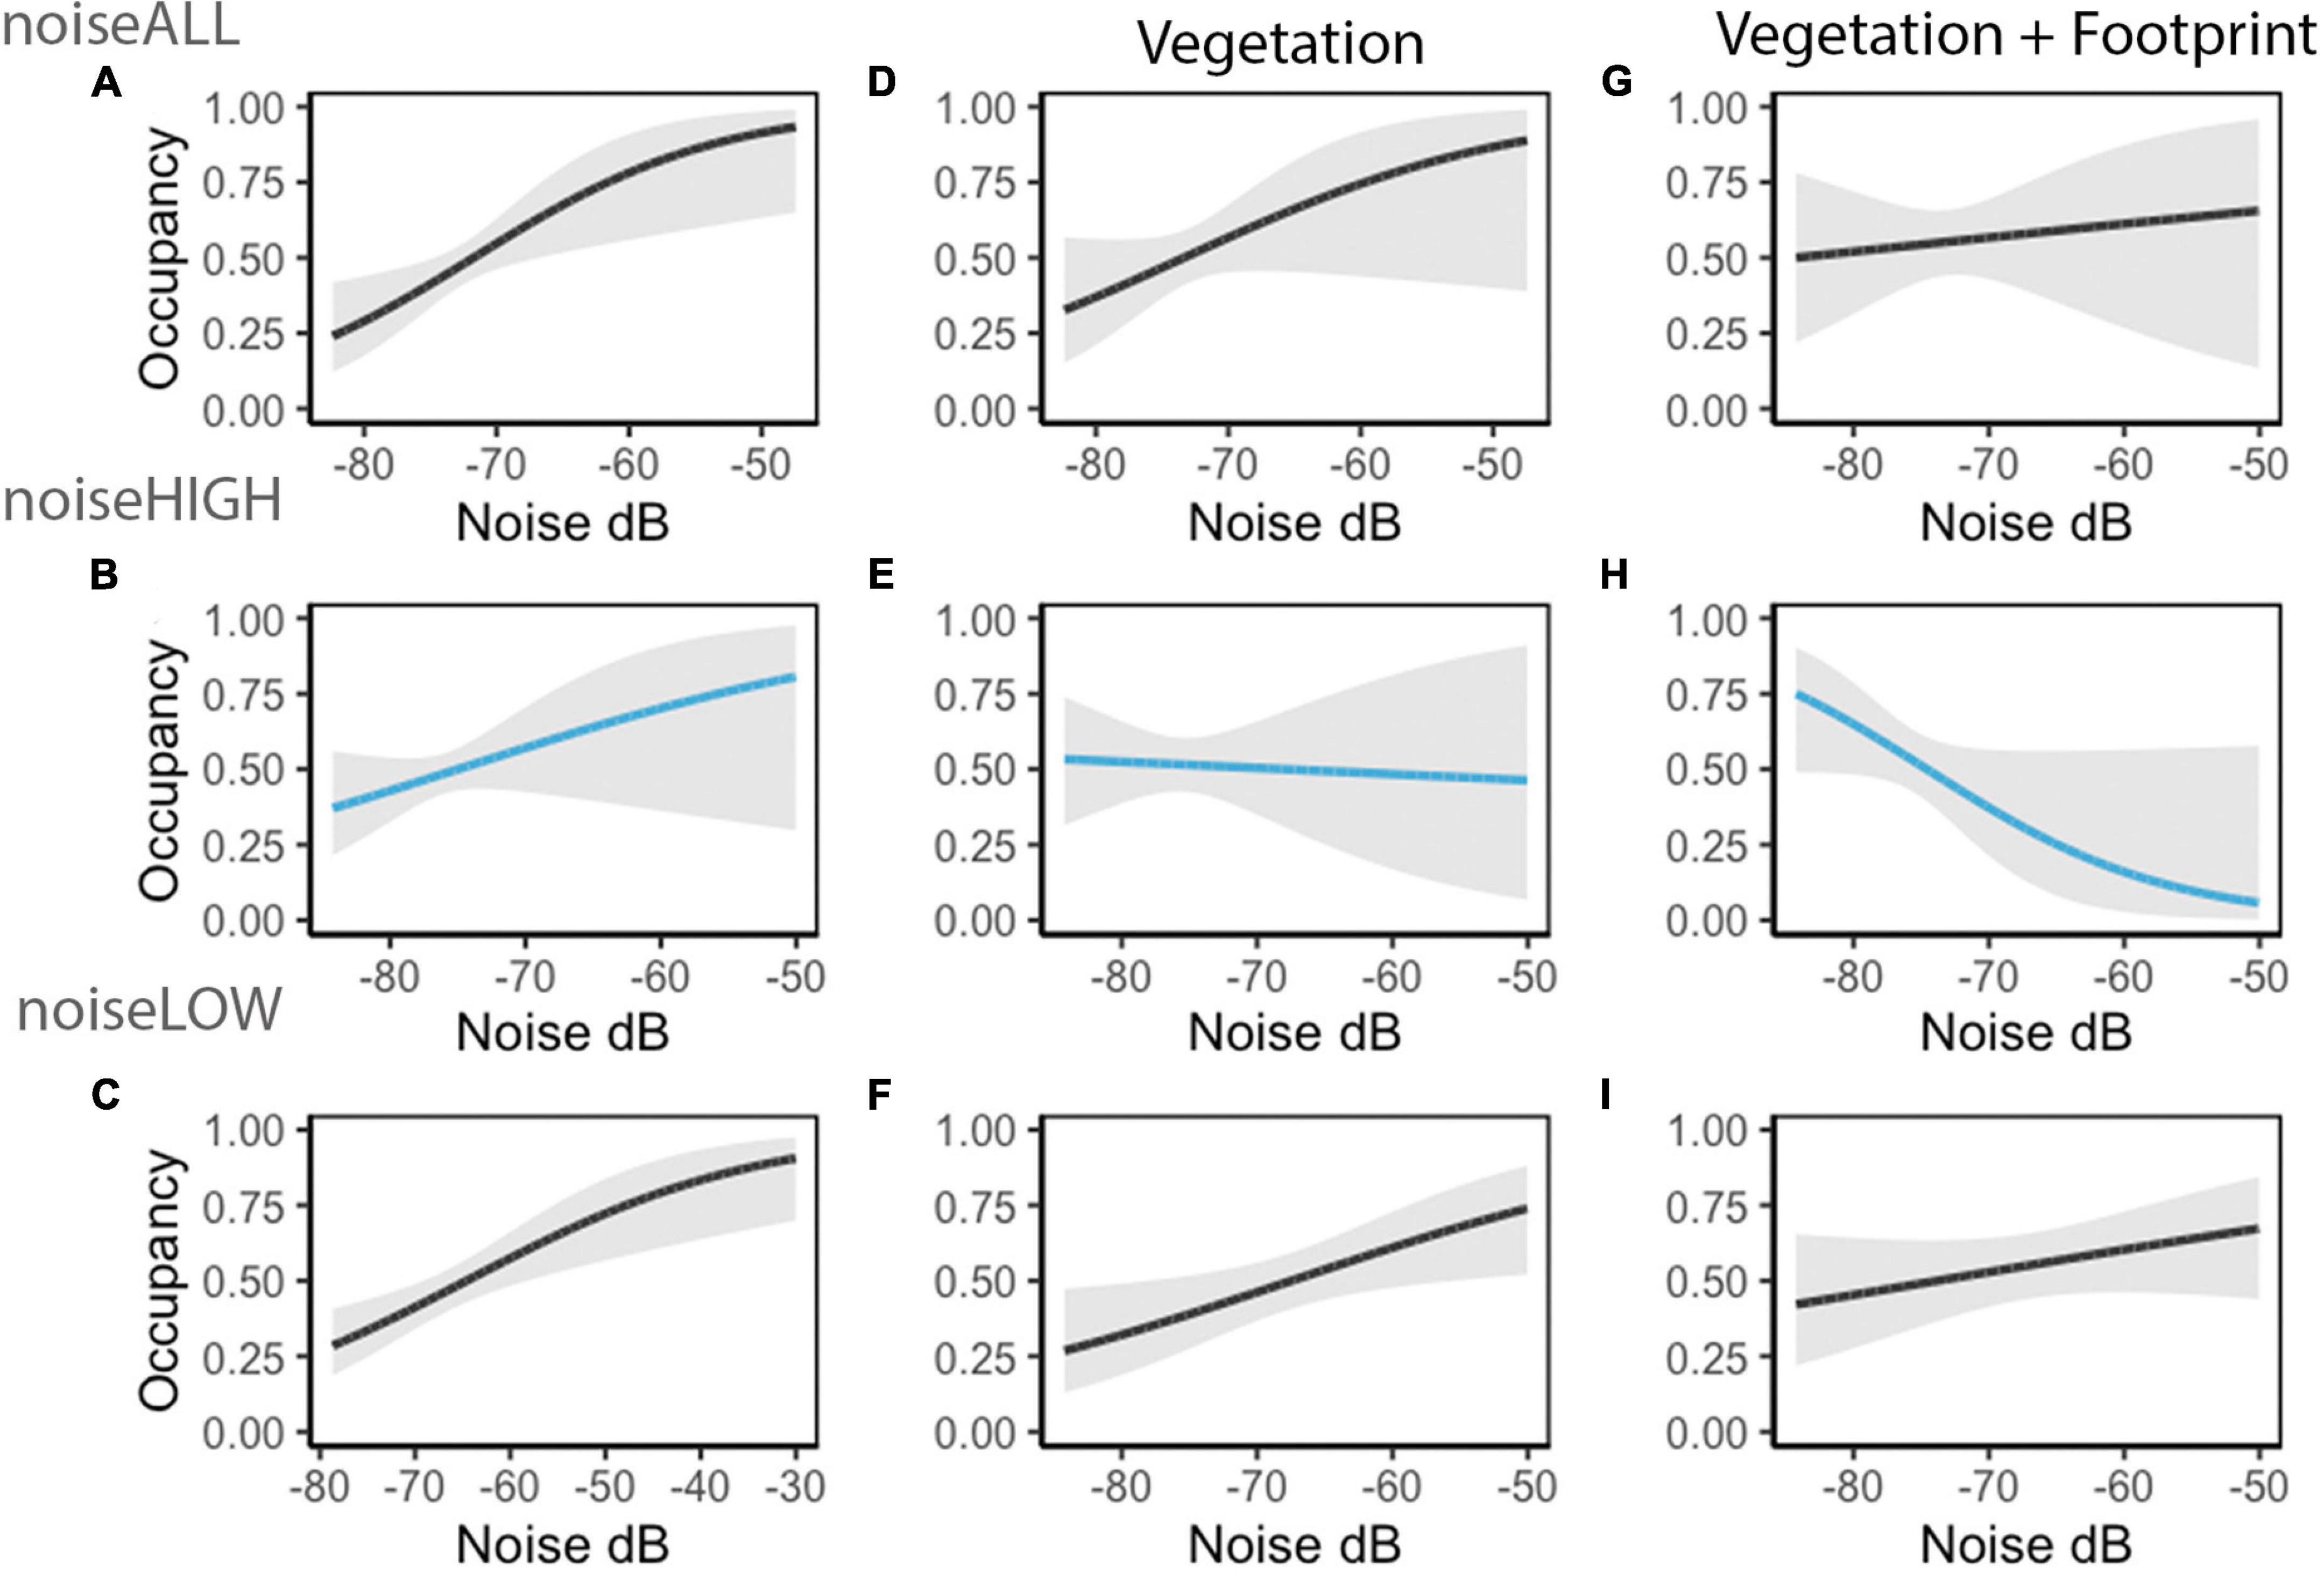
Figure 8. Lincoln’s Sparrow occupancy predicted values (95% CI, gray shade) changed with each noise metric. Each row represents three set of models: noise as unique predictor, and when additional variables are included (e.g., noiseALL, noiseALL + vegetation, and noiseALL + vegetation + proportion of footprint). Each row shows how Lincoln’s Sparrow occupancy estimates varied by noiseALL (A,D,G), noiseHIGH (B,E,H), and noiseLOW (C,F,I).
Discussion
In recent years, wildlife responses to noise have been an area of active investigation with the main focus being urban environments (Francis and Barber, 2013; Shannon et al., 2016; Ciach and Fröhlich, 2017), while industrial sites and the noise associated to their activities remain understudied (Habib et al., 2007; Francis et al., 2011b). Our approach to directly measure noise with ARUs and compare it to the occupancy of a disturbance tolerant species addresses this knowledge gap by separating the effects of vegetation structure and industrial noise in a remote area undergoing energy development. We found that industrial activities, specifically facilities and certain roads, increased the levels of noise in the environment. We also found that Lincoln’s Sparrow occupancy responded to a gradient of noise variation showing a tendency to decrease as masking noise increases in conditions with similar levels of disturbance to vegetation.
The idea that the energy industry and the noise generated by its activities have negative effects on songbird occupancy comes from the few previous studies that compared noisy to non-noisy industrial areas (Bayne et al., 2008; Francis et al., 2011a). A potential drawback of this dichotomous approach to anthropogenic noise is the lack of opportunity to understand bird responses to continuous variation in levels of noise. For example, intermediate levels of noise may be less detrimental than an extreme noisy vs. non-noisy contrast. In this study, we had 280 ARU stations describing a gradient of industrial noise levels at different sources as well as distances to those noise sources. Similarly, Marín-Gómez et al. (2020) studied the variation of occupancy for an owl species in a gradient of noise in an urban area, finding that levels of noise in the −60 and −40 dB ranges (relative amplitude levels at the frequency octave bands under 2,000 Hz) influenced occupancy, but values below −60 dB elicited no effect. Here, we assessed three different quantitative measurements of noise that were not previously considered as explanatory predictors of bird occupancy inhabiting the boreal forest in the context of industrial noise. Frequency octave bands from 2,000 to 8,000 Hz and low frequency octave bands (500 and 1,000 Hz) concentrated the higher levels of sound energy (from −60 to −40 dB), which were also the ones predicting changes in occupancy by our study species.
Measuring Noise and Factors That Influence Noise Levels
Although there are potential limitations of using ARUs to measure noise levels, we found strong relationships between energy sector footprint and our noise metrics. The large sample size allowed us to test multiple hypotheses about how noise may spread in complex environments with relationships that are somewhat dependent on the metric of noise used. There are numerous processes affecting sound propagation, such as attenuation and reverberation due to vertical objects (Wiley and Richards, 1978, 1982; Naguib and Wiley, 2001). Here, the proportion of open areas was positively associated with higher noise levels recorded at a given ARU. A priori we expected that open habitats might have higher noise levels because of fewer obstructions. Sound propagates spherically, and energy decreases with square of distance from the source (6 dB for each doubling of distance), but when sound encounters dense trees there is often a greater decrease (as high as 5–10 dB) for each doubling of distance (Naguib and Wiley, 2001). The known impediment to sound caused by vegetation makes it surprising that proportion conifers or proportion mixedwood were not important predictors of sound intensity. This may have occurred because other kinds of vegetation also absorbed sound. While there is often an inverse correlation between the proportion conifer or proportion mixedwood with proportion open, that correlation was not strong in our study area (r = −0.04, r = −0.12). Another unexpected result was that mixedwood was positively related with the noiseHIGH metric, but this may have resulted spuriously if the locations where particularly high frequency noises occurred were disproportionately located in mixedwoods. Further assessments of noise propagation are needed to more completely understand the role of vegetation structure in such areas.
The use of measurements in different octave bands to evaluate occupancy by Lincoln’s Sparrow was key to understand at which frequencies in the acoustic spectrum noise caused the strongest effect. Controlling for vegetation and energy footprint was an important component of understanding the impacts of noise, which could otherwise be confounded with habitat type. While Lincoln’s Sparrow can clearly be found in areas with noise, this species likely does not prefer noisy sites per se, but rather prefers habitat types in early seral stages that tend to be closer to noise sources (best occupancy model including noiseHIGH, total footprint, and open areas). Our noise metrics obtained from un-calibrated recordings on ARUs can benefit the study of noise in the wild because it allows for comparisons in diverse spatial settings with realistic variation in environmental noise. By measuring noise directly over several frequencies with Wildlife Acoustic SM2 recorders, we reduced variation between measurements that could otherwise be caused by equipment type. With the improvements of recording devices (especially microphones), modern equipment can eliminate some of the sounds made by the devices themselves to strengthen the inferences that can be made about noise effects. By recording ARU makes, models, and settings, researchers can support robust comparisons of these types of noise measurements across studies.
The interaction between chronic noise and intermittent noise for the three noise metrics shows the complexity of measuring noise along an industrial gradient. High chronic noise was driven by the presence of large industrial facilities, active wells, and compressor stations. Thus, the noise received by the ARUs in our study was more likely to be a function of relatively few noise sources. As the proportion of intermittent noise increased, total noise increased even with low footprints from chronic noise sources. Interestingly, at high levels of chronic noise, intermittent noise from roads did not add much to the total noise levels we observed. One reason for this could be that our method of measuring noise level was not able to properly measure the cumulative effects of noise (Sueur, 2018). The major highway and multi-lane gravel roads that take workers from the highway to the oil sands facilities generated much of the intermittent noise in our study area. However, traffic speeds are generally lower close to oil sands facilities to support greater safety, which differs from the generally positive effect on noise of traffic speed (Parris and Schneider, 2009). While not reported here, we also modeled the distance to facilities and roads as noise predictors, but these models did not fit as well as the proportion metrics, suggesting a cumulative noise effect is occurring that cannot easily be measured with distance to variables.
Lincoln’s Sparrow Response
Generally, songbirds with low-frequency songs are less abundant in noisy sites than those with higher frequency vocalizations (Proppe et al., 2013; Francis, 2015). This is why most studies that have assessed noise have focused on low-frequency anthropogenic noise. Therefore, we expected that Lincoln’s Sparrow would occupy sites with moderate-high levels of noise because their songs are generally less masked above 2,000 Hz. In addition, sparrows have shown acoustic flexibility in their songs that may allow them to better adjust to anthropogenic noise by altering their vocalizations (Wood and Yezerinac, 2006; Gentry and Luther, 2017). Occupancy models including noiseLOW or noiseALL as predictors, suggested that Lincoln’s Sparrow occupancy increased with noise; nevertheless, these were not the best predictors. These results could be interpreted as Lincoln’s Sparrow can live in noisy areas and either do not experience or have adapted to negative effects of noise on their communication. The best fitting occupancy model suggested that natural variation that made for suitable habitat was more important than the effects of noise. However, the negative effect of occupancy of high frequency industrial noise (noiseHIGH) warrants further investigation, and suggests that noise may have impacts even on species that is otherwise highly tolerant to human disturbance.
The generality of our results may depend on whether the noise levels we monitored were sufficient to inhibit aural communication in Lincoln’s Sparrow or whether the birds adapted their songs to be able to communicate in areas with noise. Lincoln’s Sparrow songs can be masked by industrial noise as there is an overlap in the low frequency syllables of their song with industrial noise under 2,000 Hz, with syllables ranging between 1.5 and 8 kHz (Cicero and Benowitz-Fredericks, 2000; Sockman, 2009). Therefore, acoustic flexibility of Lincoln’s Sparrow song features could be a possible adaptation for living in noisy areas, as described for other sparrow species exposed to similar industrial noise (Curry et al., 2018). However, in other work, we showed that Lincoln’s Sparrow did not shift the minimum frequency of its song in this environment (Sánchez, 2021). By contrast, some other species have been shown to shift the frequencies of their songs in response to anthropogenic noise (Slabbekoorn and Peet, 2003; Proppe et al., 2011; Cardoso, 2014; Roca et al., 2016).
This study is one of the first to directly use noise measurements to predict occupancy of a wild songbird in the context of chronic industrial noise and to do so in an environment that consists mainly of natural habitat. Another important feature of our study was to measure noise at multiple octave-bands, which resulted in a non-biased method to characterize the noise along an industrial gradient, giving a quantitative description of noise rather than a categorical human judgment. This method can be used to test potential limitations in communication in songbirds and will be valuable for song transmission experiments that test masking and song degradation for species exposed to noise. Understanding masking noise and how it influences song degradation over space are key biological issues related to chronic industrial noise that require more investigation. We found a negative effect of high frequency noise on Lincoln’s Sparrow occupancy in a gradient of industrial noise; therefore, this result suggests a potentially deleterious effect of noise that interferes with communication, and not of other noise types. Future studies will be needed to understand the effects of noise on communication, physiological state, and reproductive success. For terrestrial passerines and especially for Neotropical migrants who find new conditions for reproduction every year in Northern Latitudes, understanding the multiple environmental factors that could diminish quality of breeding territories requires attention for conservation actions.
Data Availability Statement
The raw data supporting the conclusions of this article will be made available by the authors, without undue reservation.
Ethics Statement
Ethical review and approval was not required for the animal study because the study relied solely on the use of autonomous recording units placed in the field to collect acoustic data. No animals were captured, handled, housed, manipulated, or followed.
Author Contributions
NS and EB conceived the idea. NS acquired the data and wrote the first draft with input from EB and CS. NS, LS, RH, and EB analyzed the data. All authors contributed to interpreting the results and writing the final draft.
Funding
This research is part of the Boreal Ecosystem Recovery and Assessment (BERA) project (www.bera-project.org), and was supported by the Natural Sciences and Engineering Research Council of Canada Collaborative Research and Development Grant (CRDPJ 469943-14) in conjunction with Alberta-Pacific Forest Industries, Cenovus Energy, ConocoPhillips Canada, and Devon Canada Corporation.
Conflict of Interest
The authors declare that the research was conducted in the absence of any commercial or financial relationships that could be construed as a potential conflict of interest.
The authors declare that this study received funding from Alberta-Pacific Forest Industries, Cenovus Energy, ConocoPhillips Canada, and Devon Canada Corporation. The funders were not involved in the study design, collection, analysis, interpretation of data, the writing of this article or the decision to submit it for publication.
Publisher’s Note
All claims expressed in this article are solely those of the authors and do not necessarily represent those of their affiliated organizations, or those of the publisher, the editors and the reviewers. Any product that may be evaluated in this article, or claim that may be made by its manufacturer, is not guaranteed or endorsed by the publisher.
Acknowledgments
We thank Lionel Leston for providing information about GIS vegetation layers and help with data extraction. Hannah Stormer helped obtaining the initial measurements of noise. Alex McPhail and Hedwig Lankau organized the recordings. Finally, we also thank all the technicians who deployed the autonomous recordings in the field. Two reviewers provided useful comments and suggestions to improve the manuscript.
Supplementary Material
The Supplementary Material for this article can be found online at: https://www.frontiersin.org/articles/10.3389/fevo.2022.810087/full#supplementary-material
Supplementary Figure 1 | Spatial distribution of average noise levels in the three study sites.
Supplementary Figure 2 | Noise measurements at 3 survey days.
Supplementary Figure 3 | Correlation of 500 Hz and 1000 Hz noise levels using Raven Pro and Kaleidoscope Pro.
Footnotes
References
Alberta Biodiversity Monitoring Institute [ABMI] (2020). Species Webpage. Available Online at: https://abmi.ca/home/data-analytics/biobrowser-home/species-profile [accessed September 24, 2021].
Bayne, E., Leston, L., Mahon, C. L., Sólymos, P., Machtans, C., Lankau, H., et al. (2016). Boreal bird abundance estimates within different energy sector disturbances vary with point count radius. Condor 118, 376–390.
Bayne, E. M., Habib, L., and Boutin, S. (2008). Impacts of chronic anthropogenic noise from energy-sector activity on abundance of songbirds in the boreal forest. Conserv. Biol. 22, 1186–1193. doi: 10.1111/j.1523-1739.2008.00973.x
Blair, R. B. (1996). Land use and avian species diversity along an urban gradient. Ecol. Appl. 6, 506–519. doi: 10.2307/2269387
Burnham, K. P., and Anderson, D. R. (2002). Model Selection and Inference: a Practical Information Theoretic Approach, 2nd Edn. New York, NY: Springer-Verlag Press.
Cardoso, G. C. (2014). Nesting and acoustic ecology, but not phylogeny, influence passerine urban tolerance. Glob. Change Biol. 20, 803–810. doi: 10.1111/gcb.12410
Cardoso, G. C., Hu, Y., and Francis, C. D. (2018). The comparative evidence for urban species sorting by anthropogenic noise. R. Soc. Open Sci. 5:172059. doi: 10.1098/rsos.172059
Carral-Murrieta, C. O., García-Arroyo, M., Marín-Gómez, O. H., Sosa-López, J. R., and MacGregor-Fors, I. (2020). Noisy environments: untangling the role of anthropogenic noise on bird species richness in a Neotropical city. Avian Res. 11:32. doi: 10.1186/s40657-020-00218-5
Ciach, M., and Fröhlich, A. (2017). Habitat type, food resources, noise and light pollution explain the species composition, abundance and stability of a winter bird assemblage in an urban environment. Urban Ecosyst. 20, 547–559. doi: 10.1007/s11252-016-0613-6
Cicero, C., and Benowitz-Fredericks, M. (2000). Song types and variation in insular populations of Lincoln’s sparrow (Melospiza lincolnii), and comparisons with other Melospiza. Auk 117, 52–64. doi: 10.1093/auk/117.1.52
Curry, C. M., Antze, B., Warrington, M. H., Des Brisay, P., Rosa, P., and Koper, N. (2018). Ability to alter song in two grassland songbirds exposed to simulated anthropogenic noise is not related to pre-existing variability. Bioacoustics 27, 105–130. doi: 10.1080/09524622.2017.1289123
Dabros, A., Pyper, M., and Castilla, G. (2018). Seismic lines in the boreal and arctic ecosystems of North America: environmental impacts, challenges, and opportunities. Environ. Rev. 26, 214–229. doi: 10.1139/er-2017-0080
Dooling, R. J., Brown, S. D., Klump, G. M., and Okanoya, K. (1992). Auditory perception of conspecific and heterospecific vocalizations in birds: evidence for special processes. J. Comp. Psychol. 106, 20–28. doi: 10.1037/0735-7036.106.1.20
Fiske, I., and Chandler, R. (2011). Unmarked: an R package for fitting hierarchical models of wildlife occurrence and abundance. J. Stat. Softw. 43, 1–23.
Forman, R. T. T., Sperling, D., Bissonette, J. A., Clevenger, A. P., Cutshall, C. D., Dale, V. H., et al. (2002). Road Ecology: Science and Solutions. Washington, DC: Island Press.
Francis, C. D. (2015). Vocal traits and diet explain avian sensitivities to anthropogenic noise. Glob. Change Biol. 21, 1809–1820. doi: 10.1111/gcb.12862
Francis, C. D., and Barber, J. R. (2013). A framework for understanding noise impacts on wildlife: an urgent conservation priority. Front. Ecol. Environ. 11, 305–313. doi: 10.1890/120183
Francis, C. D., Ortega, C. P., and Cruz, A. (2009). Noise pollution changes avian communities and species interactions. Curr. Biol. 19, 1415–1419. doi: 10.1016/j.cub.2009.06.052
Francis, C. D., Paritsis, J., Ortega, C. P., and Cruz, A. (2011b). Landscape patterns of avian habitat use and nest success are affected by chronic gas well compressor noise. Landsc. Ecol. 26, 1269–1280. doi: 10.1007/s10980-011-9609-z
Francis, C. D., Ortega, C. P., and Cruz, A. (2011a). Noise pollution filters bird communities based on vocal frequency. PLoS One 6:e27052. doi: 10.1371/journal.pone.0027052
Francis, C. D., Ortega, C. P., Kennedy, R. I., and Nylander, P. J. (2012). Chapter 9: are nest predators absent from noisy areas or unable to locate nests? Ornithol. Monogr. 74, 101–110. doi: 10.1525/om.2012.74.1.101
Gentry, K. E., and Luther, D. A. (2017). Spatiotemporal patterns of avian vocal activity in relation to urban and rural background noise. J. Ecoacoust. 1:Z9TQHU. doi: 10.22261/JEA.Z9TQHU
Habib, L., Bayne, E. M., and Boutin, S. (2007). Chronic industrial noise affects pairing success and age structure of ovenbirds Seiurus aurocapilla. J. Appl. Ecol. 44, 176–184. doi: 10.1111/j.1365-2664.2006.01234.x
Halfwerk, W., and Slabbekoorn, H. (2015). Pollution going multimodal: the complex impact of the human-altered sensory environment on animal perception and performance. Biol. Lett. 11:20141051. doi: 10.1098/rsbl.2014.1051
Kleist, N. J., Guralnick, R. P., Cruz, A., and Francis, C. D. (2017). Sound settlement: noise surpasses land cover in explaining breeding habitat selection of secondary cavity-nesting birds. Ecol. Appl. 27, 260–273. doi: 10.1002/eap.1437
Lohr, B., Wright, T. F., and Dooling, R. J. (2003). Detection and discrimination of natural calls in masking noise by birds: estimating the active space signal. Anim. Behav. 65, 763–777. doi: 10.1006/anbe.2003.2093
Luther, D., and Gentry, K. (2013). Sources of background noise and their influence on vertebrate acoustic communication. Behaviour 150, 1045–1068. doi: 10.1163/1568539X-00003054
MacArthur, R. H. (1964). Environmental factors affecting bird species diversity. Am. Nat. 98, 387–397. doi: 10.1086/282334
MacArthur, R. H., MacArthur, J. W., and Preer, J. (1962). On bird species diversity. II. Prediction of bird census from habitat measurements. Am. Nat. 96, 167–174. doi: 10.1086/282219
MacDonald, R., Ewanek, N., and Tilley, P. (1996). “Trapping and suppressing compressor axial fan intake noise,” in Proceedings of the Spring Environmental Noise Conference: Innovations in Noise Control for the Energy Industry, (Calgary: Alberta Energy and Utilities Board).
MacKenzie, D. I., Nichols, J. D., Lachman, G. B., Droege, S., Royle, J. A., and Langtimm, C. A. (2002). Estimating site occupancy rates when detection probabilities are less than one. Ecology 83, 2248–2255. doi: 10.1890/0012-9658(2002)083[2248:esorwd]2.0.co;2
Marín-Gómez, O. H., García-Arroyo, M., Sánchez-Sarria, C. E., Sosa-López, J. R., Santiago-Alarcon, D., and MacGregor-Fors, I. (2020). Nightlife in the city: drivers of the occurrence and vocal activity of a tropical owl. Avian Res. 11:9. doi: 10.1186/s40657-020-00197-7
Martens, M. J., and Michelsen, A. (1981). Absorption of acoustic energy by plant leaves. J. Acoust. Soc. Am. 69, 303–306. doi: 10.1121/1.385313
McKinney, M. L. (2002). Urbanization, biodiversity, and conservation: the impacts of urbanization on native species are poorly studied, but educating a highly urbanized human population about these impacts can greatly improve species conservation in all ecosystems. Bioscience 52, 883–890.
Naguib, M., and Wiley, R. H. (2001). Estimating the distance to a source of sound: mechanisms and adaptations for long-range communication. Anim. Behav. 62, 825–837. doi: 10.1006/anbe.2001.1860
Nemeth, E., and Brumm, H. (2010). Birds and anthropogenic noise: are urban songs adaptive? Am. Nat. 176, 465–475. doi: 10.1086/656275
Nenninger, H. R., and Koper, N. (2018). Effects of conventional oil wells on grassland songbird abundance are caused by presence of infrastructure, not noise. Biol. Conserv. 218, 124–133. doi: 10.1016/j.biocon.2017.11.014
Northrup, J. M., and Wittemyer, G. (2013). Characterising the impacts of emerging energy development on wildlife, with an eye towards mitigation. Ecol. Lett. 16, 112–125. doi: 10.1111/ele.12009
Okanoya, K., and Dooling, R. J. (1988). Hearing in the swamp sparrow, Melospiza georgiana, and the song sparrow, Melospiza melodia. Anim. Behav. 36, 726–732. doi: 10.1016/S0003-3472(88)80155-6
Parris, K. M., and Schneider, A. (2009). Impacts of traffic noise and traffic volume on birds of roadside habitats. Ecol. Soc. 14:29.
Perillo, A., Mazzoni, L. G., Passos, L. F., Goulart, V. D., Duca, C., and Young, R. J. (2017). Anthropogenic noise reduces bird species richness and diversity in urban parks. Ibis 159, 638–646. doi: 10.1111/ibi.12481
Proppe, D. S., Sturdy, C. B., and St Clair, C. C. (2011). Flexibility in animal signals facilitates adaptation to rapidly changing environments. PLoS One 6:e25413. doi: 10.1371/journal.pone.0025413
Proppe, D. S., Sturdy, C. B., and St Clair, C. C. (2013). Anthropogenic noise decreases urban songbird diversity and may contribute to homogenization. Glob. Change Biol. 19, 1075–1084. doi: 10.1111/gcb.12098
Raven Pro (2019). Interactive Sound Analysis Software (Version 1.6. 1) [Computer Software]. Ithaca, NY: The Cornell Lab of Ornithology.
Reijnen, R., Foppen, R., and Meeuwsen, H. (1996). The effects of traffic on the density of breeding birds in Dutch agricultural grasslands. Biol. Conserv. 75, 255–260. doi: 10.1016/0006-3207(95)00074-7
Roca, I. T., Desrochers, L., Giacomazzo, M., Bertolo, A., Bolduc, P., Deschesnes, R., et al. (2016). Shifting song frequencies in response to anthropogenic noise: a meta-analysis on birds and anurans. Behav. Ecol. 27, 1269–1274. doi: 10.1093/beheco/arw060
Rossing, T. D., and Fletcher, N. H. (2004). Principles of Vibration and Sound. New York, NY: Springer-Verlag.
Sánchez, N. V. (2021). Variation in Song Characteristics and Responses to Anthropogenic Noise of Lincoln’s Sparrow (Melospiza lincolnii) in the boreal forest. Doctoral thesis. Edmonton: University of Alberta.
Scobie, C. A., Bayne, E. M., and Wellicome, T. I. (2016). Influence of human footprint and sensory disturbances on night-time space use of an owl. Endanger. Species Res. 31, 75–87. doi: 10.3354/esr00756
Shannon, G., McKenna, M. F., Angeloni, L. M., Crooks, K. R., Fristrup, K. M., Brown, E., et al. (2016). A synthesis of two decades of research documenting the effects of noise on wildlife. Biol. Rev. 91, 982–1005. doi: 10.1111/brv.12207
Slabbekoorn, H., and Peet, M. (2003). Ecology: birds sing at a higher pitch in urban noise. Nature 424:267. doi: 10.1038/424267a
Slabbekoorn, H., and Ripmeester, E. A. P. (2008). Birdsong and anthropogenic noise: implications and applications for conservation. Mol. Ecol. 17, 72–83. doi: 10.1111/j.1365-294X.2007.03487.x
Sockman, K. W. (2009). Annual variation in vocal performance and its relationship with bill morphology in Lincoln’s sparrows, Melospiza lincolnii. Anim. Behav. 77, 663–671. doi: 10.1016/j.anbehav.2008.11.016
Stone, E. (2000). Separating the noise from the noise: a finding in support of the “niche hypothesis,” that birds are influenced by human-induced noise in natural habitats. Anthrozoös 13, 225–231. doi: 10.2752/089279300786999680
Truax, B. (1978). The World Soundscape Project’s Handbook for Acoustic Ecology. Vancouver: ARC Publications.
Venier, L. A., and Pearce, J. L. (2007). Boreal forest landbirds in relation to forest composition, structure, and landscape: implications for forest management. Can. J. For. Res. 37, 1214–1226. doi: 10.1139/X07-025
Venier, L. A., Thompson, I. D., Fleming, R., Malcolm, J., Aubin, I., Trofymow, J. A., et al. (2014). Effects of natural resource development on the terrestrial biodiversity of Canadian boreal forests. Environ. Rev. 22, 457–490. doi: 10.1139/er-2013-0075
Wiley, R. H., and Richards, D. G. (1978). Physical constraints on acoustic communication in the atmosphere: implications for the evolution of animal vocalizations. Behav. Ecol. Sociobiol. 3, 69–94. doi: 10.1007/BF00300047
Wiley, R. H., and Richards, D. G. (1982). “Adaptations for acoustic communication in birds: sound transmission and signal detection,” in Acoustic Communication in Birds, Vol. 1, eds D. E. Kroodsma and E. H. Miller (New York, NY: Academic Press), 131–181.
Keywords: anthropogenic noise, noise tolerance, occupancy, songbird, vegetation structure, Melospiza lincolnii
Citation: Sánchez NV, Sandoval L, Hedley RW, St. Clair CC and Bayne EM (2022) Relative Importance for Lincoln’s Sparrow (Melospiza lincolnii) Occupancy of Vegetation Type versus Noise Caused by Industrial Development. Front. Ecol. Evol. 10:810087. doi: 10.3389/fevo.2022.810087
Received: 06 November 2021; Accepted: 17 February 2022;
Published: 29 March 2022.
Edited by:
Gianni Pavan, University of Pavia, ItalyReviewed by:
Richard Anthony Peters, La Trobe University, AustraliaMelissa Lin Grunst, La Rochelle Université, France
Copyright © 2022 Sánchez, Sandoval, Hedley, St. Clair and Bayne. This is an open-access article distributed under the terms of the Creative Commons Attribution License (CC BY). The use, distribution or reproduction in other forums is permitted, provided the original author(s) and the copyright owner(s) are credited and that the original publication in this journal is cited, in accordance with accepted academic practice. No use, distribution or reproduction is permitted which does not comply with these terms.
*Correspondence: Natalie V. Sánchez, c2FuY2hlenVAdWFsYmVydGEuY2E=