 Jared A. Stabach1,2*
 Lacey F. Hughey1
 Ramiro D. Crego1
 Christen H. Fleming1,3
 J. Grant C. Hopcraft4
 Peter Leimgruber1
 Thomas A. Morrison4
 Joseph O. Ogutu5
 Robin S. Reid2
 Jeffrey S. Worden6
 Randall B. Boone2
- 1Conservation Ecology Center, Smithsonian National Zoo and Conservation Biology Institute, Front Royal, VA, United States
- 2Natural Resource Ecology Laboratory, Department of Ecosystem Science and Sustainability, Colorado State University, Fort Collins, CO, United States
- 3Department of Biology, University of Maryland, College Park, College Park, MD, United States
- 4Institute of Biodiversity, Animal Health, and Comparative Medicine, University of Glasgow, Glasgow, United Kingdom
- 5Institute of Crop Science, Biostatistics Unit, University of Hohenheim, Stuttgart, Germany
- 6World Wide Fund for Nature, Nairobi, Kenya
The ability to move is essential for animals to find mates, escape predation, and meet energy and water demands. This is especially important across grazing systems where vegetation productivity can vary drastically between seasons or years. With grasslands undergoing significant changes due to climate change and anthropogenic development, there is an urgent need to determine the relative impacts of these pressures on the movement capacity of native herbivores. To measure these impacts, we fitted 36 white-bearded wildebeest (Connochaetes taurinus) with GPS collars across three study areas in southern Kenya (Amboseli Basin, Athi-Kaputiei Plains, and Mara) to test the relationship between movement (e.g., directional persistence, speed, home range crossing time) and gradients of vegetation productivity (i.e., NDVI) and anthropogenic disturbance. As expected, wildebeest moved the most (21.0 km day–1; CI: 18.7–23.3) across areas where movement was facilitated by low human footprint and necessitated by low vegetation productivity (Amboseli Basin). However, in areas with moderate vegetation productivity (Athi-Kaputiei Plains), wildebeest moved the least (13.3 km day–1; CI: 11.0–15.5). This deviation from expectations was largely explained by impediments to movement associated with a large human footprint. Notably, the movements of wildebeest in this area were also less directed than the other study populations, suggesting that anthropogenic disturbance (i.e., roads, fences, and the expansion of settlements) impacts the ability of wildebeest to move and access available resources. In areas with high vegetation productivity and moderate human footprint (Mara), we observed intermediate levels of daily movement (14.2 km day–1; CI: 12.3–16.1). Wildebeest across each of the study systems used grassland habitats outside of protected areas extensively, highlighting the importance of unprotected landscapes for conserving mobile species. These results provide unique insights into the interactive effects of climate and anthropogenic development on the movements of a dominant herbivore in East Africa and present a cautionary tale for the development of grazing ecosystems elsewhere.
Introduction
The ability to move and exploit resources at multiple spatio-temporal scales is key to maintaining biologically viable wildlife populations (Bolger et al., 2008; Holdo et al., 2011). Rapid population growth and anthropogenic development, however, threaten species’ survival by impeding access to critical resources, restricting movements to increasingly fragmented habitat patches, and threatening the sustainability of long-distance migrations (Berger, 2004; Wilcove and Wikelski, 2008; Harris et al., 2009; Kauffman et al., 2021). Widespread changes in climate further complicate these pressures, placing new demands on the plasticity of animal movement and necessitating rapid and flexible responses to shifting resources (Davidson et al., 2020).
A recent comparison of movement strategies across multiple ungulate species revealed that broad-scale variation in vegetation productivity effectively determines the movement strategy (i.e., migration, residency, nomadism) exhibited by ungulates across a range of environmental contexts (e.g., plains to tundra; Mueller et al., 2011). Likewise, in a global synthesis of tracking data from 57 mammal species, Tucker et al. (2018) found that mammals residing in areas with high levels of anthropogenic modification exhibited movements that were one-half to one-third the extent of their movements in areas with lower modification. Such contractions in movement are expected to have important implications for the maintenance of key biological processes (e.g., predator-prey interactions, nutrient cycling, disease transmission) and have been directly linked to population declines in a number of species (Boone et al., 2005; Boone, 2007; Blackburn et al., 2011; Herbener et al., 2012; Kauffman et al., 2021).
While these findings provide strong evidence that landscape and climate play central roles in governing movement dynamics and associated survival, there has been limited research into the combined effects of these factors on the movement capacity of wide-ranging species. Without this knowledge, we limit our ability to predict the impact of future changes to ecosystems that support long-distance animal movements, such as grasslands or savannas. Holdo et al. (2011) demonstrated the value of such information by modeling the predicted impacts of proposed road construction on the movement and population dynamics of the world’s largest population of migratory wildebeest. Similarly, Armstrong et al. (2016) used theoretical simulations to demonstrate that developed landscapes prevented multiple species from tracking ephemeral resource fluctuations. Importantly, Boone et al. (2005) found that anthropogenic disturbance had the greatest negative impact on herbivore populations that occur in habitats with medium to high levels of vegetation productivity, because these areas support a greater abundance of species than less productive areas.
Here, we build on these theoretical insights by comparing key characteristics of movement between three populations of white-bearded wildebeest (Connochaetes taurinus) in southern Kenya. Central to maintaining the ecology and economy of the region (Sinclair, 2003; Hopcraft et al., 2014), wildebeest are known to be particularly sensitive to habitat fragmentation from anthropogenic disturbance (e.g., Kahurananga and Silkiluwasha, 1997), a factor which has led to precipitous declines of multiple populations of wildebeest over the past three decades (Ottichilo et al., 2001; Serneels and Lambin, 2001; Reid et al., 2008; Ogutu et al., 2011, 2013, 2014; Said et al., 2016). By relating movement characteristics (e.g., directional persistence, speed, home range crossing time) to vegetation productivity and anthropogenic disturbance, we provide new evidence into the compounding effects of climate and landscape change on an archetypal keystone species of African grasslands.
Specifically, we predicted (P1) that wildebeest in areas with low vegetation productivity (Amboseli Basin) would move more per day, with greater directional persistence, and an increased home range crossing time than wildebeest in areas with intermediate (Athi-Kaputiei Plains) to high (Mara) levels of productivity. This is due to the recognition that herbivore movements must increase as levels of vegetation productivity decrease to maximize forage intake and energy gain (Wilmshurst et al., 1999). In areas with high anthropogenic footprint (Athi-Kaputiei Plains), however, we predicted that the daily movements of wildebeest (P2) would be more restricted, leading to increased levels of tortuosity (decreased directional persistence), and reduced home range crossing times (e.g., Tucker et al., 2018).
Materials and Methods
Study Area
Research was conducted across three study areas located principally in Kajiado and Narok counties in southern Kenya (Figure 1). These areas, referred to in the text as the Amboseli Basin (2°30′S, 37°15′E), Athi-Kaputiei Plains (1°30′S, 36°55′E), and Mara (1°15′S, 35°20′E), represent portions of the wildlife dispersal areas in and around Amboseli National Park, Nairobi National Park, and the Maasai Mara National Reserve, respectively. We use these names as a means of convenience to reference the geographic regions where wildebeest were initially collared, even though some animals we monitored moved extensively beyond the boundaries of these areas throughout the course of our study period. Thus, our description of each site includes additional habitats and portions of ecosystems that are not normally considered part of these systems, especially as it relates to the Mara.
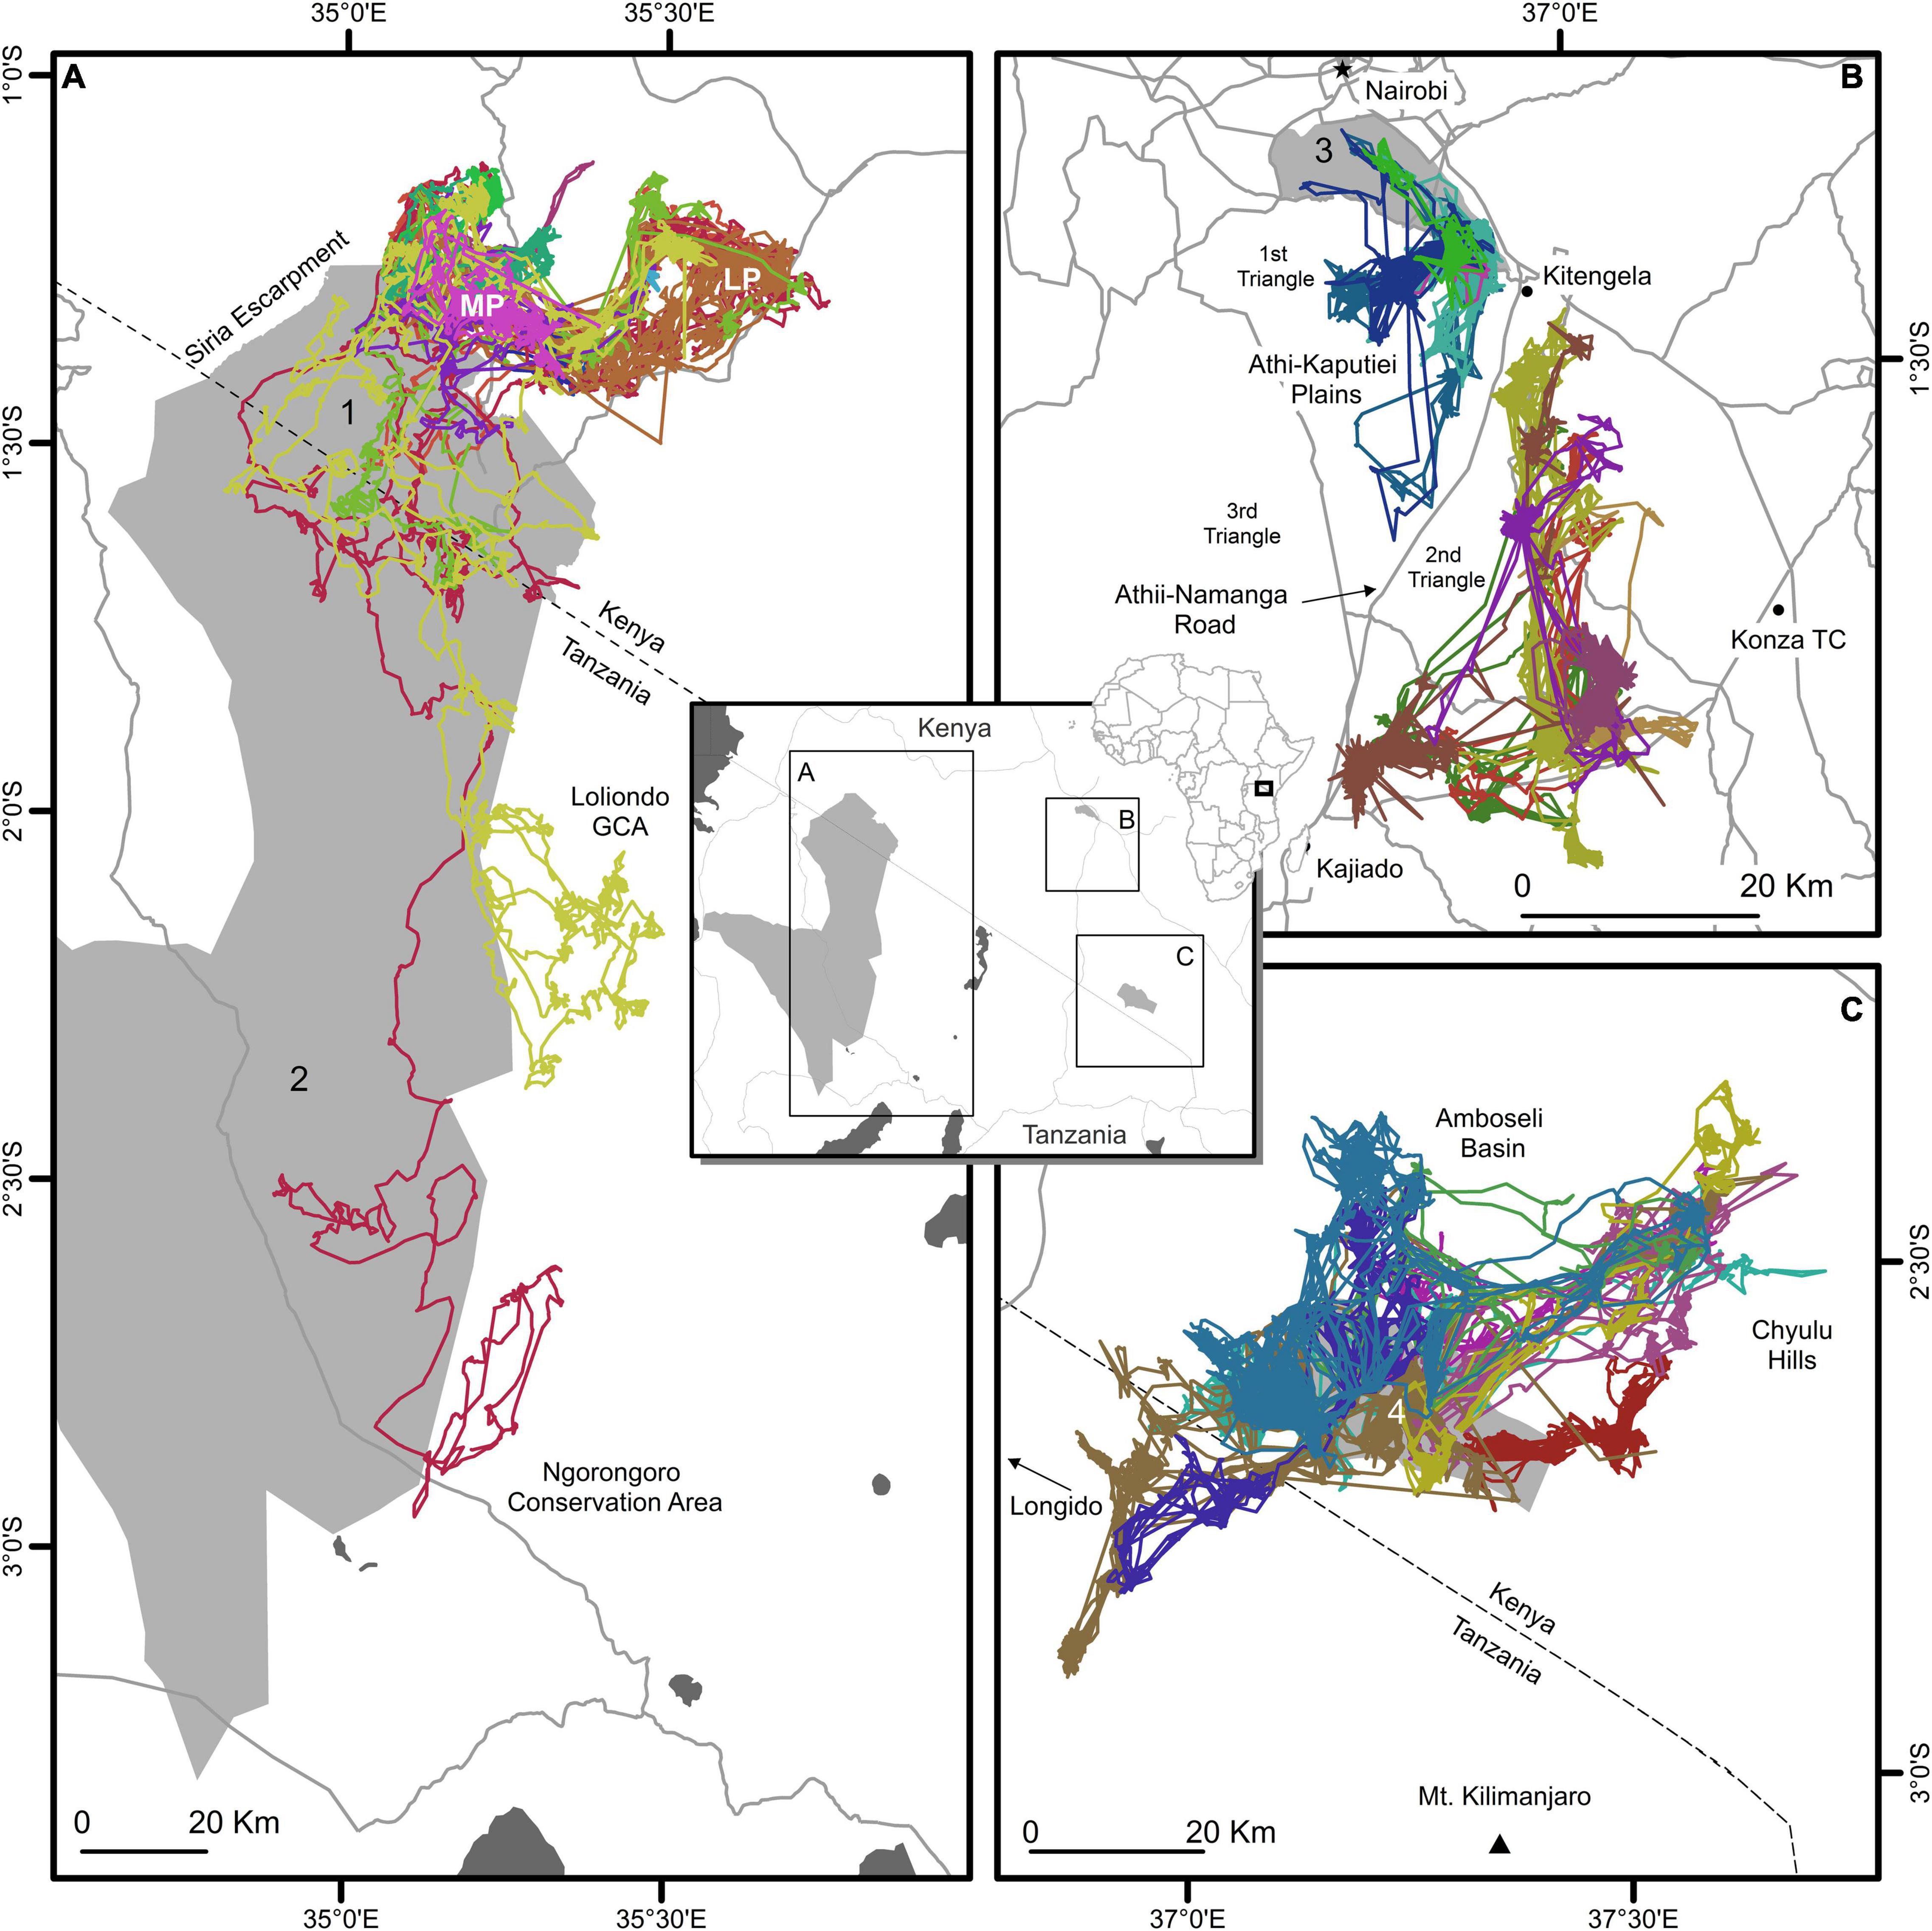
Figure 1. Wildebeest movements across three study areas in Kenya. Individual wildebeest movements (colored lines) tracked from 2010–2013 and displayed across three study areas in Kenya (A, Mara; B, Athi-Kaputiei Plains; C, Amboseli Basin). Protected areas (1, Maasai Mara National Reserve; 2, Serengeti National Park; 3, Nairobi National Park; 4, Amboseli National Park) partially obscured. Loita Plains (LP), Mara Plains (MP), Loliondo Game Controlled Area (GCA), and Ngorongoro Conservation Area labeled in A. Major roads (gray lines) provided for reference.
A strong increase in rainfall along a southeast to northwest gradient is associated with increasing levels of vegetation productivity across our study systems. The Amboseli Basin is the least productive area, with rainfall averaging 568 mm yr–1 [range (1981–2020): 368–935 mm yr–1] (Funk et al., 2015). The Athi-Kaputiei Plains experiences intermediate levels of productivity, with rainfall averaging 688 mm yr–1 [range (1981–2020): 425–1,061 mm yr–1] (Funk et al., 2015). The Mara is the most productive area, with rainfall averaging 841 mm yr–1 [range (1981–2020): 640–1,197 mm yr–1] (Funk et al., 2015). April is generally the wettest month of the year, with the majority of rainfall falling during two rainy seasons (short rains: November-December; long rains: March-June).
Amboseli Basin
The Amboseli Basin (6,600 km2) is a semi-arid tropical environment located in the rain shadow of Mount Kilimanjaro. Wildebeest were observed to move from Longido in Tanzania to the Chyulu Hills in Kenya (Figure 1). Amboseli National Park (ANP, 392 km2) lies at the center of this study area, providing formal protection to a small portion (6%) of the range in which wildlife disperse. The Amboseli Basin is covered primarily by open grassland, with woodlands and swamps fed from mountain run-off prevalent in the southern part of the ecosystem (Western, 1973). During the dry season, most species of wildlife and livestock are limited to areas where permanent water exists (i.e., swamps and boreholes). In wet season periods, species disperse and are more widely distributed across the ecosystem.
Over the past few decades, widespread changes have occurred across the Amboseli Basin, with average annual temperature increasing in all months of the year, but particularly in months with higher maximum temperatures (e.g., January–March) (Altmann et al., 2002). Rainfall has remained consistently low throughout the long dry season (June–October), with seasonal timing becoming more variable (Altmann et al., 2002). Traditional pastoralism is the dominant land-use. Livestock density and grazing pressure is high, a factor leading to habitat degradation and changes to the woodland-grassland mosaic (Altmann et al., 2002). Human population density, however, is low, averaging 14 people km–2 at the time this study was conducted (Bright et al., 2015). Rainfall is the main climatic component limiting wildebeest populations through its controlling influence on vegetation production and quality. The 2009 drought, for example, resulted in an estimated 97% mortality in wildebeest (6,800 of 7,000 individuals) (Western, 2010; Ogutu et al., 2014).
Athi-Kaputiei Plains
The Athi-Kaputiei Plains (3,425 km2) once supported some of the highest densities of wildlife in all of East Africa (Percival, 1928; Simon, 1962). In the last half-century, however, human settlement has expanded rapidly across the region, reducing and fragmenting the remaining habitat and resulting in precipitous wildlife population declines (Ogutu et al., 2013; Said et al., 2016). Reid et al. (2008) estimated a 72% population decline in wildebeest from 1977–2004, with Ogutu et al. (2013) estimating population declines as high as 93% (a decline from 25,765 to 1,700 individuals). Recent population estimates indicate a complete extirpation of wildebeest from large portions of the ecosystem, with the total wildebeest population estimated to be as low as 509 individuals by 2014 (Said et al., 2016).
The area is sometimes referred to as the three “triangles” because of its geometric shape (Figure 1). The first triangle, bordered to the north by Nairobi National Park (117 km2), is located just 10 km from the center of Kenya’s capital city, Nairobi. Human population density is greatest across this area, averaging 45 people km–2 at the time this study was conducted (Bright et al., 2015). Open habitat formerly existed in the 2nd and 3rd triangles (Figure 1), but has shrunken dramatically as the footprint of the city has expanded. Livestock keeping continues to be the dominant livelihood, outnumbering wildlife 4–1 (Reid et al., 2008). The area is extensively fenced (see Reid et al., 2008; Said et al., 2016), resulting in a 22% reduction in area accessible to wildlife and presenting severe obstructions to wildlife movement (Owen-Smith and Ogutu, 2012). A major highway, connecting Kitengela with Kajiado, and demarcating the boundary between the 1st and 2nd triangles, separates the traditional dry and wet season ranges of the species, bisecting a major migratory route. Various other infrastructure projects, including a multi-lane bypass and an elevated standard gauge railway, further restrict and/or reduce the amount of habitat available to wildebeest.
Mara
The Mara is the largest of our three study areas (19,200 km2), extending across portions of the Serengeti-Mara ecosystem in Kenya and Tanzania. This area includes the Loita Plains, the Mara Plains, the Maasai Mara National Reserve (MMNR), the Loliondo Game Controlled Area, the Ngorongoro Conservation Area, and Serengeti National Park (SNP) (Figure 1). A series of conservancies lie adjacent to and north of the MMNR (1,505 km2), comprising an additional 834 km2 of the Mara Plains at the time this study was conducted. Seventeen conservancies now exist across the region, expanding the total area protected to 1,450 km2. Maasai pastoralists are restricted from the MMNR, but granted limited access to the conservancies during the dry season. Livestock incursions into the MMNR, however, are common. The Mara ecosystem is bounded by the Siria Escarpment to the west, the forested Mau Uplands to the north, and the Rift Wall to the east.
Large-scale mechanized agriculture has occurred across the northern and western boundaries of the Mara ecosystem (Homewood et al., 2001; Serneels et al., 2001), resulting in sharp declines in wildebeest (Serneels and Lambin, 2001). From 1977 to 1997, the resident wildebeest population in Kenya declined by 81%, from 119,000 to 22,000 individuals (Ottichilo et al., 2001). Further declines in the resident wildebeest population have been observed over the past decade (2010–2020), coinciding with a period of rapid fence, road, and settlement expansion that occurred after our GPS tracking study concluded. These land-cover changes most significantly impacted the unprotected Loita Plains (Løvschal et al., 2017). Human population density at the time this study was conducted averaged 23 people km–2, with higher densities (34 people km–2) occurring in the Kenyan portion of the ecosystem where research was primarily focused (Bright et al., 2015).
Wildebeest Movement Data
We fitted 36 adult wildebeest across our three study areas (National Council for Science and Technology research permit no. NCST/RR1/12/1/MAS/39/4) with Lotek WildCell® GPS collars. Collars were fitted on animals in May 2010 across the Mara (n = 15) and in October 2010 across the Athi-Kaputiei Plains (n = 12) and the Amboseli Basin (n = 9). All individuals were selected from distinct groups. No animals were collared within national park/reserve boundaries. The mean pairwise distance between initial locations was 13 km in the Amboseli Basin, 27 km in the Athi-Kaputiei Plains, and 22 km in the Mara. All aspects of animal handling were conducted under the direction of a Kenya Wildlife Service field veterinarian and approved by the International Animal Care and Use Committee (IACUC) at Colorado State University, Fort Collins, CO, United States (Approval No. 09-214A-02).
Tracking devices were programmed to collect 16 positions per day, every hour during the day (06:00–18:00) and every 3 h at night (18:00–06:00), over a 3-year study period. We filtered the dataset, removing suspected erroneous data points using the positional accuracy information output with each data point. Only three-dimensional positions with a positional dilution of precision (PDOP) ≤ 10.0 and two-dimensional positions with a PDOP ≤ 5.0 were retained. An additional erroneous data point was removed by using tools implemented in the Continuous-Time Movement Modeling (CTMM) framework [function outlie() in R; Fleming et al., 2020] to identify unrealistic movements based on the speed and distance moved. Data were projected to Albers Equal Area projection, WGS84 datum. Wildebeest sex, approximate age, start/end dates of the collaring period, and fix success are summarized in Supplementary Table 1.
Quantifying Animal Movement
The Continuous-Time Movement Modeling (CTMM) framework (Calabrese et al., 2016) contains functions for identifying and fitting continuous-space, continuous-time stochastic movement models to animal tracking data. The framework includes variogram fitting (Fleming et al., 2014b) and non-Markovian maximum likelihood estimation (Fleming et al., 2014a) to facilitate the identification of important features inherent in the data (e.g., range residency) and optimize model fitting. Importantly, CTMM is robust to irregular sampling intervals, gaps in data collection, and complex autocorrelation structures (Calabrese et al., 2016), features common to most GPS tracking datasets. In addition, since parameter estimates and their confidence intervals derived from CTMM are based on model-based inference, animal trajectories do not need to be truncated to the same temporal interval to make comparison possible—as would be required when comparing metrics derived from straight-line displacements.
We estimated animal movement metrics, including directional persistence, home range crossing timescale, and average distance traveled per day, using CTMM following detailed instructions provided by Calabrese et al. (2016) and Noonan et al. (2019), and vignettes contained within the ctmm R package (Fleming and Calabrese, 2021). Analysis steps included fitting an error model to the data, investigating potential outliers, estimating the variogram, fitting movement models to the variogram structure [e.g., Brownian motion (BM), Ornstein-Uhlenbeck (OU), Ornstein-Uhlenbeck with foraging (OUF)], and performing model selection based on AICc (Akaike, 1974). For each animal, we plotted the estimated semi-variance as a function of time lag to visually inspect the autocorrelation structure (Fleming et al., 2014a) and assess if animals met the range residency assumption, indicated by the estimated semi-variance reaching an asymptote that roughly corresponds to the home-range crossing timescale (Fleming et al., 2014a; Calabrese et al., 2016).
Best fitting CTMM models were either OU or OUF (Supplementary Table 1). OUF models are described by three parameters [i.e., home range crossing timescale (days), velocity autocorrelation timescale (minutes), and variance (km2)], resulting in estimates of home range, home range crossing timescale, directional persistence, and average distance traveled. For all animals fitted with OUF models, we used a simulation-based approach detailed in Noonan et al. (2019) to sample from the distribution of trajectories conditional on the data to estimate the average distance traveled per day during the duration of the tracking period [function speed(); Noonan et al., 2019]. Average distance traveled per day for animal movement data fitted with OU models, described by two parameters [i.e., home range crossing timescale (days) and variance (km2)], could not be estimated.
Landscape Dynamics
To describe spatial-temporal changes in resources across each study area, we extracted MODIS (MOD13Q1) Normalized Difference Vegetation Index (NDVI) raster subsets (Carroll et al., 2004) from the minimum convex polygon (MCP) derived from wildebeest locations across each study area, buffered by 10-km, over a 10-year period (2004–2013). NDVI is known to be a reliable measure of vegetation productivity/greenness (Tucker, 1979; Goward and Prince, 1995) and has been shown to be an important predictor of movement and use for various herbivores (Pettorelli et al., 2011; Ryan et al., 2012; Stabach et al., 2017), including wildebeest (Boone et al., 2006; Hopcraft et al., 2014). Using the semi-monthly NDVI data, we calculated the temporal variability and predictability of each landscape, as described by Mueller et al. (2011). Temporal variability was calculated by summarizing the spatial average of the mean NDVI within semi-monthly periods to provide an estimate of resource phenology within years. Predictability characterizes the variation across each landscape from year to year [i.e., the repeatability (or lack thereof) of the landscape] (Mueller and Fagan, 2008). To estimate predictability, we calculated the inverse of the spatial average of the standard deviations of NDVI at each grid cell across all images within a semi-monthly period (i.e., 1 − unpredictability).
Statistical Analyses
We tested for significant differences between movement statistics by comparing results using hierarchical Bayesian fixed-effect one-way ANOVAs (McCarthy, 2007; Kéry, 2010). The variable home range crossing timescale was log transformed for analysis. We estimated marginal posterior distributions of parameters using Markov chain Monte Carlo (MCMC) methods. We fitted the model using a MCMC algorithm with 10,000 iterations and a 20% burn-in period. We assessed convergence by visually inspecting trace plots to ensure a reasonable exploration of the parameter space and confirming that the potential scale reduction factor was < 1.02 for each variable (Gelman and Rubin, 1992). We calculated the probability (Prob) that the mean of one group was greater than the other by sampling from each of the resulting posterior distributions (Gelman and Hill, 2007).
We fit linear regression models to investigate how average distance traveled per day differed among individuals and to what extent these distances were related to estimates of landscape productivity and human disturbance. To quantify landscape productivity at wildebeest locations, we extracted the NDVI data value at each GPS point observation, matching the spatio-temporal dynamics of the NDVI data (Crego et al., 2021) before aggregating the means for each animal. Human disturbance was similarly quantified by calculating the distance to digitized structures weighted by the estimated human population density (Bright et al., 2009). Adopted from Hopcraft et al. (2014) and referred to as “Anthropogenic Footprint,” this method incorporates small-scale disturbances that would have otherwise been missed due to the coarse resolution of the human population dataset (1 km2). Densely populated areas have the highest values, whereas areas furthest from small or sparsely populated areas have the lowest values (i.e., lowest disturbance). Further information about this data layer can be found in Stabach et al. (2016).
We created four regression models, including NDVI only, anthropogenic footprint only, additive effects (NDVI + anthropogenic footprint), and interactive effects (NDVI * anthropogenic footprint). Competing models were evaluated based on DIC (Spiegelhalter et al., 2002). NDVI and anthropogenic footprint were scaled and centered to enhance coefficient comparability. We evaluated the goodness of fit of the model to the data by calculating the Bayesian p-value—the proportion of times when the replicated “ideal” dataset is greater than the actual dataset (Gelman and Hill, 2007; Kéry, 2010). P-values close to 0.50 indicate a good model fit (i.e., no difference between the actual and replicated datasets). Model variability was displayed by randomly sampling (5,000 times) from the posterior distributions of the alpha and beta parameters. All statistical analyses were conducted in the R environment for statistical computing (R Development Core Team, 2020) using the jagsUI package (McCloskey et al., 2011), version 1.5.2.
Results
Landscape Dynamics
Seasonal patterns of vegetative greenness were similar across each study area, with the Athi-Kaputiei Plains exhibiting the greatest range in landscape seasonality (i.e., difference in NDVI throughout the year) and the Amboseli Basin the least (Figure 2A). Across the Mara, landscape predictability was low (<0.5) for most of the year, especially from December–June (day 321–177). Landscape predictability across the Athi-Kaputiei Plains was similar to the Mara, with the short rains (February–April; day 49–81) being marginally more predictable across this region. Landscape predictability was highest across the Amboseli Basin (except in September–October; day 257–289), with the long dry season (June–November; day 177–305) being the most predictable feature across each study area (Figure 2B).
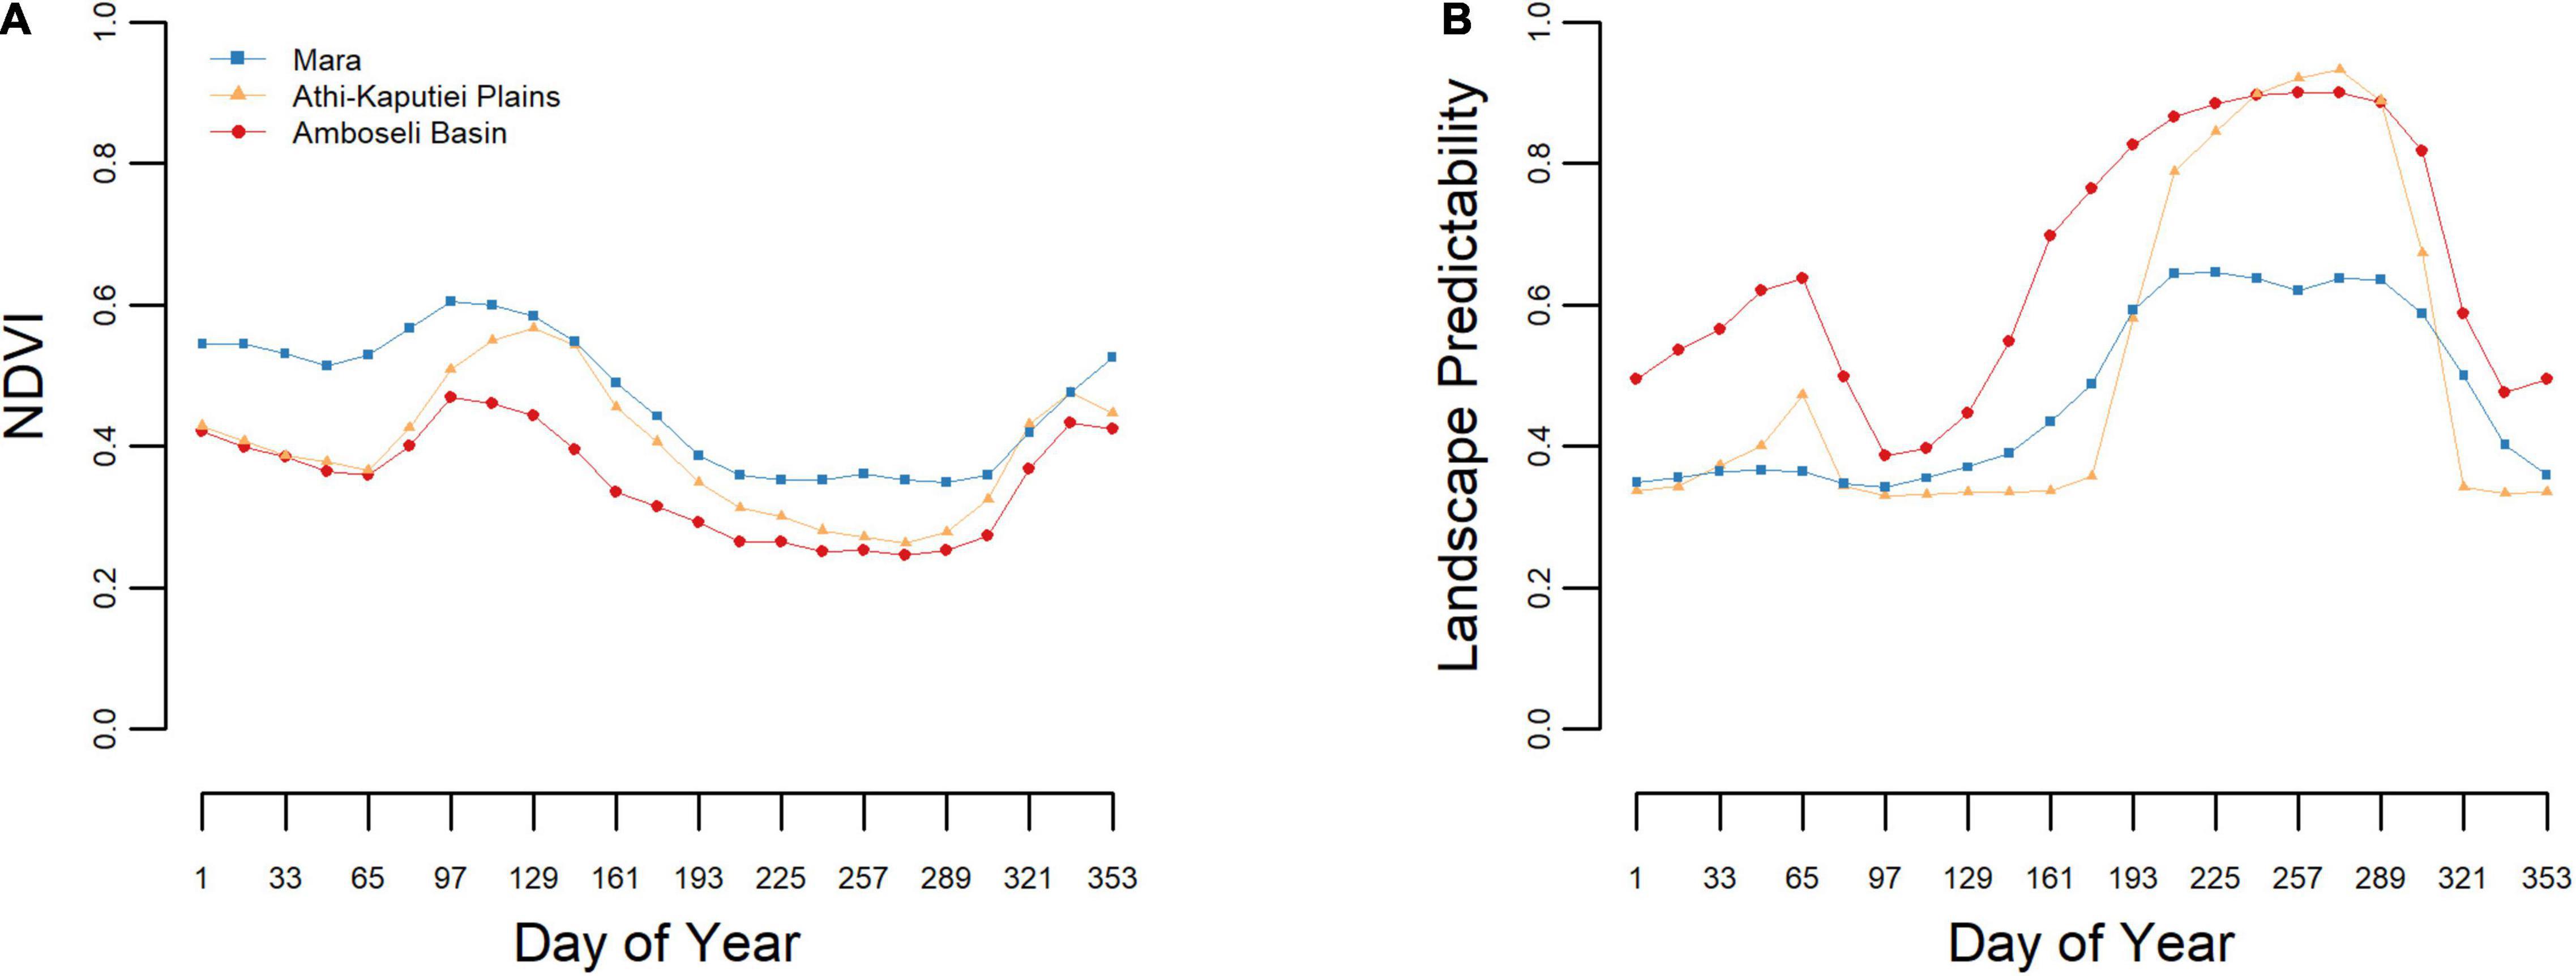
Figure 2. Comparison of landscape dynamics. Landscape phenology based on 10-years (2004–2013) of MODIS NDVI data across three landscapes in southern Kenya with regard to vegetation greenness (A) and landscape predictability (B).
Animal Movements
Wildebeest across the Amboseli Basin moved more per day (21.0 km day–1; CRI: 18.7–23.3) and with greater average directional persistence (36.5 min; CRI: 30.9–42.0) than wildebeest across the Athi-Kaputiei Plains [avg daily movement: 13.3 km day–1 (CRI: 11.0–15.5); avg directional persistence: 18.1 min (CRI: 12.8–23.3)] or Mara [avg daily movement: 14.2 km day–1 (12.3–16.1); avg directional persistence: 23.9 min (CRI: 19.3–28.3)] (Figures 3A,B and Supplementary Table 1). The probability that the movements (daily distance moved and directional persistence) of Amboseli Basin wildebeest were greater than those of wildebeest across the Athi-Kaputiei Plains or Mara were all > 0.99. Wildebeest across the Athi-Kaputiei Plains rarely (Prob = 0.05) moved with more directional persistence than wildebeest across the Mara. Similarly, the probability that wildebeest across the Athi-Kaputiei Plains (range: 8.2–17.7 km day–1) moved further per day than wildebeest across the Mara (range: 8.2–20.6 km day–1) was 0.26, highlighted by the overlap in the posterior distributions of this parameter (Figures 3A,B).
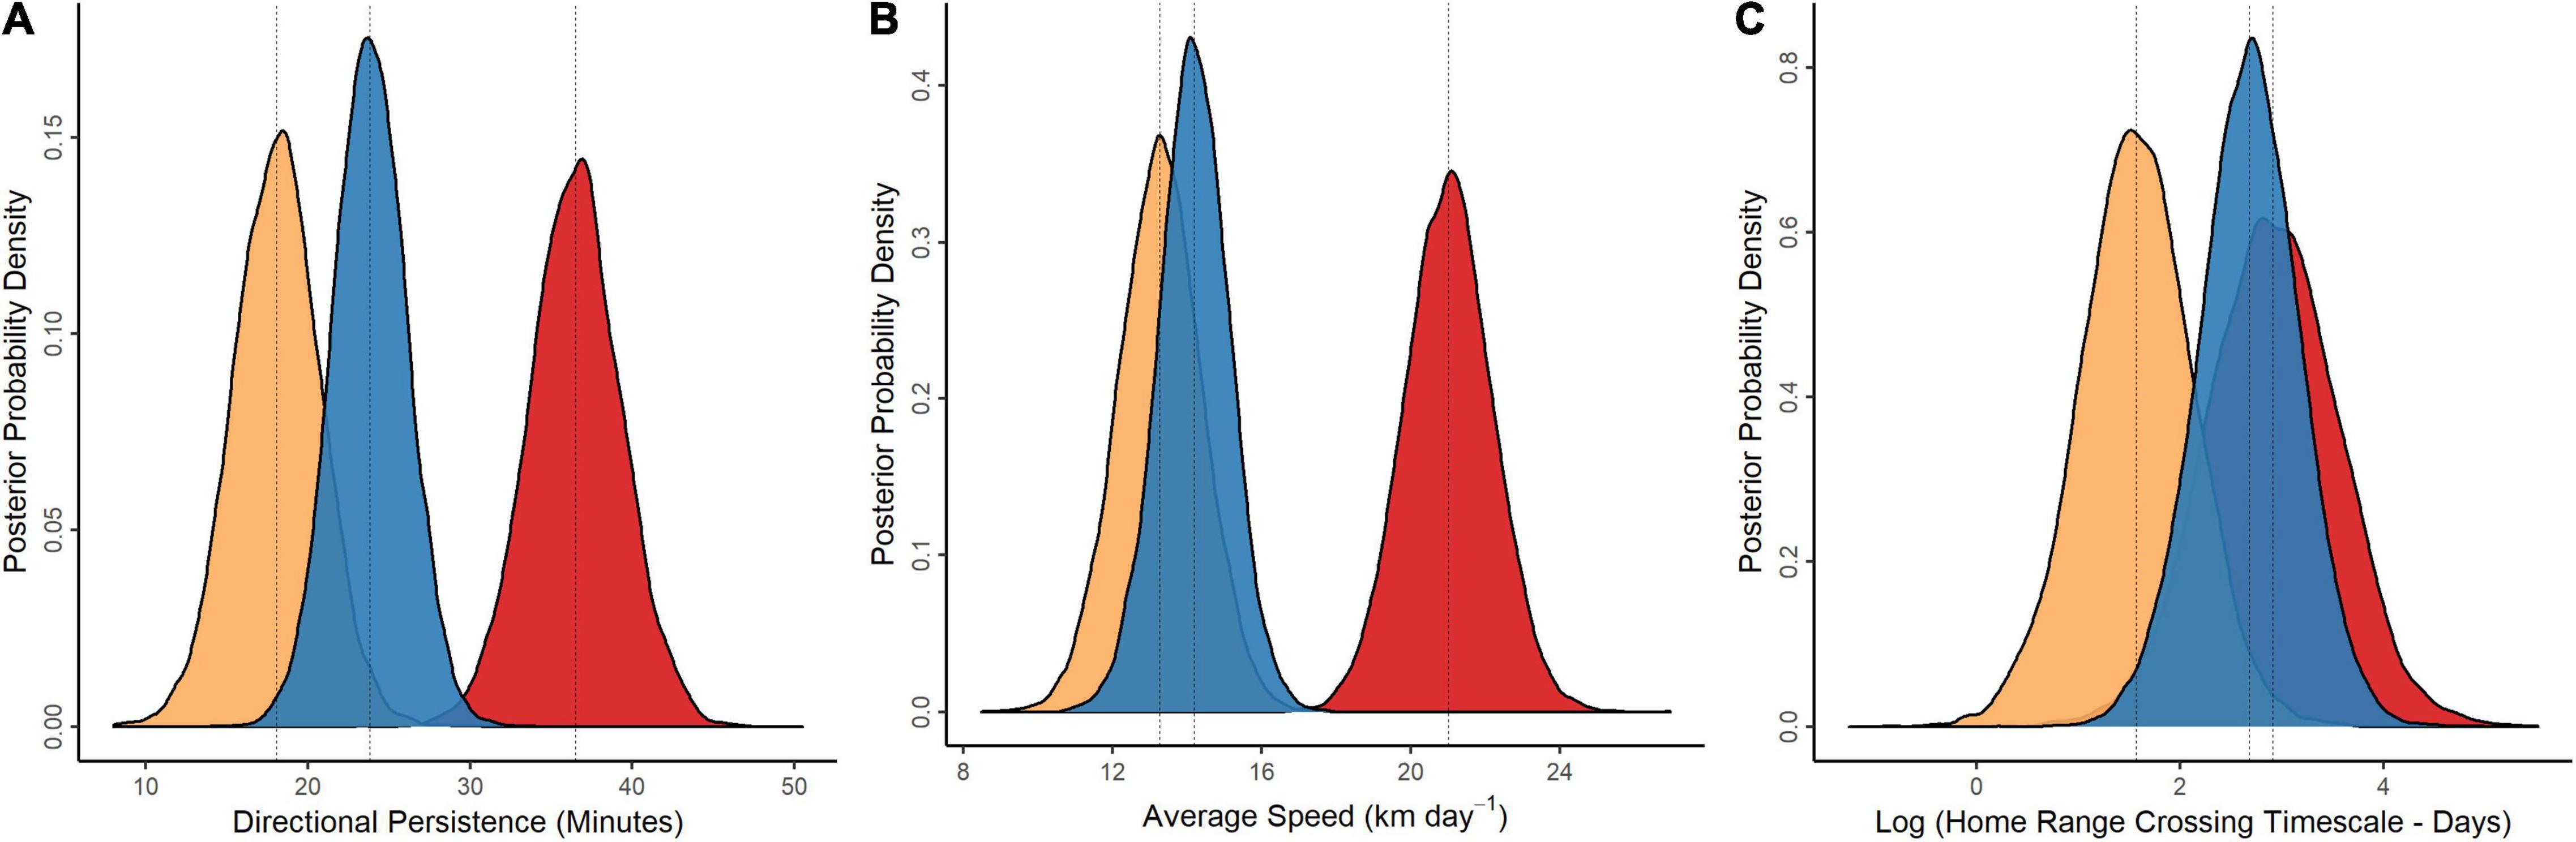
Figure 3. Summary of wildebeest movement. Movement parameters estimated from continuous-space, continuous-time stochastic movement models, including directional persistence (A), average speed (B), and home range crossing timescale (C). Posterior distributions for panels (A–C) shown to highlight parameter overlap. Vertical dashed lines displayed are posterior means. Amboseli Basin = red; Athi-Kaputiei Plains = orange; Mara = blue.
Average home range crossing timescale (log transformed) was similar between wildebeest across the Amboseli Basin (2.9 days; 95% CRI: 1.7–4.2) and Mara (2.7 days; 95% CRI: 1.7–3.7), with posterior distributions that were nearly indistinguishable. The probability that home range crossing timescale was greater for wildebeest across the Amboseli Basin in comparison to the Mara was 0.61. Wildebeest across the Athi-Kaputiei Plains had a shorter average home range crossing timescale (1.6 days; 95% CRI: 0.5–2.7) than either their Amboseli Basin or Mara counterparts. The probability that the home range crossing timescale of Amboseli Basin wildebeest was greater than that of Athi-Kaputiei Plains wildebeest was 0.94. Wildebeest across the Athi-Kaputiei Plains, however, seldom (Prob = 0.07) had a home range crossing timescale greater than that of Mara wildebeest (Figure 3C).
One wildebeest in the Amboseli Basin moved 6,197.8 km over a 728-day study period, the longest distance traversed by any animal we monitored. A second wildebeest, animal 2834, moved south from the Loita Plains to the Ngorongoro Conservation Area in Tanzania (Figure 1), a total net displacement of 205.4 km from its initial collaring location. Another wildebeest across the Mara, animal 2845, moved south through the MMNR and into the Loliondo Game Controlled Area before returning to within 5.9-m of its initial collaring location. Across the Athi-Kaputiei Plains, the maximum net displacement made by a wildebeest from initial collaring locations was 38.2 km, with no animal observed to cross the tarmac road (Athi-Namanga road, Figure 1) bisecting the seasonal habitat range of the species (Supplementary Table 1).
We classified 33.7% of GPS locations (21,075 of 62,392) within the national park boundary across the Amboseli Basin. Only 3.8% of locations (3,795 of 101,265) across the Athi-Kaputiei Plains and 8.0% of locations (9,228 of 116,061) across the Mara were observed within national park/national reserve boundaries (Figure 1). Wildebeest across the Mara, however, used the conservancies located to the north of the Maasai Mara National Reserve extensively, increasing the percentage of locations within protected area boundaries to 73.4% (85,194 of 116,061) when included.
Our best fitting model included additive effects of NDVI and anthropogenic footprint on average daily movement (Supplementary Table 2), with the Bayesian p-value (0.495) indicating an adequate fit of the regression model to the data. Both independent variables had strong negative effects (βNDVI = −2.78; CRI: −3.90 to −1.65 and βAnth Footprint = −2.18; CRI: −3.33 to −1.00) on average daily movement (a = 15.62 km day–1, CRI: 14.48–16.75 km day–1). Wildebeest across the Athi-Kaputiei Plains deviated from the linear prediction in relation to NDVI but fit closely to the prediction in relation to anthropogenic footprint (Figure 4). All wildebeest across the Amboseli Basin and Mara were located in areas with low average anthropogenic footprint (−1.3 to 0.1). Average anthropogenic footprint across the Athi-Kaputiei Plains where wildebeest were located was > 0.4.
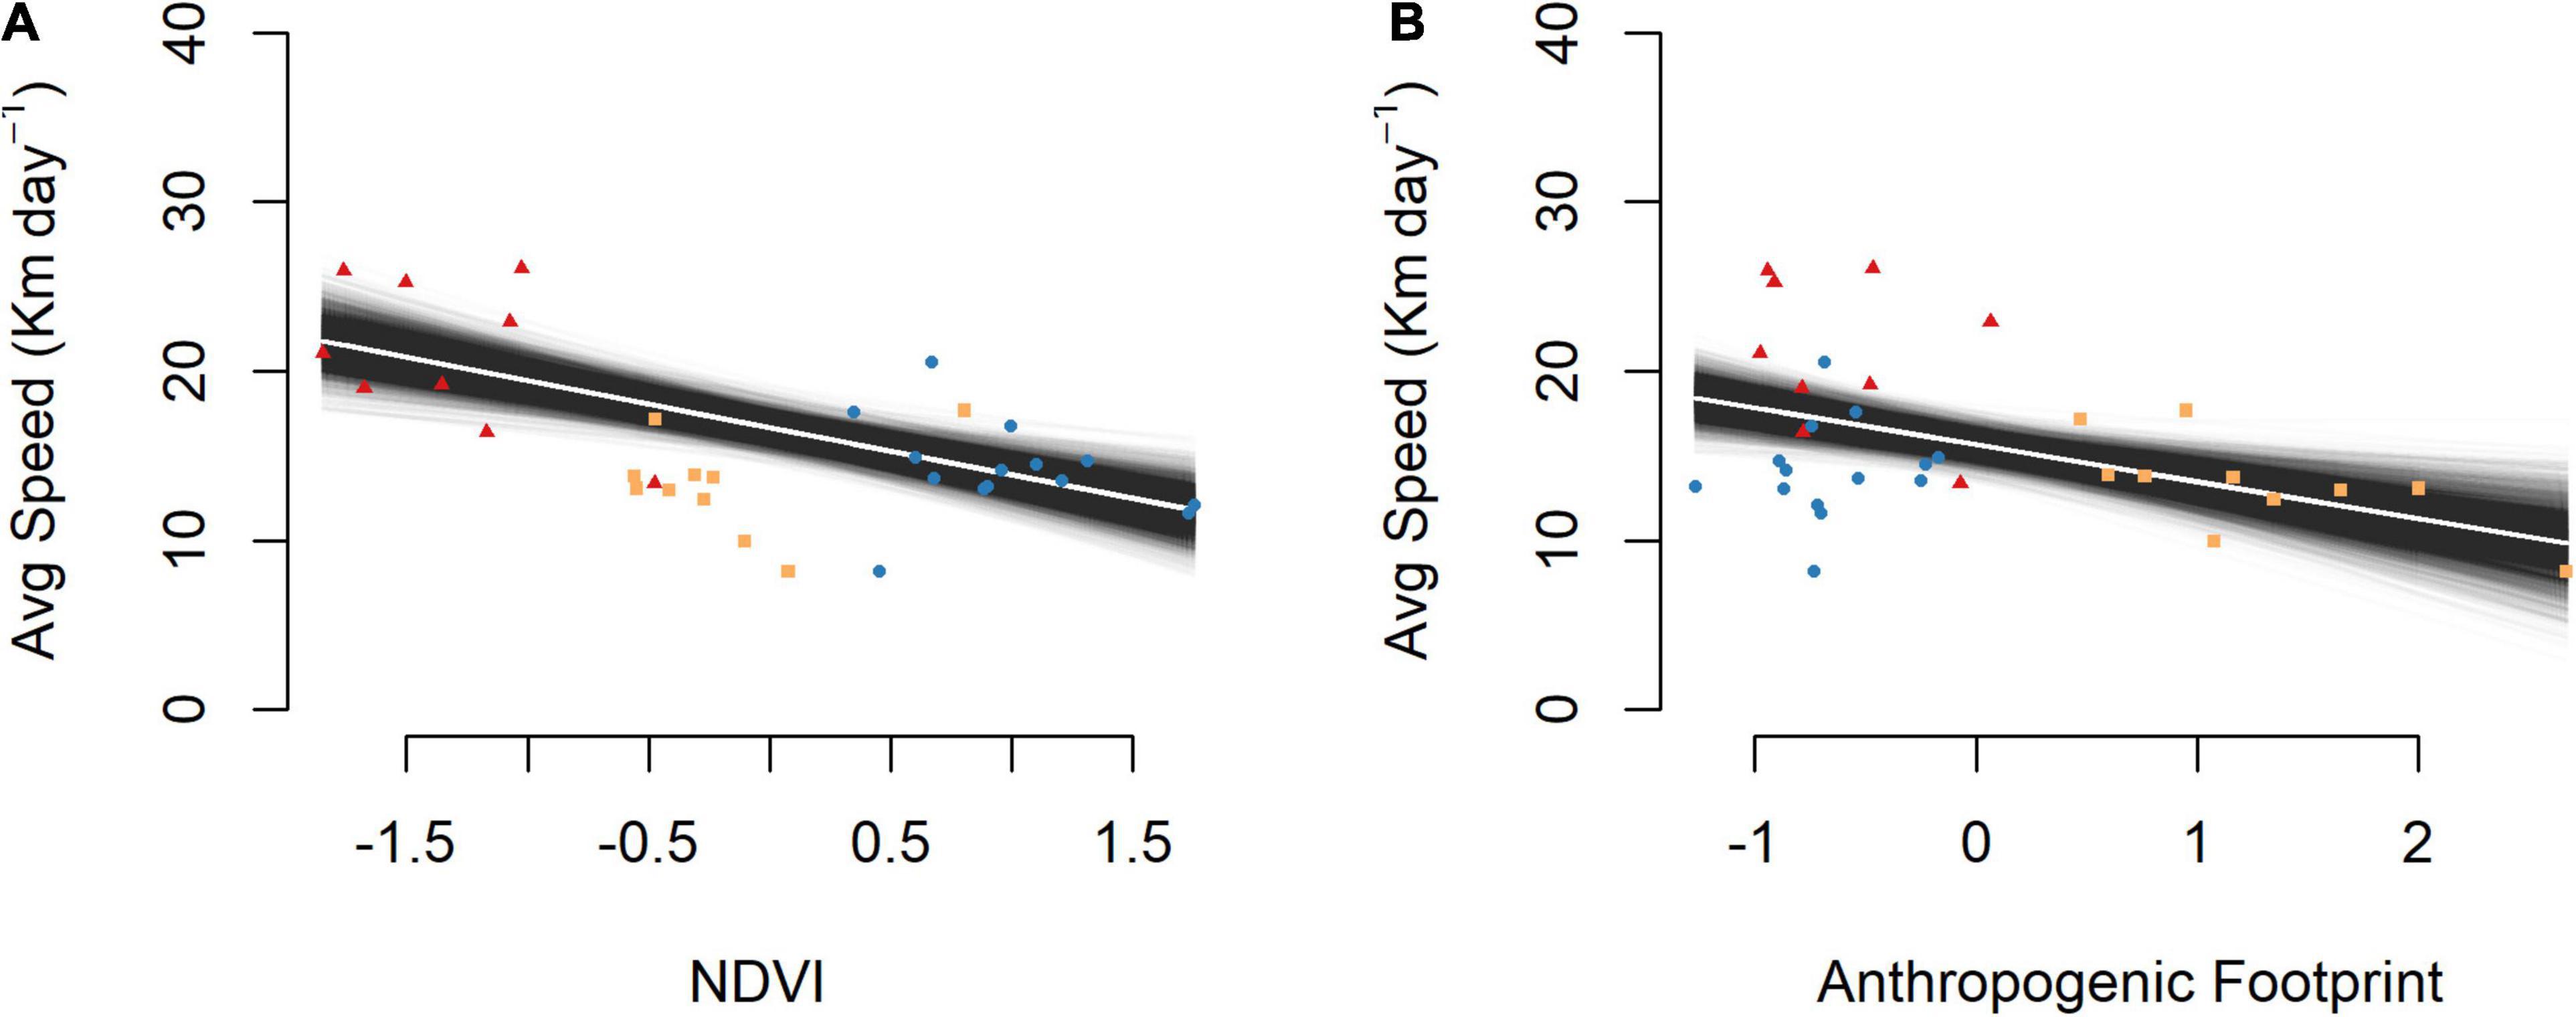
Figure 4. Average daily movement (km day–1) in relation to vegetation greenness (NDVI) and anthropogenic footprint. Daily movements decrease with an increase in (A) NDVI and (B) anthropogenic footprint. Independent variables have been scaled and centered. Model variability displayed by randomly sampling from the posterior distributions of the alpha and beta parameters. Amboseli Basin = red triangles; Athi-Kaputiei Plains = orange squares; Mara = blue circles.
Discussion
By linking the movements of wildebeest across three study areas with contrasting dynamics of landscape productivity and anthropogenic disturbance, we found that high levels of human activity drove unexpected relationships between the movement capacity of herbivores and productivity of the landscape. For example, wildebeest movement was expected to scale positively with vegetation productivity across all sites (P1). However, we found movements to be most restricted at moderate levels of vegetation productivity (Athi-Kaputiei Plains). This loss of movement capacity was observed as a decrease in average daily movement, an increase in tortuosity (decreased directional persistence), and a reduced home range crossing timescale relative to sites with lower levels of anthropogenic disturbance (Amboseli Basin and Mara). Moreover, the strong explanatory power of anthropogenic disturbance relative to other variables tested (i.e., NDVI) suggests that such changes are the consequence of rapid and dramatic landscape conversion (P2), trends which continue across the region (Reid et al., 2008; McCloskey et al., 2011; Said et al., 2016).
Movement is intimately related to an animal’s fitness, facilitating the ability to access better quality resources, encounter potential mates, and move away from an area when conditions deteriorate (Turchin, 1998; Morales et al., 2010; van Moorter et al., 2013). The importance of movement is often amplified in semi-arid and arid lands where resources are limited (Conrad, 1941; Thornton et al., 2006; Boone and Wang, 2007). While we lack data which relates movement declines with fitness consequences, our analysis complements previous work showing that habitat disturbance can have a measurable negative effect on stress hormones (e.g., fecal glucocorticoid metabolites) in wildebeest when vegetative conditions deteriorate (Stabach et al., 2015). Characteristics of long-term or chronic stress include a suppressed immune system, inhibition of reproductive behavior, and decreased growth (Moberg, 2000; Sapolsky, 2000; Keay et al., 2006), factors which could be detrimental to the survival of individuals or populations.
Similar to the trends observed in the Athi-Kaputiei Plains, recent work from the Mara (2017–present) suggests that severe habitat degradation (Li et al., 2020) and fence expansion (Løvschal et al., 2017; Tyrrell et al., 2022) are driving reductions in wildebeest movement and raising concerns about the persistence of this population into the future. Likewise, we expect that movement estimates from the Amboseli Basin may be conservative because this population was in a period of recovery following the devastating drought that occurred in 2009 (Western, 2010; Ogutu et al., 2014). The resulting decline in animal densities should have decreased competition for resources and reduced the distance required to access sufficient forage to meet energy demands (e.g., Merrill et al., 2021). As a result, additional research into the impacts of anthropogenic disturbance would be expected to strengthen the inference observed in this study and further align with previous research conducted on mammal movement responses across a range of terrestrial ecosystems globally (Tucker et al., 2018).
In addition to these implications for population persistence, we found it notable that collared wildebeest were located primarily outside of protected area boundaries throughout the study period. This is particularly interesting given the comparatively low levels of anthropogenic disturbance within protected area boundaries, especially across the Athi-Kaputiei Plains where park boundaries abut one of East Africa’s largest cities. The observed effect could be reflective of differences in vegetation quality, predation pressure, or alternatively, a result of capture-induced bias, since we did not collar any animals within national park/reserve boundaries. Across the Athi-Kaputiei Plains, our results are at least partially biased by the Athi-Namanga road (Figure 1), as wildebeest did not move between the 1st and 2nd triangles during our study period. Wildebeest collared in the 2nd triangle were therefore unable to disperse to the national park. These data provide quantitative support, however, that this historic migration (see Reid et al., 2008) has completely collapsed, with concomitant effects on population abundance (Reid et al., 2008; Ogutu et al., 2013; Said et al., 2016).
Although we focused on two primary drivers of animal movement in this study (e.g., NDVI and anthropogenic footprint), we acknowledge that multiple forces shape the movement dynamics of wildebeest. Further research on water availability and livestock density may benefit from a specific focus. For example, wildebeest cannot survive without water for more than 2–3 days (Talbot and Talbot, 1963) and domestic livestock compete with wild herbivores for grazing resources (Schieltz and Rubenstein, 2016; Kimuyu et al., 2017; Crego et al., 2020; Connolly et al., 2021; Wells et al., 2022). However, data were not available at an appropriate spatio-temporal resolution to be included in this study. Moreover, Boone et al. (2006) demonstrated that NDVI is a better predictor of wildebeest movement than rainfall, suggesting that our models should sufficiently explain the variation in movement strategies we observed. We also found relatively high levels of correlation between anthropogenic footprint and the best available estimates of livestock density (Gilbert et al., 2018) for the Mara (0.57), indicating that this variable would have been removed during the first steps of model evaluation. Notably, we found little to no correlation between these metrics in the Amboseli Basin or Athi-Kaputiei Plains (0.18 and 0.04, respectively), but suspect that this was due to the mis-match between the spatial resolution of the livestock dataset (10-km at equatorial regions; Gilbert et al., 2018) and the spatial extent of each study area (6,600 and 3,425 km2, respectively). More detailed information on livestock abundance could help to disentangle the potential confounding effects of livestock abundance with other aspects of human disturbance, but would require significant improvements in current methods for estimating livestock abundance at (relatively) small spatial scales, like those described here. Exciting new developments using high-resolution (<50 cm) satellite imagery are currently underway to map large mammals (including cattle) that could prove useful in future analyses (e.g., Duporge et al., 2020; Robinson et al., 2021).
The results of this study have important conservation implications across the region that can be applied to other systems, especially dryland systems where the ability of species to move is essential for survival (e.g., gazelle in the Mongolian steppe; Mueller et al., 2008; Dejid et al., 2019). Similarly, results from the Athi-Kaputiei Plains suggest that under scenarios of extreme climate change, the effects of anthropogenic disturbance may be compounded to a point that populations are unable to recover. Beyond the impacts to wildlife, the dramatic changes occurring to grasslands also impact the people that rely on these systems for survival. Pastoralists across the Athi-Kaputiei Plains, for example, have been voicing concerns about shrinking access to resources for decades (Galaty, 1994). Determining and conserving the dynamic extent of the ecosystem, where still possible, is thus imperative to allow for dispersal to support entire life-cycle processes and provide a means of ecosystem resilience (Allen and Singh, 2016), topics that have been highlighted by other authors (e.g., Thirgood et al., 2004; Martin et al., 2007; Bolger et al., 2008; Runge et al., 2014) and that are especially important as the duration, frequency, and intensity of drought are expected to increase (Haile et al., 2020).
Data Availability Statement
The datasets presented in this study can be found in online repositories. The names of the repository/repositories and accession number(s) can be found below: Movebank Data Repository: https://www.datarepository.movebank.org/handle/10255/move.1095.
Ethics Statement
The animal study was reviewed and approved by International Animal Care and Use Committee at Colorado State University (Approval No. 09-214A-02).
Author Contributions
RB, RR, JW, and JO conceived the project and provided project supervision and in-country coordination. RB, RR, and JW led animal captures/data collection. JS developed the analytical approach and conducted the analyses, with support from CF and RC. JS led the writing of the manuscript, with support from RB, RR, LH, RC, and PL. All authors contributed critically to the final draft and gave final approval for publication.
Funding
Funding and support for this research was provided by the National Science Foundation (DEB Grant 0919383), the Ohrstrom Family Foundation, and Smithsonian’s Movement of Life Initiative. JH, TM, and JO received funding from the European Union’s Horizon 2020 Research and Innovation Program under grant agreement no. 641918 through the AfricanBioServices Project. The German Research Foundation (DFG, Grant # 257734638) also supported JO. CF was supported by the National Science Foundation Infrastructure Innovation for Biological Research (IIBR 1915347).
Author Disclaimer
Any opinions, findings, and conclusions or recommendations expressed in this material are those of the authors.
Conflict of Interest
The authors declare that the research was conducted in the absence of any commercial or financial relationships that could be construed as a potential conflict of interest.
Publisher’s Note
All claims expressed in this article are solely those of the authors and do not necessarily represent those of their affiliated organizations, or those of the publisher, the editors and the reviewers. Any product that may be evaluated in this article, or claim that may be made by its manufacturer, is not guaranteed or endorsed by the publisher.
Acknowledgments
We would like to thank the British Ecological Society, Frankfurt Zoological Society, Zurich Zoo, and Paul Tudor Jones for additional support. We would also like to thank G. Florant and G. Wittemyer for initial comments on this manuscript, the staff at the African Conservation Centre, E. Kanga, D. Mijele, and the Kenya Wildlife Service, the managers of the Olare Orok, Mara North, Motorogi, and Naboisho conservancies, and the local communities adjacent to each study area for facilitating research, granting us access to their land, and assisting with collaring activities.
Supplementary Material
The Supplementary Material for this article can be found online at: https://www.frontiersin.org/articles/10.3389/fevo.2022.846171/full#supplementary-material
References
Akaike, H. (1974). A new look at the statistical model identification. IEEE Trans. Automat. Contr. 19, 716–723. doi: 10.1109/TAC.1974.1100705
Allen, A. M., and Singh, N. J. (2016). Linking movement ecology with wildlife management and conservation. Front. Ecol. Evol. 3:155. doi: 10.3389/fevo.2015.00155
Altmann, J., Alberts, S. C., Altmann, S. A., and Roy, S. B. (2002). Dramatic change in local climate patterns in the Amboseli basin, Kenya. Afr. J. Ecol. 40, 248–251. doi: 10.1046/j.1365-2028.2002.00366.x
Armstrong, J. B., Takimoto, G., Schindler, D. E., Hayes, M. M., and Kauffman, M. J. (2016). Resource waves: phenological diversity enhances foraging opportunities for mobile consumers. Ecology 97, 1099–1112. doi: 10.1890/15-0554.1
Berger, J. (2004). The last mile: how to sustain long-distance migration in mammals. Conserv. Biol. 18, 320–331. doi: 10.1111/j.1523-1739.2004.00548.x
Blackburn, H. B., Hobbs, N. T., and Detling, J. K. (2011). Nonlinear responses to food availability shape effects of habitat fragmentation on consumers. Ecology 92, 98–107. doi: 10.1890/10-0637.1
Bolger, D. T., Newmark, W. D., Morrison, T. A., and Doak, D. F. (2008). The need for integrative approaches to understand and conserve migratory ungulates. Ecol. Lett. 11, 63–77. doi: 10.1111/j.1461-0248.2007.01109.x
Boone, R. B. (2007). Effects of fragmentation on cattle in African savannas under variable precipitation. Landsc. Ecol. 22, 1355–1369. doi: 10.1007/s10980-007-9124-4
Boone, R. B., BurnSilver, S. B., Thornton, P. K., Worden, J. S., and Galvin, K. A. (2005). Quantifying declines in livestock due to land subdivision. Rangel. Ecol. Manag. 58, 523–532. doi: 10.1111/1365-2664.13072
Boone, R. B., Thirgood, S. J., and Hopcraft, J. G. C. (2006). Serengeti wildebeest migratory patterns modeled from rainfall and new vegetation growth. Ecology 87, 1987–1994. doi: 10.1890/0012-9658(2006)87[1987:swmpmf]2.0.co;2
Boone, R. B., and Wang, G. (2007). Cattle dynamics in African grazing systems under variable climate. J. Arid Environ. 70, 495–513.
Bright, E. A., Coleman, P. R., King, A. L., Rose, A. N., and Urban, M. L. (2009). LandScan 2008. Available online at: https://landscan.ornl.gov/
Bright, E. A., Rose, A. N., and Urban, M. L. (2015). Landscan - High Resolution Global Population Data Set. Oak Ridge: Oak Ridge National Laboratory.
Calabrese, J. M., Fleming, C. H., and Gurarie, E. (2016). Ctmm : an R package for analyzing animal relocation data as a continuous-time stochastic process. Methods Ecol. Evol. 7, 1124–1132. doi: 10.1111/2041-210X.12559
Carroll, M. L., DiMiceli, C. M., Sohlberg, R. A., and Townshend, J. R. G. (2004). 250m MODIS Normalized Difference Vegetation Index. Maryland: University of Maryland.
Connolly, E., Allan, J., Brehony, P., Aduda, A., Western, G., Russell, S., et al. (2021). Coexistence in an African pastoral landscape: evidence that livestock and wildlife temporally partition water resources. Afr. J. Ecol. 59, 696–711.
Crego, R., Masolele, M., Connette, G., and Stabach, J. (2021). Enhancing animal movement analyses: spatiotemporal matching of animal positions with remotely sensed data using google earth engine and R. Remote Sens. 13:4154. doi: 10.3390/rs13204154
Crego, R. D., Ogutu, J. O., Wells, H. B. M., Ojwang, G. O., Martins, D. J., Leimgruber, P., et al. (2020). Spatiotemporal dynamics of wild herbivore species richness and occupancy across a savannah rangeland: implications for conservation. Biol. Conserv. 242:108436. doi: 10.1016/j.biocon.2020.108436
Davidson, S. C., Bohrer, G., Gurarie, E., LaPoint, S., Mahoney, P. J., Boelman, N. T., et al. (2020). Ecological insights from three decades of animal movement tracking across a changing Arctic. Science 370, 712–715.
Dejid, N., Bracis, C., Olson, K. A., Böhning-Gaese, K., Calabrese, J. M., Chimeddorj, B., et al. (2019). Challenges in the conservation of wide-ranging nomadic species. J. Appl. Ecol. 56, 1916–1926. doi: 10.1111/1365-2664.13380
Duporge, I., Isupova, O., Reece, S., Macdonald, D. W., and Wang, T. (2020). Using very-high-resolution satellite imagery and deep learning to detect and count African elephants in heterogeneous landscapes. Remote Sens. Ecol. Conserv. 7, 369–381. doi: 10.1002/rse2.195
Fleming, C. H., and Calabrese, J. M. (2021). ctmm: Continuous-Time Movement Modeling. R package version 0.6.1. Available online at: https://cran.r-project.org/package=ctmm (accessed February 2022).
Fleming, C. H., Calabrese, J. M., Mueller, T., Olson, K. A., Leimgruber, P., and Fagan, W. F. (2014b). From fine-scale foraging to home ranges: a semivariance approach to identifying movement modes across spatiotemporal scales. Am. Nat. 183, E154–E167. doi: 10.1086/675504
Fleming, C. H., Calabrese, J. M., Mueller, T., Olson, K. A., Leimgruber, P., and Fagan, W. F. (2014a). Non-Markovian maximum likelihood estimation of autocorrelated movement processes. Methods Ecol. Evol. 5, 462–472.
Fleming, C. H., Drescher-Lehman, J., Noonan, M. J., Akre, T. S. B., Brown, D. J., Cochrane, M. M., et al. (2020). A comprehensive framework for handling location error in animal tracking data. bioRxiv [Preprint]. doi: 10.1101/2020.06.12.130195
Funk, C., Peterson, P., Landsfeld, M., Pedreros, D., Verdin, J., Shukla, S., et al. (2015). The climate hazards infrared precipitation with stations - a new environmental record for monitoring extremes. Sci. Data 2:150066.
Galaty, J. G. (1994). Ha(l)ving land in common: the subdivision of Maasai group ranches in Kenya. Nomadic Peoples 34, 109–122.
Gelman, A., and Hill, J. (2007). Data Analysis Using Regression and Multilevel/Hierarchical Models. New York: Cambridge University Press.
Gelman, A., and Rubin, D. (1992). Inference from iterative simulation using multiple sequences. Stat. Sci. 7, 457–511.
Gilbert, M., Nicolas, G., Cinardi, G. Van Boeckel, T. P., Vanwambeke, S., Wint, W. G. R., et al. (2018). Global Cattle Distribution in 2010 (5 minutes of Arc). Harvard Dataverse, V3. doi: 10.7910/DVN/GIVQ75
Goward, S. N., and Prince, S. D. (1995). Transient effects of climate on vegetation dynamics: satellite observations. J. Biogeogr. 22, 549–564. doi: 10.2307/2845953
Haile, G. G., Tang, Q., Hosseini-Moghari, S., Liu, X., Gebremicael, T. G., Leng, G., et al. (2020). Projected impacts of climate change on drought patterns over East Africa. Earth’s Future 8:e2020EF001502. doi: 10.1029/2020EF001502
Harris, G., Thirgood, S., Hopcraft, J., Cromsight, J., and Berger, J. (2009). Global decline in aggregated migrations of large terrestrial mammals. Endanger. Species Res. 7, 55–76. doi: 10.3354/esr00173
Herbener, K. W., Tavener, S. J., and Hobbs, N. T. (2012). The distinct effects of habitat fragmentation on population size. Theor. Ecol. 5, 73–82. doi: 10.1007/s12080-010-0097.6
Holdo, R. M., Fryxell, J. M., Sinclair, A. R. E., Dobson, A., and Holt, R. D. (2011). Predicted impact of barriers to migration on the Serengeti wildebeest population. PLoS One 6:e16370. doi: 10.1371/journal.pone.0016370
Homewood, K., Lambin, E. F., Coast, E., Kariuki, A., Kikula, I., Kivelia, J., et al. (2001). Long-term changes in Serengeti-Mara wildebeest and land cover: pastoralism, population, or policies? Proc. Natl. Acad. Sci. U. S. A. 98, 12544–12549. doi: 10.1073/pnas.221053998
Hopcraft, J., Morales, J., Beyer, H., Borner, M., Mwangomo, E., Sinclair, A., et al. (2014). Competition, predation, and migration: individual choice patterns of Serengeti migrants captured by hierarchical models. Ecol. Monogr. 84, 355–372.
Kahurananga, J., and Silkiluwasha, F. (1997). The migration of zebra and wildebeest between Tarangire National Park and Simanjiro Plains, northern Tanzania, in 1972 and recent trends. Afr. J. Ecol. 35, 179–185.
Kauffman, M. J., Cagnacci, F., Chamaillé-Jammes, S., Hebblewhite, M., Hopcraft, J. G. C., Merkle, J. A., et al. (2021). Mapping out a future for ungulate migrations. Science 372, 566–569. doi: 10.1126/science.abf0998
Keay, J. M., Singh, J., Gaunt, M. C., and Kaur, T. (2006). Fecal glucocorticoids and their metabolites as indicators of stress in various mammalian species: a literature review. J. Zoo Wildl. Med. 37, 234–244. doi: 10.1638/05-050.1
Kéry, M. (2010). Introduction to Winbugs for Ecologists: Bayesian Approach to Regression, Anova, Mixed Models and Related Analyses, First Edition. Burlington: Academic Press. doi: 10.1016/B978-0-12-378605-0.00054-5
Kimuyu, D. M., Veblen, K. E., Riginos, C., Chira, R. M., Githaiga, J. M., and Young, T. P. (2017). Influence of cattle on browsing and grazing wildlife varies with rainfall and presence of megaherbivores. Ecol. Appl. 27, 789–798. doi: 10.1002/eap.1482
Li, W., Buitenwerf, R., Munk, M., Amoke, I., Bøcher, P. K., and Svenning, J.-C. (2020). Accelerating savanna degradation threatens the Maasai Mara socio-ecological system. Glob. Environ. Change 60:102030. doi: 10.1016/j.gloenvcha.2019.102030
Løvschal, M., Bøcher, K., Pilgaard, J., Amoke, I., Odingo, A., Thuo, A., et al. (2017). Fencing bodes a rapid collapse of the unique greater mara ecosystem. Sci. Rep. 7:41450. doi: 10.1038/srep41450
Martin, T. G., Chadès, I., Arcese, P., Marra, P. P., Possingham, H. P., and Norris, D. R. (2007). Optimal conservation of migratory species. PLoS One 2:e751. doi: 10.1371/journal.pone.0000751
McCloskey, J. T., Lilieholm, R. J., Boone, R., Reid, R., Sader, S., Nkedianye, D., et al. (2011). A participatory approach for modeling alternative future land use scenarios around nairobi national park using bayesian belief networks. Ecol. Environ. 144, 43–57. doi: 10.2495/ECO110041
Merrill, E. H., Killeen, J., Pettit, J., Trottier, M., Martin, H., Berg, J., et al. (2021). Density-dependent foraging behaviors on sympatric winter ranges in a partially migratory elk population. Front. Ecol. Evol. 8:269. doi: 10.3389/fevo.2020.00269
Moberg, G. P. (2000). “Biological response to stress: implications for animal welfare,” in The Biology of Animal Stress: Basic Principles and Implications for Animal Welfare, eds G. P. Moberg and J. A. Mench (Wallingford: CABI), doi: 10.1079/9780851993591.0000
Morales, J. M., Moorcroft, P. R., Matthiopoulos, J., Frair, J. L., Kie, J. G., Powell, R. A., et al. (2010). Building the bridge between animal movement and population dynamics. Philos. Trans. R. Soc. Lond. Ser. B Biol. Sci. 365, 2289–2301. doi: 10.1098/rstb.2010.0082
Mueller, T., and Fagan, W. (2008). Search and navigation in dynamic environments–from individual behaviors to population distributions. Oikos 117, 654–664. doi: 10.1111/j.2008.0030-1299.16291.x
Mueller, T., Olson, K. A., Dressler, G., Leimgruber, P., Fuller, T. K., Nicolson, C., et al. (2011). How landscape dynamics link individual- to population-level movement patterns: a multispecies comparison of ungulate relocation data. Glob. Ecol. Biogeogr. 20, 683–694. doi: 10.1111/j.1466-8238.2010.00638.x
Mueller, T., Olson, K. A., Fuller, T. K., Schaller, G. B., Murray, M. G., and Leimgruber, P. (2008). In search of forage: predicting dynamic habitats of Mongolian gazelles using satellite-based estimates of vegetation productivity. J. Appl. Ecol. 45, 649–658. doi: 10.1111/j.1365-2664.2007.01371.x
Noonan, M. J., Fleming, C. H., Akre, T. S., Drescher-lehman, J., Gurarie, E., Kays, R., et al. (2019). The fast and the spurious: scale-free estimation of speed and distance traveled from animal tracking data. Mov. Ecol. 7, 1–15. doi: 10.1186/s40462-019-0177-1
Ogutu, J. O., Owen-Smith, N., Piepho, H.-P., and Said, M. Y. (2011). Continuing wildlife population declines and range contraction in the Mara region of Kenya during 1977-2009. J. Zool. 285, 99–109. doi: 10.1111/j.1469-7998.2011.00818.x
Ogutu, J. O., Owen-Smith, N., Piepho, H.-P., Said, M. Y., Kifugo, S. C., Reid, R. S., et al. (2013). Changing wildlife populations in nairobi national park and adjoining athi-kaputiei plains: collapse of the migratory wildebeest. Open Conserv. Biol. J. 7, 11–26.
Ogutu, J. O., Piepho, H. P., Said, M. Y., and Kifugo, S. C. (2014). Herbivore dynamics and range contraction in Kajiado county Kenya: climate and land use changes, population pressures, governance, policy and human-wildlife conflicts. Open Ecol. J. 7, 9–31. doi: 10.2174/1874213001407010009
Ottichilo, W. K., de Leeuw, J., and Prins, H. H. (2001). Population trends of resident wildebeest [Connochaetes taurinus hecki (Neumann)] and factors influencing them in the Masai Mara ecosystem, Kenya. Biol. Conserv. 97, 271–282.
Owen-Smith, N., and Ogutu, J. O. (2012). “Changing rainfall and obstructed movements: impact on African ungulates,” in Wildlife Conservation in a Changing Climate, eds J. F. Brodie, E. S. Post, and D. F. Doak (Chicago: University of Chicago Press), 153–178. doi: 10.7208/9780226074641-008
Pettorelli, N., Ryan, S., Mueller, T., Bunnefeld, N., Bogumila Jȩdrzejewska, M. L., and Kausrud, K. (2011). The normalized difference vegetation index (NDVI): unforeseen successes in animal ecology. Clim. Res. 46, 15–27.
R Development Core Team (2020). R: A Language and Environment for Statistical Computing. Vienna: R Foundation for Statistical Computing.
Reid, R., Gichohi, H., Said, M., Galvin, K., Behnke, R., Hobbs, N., et al. (2008). Fragmentation in Semi-Arid and Arid Landscapes. Berlin: Springer.
Robinson, C., Ortiz, A., Hughey, L., Stabach, J. A., and Ferres, J. M. L. (2021). Detecting cattle and Elk in the wild from space. arXiv [Preprint]. Available online at: https://arxiv.org/abs/2106.15448 (accessed February 2022).
Runge, C. A., Martin, T. G., Possingham, H. P., Willis, S. G., and Fuller, R. A. (2014). Conserving mobile species. Front. Ecol. Environ. 12, 395–402.
Ryan, S. J., Cross, P. C., Winnie, J., Hay, C., Bowers, J., and Getz, W. M. (2012). The utility of normalized difference vegetation index for predicting African buffalo forage quality. J. Wildl. Manage. 76, 1499–1508. doi: 10.1002/jwmg.407
Said, M. Y., Ogutu, J. O., Kifugo, S. C., Makui, O., Reid, R. S., and de Leeuw, J. (2016). Effects of extreme land fragmentation on wildlife and livestock population abundance and distribution. J. Nat. Conserv. 34, 151–164. doi: 10.1016/j.jnc.2016.10.005
Sapolsky, R. M. (2000). How do glucocorticoids influence stress responses? integrating permissive, suppressive, stimulatory, and preparative actions. Endocr. Rev. 21, 55–89. doi: 10.1210/er.21.1.55
Schieltz, J. M., and Rubenstein, D. I. (2016). Evidence based review : positive versus negative effects of livestock grazing on wildlife. What do we really know? Environ. Res. Lett. 11, 1–18. doi: 10.1088/1748-9326/11/11/113003
Serneels, S., and Lambin, E. (2001). Impact of land-use changes on the wildebeest migration in the northern part of the Serengeti–Mara ecosystem. J. Biogeogr. 28, 391–407.
Serneels, S., Said, M. Y., and Lambin, E. F. (2001). Land cover changes around a major east African wildlife reserve: the Mara Ecosystem (Kenya). Int. J. Remote Sens. 22, 3397–3420. doi: 10.1080/01431160152609236
Sinclair, A. R. (2003). Mammal population regulation, keystone processes and ecosystem dynamics. Philos. Trans. R. Soc. Lond. Ser. B Biol. Sci. 358, 1729–1740. doi: 10.1098/rstb.2003.1359
Spiegelhalter, D. J., Best, N. G., Carlin, B. P., and van der Linde, A. (2002). Bayesian measures of model complexity and fit. J. R. Stat. Soc. Ser. B 64, 583–639.
Stabach, J. A., Boone, R. B., Worden, J. S., and Florant, G. (2015). Habitat disturbance effects on the physiological stress response in resident Kenyan white-bearded wildebeest (Connochaetes taurinus). Biol. Conserv. 182, 177–186. doi: 10.1016/j.biocon.2014.12.003
Stabach, J. A., Rabeil, T., Turmine, V., Wacher, T., Mueller, T., and Leimgruber, P. (2017). On the brink of extinction-Habitat selection of addax and dorcas gazelle across the Tin Toumma desert, Niger. Divers. Distrib. 23, 581–591. doi: 10.1111/ddi.12563
Stabach, J. A., Wittemyer, G., Boone, R. B., Reid, R. S., and Worden, J. S. (2016). Variation in habitat selection by white-bearded wildebeest across different degrees of human disturbance. Ecosphere 7:e01428.
Talbot, L., and Talbot, M. (1963). The Wildebeest in Western Masailand, East Africa. 3–88. Available online at: http://books.google.com/books?hl=en&lr=&id=gEMrAAAAYAAJ&oi=fnd&pg=PA5&dq=The+wildebeest+in+western+masailand,+East+Africa&ots=kk9qHLGilK&sig=mQ74op_ec5IIuoSn3Vyqtq39mwY (accessed September 18, 2013).
Thirgood, S., Mosser, A., Tham, S., Hopcraft, G., Mwangomo, E., Mlengeya, T., et al. (2004). Can parks protect migratory ungulates? The case of the Serengeti wildebeest. Anim. Conserv. 7, 113–120. doi: 10.1017/S1367943004001404
Thornton, P. K., BurnSilver, S. B., Boone, R. B., and Galvin, K. A. (2006). Modelling the impacts of group ranch subdivision on agro-pastoral households in Kajiado, Kenya. Agric. Syst. 87, 331–356.
Tucker, C. J. (1979). Red and photographic infrared linear combinations for monitoring vegetation. Remote Sens. Environ. 8, 127–150.
Tucker, M. A., Böhning-Gaese, K., Fagan, W. F., Fryxell, J. M., Van Moorter, B., Alberts, S. C., et al. (2018). Moving in the Anthropocene: global reductions in terrestrial mammalian movements. Science 359, 466–469. doi: 10.1126/science.aam9712
Turchin, P. (1998). Quantitative Analysis of Movement: Measuring and Modeling Population Redistributions in Plants and Animals. Sunderland: Sinauer Associates.
Tyrrell, P., Amoke, I., Betjes, K., Broekhuis, F., Buitenwerf, R., Carroll, S., et al. (2022). Landscape Dynamics (landDX): an open-access spatial-temporal database for the Kenya-Tanzania borderlands. Sci. Data 9:8. doi: 10.1038/s41597-021-01100-9
van Moorter, B., Bunnefeld, N., Panzacchi, M., Rolandsen, C. M., Solberg, E. J., and Sæther, B. (2013). Understanding scales of movement : animals ride waves and ripples of environmental change. J. Anim. Ecol. 82, 770–780. doi: 10.1111/1365-2656.12045
Wells, H., Crego, R., Ekadeli, J., Namoni, M., Kimuyu, D., Odadi, W., et al. (2022). Less Is more: lowering cattle stocking rates enhances wild herbivore habitat use and cattle foraging efficiency. Front. Ecol. Evol. 10:825689. doi: 10.3389/fevo.2022.825689
Western, D. (1973). The Structure, Dynamics, and Changes of the Amboseli Ecosystem. Ph.D. Thesis. Nairobi: University of Nairobi.
Wilcove, D. S., and Wikelski, M. (2008). Going, going, gone: is animal migration disappearing? PLoS Biol. 6:e188. doi: 10.1371/journal.pbio.0060188
Keywords: wildebeest (Connochaetes taurinus), anthropogenic disturbance, NDVI, ctmm, ecosystem resilience, habitat loss and fragmentation
Citation: Stabach JA, Hughey LF, Crego RD, Fleming CH, Hopcraft JGC, Leimgruber P, Morrison TA, Ogutu JO, Reid RS, Worden JS and Boone RB (2022) Increasing Anthropogenic Disturbance Restricts Wildebeest Movement Across East African Grazing Systems. Front. Ecol. Evol. 10:846171. doi: 10.3389/fevo.2022.846171
Received: 30 December 2021; Accepted: 22 February 2022;
Published: 15 March 2022.
Edited by:
R. Terry Bowyer, University of Alaska Fairbanks, United StatesReviewed by:
Ryan Long, University of Idaho, United StatesJennifer Lesley Silcock, The University of Queensland, Australia
Copyright © 2022 Stabach, Hughey, Crego, Fleming, Hopcraft, Leimgruber, Morrison, Ogutu, Reid, Worden and Boone. This is an open-access article distributed under the terms of the Creative Commons Attribution License (CC BY). The use, distribution or reproduction in other forums is permitted, provided the original author(s) and the copyright owner(s) are credited and that the original publication in this journal is cited, in accordance with accepted academic practice. No use, distribution or reproduction is permitted which does not comply with these terms.
*Correspondence: Jared A. Stabach, c3RhYmFjaGpAc2kuZWR1