 Carmen R. Ebel1*
 Madelon F. Case1
 Chhaya M. Werner1,2Lauren M. Porensky3Kari E. Veblen4,5
 Harry B. M. Wells6,7,8
 Duncan M. Kimuyu4,9Ryan E. Langendorf10,11Truman P. Young4,12Lauren M. Hallett1,13
- 1Department of Biology, Institute of Ecology and Evolution, University of Oregon, Eugene, OR, United States
- 2Department of Botany, University of Wyoming, Laramie, WY, United States
- 3Rangeland Resources and Systems Research Unit, US Department of Agriculture, Agricultural Research Service (ARS), Fort Collins, CO, United States
- 4Mpala Research Centre, Nanyuki, Kenya
- 5Department of Wildland Resources and Ecology Center, Utah State University, Logan, UT, United States
- 6Lolldaiga Hills Research Programme, Nanyuki, Kenya
- 7School of Earth and Environment, Sustainability Research Institute, University of Leeds, Leeds, United Kingdom
- 8Space for Giants, Nanyuki, Kenya
- 9Department of Natural Resources, Karatina University, Karatina, Kenya
- 10Cooperative Institute for Research in Environmental Sciences, University of Colorado Boulder, Boulder, CO, United States
- 11Department of Environmental Studies, University of Colorado Boulder, Boulder, CO, United States
- 12Department of Plant Sciences and Ecology Graduate Group, University of California, Davis, Davis, CA, United States
- 13Environmental Studies Program, University of Oregon, Eugene, OR, United States
Ecological stability in plant communities is shaped by bottom-up processes like environmental resource fluctuations and top-down controls such as herbivory, each of which have demonstrated direct effects but may also act indirectly by altering plant community dynamics. These indirect effects, called biotic stability mechanisms, have been studied across environmental gradients, but few studies have assessed the importance of top-down controls on biotic stability mechanisms in conjunction with bottom-up processes. Here we use a long-term herbivore exclusion experiment in central Kenya to explore the joint effects of drought and herbivory (bottom-up and top-down limitation, respectively) on three biotic stability mechanisms: (1) species asynchrony, in which a decline in one species is compensated for by a rise in another, (2) stable dominant species driving overall stability, and (3) the portfolio effect, in which a community property is distributed among multiple species. We calculated the temporal stability of herbaceous cover and biotic stability mechanisms over a 22-year time series and with a moving window to examine changes through time. Both drought and herbivory additively reduced asynchronous dynamics, leading to lower stability during droughts and under high herbivore pressure. This effect is likely attributed to a reduction in palatable dominant species under higher herbivory, which creates space for subordinate species to fluctuate synchronously in response to rainfall variability. Dominant species population stability promoted community stability, an effect that did not vary with precipitation but depended on herbivory. The portfolio effect was not important for stability in this system. Our results demonstrate that this system is naturally dynamic, and a future of increasing drought may reduce its stability. However, these effects will in turn be amplified or buffered depending on changes in herbivore communities and their direct and indirect impacts on plant community dynamics.
Introduction
Ecological stability–the tendency of aggregate community properties such as primary productivity to be stable through time–is a key metric for understanding ecosystem dynamics and predicting responses to a changing environment. Stability can be shaped by bottom-up processes, for instance when ecosystem properties like primary productivity and total vegetative cover directly track environmental resource fluctuations (Power, 1992; La Pierre et al., 2011; Craine et al., 2012). At the same time, stability can be structured by top-down processes, such as when episodic herbivory temporally shifts plant investment in productivity, or when the effect of herbivory shifts seasonally (Hairston et al., 1960; Van Langevelde et al., 2003; Porensky et al., 2013). However, top-down processes remain understudied relative to environmental variability. Finally, stability can be influenced by dynamics among species within the community. Biotic stabilizing mechanisms occur when species dynamics result in a community that is more stable than predicted by external variability. The presence of such dynamics complicates assessment of the impacts of bottom-up and top-down drivers; beyond their direct impacts on the stability of ecosystem properties, we must also consider indirect effects via influences on species composition and community dynamics.
Multiple biotic stability mechanisms can contribute additively or differentially toward the stability of aggregate community properties (Lehman and Tilman, 2000). These include: (a) asynchronous dynamics, also known as compensatory dynamics, where declines in one species are compensated for by a rise in another, (b) stable dominant species, where aggregate stability depends on a few dominant species with high population stability, or (c) species richness driving portfolio effects, in which the community property is distributed among multiple species in a diverse community (especially when asynchronous). A growing body of work has highlighted that biotic stability mechanisms depend on the environmental context, with most studies exploring this in relation to bottom-up resource dynamics (Grman et al., 2010; Hallett et al., 2014; Xu et al., 2015; Hautier et al., 2020). Biotic stability mechanisms can shift along environmental gradients (Hallett et al., 2014), and resource variability can also cause shifts in mechanisms over time in the same system. For example, drought can both reduce biomass (Craine et al., 2012; Aroca, 2013; Grant et al., 2014; Alon and Sternberg, 2019) and increase variability if production tracks rainfall fluctuations (La Pierre et al., 2011). Both a decline in the mean and increase in the (relative) variance can decrease the stability of primary productivity and alter the strength of underlying biotic mechanisms (Muraina et al., 2021).
Top-down effects on community stability are also likely mediated by biotic stability mechanisms, but few studies have delineated these mechanistic relationships (Qin et al., 2019; Fu et al., 2020; Liang et al., 2021; Campana et al., 2022). It is well-known, however, that top-down pressure can directly alter both community stability and structure (Sankaran et al., 2004; Beck et al., 2015; Riginos et al., 2018; Ganjurjav et al., 2019). Changes in top-down effects, such as herbivore loss or a reduction of historic herbivory levels, can cause slow, directional compositional change (Porensky et al., 2016, 2017; Riginos et al., 2018), potentially shifting the importance of different biotic mechanisms. For instance, herbivores may reduce asynchronous dynamics by opening space that allows other species to increase synchronously (Porensky et al., 2013), or by limiting temporary pulses of dominant species (Mortensen et al., 2018) that could have produced asynchronous dynamics. Additionally, herbivores may preferentially consume abundant species, thereby freeing resources and space for new species (Hillebrand et al., 2007; Porensky et al., 2013; Borer et al., 2014; Koerner et al., 2018; Mortensen et al., 2018); these effects would reduce dominant species population stability while simultaneously strengthening diversity-associated portfolio effects. Herbivore abundance and the functional composition of herbivore communities also likely influence biotic stability mechanisms, as variation in herbivore pressure and identity each determine the extent of herbivore impacts on plant community composition (Augustine and McNaughton, 1998; Fynn and O'Connor, 2000; Veblen et al., 2016; Riginos et al., 2018).
Most plant communities are simultaneously subject to both bottom-up and top-down control, and we must consider how ecological stability and biotic stability mechanisms respond to such drivers in tandem. While drought and herbivory may both limit plant production and enhance the variability of production through time (Gill, 2007; Craine et al., 2012; Aroca, 2013; Grant et al., 2014; Muthoni et al., 2014), they do so in different ways, and thus their effects on biotic stability mechanisms may sometimes be aligned and sometimes different. Drought occurs episodically in semi-arid grasslands and savannas and affects all species simultaneously, while herbivory continually operates, but may have greater effects on certain plant species than others due to selective herbivory and the diets of different herbivore guilds (Augustine and McNaughton, 1998). We expect both types of disturbance to increase synchrony: fluctuations in year- to year rainfall can drive synchronous dynamics (Tredennick et al., 2017), while herbivory may enhance synchrony by freeing space or resources for less abundant species to increase simultaneously (Porensky et al., 2013). We also expect that drought and herbivory will both negatively affect the population stability of dominant species, as competitive dominant species can be especially drought-sensitive (Kardol et al., 2010), and as herbivores preferentially consume all of the dominant species in this system (Odadi et al., 2013). While we expect drought and herbivory will produce similar effects on synchrony and population stability, we expect that their effects on species diversity and the portfolio effect will be opposing. Specifically, selective herbivory of the dominant species may provide opportunities for subordinate species to thrive and thus increase richness (Porensky et al., 2013; Koerner et al., 2018; Bråthen et al., 2021). On the other hand, we expect the reduction in water availability with drought will reduce species richness (Adler and Levine, 2007; Harrison et al., 2018). As a result, the combination of drivers may jointly sum to produce a greater effect on stability than either alone when they have similar effects on a biotic mechanism, or they may buffer impacts of the other if their effects on a particular mechanism differ.
Here, to investigate how drought and herbivory affect stability and its underlying mechanisms, we leverage the Kenya Long-Term Exclosure Experiment (KLEE), which has measured plant responses to six levels of herbivory from experimental combinations of domestic and wild large mammalian herbivores across 22 years, including multiple drought events. Because drought is a temporal phenomenon, we calculated stability and biotic mechanisms over a moving window and assessed stability at different temporal scales. We first hypothesized that (H1) drought and herbivory would both reduce the stability of herbaceous cover (Figure 1). Second, we hypothesized that (H2) the importance of different biotic stability mechanisms would depend on drought and herbivore pressure (Figure 1). Specifically, we expected that, (2a) Asynchronous dynamics would decrease with drought and herbivore pressure, (2b) drought and herbivory would reduce the population stability of the palatable, dominant species, and (2c) species richness and the portfolio effect would decrease with drought but increase with the intensity of herbivory. Finally, we hypothesized that (H3) the effects of drought and herbivory on stability would be mediated by these biotic mechanisms (Figure 1). Consistent with the broader literature on biotic stability mechanisms, we hypothesized that (3a) stability would increase with increasing asynchronous dynamics (Valencia et al., 2020), (3b) stability would increase with dominant species population stability (Sasaki and Lauenroth, 2011; Yang et al., 2017), and (3c) stability would increase with species richness and the portfolio effect (Thibaut and Connolly, 2013).
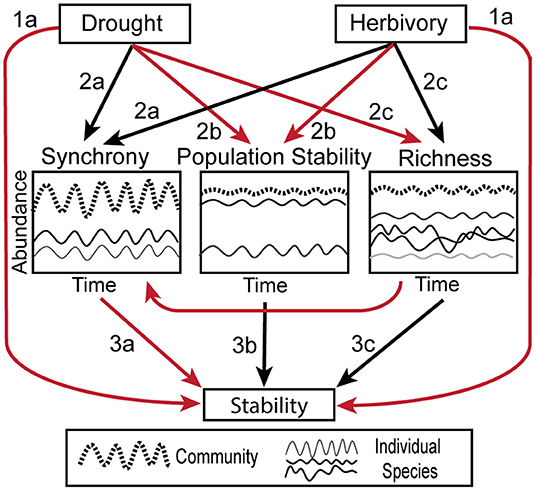
Figure 1. Conceptual figure illustrating the hypothesized relationships between herbivory, drought, biotic stability mechanisms and temporal stability. Black arrows indicate positive relationships, while red arrows indicate negative. Compare to Figure 6. The biotic mechanisms are illustrated as follows: Synchrony—two individual species' abundances (thin solid lines) fluctuate in unison, causing the full community (thick dashed line) to be more variable. Population Stability–one of the two individual species is dominant compared to the other (thin solid lines) and the population stability of the dominant species heavily influences the stability of the overall community (thick dashed line). Richness—when a community is composed of many species (thin solid lines), they average out to make the full community (thick dashed line) more stable than the individual components.
Materials and Methods
Site and Experiment Description
We analyzed the temporal stability of herbaceous cover in the Kenya Long-term Exclosure Experiment (KLEE), located on the Mpala Ranch and Conservancy (0°17' N, 36°52' E; 1,800 m asl) in Laikipia, Kenya. During our study period (1999–2020), rainfall at the site averaged 605 ± 39 mm/year (mean ± SE; range 351–1,009 mm/year). The study site is a semi-arid savanna ecosystem underlain with nutrient-rich vertisols (black cotton soils) with >50% clay content and >30% sand content (Young et al., 1997) and dominated by the tree Acacia drepanolobium (syn. Vachellia drepanolobium) and five grass species: Pennisetum mezianum Leeke, P. stramineum Peter, Themeda triandra Forssk., Lintonia nutans Stapf., and Brachiaria lachnantha (Hochst.) Stapf. (Porensky et al., 2013). Mpala supports a diverse variety of native herbivores and is managed for both livestock production and wildlife conservation (Young et al., 1997).
The KLEE plots were established in 1995 and use semi-permeable barriers to create six replicated herbivore exclosure treatments arranged in three blocks (North, Central, and South), each with six 200 × 200 m plots, for a total of 18 plots with 3 treatment replicates. Treatments are composed of combinations of three herbivore groups: wild mesoherbivores (15–1,000 kg, e.g., zebras, gazelles), wild megaherbivores (giraffes and elephants), and cattle. Treatment combinations and abbreviations are as follows: O = all large herbivores (>15 kg) excluded, W = wild mesoherbivores present, C = cattle present, WC = cattle and wild mesoherbivores present, MW = megaherbivores and wild mesoherbivores present, MWC = all herbivores present. Cattle are grazed in C, WC, and MWC plots in groups of 100–120 for 2 h on each of two to three consecutive days, typically three to four times per year. At the moderate cattle stocking rates applied to our experimental plots, plant community composition corresponds more to herbivory intensity than herbivore identity (Veblen et al., 2016; Charles et al., 2017; Riginos et al., 2018), although this is not the case at high cattle stocking rates (Wells et al., 2021). Across treatments, herbivore pressure increases from lowest to highest in the order of O, W, MW, C, WC, MWC, based on estimates of herbivore densities and body mass per unit area (from Veblen et al., 2016): all wild mesoherbivores = 730 kg/km2, all megaherbivores = 880 kg/km2, and cattle = 4,740 kg/km2 (Georgiadis et al., 2007; Augustine, 2010; Veblen et al., 2016). While the cattle stocking rate is moderate relative to pastoral areas, which are increasingly devoid of wildlife, it is high relative to wildlife densities, which is common. See Young et al. (1997) and Veblen et al. (2016) for more site and experimental details.
Sampling
Aerial herbaceous vegetation cover data was collected annually in June following the March–May primary rainy season in the central hectare of each of the 18 KLEE plots. Each central hectare is divided into a 10 × 10 grid of 100 sampling stations spaced 10 m apart, and at sampling stations aerial plant cover and composition were assessed by counting the number of pins hit by each species over a 10-point pin frame, with vertical pins separated by 5 cm. Only the first hit per pin was recorded for each species (i.e., a maximum of 10 hits per pin frame per species) to assess aerial cover. All 100 grid points were sampled from 1999 to 2005. From 2006 to 2020, every fifth grid point was sampled for the five dominant grasses and alternate grid points (i.e., 50) were sampled for less common species.
Data Analysis
All analyses were carried out in R version 4.1.2 (R Core Team, 2021). We used herbaceous cover data from 1999 to 2020 in our analyses. For years 1999 and 2003 where data from surveys following the March-May primary rainy season were missing, we used data from September 1999 and February 2003 surveys as the species composition remained similar between 1999–2000 and 2002–2004 (Riginos et al., 2018). We accounted for subsampling of dominant species, by expressing all values as the number of first hits per 500 pins (10 pins x 50 sampling locations). The raw first hits for the dominant species were multiplied by 2.5 (50/20 sampling locations) for post-2006 data, while first hits of all other species were left as row values. Pre-2006 data were subsampled to account for the change in sampling effort. We removed rare species (<5% cover) and bare ground pin hits (i.e., when no plants were hit by a pin) (see Veblen et al., 2016; Riginos et al., 2018 for more details). Total cover was calculated as the sum of all individual pin hits in a plot, excluding bare ground and rare species, and could sum to >100% cover.
Calculating Stability and Biotic Mechanisms Over the Full Timeseries
We used herbaceous cover data to calculate the temporal stability of the aggregate community (Sc) as (the inverse of the coefficient of variation), where μ is the temporal mean of total cover, divided by the standard deviation, σ (codyn package; Hallett et al., 2016). To characterize the three biotic stability mechanisms, we used the following metrics: (1) the variance ratio as a measure of asynchronous dynamics, (2) the mean population stability of five dominant species as a measure of dominant species population stability, and (3) species richness as a measure of the portfolio effect.
Asynchronous dynamics: We used the classic variance ratio (VR) to measure asynchronous dynamics, which compares the variance of the aggregate community (C) to the variance expected with independent species population fluctuations (Pi) (Peterson, 1975; Schluter, 1984).
where
A variance ratio >1 indicates synchronous dynamics, and < 1 indicates asynchronous (or compensatory) dynamics (Schluter, 1984). We calculated the variance ratio for all species in the community and additionally for the five most abundant species, hereafter the dominant species. Dominant species (B. lachnantha, P. stramineum, L. nutans, T. triandra, and P. mezianum) were identified from Porensky et al. (2013) as the species composing 85% of herbaceous cover. To investigate the effects of timescale on asynchrony, we used the timescale specific variance ratio which decomposes the classic variance ratio into timescales of distinct contributions (Zhao et al., 2020).
Dominant species population stability: We calculated population temporal stability (Sp) as , where μ is the temporal mean of a species' cover divided by the standard deviation, σ, for each of the five dominant species individually. We then used the average of all five dominant species' population stability values in analyses.
Portfolio Effect: We calculated species richness as the number of unique species present at all sample points in the 1-hectare sampling area. To verify that species richness enhanced the portfolio effect in this system, we used Taylor's power law, σ2 = cμz, where σ2 is the variance in species abundance, μ is the mean species abundance, and c and z are constants (Taylor, 1961). The portfolio effect is enhanced by species richness when the variances in species abundances increase more steeply than their mean abundances, or when z > 1 (Doak et al., 1998; Tilman, 1999). At our site, z = 1.95, so we used species richness as a measure of the portfolio effect in analyses. The fit was slightly sublinear for this model (Supplementary Figure S1), suggesting that dominant species are more stable than expected from a classic Taylor's power law and underscoring the potential importance of dominant stability for overall stability.
Moving Window Calculations
While we expected that aggregating across the full time series would provide the most complete picture for comparisons among herbivore treatments, analyzing the influence of drought required a time-varying approach and careful attention to the choice of time scale. To explore whether stability and the stabilizing effect of different biotic mechanisms varied over time in relation to drought events, we calculated stability, biotic mechanisms, and a drought score over a moving window. Moving window analyses entail taking a subset (window) of the data of a particular number of years and calculating a given metric over this window. The starting point of the window is then shifted one time point until the whole data set has been covered. To assess sensitivity to the choice of time scale, we repeated our analyses with different sized windows (ranging from 5 to 21 years) to assess variation in stability and biotic mechanisms over the temporal scale of calculation (Supplementary Figure S2). We compared the relationship between stability and biotic mechanisms at 5-, 10-, and 15-year window sizes because these correspond to approximately a quarter, half, and three-quarters of our time series, similar to the approach in Bueno de Mesquita et al. (2021). The window sizes included enough years in the window to calculate all metrics, had enough windows to examine trends over the 22-year time series, and allowed us to visualize shorter term fluctuations in stability and mechanisms vs. longer term trends. The responses of stability and its underlying mechanisms to herbivore treatments were consistent across timescales, indicating that the patterns we see are robust to timescale (Supplementary Figure S2). Further, relationships between stability and synchrony, population stability, and richness were similar over the different timescales (Supplementary Figure S3). Thus, we chose to retain only the 10-year window size for further analyses as this balanced capturing variability through time with reducing the noise from the shorter time windows. We also include results from the full time series for comparisons of herbivore treatments alone, but any analyses involving drought (examining the effects of drought alone, or in combination with herbivore treatments in a multiple regression or structural equation modeling approach) use 10-year moving-window metrics because drought effects had to be examined in a time-varying way.
Calculating Drought and the Drought Score
We calculated rainfall on an annual basis using the total rainfall over 12 months starting in July of the previous year through June of the sampling year (e.g., July 2005–June 2006 for the sampling that took place in June 2006). The timeframe was adjusted for years 1999 and 2003 to cover the 12 months before each respective (non-June) sampling period. The total rainfall varied from 211 to 1,082 mm in these defined periods and drought was classified as a rainfall value in the first quartile (≤ 494 mm rain). We identified droughts as those preceding the 2000 (350 mm), 2006 (373 mm), 2008 (458 mm), 2009 (484 mm), 2014 (490 mm), and 2017 (211 mm) sampling periods (Figure 2A). These drought years align with droughts identified by season in Riginos et al. (2018) and match periods where there was compositional change in the plant community (Riginos et al., 2018).
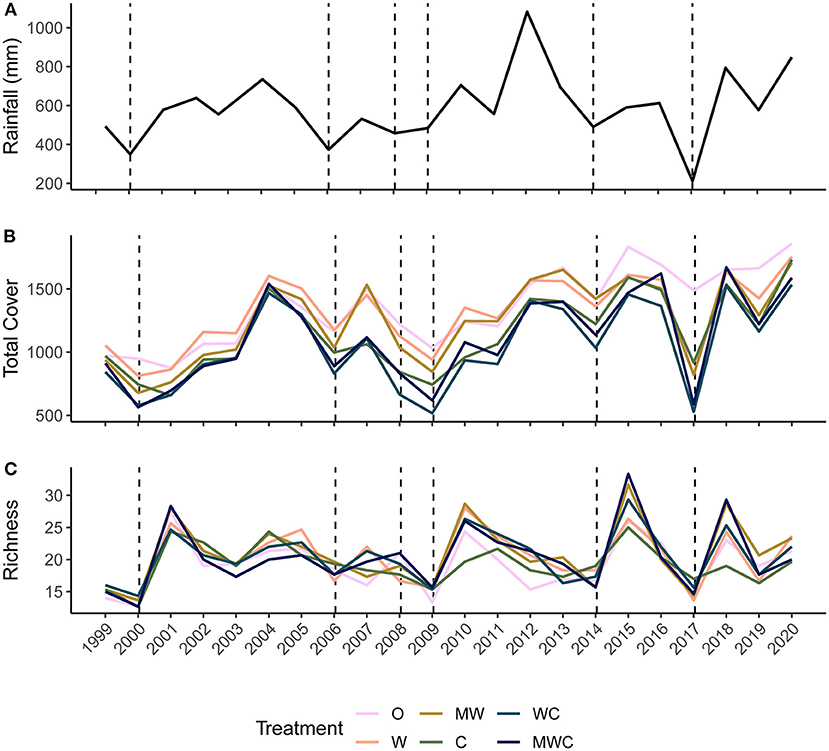
Figure 2. Precipitation (mm) calculated over the 12-months before the annual June sampling period (A), mean total cover (B) and species richness (C) at each sampling point (annually in June) from 1999-2020 colored by herbivore treatment. Herbivore treatments (ordered by total herbivore biomass) are: O, No herbivores; W, Wild mesoherbivores; MW, Wild megaherbivores and wild mesoherbivores; C, Cattle; WC, Wild mesoherbivores and cattle; MWC, Wild megaherbivores, wild mesoherbivores, and cattle. Dashed lines indicate low rainfall (<the 25th percentile, defined here as a drought) in the 12 months preceding the sampling point.
Our timeseries contained multiple drought events occurring at variable intervals, making it difficult to parse the effects of individual droughts on stability. As such, we chose to define a metric of drought impact for any given period of years. Our metric addresses three considerations: (1) the number of droughts in the period of time, assuming that a greater number of droughts would have a greater impact on the time window, (2) how severe each drought was relative to others, assuming that more severe droughts produce greater impacts, and finally (3) that droughts have lagged effects on the ecosystem (Dudney et al., 2017; Ye et al., 2020).
(1) Calculating the number of droughts: In each time window we assigned years with drought as 1 and all others as 0. Therefore, the number of droughts, Nd, in a window of n years can be written as:
(2) Defining drought severity: To approximate the severity of each drought in a window, we calculated the percentile of precipitation values in the first quartile (Q1). In order to bound the severity metric between 0 and 1 and make it inversely proportional to the precipitation amount, we defined drought severity as:
where p is the precipitation percentile, and d is the number of divisions in the first quartile (here 25 as we chose to use percentiles). Finally,
(3) accounting for lagged effects: We considered lagged effects (L) only in the year after a drought and set the magnitude as half that of a drought year. We scored years by whether there was a drought in the previous year and if so, multiplied severity (S) by ½ assuming that the effect will not be as large as the year in which the drought occurred, such that:
Drought score (Ds) is comprised of these three functions (divided by n years to normalize the function):
When calculated over each 10-year window used in the main moving window analyses, the drought score ranged from 0.076 (less severe drought) to 0.216 (more severe drought).
Linear Mixed Effects Models
We analyzed whether overall stability and component biotic mechanisms were affected by drought and herbivore treatment, using linear mixed effects models due to repeated sampling of plots through time (lme4 package; Bates et al., 2015). We used metrics calculated over the full time series to separately model (1) stability, (2) the classic variance ratio, (3) dominant species average population stability, and (4) species richness as functions of three herbivore groups: cattle, mesoherbivores, and megaherbivores, with block as a random effect. Similarly, we analyzed whether stability and component biotic mechanisms were related to the drought score and herbivore treatment, using data from the 10-year moving window calculations in sets of linear mixed effects models. We separately modeled (1) stability, (2) the classic variance ratio, (3) dominant species average population stability, and (4) species richness as functions of drought score and the three herbivore groups: cattle, mesoherbivores, and megaherbivores, with block and plot as separate random effects. To select models with the best predictors, we compared the Akaike Information Criterion with correction for small sample sizes (AICc) values between models with all factorial combinations of predictors and a null model. We evaluated whether our data fit the assumptions of this analysis by plotting the residuals vs. fitted values and checking the normality of residuals using a q-q plot.
To investigate which biotic mechanisms were the strongest drivers of temporal stability, we used a set of linear mixed effects models analyzing stability as a function of the classic variance ratio, dominant species average population stability, and species richness, with block as a random effect and no interactions between predictors. Before including predictors, we compared the correlation between all pairs of the three variables using Pearson's correlation test. No significant correlations were found (Pearson r values from −0.21 to 0.25), so we retained all three mechanisms as predictors. We selected the best set of predictor variables by comparing AICc values of models with all possible subset combinations of predictors.
Structural Equation Modeling
We examined our a priori hypothesized causal pathways between drought, herbivory, biotic mechanisms, and stability (Figure 1) using a piecewise structural equation model (SEM) (package piecewiseSEM, Lefcheck, 2016). We investigated Pearson's correlation coefficients (Supplementary Figure S4) and checked for multicollinearity using variance inflation factors (VIFs). There was minimal concern over multicollinearity as the greatest VIF in all three structural equation models was 1.79 (Supplementary Table S1) and generally, VIFs >5 indicate multicollinearity (James et al., 2013).
We modeled each of the three herbivore groups (mesoherbivores, megaherbivores, and cattle) in separate structural equation models so that herbivory could be coded numerically as a binary presence (1) or absence (0) of a particular herbivore group, as models with a categorical variable of more than two levels prohibit simple interpretation. With the piecewiseSEM package, we combined a series of multiple regressions predicting stability and the three biotic stability mechanisms, each fitted using lme4 with block as a random effect. For the regression model predicting stability, we removed the random effect of block as it did not explain any extra variance and caused singularity issues. All variables used in models were calculated over the 10-year moving window. The overall model fit was determined by testing the significance of pathways that were not included, where a well-supported model has a high Goodness-of-Fit p-value. Among our unincluded pathways, we identified significant relationships (test of directed separation, p < 0.05) between population stability and the variance ratio in the Cattle and Megaherbivore SEMs. Although this was identified as a missing pathway in two of our models, we did not change our structural equation models to include them as there was not a strong a priori hypothesized reason for doing so and it is likely a result of a small but significant correlation between the variance ratio and population stability, r = −0.159 (Supplementary Figure S4). Model coefficients can still be interpreted.
Standardized coefficients were calculated for each pathway using scale standardized coefficients (b), where the unstandardized coefficient (β) was scaled by the ratio of the standard deviation of x over the standard deviation of y, . For the herbivory, the coefficients represent the change in y as x changes from state “0”–particular herbivore group not present, to the other state “1”–herbivore group present. We calculated indirect effects, by multiplying the standardized coefficients of significant paths along an effect. Marginal and conditional R2 values represent the variance explained by fixed effects alone and the variance explained by both fixed and random effects (Nakagawa et al., 2017).
Results
Total cover fluctuated through time after an initial recovery from pre-treatment levels (Figure 2B). Treatment differences in total cover remained mostly consistent through time, and treatments followed the same fluctuations, with sharp drops in total cover during droughts, even in plots with few (W) or no (O) large herbivores (non-excluded herbivores included rodents, hares, and small <15kg ungulates). Species richness also varied through time (Figure 2C). It was not consistently ordered by herbivore pressure, although when richness sharply increased after dry periods, treatments that included wildlife had the greatest plant species richness (Figure 2C).
Bottom-Up and Top-Down Control of Stability
Consistent with H1, the temporal stability of total herbaceous cover declined with both drought and increasing herbivore pressure (Figure 3). Stability was negatively associated with greater drought score values (periods with more frequent or severe droughts) when calculated over the 10-year moving window (β = −7.28, Figure 3A, Table 1). The mean total cover (Supplementary Figure S5A) and variance (Supplementary Figure S5B) also declined with drought. Declines in stability (10-year) were associated most strongly with the presence of cattle (β = −1.62) and mesoherbivores (β = −0.91) judged by inclusion in the top model (Supplementary Tables S2, S3). The other highly ranked models (within 2 Δ AICc of the lowest AICc model) included megaherbivores, indicating some support for the hypothesis that all herbivore groups impact stability (Supplementary Tables S2, S3). Stability over the full time series also declined with herbivory (Figure 3B, Table 1) and had three models (37.5% of all models) within 2 Δ AICc. The preferred model (simplest model within 2 Δ AICc of the lowest AICc model) included only cattle (β = −0.92), but other top ranked models included mesoherbivores and megaherbivores also (Supplementary Tables S2, S3). The mean total cover (Supplementary Figure S6A) and variance (Supplementary Figure S6B) also declined with herbivore pressure, with the highest values in the herbivore exclusion treatment to lowest in the mesoherbivores + cattle treatment. Although treatments with greater herbivory did not vary as much in terms of absolute magnitude over time (had lower variance in herbaceous cover), this was outweighed by reductions in mean cover that led to lower relative stability overall.
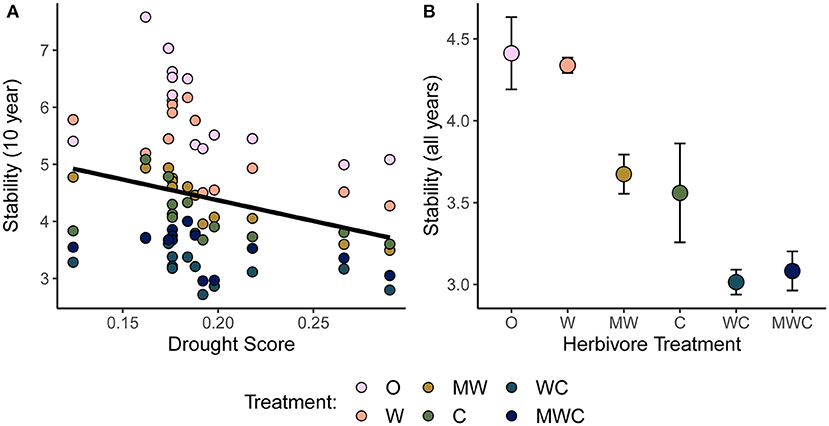
Figure 3. Temporal stability (μ/σ) of herbaceous cover as a function of the drought score (A) and herbivore treatment (B). Stability is calculated over a 10-year moving window in (A) in order to compare to the corresponding drought score of each time window. Higher drought score values indicate more severe drought. The black regression line in (A) is plotted as the predictor was included in the top model. In (B) stability is calculated over the full time series and points are colored by herbivore treatment. Herbivory patterns are consistent on a 10-year scale (Supplementary Figure S2A). Figures are based on raw data, but statistical models include random effects to account for spatial and temporal autocorrelation. See Table 1 for model details. Herbivore treatments (ordered by total herbivore biomass) are: O, No herbivores; W, Wild mesoherbivores; MW, Wild megaherbivores and wild mesoherbivores; C, Cattle; WC, Wild mesoherbivores and cattle; MWC, Wild megaherbivores, wild mesoherbivores, and cattle.
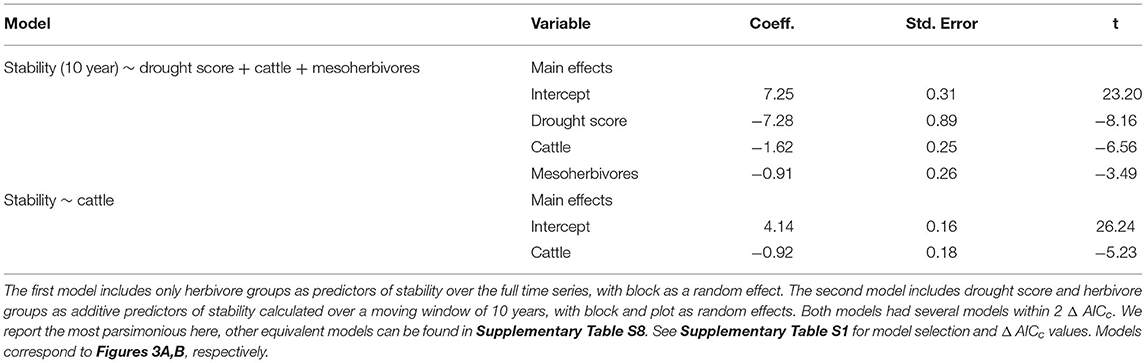
Table 1. Model outputs from linear mixed effects models predicting stability and selected for the lowest AICc value.
Bottom-Up and Top-Down Control of Biotic Stability Mechanisms
Asynchronous dynamics (i.e., patterns of synchrony) were altered by both top-down and bottom-up drivers. Periods with a higher drought score (indicating more frequent or severe droughts) were generally associated with greater synchrony (variance ratio > 1; β = 3.48), supporting H2a that drought would increase synchrony (Figure 4A, Table 2, Supplementary Table S4). On average, the variance ratio of the full community increased from weak asynchronous dynamics in the herbivore exclusion treatment to synchronous dynamics in the higher herbivory treatments, also consistent with H2a that herbivory would increase synchrony (Figure 4B). Specifically, cattle (β = 0.61) and megaherbivores (β = 0.52) had a positive relationship with synchrony when calculated over the full time series (Table 3), while cattle (β = 0.61) and mesoherbivores (β = 0.46) had a positive relationship with synchrony over the 10-year moving windows (Table 2). The variance ratios of just the five dominant species showed similar responses to herbivore treatment (Figure 4B) but were on average less synchronous than the full community and four of six treatments (O, W, MW, and C) showed asynchronous dynamics (variance ratio < 1, Figure 4B).
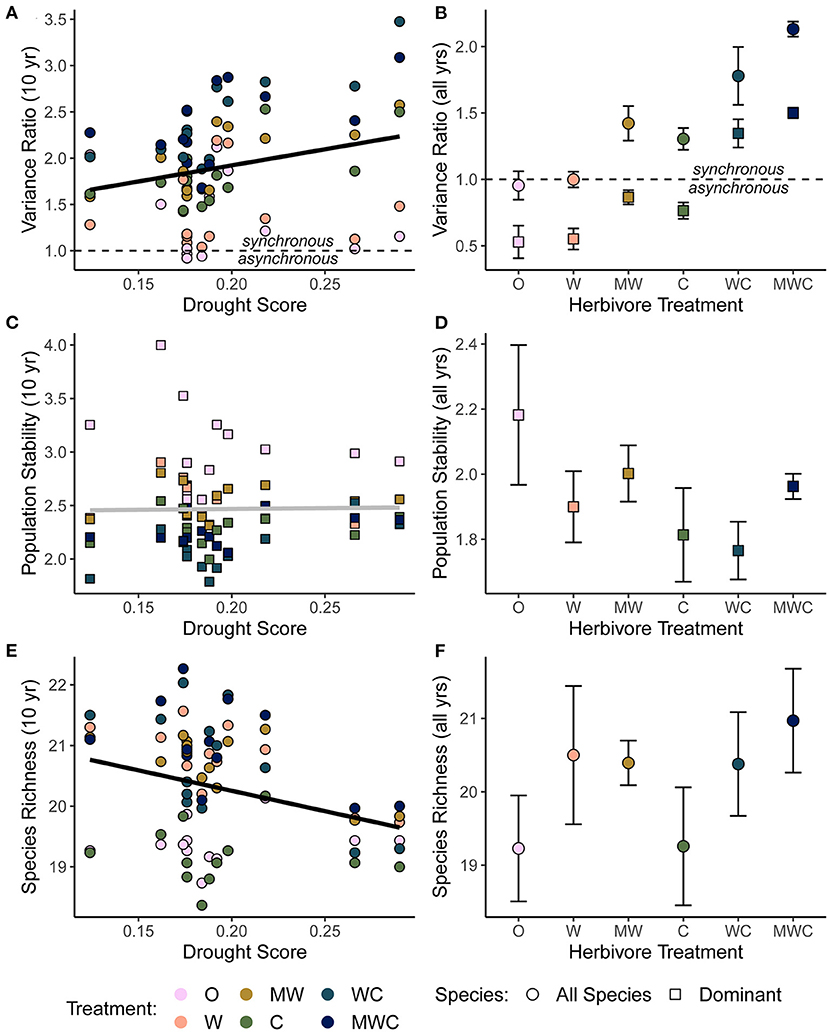
Figure 4. The relationship between the variance ratio (A), dominant species population stability (C), species richness (E) and drought, all calculated over a 10-year moving window in order to compare to the corresponding drought score of each time window. The effects of herbivore treatment on the variance ratio (B), dominant species population stability (D), and species richness (F) calculated as an average over the full timeseries. A variance ratio less than one indicates asynchronous dynamics, and greater than one indicates synchronous dynamics. Shape indicates whether the biotic mechanism is calculated using all species in the community (circles) or only the five dominant species (squares). Bars are one standard error. Black regression lines in (A,E) are plotted when the predictor was included in the top model and the gray regression line in (C) indicates that this predictor did not have an effect. Figures are based on raw data, but statistical models include random effects to account for spatial and temporal autocorrelation. See Tables 2, 3 for model details. Herbivore treatments (ordered by total herbivore biomass) are: O, No herbivores; W, Wild mesoherbivores; MW, Wild megaherbivores and wild mesoherbivores; C, Cattle; WC, Wild mesoherbivores and cattle; MWC, Wild megaherbivores, wild mesoherbivores, and cattle.
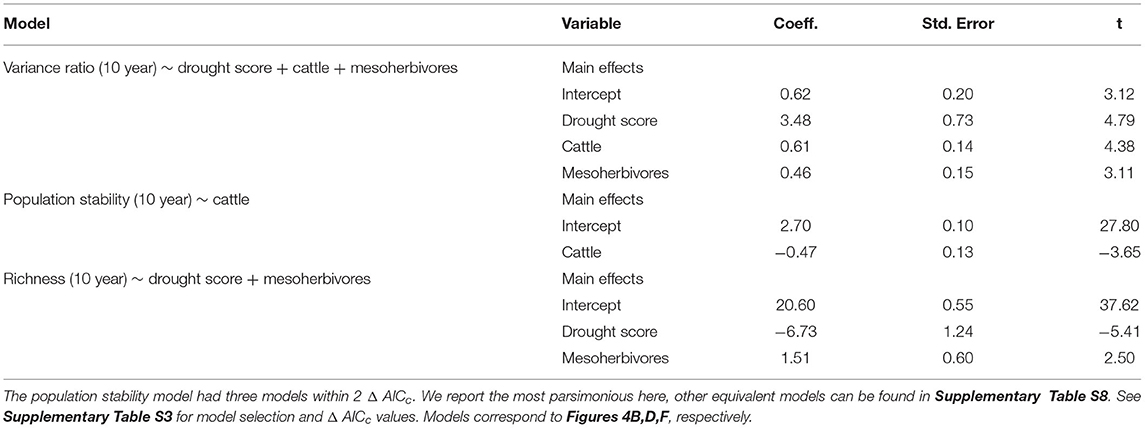
Table 2. Model outputs from linear mixed effects models with herbivore treatment and drought score as predictors of biotic stability mechanisms, with block and plot as random effects.
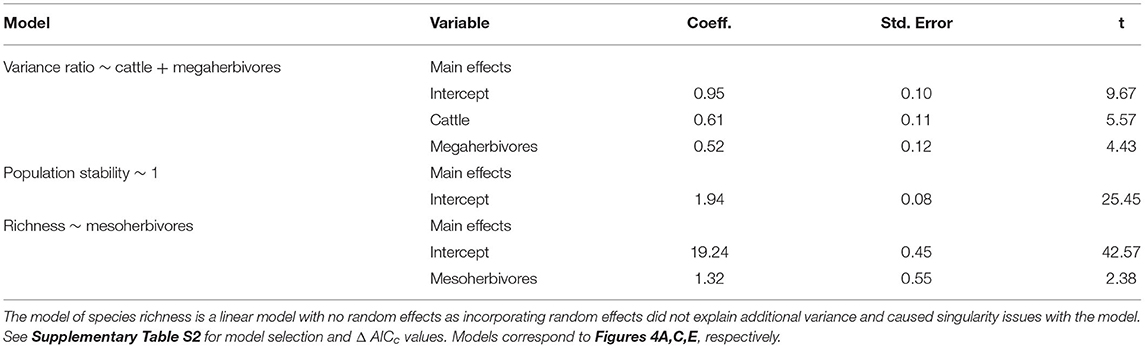
Table 3. Model outputs from linear mixed effects models with herbivore treatment as a predictor of biotic stability mechanisms, with block as a random effect.
Synchronous and compensatory dynamics varied by timescale in all herbivore treatments. At short timescales (< 4 years), synchrony dominated in all treatments (O = 1.66 to WC & MWC = 3.19, Supplementary Figure S7). Long timescales (> 4 years) ubiquitously had lower variance ratios than short timescales, where there were weak compensatory dynamics in the lowest grazing treatments (O = 0.854, W = 0.763), and all other herbivore treatments showed synchronous dynamics (Supplementary Figure S7). The timescale specific variance ratio followed the same pattern as the classic variance ratio, where increased herbivory was associated with increased synchronous dynamics.
The mean population stability of dominant species did not vary significantly between herbivore treatments when averaged across the time series (Figure 4D, Table 3, Supplementary Table S5). However, over a 10-year window, cattle negatively affected stability (β = −0.47), providing mixed support for H2b and suggesting that the influence of herbivory on population stability may depend on the timescale of calculation (Figure 4C, Table 2, Supplementary Table S4). The preferred model (simplest model within 2 AICc of the lowest AICc model) included only cattle, but other highly ranked models included mesoherbivores and the drought score, indicating some support for the hypothesis that these factors also impact dominant species stability (Supplementary Tables S3, S4).
Species richness was significantly negatively associated with drought score (β = −6.73; Figure 4E, Table 2, Supplementary Table S4) and positively associated with mesoherbivores (β = 1.32; Table 3, Supplementary Table S5), generally supporting H2c that richness would decline with drought and increase with herbivore intensity, but with different responses to specific herbivore treatments than were predicted. Species richness did not vary linearly along the gradient of herbivore pressure but did vary more predictably with herbivore diversity. Treatments with the lowest herbivore species richness (O and C) also had the lowest plant species richness (O = 19.2 and C = 19.3), while the most diverse herbivore treatment had the greatest plant species richness (MWC = 21.0; Figure 4F).
Biotic Stability Mechanisms as Predictors of Overall Stability
As hypothesized in H3a and H3b, temporal stability was negatively associated with synchrony (β = −1.11; Figure 5A) and positively associated with the mean population stability of dominant species (β = 0.92; Figure 5B). Synchrony and population stability together predicted temporal stability better than either mechanism on its own (Table 4). In contrast with H3c, richness did not predict stability (Figure 5C); instead, the variance ratio and dominant species population stability together were the best predictors (Table 4, Supplementary Table S6).
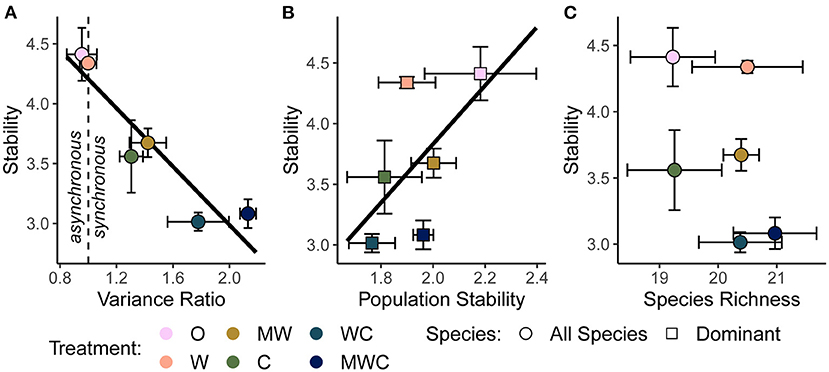
Figure 5. The relationship between stability and the variance ratio (A), dominant species population stability (B), and species richness (C), all calculated over the full timeseries. A variance ratio less than one indicates asynchronous dynamics, and greater than one indicates synchronous dynamics. Black regression lines in (A) and (B) are plotted when the predictor was included in the top model. Figures are based on raw data, but statistical models include random effects to account for spatial and temporal autocorrelation. See Table 4 and Supplementary Table S6 for statistical model details. Herbivore treatments (ordered by total herbivore biomass) are: O, No herbivores; W, Wild mesoherbivores; MW, Wild megaherbivores and wild mesoherbivores; C, Cattle; WC, Wild mesoherbivores and cattle; MWC, Wild megaherbivores, wild mesoherbivores, and cattle.
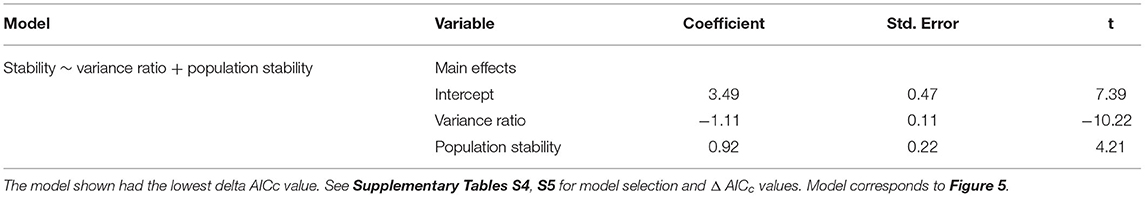
Table 4. Model output from the linear mixed effect model predicting stability as a function of biotic mechanisms.
Timescale
To assess the sensitivity of our findings to the choice of timescale, we evaluated metrics of stability and biotic mechanisms across timescales ranging from 5-year moving windows to the full 22-year time series (Supplementary Figure S2), and examined all bivariate relationships for 5-year, 10-year, and 15-year windows (Supplementary Figures S3, S8, S9). The responses of stability and biotic mechanisms to herbivore treatments were consistent across timescales (Supplementary Figure S2). Stability, synchrony, and population stability values declined as they were calculated over larger window sizes, but the relative ordering of these response variables with respect to herbivore treatment was consistent regardless of window size (Supplementary Figure S2). The relationship between drought and stability was negative across all three window sizes (Supplementary Figure S8). The 15-year moving window had the weakest relationship likely because the window was large enough to average over trends (Supplementary Figure S8C). The total herbivore exclusion treatment was decoupled from this trend in the 5-year window analysis; at high drought score values it also had high stability (Supplementary Figure S8A), which may be due to one instance where it exhibited high resistance to drought (Figure 2B−2017). The relationship between synchrony (variance ratio) and the drought score were positive at all timescales, although the slope flattened slightly as the timescale increased (Supplementary Figures S9A–C). There was no relationship between drought and population stability at any timescale (Supplementary Figures S9D–F), and richness had a negative relationship with drought at all timescales (Supplementary Figures S9G–I). The relationships between stability and biotic mechanisms remained the same at all timescales (Supplementary Figure S3).
Relative Importance of All Drivers
To quantify the relative importance of top-down and bottom-up drivers as well as their indirect effects, we generated a piecewise structural equation model for each herbivore group: mesoherbivores (Figure 6A, Supplementary Table S7), megaherbivores (Figure 6B, Supplementary Table S8), and cattle (Figure 6C, Supplementary Table S9). These models explained 82 to 84% of the variation in community stability. They confirmed the direct negative effects of drought (standardized coefficient range: −0.134 to −0.116) and herbivory (standardized coefficient range: −0.165 to −0.002). However, the magnitude of direct effects of synchrony (standardized coefficient range: −0.593 to −0.523) and population stability (standardized coefficient range: 0.498 to 0.575), were always greater than the magnitude of direct drought and herbivory effects. The direct effect of species richness on stability remained nonsignificant except for a small positive effect on stability in the megaherbivore model (standardized coefficient = 0.075). Given the strong direct effects of the plant community on stability, the indirect effects of drought and herbivory as mediated through the plant community were important in determining stability. The indirect effects of drought (standardized coefficient range: −0.148 to −0.130) were similar in magnitude to its direct effects and always mediated through synchrony (Table 5). In the megaherbivore model, the indirect effects of drought were also mediated through richness. Cattle and mesoherbivore herbivory produced large indirect effects (standardized coefficients: −0.502 and −0.380) relative to their direct effects, mediated through both synchrony and population stability (Table 5). Megaherbivore herbivory on the other hand, had direct and indirect effects (standardized coefficients: −0.087 and 0.129) that were similar in magnitude and mediated through synchrony and species richness (Table 5).
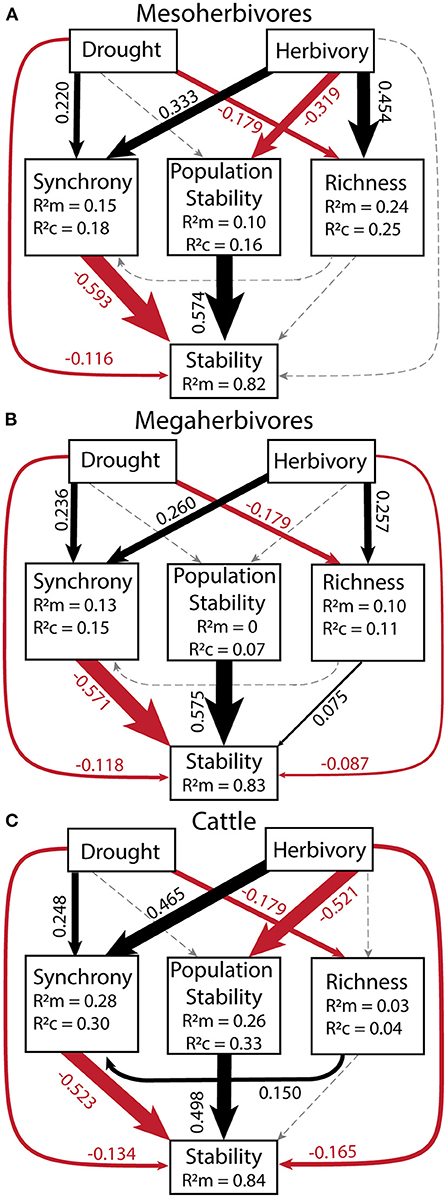
Figure 6. Structural equation models for each herbivore group: mesoherbivores (A), megaherbivores (B), and cattle (C) to determine the relative strength of direct vs. indirect effects of drought and herbivory. All variables in the model were calculated over a 10-year moving window in order to compare to the corresponding drought score of each time window. Goodness of Fit values were: for mesoherbivores C = 4.00, p = 0.406, df = 4 (A), for megaherbivores C = 8.86, p = 0.065, df = 4 (B), and for cattle C = 13.79, p = 0.008, df = 4 (C). Values next to arrows (direct effects) are scale standardized estimates of coefficients and arrow width is scaled to their magnitude. Black arrows denote positive effects, red arrows show negative effects, and gray, dashed arrows show non-significant effects. Model coefficients and outputs can be found in Supplementary Tables S7–S9. The R of each response variable provides the variance explained by fixed effect(s) alone and R is the variance explained by both the fixed and random effects (Block = random). No R value is present for stability as we removed random effects from the model because they did not explain any variance and caused singularity issues. See Table 5 for indirect effects.
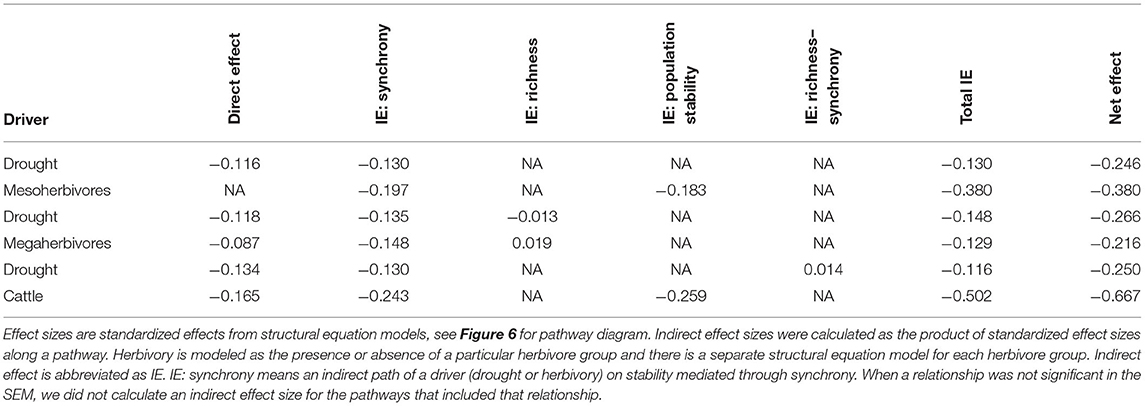
Table 5. Direct, indirect, and net effects of drought and herbivory on stability.
Discussion
Unraveling the determinants of ecological stability is a core theoretical and empirical pursuit in ecology with important implications for land management and conservation in a changing world. Here, we explored the effects of herbivory and episodic drought on stability directly and as mediated through biotic stability mechanisms, using a 22-year time series of herbaceous cover data from an herbivore exclusion experiment in a semi-arid savanna. We analyzed stability and biotic mechanisms over a moving window, allowing us to incorporate the effects of periodic drought into temporal stability analyses and understand the top-down and bottom-up drivers of stability through time. Drought and herbivory both directly decreased the temporal stability of herbaceous cover (Figure 3) but varied in their effects on mediating biotic mechanisms. Both drought and herbivory increased synchrony (a destabilizing dynamic) while herbivory, but not drought, reduced the population stability of dominant species (Figure 4). Although both drivers affected species richness, and in contrasting ways (Figures 4E,F), richness was not significantly associated with overall stability (Figure 5). Overall, the direct effects of drought and herbivory on stability were smaller in magnitude than their indirect effects mediated through biotic stability mechanisms (Figure 6).
Grasslands and savannas are disturbance-dependent systems that are frequently described by non-equilibrium dynamics (Higgins et al., 2000; Fuhlendorf and Engle, 2001; Bond, 2008; Riginos et al., 2018) and our findings highlight the dynamic nature of this savanna rangeland system. Here we found that the direct effects of both bottom-up and top-down drivers structured stability. Specifically, drought and herbivory reduced the temporal stability of total herbaceous cover in an additive fashion, supporting H1 (Figure 3). The relationship between herbivory and stability was particularly strong, and treatments appeared to pair into groups of O and W, MW and C, WC and MWC (Figure 3B). Overall, the reductions in stability were largely driven by a reduction in the mean cover (Supplementary Figures S5A, S6A). Although both drivers also reduced the variance in absolute terms (Supplementary Figures S5B, S6B), the relative variance increased because we defined stability as the mean total cover divided by the standard deviation. Drought reduces the total amount of biomass as water stress limits production (Craine et al., 2012; Aroca, 2013; Grant et al., 2014), and also introduces greater variability to the system when production tracks rainfall fluctuations through time (La Pierre et al., 2011). At the same time, temporal variation in herbivore behavior and population dynamics may either buffer or enhance variability in vegetative cover (Augustine and McNaughton, 1998; Fynn and O'Connor, 2000; Abraham et al., 2019; Staver et al., 2019). Herbivores limit mean total cover by removing plant tissue (Gill, 2007; Muthoni et al., 2014), and may either suppress production by reducing photosynthetic potential and removing nutrients (Sitters et al., 2020) or stimulate productivity when plants compensate for herbivore damage by increasing growth rates (Strauss and Agrawal, 1999; Agrawal, 2000; Knapp et al., 2012). While there is evidence that herbivores increase productivity in this system (Charles et al., 2017), the effect of this on stability was outweighed by tissue removal. Herbivore identity and stocking rate also mattered: cattle and mesoherbivores were the only groups that significantly reduced stability, and cattle had a stronger effect likely because they were stocked at higher biomass densities (4,740 vs. 730 kg/km2). This is consistent with previous findings that total herbivore pressure is a stronger predictor of productivity and shifts in community composition than herbivore identity, but individual herbivore types are more likely to drive variation in productivity across space and time and changes in individual species (Veblen et al., 2016; Charles et al., 2017; Wells et al., 2021).
Although asynchronous dynamics are commonly observed in terrestrial systems (Zhao et al., 2020; but see Houlahan et al., 2007) and are often a key stabilizing mechanism (Valencia et al., 2020), we observed instead varying levels of synchronous dynamics (defined as variance ratio >1) which appeared to drive the dynamic nature of vegetative cover in this system (Figures 4A,B). In other words, under no conditions did species asynchrony stabilize herbaceous cover per se, but there was variation in the degree to which synchrony was a destabilizing dynamic, associated with drought and herbivory. Both drought and herbivory indirectly reduced stability by increasing synchrony (Figures 4A,B): synchronous dynamics increased during time periods with more frequent or severe droughts and in communities experiencing more herbivory, supporting H2a. Further, these indirect effects were similar to or greater in magnitude than the direct effect of either driver (Figure 6, Table 5). The finding with respect to drought does contrast with other findings across precipitation gradients (a spatial comparison rather than a temporal one), which find that asynchronous (compensatory) dynamics are strongest in places with high precipitation variability–implying that precipitation fluctuations can decrease synchrony rather than increasing it as we found here (Hallett et al., 2014). Dominant species were on average less synchronous than the full community (Figure 4B), indicating that subordinate species also substantially contribute to community synchrony. This effect is likely attributed to a reduction in palatable dominant species under higher herbivory, which creates space for subordinate species to fluctuate synchronously in response to rainfall variability (Porensky et al., 2013).
Counter to the effects of synchrony, dominant species population stability promoted community stability, especially at low levels of herbivory (Figures 5B, 6). Herbivores commonly influence community structure by preferentially consuming dominant species (Hillebrand et al., 2007; Porensky et al., 2013; Borer et al., 2014; Koerner et al., 2018; Mortensen et al., 2018). We found that the population stability of dominant species declined with increased herbivory, particularly when cattle or mesoherbivores were present. In this system, herbivores consume all of the dominant species, particularly B. lachnantha and T. triandra (Odadi et al., 2013), likely contributing to the reduction in average population stability. In particular, B. lachnantha showed large increases when released from herbivore pressure (Veblen et al., 2016). Contrary to expectations, the population stability of dominant species as a whole did not respond to drought. However, total herbaceous cover and stability did decline during drought periods even as the stability of dominant species did not, implying that drought-related reductions in stability result more from the response of the community as a whole than from the sensitivity of dominant species. Overall, the stability of total herbaceous cover correlated well with the population stability of dominant species, consistent with previous findings (Grman et al., 2010; Liang et al., 2021).
Although the portfolio effect is often noted as important in determining stability, where more diverse communities have more stable ecosystem properties overall (Yachi and Loreau, 1999; Hautier et al., 2015; Isbell et al., 2015; Loreau et al., 2021), we did not find evidence for this here (Figures 4E,F), contrary to H3c that species richness would be positively correlated with temporal stability. Indeed, an increasing number of studies find that asynchrony and dominant species stability have a greater influence on stability than richness (Hallett et al., 2014; Valencia et al., 2020; Muraina et al., 2021). The portfolio effect predicts that aggregate ecosystem properties will vary less in diverse communities due to some form of compensatory dynamics and thus, species richness should reduce synchrony (Valencia et al., 2020; Loreau et al., 2021). We included this relationship in our structural equation models but when this pathway was significant (only in the model including cattle herbivory) richness increased synchrony and thus had a small negative indirect effect on stability (Figure 6C). This phenomenon is likely explained by richness fluctuations in response to the combination of bottom-up and top-down drivers. Species richness declined with drought, a signal that was weakly detected over a 10-year moving window (Figure 4E) but apparent in the time series (Figure 2C), and increased transiently when rain followed after drought (Figure 2C), especially where herbivory opened space for rarer species (Porensky et al., 2013). These transient increases in richness (of rarer species) may contribute to some of the observed synchrony patterns, especially as dominant species were on average less synchronous than the full community (Figure 4B).
Drivers of stability fluctuate through time, which may produce timescale dependent effects on stability (Zelnik et al., 2018; Clark et al., 2021; Ross et al., 2021). To address the potential effects of timescale on our analyses, we considered stability and its underlying mechanisms at three timescales of 5-, 10-, and 15-year moving windows. In particular, synchronous dynamics are timescale dependent phenomena and our results show that synchrony dominated at shorter timescales (Supplementary Figures S2B, S7), consistent with evidence in grasslands that synchrony is stronger at short timescales, while asynchronous dynamics often dominate at longer timescales (Zhao et al., 2020; Shoemaker et al., 2022). Despite this, stability declined when calculated over longer timescales, likely reflecting the intuitive outcome that including more years in the calculation leads to a higher chance of including more variation. Even the effects of drought, an inherently temporal phenomenon, did not change substantially with timescale (Supplementary Figure S8). The relationship between stability and synchrony remained unchanged by timescale (Supplementary Figures S3A–C). We similarly found no difference in the relationships between population stability or richness and stability at different timescales (Supplementary Figures S3D–I), showing that although temporal variation in precipitation amounts as well as herbivore abundance, types, or intensity could alter the importance of biotic stability mechanisms depending on the timescale of observation, they did not here. Therefore, while synchrony was timescale dependent and the timescale of calculation influenced the magnitude of stability values, timescale did alter the effects of herbivore treatments or drought events on stability and biotic mechanisms.
Delving into the role of both bottom-up and top-down processes in structuring stability is critical to understanding the full picture, but the majority of theoretical and empirical work on this topic has focused on variation across bottom-up gradients only (Grman et al., 2010; Hallett et al., 2014; Xu et al., 2015; Hautier et al., 2020). In examining an herbaceous community subject to strong bottom-up (drought) and top-down (herbivory) limitation, we found that these stressors affect biotic mechanisms of stability in sometimes similar and sometimes contrasting ways. Drought and herbivory both reduced the stability of total herbaceous cover by increasing species synchrony, suggesting a commonality of mechanism. In both cases, the more stressed a community was, whether by water limitation or herbivore consumption, the less capacity there was for species to differ asynchronously in their responses to variability. On the other hand, drought and herbivory differed in how they affected two other potential mediators of stability: herbivory reduced dominant species population stability while drought had little effect, and herbivory increased average species richness while drought decreased it. In an applied context, this means considering that the stability of plant biomass for livestock or other consumers is a function not only of how much production the abiotic environment can support, but also how grazing feeds back to influence stability both directly and indirectly.
Climate change is expected to lead to more extreme and variable precipitation patterns (Allan and Soden, 2008; Trenberth et al., 2014; Funk et al., 2021; IPCC, 2021), and at the same time, in savanna ecosystems such as the one studied here, large herbivores are being lost from some areas (Ripple et al., 2015) and restored (Seddon et al., 2014; Stalmans et al., 2019) or replaced by increased livestock in others (Du Toit and Cumming, 1999). Understanding how bottom-up and top-down drivers alter stability and stabilizing community dynamics will provide more ability to predict and adapt to these changing landscapes. In particular, in a future of increasing drought, we may expect to see an increase in synchronous dynamics in plant communities and a decrease in temporal stability as observed here, but these effects will in turn be mediated by changes in herbivore communities and their direct and indirect impacts on plant community dynamics. Livestock replacement of wildlife is generally at higher stocking densities than the wild herbivores lost, particularly in semi-arid parts of the African continent (Hempson et al., 2017). An increase in total herbivore pressure will likely amplify the effects of drought, although wild meso- and megaherbivores are likely to have smaller effects on stability than cattle. In considering the applications of ecological stability, it is important to note that there are many facets of stability. We measured the invariability of herbaceous cover here, which reflects aggregate patterns over time and can incorporate but not directly measure other facets of stability such as resistance to perturbations or the rate of recovery to initial conditions, i.e., resilience (Donohue et al., 2016). How “stability” itself aligns with management goals will depend on the values applied to a particular system; the constancy of total herbaceous cover, for example, may be a desirable quality for forage availability and erosion control (Fynn and O'Connor, 2000), while temporal variability and heterogeneity support other key ecosystem functions and dimensions of biodiversity (Fuhlendorf and Engle, 2001; Porensky et al., 2013; Bråthen et al., 2021). Overall, our ability to understand the sources of variation and stability in dynamic systems will be essential to predicting future patterns of stability and navigating a changing world.
Data Availability Statement
Publicly available datasets were analyzed in this study. This data can be found here: https://doi.org/10.6084/m9.figshare.3175561.v1.
Author Contributions
CE led analysis and writing. MC, CW, and LH assisted in analytical methods. TY, KV, DK, and LP designed, implemented, and maintained the KLEE plots. All authors contributed to the article, interpretation of results, manuscript envisioning, editing, and approved the submitted version.
Funding
The KLEE exclosure plots were built and maintained by grants from the James Smithson Fund of the Smithsonian Institution, the National Geographic Society (Grants 4691-91, 9106-12, and 9986-16) and the National Science Foundation (Grants LTREB DEB 97-26642, 03-16402, 08-16453, 12-56004, 12-56034, and 19-31224).
Conflict of Interest
The authors declare that the research was conducted in the absence of any commercial or financial relationships that could be construed as a potential conflict of interest.
The reviewer KJ declared a shared affiliation with the author RL to the handling editor at the time of review.
Publisher's Note
All claims expressed in this article are solely those of the authors and do not necessarily represent those of their affiliated organizations, or those of the publisher, the editors and the reviewers. Any product that may be evaluated in this article, or claim that may be made by its manufacturer, is not guaranteed or endorsed by the publisher.
Acknowledgments
This research was carried out under Government of Kenya research clearance permit No. NCST/RCD/12B/012/42. We would like to thank Frederick Erii, John Lochikuya, Mathew Namoni, Jackson Ekadeli, and Stephen Ekale for their invaluable assistance in the field and the Mpala Research Center and its staff for their logistical support. We would also like to thank Oisín Watkins for his help in developing a system to score droughts in the moving window analysis. Finally, we are grateful to Hallett lab members for useful comments on the manuscript and to Paul Reed for assistance on structural equation models.
Supplementary Material
The Supplementary Material for this article can be found online at: https://www.frontiersin.org/articles/10.3389/fevo.2022.867051/full#supplementary-material
References
Abraham, J. O., Hempson, G. P., and Staver, A. C. (2019). Drought-response strategies of savanna herbivores. Ecol. Evol. 9, 7047–7056. doi: 10.1002/ece3.5270
Adler, P. B., and Levine, J. M. (2007). Contrasting relationships between precipitation and species richness in space and time. Wildlife Bio. 116, 221–232. doi: 10.1111/j.0030-1299.2007.15327.x
Agrawal, A. A. (2000). Overcompensation of plants in response to herbivory and the by-product benefits of mutualism. Trends Plant Sci. 5, 309–313. doi: 10.1016/S1360-1385(00)01679-4
Allan, R. P., and Soden, B. J. (2008). Atmospheric warming and the amplification of precipitation extremes. Science. 321, 1481–1484. doi: 10.1126/science.1160787
Alon, M., and Sternberg, M. (2019). Effects of extreme drought on primary production, species composition and species diversity of a Mediterranean annual plant community. J. Veg. Sci. 30, 1045–1061. doi: 10.1111/jvs.12807
Aroca, R. (ed.)., (2013). Plant Responses to Drought Stress: From Morphological to Molecular Features. London: Springer Heidelberg New York Dordrecht London. doi: 10.1007/978-3-642-32653-0
Augustine, D. J. (2010). Response of native ungulates to drought in semi-arid Kenyan rangeland. Afr. J. Ecol. 48, 1009–1020. doi: 10.1111/j.1365-2028.2010.01207.x
Augustine, D. J., and McNaughton, S. J. (1998). Ungulate effects on the functional species composition of plant communities: herbivore selectivity and plant tolerance. J. Wildl. Manage. 62, 1165–1183. doi: 10.2307/3801981
Bates, D., Mächler, M., Bolker, B. M., and Walker, S. C. (2015). Fitting linear mixed-effects models using lme4. J. Stat. Softw. 67, 1–48. doi: 10.18637/jss.v067.i01
Beck, J. J., Hernández, D. L., Pasari, J. R., and Zavaleta, E. S. (2015). Grazing maintains native plant diversity and promotes community stability in an annual grassland. Ecol. Appl. 25, 1259–1270. doi: 10.1890/14-1093.1
Bond, W. J. (2008). What limits trees in C4 grasslands and savannas? Annu. Rev. Ecol. Evol. Syst. 39, 641–659. doi: 10.1146/annurev.ecolsys.39.110707.173411
Borer, E. T., Seabloom, E. W., Gruner, D. S., Harpole, W. S., Hillebrand, H., Lind, E. M., et al. (2014). Herbivores and nutrients control grassland plant diversity via light limitation. Nature 508, 517–520. doi: 10.1038/nature13144
Bråthen, K. A., Pugnaire, F. I., and Bardgett, R. D. (2021). The paradox of forbs in grasslands and the legacy of the mammoth steppe. Front. Ecol. Environ. 19, 584–592. doi: 10.1002/fee.2405
Bueno de Mesquita, C. P., White, C. T., Farrer, E. C., Hallett, L. M., and Suding, K. N. (2021). Taking climate change into account: Non-stationarity in climate drivers of ecological response. J. Ecol. 109, 1491–1500. doi: 10.1111/1365-2745.13572
Campana, S., Tognetti, P. M., and Yahdjian, L. (2022). Livestock exclusion reduces the temporal stability of grassland productivity regardless of eutrophication. Sci. Total Environ. 817, 152707. doi: 10.1016/j.scitotenv.2021.152707
Charles, G. K., Porensky, L. M., Riginos, C., Veblen, K. E., and Young, T. P. (2017). Herbivore effects on productivity vary by guild: cattle increase mean productivity while wildlife reduce variability: cattle. Ecol. Appl. 27, 143–155. doi: 10.1002/eap.1422
Clark, A. T., Arnoldi, J. F., Zelnik, Y. R., Barabas, G., Hodapp, D., Karakoç, C., et al. (2021). General statistical scaling laws for stability in ecological systems. Ecol. Lett. 24, 1474–1486. doi: 10.1111/ele.13760
Craine, J. M., Nippert, J. B., Elmore, A. J., Skibbe, A. M., Hutchinson, S. L., and Brunsell, N. A. (2012). Timing of climate variability and grassland productivity. Proc. Natl. Acad. Sci. U. S. A. 109, 3401–3405. doi: 10.1073/pnas.1118438109
Doak, D. F., Bigger, D., Harding, E. K., Marvier, M. A., O'Malley, R. E., and Thomson, D. (1998). The statistical inevitability of stability-diversity relationships in community ecology. Am. Nat. 151, 264–276. doi: 10.1086/286117
Donohue, I., Hillebrand, H., Montoya, J. M., Petchey, O. L., Pimm, S. L., Fowler, M. S., et al. (2016). Navigating the complexity of ecological stability. Ecol. Lett. 19, 1172–1185. doi: 10.1111/ele.12648
Du Toit, J. T., and Cumming, D. H. M. (1999). Functional significance of ungulate diversity in African savannas and the ecological implications of the spread of pastoralism. Biodivers. Conserv. 8, 1643–1661. doi: 10.1023/A:1008959721342
Dudney, J., Hallett, L. M., Larios, L., Farrer, E. C., Spotswood, E. N., Stein, C., et al. (2017). Lagging behind: have we overlooked previous-year rainfall effects in annual grasslands? J. Ecol. 105, 484–495. doi: 10.1111/1365-2745.12671
Fu, H., Yuan, G., Özkan, K., Johansson, L. S., Søndergaard, M., Lauridsen, T. L., et al. (2020). Patterns of seasonal stability of lake phytoplankton mediated by resource and grazer control during two decades of re-oligotrophication. Ecosystems. 24, 911–925. doi: 10.1007/s10021-020-00557-w
Fuhlendorf, S. D., and Engle, D. M. (2001). Restoring heterogeneity on rangelands: Ecosystem management based on evolutionary grazing patterns. Bioscience. 51, 625–632. doi: 10.1641/0006-3568(2001)051[0625:RHOREM]2.0.CO;2
Funk, C., Way-henthorne, J., and Turner, W. (2021). Phenological water balance applications for trend analyses and risk management. Front. Clim. 3, 1–15. doi: 10.3389/fclim.2021.716588
Fynn, R. W. S., and O'Connor, T. G. (2000). Effect of stocking rate and rainfall on rangeland dynamics and cattle performance in a semi-arid savanna, South Africa. J. Appl. Ecol. 37, 491–507. doi: 10.1046/j.1365-2664.2000.00513.x
Ganjurjav, H., Zhang, Y., Gornish, E. S., Hu, G., Li, Y., Wan, Y., et al. (2019). Differential resistance and resilience of functional groups to livestock grazing maintain ecosystem stability in an alpine steppe on the Qinghai-Tibetan Plateau. J. Environ. Manage. 251, 109579. doi: 10.1016/j.jenvman.2019.109579
Georgiadis, N. J., Olwero, J. G. N., Ojwang,', G., and Romañach, S. S. (2007). Savanna herbivore dynamics in a livestock-dominated landscape: I. dependence on land use, rainfall, density, and time. Biol. Conserv. 137, 461–472. doi: 10.1016/j.biocon.2007.03.005
Gill, R. A. (2007). Influence of 90 years of protection from grazing on plant and soil processes in the subalpine of the Wasatch Plateau, USA. Rangel. Ecol. Manag. 60, 88–98. doi: 10.2111/05-236R2.1
Grant, K., Kreyling, J., Dienstbach, L. F. H., Beierkuhnlein, C., and Jentsch, A. (2014). Water stress due to increased intra-annual precipitation variability reduced forage yield but raised forage quality of a temperate grassland. Agric. Ecosyst. Environ. 186, 11–22. doi: 10.1016/j.agee.2014.01.013
Grman, E., Lau, J. A., Schoolmaster, D. R., and Gross, K. L. (2010). Mechanisms contributing to stability in ecosystem function depend on the environmental context. Ecol. Lett. 13, 1400–1410. doi: 10.1111/j.1461-0248.2010.01533.x
Hairston, N. G., Smith, F. E., and Slobodkin, L. B. (1960). Community structure, population control, and competition. Am. Nat. 94, 421–425. doi: 10.1086/282146
Hallett, L. M., Hsu, J. S., Cleland, E. E., Collins, S. L., Dickson, T. L., Farrer, E. C., et al. (2014). Biotic mechanisms of community stability shift along a precipitation gradient. Ecology. 95, 1693–1700. doi: 10.1890/13-0895.1
Hallett, L. M., Jones, S. K., MacDonald, A. A. M., Jones, M. B., Flynn, D. F. B., Ripplinger, J., et al. (2016). codyn: An r package of community dynamics metrics. Methods Ecol. Evol. 7, 1146–1151. doi: 10.1111/2041-210X.12569
Harrison, S. P., Laforgia, M. L., and Latimer, A. M. (2018). Climate-driven diversity change in annual grasslands : drought plus deluge does not equal normal. 24, 1782–1792. doi: 10.1111/gcb.14018
Hautier, Y., Tilman, D., Isbell, F., Seabloom, E. W., Borer, E. T., and Reich, P. B. (2015). Anthropogenic environmental changes affect ecosystem stability via biodiversity. Science (80). 348, 336–340. doi: 10.1126/science.aaa1788
Hautier, Y., Zhang, P., Loreau, M., Wilcox, K. R., Seabloom, E. W., Borer, E. T., et al. (2020). General destabilizing effects of eutrophication on grassland productivity at multiple spatial scales. Nat. Commun. 11, 1–9. doi: 10.1038/s41467-020-19252-4
Hempson, G. P., Archibald, S., and Bond, W. J. (2017). The consequences of replacing wildlife with livestock in Africa. Sci. Rep. 7, 1–10. doi: 10.1038/s41598-017-17348-4
Higgins, S. I., Bond, W. J., and Trollope, W. S. W. (2000). Fire, resprouting and variability: A recipe for grass-tree coexistence in savanna. J. Ecol. 88, 213–229. doi: 10.1046/j.1365-2745.2000.00435.x
Hillebrand, H., Gruner, D. S., Borer, E. T., Bracken, M. E. S., Cleland, E. E., Elser, J. J., et al. (2007). Consumer versus resource control of producer diversity depends on ecosystem type and producer community structure. Proc. Natl. Acad. Sci. U. S. A. 104, 10904–10909. doi: 10.1073/pnas.0701918104
Houlahan, J. E., Currie, D. J., Cottenie, K., Cumming, G. S., Ernest, S. K. M., Findlay, C. S., et al. (2007). Compensatory dynamics are rare in natural ecological communities. Proc. Natl. Acad. Sci. U. S. A. 104, 3273–3277. doi: 10.1073/pnas.0603798104
IPCC (2021). Climate Change 2021: The Physical Science Basis. Contribution of Working Group I to the Sixth Assessment Report of the Intergovernmental Panel on Climate Change. Cambridge, New York, NY: Cambridge University Press.
Isbell, F., Craven, D., Connolly, J., Loreau, M., Schmid, B., Beierkuhnlein, C., et al. (2015). Biodiversity increases the resistance of ecosystem productivity to climate extremes. Nature. 526, 574–577. doi: 10.1038/nature15374
James, G., Witten, D., Hastie, T., and Tibshirani, R. (2013). An Introduction to Statistical Learning with applications in R. New York, NY; Heidelberg; Dordrecht; London: Springer. doi: 10.1007/978-1-4614-7138-7_1
Kardol, P., Campany, C. E., Souza, L., Norby, R. J., Weltzin, J. F., and Classen, A. T. (2010). Climate change effects on plant biomass alter dominance patterns and community evenness in an experimental old-field ecosystem. Glob. Chang. Biol. 16, 2676–2687. doi: 10.1111/j.1365-2486.2010.02162.x
Knapp, A. K., Hoover, D. L., Blair, J. M., Buis, G., Burkepile, D. E., Chamberlain, A., et al. (2012). A test of two mechanisms proposed to optimize grassland aboveground primary productivity in response to grazing. J. Plant Ecol. 5, 357–365. doi: 10.1093/jpe/rts020
Koerner, S. E., Smith, M. D., Burkepile, D. E., Hanan, N. P., Avolio, M. L., Collins, S. L., et al. (2018). Change in dominance determines herbivore effects on plant biodiversity. Nat. Ecol. Evol. 2, 1925–1932. doi: 10.1038/s41559-018-0696-y
La Pierre, K. J., Yuan, S., Chang, C. C., Avolio, M. L., Hallett, L. M., Schreck, T., et al. (2011). Explaining temporal variation in above-ground productivity in a mesic grassland: The role of climate and flowering. J. Ecol. 99, 1250–1262. doi: 10.1111/j.1365-2745.2011.01844.x
Lefcheck, J. S. (2016). piecewiseSEM: Piecewise structural equation modelling in r for ecology, evolution, and systematics. Methods Ecol. Evol. 7, 573–579. doi: 10.1111/2041-210X.12512
Lehman, C. L., and Tilman, D. (2000). Biodiversity, stability, and productivity in competitive communities. Am. Nat. 156, 534–552. doi: 10.1086/303402
Liang, M., Liang, C., Hautier, Y., Wilcox, K. R., and Wang, S. (2021). Grazing-induced biodiversity loss impairs grassland ecosystem stability at multiple scales. Ecol. Lett. 24, 1–11. doi: 10.1111/ele.13826
Loreau, M., Barbier, M., Filotas, E., Gravel, D., Isbell, F., Miller, S. J., et al. (2021). Biodiversity as insurance: from concept to measurement and application. Biol. Rev. 96, 2333–2354. doi: 10.1111/brv.12756
Mortensen, B., Danielson, B., Harpole, W. S., Alberti, J., Arnillas, C. A., Biederman, L., et al. (2018). Herbivores safeguard plant diversity by reducing variability in dominance. J. Ecol. 106, 101–112. doi: 10.1111/1365-2745.12821
Muraina, T. O., Xu, C., Yu, Q., Yang, Y., Jing, M., Jia, X., et al. (2021). Species asynchrony stabilises productivity under extreme drought across Northern China grasslands. J. Ecol. 109, 1665–1675. doi: 10.1111/1365-2745.13587
Muthoni, F. K., Groen, T. A., Skidmore, A. K., and van Oel, P. (2014). Ungulate herbivory overrides rainfall impacts on herbaceous regrowth and residual biomass in a key resource area. J. Arid Environ. 100–101, 9–17. doi: 10.1016/j.jaridenv.2013.09.007
Nakagawa, S., Johnson, P. C. D., and Schielzeth, H. (2017). The coefficient of determination R2 and intra-class correlation coefficient from generalized linear mixed-effects models revisited and expanded. J. R. Soc. Interface 14, 1–11. doi: 10.1098/rsif.2017.0213
Odadi, W. O., Karachi, M. K., Abdulrazak, S. A., and Young, T. P. (2013). Protein supplementation reduces non-grass foraging by a primary grazer. Ecol. Appl. 23, 455–463. doi: 10.1890/12-0878.1
Peterson, C. H. (1975). Stability of Species and of Community for the Benthos of two Lagoons. Ecology 56, 958–965. doi: 10.2307/1936306
Porensky, L. M., Derner, J. D., Augustine, D. J., and Milchunas, D. G. (2017). Plant community composition after 75 Yr of sustained grazing intensity treatments in shortgrass steppe. Rangel. Ecol. Manag. 70, 456–464. doi: 10.1016/j.rama.2016.12.001
Porensky, L. M., Mueller, K. E., Augustine, D. J., and Derner, J. D. (2016). Thresholds and gradients in a semi-arid grassland: long-term grazing treatments induce slow, continuous and reversible vegetation change. J. Appl. Ecol. 53, 1013–1022. doi: 10.1111/1365-2664.12630
Porensky, L. M., Wittman, S. E., Riginos, C., and Young, T. P. (2013). Herbivory and drought interact to enhance spatial patterning and diversity in a savanna understory. Oecologia. 173, 591–602. doi: 10.1007/s00442-013-2637-4
Power, M. E. (1992). Top-Down and Bottom-Up Forces in Food Webs : Do Plants Have Primacy. Ecology. 73, 733–746. doi: 10.2307/1940153
Qin, J., Ren, H., Han, G., Zhang, J., Browning, D., Willms, W., et al. (2019). Grazing reduces the temporal stability of temperate grasslands in northern China. Flora Morphol. Distrib. Funct. Ecol. Plants. 259. doi: 10.1016/j.flora.2019.151450
R Core Team. (2021). R: A language and environment for statistical computing. R Foundation for Statistical Computing, Vienna, Austria. Available online at: https://www.R-project.org/
Riginos, C., Porensky, L. M., Veblen, K. E., and Young, T. P. (2018). Herbivory and drought generate short-term stochasticity and long-term stability in a savanna understory community. Ecol. Appl. 28, 323–335. doi: 10.1002/eap.1649
Ripple, W. J., Newsome, T. M., Wolf, C., Dirzo, R., Everatt, K. T., Galetti, M., et al. (2015). Collapse of the world's largest herbivores. Sci. Adv. 1:e1400103. doi: 10.1126/sciadv.1400103
Ross, S. R. P. J., Suzuki, Y., Kondoh, M., Suzuki, K., Villa Martín, P., and Dornelas, M. (2021). Illuminating the intrinsic and extrinsic drivers of ecological stability across scales. Ecol. Res. 36, 364–378. doi: 10.1111/1440-1703.12214
Sankaran, M., Ratnam, J., and Hanan, N. P. (2004). Tree-grass coexistence in savannas revisited - Insights from an examination of assumptions and mechanisms invoked in existing models. Ecol. Lett. 7, 480–490. doi: 10.1111/j.1461-0248.2004.00596.x
Sasaki, T., and Lauenroth, W. K. (2011). Dominant species, rather than diversity, regulates temporal stability of plant communities. 166, 761–768. doi: 10.1007/s00442-011-1916-1
Schluter, D. (1984). A variance test for detecting species associations, with some example applications. Ecology 65, 998–1005. doi: 10.2307/1938071
Seddon, P. J., Griffiths, C. J., Soorae, P. S., and Armstrong, D. P. (2014). Reversing defaunation: Restoring species in a changing world. Science. 345, 406–412. doi: 10.1126/science.1251818
Shoemaker, L. G., Hallett, L. M., Zhao, L., Reuman, D. C., Wang, S., Cottingham, K. L., et al. (2022). The long and the short of it: Mechanisms of synchronous and compensatory dynamics across temporal scales. Ecology. 103, 1–14. doi: 10.1002/ecy.3650
Sitters, J., Kimuyu, D. M., Young, T. P., Claeys, P., and Olde Venterink, H. (2020). Negative effects of cattle on soil carbon and nutrient pools reversed by megaherbivores. Nat. Sustain. 3, 360–366. doi: 10.1038/s41893-020-0490-0
Stalmans, M. E., Massad, T. J., Peel, M. J. S. S., Tarnita, C. E., and Pringle, R. M. (2019). War-induced collapse and asymmetric recovery of large-mammal populations in Gorongosa National Park, Mozambique. PLoS ONE. 14, e0212864. doi: 10.1371/journal.pone.0212864
Staver, A. C., Wigley-Coetsee, C., and Botha, J. (2019). Grazer movements exacerbate grass declines during drought in an African savanna. J. Ecol. 107, 1482–1491. doi: 10.1111/1365-2745.13106
Strauss, S. Y., and Agrawal, A. A. (1999). The ecology and evolution of plant tolerance to herbivory. Trends Ecol. Evol. 14, 179–185. doi: 10.1016/S0169-5347(98)01576-6
Taylor, L. R. (1961). Aggregation, variance, and the mean. Nature. 189, 732–735. doi: 10.1038/189732a0
Thibaut, L. M., and Connolly, S. R. (2013). Understanding diversity-stability relationships: Towards a unified model of portfolio effects. Ecol. Lett. 16, 140–150. doi: 10.1111/ele.12019
Tilman, D. (1999). The ecological consequences of changes in biodiversity: a search for general principles. Ecology 80, 1455–1474. doi: 10.2307/176540
Tredennick, A. T., de Mazancourt, C., Loreau, M., and Adler, P. B. (2017). Environmental responses, not species interactions, determine synchrony of dominant species in semiarid grasslands. Ecology. 98, 971–981. doi: 10.1002/ecy.1757
Trenberth, K. E., Dai, A., Van Der Schrier, G., Jones, P. D., Barichivich, J., Briffa, K. R., et al. (2014). Global warming and changes in drought. Nat. Clim. Chang. 4, 17–22. doi: 10.1038/nclimate2067
Valencia, E., de Bello, F., Galland, T., Adler, P. B., Lep,š, J., E.-,Vojtkó, A., et al. (2020). Synchrony matters more than species richness in plant community stability at a global scale. Proc. Natl. Acad. Sci. U. S. A. 117, 24345–24351. doi: 10.1073/pnas.1920405117
Van Langevelde, F., Van De Vijver, C. A. D. M., Kumar, L., Van De Koppel, J., De Ridder, N., Van Andel, J., et al. (2003). Effects of fire and herbivory on the stability of savanna ecosystems. Ecology. 84, 337–350. doi: 10.1890/0012-9658(2003)084[0337:EOFAHO]2.0.CO;2
Veblen, K. E., Porensky, L. M., Riginos, C., and Young, T. P. (2016). Are cattle surrogate wildlife? Savanna plant community composition explained by total herbivory more than herbivore type. Ecol. Appl. 26, 1610–1623. doi: 10.1890/15-1367.1
Wells, H. B. M., Porensky, L. M., Veblen, K. E., Riginos, C., Stringer, L. C., Dougill, A. J., et al. (2021). At high stocking rates, cattle do not functionally replace wild herbivores in shaping understory community composition. Ecol. Appl. 32:e2520. doi: 10.1002/eap.2520
Xu, Z., Ren, H., Li, M. H., Van Ruijven, J., Han, X., Wan, S., et al. (2015). Environmental changes drive the temporal stability of semi-arid natural grasslands through altering species asynchrony. J. Ecol. 103, 1308–1316. doi: 10.1111/1365-2745.12441
Yachi, S., and Loreau, M. (1999). Biodiversity and ecosystem productivity in a fluctuating environment: The insurance hypothesis. Proc. Natl. Acad. Sci. U. S. A. 96, 1463–1468. doi: 10.1073/pnas.96.4.1463
Yang, Z., Zhang, Q., Su, F., Zhang, C., Pu, Z., Xia, J., et al. (2017). Daytime warming lowers community temporal stability by reducing the abundance of dominant, stable species. Glob. Chang. Biol. 23, 154–163. doi: 10.1111/gcb.13391
Ye, C., Sun, J., Liu, M., Xiong, J., Zong, N., Hu, J., et al. (2020). Concurrent and lagged effects of extreme drought induce net reduction in vegetation carbon uptake on Tibetan plateau. Remote Sens. 12:2347. doi: 10.3390/rs12152347
Young, T. P., Young, T. P., Okello, B. D., Palmer, T. M., and Palmer, T. M. (1997). KLEE: A long-term multi-species herbivore exclusion experiment in Laikipia, Kenya. African J. Range Forage Sci. 14, 94–102. doi: 10.1080/10220119.1997.9647929
Zelnik, Y. R., Arnoldi, J.-F., and Loreau, M. (2018). The impact of spatial and temporal dimensions of disturbances on ecosystem stability. Front. Ecol. Evol. 6, 1–10. doi: 10.3389/fevo.2018.00224
Keywords: biotic stability mechanisms, bottom-up and top-down control, portfolio effect, compensatory dynamics, population stability, asynchronous dynamics
Citation: Ebel CR, Case MF, Werner CM, Porensky LM, Veblen KE, Wells HBM, Kimuyu DM, Langendorf RE, Young TP and Hallett LM (2022) Herbivory and Drought Reduce the Temporal Stability of Herbaceous Cover by Increasing Synchrony in a Semi-arid Savanna. Front. Ecol. Evol. 10:867051. doi: 10.3389/fevo.2022.867051
Received: 31 January 2022; Accepted: 26 May 2022;
Published: 27 June 2022.
Edited by:
Yuval Zelnik, Swedish University of Agricultural Sciences, SwedenReviewed by:
Katya Jay, University of Colorado Boulder, United StatesFrances Siebert, North-West University, South Africa
Allan Sebata, National University of Science & Technology, Zimbabwe
Copyright © 2022 Ebel, Case, Werner, Porensky, Veblen, Wells, Kimuyu, Langendorf, Young and Hallett. This is an open-access article distributed under the terms of the Creative Commons Attribution License (CC BY). The use, distribution or reproduction in other forums is permitted, provided the original author(s) and the copyright owner(s) are credited and that the original publication in this journal is cited, in accordance with accepted academic practice. No use, distribution or reproduction is permitted which does not comply with these terms.
*Correspondence: Carmen R. Ebel, Y2ViZWwyQHVvcmVnb24uZWR1