 Nicolas Leroux1,2*†
 François-Étienne Sylvain1,2†
 Eric Normandeau2†
 Aleicia Holland3
 Adalberto Luis Val4†
 Nicolas Derome1,2†
- 1Department of Biology, Laval University, Quebec City, QC, Canada
- 2Institut de Biologie Intégrative et des Systèmes, Quebec City, QC, Canada
- 3Department of Environment and Genetics, Centre for Freshwater Ecosystems, Wodonga, VIC, Australia
- 4Laboratory of Ecophysiology and Molecular Evolution, Brazilian National Institute for Research of the Amazon, Manaus, Brazil
Lowland central Amazonia is characterized by heterogeneous riverscapes dominated by two chemically divergent water types: black (ion-poor, rich in dissolved organic carbonate and acidic) and white (rich in nutrient and turbid) waters. Recent phylogeographic and genomic studies have associated the ecotone formed by these environments to an ecologically driven genetic divergence between fish present in both water types. With the objective of better understanding the evolutionary forces behind the central Amazonian teleostean diversification, we sampled 240 Mesonauta festivus from 12 sites on a wide area of the Amazonian basin. These sites included three confluences of black and white water environments to seek for repeated evidences of ecological divergence at the junction of these ecotones. Results obtained through our genetic assessment based on 41,268 single nucleotide polymorphism (SNPs) contrast with previous findings and support a low influence of diverging water physicochemical characteristics on the genetic structuration of M. festivus populations. Conversely, we detected patterns of isolation by downstream water current and evidence of past events of vicariance potentially linked to the Amazon River formation. Using a combination of population genetics, phylogeographic analysis and environmental association models, we decomposed the spatial and environmental genetic variances to assess which evolutionary forces shaped inter-population differences in M. festivus’ genome. Our sampling design, comprising three confluences of black and white water rivers, supports the main role of evolution by allopatry. While an ecologically driven evolution admittedly played a role in Amazonian fish diversification, we argue that neutral evolutionary processes explain most of the divergence between M. festivus populations.
Introduction
The neotropical region hosts the most diverse freshwater fish fauna in the world, with estimates varying from 6,000 to 8,000 different fish species (Reis, 2013). While knowledge of its diversity is central for its conservation (Beheregaray et al., 2015), this megadiverse region is understudied and studies investigating the evolutionary history of South American fish are still scarce. Multiple speciation hypotheses have been constructed based on a mix of geologic, phenotypic and genetic data (Hubert et al., 2007; Ríos-Villamizar et al., 2013; Bragança and Costa, 2018). Ecological speciation, the evolution of new species from populations affected by an ecologically driven divergent natural selection (Schluter, 2001, 2009; Rundle and Nosil, 2005), and allopatric speciation, the evolution of new species by vicariance events leading to the accumulation of mutations (Yamaguchi and Iwasa, 2013), are promising hypotheses.
The first hypothesis, ecological speciation, suggests that speciation of lowland central Amazonian fish species is based on the presence of very heterogeneous Amazonian aquatic ecosystems resulting from two water types with contrasting chemistry. White water has a cloudy appearance caused by a large amount of silicate in suspension. Also, it has a lower amount of dissolved organic carbonate, a circumneutral pH and contains a higher quantity of ions than black water which is rich in DOC, acidic and ion-poor. For instance, conductivity at 20°C for black water is close to 8 vs. 70 μS/cm for white water. In the same way, the pH for black water is usually lower than five, compared to seven for white water (Sioli, 1984; Val and Almeida-Val, 1995; Ríos-Villamizar et al., 2013; Holland et al., 2017). These variable parameters could represent physiological challenges for fish species (Ríos-Villamizar et al., 2013). The high dissimilarity between water types could lead to natural selection against migrants, a post-zygotic isolation which could reduce gene flow between white and black water sites (Rundle and Nosil, 2005). Additionally, the different selective pressures in each environment could lead to directional and discrete modifications in small and specific regions of the genome (Schluter, 2001; Rundle and Nosil, 2005).
The Amazonian ecological speciation hypothesis is partly based on genetic studies conducted at the confluence of the Amazon’s main tributaries, the Rio Negro (black water) and the Rio Solimões (white water) (Cooke et al., 2012a,b,c, 2014; Beheregaray et al., 2015). For instance, Cooke et al. (2012a,b,c, 2014) detected natural selection with gene flow based on the observation of a genetic divergence between Triportheus albus, Plagioscion sp., and Steatogenys elegans populations living in distinct Amazonian water types. Also, genome scan analyses (Cooke et al., 2012c,2014) and a reproductive isolation experiment (Pires et al., 2018) suggested that multiple fish species from these same two major rivers have an important genetic divergence as a result of possible ecological speciation associated with the waters contrasting environmental conditions. The conclusions of these studies tend to allocate more importance to an ecologically driven natural selection to explain the evolution of Amazonian fish and less to the relative contribution of past biogeographic processes (Roxo et al., 2012; Abreu et al., 2020). However, the sampling designs in this series of papers are based on the sampling of the same confluence of rivers, which could potentially lead to describing the same evolutionary processes by simple pseudoreplication (Cooke et al., 2012a,b,c, 2014; Beheregaray et al., 2015). By performing a similar study based on a sampling scheme considering additional crossings between the two water types, we aimed at confirming or improving the documentation of the complex ecological dynamics of the Amazonia.
The second hypothesis, speciation by allopatry, is based on speciation events having occurred in lakes or rivers isolated by geological and sea-level fluctuation events since the Pliocene (Hubert and Renno, 2006; Abreu et al., 2020). Typically, this evolutionary hypothesis assumes that isolated populations are evolving independently by genetic drift, leading to genome wide random variations of allele frequencies in separated populations. Also, this genetic divergence is linear with time, meaning that populations separated by older geological processes should be increasingly different. The Amazon has a complex but well-studied geological past which has been the source of informative and robust evolutionary hypotheses (Potter, 1997; Hoorn et al., 2010; Albert et al., 2018). Geological studies revealed that the Amazonian region was characterized by a series of connected mega-lakes from the late Miocene until ∼2.5 Mya (Campbell et al., 2006). The modern Amazon formed after the breaching of the eastern rim of the sedimentary basin resulting from the Andean uplift, which led to the now-established connection with the Atlantic Ocean (Campbell et al., 2006). The water drainage engendered strong erosion and sediment accumulations, leading to the formation of thousands of small lakes and rivers (Moreira et al., 2020). These geological records are strongly supported by terrestrial diversification processes (Ribas et al., 2012; Lynch Alfaro et al., 2015) and coincide with important sea-level fluctuation events caused by the interglacial cycles of the last 2.75 Ma, leading to temporary salt-water incursions (Berger and Loutre, 2010; Grant et al., 2019). Likewise, sedimentation and saltwater incursions are natural processes that can cause isolation of freshwater bodies, a potential vector of evolution by allopatry (Latrubesse and Franzinelli, 2005; Lovejoy et al., 2006). Consequently, events of speciation by allopatry were previously linked to the Amazon formation and to interglacial cycles that were studied through the use of mitochondrial molecular clock estimates in three fish species, i.e., Discus (Symphysodon sp.) (Farias and Hrbek, 2008), Steindachnerina sp. (Venere et al., 2008), and the miniature killifish (Fluviphylax) (Bragança and Costa, 2018).
Differentiating the effects of ecological and allopatric evolution is a complex challenge in the Amazon since water’s chemistry is naturally linked to the geological past. In this sense, the transition from black to white water (and vice versa) always originates from a geological event that shaped today’s watercourses. Given the high environmental dissimilarity and the geological past of the studied region, both evolutionary processes probably co-occurred. To decipher each evolutionary force effect, it is necessary to compare multiple black and white water boundaries to seek for repeated evidence of ecological divergence. In the presence of an ecologically driven evolution caused by water type, the similar environmental shift between populations should lead to similar directional genetic variations. These variations should be located on specific loci under selection and/or some genome-wide variations in allele frequency caused by the reduced gene flow between different water types (Rundle and Nosil, 2005). On the contrary, evolution by allopatry should show a time-related linear genetic divergence, where populations separated by an older geological process are more strongly differentiated genome wide. While loci under selection tend to coincide with habitat variations, neutral loci mostly reflect the geographical connectivity between sites (Bierne et al., 2013), requiring the independent analysis of both types of loci to detect or deny a scenario of ecological divergence. It is also difficult to distinguish the molecular signatures of ecological and allopatric evolution since the Amazonian watershed connectivity varied throughout past climate oscillations, saltwater incursions and geological events (Nores, 2004; Thom et al., 2020). Additionally, the high connectivity between rivers facilitates the migration and tends to weaken the genetic signal coming from older geological processes.
Our study aimed to test the relative influence of the two different evolutionary hypotheses (ecological and allopatric) in relation to populations of Mesonauta festivus, one of the most widespread teleosteans in the Amazon basin (Pires et al., 2015). Mesonauta festivus is a small cichlid ubiquitous to the Amazon basin. It has very low upstream migration potential, but moderate downstream migration potential since it can let itself be carried by the current (Pires et al., 2015). Additionally, M. festivus shows strong parental care investment and a high environmental tolerance, allowing the species to live under different abiotic conditions, potentially facilitating the establishment of new populations (Pires et al., 2015). Here, we used a sampling design consisting of 12 sites from the lowland central Amazon basin and comprising three black and white water river confluences to (1) assess the phylogeographic history of M. festivus in the Amazonian watershed; (2) describe the importance of the diverging water characteristics on the genotype of M. festivus; and (3) assess the relative contribution of ecological and allopatric evolutionary processes on the evolution of M. festivus at these sites. Our approach based on a combination of population genetics, phylogeographic analysis and environmental association models helped us decipher the impact of the water’s physicochemical characteristics and historical vicariance events as structuring factors for populations of M. festivus.
Materials and Methods
Experimental Design
We sampled 240 M. festivus at 12 sites distributed across three major Amazonian rivers (i.e., Rio Branco, Rio Negro, and Rio Solimões) (Figure 1). These sites comprise ecosystems with drastically divergent physicochemical parameters: five black water sites (NEG-1, NEG-2, NEG-3, NEG-4, and TEF) and seven white water sites (SOL-1, SOL-2, SOL-3, SOL-4, SOL-5, SOL-6, and BRA) (Table 1). These sites comprise three confluence zones between black and white water sites: (1) Six sampling sites were close to the confluence of two major Amazonian tributaries, the Rio Negro and Rio Solimões (NEG-3, NEG-4, SOL-3, SOL-4, SOL-5, and SOL-6); (2) three sites were close to the confluence of the Rio Branco and Rio Negro (NEG-1, NEG-2, and BRA) and (3) three sites were close to the confluence of the Rio Tefé and Rio Solimões (TEF, SOL-1, and SOL-2) (Figure 1). All sampling sites were located at small rivers or lakes directly connected to a major Amazonian River. The sites’ position and connectivity to the main network was selected to engender a negligible influence on the amount of gene flow between sites when compared to other factors considered in the study.
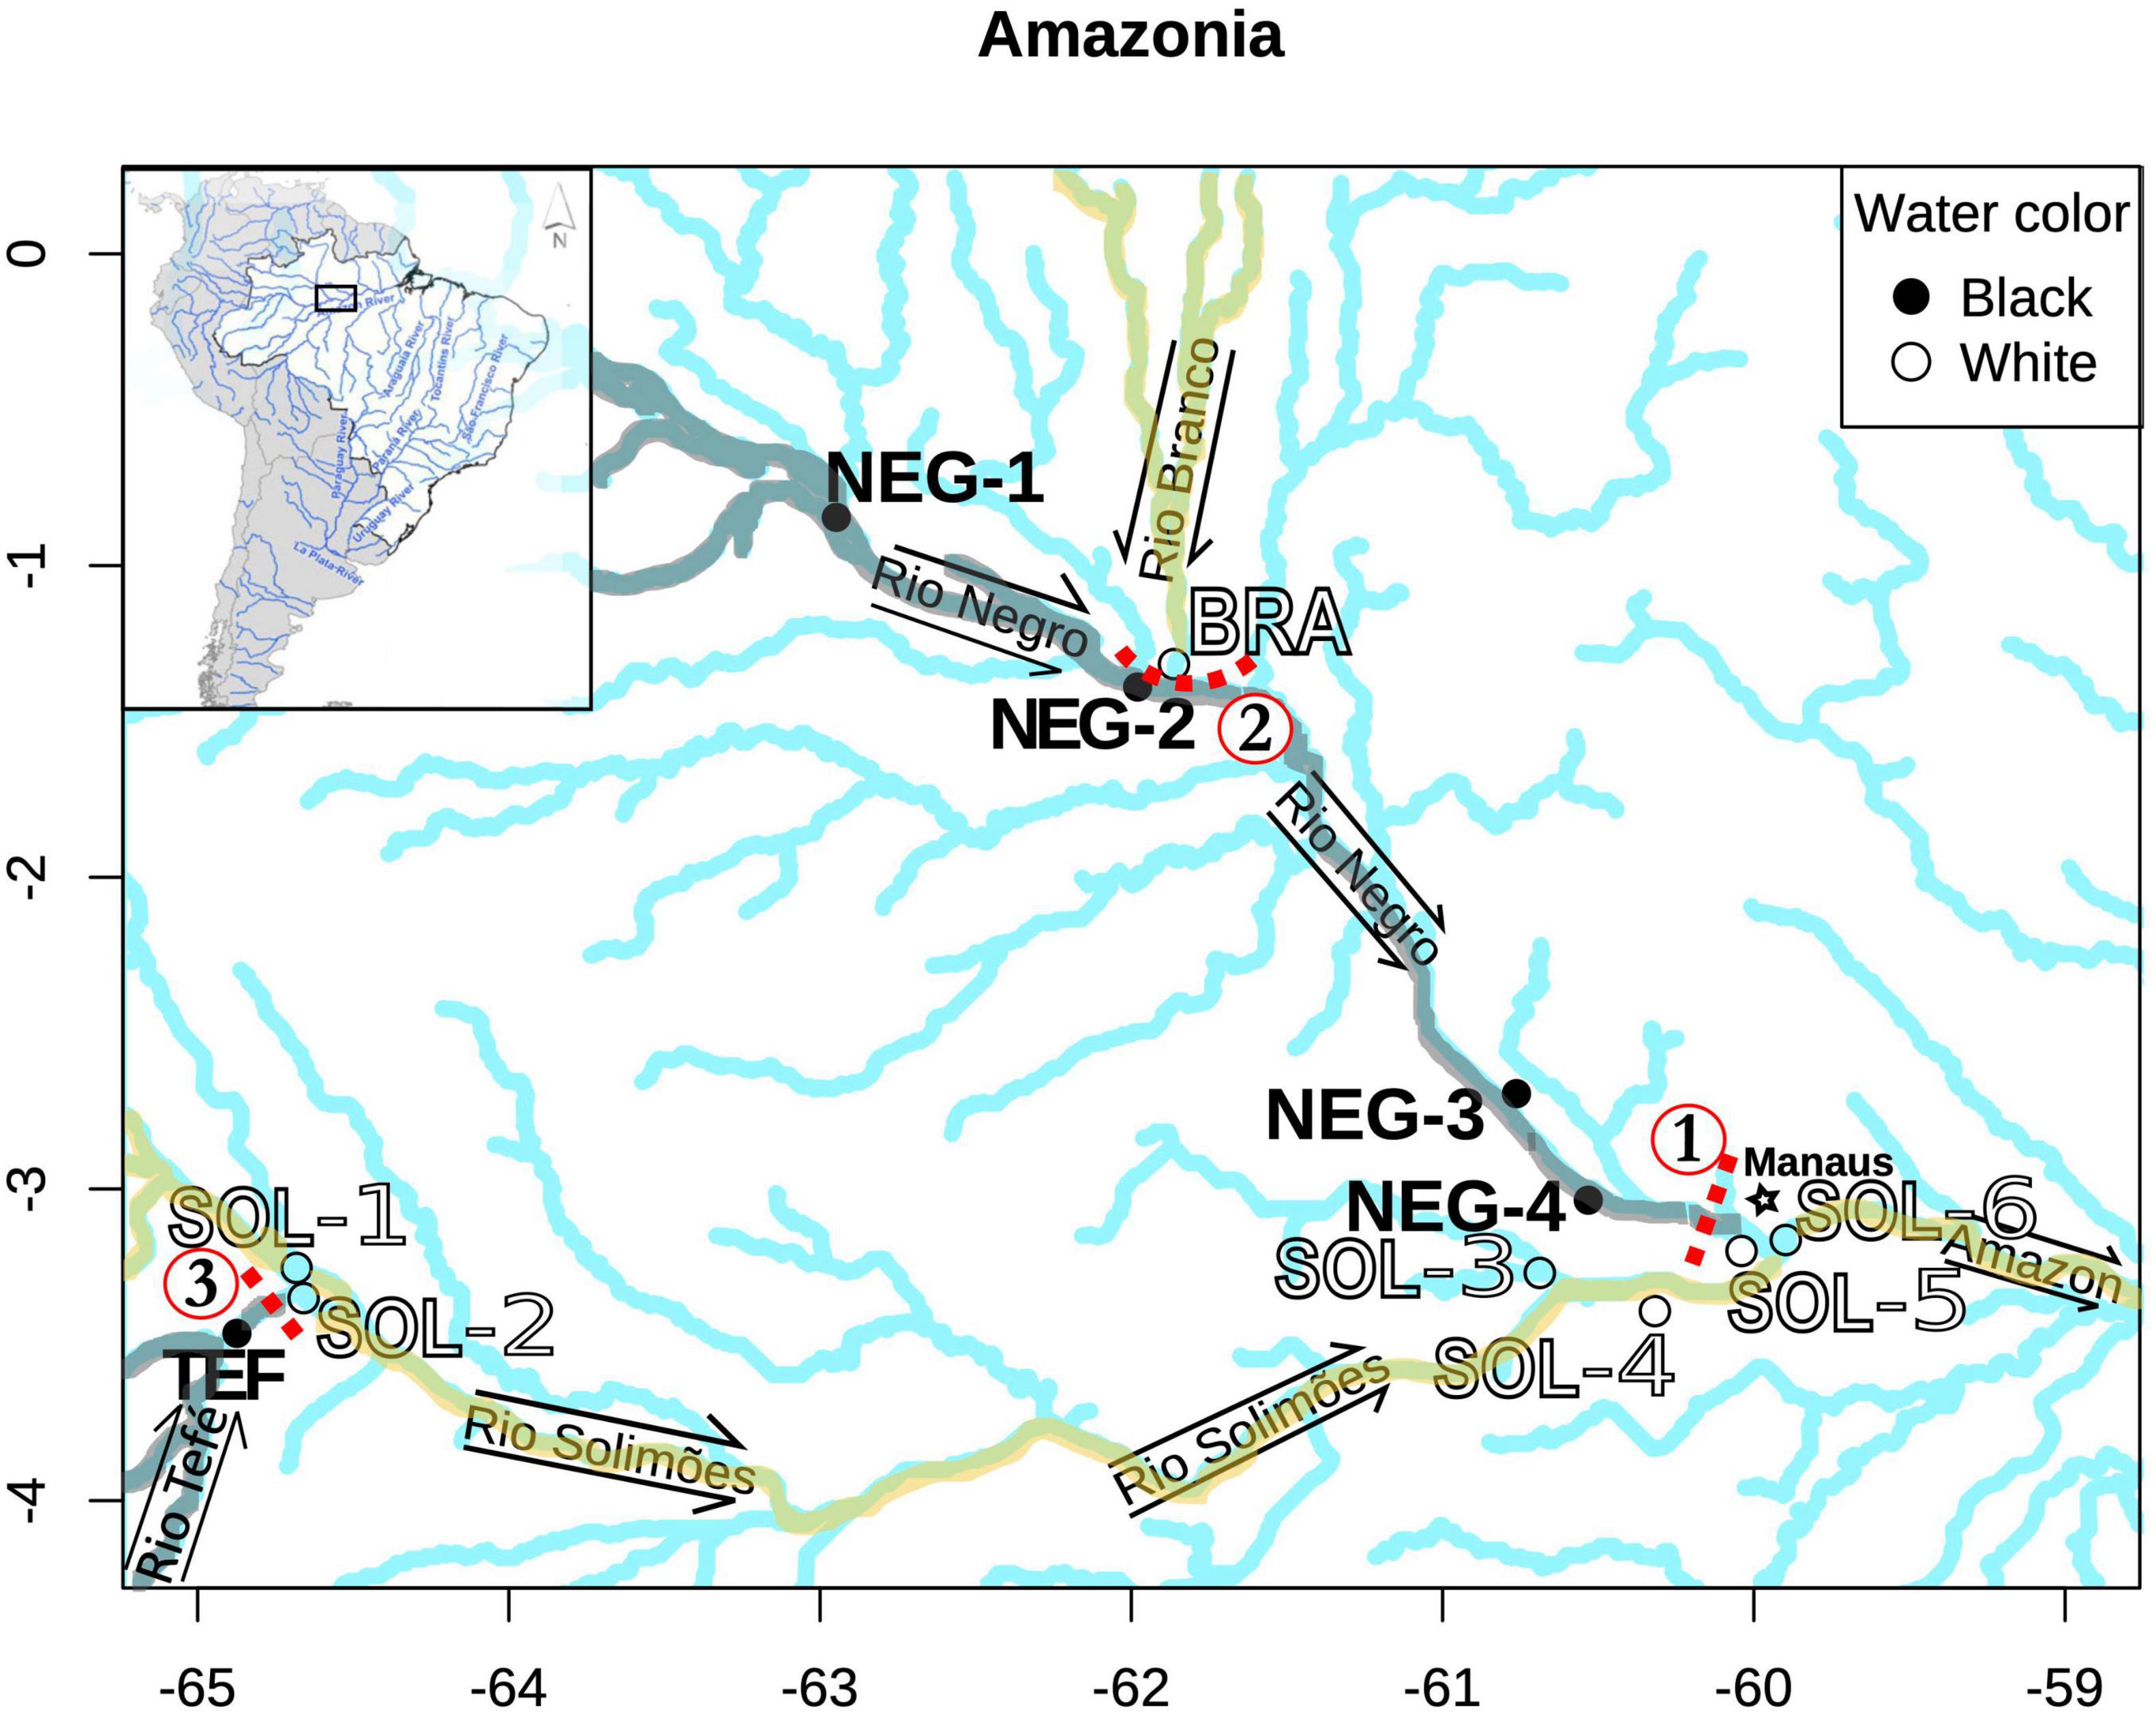
Figure 1. Location of the sampling sites (n = 12) in the Amazon basin. The four tributaries of the Amazon are labeled, and the water flow directions are identified using arrows. Rivers of interest have been highlighted according to their water type. Water is always flowing toward the East, in the direction of the Amazon. Sites have been identified using their river three letter acronym and numbered from the most upstream to downstream. Point colors are consistent with the described water type at a given site. The three genetic gaps detected in the study are also identified by red dotted lines and numbers (1–3).
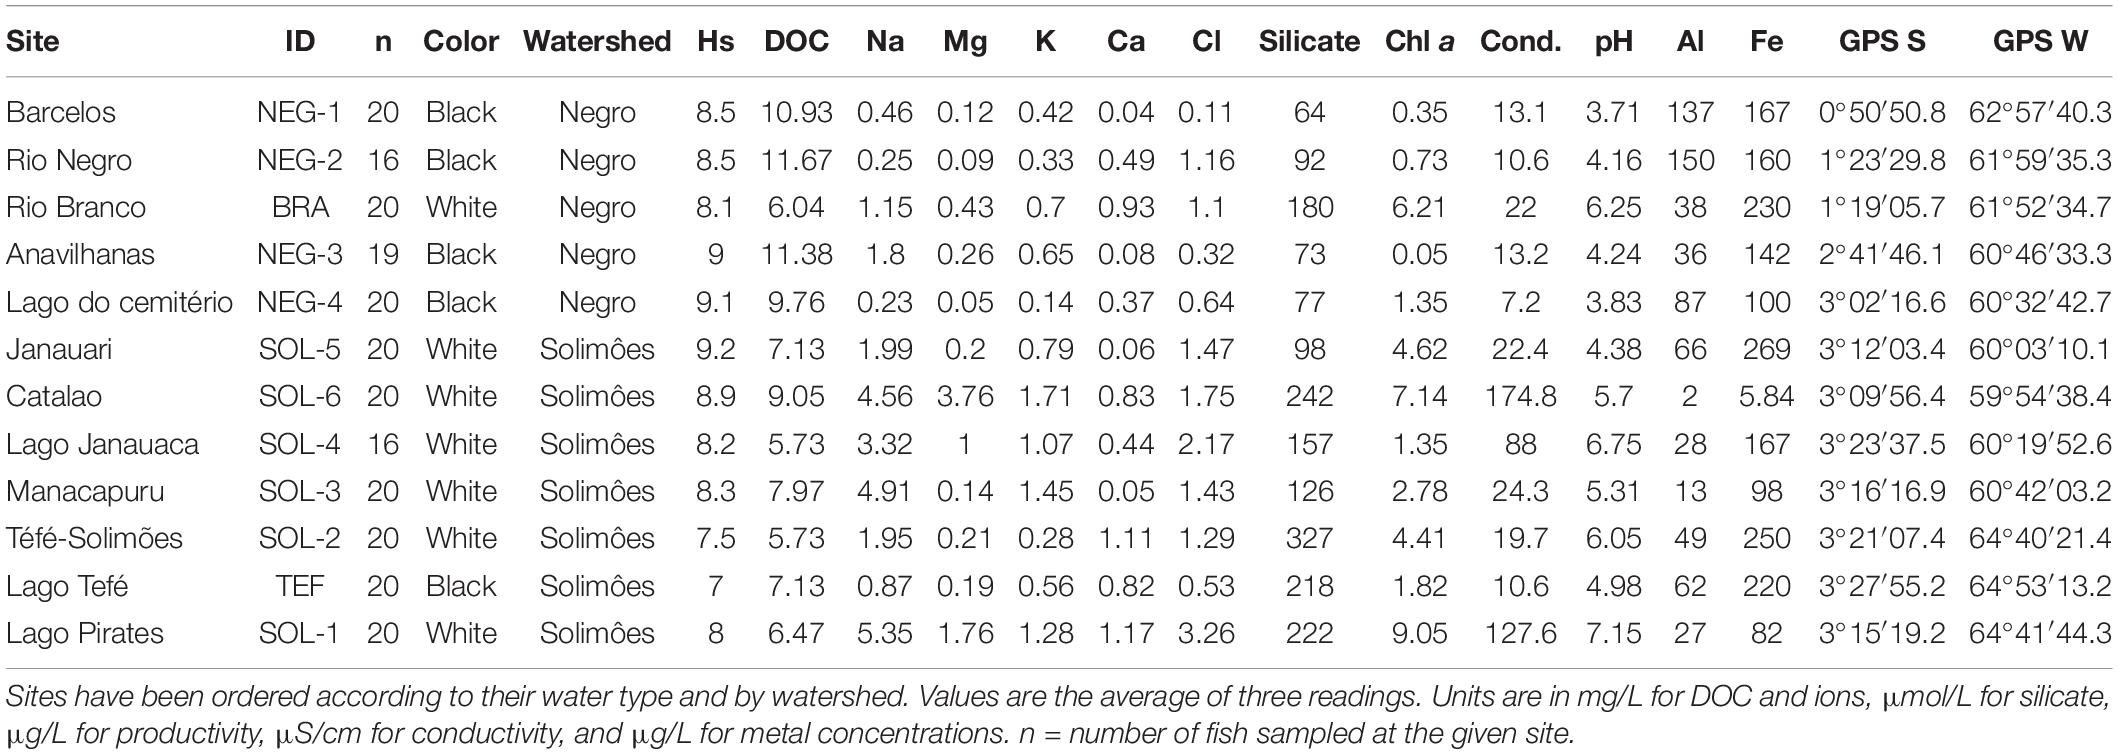
Table 1. Expected percentage of heterozygosity (Hs), dissolved organic carbon (DOC), ionic composition (Na, Mg, K, Ca, and Cl), nutrient concentration (Silicate), productivity (Chlorophyll a: Chl a), physiochemical characteristics (Conductivity: Cond and pH), total dissolved metal concentrations (Al and Fe), and Global Positioning System (GPS) coordinates (GPS S and GPS W) measured at each sampling sites (n = 12).
Field trips were conducted from September to December 2018–2019 during the dry season. Sites coordinates were recorded using the Global Positioning System (GPS) and the fishing perimeters were assessed in the field according to each site’s local geography. We estimated the watercourse distance separating each sampling site using Google Earth pro (Image Landsat/Copernicus, United States). A multiparameter YSI Professional + Series meter (YSI Inc./Xylem Inc., United States) was used to characterize water physicochemical properties (conductivity and pH) at the sites. Two liters of water were sampled at each site 30 cm below the surface, the depth where M. festivus were fished (Pires et al., 2015), to characterize other water parameters. At the laboratory, dissolved organic carbon (DOC) was quantified and characterized. The concentration of nutrients (NO2–, NO3–, and silicates), free ions (Ca, Na, Cl, Mg, and K) and 12 metals (Al, V, Cr, Mn, Fe, Co, Ni, Cu, Zn, As, Cd, and Pb) were determined according to the method detailed in Sylvain et al. (2019, 2020). All environmental parameters are the mean of three measurements and can be found in Supplementary Material.
Twenty fish specimens were collected at each sampling site using a combination of small seine net-fishing and line fishing (fish collection permit number 29837-18). Shortly after collection, the fish were euthanized using a classic MS-222 protocol to dissect a fin clip conserved in NAP buffer to preserve DNA integrity (Camacho-Sanchez et al., 2013). Samples were frozen at –20°C right after the dissection and until DNA extraction.
DNA Extraction and Sequencing
A total of 240 fin samples were collected and processed. Genomic DNA was extracted using the QIAGEN DNeasy® Blood and Tissues kit following the manufacturer’s instructions. Genomic DNA was purified with AMPure beads (Beckman Coulter Genomics), according to the manufacturer’s instructions. Double strand DNA was quantified using the Qubit® 2.0 Fluorometer. GBS libraries and sequencing were done at the IBIS Plateforme d’Analyse Génomique using Pstl and Mspl as restriction enzymes. Barcodes were ligated to digested DNA fragments and libraries were sequenced using Ion proton™ technology.
Single Nucleotide Polymorphisms Calling
The raw sequence reads were trimmed with Cutadapt (Martin, 2011) to remove the adapter sequences and sequence quality was assessed using FastQC. The sequences were extracted and trimmed to 80 bp using process_radtags in STACKS V1.5 (Catchen et al., 2013). After trimming with Cutadapt (Martin, 2011) and extracting with process_radtags, samples had an average of 2.91 (sd = 0.91) million reads (n = 231). Nine samples were discarded during the filtration process because of low-quality sequences and/or insufficient coverage. The STACKS programs for de novo Single Nucleotide Polymorphism (SNP) discovery were then run with the following filters and parameters. Firstly, we ran Ustacks considering a population size of “p = 1,” a minimum stack depth of “m = 3,” a distance allowed between stacks of “M = 3,” a maximum number of mismatches allowed of “N = 5” and activating the “disable-gapped,” “H,” and “deleverage” options. We tested multiple parameter combinations and these parameters were robust and led to a low false discovery rate for de novo SNPs discovery (Paris et al., 2017). Afterward, we allowed a distance of “n = 1” between catalog loci in Cstacks and applied the following filtration and transformation steps: Sstacks to match samples against the catalog, tsv2bam to transpose the data so it is stored by locus, gstacks to call variant sites in each population and ran populations using a “p = 4,” a “r = 0.6” and the option “vcf” to produce a variant call format (VCF) file (Rochette and Catchen, 2017). These filtration steps led to 428,095 putative SNPs across M. festivus’ genome. SNPs with heterozygosity rates higher than 0.5 were filtered out, which is considered stringent. The resulting VCF file was further filtered using the script “05_filter_vcf_fast.py” from stacks workflow1 with the following parameters: a minimum allele coverage to keep genotypes of “m = 3,” a minimum percent of genotype data per population of “percent_genotype = 60,” a maximum number of populations that can fail percent genotypes of “max_pop_fail = 0” and a minimum number of samples with rare alleles of “min_mas = 2.” In total, 41,268 SNPs were conserved after these filtration steps, keeping only non-duplicated loci and removing SNPs in linkage. Overall missing data for the dataset was 11.70%. Also, we screened for high relatedness between samples and estimated the mean heterozygosity rate at each site using the function “genetic_diff” from the library vcfR in R (Knaus and Grünwald, 2017).
Data Analysis
Mesonauta Festivus Phylogeographic History
We used ADMIXTURE, a program that estimates individual ancestry from SNP datasets (Alexander and Lange, 2011), to calculate the posterior membership probability of each sample considering two to eight genetic clusters in the dataset. Then, we selected the number of biologically significant genetic clusters present in the data based on a combination of cross-validation error values from ADMIXTURE, the goodness-of-fit (BIC) measures from the “find.cluster” function from Adegenet (Jombart, 2008) in R and the analysis of multiple membership probability plots from ADMIXTURE. According to the number of genetic clusters detected, pairwise fixation indexes (Fst) were estimated assuming four genetic clusters with the “stamppFst” function from StAMPP (Pembleton et al., 2013) in R. We produced a heatmap to illustrate the linearized Fst/(1 - Fst), as it is more adapted to detect scenarios of isolation by distance in linear landscapes like riverscapes (Rousset, 1997).
We conducted a multiple linear regression on distance matrices (MRM) (Lichstein, 2007), an extension of the partial Mantel analysis. We considered a pairwise “Fst/(1 - Fst)” matrix as the dependent variable and used four explanatory matrices: (1) a matrix with pairwise river course distances between sites for isolation by distance; (2) a matrix with pairwise environmental Euclidean distances between sites based on mean measurements of pH, concentration of dissolved organic carbonate (DOC) (mg/L), aluminum concentration (μg/L), conductivity (μS/cm), productivity (μg of Chla/L), and Silicate in suspension (μmol/L) for isolation by physicochemical characteristics; (3) a matrix indicating whether pairs of sites are from the same water type (same = 0, different = 1) for isolation by ecology and (4) a matrix indicating whether pairs of sites are connected by downstream water flow (flow-connected = 0, flow-unconnected = 1) for isolation by unidirectional downstream water currents. The linear MRM was run with 1,000 permutations to assess the significance and the power of the four explanatory variables at explaining the genetic dissimilarity between sites. To visualize the results from the MRM analysis, we produced four Mantel tests (Mantel, 1967) using the function “mantel.randtest” from the package ade4 in R to verify associations between the pairwise linearized Fst/(1 - Fst) matrix and the four explanatory matrices used in the MRM.
Environmental Association Study
Water Type Comparison Using Environmental Parameters
At each site, water type was assessed based on visual observations and literature research prior to the environmental parameters’ characterization. Using the library factoextra in R, we calculated a principal component analysis (PCA) on normalized environmental parameters, normalized as deviations from the mean, between sites. It was used to assess which environmental variables were associated with certain water types. The EAS required environmental variables not to be strongly correlated with each other. For this reason, we selected five environmental parameters not strongly associated with one another, which can differentiate black and white water sites in our study. The selected environmental parameters were the concentration of silicate in suspension (μmol/L), DOC (mg/L), conductivity (μS/cm), productivity (μg of Chla/L), and aluminum concentration (μg/L). Again, using the library factoextra, we produced a biplot to visualize the importance of these environmental parameters in the differentiation of black and white water types.
Detecting Genetic-Environment Associations
Since EAS models do not accept missing data in their genotype files, we used the ADMIXTURE most probable posterior membership probability result of each sample to impute the missing genotypes according to the procedure described on GitHub2 (Alexander and Lange, 2011). We used three proven and recently developed approaches of EAS (de Villemereuil et al., 2014; Rellstab et al., 2015; Capblancq et al., 2018; Forester et al., 2018), which correct for neutral genetic variation. This helped to detect associations between our 41,268 SNPs and the diverging environmental parameters of the five black and seven white water sites sampled. For the three EAS methods, we used the imputed SNPs dataset as the dependent variable. As explanatory variables, we used the selected normalized environmental parameters as quantitative variables and the water type as a qualitative variable (black water = 1; white water = -1).
First, a constrained ordination redundancy analysis (RDA) (Legendre and Legendre, 2012; Forester et al., 2016) was performed to detect covariation between loci and environmental predictors. We performed the RDA considering the genotype matrix as the dependent variable and the environmental parameters as explanatory variables. The covariation and multicollinearity between environmental parameters were verified, with the function “vif.cca” from vegan (Oksanen et al., 2019) in R, to ensure that the variance inflation factor was below 5 for each variable. We verified the significance of each constrained axis and plotted the RDA to assess how the samples at each site were clustering according to their respective environmental parameters. Afterward, we selected SNPs significantly associated to a given constrained axis by selecting outliers SNPs assuming 3.5 standard deviation cut-offs (two-tailed p = 0.00046). These SNPs putatively under selection were then associated to the environmental variable they most strongly correlated to. We plotted the selected SNPs to visualize their distribution according to the selected constrained axes.
Second, we used Baypass 2.1 (Gautier, 2015), a Bayesian hierarchical model based on the BayEnv model (Coop et al., 2010), to detect linear associations between environmental predictors and genetic markers. We performed the core model of Baypass 2.1 with the following parameters (-npop 12, -gfile imputed SNPs dataset, -efile environmental parameters normalized as deviations from the mean, -burnin 10000 and -pilotlenght 2500). Using a heat map, we compared the resulting covariance matrix of population allele frequencies to the linearized Fst/(1 - Fst) heat map to ensure that the neutral genetic variation was adequately computed by Baypass. Afterward, SNPs strongly associated with environmental predictors (eBPis > 1.5) in the “betail_reg_out” file were selected as putatively under selection for a given environmental variable.
Finally, we used a latent factor mixed model (LFMM2) (Caye et al., 2019), a least-squares estimation approach to detect associations between environmental predictors and genotypes. We performed the LFMM using the function “lfmm2” from the library LEA (Frichot and Francois, 2015; Caye et al., 2019) in R. We ran the function “lfmm2.test” with the genomic control activated and considered a linear model. We corrected for the neutral genetic structure by considering four latent factors based on the four genetic clusters previously detected. We verified the distribution of p-values for each predictor by plotting histograms. Afterward, we adjusted the p-value associated to each SNP using a Bonferroni correction and selected significant SNPs (p < 0.05) as putatively under selection.
These three programs have proven to be robust and correct for the neutral genetic structure (de Villemereuil et al., 2014; Rellstab et al., 2015; Capblancq et al., 2018; Forester et al., 2018). Nonetheless, we selected loci detected by at least two of the three methods to reduce the false positive rate using the function “calculate_overlap” from the package VennDiagram (Chen and Boutros, 2011) in R (de Villemereuil et al., 2014). Selected markers associated with environmental variables were extracted from the full-genotype dataset and visualized using a PCA calculated with Vegan (Oksanen et al., 2019) in R.
Results
Phylogeographic Analysis
Admixture results considering different numbers of clusters (2–4) provide compelling information about the genetic structure of the 12 sites sampled (Figure 2). When using (K = 2), the sites from Rio Negro and Rio Solimões are strongly differentiated. Only SOL-5 and SOL-6, two sites located downstream from the Rio Negro, have a weak admixture with Rio Negro sites. When using (K = 3), the two sites located upstream of the Rio Negro (NEG-1 and NEG-2) are differentiated, but still show some admixture with sites downstream (NEG-4 and NEG-3). Nevertheless, BRA does not share posterior membership probability with NEG-1 and NEG-2 even though these sites are close geographically. When using (K = 4), sites located far upstream of the Rio Solimões (SOL-2 and TEF) are differentiated from the rest of the Rio Solimões sites. But SOL-1, a site even further upstream the Rio Solimões, is not differentiated from other downstream lakes. Each subsequent increase of the K-value up to eight led to the differentiation of a new site, (K = 5) differentiates SOL-3, (K = 6) differentiates BRA, (K = 7) differentiates SOL-1, and (K = 8) differentiates SOL-5 (Supplementary Figure 1).
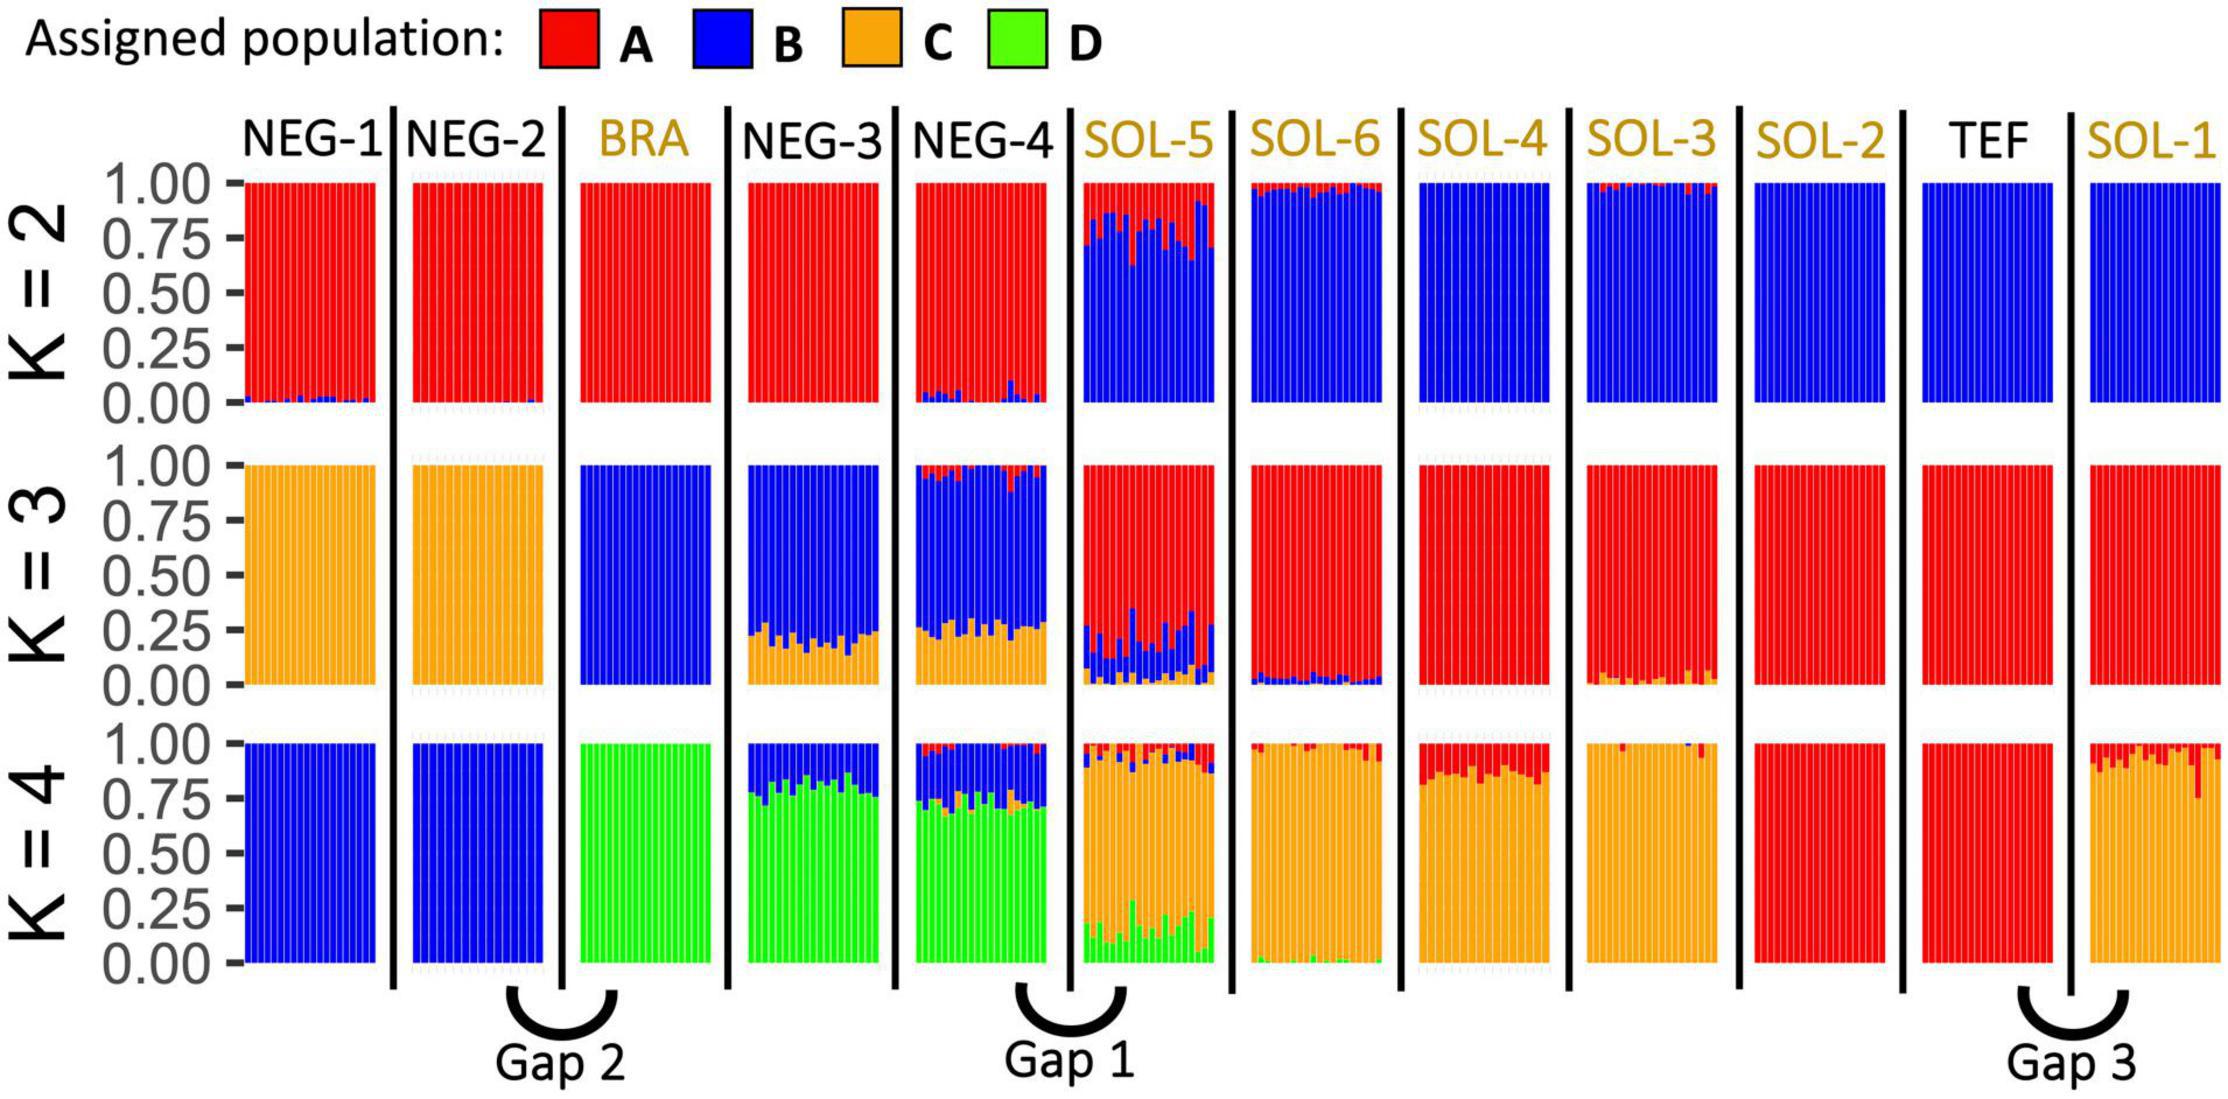
Figure 2. Posterior membership probability plots from Admixture based on the 41,268 SNPs and considering two to four genetic clusters (K). Each individual (n = 231) is represented by a single vertical line colored proportionally to its posterior membership probability to one of the four genetic clusters considered for this analysis. Samples are wrapped by sampling sites. After K = 4, only one sampling site is being differentiated from the others when increasing the K value. The three genetic gaps detected in the study are identified.
According to the results from the cross-validation error values from ADMIXTURE (Supplementary Figure 2), the optimal number of clusters for our genetic data is three. Nevertheless, this cross-validation value 0.20966 is close to the one obtained with four clusters 0.20997. The “find.cluster” function from Adegenet led to a similar result since its goodness-of-fit (BIC) values reduced more slowly at the fourth cluster (Supplementary Figure 3). Additionally, the posterior membership probability plots (Supplementary Figure 1) stopped forming biologically significant clusters after (K = 4), differentiating only one sampling site at the time when adding more clusters. For this reason, we completed the phylogeographic analysis assuming that our full SNPs dataset is represented by four genetic clusters.
According to the Admixture results (Figure 2), some sites that are close to each other are showing a strong genetic differentiation with each other. For instance, there is a first genetic gap (i.e., a disproportional genetic distance compared to the river course distance separating sites) at the confluence of the Rio Negro and Rio Solimões. Additionally, there is another second genetic gap between BRA and NEG-2, and a third one between TEF and SOL-1. These genetic gaps are detectable in every neutral population structure analysis that we have produced; the Admixture results (Figure 2) and the high pairwise Fst values (Figure 3).
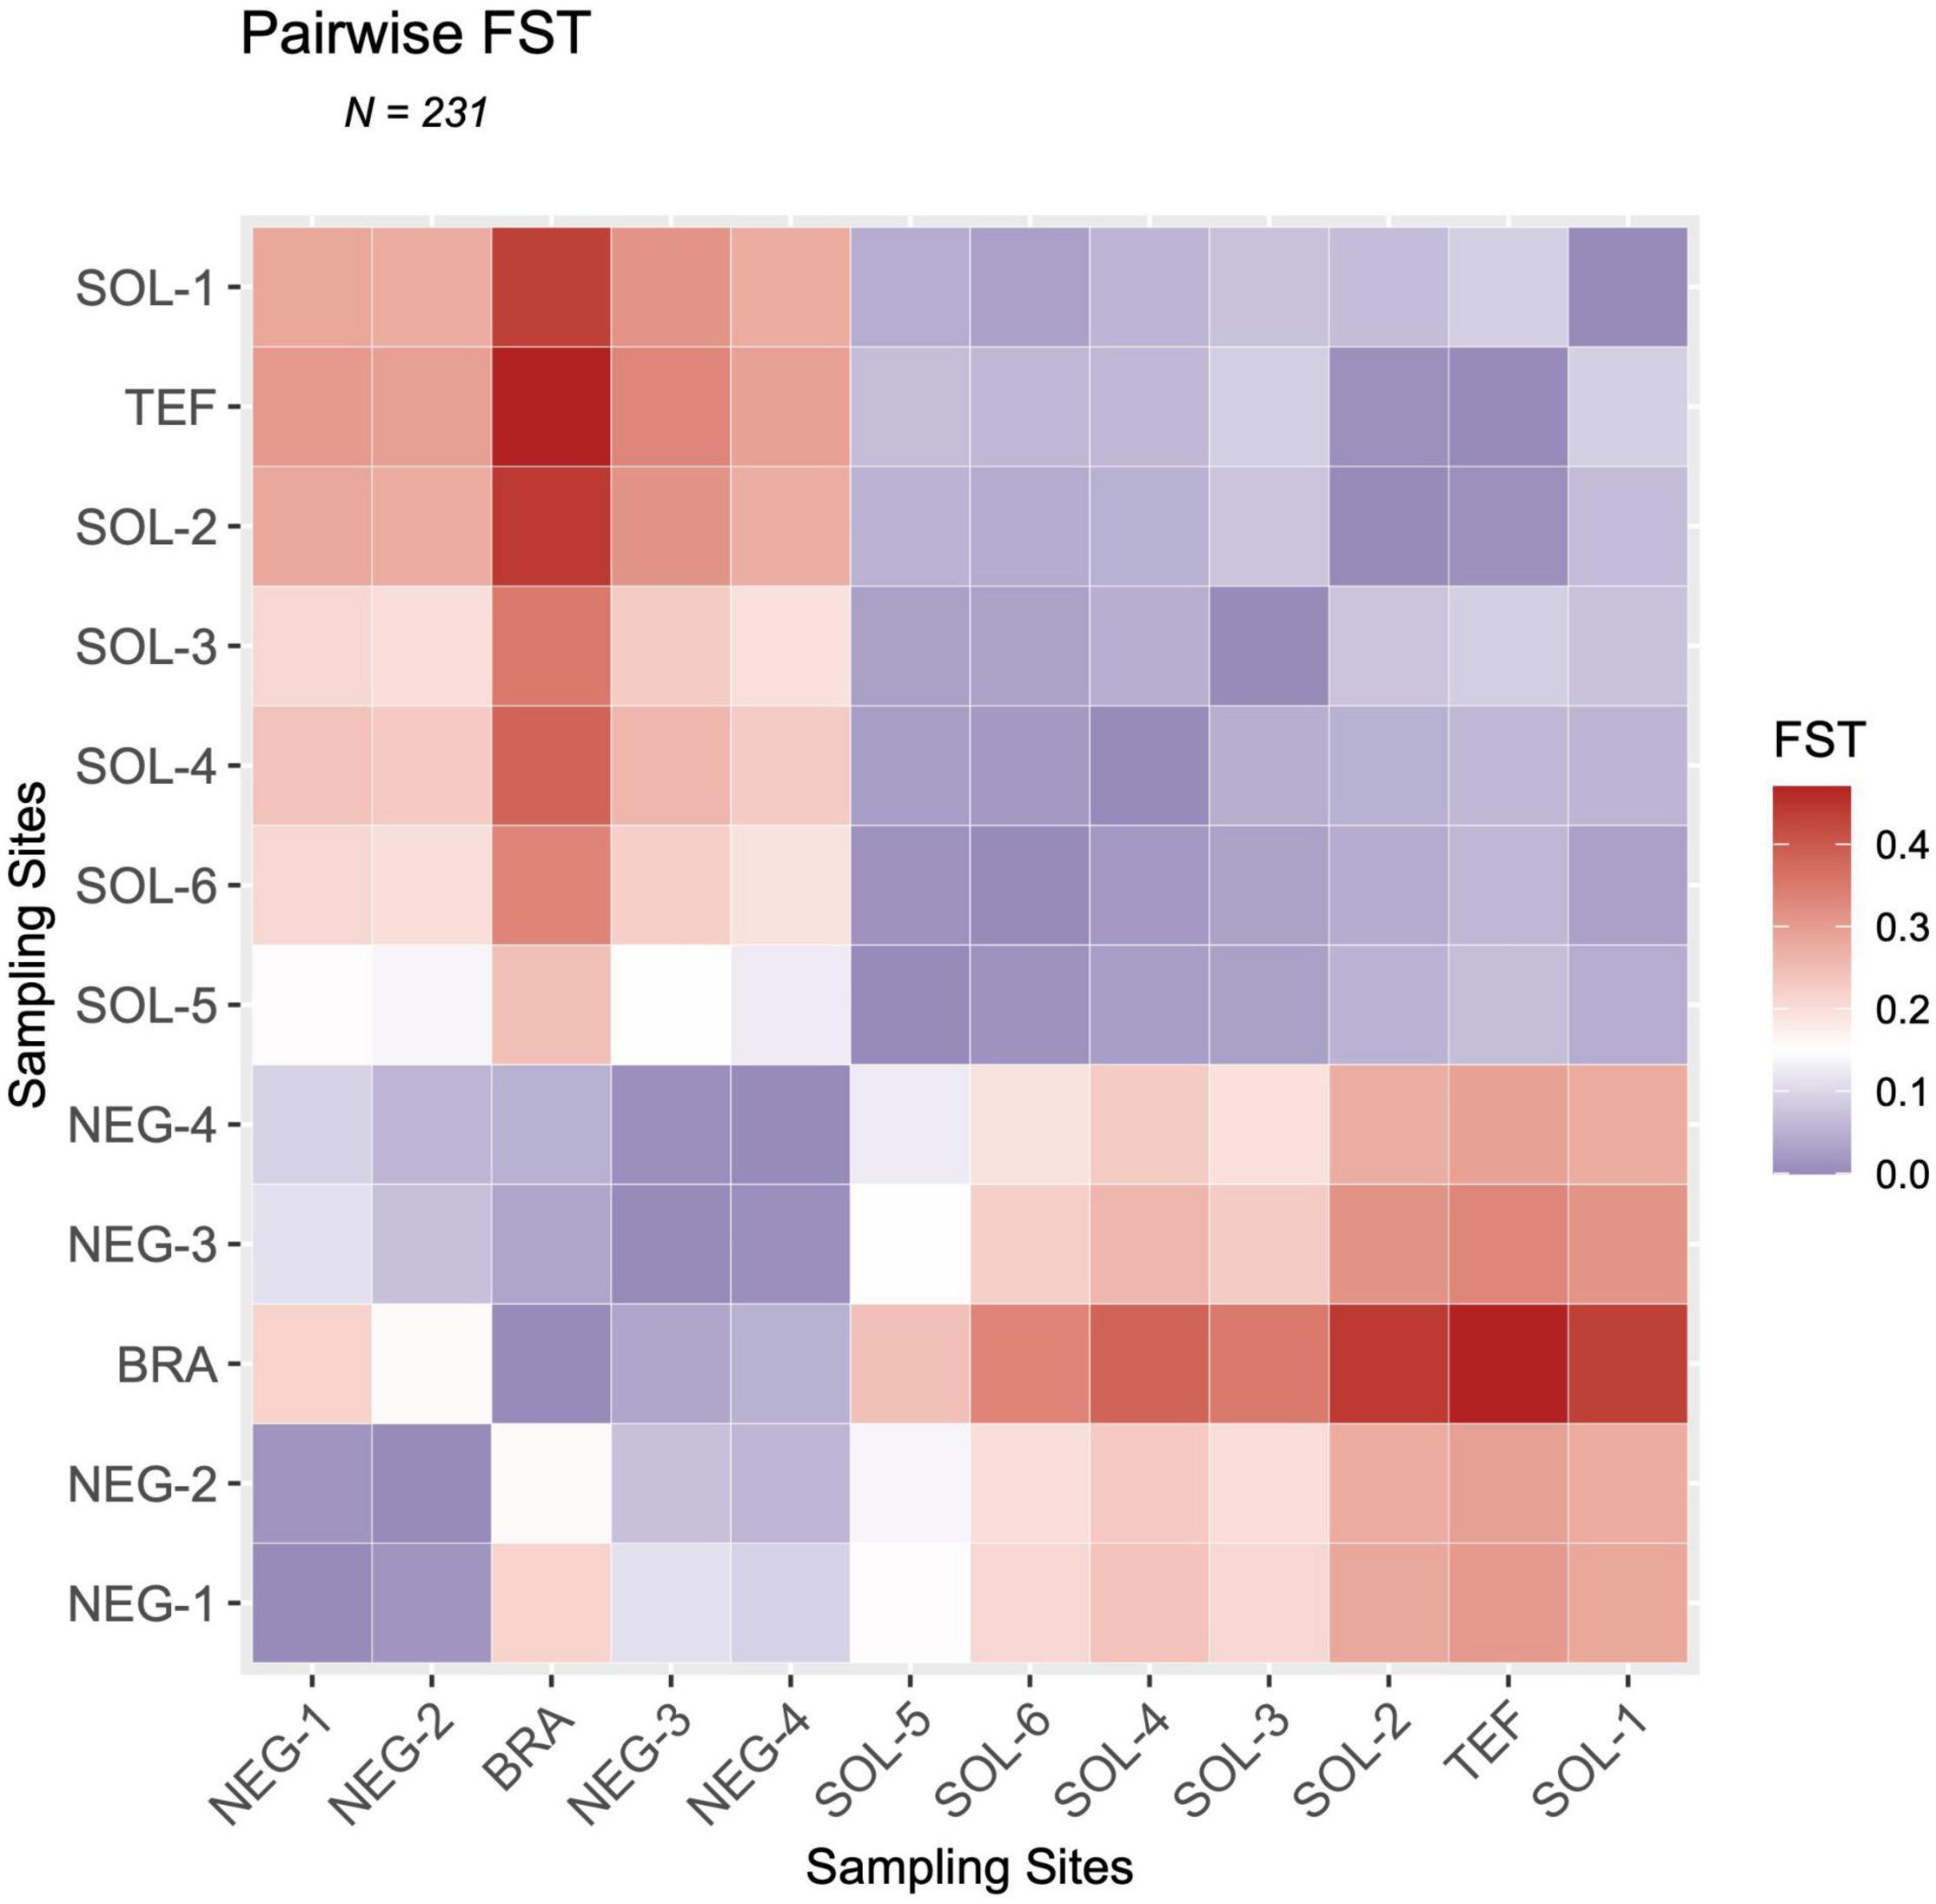
Figure 3. Pairwise Fst/(1 - Fst) heatmap of the Fst values between the 12 sampling sites of Mesonauta festivus in the Amazon basin. Fst values were estimated using the stamppFst function in R with 100 bootstraps and assuming four genetic clusters. Fst values represent the genetic differentiation between each pair of sites, a value of one meaning that the populations are completely differentiated and a value of zero meaning that they are identical. Sites were ordered according to their watershed of origin. For NEG-1, SOL-6, SOL-5, SOL-3, NEG-4, BRA, TEF, SOL-2 and SOL-1 (n = 20), for NEG-3 (n = 19), and for SOL-4 and NEG-2 (n = 16).
In the first genetic gap, white water sites were always more closely related to other white water sites, and vice versa (Figure 2). However, the inverse is observed in the second genetic gap, where BRA (white water) has a higher relatedness with NEG-3 (black water) than NEG-2 (black water) (Figures 2, 3). This migration pattern, moving downstream preferentially from white to black water, is inverse to the one observed at the Rio Negro-Solimões confluence (The first genetic gap). The third genetic gap is at the confluence of the Rio Tefé and Solimões. Effectively, the genetic distance between SOL-1 and SOL-2 is disproportionately big when compared to the small geographic distance separating the sites. Additionally, SOL-2 (white water) is more closely related to TEF (black water) than SOL-1 (white water). This result is detectable in the Admixture results (Figure 2), where SOL-1 shares a common posterior membership with other downstream Rio Solimões sites, and TEF and SOL-2 are clustered separately. However, according to the pairwise linearized Fst/(1 - Fst) heatmap, TEF and SOL-2 are similarly genetically distant as are other downstream Rio Solimões sites and SOL-1 (Figure 3).
The multiple regression on distance matrices (MRM) detected a significant association between the pairwise linearized Fst/(1 - Fst) matrix and both the river course distance (p = 0.017) and the connectivity (p = 0.001) matrices. The relations between the genetic distance and both the water type similarity matrix (p = 0.491) and the pairwise Euclidean environmental distances matrix (p = 0.237) were not significant. When using both the river course distance and the downstream connectivity matrices, 59.23% of the dependent matrix is explained by the linear model produced. According to the one-by-one Mantel tests (Supplementary Figure 4), the pairwise genetic distances between sites are moderately correlated with the pairwise river course distances (correlation coefficient of 0.56 with a p-value of 0.001). In the same way, there is a moderate correlation between the pairwise genetic distances and downstream water flow connectivity (correlation coefficient of 0.69 with a p-value of 9 × 10⁻⁵). Also, we detected a weak and near significant relationship between the genetic distances and the pairwise Euclidean environmental distances matrix (correlation coefficient of 0.24 with a p-value = 0.05), while no correlation exists between genetic distances and the water type similarity matrix (correlation coefficient of 0.21 with a p-value = 0.07).
Environmental Association Study
As seen in the physicochemical parameters biplot using the five selected environmental parameters (Figure 4), differences in water physicochemical characteristics can differentiate the two water types. Black water sites were characterized by higher DOC and Al concentrations and lower pH, while white water sites had higher amounts of silicate in suspension, as well as higher conductivity and Chl a concentration (Table 1 and Supplementary Figure 5).
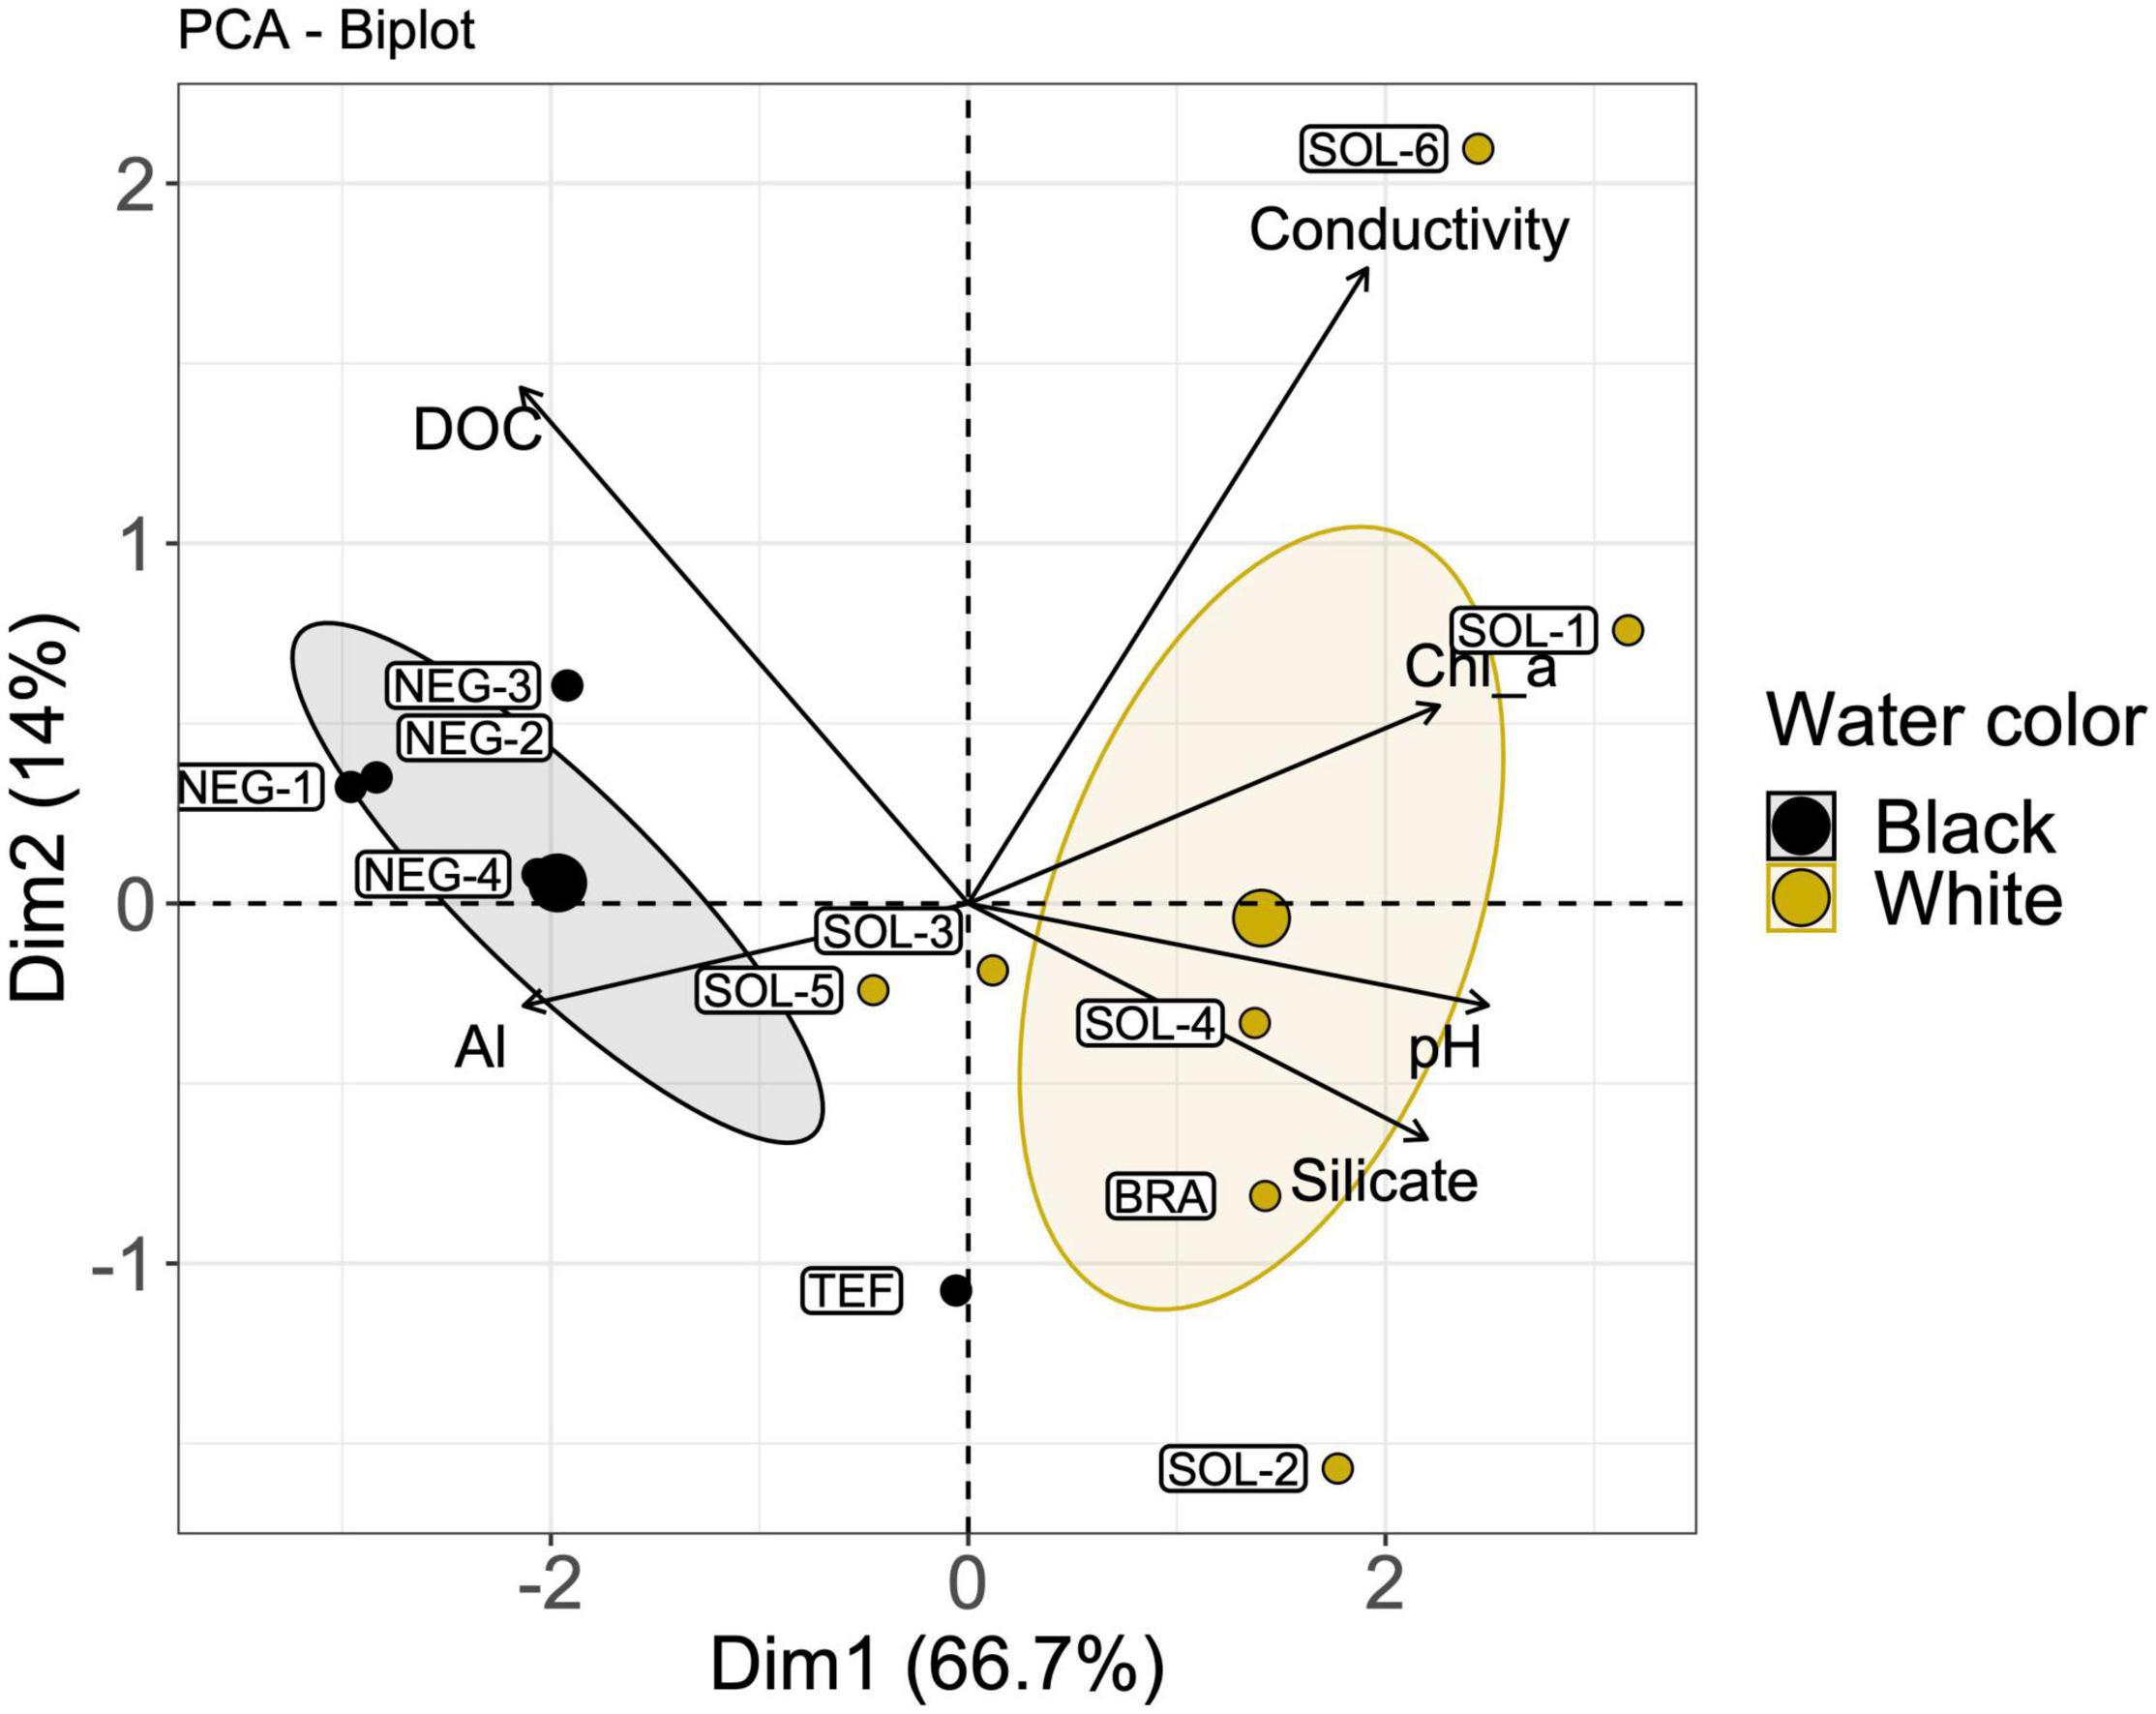
Figure 4. Biplot of the six selected environmental variables that explains most of the differences between the three water types sampled at the 12 sites of the study. Colored ellipses represent a 95% confidence interval for the two water types, with the larger circles representing the centroids (mean values) of each ellipse. The labels identify each site sampled (n = 12). Vectors length represents each variable contribution to the PCA.
All six axes of the RDA were significant (p < 0.05) and used for the detection of associations between the genotypes and environmental predictors. The corrected sum of the variance explained by the environmental predictors in the redundancy analysis is 4.93%. Sample representation in the RDA according to the explanatory variables was unrelated to their respective genetic clusters (Supplementary Figure 6). A total of 584 unique SNPs were associated to the environmental predictors in the RDA. From these, 45 were associated to aluminum concentration, 29 to productivity, 74 to conductivity, 44 to DOC concentration, 357 to silicate concentration and 35 directly to water types (Supplementary Figure 7). For Baypass2, the neutral genetic structure estimated by the program (Supplementary Figure 8) is concordant with the Fst heatmap previously produced (Figure 3). A total of 307 unique SNPs had an eBPis superior to 1.5 and were considered as putatively under selection. From these, 178 were associated to aluminum concentration, 63 to productivity, 60 to conductivity, 5 to DOC concentration, 21 to silicate concentration and 15 directly to water types. In 35 occurrences, SNPs were associated to two environmental variables. For the LFMM2, a total of 367 unique SNPs had a significant p-value after the Bonferroni correction. From these, 13 were associated to aluminum concentration, 215 to productivity, 107 to conductivity, 4 to DOC concentration, 117 to silicate concentration and 24 directly to water types (Supplementary Figure 9). From these SNPs, 172 were found in at least 2 methods and kept for the following analyses (Figure 5).
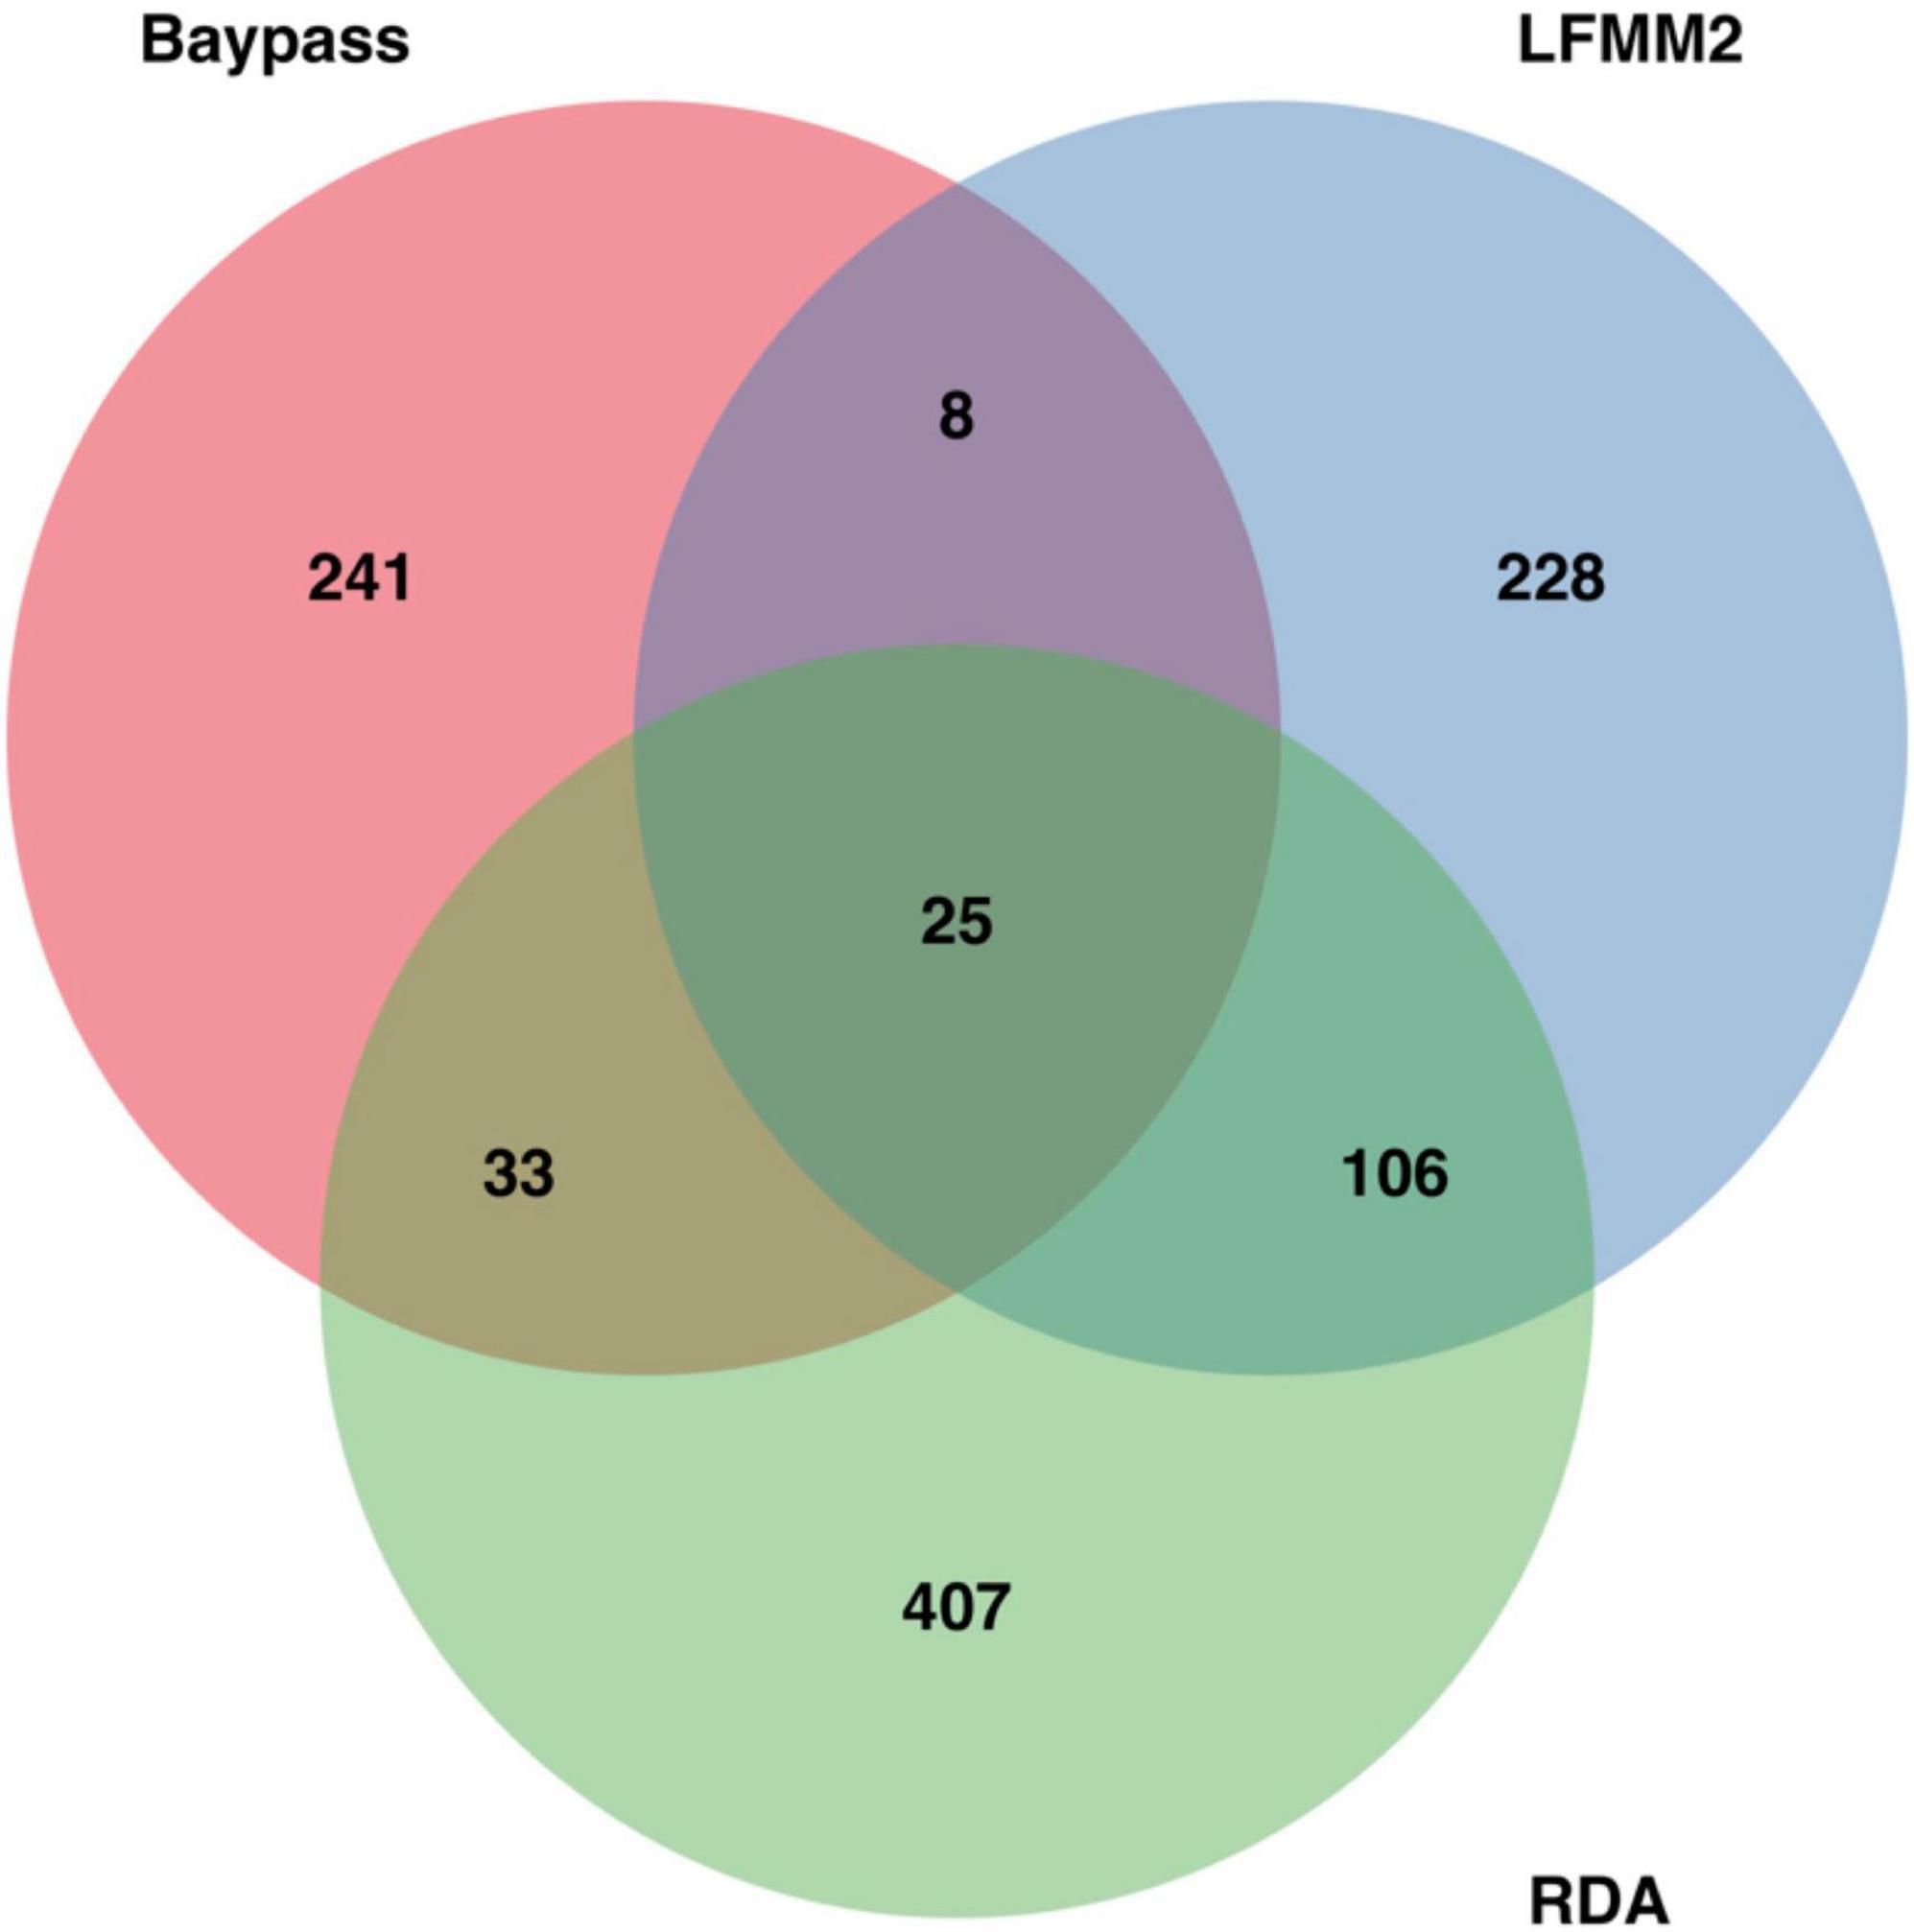
Figure 5. Venn diagram representing the number of SNPs putatively associated to environmental variables detected in the environmental association study. In total, Baypass detected 307 SNPs putatively under selection, while LFMM2 and RDA respectively detected 367 and 584 SNPs. This Venn diagram was produced using the library VennDiagram in R.
Notwithstanding, the 172 selected SNPs resulting from our EAS were not structuring the samples according to their water type. According to the PCA using the water type associated SNPs (Figure 6), samples were clustered according to their watershed of origin (Figure 6B) and not according to their water type (Figure 6C). Samples from the two main Amazonian watersheds are well-differentiated by PC1, which explains 26.56% of the variation in the genetic matrix. Additionally, BRA (white water) is clustering with black water sites from the Rio Negro (i.e., NEG-1, NEG-2, NEG-3, and NEG-4). In contrast, TEF and SOL-2 (respectively black and white water sites) seemed to be isolated from the other Solimões River sites, which is concordant with our previous results (Figures 2, 3). When compared to a PCA using the full 41,268 SNPs (Supplementary Figure 10), the general clusters stay the same. The only major difference is in the clustering of SOL-2 and TEF with the other sites from the Solimões watershed and the higher dispersion of the sites from Rio Negro along PC2. Again, the differences in water type between sites do not seem to be the main structuring factors in the data.
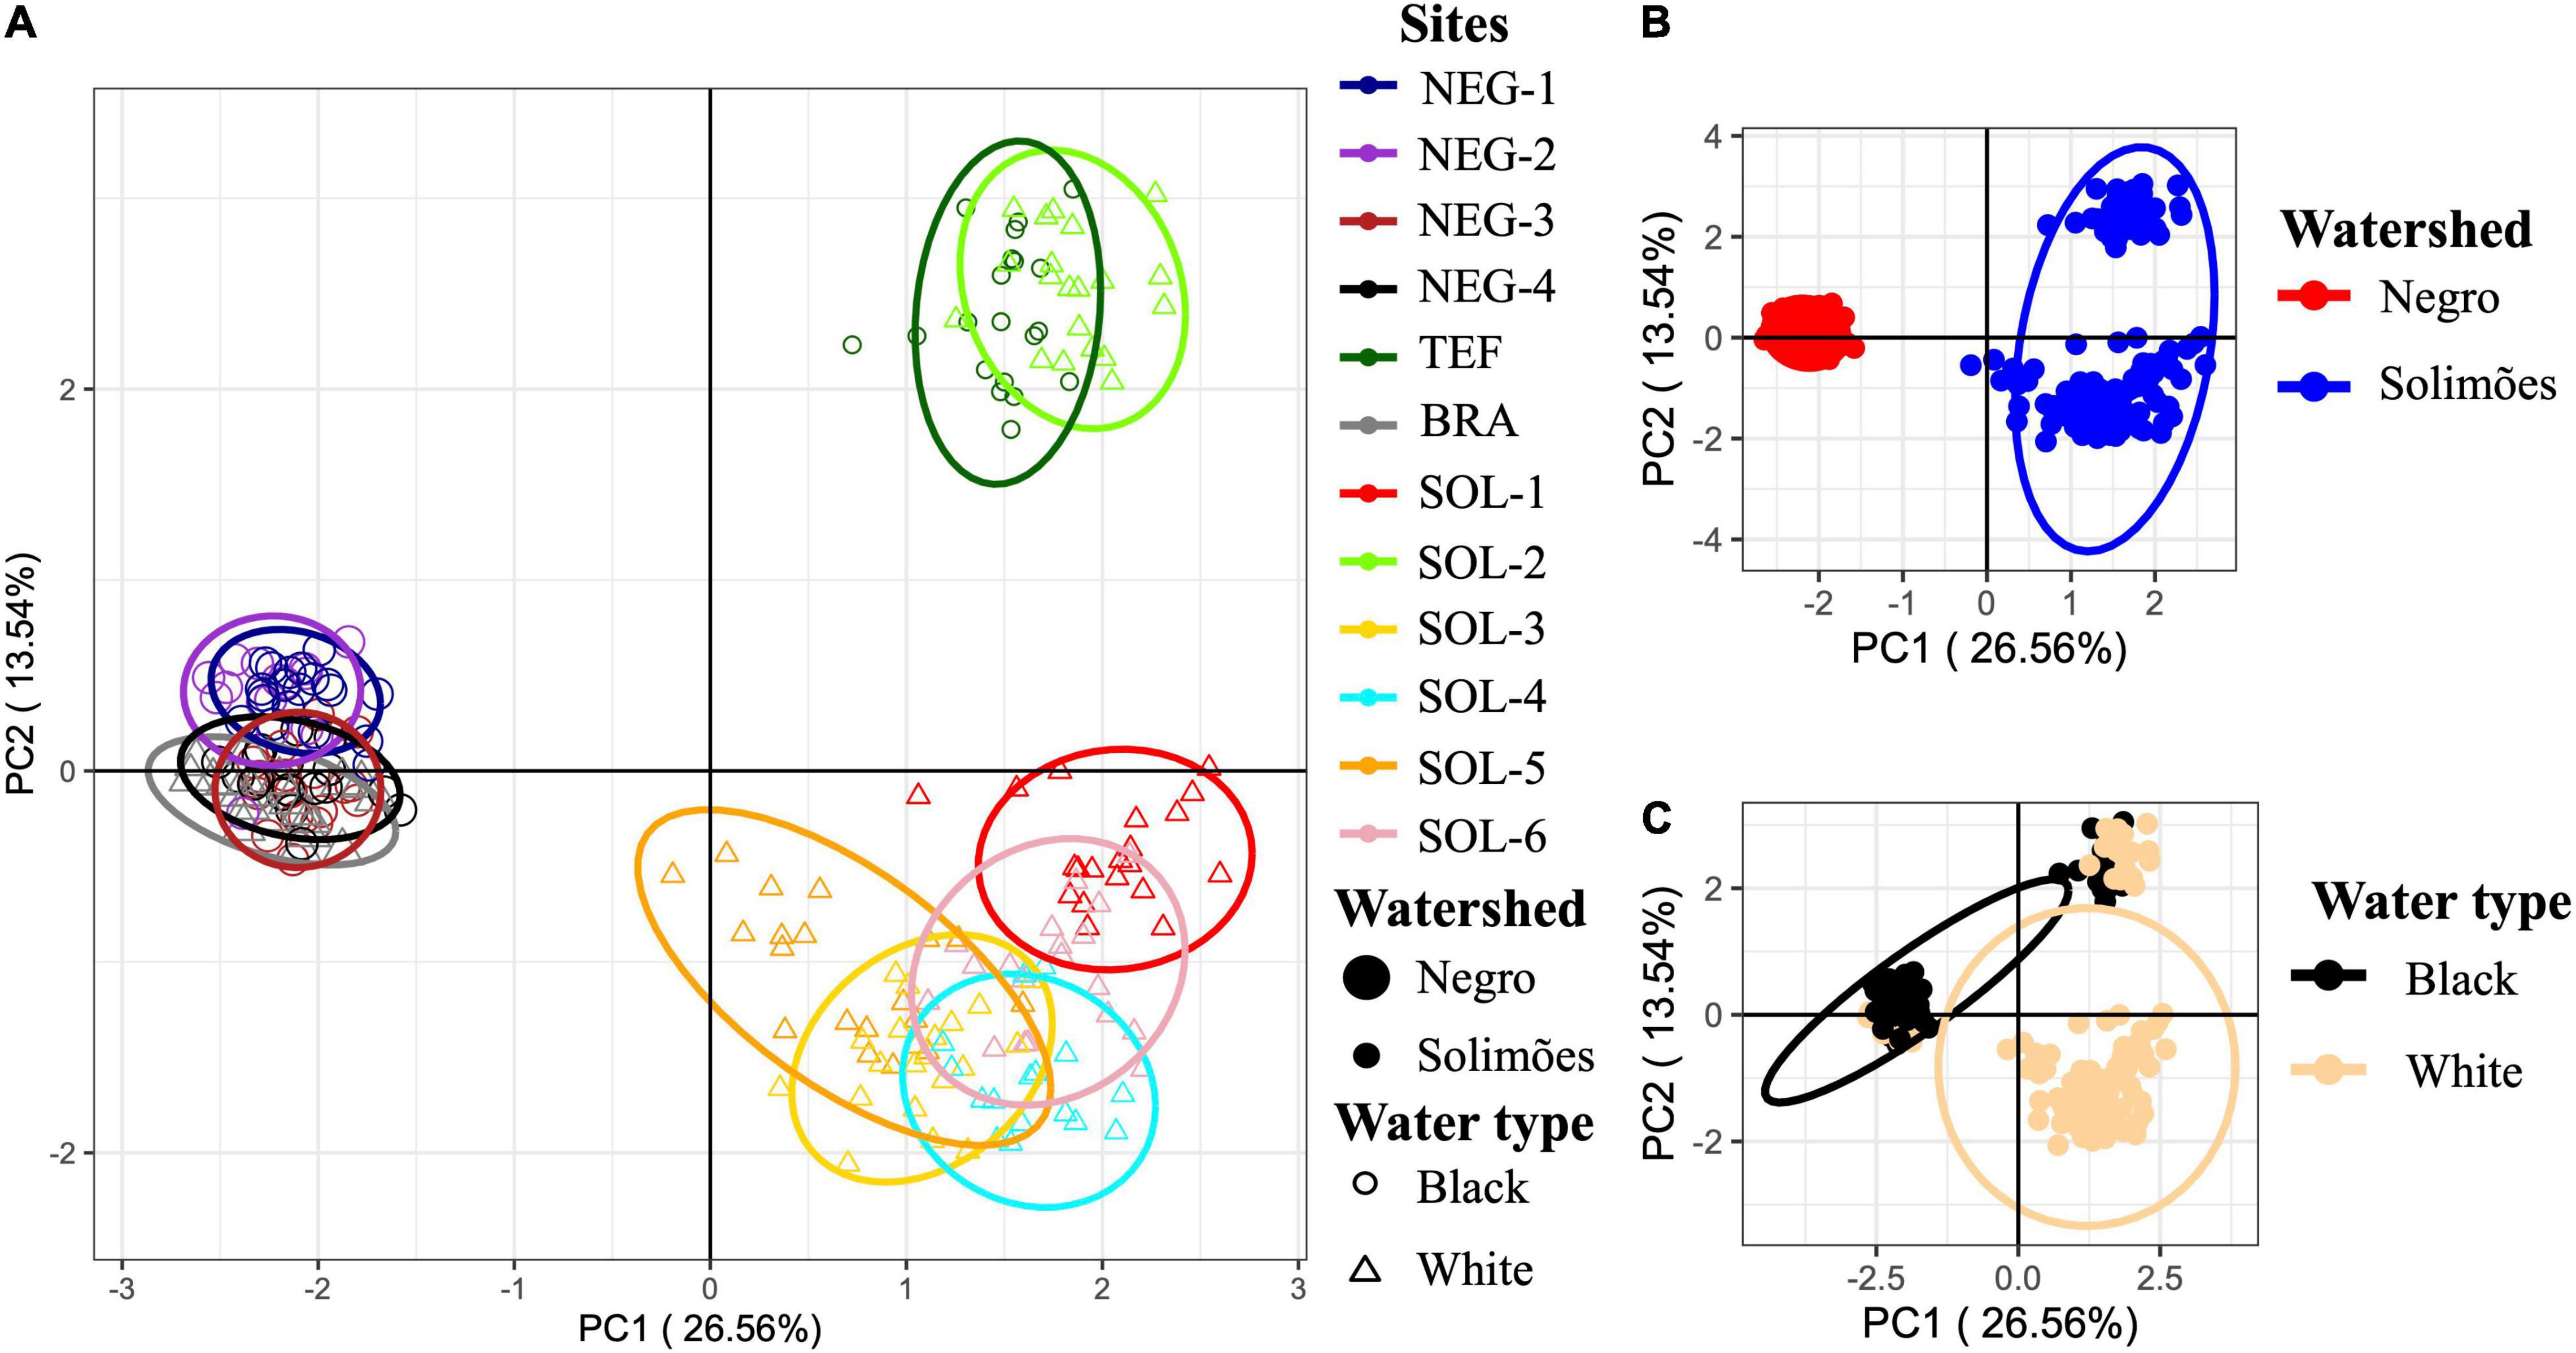
Figure 6. Principal component analysis, from black and white water sites [12 sites (n = 231)], based on the 172 SNPs associated to water type or to environmental variables associated with diverging water types. The percentage of the variance explained by the principal component’s axes are written in parentheses. Ellipses represent the 95% confidence interval of the groupings position in space. In (A), the ellipses represent the sampling site, the point size represents the site’s watershed and the point shape the site’s water type. In (B), samples are clustered by watershed, and, in (C), they are clustered by water type. See in Supplementary Figure 10 PCAs with the 41,268 SNPs, which shows a very similar clustering pattern.
Discussion
Using a genotyping by sequencing approach, we provided a robust dataset supporting the large-scale structuration of M. festivus populations by evolution through vicariance events. Our sampling design, which combined 12 sites from lowland central Amazon and 231 M. festivus samples, leads to different conclusions than those obtained from similar previous studies (Cooke et al., 2009, 2012a,b,c,2014; Beheregaray et al., 2015). Using a broader sampling design and a combination of phylogeographic and environmental association models, we show evidence that water type has low-structuring power on M. festivus populations. Instead, our results support a dominant influence of vicariance events associated with the Amazon’s formation and isolation through unidirectional downstream water currents on structuring populations of this clade.
Phylogeographic Analysis
According to the Admixture results and the Bayesian information criterion (BIC), four genetic populations were detected across our 12 sampling sites. The geographic structuring of these four genetic populations can be used to infer the phylogeographic history of M. festivus, its colonization potential and to infer the evolutionary history of closely related clades.
The first genetic group detected is formed by five Rio Solimões sites: SOL-1, SOL-3, SOL-4, SOL-5, and SOL-6. Despite the small river course distance separating them, it appears that an important genetic distance separates SOL-3, SOL-4, SOL-5, and SOL-6 from the sites sampled in the Rio Negro (Figure 2). This first genetic gap, between the Rio Negro and Solimões, has already been identified in a series of scientific papers based on similar sampling designs (Cooke et al., 2009, 2012a,b, 2014; Beheregaray et al., 2015). In these studies, this genetic gap was associated with ecological speciation, an evolutionary process caused by the presence of an ecotone like the black and white water confluence. Strikingly, fish sampled at SOL-6 are more closely related to SOL-1 than to NEG-4, located respectively at 631 and 71 km from SOL-6. Here, the genetic distances seem to be unrelated to the geographic distance, but strongly correlated to other variables such as water type differences and isolation by unidirectional downstream currents. While this result is in concordance with the ecological speciation hypothesis and the results from Cooke et al. (2009, 2012a,b, 2014), it ultimately does not lead us to the same evolutionary conclusions.
Indeed, we observed a second genetic gap at the confluence of the Negro and Branco Rivers, forming our second genetic group composed of the sites NEG-1 and NEG-2. This genetic divergence has not been recorded in previous Amazonian population genetic studies, demonstrating the advantage of using a larger sampling design. While it might be interpreted as evidence of the divergence between the black (NEG-2) and white (BRA) water types, this conjecture is refuted by the high relatedness between BRA and NEG-3. These two sites, respectively white and black water sites, are more genetically alike than NEG-2 and NEG-3, two black water sites, in the Admixture results and the Pairwise linearized Fst heatmap. This is despite the drastic environmental shift separating NEG-3 and BRA, and both sites being at a similar river course distance from NEG-3, respectively 215 and 225 km for NEG-2 and BRA. To reiterate, this result supports that gene flow is stronger between sites with different water types and that water type is not an important migration barrier for M. festivus at these sites. These genetic patterns are similar when comparing BRA and NEG-2 with NEG-4. These sites: BRA, NEG-3, and NEG-4, form the third genetic population observed.
Here, the strong genetic divergence between NEG-2 and BRA could be caused by the strong unidirectional downstream water current that prevents the migration of M. festivus from the Rio Branco to upstream of the Rio Negro and vice versa. This downstream biased gene flow could lead to a partial isolation of upstream M. festivus populations, which admix in downstream rivers. Ultimately, this should lead to a downstream increase in intraspecific genetic diversity since multiple isolated upstream populations meet at the confluence of large rivers (Paz-Vinas et al., 2015). Systematically, the sites located downstream of the main rivers (i.e., NEG-3, NEG-4, SOL-5, and SOL-6) had a higher mean heterozygosity rate than their upstream relatives (i.e., NEG-2, BRA, and SOL-3) (Table 1). In fact, the sites with the lowest heterozygosity were the ones from upstream tributaries (i.e., BRA, NEG-1, SOL-1, and TEF), which is typical in dendritic riverine systems (Brauer et al., 2018). Similarly, diversity hotspots of Amazonian freshwater fish are usually located downstream of confluences of large watercourses (Oberdorff et al., 2019). For instance, the highest total species richness is found at the confluence of the Negro and Solimões rivers and other large river confluences show similar diversity patterns. Oberdorff et al. (2019) previously observed this pattern at the Tapajós-Amazon rivers and the Branco-Negro rivers confluences. This is supporting the hypothesis of evolution by allopatry, where neutral evolutionary processes in fish populations located in isolated rivers were followed by a reconnection of the waterways and a mix of the newly formed and reproductively isolated species.
The fourth and last genetic population is formed by two sites located in the upper Rio Solimões, near the Rio Téfé: SOL-2 and TEF. The third genetic gap is located between SOL-1 and SOL-2, two sites separated by only 6 km. According to the linearized Fst/(1 - Fst) heatmap, this genetic population does not harbor an important genetic dissimilarity with the other Rio Solimões sites. Yet, the pairwise Fst Values between SOL-1 and SOL-2 are similar to Fst values with sites located more than 500 km downstream the Rio Solimões. Therefore, TEF (black water) seems to lead to higher gene flow into SOL-2 (white water) than SOL-1 (white water) does. While this result goes against the ecological speciation hypothesis, the dissimilarity between SOL-2 and SOL-1 could, again, be caused by isolation by strong downstream water currents. We selected the site SOL-2 as a site located right between SOL-1 and TEF, two sites characterized by drastically divergent environmental conditions (Table 1). It is possible that the river architecture between TEF and SOL-2 favors gene flow coming from TEF rather than from SOL-1. Either way, this again supports that water type is not an important migration barrier for M. festivus since the populations from different water types are more genetically alike to each other’s than the site from the same water type.
According to the MRM analysis results, most of the gene flow between the sampled sites happened between sites connected by downstream water flow. Higher amounts of gene flow happened between sites located close to each other, with low influence stemming from both the water type and the physicochemical characteristics of the water at each site. In this sense, the environmental dissimilarity between sites explained a low proportion of the genetic distance between sites. On the contrary, the connectivity between sites was very significant and inversely correlated to the genetic distance between sites. In the same way, sites separated by a small pairwise river course distance were more genetically related. According to these results, the high environmental dissimilarity between sites do not affect the migration rate between sites for M. festivus. Conversely, the downstream water flows connectivity and the distance between rivers seemed to play a much more important role at structuring M. festivus genetic populations.
According to our results based on neutral loci, the three genetic gaps detected are caused by a combination of isolation by strong unidirectional water currents and past evolution by allopatry between watersheds that recently reconnected. While the diverging environmental conditions must certainly have at least some effects on fish evolution, due to differences in productivity, food availability, species assemblages, environmental pressures, physiological demands, etc., we argue that isolation by strong downstream water current and past isolation by geological processes played a much more important role in shaping the genetic structure of M. festivus populations. Still, our study design is potentially better suited to detect large-scale evolutionary processes. Directional evolutionary processes likely explain small-scale differentiation in specific regions of the genome. On the contrary, neutral evolutionary processes are located across all the genome and are detected better using a large spatial scale.
Environmental Association Study
While we did not detect an important impact of the water types on the structure of M. festivus genetic populations using neutral loci, the effect of an ecologically driven change in specific allelic frequencies in presence of gene flow could still be detected using genotype to environment association models. We conducted an environment to genotype association study (EAS) aiming to identify SNPs strongly associated with selected environmental variables and directly to water type. We chose to use DOC concentration, chlorophyll a concentration, conductivity, silicate in suspension and dissolved aluminum concentration since other authors have previously employed these to characterize black and white waters (Junk et al., 2011, 2015). While a low pH has proven to be a major characteristic of the black water environment (Ríos-Villamizar et al., 2013), its strong covariation with other parameters required its exclusion from the analyses. The aforementioned parameters have a very good power at differentiating black and white water sites in our study (Figure 4). In the RDA, these environmental predictors explained 4.93% of the genetic variance between samples. This supports an influence of the measured physicochemical parameters on M. festivus genetics. But, if water type is responsible for a strong ecological divergence in our system, we expect to detect a strong pattern of differentiation between sites of different water types at the 172 SNPs associated with water type and its associated physicochemical parameters. Also, samples should not cluster according to their watershed of origin.
In a PCA, the clustering of samples according to the SNPs associated to the environment (Figure 6) is similar to the result obtained using the full dataset (Supplementary Figure 10), which is compatible with the scenario of neutral divergence in allopatry. Likewise, the dominant influence of neutral evolutionary forces, for example, mutation and genetic drift in conditions of low gene flow between certain populations, contrasts with the low influence of directional evolutionary forces in the genetic structure of environmentally associated SNPs. When clustered by watershed, samples are very well-differentiated in the PCA plot, while clustering the samples by their water type gives a much more admixed PCA plot. This suggests that the presence of divergent water types is not one of the main evolutionary factors and that neutral evolutionary processes have a much stronger impact on the differentiation of these populations. Still, we used a large spatial scale approach which favors the detection of neutral evolutionary processes at the expense of natural selection processes. The high amount of genetic drift occurring between sites located far apart potentially lead to a co-evolution between neutral and adaptative loci. This is even though we corrected for the neutral genetic structure in the three EAS methods and that there is gene flow between sites. Looking for repeated evidence of adaptative divergence based on the sampling of a gradient of physicochemical characteristics at the three confluences between black and white water would be a more powerful approach to resolve the complex evolutionary dynamic present. Also, M. festivus is documented for its high environmental tolerance which could be the result of an important phenotypic plasticity, irrespectively of its genotype at these specific genetic markers. Also, we only sampled a fraction of M. festivus’ genome and did not have access to a reference genome to map for SNPs associated with genes of interest, this result does not rule out the possibility that other genes could be positively selected in a specific water type. Doing a whole genome sequencing analysis using a reference genome could lead to the discovery of key genes affecting the survivability of M. festivus individuals in each environment. Nevertheless, when combined with other analyses included in this study, the EAS results provide additional evidence that evolution by an ecologically driven evolution did not have an important influence on the present M. festivus population structure in Amazonia.
The Roles of Vicariance and Ecological Divergence
Ecological divergence was recently proposed as a major Teleostean evolution driver in the tropics (Cooke et al., 2012b,2014). We suggest that in these cases the experimental design may have naturally led to this conclusion by the presence of an important divergence between fish populations of the Rio Negro and the Solimões. Our results, however, support that the structuring effect caused by the water type was potentially confounded with the effect of a strong unidirectional water flow at the sampled sites. Furthermore, if new sites were to be added to these past studies, they could lead to different conclusions. For instance, if we consider only the sites that were sampled by Cooke et al. (2012a,b, 2014) in our results, it leads us to very similar results and conclusions. For these papers, authors sampled the genetic gap happening at the confluence of the Rio Negro and Solimões. Our genetic data behaves identically to theirs at those sites, detecting an extensive genetic distance between the Rio Negro and Solimões populations. However, it should be noted that this series of papers focused on different species that are genetically and ecologically distant from M. festivus. It is only by including the data from sampling sites at two other black and white water confluences that we can detect evidence that adaptative divergence to specific water types has not been the main driver of population structure in M. festivus. Therefore, there seems to be a real possibility that adding new sites to Cooke’s studies would reveal a more important effect of vicariance. Nevertheless, the high environmental tolerance of M. festivus may exceed that of other species that have been previously studied. Even though these species all live under extremely divergent physicochemical conditions. This high environmental tolerance might partly explain why we did not detect evidence for ecological divergence between M. festivus populations while past studies did.
A Demographic Scenario Based on the Amazon’s Geological History
Our study detected three main genetic gaps at the confluences of: (1) the Negro and Solimões Rivers, (2) Branco and Negro Rivers, and (3) Lago Tefé and Solimões Rivers. What do these three genetic gaps have in common? First, they all represent a confluence of black and white water rivers. Second, gene flow is always going downstream, which could mean the water current is the primary driver of gene flow for M. festivus. Considering its physiology and sedentary behavior (Pires et al., 2015), strong current velocity represents an important environmental gene flow barrier for M. festivus. Additionally, there have been anecdotes of fishermen seeing M. festivus floating in high current while imitating a dead leaf (Pires et al., 2015), which could explain why there are sources of downstream gene flow over very long distances. Lastly, the three confluences result from the formation of the modern Amazon during the late Pliocene, between 2.5 Ma and 700 Ka (Campbell et al., 2006; Ribas et al., 2012).
The formation of the modern Amazon is relatively recent and has shown to be one of the main causes of the Amazonian Animalia terrestrial diversity boom (Lynch Alfaro et al., 2015; Araújo-Silva et al., 2017; Albert et al., 2018). Numerous authors support the Pleistocene refugia hypothesis, assuming that Amazonia diversity is partly due to geographic isolation caused by geological processes and salt-water incursion events (Farias and Hrbek, 2008; Bragança and Costa, 2018; da Rocha and Kaefer, 2019). Amazonian cichlids are much older, dating from the separation from their African sister clade, and have evolved mostly in riverine ecosystems (Concheiro Pérez et al., 2007). For this reason, M. festivus, a ubiquitous Cichlid species, is a good model to understand the impact of the formation of the modern Amazon on fish evolution. The modern transcontinental Amazon got established 2.5 Mya, when the west and east territories were divided in two (Campbell et al., 2006). The water drainage led to sediment accumulation, creating thousands of small lakes and rivers. The Negro and Branco Rivers were formed approximately between 1.0 and 0.7 Mya and Tefé River approximately between 2.0 and 1.0 Mya (Ribas et al., 2012). Heroine cichlids, including M. festivus, usually occur in a large geographical range and were probably present before the formation of these rivers (Reis et al., 2003). They potentially colonized the new downstream environments as they formed. As previously mentioned, M. festivus has a very good colonization potential of new environments and show strong proof of downstream migration. In this sense, the founding population of M. festivus probably came from the Andes, in the west, and admixed in multiple downstream rivers, irrespective of their water type. Likewise, the genetic gaps detected at the confluences of black and white water rivers are probably related to the formation of the rivers (geological history) rather than the confounding effect of the water type. As a result, the strong genetic divergence between the M. festivus populations of the Negro and Solimões rivers probably stems from geological processes that led to a neutral evolution by allopatry.
The low upstream migration potential of M. festivus (Pires et al., 2015) must have slowed the admixture process after the reconnection of the waterways as observed in the present watershed structures. Considering this and the similarity between our results and those from Cooke et al. (2009, 2012a,b, 2014), multiple Amazonian fish species could have evolved in these same vicariant conditions, potentially leading to the genesis of new species who could have dispersed after the connection of the waterways. In order to test whether the timing of some population divergence are linked to important geological events, it would be interesting to do a demographic analysis with a molecular clock estimate based on M. festivus mitochondrial DNA from sites positioned close to past major geological processes.
Our study aimed to investigate the support for the two mains mechanisms of speciation (ecological and allopatric) driving the evolution of M. festivus within the Amazon basin. We found strong evidence that the divergent physicochemical characteristics between black and white water have a weak structuring power on M. festivus populations in the Amazonian watershed. Unlike previous studies focusing on a single confluence between black and white water, our sampling design comprising 12 populations of M. festivus detected a genetic structure congruent with isolation by unidirectional downstream water current, past geological events, and shift in waterway connectivity. While the Brazilian Amazon supports one of the richest fish faunas on Earth, our comprehension of the evolutionary processes which shaped its biodiversity is still lacking. Understanding the origin of such richness would help us protect its diversity. We believe that our study raises interesting points that constitute a step forward in understanding these important evolutionary processes, and also provides a conceptual framework that should benefit the sampling designs of future investigations on this matter.
Data Availability Statement
The datasets presented in this study can be found in online repositories. The names of the repository/repositories and accession number(s) can be found below: https://osf.io/2j5fh/, and 10.17605/OSF.IO/2J5FH.
Ethics Statement
The animal study was reviewed and approved by the Ethics Committee for the Use of Animals of the Instituto Nacional de Pesquisas da Amazonia (INPA). The permit (number 29837-18 as of 23 March 2021) was approved by the Ethics Committee for the Use of Animals of INPA.
Author Contributions
F-ÉS, NL, EN, ND, and AV designed the experiment. F-ÉS, NL, AH, ND, and AV organized sampling expeditions. F-ÉS, NL, AH, and ND sampled fish during field expeditions and processed samples in the laboratory (fish dissections and DNA extractions). NL and EN performed bioinformatic analyses. NL wrote the manuscript. All authors reviewed the manuscript.
Funding
This work was part of the ADAPTA project at INPA and was supported by the INCT ADAPTA (CNPq/FAPEAM) and INPA/MCTI grants to AV; the Natural Sciences and Engineering Research Council of Canada (NSERC) Discovery grant (grant #6333) and the Canada-Brazil Awards Joint Research Project to ND; the NSERC BESC M Alexander-Graham-Bell, the FRQNTMaster Scholarship grant, the MITACS GlobaLink grant, the Ressources Aquatiques Québec (RAQ) internship grant, and the André Darveau grant to NL; and INCT ADAPTA-CNPq (465540/2014-7)/FAPEAM (062.1187/2017)/CAPES (finance code 001) to AV. AV was a recipient of a research fellowship from the Brazilian National Research Council (CNPq).
Conflict of Interest
The authors declare that the research was conducted in the absence of any commercial or financial relationships that could be construed as a potential conflict of interest.
Publisher’s Note
All claims expressed in this article are solely those of the authors and do not necessarily represent those of their affiliated organizations, or those of the publisher, the editors and the reviewers. Any product that may be evaluated in this article, or claim that may be made by its manufacturer, is not guaranteed or endorsed by the publisher.
Acknowledgments
We gratefully acknowledge help from all members of the Derome and Val laboratory. Thank you to the IBIS Plateforme d’Analyse Génomique for the sequencing and to ICMBIO/Instituto Chico Mendes de Conservação da Biodiversidade for in situ support for fish collection and for issuing the permit to transport biological samples (permit number 29837/18). Additionally, we would like to thank Gabriel Lazar Garrido, Tommy Pontbriand, and Jérémie Boucher-Fontaine for their help reviewing the manuscript.
Supplementary Material
The Supplementary Material for this article can be found online at: https://www.frontiersin.org/articles/10.3389/fevo.2022.875961/full#supplementary-material
Footnotes
References
Abreu, J. M. S., Saraiva, A. C. S., Albert, J. S., and Piorski, N. M. (2020). Paleogeographic influences on freshwater fish distributions in northeastern Brazil. J. South Am. Earth Sci. 102:102692. doi: 10.1016/j.jsames.2020.102692
Albert, J. S., Val, P., and Hoorn, C. (2018). The changing course of the Amazon River in the Neogene: center stage for Neotropical diversification. Neotrop. Ichthyol. 16:e180033.
Alexander, D. H., and Lange, K. (2011). Enhancements to the ADMIXTURE algorithm for individual ancestry estimation. BMC Bioinformatics 12:246. doi: 10.1186/1471-2105-12-246
Araújo-Silva, L. E., Miranda, L. S., Carneiro, L., and Aleixo, A. (2017). Phylogeography and diversification of an Amazonian understorey hummingbird: paraphyly and evidence for widespread cryptic speciation in the Plio-Pleistocene. IBIS 159, 778–791. doi: 10.1111/ibi.12500
Beheregaray, L., Cooke, G., Chao, N., and Landguth, E. (2015). Ecological speciation in the tropics: insights from comparative genetic studies in Amazonia. Front. Genet. 5:477. doi: 10.3389/fgene.2014.00477
Berger, A., and Loutre, M. F. (2010). Modeling the 100-kyr glacial–interglacial cycles. Glob. Planet. Change 72, 275–281. doi: 10.1016/j.gloplacha.2010.01.003
Bierne, N., Gagnaire, P.-A., and David, P. (2013). The geography of introgression in a patchy environment and the thorn in the side of ecological speciation. Curr. Zool. 59, 72–86. doi: 10.1093/czoolo/59.1.72
Bragança, P. H. N., and Costa, W. J. E. M. (2018). Time-calibrated molecular phylogeny reveals a Miocene–Pliocene diversification in the Amazon miniature killifish genus Fluviphylax (Cyprinodontiformes: Cyprinodontoidei). Organ. Divers. Evol. 18, 345–353. doi: 10.1007/s13127-018-0373-7
Brauer, C. J., Unmack, P. J., Smith, S., Bernatchez, L., and Beheregaray, L. B. (2018). On the roles of landscape heterogeneity and environmental variation in determining population genomic structure in a dendritic system. Mol. Ecol. 27, 3484–3497. doi: 10.1111/mec.14808
Camacho-Sanchez, M., Burraco, P., Gomez-Mestre, I., and Leonard, J. A. (2013). Preservation of RNA and DNA from mammal samples under field conditions. Mol. Ecol. Resour. 13, 663–673. doi: 10.1111/1755-0998.12108
Campbell, K. E., Frailey, C. D., and Romero-Pittman, L. (2006). The Pan-Amazonian Ucayali Peneplain, late Neogene sedimentation in Amazonia, and the birth of the modern Amazon River system. Palaeogeogr. Palaeoclimatol. Palaeoecol. 239, 166–219. doi: 10.1016/j.palaeo.2006.01.020
Capblancq, T., Luu, K., Blum, M. G. B., and Bazin, E. (2018). Evaluation of redundancy analysis to identify signatures of local adaptation. Mol. Ecol. Resour. 18, 1223–1233. doi: 10.1111/1755-0998.12906
Catchen, J., Hohenlohe, P. A., Bassham, S., Amores, A., and Cresko, W. A. (2013). Stacks: an analysis tool set for population genomics. Mol. Ecol. 22, 3124–3140. doi: 10.1111/mec.12354
Caye, K., Jumentier, B., Lepeule, J., and François, O. (2019). LFMM 2: fast and accurate inference of gene-environment associations in genome-wide studies. Mol. Biol. Evol. 36, 852–860. doi: 10.1093/molbev/msz008
Chen, H., and Boutros, P. C. (2011). VennDiagram: a package for the generation of highly-customizable Venn and Euler diagrams in R. BMC Bioinformatics 12:35. doi: 10.1186/1471-2105-12-35
Concheiro Pérez, G. A., Øíèan, O., Ortí, G., Bermingham, E., Doadrio, I., and Zardoya, R. (2007). Phylogeny and biogeography of 91 species of heroine cichlids (Teleostei: Cichlidae) based on sequences of the cytochrome b gene. Mol. Phylogenet. Evol. 43, 91–110. doi: 10.1016/j.ympev.2006.08.012
Cooke, G. M., Chao, N. L., and Beheregaray, L. B. (2009). Phylogeography of a flooded forest specialist fish from central Amazonia based on intron DNA: the cardinal tetra Paracheirodon axelrodi. Freshw. Biol. 54, 1216–1232. doi: 10.1111/j.1365-2427.2009.02172.x
Cooke, G. M., Chao, N. L., and Beheregaray, L. B. (2012a). Marine incursions, cryptic species and ecological diversification in Amazonia: the biogeographic history of the croaker genus Plagioscion (Sciaenidae). J. Biogeogr. 39, 724–738. doi: 10.1111/j.1365-2699.2011.02635.x
Cooke, G. M., Chao, N. L., and Beheregaray, L. B. (2012b). Divergent natural selection with gene flow along major environmental gradients in Amazonia: insights from genome scans, population genetics and phylogeography of the characin fish Triportheus albus. Mol. Ecol. 21, 2410–2427. doi: 10.1111/j.1365-294X.2012.05540.x
Cooke, G. M., Chao, N. L., and Beheregaray, L. B. (2012c). Natural selection in the water: freshwater invasion and adaptation by water colour in the Amazonian pufferfish. J. Evol. Biol. 25, 1305–1320. doi: 10.1111/j.1420-9101.2012.02514.x
Cooke, G. M., Landguth, E. L., and Beheregaray, L. B. (2014). Riverscape genetics identifies replicated ecological divergence across an Amazonian ecotone. Evolution 68, 1947–1960. doi: 10.1111/evo.12410
Coop, G., Witonsky, D., Di Rienzo, A., and Pritchard, J. K. (2010). Using environmental correlations to identify loci underlying local adaptation. Genetics 185, 1411–1423. doi: 10.1534/genetics.110.114819
da Rocha, D. G., and Kaefer, I. L. (2019). What has become of the refugia hypothesis to explain biological diversity in Amazonia? Ecol. Evol. 9, 4302–4309. doi: 10.1002/ece3.5051
de Villemereuil, P., Frichot, E., Bazin, E., Francois, O., and Gaggiotti, O. E. (2014). Genome scan methods against more complex models: when and how much should we trust them? Mol. Ecol. 23, 2006–2019. doi: 10.1111/mec.12705
Farias, I. P., and Hrbek, T. (2008). Patterns of diversification in the discus fishes (Symphysodon spp. Cichlidae) of the Amazon basin. Mol. Phylogenet. Evol. 49, 32–43. doi: 10.1016/j.ympev.2008.05.033
Forester, B. R., Jones, M. R., Joost, S., Landguth, E. L., and Lasky, J. R. (2016). Detecting spatial genetic signatures of local adaptation in heterogeneous landscapes. Mol. Ecol. 25, 104–120. doi: 10.1111/mec.13476
Forester, B. R., Lasky, J. R., Wagner, H. H., and Urban, D. L. (2018). Comparing methods for detecting multilocus adaptation with multivariate genotype–environment associations. Mol. Ecol. 27, 2215–2233. doi: 10.1111/mec.14584
Frichot, E., and Francois, O. (2015). LEA: an R package for landscape and ecological association studies. Methods Ecol. Evol. 6, 925–929. doi: 10.1111/2041-210x.12382
Gautier, M. (2015). Genome-wide scan for adaptive divergence and association with population-specific covariates. bioRxiv [Preprint]. bioRxiv 023721,
Grant, G. R., Naish, T. R., Dunbar, G. B., Stocchi, P., Kominz, M. A., Kamp, P. J. J., et al. (2019). The amplitude and origin of sea-level variability during the Pliocene epoch. Nature 574, 237–241. doi: 10.1038/s41586-019-1619-z
Holland, A., Wood, C. M., Smith, D. S., Correia, T. G., and Val, A. L. (2017). Nickel toxicity to cardinal tetra (Paracheirodon axelrodi) differs seasonally and among the black, white and clear river waters of the Amazon basin. Water Res. 123, 21–29. doi: 10.1016/j.watres.2017.06.044
Hoorn, C., Wesselingh, F. P., ter Steege, H., Bermudez, M. A., Mora, A., Sevink, J., et al. (2010). Amazonia through time: andean uplift, climate change, landscape evolution, and biodiversity. Science 330, 927–931. doi: 10.1126/science.1194585
Hubert, N., and Renno, J.-F. (2006). Historical biogeography of South American freshwater fishes. J. Biogeogr. 33, 1414–1436. doi: 10.1111/j.1365-2699.2006.01518.x
Hubert, N., Duponchelle, F., Nuñez, J., Garcia-Davila, C., Paugy, D., and Renno, J.-F. (2007). Phylogeography of the piranha genera Serrasalmus and Pygocentrus: implications for the diversification of the Neotropical ichthyofauna. Mol. Ecol. 16, 2115–2136. doi: 10.1111/j.1365-294X.2007.03267.x
Oksanen, J., Blanchet, F. G., Friendly, M., Kindt, R., Legendre, P., McGlinn, D., et al. (2019). vegan: Community Ecology Package.
Jombart, T. (2008). adegenet: a R package for the multivariate analysis of genetic markers. Bioinformatics 24, 1403–1405. doi: 10.1093/bioinformatics/btn129
Junk, W. J., Piedade, M. T. F., Schöngart, J., Cohn-Haft, M., Adeney, J. M., and Wittmann, F. (2011). A classification of major naturally-occurring Amazonian lowland Wetlands. Wetlands 31, 623–640. doi: 10.1007/s13157-011-0190-7
Junk, W. J., Wittmann, F., Schoengart, J., and Piedade, M. T. F. (2015). A classification of the major habitats of Amazonian black-water river floodplains and a comparison with their white-water counterparts. Wetlands Ecol. Manag. 23, 677–693. doi: 10.1007/s11273-015-9412-8
Knaus, B. J., and Grünwald, N. J. (2017). vcfr: a package to manipulate and visualize variant call format data in R. Mol. Ecol. Resour. 17, 44–53. doi: 10.1111/1755-0998.12549
Latrubesse, E. M., and Franzinelli, E. (2005). The late Quaternary evolution of the Negro River, Amazon, Brazil: implications for island and floodplain formation in large anabranching tropical systems. Geomorphology 70, 372–397. doi: 10.1016/j.geomorph.2005.02.014
Legendre, P., and Legendre, L. (2012). Numerical Ecology, eds P. Legendre and L. Legendre (Amsterdam: Elsevier).
Lichstein, J. W. (2007). Multiple regression on distance matrices: a multivariate spatial analysis tool. Plant Ecol. 188, 117–131. doi: 10.1007/s11258-006-9126-3
Lovejoy, N. R., Albert, J. S., and Crampton, W. G. R. (2006). Miocene marine incursions and marine/freshwater transitions: evidence from Neotropical fishes. J. South Am. Earth Sci. 21, 5–13. doi: 10.1016/j.jsames.2005.07.009
Lynch Alfaro, J. W., Boubli, J. P., Paim, F. P., Ribas, C. C., da Silva, M. N. F., Messias, M. R., et al. (2015). Biogeography of squirrel monkeys (genus Saimiri): South-central Amazon origin and rapid pan-Amazonian diversification of a lowland primate. Mol. Phylogenet. Evol. 82, 436–454. doi: 10.1016/j.ympev.2014.09.004
Mantel, N. (1967). The detection of disease clustering and a generalized regression approach. Cancer Res. 27, 209–220.
Martin, M. (2011). Cutadapt removes adapter sequences from high-throughput sequencing reads. EMBnet. J. 17, 10–12. doi: 10.1089/cmb.2017.0096
Moreira, L. S., Moreira-Turcq, P., Cordeiro, R. C., Turcq, B., Aniceto, K. C., Moreira-Ramírez, M., et al. (2020). Climate and hydrologic controls on late Holocene sediment supply to an Amazon floodplain lake. J. Paleolimnol. 64, 389–403. doi: 10.1007/s10933-020-00144-y
Nores, M. (2004). The implications of tertiary and quaternary sea level rise events for avian distribution patterns in the Lowlands of Northern South America. Glob. Ecol. Biogeogr. 13, 149–161. doi: 10.1111/j.1466-882x.2004.00076.x
Oberdorff, T., Dias, M. S., Jézéquel, C., Albert, J. S., Arantes, C. C., Bigorne, R., et al. (2019). Unexpected fish diversity gradients in the Amazon basin. Sci. Adv. 5:eaav8681. doi: 10.1126/sciadv.aav8681
Paris, J. R., Stevens, J. R., and Catchen, J. M. (2017). Lost in parameter space: a road map for stacks. Methods Ecol. Evol. 8, 1360–1373. doi: 10.1111/2041-210x.12775
Paz-Vinas, I., Loot, G., Stevens, V. M., and Blanchet, S. (2015). Evolutionary processes driving spatial patterns of intraspecific genetic diversity in river ecosystems. Mol. Ecol. 24, 4586–4604. doi: 10.1111/mec.13345
Pembleton, L. W., Cogan, N. O. I., and Forster, J. W. (2013). StAMPP: an R package for calculation of genetic differentiation and structure of mixed-ploidy level populations. Mol. Ecol. Resour. 13, 946–952. doi: 10.1111/1755-0998.12129
Pires, T. H. S., Borghezan, E. A., Machado, V. N., Powell, D. L., Röpke, C. P., Oliveira, C., et al. (2018). Testing Wallace’s intuition: water type, reproductive isolation and divergence in an Amazonian fish. J. Evol. Biol. 31, 882–892. doi: 10.1111/jeb.13272
Pires, T., Campos, D., Röpke, C., Sodré, J., Amadio, S., and Zuanon, J. (2015). Ecology and life-history of Mesonauta festivus: biological traits of a broad ranged and abundant Neotropical cichlid. Environ. Biol. Fish. 98, 789–799. doi: 10.1007/s10641-014-0314-z
Potter, P. E. (1997). The Mesozoic and Cenozoic paleodrainage of South America: a natural history. J. South Am. Earth Sci. 10, 331–344. doi: 10.1016/s0895-9811(97)00031-x
Reis, R. E. (2013). Conserving the freshwater fishes of South America: conserving South American Freshwater Fishes. Int. Zoo Yearb. 47, 65–70. doi: 10.1111/izy.12000
Reis, R. E., Kullander, S. O., and Ferraris, C. (2003). Check list of the freshwater fishes of south and central america. Edipucrs 2003, 605–654.
Rellstab, C., Gugerli, F., Eckert, A. J., Hancock, A. M., and Holderegger, R. (2015). A practical guide to environmental association analysis in landscape genomics. Mol. Ecol. 24, 4348–4370. doi: 10.1111/mec.13322
Ribas, C. C., Aleixo, A., Nogueira, A. C. R., Miyaki, C. Y., and Cracraft, J. (2012). A palaeobiogeographic model for biotic diversification within Amazonia over the past three million years. Proc. Biol. Sci. 279, 681–689. doi: 10.1098/rspb.2011.1120
Ríos-Villamizar, E. A., Piedade, M. T. F., Da Costa, J. G., Adeney, J. M., and Junk, W. J. (2013). Chemistry of different Amazonian Water Types for River Classification: A Preliminary Review. New Forest: WIT Press, 17–28.
Rochette, N. C., and Catchen, J. M. (2017). Deriving genotypes from RAD-seq short-read data using Stacks. Nat. Protoc. 12, 2640–2659. doi: 10.1038/nprot.2017.123
Rousset, F. (1997). Genetic differentiation and estimation of gene flow from f-statistics under isolation by distance. Genetics 145, 1219–1228. doi: 10.1093/genetics/145.4.1219
Roxo, F. F., Zawadzki, C. H., Alexandrou, M. A., Costa Silva, G. J., Chiachio, M. C., Foresti, F., et al. (2012). Evolutionary and biogeographic history of the subfamily Neoplecostominae (Siluriformes: Loricariidae). Ecol. Evol. 2, 2438–2449. doi: 10.1002/ece3.368
Rundle, H. D., and Nosil, P. (2005). Ecological speciation. Ecol. Lett. 8, 336–352. doi: 10.1111/j.1461-0248.2004.00715.x
Schluter, D. (2001). Ecology and the origin of species. Trends Ecol. Evol. 16, 372–380. doi: 10.1016/s0169-5347(01)02198-x
Schluter, D. (2009). Evidence for ecological speciation and its alternative. Science 323, 737–741. doi: 10.1126/science.1160006
Sioli, H. (1984). “Water chemistry of the Amazon basin: the distribution of chemical elements among freshwaters,” in The Amazon: Limnology and Landscape Ecology of a Mighty Tropical River and its Basin, ed. H. Sioli (Dordrecht: Springer), 167–199. doi: 10.1007/978-94-009-6542-3_6
Sylvain, F. -É, Holland, A., Audet-Gilbert, É, Val, A. L., and Derome, N. (2019). Amazon fish bacterial communities show structural convergence along widespread hydrochemical gradients. Mol. Ecol. 28, 3612–3626. doi: 10.1111/mec.15184
Sylvain, F.-E., Holland, A., Bouslama, S., Audet-Gilbert, E., Lavoie, C., Val, A. L., et al. (2020). Fish skin and gut microbiomes show contrasting signatures of host species and habitat. Appl. Environ. Microbiol. 86:e00789-20. doi: 10.1128/AEM.00789-20
Thom, G., Xue, A. T., Sawakuchi, A. O., Ribas, C. C., Hickerson, M. J., Aleixo, A., et al. (2020). Quaternary climate changes as speciation drivers in the Amazon floodplains. Sci. Adv. 6:eaax4718. doi: 10.1126/sciadv.aax4718
Val, A. L., and Almeida-Val, V. M. F. (1995). Fishes of the Amazon and their Environment. Berlin: Springer.
Venere, P. C. I., Souza, L., Silva, L. K. S., Anjos, M. B. D., Oliveira, R. R. D., and Galetti, P. M. (2008). Recent chromosome diversification in the evolutionary radiation of the freshwater fish family Curimatidae (Characiformes). J. Fish Biol. 72, 1976–1989. doi: 10.1111/j.1095-8649.2008.01814.x
Keywords: landscape genomics, phylogeography, population genetics, Amazonia, ecological genetics, evolution, ecological speciation, allopatric speciation
Citation: Leroux N, Sylvain F-É, Normandeau E, Holland A, Val AL and Derome N (2022) Evolution of an Amazonian Fish Is Driven by Allopatric Divergence Rather Than Ecological Divergence. Front. Ecol. Evol. 10:875961. doi: 10.3389/fevo.2022.875961
Received: 14 February 2022; Accepted: 28 April 2022;
Published: 31 May 2022.
Edited by:
Stephane Boissinot, New York University Abu Dhabi, United Arab EmiratesReviewed by:
James Albert, University of Louisiana at Lafayette, United StatesSimon Blanchet, Centre National de la Recherche Scientifique (CNRS), France
Copyright © 2022 Leroux, Sylvain, Normandeau, Holland, Val and Derome. This is an open-access article distributed under the terms of the Creative Commons Attribution License (CC BY). The use, distribution or reproduction in other forums is permitted, provided the original author(s) and the copyright owner(s) are credited and that the original publication in this journal is cited, in accordance with accepted academic practice. No use, distribution or reproduction is permitted which does not comply with these terms.
*Correspondence: Nicolas Leroux, Tmljb2xhcy5sZXJvdXguMUB1bGF2YWwuY2E=
†ORCID: Nicolas Leroux, orcid.org/0000-0003-1198-9435; François-Étienne Sylvain, orcid.org/0000-0002-1763-0434; Eric Normandeau, orcid.org/0000-0003-2841-9391; Adalberto Luis Val, orcid.org/0000-0002-3823-3868; Nicolas Derome, orcid.org/0000-0002-2509-6104