 Ortal Mizrahy-Rewald1,2*†
 Elisa Perinot1,2†
 Johannes Fritz2†
 Alexei L. Vyssotski3†Leonida Fusani1,4†Bernhard Voelkl5†
 Thomas Ruf1†
- 1Department of Interdisciplinary Life Sciences, University of Veterinary Medicine, Vienna, Austria
- 2Waldrappteam Conservation & Research, Mutters, Austria
- 3ETH Zürich, Zurich, Switzerland
- 4Department of Behavioural and Cognitive Biology, University of Vienna, Vienna, Austria
- 5Animal Welfare Division, Vetsuisse Faculty, University of Bern, Bern, Switzerland
Birds face exceptionally high energy demands during their flight. One visible feature of some species is alternating between flapping and gliding, which should allow them to save energy. To date, there is no empirical evidence of an energetic benefit to this. To understand the physiology behind the strategy, we equipped hand-raised Northern Bald Ibises (Geronticus eremita) with data loggers during human-guided migration. We monitored the position of the birds, wingbeats, overall dynamic body acceleration (ODBA), and heart rates as a proxy for energy expenditure. The energy expenditure was significantly affected by the length of flapping and gliding bouts. A pronounced decrease in heart rate was measured after already 1 s of gliding. Additionally, the heart rate at flapping bouts up to 30 s increased steadily but stabilized thereafter. The gilding proportion during intermittent flight affected the energy saving compared to continuous flapping. At a gliding proportion of about 20%, we measured a maximum of 11% saving based on heart rate measurement. At higher gliding proportions, the additional energy saving was negligible. Furthermore, as during flight, not all energy is used for mechanical work, we found a greater decrease rate of ODBA at different gliding proportions compared to heart rate. Nevertheless, the combination of the two methods is essential to determine birds’ movement and energy expenditure. This study provides empirical evidence that intermittent flight is energetically beneficial and can reduce the high costs of flights.
Introduction
A considerable proportion of worldwide bird populations perform seasonal long-distance migration in response to environmental periodicity (Alerstam, 1990; Newton, 2010). However, migratory journeys carry high energetic costs that often come with a higher risk of mortality (Berthold, 2001; Newton, 2010) as flapping flight is the most energy-consuming type of any form of vertebrate locomotion (Schmidt-Nielsen, 1972). To overcome these costs, birds use favorable atmospheric conditions during flight such as thermals (Hedenström, 1993), tailwind (Weimerskirch et al., 2000; Amélineau et al., 2014; Klaassen et al., 2017) and solar radiation (Duriez et al., 2014) or take advantage of social formation flight to save energy (Portugal et al., 2014; Voelkl and Fritz, 2017). Another technique to reduce energetic costs might be intermittent flight as this reduces power requirements (Ward-Smith, 1984) when optimal proportion between flapping and gliding occurs.
Intermittent flight consists of phases in which the bird flexes its wings against its body (flap-bound) or extends its wings and glides (flap-glide) (Tobalske and Dial, 1994; Rayner, 1995; Rayner et al., 2001; Tobalske, 2001, 2010). The main feature of these intermittent flight modes is a periodic variation in force generated by the flapping wings, and therefore in the dynamics of the body (Rayner et al., 2001). While the intermittent bounding flight is limited to small birds and lasts for fractions of a second, intermittent glide is associated with medium and large size birds, and it varies in duration that can last from less than a second to minutes in larger gliding birds (Rayner, 1996; Tobalske, 1996, 2010). Theoretical studies on energy saving during intermittent flight in comparison to continuous flapping flight resulted in contrasting conclusions. Some studies suggested no energy saving (Ward-Smith, 1984; Pennycuick, 2008), while others claimed that intermittent flight is less costly than continuous flapping (Rayner, 1985; Tobalske and Dial, 1994; Muijres et al., 2012; Sachs, 2015, 2017). For example, according to a model developed by Muijres et al. (2012), common swifts (Apus apus) can save up to 15% energy during intermittent flight, when their gliding proportion was 64%, compared to continuously flapping. The energy saving in common swifts is mainly achieved due to the extremely high ratio between the lift generated by the wings and the drag during gliding flight compared to that in flapping flight (Muijres et al., 2012). Another theoretical calculation by Rayner (1985) predicted a reduction of 11% in transport costs for European starlings (Sturnus vulgaris) that glide 75% of the time during intermittent flight. Nevertheless, following intense activity such as flapping, metabolic rates require time to decrease (Baker and Gleeson, 1999), hence, metabolic savings during short gliding phases are likely limited compared to potential energy savings associated with prolonged glides.
This study aimed to investigate the flexibility of flapping and gliding duration during intermittent flight in Northern Bald Ibis and to provide empirical evidence for possible energy savings based on heart rate and ODBA measurements, by using intermittent gliding flight during migration.
To estimate energy expenditure in this study, methods with a good estimation of energy expenditure, a good temporal resolution, and which can be applied to free-flying birds were needed (Butler et al., 2004; Ward et al., 2004; Gleiss et al., 2011; Green, 2011). Thus, we used heart rate and dynamic body acceleration (DBA) measurements. As a proxy for energy use, the heart-rate method can provide high-resolution measures continuously during flight (Bevan et al., 1994; Butler et al., 1998; Weimerskirch et al., 2000). Measurements of the heart rate of free-flying birds can be either done with implanted transmitters or with externally attached data loggers in combination with electrocardiogram electrodes attached subcutaneously (Weimerskirch et al., 2002; Duriez et al., 2014; Müller et al., 2018) or glued to the skin surface (Yamamoto et al., 2009), see also (Green, 2011). DBA is based on the observation that body acceleration is mainly derived from the muscle-powered movement of the animal and therefore can be correlated with energy expenditure (Bouten et al., 1994; Wilson et al., 2006, 2020; Gleiss et al., 2011; Halsey et al., 2011; Karasov, 2015; Hicks et al., 2017). DBA estimates are gained from accelerometers attached to the subjects and can also provide a high level of detail about the bird’s behavior during free-flight (e.g., wing beat rate and time spent flapping) (Ropert-Coudert et al., 2006; Halsey et al., 2009b; Duriez et al., 2014; Hicks et al., 2017; Wilson et al., 2020). The combined measurements of heart rate and DBA allow a better understanding of the estimated energy expenditure (Clark et al., 2010) during flights and allow an assessment of the relationship between these two methods in relation to flight activities.
In the framework of a reintroduction project, hand-raised Northern Bald Ibises (Geronticus eremita) undergoing a human-guided autumn migration (Fritz et al., 2017; Fritz, 2021) were equipped with a non-invasive device to measure heart rate, and acceleration (Vyssotski et al., 2009; Duriez et al., 2014; Müller et al., 2018). Additionally, the birds carried global navigation satellite system (GNSS) loggers that allow to determine their position and movements at high precision (Paziewski and Crespi, 2019). To assess the costs of glides and flaps during intermittent flight, we compared the heart rate and overall dynamic body acceleration (ODBA) during bouts of flapping and gliding. We predicted that the duration of flapping and intermittent gliding phases plays a significant role in energy expenditure and recovery rate, and hence there should be an optimal proportion between flapping and gliding for the most energy-efficient migratory flight.
Materials and Methods
Study Site, Birds, and Experimental Setting
This study took part within a long-term conservation program that aims to re-establish a migratory population of Northern Bald Ibises (G. eremita) in Europe, embedded in the European LIFE+ program (LIFE + 12-BIO_AT_0001431).
A group of 29 Northern Bald Ibises were imprinted onto human foster parents and trained to follow microlight aircraft (paraplane). In late summer, after about 2 months of flights training, two paraplanes lead the birds from their future breeding grounds north of the Alps to their wintering area in southern Tuscany, Italy, teaching the birds the migration route (Fritz et al., 2017). The migration during this study took place in August 2019 from the training site near Heiligenberg, Germany (47.832029°N, 9.298881°E), to Orbetello, Italy (42.425484°N, 11.232662°E). During the last two training flights and four out of the six migration phases, we equipped all birds with high-resolution data loggers with a GNSS receiver (see below). Additionally, we equipped four birds with a heart rate logger and accelerometer (see below). The loggers were fitted to the birds on the day of the flight and removed after landing on the same day for recharging batteries and downloading data. As part of the habituation procedure, the birds carried dummy loggers already 2 weeks before the start of the experimental period. All translocation and management measures were implemented in the frame of the European LIFE+ project LIFE + 12-BIO_AT_000143. National approvals were provided by the authorities of Salzburg (21302-02/239/352-2012), Carinthia (11-JAG-s/75-2004), Baden-Württemberg (I1-7.3.3_Waldrapp), Bavaria (55.1-8646.NAT_03-10-1), and Italy (0027720-09/04/2013). The present study was discussed and approved by the Ethics and Animals’ Welfare Committee of the University of Veterinary Medicine, Vienna, Austria, in accordance with good scientific practice and national legislation (GZ: BMWFW-68.205/0069-V/3b/2019).
Location Measurements
We used specially designed data loggers with high-precision GNSS modules (NEO-M8T, u-blox AG, Thalwil, Switzerland) that collect raw-satellite data from Global Positioning System (GPS), GLONASS, and Galileo satellites to record unprocessed GPS carrier-phase raw data at a sample rate of 5 Hz.
After collection, the data was post-processed using RTKlib v. demo5 b33b software (Everett, 2020) based on the RTKLIB (Takasu, 2020), and with Python v. 3.8 (Van Rossum and Drake, 2009). First, we calculated the birds’ flying path using several fixed base stations from the EUREF Permanent Network and IGS network, using the nearest one to the flight route (Bruyninx et al., 2019). After visual inspection of plots that represent the flying paths, we manually excluded soaring bouts that suggested the use of thermal updraft, as the birds fly in circles. More specifically, we excluded soaring bouts when the bird completed at least two circles without interruption. Finally, we removed the start sequence after taking off and before landing, where we could observe bouts of extended gliding when birds reduced altitude.
Heart Rate and Acceleration Measurement
The heart rate method is based on the assumption that increased oxygen consumption leads to increased blood flow and heart rate (Henderson and Prince, 1914; Green, 2011). In addition, the correlation between heart rate and oxygen consumption is usually higher when animals are active relative to sedentary (Green et al., 2008), and it is robust for flight (Bishop et al., 2002; Hicks et al., 2017). Based on the observed differences in heart rate between flapping and gliding, we assume a relationship between heart rate and metabolic rate and estimated energetic costs (Butler et al., 2004; Portugal et al., 2009; Green, 2011).
We recorded heart rate at a sampling frequency of 1600 Hz, using the external ECG logger Neurologger 2A (Supplementary Figure 1) with a 1 GB memory (Evolocus LLC, NY, United States) (Vyssotski et al., 2009; Duriez et al., 2014; Müller et al., 2017, 2018). Three lead wires extended from the ECG logger, with adhesive mini electrodes (NeoLead®, ©Connect Medizintechnik GmbH, Mistelbach, Austria) soldered to the ends (Supplementary Figure 1). The logger recorded the electric potential difference between two of the electrodes at a range of −6 to +6 mV; the third electrode served as a reference electrode to reduce electrical noise. The first two electrodes were fixed to the skin on each side of the lower abdomen and the third (reference electrode) on the middle of the back.
Three axial acceleration between g-force of −8 and +8 g was acquired at 1600 Hz with an accelerometer (LIS302DLH; STMicro-electronics, Geneva, Switzerland) that was stored in the Neurologger 2A. The body of the ECG logger and the GNSS logger were fixed on a 5.8 g leg loop harness with a plastic plate (80 × 35 mm). The loggers-plate unit was positioned approximately at the center of gravity on the back of the bird (Mallory and Gilbert, 2008), and was covered by a custom-made aerodynamic-shape 3D printed cover. The wires of the electrodes were secured inside the Teflon ribbon strips of the harness (Supplementary Figure 1). The overall weight of the logger, electrodes, harness, housing, and electrodes reached a maximum of 38.17 g, which is about 3% of the body mass of the lightest bird (1297 g). This is below the BTO recommendation that loggers should not exceed 5% of the birds’ body mass (Barron et al., 2010). The mean mass of the birds at the start of migration was 1310 ± 200 g.
Out of the six flights that the birds performed with the ECG data loggers (four birds carried ECG logger in each of the six flights), in four of the flights, the loggers recorded ECG data (n = 5 birds), totaling 26,040 s of flight. During the other flights, the birds removed the adhesive electrodes before taking off. Thus, the loggers did not record ECG but did collect acceleration data.
Data Analyses
ECG and acceleration data were processed using R v. 4.05 (R Core team, 2020). Heart rate in beats per minute (bpm) was calculated from the raw ECG data using a custom QRS-complex detection algorithm in R (Supplementary Code 1). First, we removed noise from real heart rate and deleted physiologically unlikely heart rates (i.e., data points above 600 bpm), and second, we filtered the remaining data with a contrast-enhancing routine implemented in R. The filter was designed to assign each data point a weight based on the number of neighboring points. This was implemented by looping through all data points and counting neighbors within a frame of 2 s and a step size of 0.2 s. The calculation considered in the previous time frame a high or low activity, based on the heave axis from the acceleration data. When the activity in the previous interval was high (above median), we scanned for a heart rate in the high frequency range of 5–10 Hz (=300–600 bpm). If, however, the activity was low, we scanned the entire range 0.5–10 Hz (=30–600 bpm). Subsequently, we ranked all data points in each data set according to their neighbor counts and retained only those points with the highest ranks (i.e., points within a dense band). As a final step, we visualized the data and deleted obvious outliers. The final processed heart rate data in bpm was at a frequency of 5 Hz (Figure 1A). For more details on the heart rate analysis see (Signer et al., 2010).
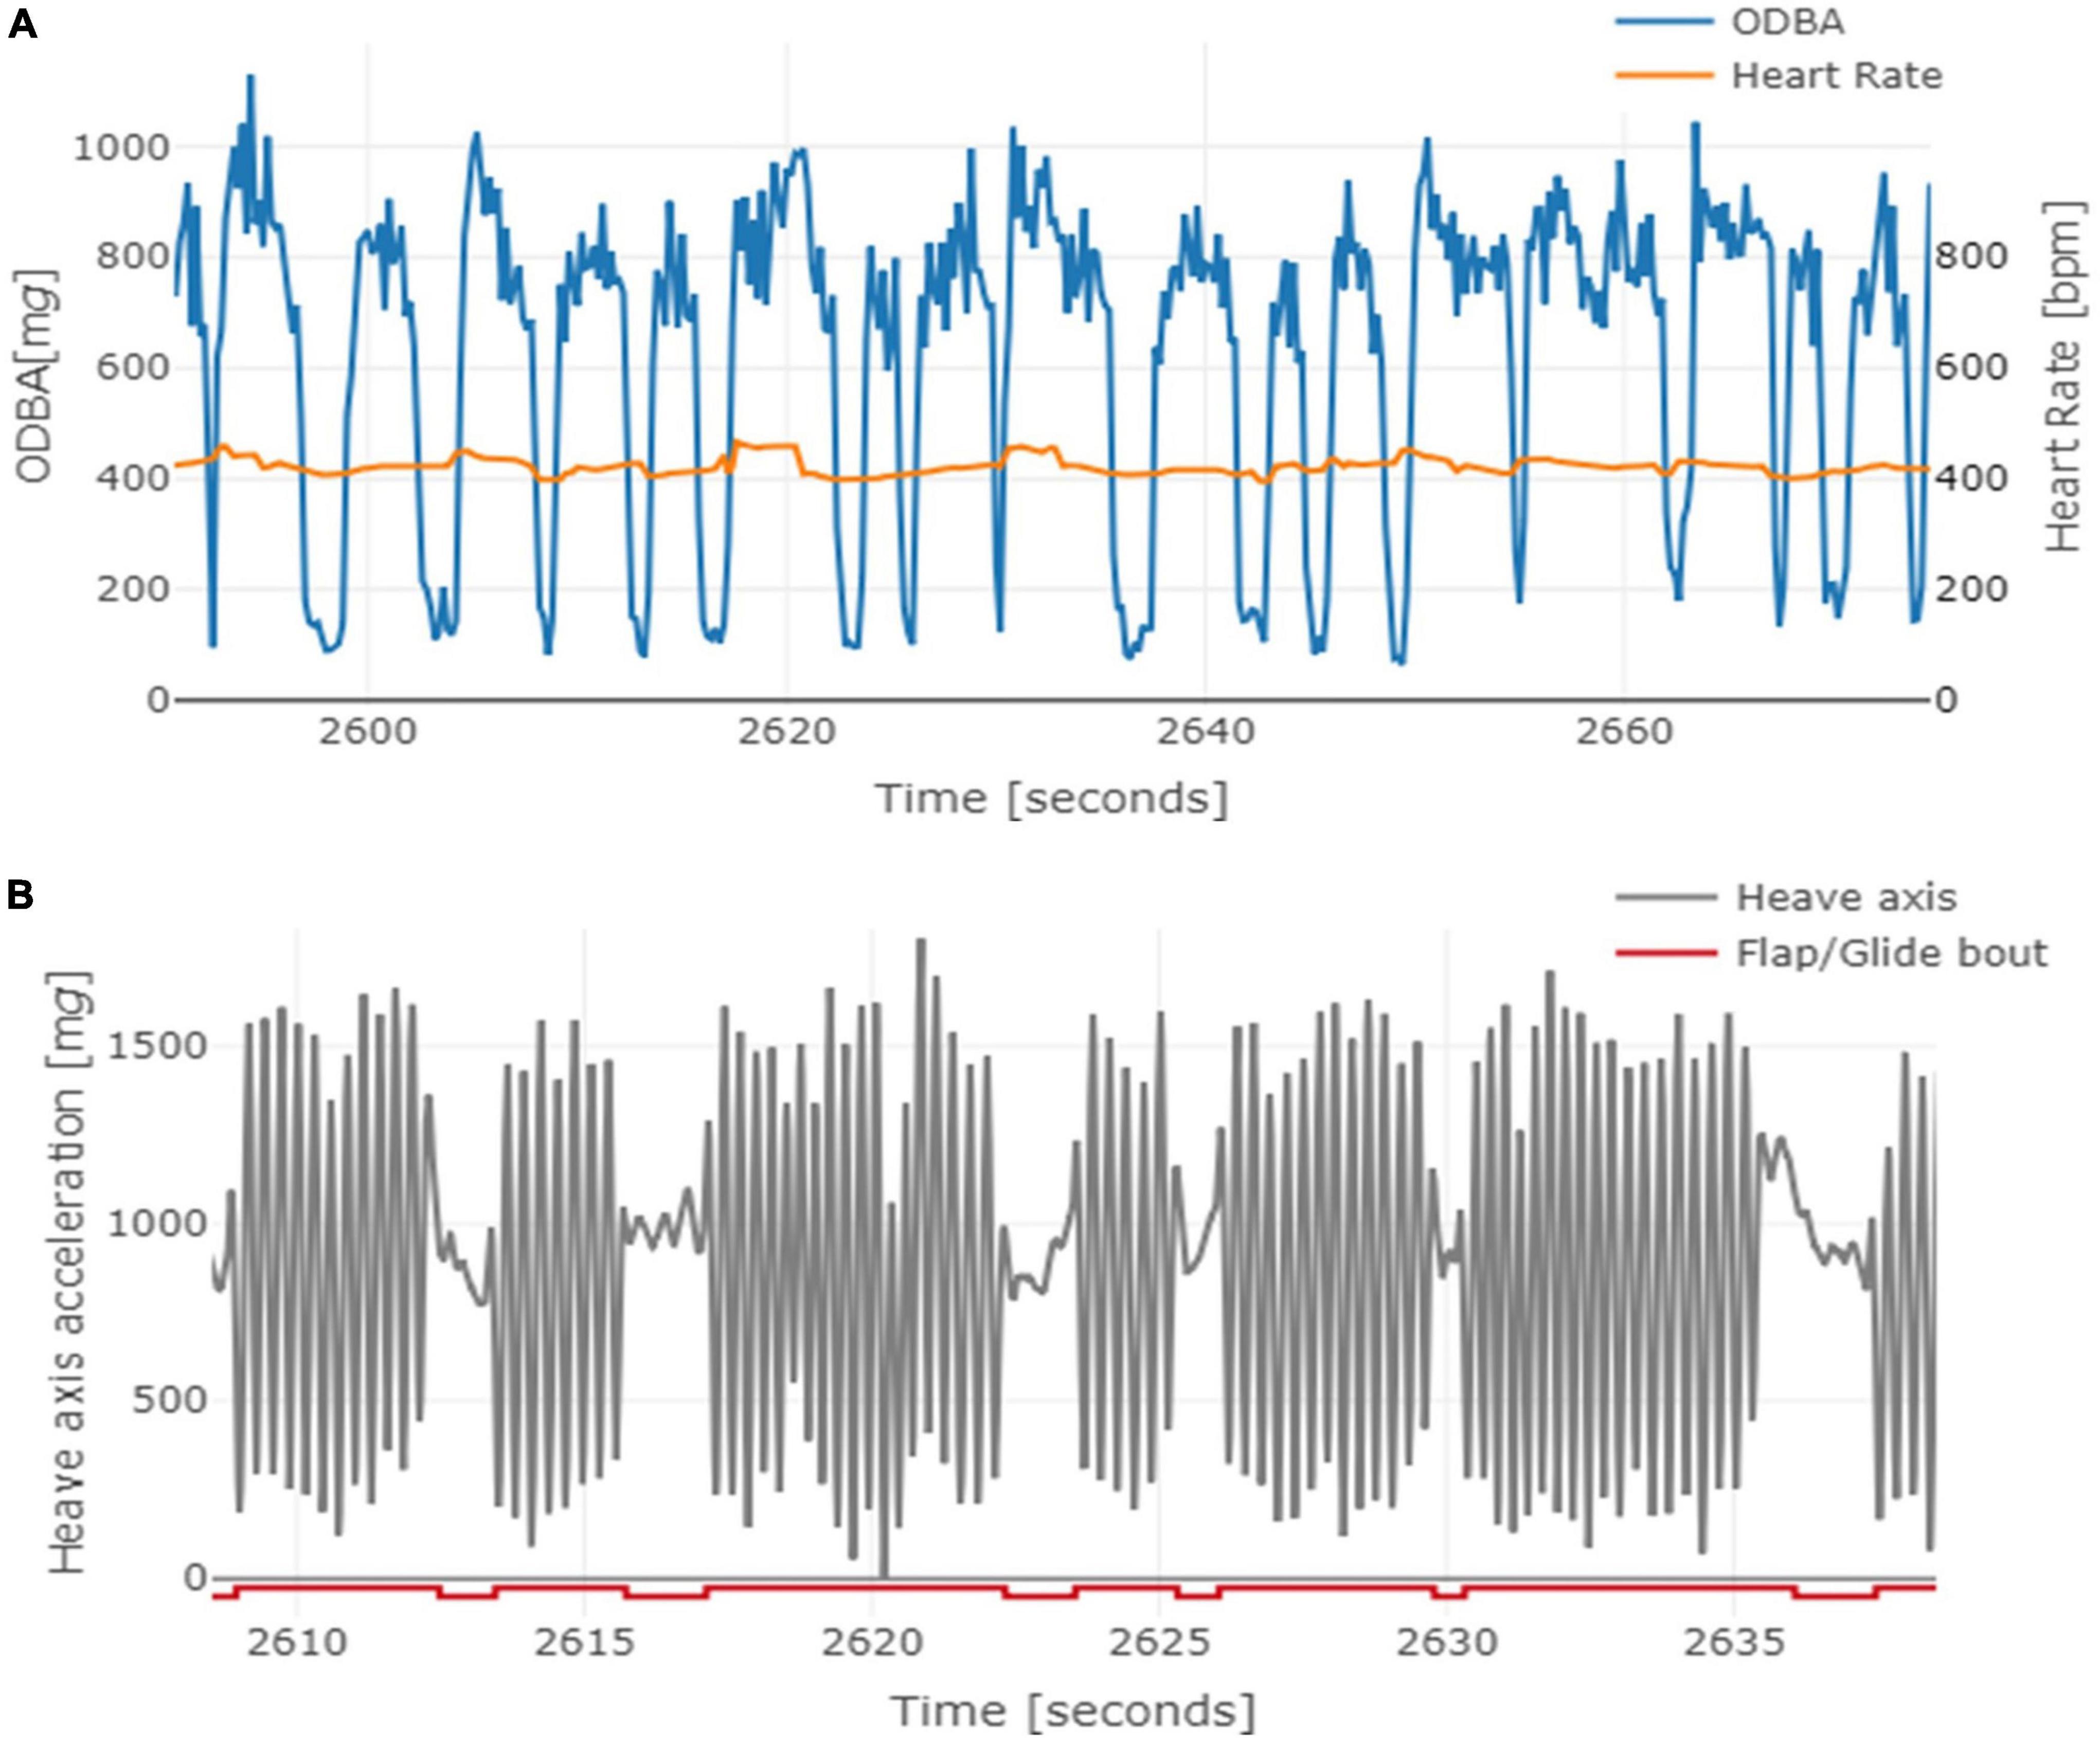
Figure 1. Example a migration flight performed by a Northern Bald Ibis (bird #296) on 26 August 2019. (A) Approximately 60 s of recorded heart rate (orange) in bpm and overall dynamic body acceleration (ODBA; blue) based on three axes acceleration signals in mg. Periods of large increases in ODBA represent flapping flight and periods of low change represent gliding flight. Both heart rate and ODBA at a resolution of 5 Hz. (B) Raw acceleration values over 30 s of the heave axis filtered over 200 data points (=1/8 s) in gray. The raised and lowered horizontal red line denotes flapping and gliding phases, respectively. The resolution of the heave axis and flapping/gliding bouts is 1600 Hz.
The vectorial static body acceleration (VeDBA, mg) was calculated from the tri-axial accelerations. Nevertheless, we will only use the term ODBA from here on as from a mathematical perspective both ODBA and VeDBA are equally valid to measure the length of a vector (Qasem et al., 2012). We first smoothed the data of each axis over a window size of 1 s period using a running mean, to calculate the static acceleration, and then subtracted the static acceleration from the raw acceleration values to receive the dynamic acceleration. The square root of the sum of the squares of all three axes DBA yielded the ODBA values (Shepard et al., 2008b; McGregor et al., 2009; Gleiss et al., 2011; Qasem et al., 2012). The final ODBA data was downscaled to 5 Hz to meet the same timesteps of the processed heart rate data.
By visualizing the accelerometer data, we identified a threshold of the heave axis to define flapping and gliding. Flapping flight was defined by regular peaks in the heave axis, where each peak represents a wing beat. The mean wingbeat frequency for Northern Bald Ibis during active flight is 3–4 beats s–1 (Fritz et al., 2008; Wehner et al., 2022). Gliding was defined by an absolute acceleration value lower than 300 mg on the heave axis, that lasted for a minimum of 0.2 s (approximately one wingbeat). We first smoothed the acceleration data over 200 data points (0.125 s) and later calculated the number and duration of each flapping and gliding bout using a custom algorithm in R (Figure 1B and Supplementary Code 2). After the above calculation, we merged the flapping/gliding bouts data with the heart rate and ODBA data based on the timestamps of the later data. By merging the two datasets, we downscaled the flapping/gliding data to meet the frequency of the heart rate and ODBA (5 Hz). In addition, we further filtered the data by removing cases of a single flap bout within a gliding phase. The reason behind removing short flapping bouts of 0.2 s, is that we found no increase in the heart rate due to a single flap but a further decrease.
Percentages of gliding during the migratory flight bouts were analyzed by cutting the total flights data of each bird into segments of 1 min. For each segment, we used the R package “dplyr” (Wickham et al., 2021) to calculate the mean heart rate and ODBA, the change in altitude and horizontal distance traveled, and the percentage of gliding.
Statistical Analysis
We examined the frequency distributions of ODBA and heart rate for each flight type. Before calculation, we excluded all passive flight parts (soaring and gliding due to thermals) based on the GNSS data. In total, we excluded 2287 s from the recorded data and performed statistical analysis on 23,224 s of flight data. Mean ODBA and HR were calculated for each flapping and gliding bout. As our data did not show a clear linear relationship and were repeated measurements, we performed a generalized additive mixed model (GAMM) to quantify the effects of flight type, length, and time of the bout on ODBA and HR. All models were produced in R using the function “bam()” within the package “mgcv” (Wood, 2004).
The analysis was used after data exploration revealed potential violations of homogeneity and non-linearity (Zuur et al., 2007). GAMM provides a general framework by allowing non-linear functions of each of the variables while maintaining the additive assumption. In addition, it offers flexibility through smooth functions that can be applied to each explanatory variable (Wood, 2003). All our fitted GAMM models (Table 1) combined separate smooth terms for each numerical predictor (default thin-plate splines), and a smooth term for the categorical predictor (Bird, n = 5) with a basis specification for random effects [using s (Bird, bs = “re”)]. Hence, these mixed models allowed for differences in the mean level of heart rates and ODBA between individuals. As a smoothing parameter estimation method, the default selection score in GAMM [i.e., fast restricted maximum likelihood (fREML)], was applied. Given that the pattern of the residuals, as inspected by normal quantile–quantile plots, resembled that of a normal distribution with heavier tails, we fitted all models using the scaled-t (Student’s t) family distribution for heavy-tailed data. In addition, the “identity” link function was specified. Below is an example of the R code for local GAMM fitting, where y represents the response variable, while the other arguments are the predictor. The function f is the smooth functions, to be estimated by non-parametric means variables:
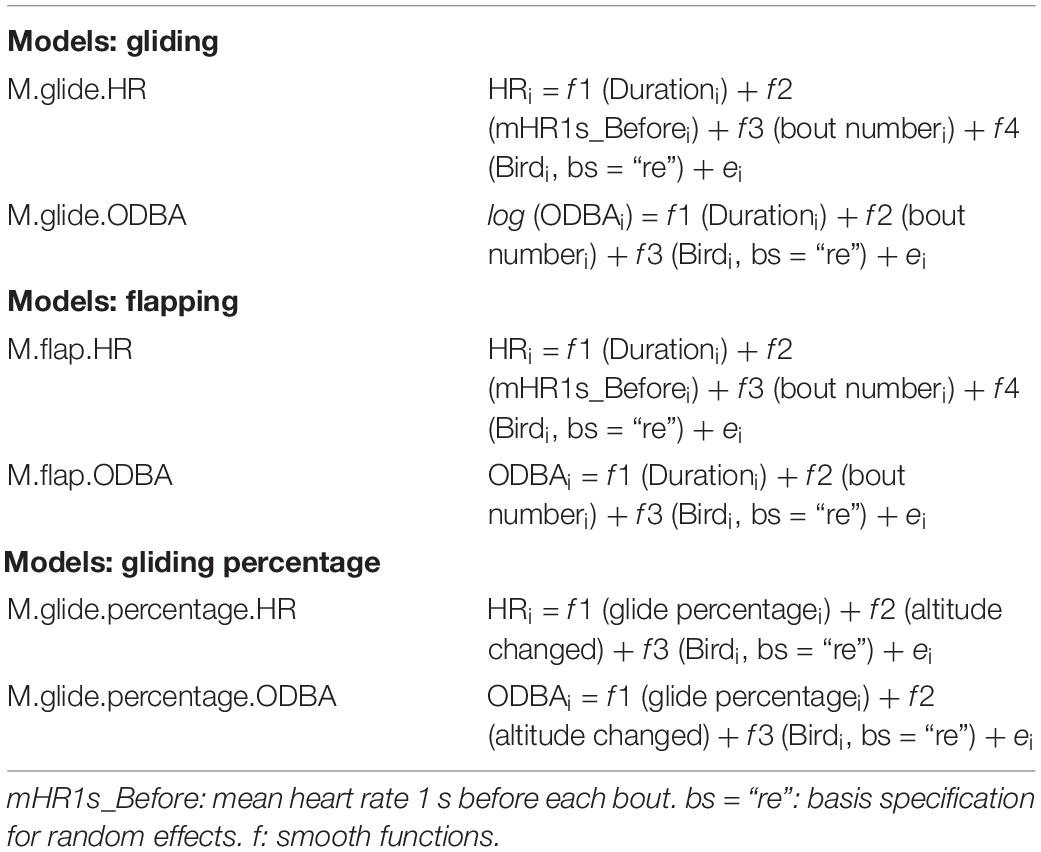
Table 1. Generalized additive mixed models models for explaining energy expenditure based on heart rate (HR) and overall dynamic body acceleration (ODBA) at two flying behaviors (flapping, gliding), and their proportion (gliding percentage) in Northern Bald Ibises.
To estimate GAMMs, we used the mgcv function “bam()” as it allows a known autoregressive order 1 (AR1) error term and is optimized for large data sets. Two numerical predictors (i.e., Duration = gliding/flapping duration; Bout number = chronologically ordered index of the gliding/flapping bout number) were included in all gliding and flapping models (Table 1). As the heart rate is a physiological parameter that does not change instantaneously, we included an additional predictor into the heart rate models during gliding and flapping (i.e., M.glide.HR and M.flap.HR; see Table 1) – the mean heart rate of the birds 1 s before each bout of gliding or flapping (mHR1s_Before) (Table 1).
All models were checked for autocorrelation and were corrected by including AR1 error models in GAMM functions if required (i.e., M.flap.HR, M.flap.ODBA, M.glide.percentage.HR, and M.glide.percentage.ODBA). The successful autocorrelation correction was confirmed by comparing the autocorrelation function of model residuals (ACF) before and after their correction. The function “gam.check” in the “mgcv” package was used for model diagnostics with appropriate adjustment of the number of knots in the smoothed functions when necessary. Additionally, we plotted the model-checks graphs using the function “getViz” in the “mgcViz” package (Fasiolo et al., 2020), which is an extension of the “mgcv” package. All model-checks graphs are presented in Supplementary Figures 2–10, 12. While examining the model diagnostics, we inspected the distribution of the residuals of the models and performed a log transform on the ODBA response variable when needed (M.glide.ODBA, see Table 1). No transformation was performed on the heart rate. The adjusted coefficient of determination (R2adj) was used as an overall measure of the goodness-of-fit of the model. The p-value for each explanatory variable indicates whether its effect within the model is significantly different from zero. All values are given as mean ± SE unless stated otherwise. The GAMM predicted fitted graphs were created using the “visreg” function from package “visreg” (Patrick and Woodrow, 2017). Additional graphs for all models are presented in Supplementary Figures 3–11, 13.
Results
We successfully recorded the heart rate, ODBA, and location of 5 different Northern Bald Ibises during free flights in autumn migration. The records were performed on different days and locations along the migration route from south Germany to Italy. During gliding, the mean heart rate and ODBA of all birds ranged from 390 to 437 bpm and 185 to 280 mg, respectively, while during flapping, heart rate and ODBA ranged from 419 to 450 bpm and 798 to 839 mg, respectively (Figure 2). The mean heart rate for all flights, including flapping and gliding phases was 428.93 bpm. We found that during intermittent flight, the birds were gliding 7–22.2% of the time (Table 2).
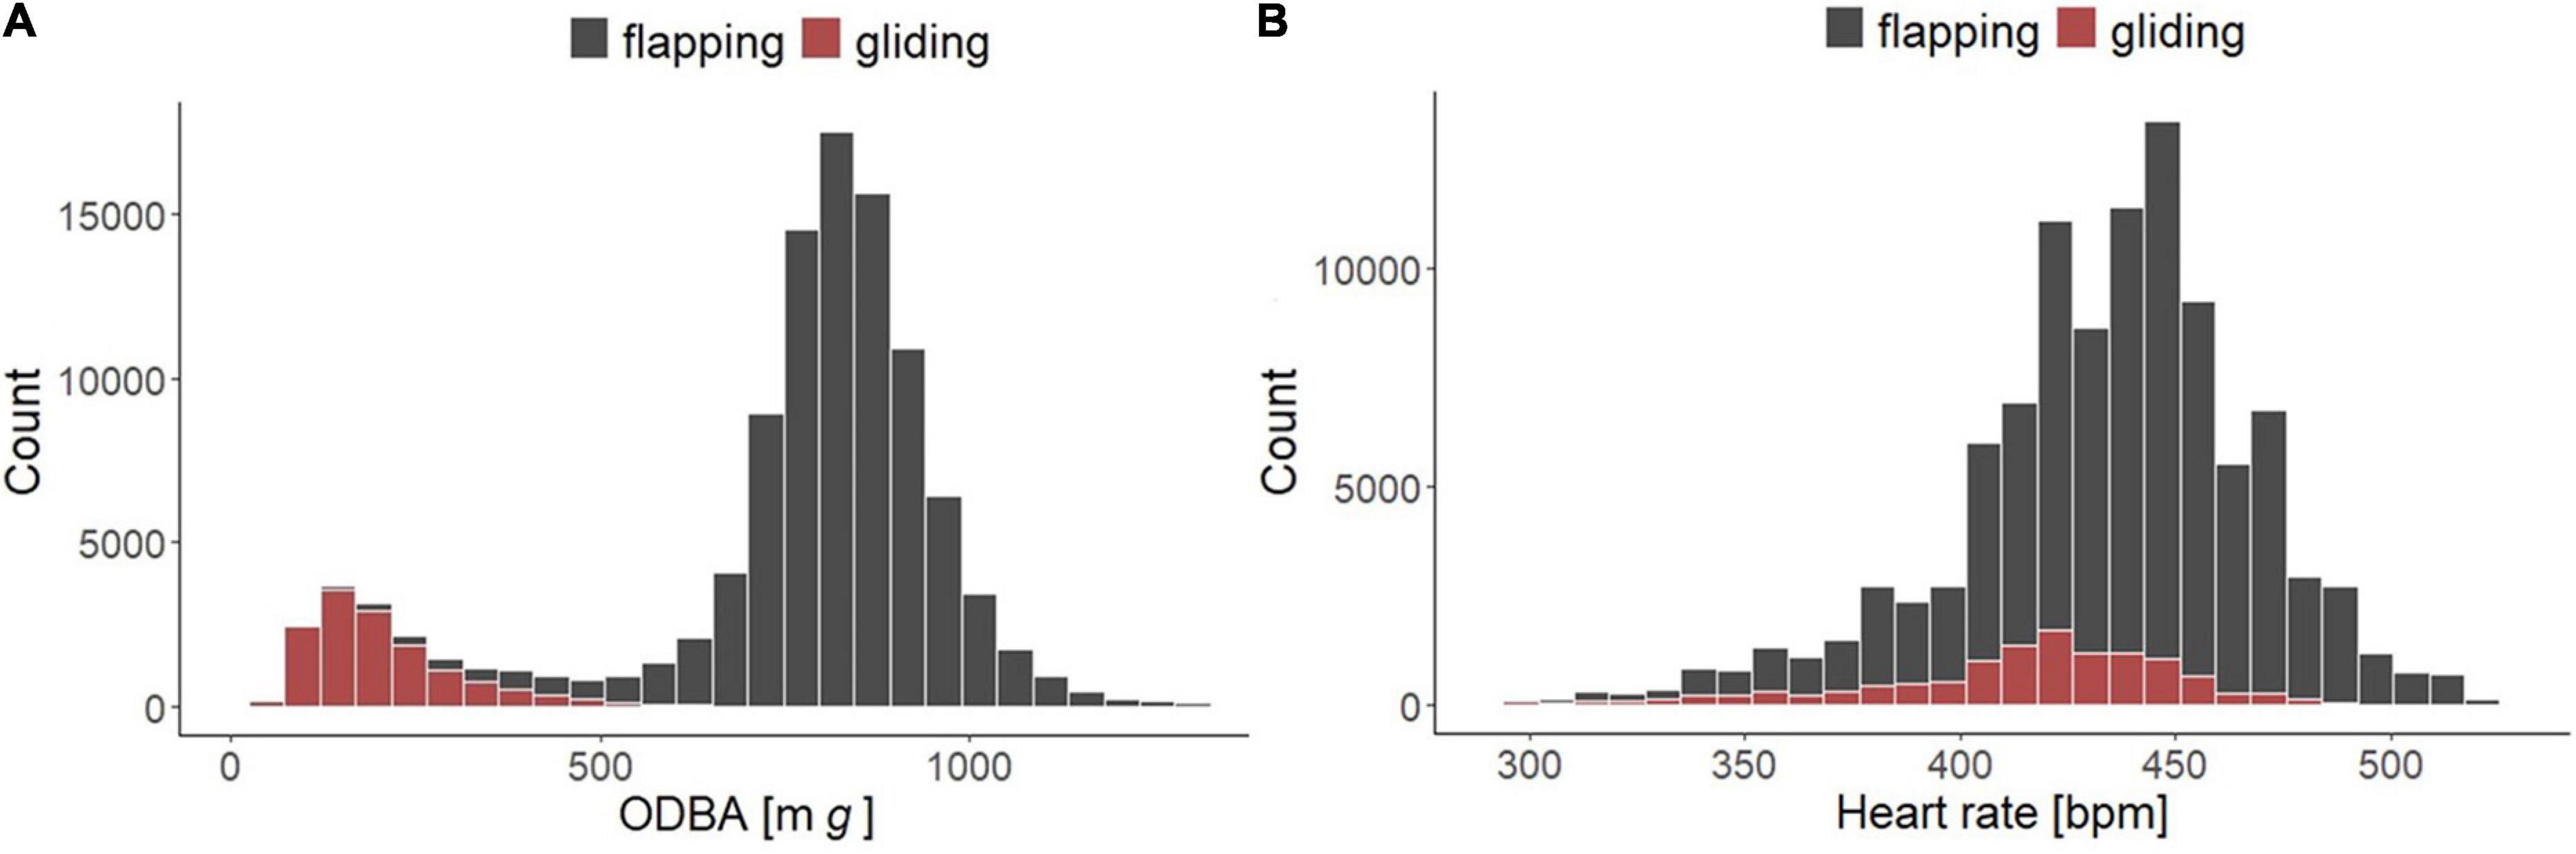
Figure 2. Frequency distribution for Northern Bald Ibises (n = 5 birds) of panel (A) bimodal ODBA (mg). Gray bars represent ODBA measured during flapping (N = 92,697), and red bars indicate ODBA measured during gliding (N = 14,092). (B) Heart rate (bpm). Gray bars represent heart rate measured during flapping (N = 89,845), and red bars indicate heart rate measured during gliding (N = 11,904).
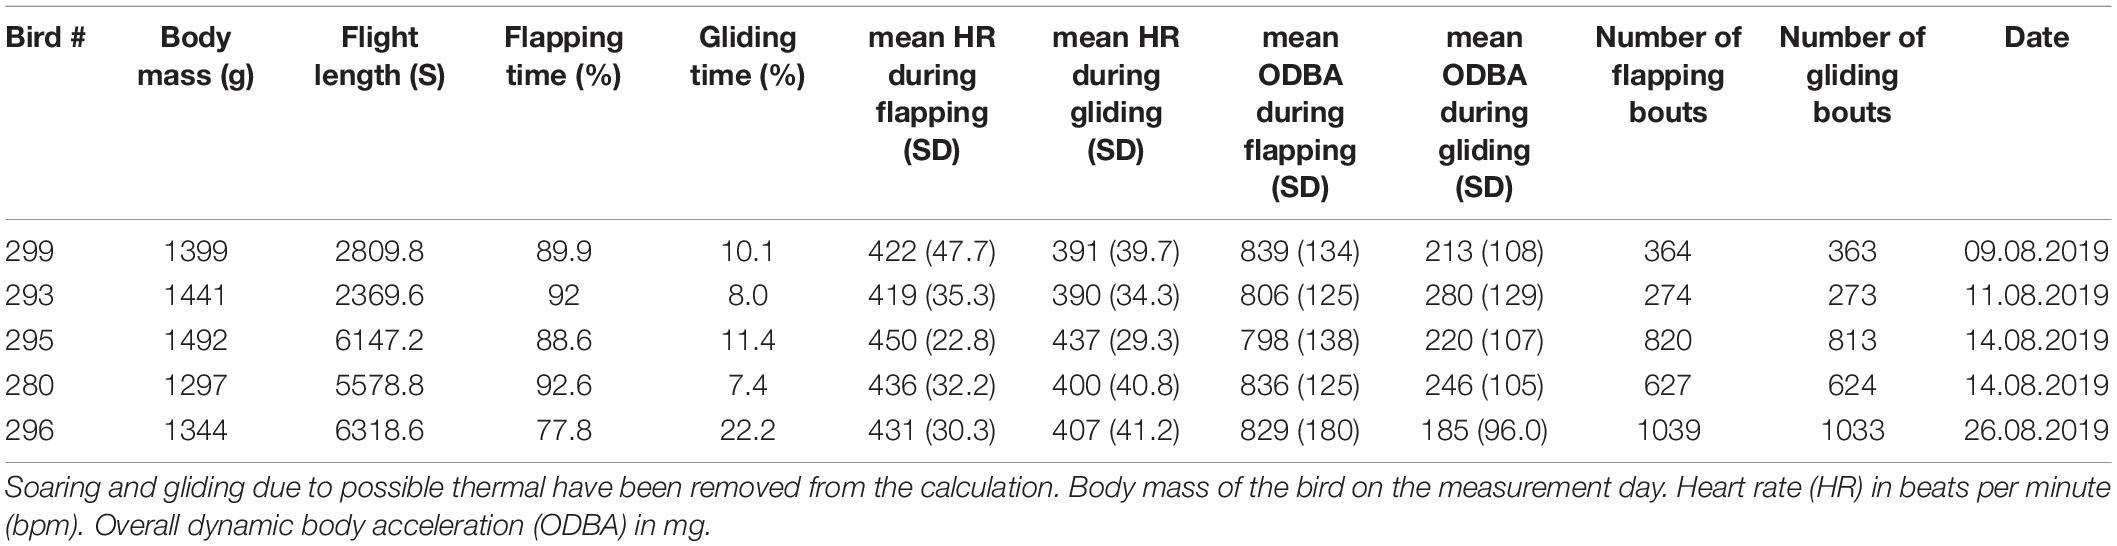
Table 2. Summary statistics for flight performance of Northern Bald Ibis (n = 5).
We performed a Spearman’s rank correlation test between heart rate and ODBA data for the gliding and flapping separately. We found a relatively poor correlation between heart rate and ODBA during gliding bouts (rho, R = 0.15, p-value < 0.001) and flapping bouts (rho, R = 0.37, p-value < 0.001) (Supplementary Figure 14). In addition, we tested for correlation between heart rate and ODBA using the 1-min sections dataset (see section “Materials and Methods”) and found a higher correlation (rho, R = 0.67, p-value < 0.001, Supplementary Figure 15).
The Effect of Gliding Duration on Heart Rate and Overall Dynamic Body Acceleration
The fitted GAMM M.glide.HR, to measure the effect of gliding on heart rate, had a high explanatory power for the change in heart rate during gliding (R2adj = 0.916, Table 3). We found a significant relation between the length of gliding and the bird’s heart rate, with a decrease of heartbeats with every additional second of gliding (Figure 3A and Table 3). After only 1 s of gliding, the heart rate decreased by 0.7%, and by the fourth second by 1.5% compared with flapping. The mean heart rate 1 s before each glide was, as expected, a very strong linear predictor of the heart rate value (Supplementary Figure 3). On the other hand, the gliding bout number had no significant effect on the heart rate during glides (Figure 3B). The fitted GAMM M.glide.ODBA, to measure the effect of gliding on ODBA (Table 1), had an explanatory power of 0.34 (R2adj, Table 3). The two separate smooth terms for the gliding duration (Duration) and gliding bout number had a significant effect on the change of ODBA during gliding (Table 3). We found that the ODBA decreased sharply by 8.9% during the first 2 s of the glide but continued to decrease at a slower rate during longer glides than 2 s (e.g., after 4 s ODBA decreased by 10.7%) (Figure 3C and Table 3). In addition, in short glides up to about 1 s, the ODBA was higher than the mean during gliding (Supplementary Figure 5). Also, we found that the ODBA was slightly higher at the early and late stages of the flight compared to the middle part of the flight (Figure 3D).
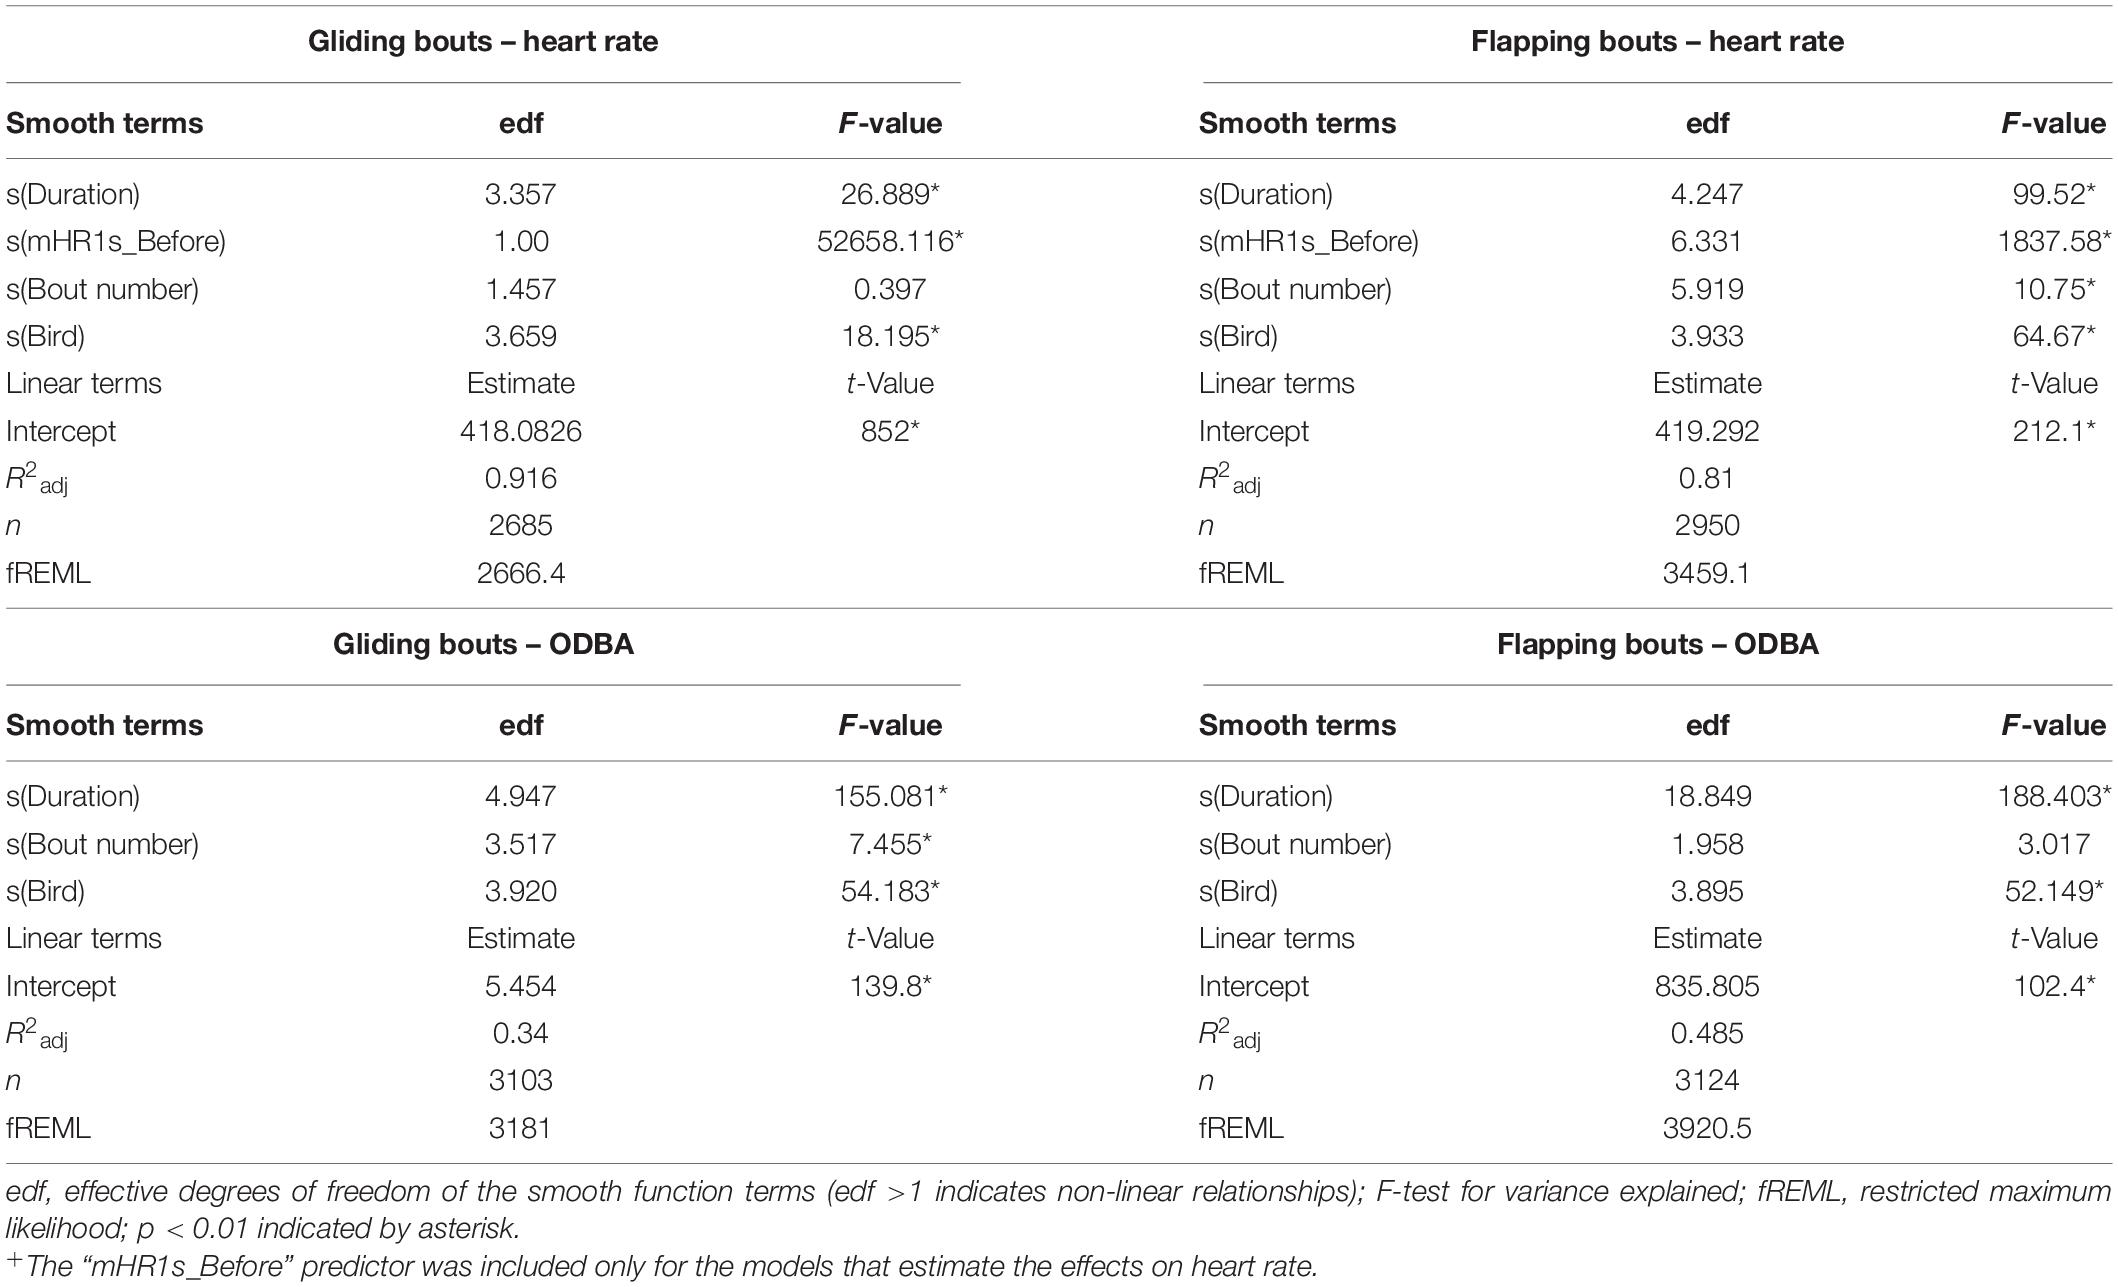
Table 3. Generalized additive mixed model estimates of the effects of flapping/gliding duration, mean heart rate of the birds 1 s before each bout (mHR1s_Before)+ and bout number on heart rate and ODBA in Northern Bald Ibis.
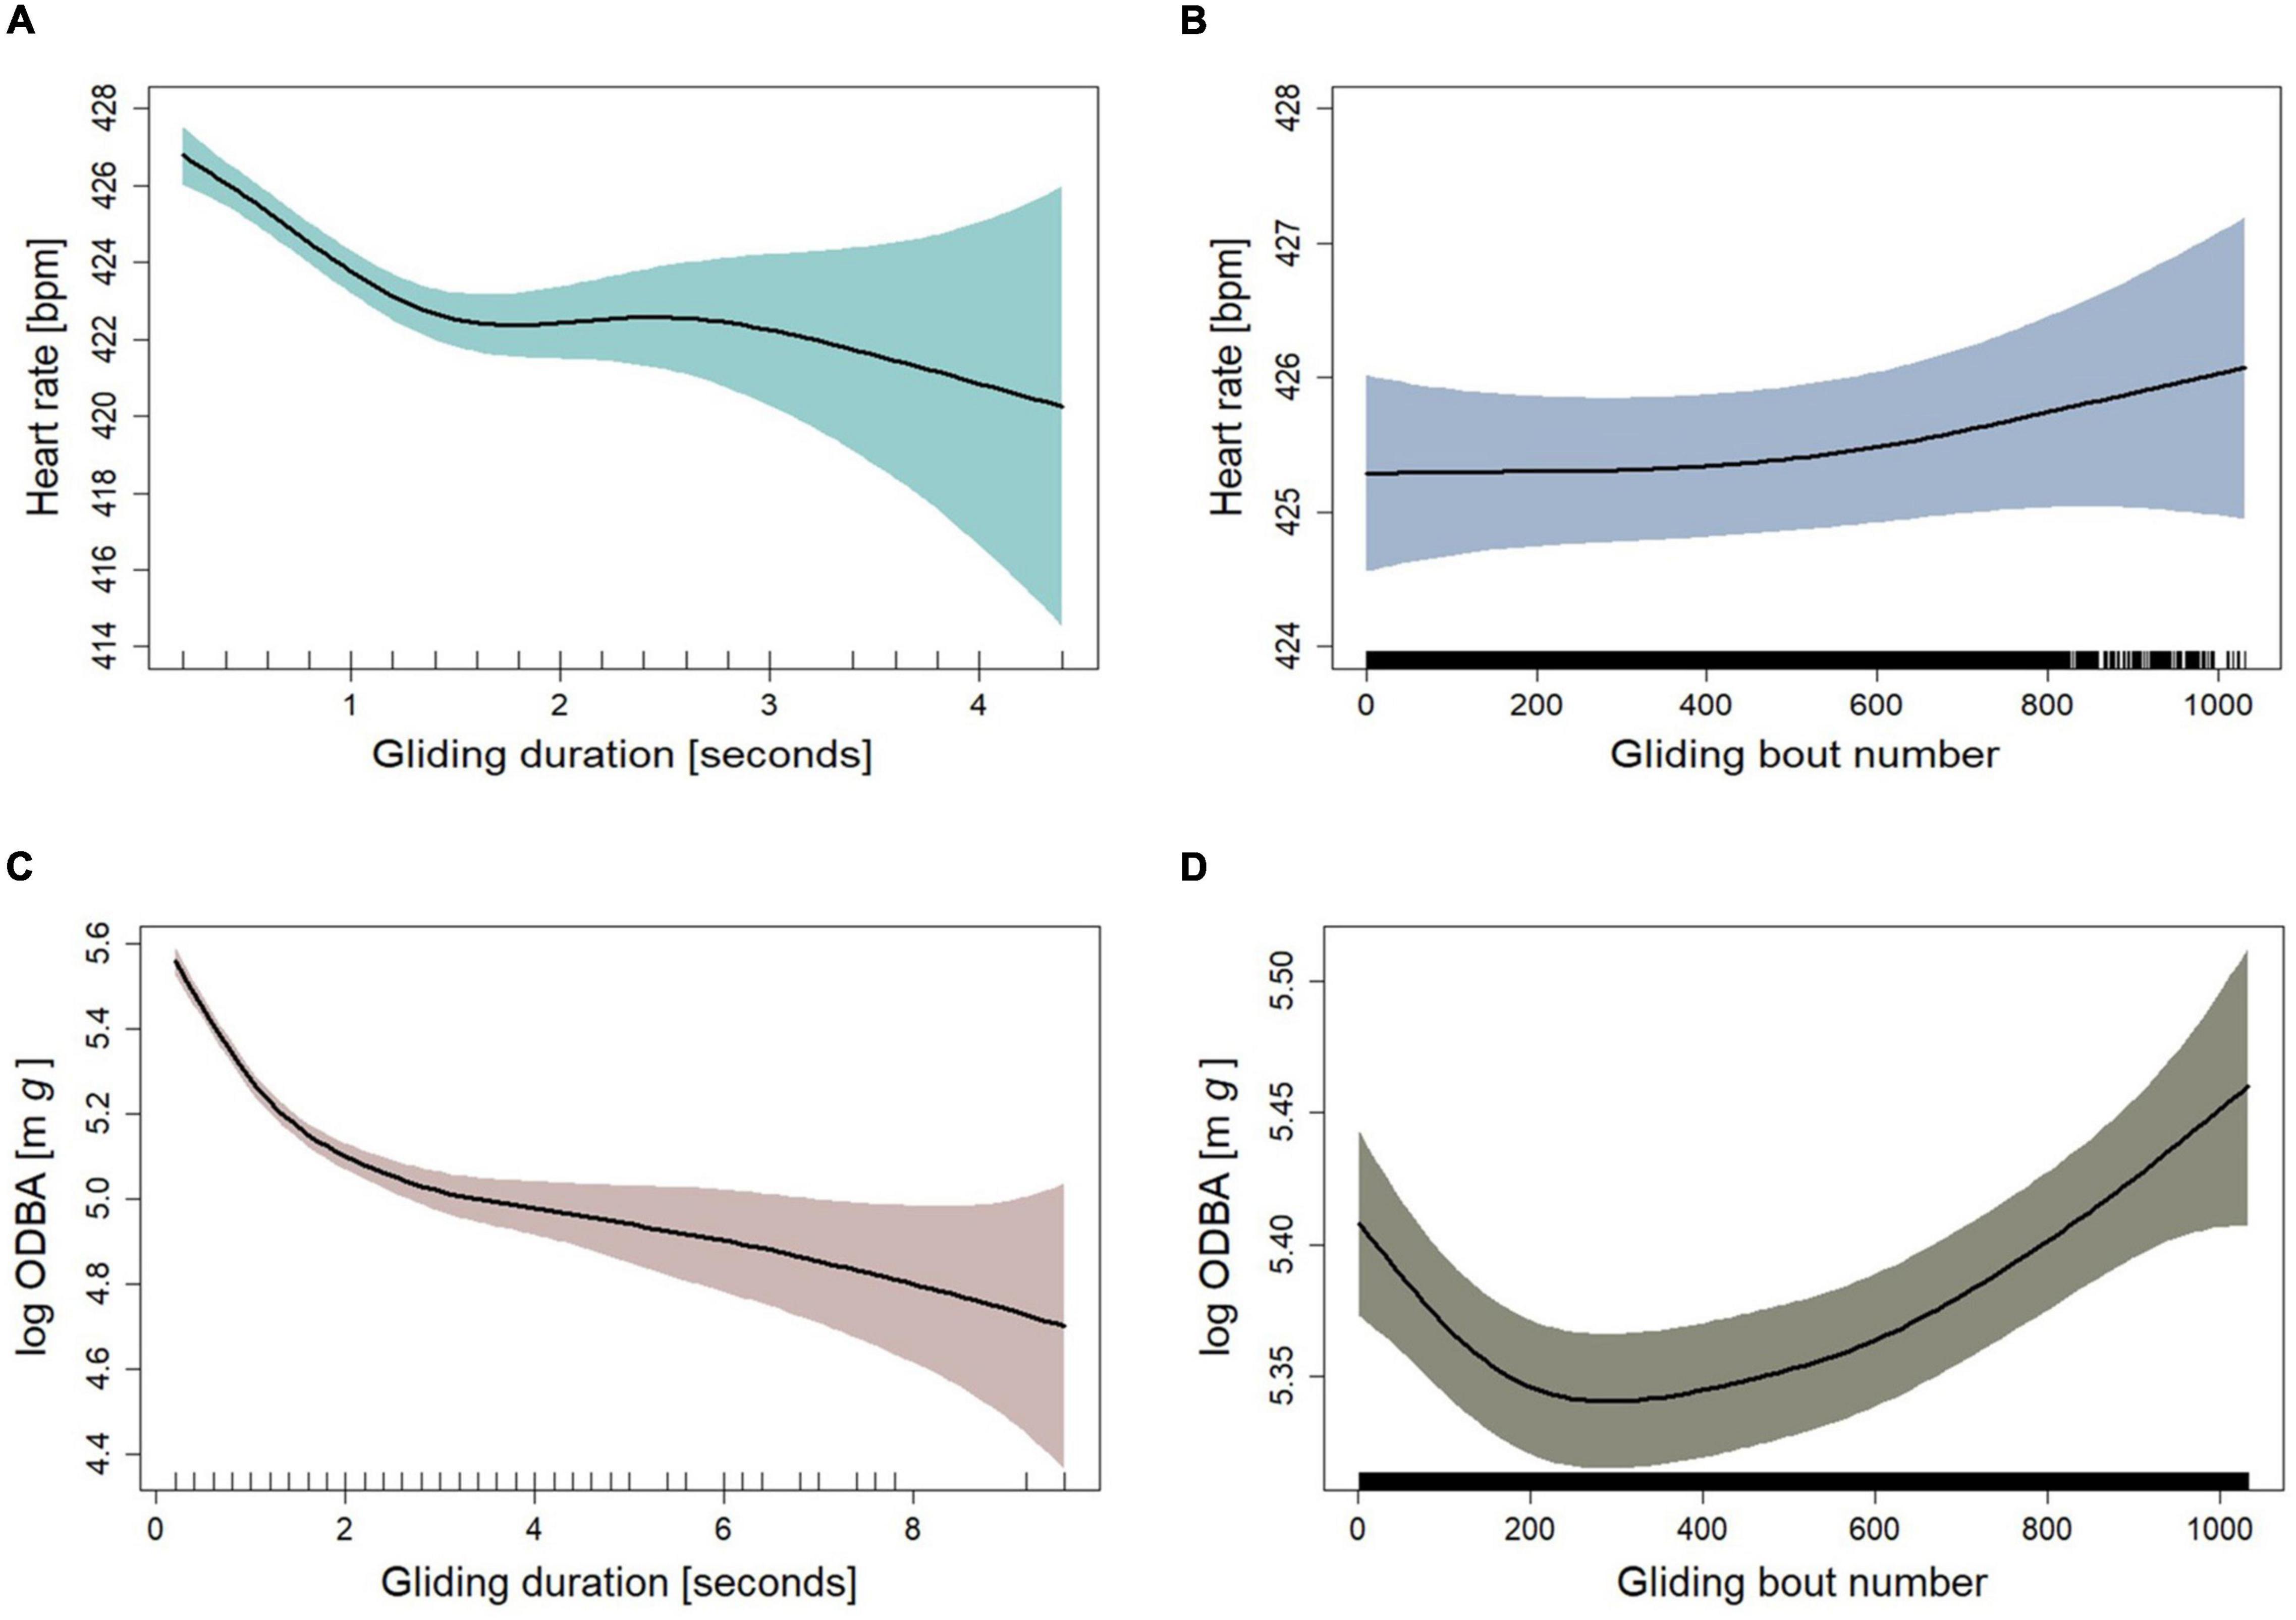
Figure 3. Fitted curves for heart rate as a function of (A) gliding duration and (B) glide bout number as fitted in GAMM M.glide.HR (n = 2685). Fitted curves for log ODBA as a function of (C) gliding duration and (D) glide bout number as fitted in GAMM M.glide.ODBA (n = 3103). (A–D) Shown are fits plus 95% confidence intervals (colored areas) from mixed models. The “rug” plots on the horizontal axes indicate the temporal distribution of data points.
The Effect of Flapping Duration on Heart Rate and Overall Dynamic Body Acceleration
By definition, flapping bouts were bouts where birds were not gliding for 0.2 s or longer. For the birds’ performance during flapping bouts, we found a significant increase in heart rate and ODBA with the increase of the duration of the flapping bout (Table 3). As there were only thirteen flapping bouts longer than 80 s, we exclude them from the model, as predictions based on these scarce data seemed unreliable. The fitted GAMM M.flap.HR, to measure the effect of flapping on heart rate, had a high explanatory power for the change in heart rate during gliding (R2adj = 0.81, Table 3). The heart rate increased sharply during flapping bouts of up to about 30 s. At flapping duration longer than 40 s, the increase in heart rate stabilized (Figure 4A). At flapping bouts longer than about 18 s, the heart rate increased above the mean flapping heart rate (Supplementary Figure 7). Along with the flapping duration, we found that the flapping bout number had a significant effect on the heart rate during flapping (Table 3). The heart rate was at its highest level at the early phase of the flight and decreased by 6–7 bpm as the flight persisted (Figure 4B). As with the heart rate during gliding, the mean heart rate 1 s before each flapping bout as a predictor of the change in heart rate during flapping, contributed greatly to the model (Table 3 and Supplementary Figure 7). ODBA during flapping bouts increased substantially within the first few seconds and stayed relatively constant with a slight increase during longer flapping periods (Figure 4C), and at a higher level than the mean ODBA during flapping (Supplementary Figure 9). We found no significant effect between the flapping bout number and the level of ODBA during flapping (Figure 4D and Table 3). However, a slight decrease in ODBA toward the end of the flight was notable. This model (M.flap.ODBA) had an explanatory power of 0.485 (R2adj) for the change in ODBA during flapping (Table 3).
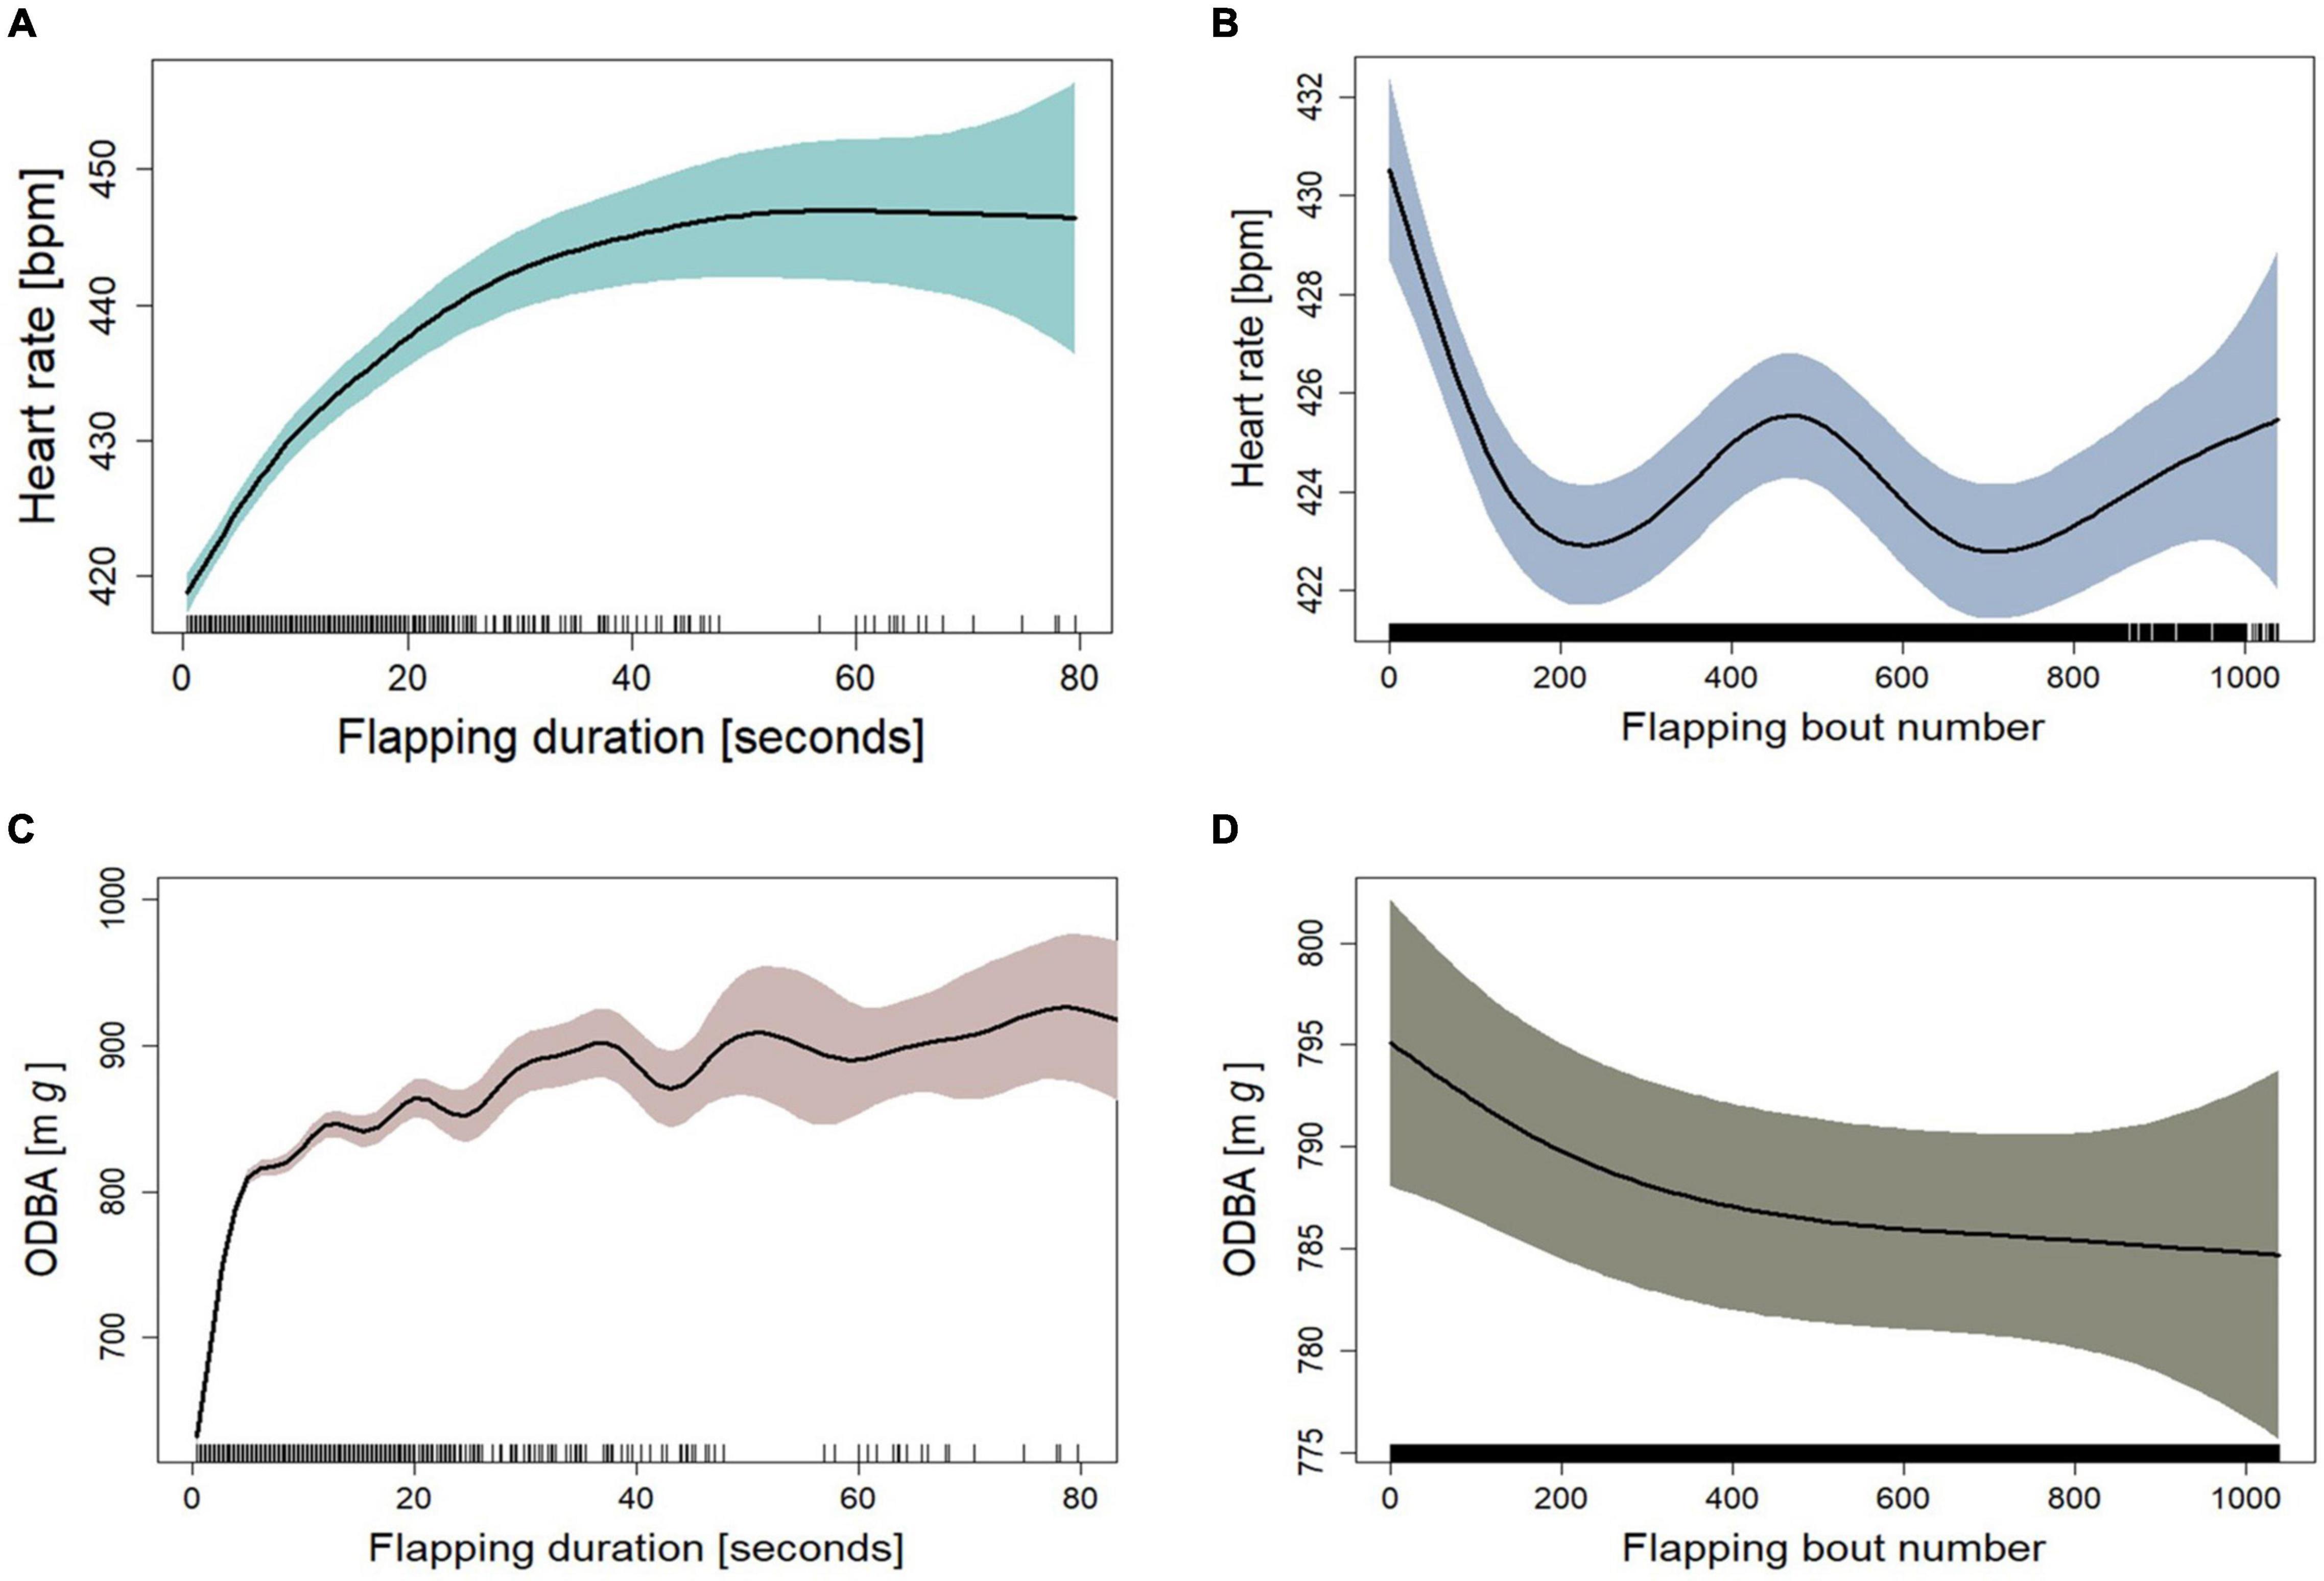
Figure 4. Fitted curves for heart rate as a function of (A) flapping duration and (B) flapping bout number as fitted in GAMM M.flap.HR (n = 2950). Fitted curves for ODBA as a function of (C) flapping duration and (D) flapping bout number as fitted in GAMM M.flap.ODBA (n = 3124). (A–D) Shown are fits plus 95% confidence intervals (colored areas) from mixed models that adjusted for individual levels of the five birds. The “rug” plot on the horizontal axis indicates the temporal distribution of data points.
The Effect of Gliding Percentage on Heart Rate and Overall Dynamic Body Acceleration
After splitting the entire flight dataset into sections of 1 min and calculating the gliding proportion per section (from 0% to a maximum of 67.3%), we predicted the levels of heart rate and ODBA at different gliding proportions (Table 2). With heart rate as a response variable (M.glide.percentage.HR), we found that all the predictors were significant with explanatory power (R2adj) of 0.581 (Table 4). The heart rate during flight sections containing less than about 14% gliding was elevated compared to the mean heart rate during the entire flight. Gliding more than 14% per section resulted in a lower heart rate than the mean (Supplementary Figure 11). The heart rate decreased by approximately 40 bpm up to about 20% gliding time but stayed relatively constant at higher gliding proportions (Figure 5A). The change in altitude had a positive effect on the heart rate (Figure 5B and Table 4). All predictors in the fitted GAMM for ODBA during flight at different gliding proportions (M.glide.percentage.ODBA) were significant with high explanatory power (R2adj) of 0.946 (Table 4). As expected, ODBA decreased with the increase in gliding proportion (Figure 5C; Halsey et al., 2009b; Duriez et al., 2014). Up to a gliding percentage of approximately 10%, ODBA decreased at a higher rate than at higher gliding percentages. In addition, up to a gliding proportion of about 18%, the level of ODBA was higher than the mean ODBA during flights (Supplementary Figure 13). Above 18% of gliding time, the ODBA remained below the mean. The change in altitude had a positive effect on the change in ODBA (Table 4). The level of ODBA decreased with losing altitude and increased when the birds gained altitude (Figure 5D). Nevertheless, with altitude losses of about 50 m, the decrease in ODBA was demoted.
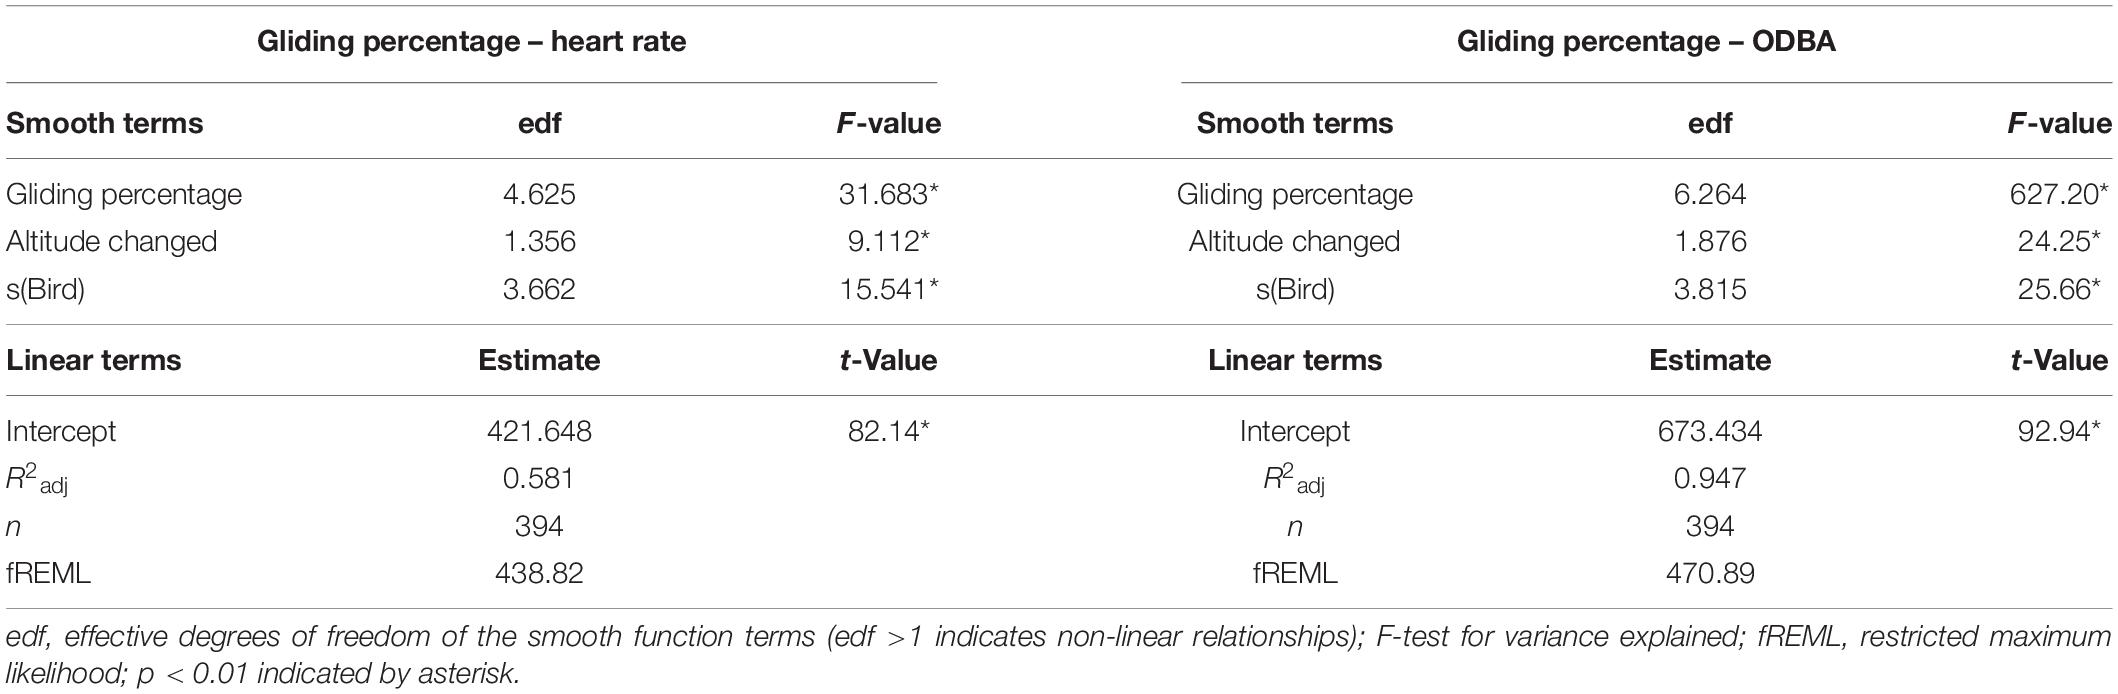
Table 4. Generalized additive mixed model estimates of the effects of gliding percentage on heart rate and ODBA in Northern Bald Ibis.
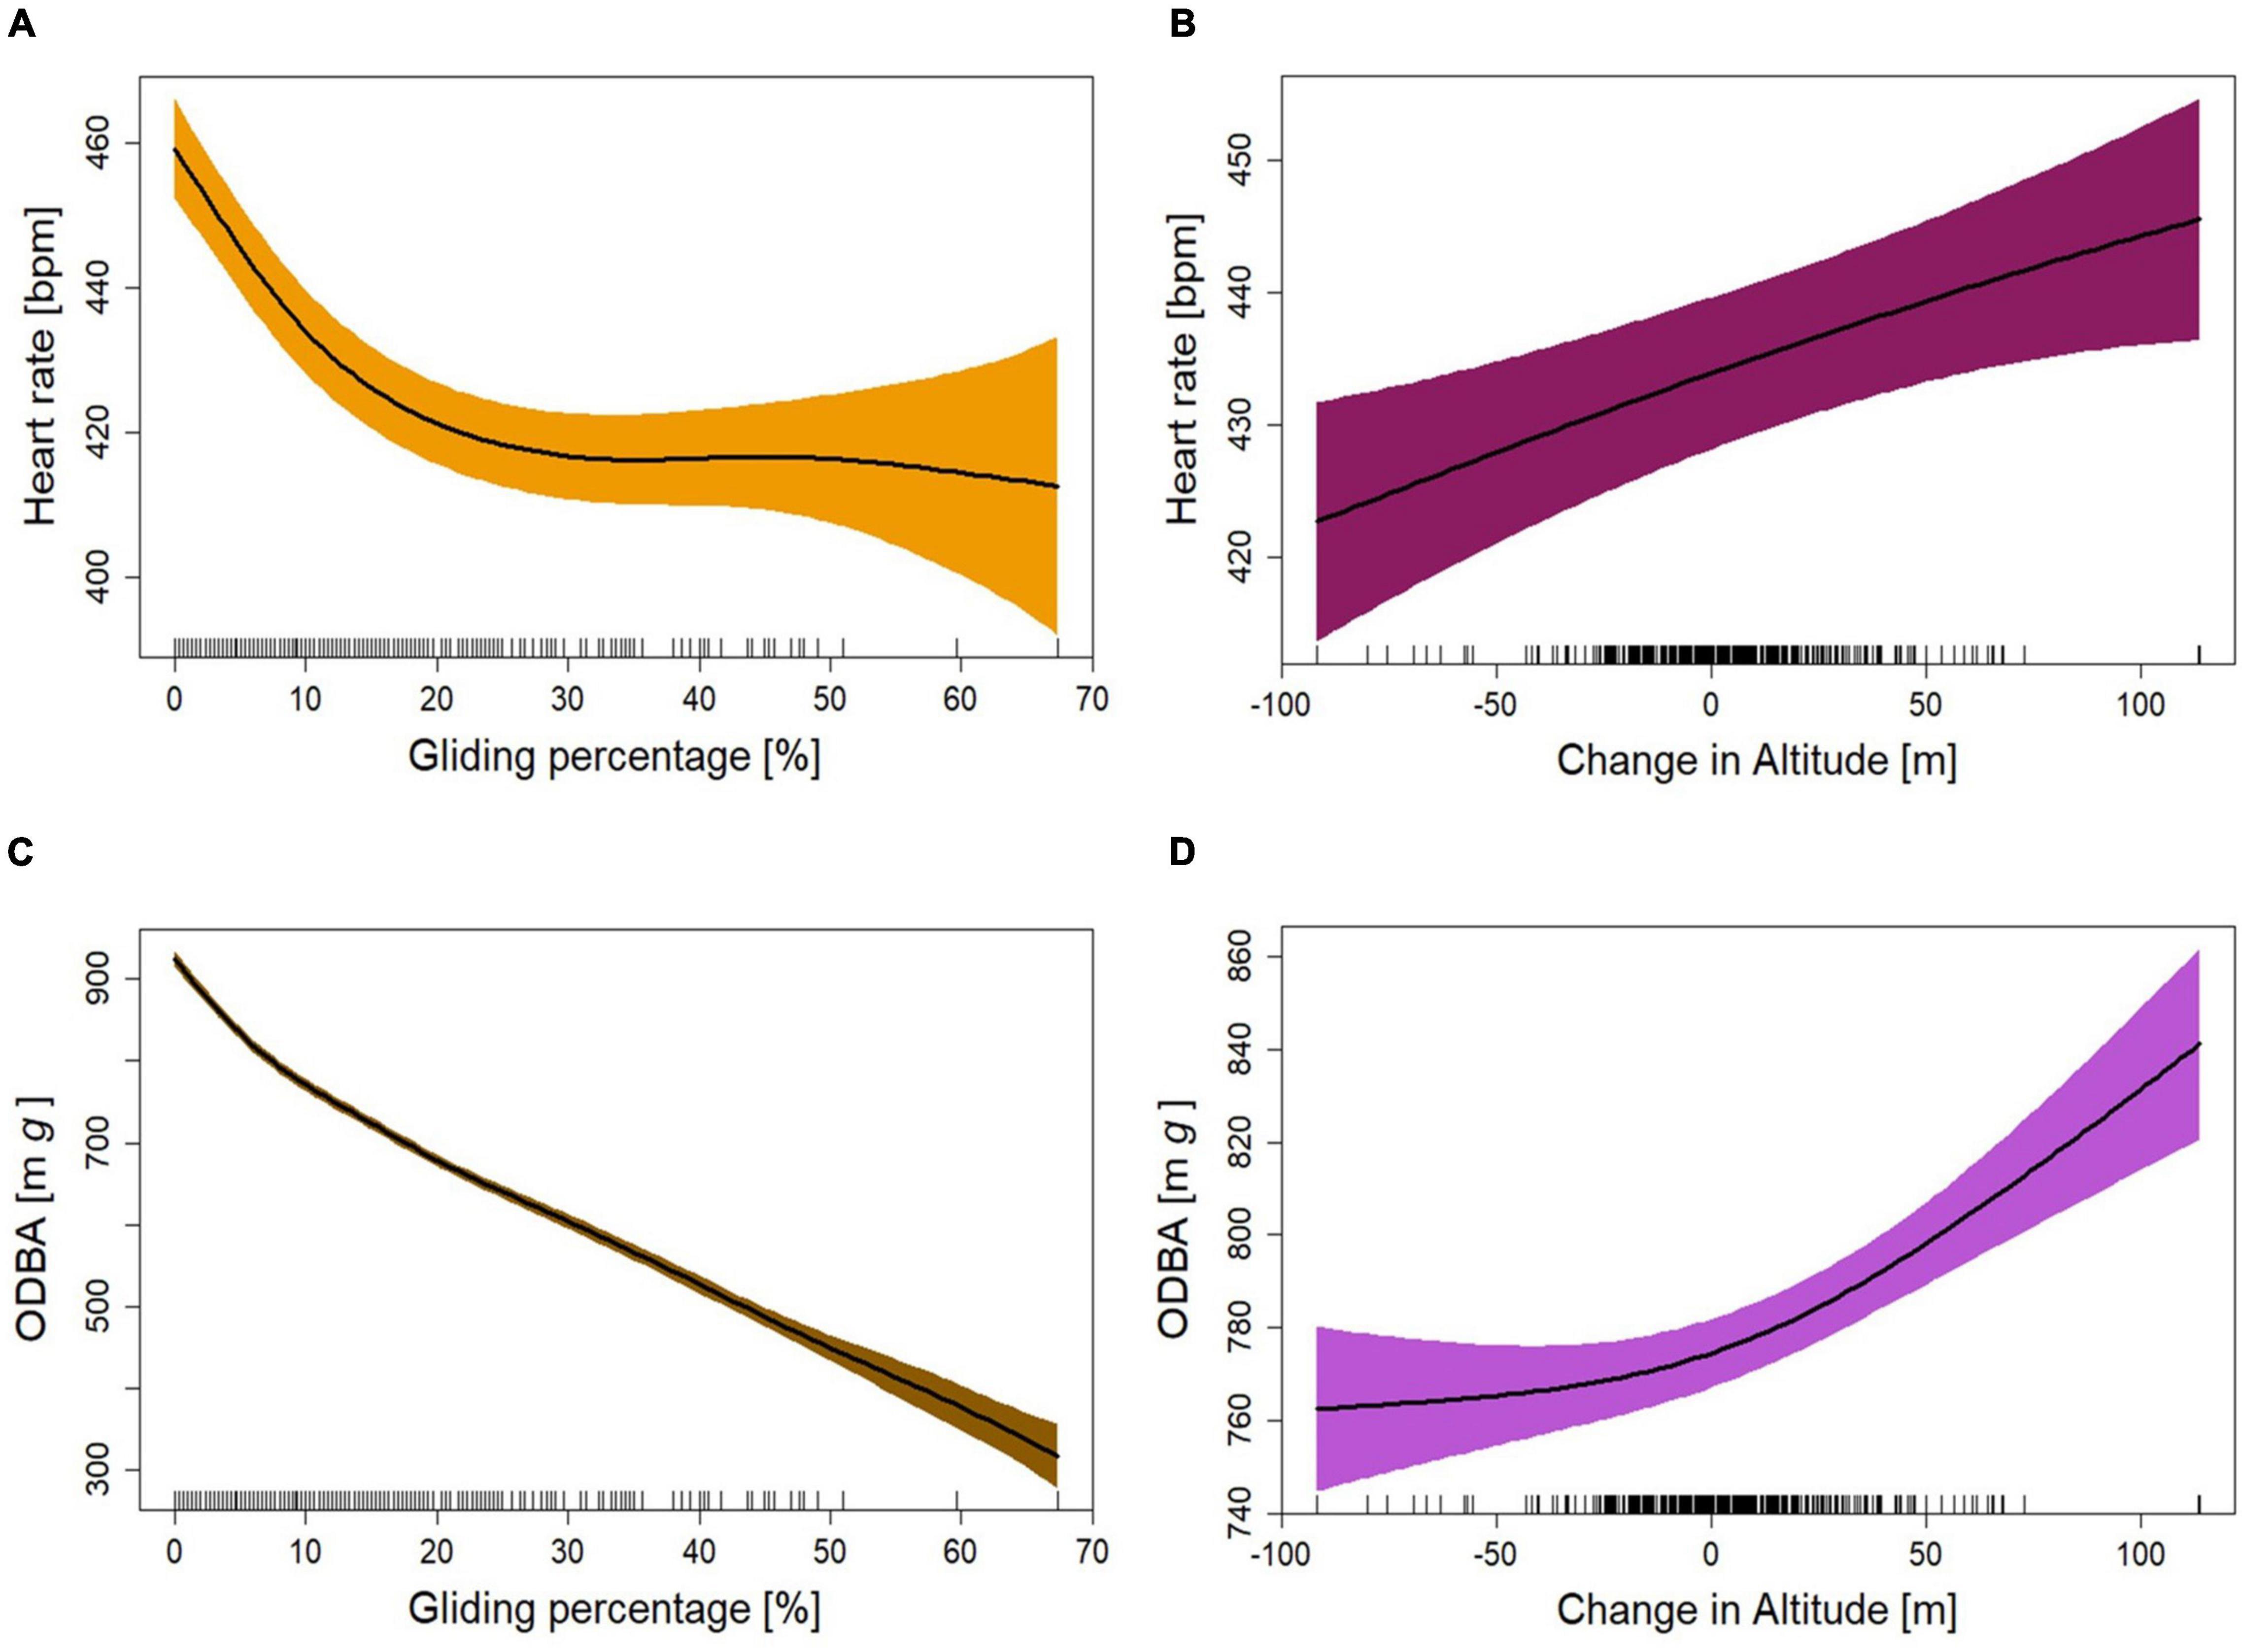
Figure 5. Fitted curves for heart rate as a function of (A) gliding percentage and (B) change in altitude as fitted in GAMM M.glide.percentage.HR. Fitted curves for ODBA as a function of (C) gliding percentage and (D) change in altitude as fitted in GAMM M.glide.percentage.ODBA. (A–D) Shown are fits plus 95% confidence areas (colored areas) from mixed models that adjusted for individual levels of the five birds. The “rug” plots on the horizontal axes indicate the temporal distribution of data points.
Discussion
The motion sequence of flapping and gliding during intermittent flight is well documented (Rayner, 1995; Tobalske, 2010; Wehner et al., 2022). While empirical studies are scarce, theoretical models have linked possible energy savings to the reduced mechanical power in intermittent flight compared to steady flight (Tobalske and Dial, 1994; Rayner, 1995; Rayner et al., 2001; Sachs, 2017). Thus, to the best of our knowledge, this is the first empirical study that links gliding proportion and different gliding and flapping durations during intermittent flight with heart rate and ODBA as a proxy for energy expenditure.
This study shows that Northern Bald Ibises perform a flight mode containing a flexible alternation of flapping and gliding phases to achieve lower flight costs. The most frequently recorded gliding bouts and flapping bout durations were short and in the region of up to 2 and 5 s, respectively (Supplementary Figures 16, 17).
The energy saving and loss of altitude during intermittent glide phases need to balance the energy expense to restore altitude and speed during the flapping phase in order to attain energy gain. Part of the energy cost to regain altitude and speed depends on the relative time spent gliding. When the gliding proportion during intermittent flight increased due to longer gliding bouts, the bird lost more altitude (Supplementary Figure 18), and thus, more speed and power were needed to build up by flapping to compensate for the lost altitude. Our results indeed showed a rapid reduction in mean heart rate up to 20% gliding, however, only minimal further reduction of heart rate was measured at higher gliding proportions (Figure 5A). In addition, a flight with a higher gliding proportion reduced the flight speed and may affect the overall migration speed (Alerstam and Lindström, 1990; Hedenström, 1993). In this study, the median gliding duration during intermittent flight was 0.8 s (Supplementary Figure 16)–during which the median loss of altitude was −0.078 m (the median loss of altitude for all gliding phases durations = −0.048 m). Thus, we conclude that in most gliding phases, the birds had to build minimal flight speed and power to compensate for the reduction in fight speed and lost altitude.
The duration of flapping and gliding had clearly a pronounced impact on heart rate and ODBA. During gliding, we measured a rapid decrease, particularly during the first 1.5–2 s. After already 1 s of gliding, the heart rate, and ODBA decreased by 0.7 and 7.1%, respectively. During flapping the heart rate increased steadily but stabilized at longer flapping durations (Figure 4A). Thus, we are convinced that the mean heart rate of 465 bpm during flapping bouts of 60–80 s, represents the average heart rate during continuous flapping. We found a constant decrease in the mean heart rate up to a gliding proportion of about 20% (Figure 5A), which resulted in approximately 11% heart rate reduction compared to continuous flapping flight (Figure 6). At gliding percentages higher than 20%, a further reduction in heart rate was only 1%. Thus, we consider that for Northern Bald Ibises, a gliding proportion of about 20% can optimize their energy savings during flight and overall migration journey.
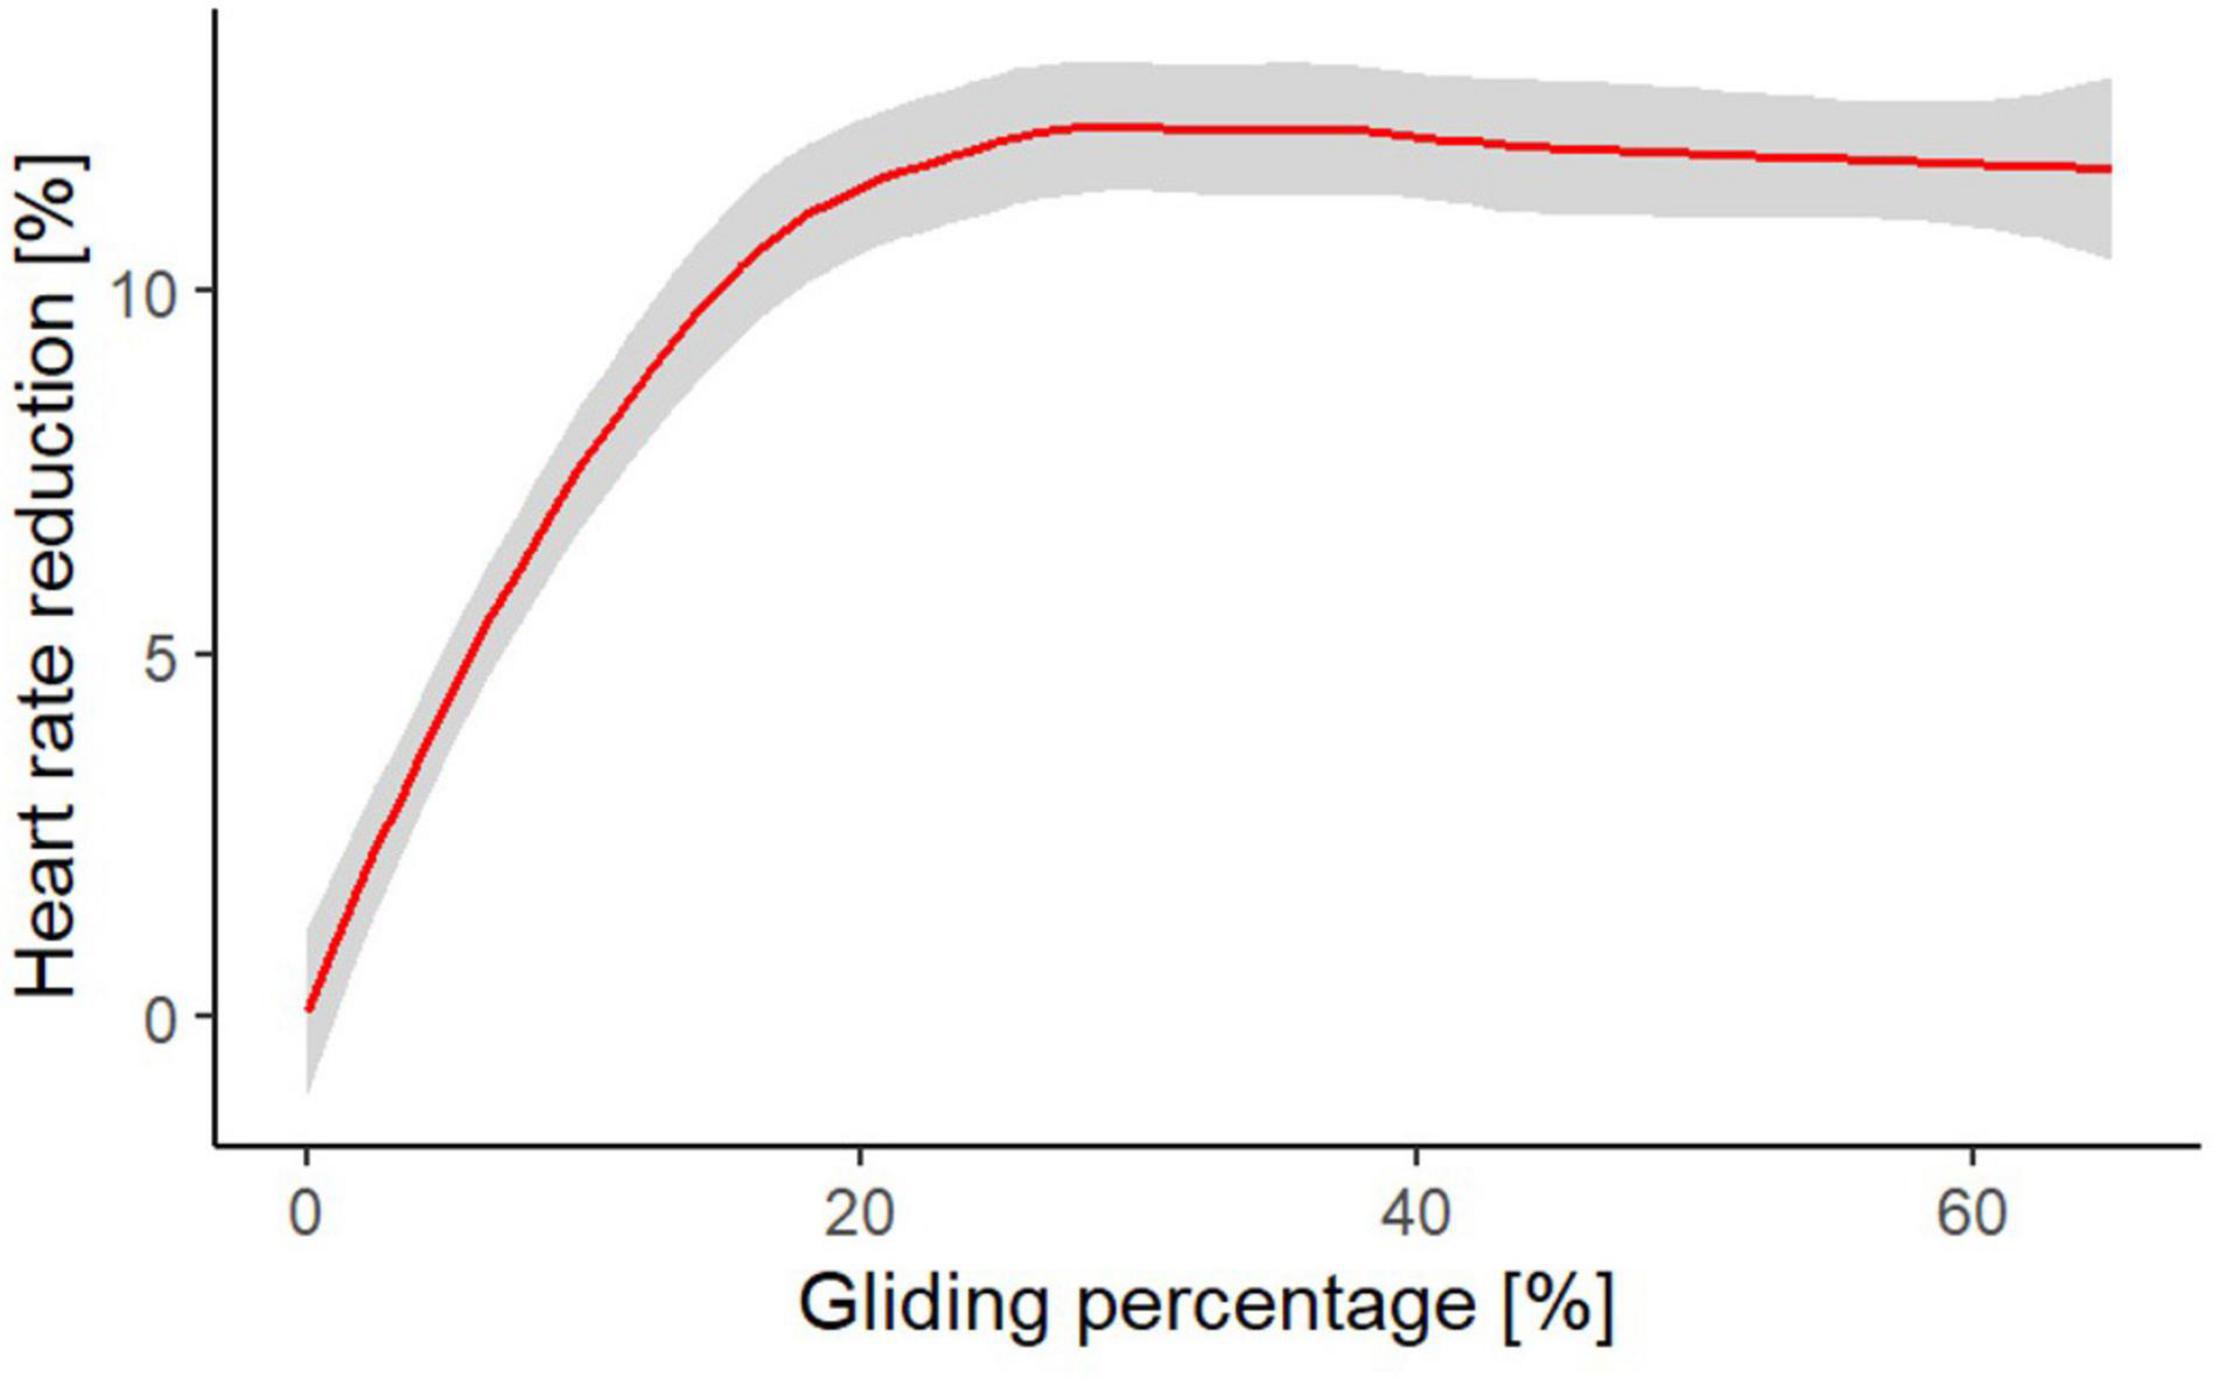
Figure 6. Heart rate reduction based on mean heart rate measurement at different gliding proportions in comparison to the mean heart rate during continuous flapping flight (i.e., the mean heart rate at the longest continuous flapping bouts (60–80 s) we recorded).
Estimates on the amount of energy saving during intermitted gliding flight vary considerably. In a theoretical study, Sachs (2017) assumed up to 35% energy saving at gliding proportion of about 80% during intermittent gliding flight in aerial roosting swifts, when compared with continuous flapping flight. That study showed that the most frequently observed duration of gliding phases is 3 s followed by 2 s flapping phases (Sachs, 2017). At this alternating frequency, Sachs and colleagues estimated 28% energy saving based on a model that accounts for the dynamics of the flight motion. In another theoretical study on swifts that measured similar gliding proportion, the authors estimated a 15% improvement in flight economy due to intermittent flight (Muijres et al., 2012). Also, based on a simple flap-gliding flight model, which estimates the variation of mechanical power output with flight speed in starlings, the authors arrived at an estimate of 11% energy saving during intermittent flight with a gliding proportion of 75% (Rayner, 1985). These theoretical studies varied greatly with the energy-saving estimation due to intermittent flight. Additionally, the gliding proportions calculated in these studies are much higher than the one calculated for the Northern Bald Ibises. In our empirical study, the energy saving increased during intermitted flight up to a maximum of 12% for the highest measured gliding proportion of 67.3% (Figure 6). A possible explanation for the differences between the studies could be due to the fact that Northern Bald Ibises are larger compared with swifts and starlings, however, it could also be due to a wing shape that profits less from this flight technique. Moreover, theoretical models predict energy savings based on still air. When birds fly in nature, it is affected by environmental conditions, which can influence the gliding proportions and thus the energy expenditure.
Flight types were clearly distinguishable based on the accelerometer data. The combination of ODBA, and the data of the heave axes to define wing beats, allowed the accurate classification of active and passive flight types. While we found that ODBA and heart rate have the same trend of change with the bird’s activity, the rate of change differed between them. For example, as gliding percentages increased, the heart rate decreased rapidly up to a gliding percentage of about 20% but followed by very moderate to no change in heart rate at higher gliding percentages (Figure 5A). On the contrary, a fast decrease in ODBA appeared up to a gliding percentage of about 6% followed by a rather linear decrease at higher gliding percentages (Figure 5C). Indeed, we found a rather poor correlation between these two methods with large variation in heart rate at any level of ODBA. Yet, the correlation increased markedly when values were averaged over a longer time scale (Supplementary Figure 15). This is in contrast to expected correlations based on previous considerations (Duriez et al., 2014; Weimerskirch et al., 2016) and other studies that claimed that for an active animal, acceleration data can provide estimates for metabolic rate with similar accuracy to those made using heart rate measurements (Halsey et al., 2008, 2009a; Green et al., 2009). The bimodal distribution of ODBA in flapping flight (Figure 2A) may partly account for the weak correlation we measured (Shepard et al., 2008a). Generally, the relationship between ODBA and energy expenditure is known to depend on the kind of animal movement (Gleiss et al., 2009; Laich et al., 2009; Hicks et al., 2020), with good relationships during flight at low-resolution measurements and diving behavior, but poor relationships with overestimates in energy expenditure at resting behavior (Hicks et al., 2020) or in measurements at very high sampling resolutions like in our study. Thus, we suggest that ODBA may predict estimates for heart rate measurements merely at a constant activity (e.g., continues flapping flight) or at a lower temporal measurement.
During gliding phases, ODBA was affected by the stage of the flight. We calculated the lowest values in the middle of the flight (Figure 3D), presumably because of relatively longer gliding bouts as the birds reached cruising altitudes (Supplementary Figure 19). In addition, at longer gliding bouts, the artifact of the previous flapping bout acceleration is low. Nevertheless, the heart rate during gliding was not affected by the stage of the flight (Figure 3B). This finding might be a result of a relatively equal distribution of the gliding throughout the entire flight (Supplementary Figure 19), which did not allow pronounced deference in heart rate at different flight stages.
In contrast to the different flight stages while gliding, during flapping phases we documented opposing results for the heart rate and ODBA. After excluding the parts after taking off and before landing, we documented slightly higher levels of heart rate at early and late stages of the flight. We could indeed see that the flapping duration for all birds was the highest at the earlier phase of the flight and for most birds also toward the end of the flight (Supplementary Figure 20). However, the flight stages during flapping had no significant effect on ODBA. Nevertheless, we could notice a higher level of ODBA at the early stage of the flight that decrease slightly as the flight progressed. This may be partly an artifact of the take-off when the birds still gained altitude and flapped in longer bouts durations (Supplementary Figure 20) until reaching cruising altitudes (Gatt et al., 2020). Another possible reason for the decrease in ODBA as the flight progressed is that the birds adjusted their positions to take advantage of energy-saving from formation flight and the upwash created by the preceding bird (Hummel, 1995; Weimerskirch et al., 2001; Portugal et al., 2014).
Differences were identified between the birds regarding gliding time (Table 2), heart rate, and ODBA measurements (Table 3). These differences between individuals could arise from the fact that the birds were flying on different days with different environmental conditions (e.g., temperature, humidity, wind, location), total flight duration, and start and end points of the flight considering the altitude. However, we have a reason to trust that the differences between two of the birds (295 and 280) that flew on the same day (14.08.2019) are linked to their variation in body mass (see section “Materials and Methods” and Table 2).
Conclusion
Migrating Northern Bald Ibises use dynamic flapping-gliding flights as a strategy for saving energy. Using simultaneously heart rate and accelerometer measurements at a high frequency allows to estimate the heart rate and ODBA based energy costs of different gliding proportions and different gliding and flapping duration. The duration of the flapping and gliding had a significant impact on energy expenditure during flight. A rapid decrease in energy expenditure was observed after already 1 s of gliding. Intermittent flights containing approximately 20% gliding, resulted in heart rate reduction of about 11% compared with continuous flapping flight, signifying a noteworthy reduction in energy consumption. However, at higher gliding proportions further energy savings were negligible. Heart rate and ODBA methods are complementary: while the former can be taken as a proxy for metabolic energy consumption, the later gives a proxy measure for mechanical power output. Yet, we see that at high-frequency measurements, a comparison between the two methods is not reliable for the calculation of energy saving. Nevertheless, acceleration measurements provide accurate data to distinguish between different behaviors and movements. Thus, the combination of the two methods is essential.
Data Availability Statement
The original contributions presented in this study are included in the article/Supplementary Material, further inquiries can be directed to the corresponding author.
Ethics Statement
The animal study was reviewed and approved by the Ethics and Animals’ Welfare Committee of the University of Veterinary Medicine, Vienna, Austria. National approvals were provided by the authorities of Salzburg (21302-02/239/352-2012), Carinthia (11-JAG-s/75-2004), Baden-Württemberg (I1-7.3.3_Waldrapp), Bavaria (55.1-8646.NAT_03-10-1), and Italy (0027720-09/04/2013).
Author Contributions
OM-R, BV, JF, and TR developed the concept of the manuscript. OM-R and EP collected the field data. OM-R, EP, BV, and TR undertook the data processing and analyses. OM-R performed the statistics and led the writing of the manuscript. BV, LF, and TR contributed to interpreting the results. All authors contributed to the improvement of the manuscript.
Funding
This project was funded by the Austrian Science Fund (FWF; Project P-30620) and took part within the framework of the LIFE Northern Bald Ibis LIFE + 12-BIO_AT_000143 project. The four Neurologgers 2A (i.e., heart rate loggers) were financed by the University of Veterinary Medicine, Vienna, Austria, which provided also office and laboratory space for the entire project.
Conflict of Interest
The authors declare that the research was conducted in the absence of any commercial or financial relationships that could be construed as a potential conflict of interest.
Publisher’s Note
All claims expressed in this article are solely those of the authors and do not necessarily represent those of their affiliated organizations, or those of the publisher, the editors and the reviewers. Any product that may be evaluated in this article, or claim that may be made by its manufacturer, is not guaranteed or endorsed by the publisher.
Acknowledgments
The enterprise Waldrappteam Conservation & Research assisted with data collection and provided logistical support. H. Wehner and A.G Schmalstieg reared and trained the birds. G. Fluch helped to modify the electrodes and provides technical support, we are grateful for his support. We thank A. Scope and the Eulen und Greifvogelstation Haringsee for the initial help with the preliminary tests of the bird’s heart rate. We also thank the Vetmed-Tektalk team for helpful feedback and suggestions, and especially to C. Quigley for her initial help with the Neurologgers. We would like to thank Helena Wehner and Anne-Gabriela Schmalstieg for raising and training the birds to follow the paraplane.
Supplementary Material
The Supplementary Material for this article can be found online at: https://www.frontiersin.org/articles/10.3389/fevo.2022.891079/full#supplementary-material
Footnotes
References
Alerstam, T., and Lindström, Å (1990). Optimal Bird Migration: the Relative Importance of Time, Energy, and Safety. Berlin: Springer, 331–351.
Amélineau, F., Péron, C., Lescroël, A., Authier, M., Provost, P., and Grémillet, D. (2014). Windscape and tortuosity shape the flight costs of northern gannets. J. Exper. Biol. 217, 876–885. doi: 10.1242/jeb.097915
Baker, E. J., and Gleeson, T. T. (1999). The effects of intensity on the energetics of brief locomotor activity. J. Exper. Biol. 202(Pt 22), 3081–3087. doi: 10.1242/jeb.202.22.3081
Barron, D. G., Brawn, J. D., and Weatherhead, P. J. (2010). Meta-analysis of transmitter effects on avian behaviour and ecology. Methods Ecol. Evol. 1, 180–187. doi: 10.1111/j.2041-210X.2010.00013.x
Bevan, R. M., Woakes, A. J., Butler, P. J., and Boyd, I. L. (1994). The use of heart rate to estimate oxygen consumption of free-ranging black-browed albatrosses diomedea melanophrys. J. Exper. Biol. 193, 119–137. doi: 10.1242/jeb.193.1.119
Bishop, C. M., Ward, S., Woakes, A. J., and Butler, P. J. (2002). The energetics of barnacle geese (Branta leucopsis) flying in captive and wild conditions. Comp. Biochem. Physiol. A Mol. Integr. Physiol. 133, 225–237. doi: 10.1016/S1095-6433(02)00157-5
Bouten, C. V., Westerterp, K. R., Verduin, M., and Janssen, J. D. (1994). Assessment of energy expenditure for physical activity using a triaxial accelerometer. Med. Sci. Sports Exerc. 26, 1516–1523.
Bruyninx, C., Legrand, J., Fabian, A., and Pottiaux, E. (2019). GNSS metadata and data validation in the EUREF Permanent Network. GPS Solutions 23:106. doi: 10.1007/s10291-019-0880-9
Butler, P. J., Green, J. A., Boyd, I. L., and Speakman, J. R. (2004). Measuring metabolic rate in the field: the pros and cons of the doubly labelled water and heart rate methods. Funct. Ecol. 18, 168–183. doi: 10.1111/j.0269-8463.2004.00821.x
Butler, P. J., Woakes, A. J., and Bishop, C. M. (1998). Behaviour and Physiology of Svalbard Barnacle Geese Branta leucopsis during Their Autumn Migration. J. Avian Biol. 29, 536–545. doi: 10.2307/3677173
Clark, T. D., Sandblom, E., Hinch, S. G., Patterson, D. A., Frappell, P. B., and Farrell, A. P. (2010). Simultaneous biologging of heart rate and acceleration, and their relationships with energy expenditure in free-swimming sockeye salmon (Oncorhynchus nerka). J. Comp. Physiol. B 180, 673–684. doi: 10.1007/s00360-009-0442-5
Duriez, O., Kato, A., Tromp, C., Dell’Omo, G., Vyssotski, A. L., Sarrazin, F., et al. (2014). How Cheap Is Soaring Flight in Raptors? A Preliminary Investigation in Freely-Flying Vultures. PLoS One 9:e84887. doi: 10.1371/journal.pone.0084887
Everett, T. (2020). RTK-LIB, Version Demo5\_b33e”. b33e ed.: rtklibexplorer. URL: http://rtkexplorer.com/downloads/rtklib-code)
Fasiolo, M., Nedellec, R., Goude, Y., and Wood, S. N. (2020). Scalable Visualization Methods for Modern Generalized Additive Models. J. Comput. Graphical Stat. 29, 78–86. doi: 10.1080/10618600.2019.1629942
Fritz, J. (2021). The European LIFE+ northern bald ibis reintroduction project. Oryx 55, 809–810. doi: 10.1017/S003060532100123X
Fritz, J., Dietl, J., Kotrschal, K., Bairlein, F., and Dittami, J. (2008). Flugstilanalysen bei ziehenden Waldrappen. Vogelwarte 46, 350–351.
Fritz, J., Kramer, R., Hoffmann, W., Trobe, D., and Unsöld, M. (2017). Back into the wild: establishing a migratory Northern bald ibis Geronticus eremita population in Europe. Int. Zoo. Yearbook 51, 107–123. doi: 10.1111/izy.12163
Gatt, M. C., Quetting, M., Cheng, Y., and Wikelski, M. (2020). Dynamic body acceleration increases by 20% during flight ontogeny of greylag geese Anser anser. J. Avian Biol. 51, doi: 10.1111/jav.02235
Gleiss, A. C., Gruber, S. H., and Wilson, R. P. (2009). “Multi-Channel Data-Logging: Towards Determination of Behaviour and Metabolic Rate in Free-Swimming Sharks,” in Tagging and Tracking of Marine Animals with Electronic Devices, eds J. L. Nielsen, H. Arrizabalaga, N. Fragoso, A. Hobday, M. Lutcavage, and J. Sibert (Dordrecht: Springer Netherlands), 211–228.
Gleiss, A. C., Wilson, R. P., and Shepard, E. L. C. (2011). Making overall dynamic body acceleration work: on the theory of acceleration as a proxy for energy expenditure. Methods Ecol. Evol. 2, 23–33. doi: 10.1111/j.2041-210X.2010.00057.x
Green, J. A. (2011). The heart rate method for estimating metabolic rate: Review and recommendations. Comp. Biochem. Physiol. Part A 158, 287–304. doi: 10.1016/j.cbpa.2010.09.011
Green, J. A., Frappell, P. B., Clark, T. D., and Butler, P. J. (2008). Predicting rate of oxygen consumption from heart rate while little penguins work, rest and play. Comp. Biochem. Physiol. A Mol. Integr. Physiol. 150, 222–230. doi: 10.1016/j.cbpa.2006.06.017
Green, J. A., Halsey, L. G., Wilson, R. P., and Frappell, P. B. (2009). Estimating energy expenditure of animals using the accelerometry technique: activity, inactivity and comparison with the heart-rate technique. J. Exper. Biol. 212, 471–482. doi: 10.1242/jeb.026377
Halsey, L. G., Green, J. A., Wilson, R. P., and Frappell, P. B. (2009a). Accelerometry to Estimate Energy Expenditure during Activity: Best Practice with Data Loggers. Physiol. Biochem. Zool. 82, 396–404. doi: 10.1086/589815
Halsey, L. G., Portugal, S. J., Smith, J. A., Murn, C. P., and Wilson, R. P. (2009b). Recording raptor behavior on the wing via accelerometry. J. Field Ornithol. 80, 171–177. doi: 10.1111/j.1557-9263.2009.00219.x
Halsey, L. G., Shepard, E. L. C., and Wilson, R. P. (2011). Assessing the development and application of the accelerometry technique for estimating energy expenditure. Comp. Biochem. Physiol. Part A 158, 305–314. doi: 10.1016/j.cbpa.2010.09.002
Halsey, L. G., Shepard, E. L., Hulston, C. J., Venables, M. C., White, C. R., Jeukendrup, A. E., et al. (2008). Acceleration versus heart rate for estimating energy expenditure and speed during locomotion in animals: tests with an easy model species. Homo sapiens. Zoology 111, 231–241. doi: 10.1016/j.zool.2007.07.011
Hedenström, A. (1993). Migration by soaring or flapping flight in birds: the relative importance of energy cost and speed. Philos. Trans.R. Soc. London. Series B 342, 353–361. doi: 10.1098/rstb.1993.0164
Henderson, Y., and Prince, A. L. (1914). The oxygen pulse and the systolic discharge. Am. J. Physiol. Leg. Content 35, 106–115. doi: 10.1152/ajplegacy.1914.35.1.106
Hicks, O., Burthe, S., Daunt, F., Butler, A., Bishop, C., and Green, J. A. (2017). Validating accelerometry estimates of energy expenditure across behaviours using heart rate data in a free-living seabird. J. Exper. Biol. 220, 1875–1881. doi: 10.1242/jeb.152710
Hicks, O., Kato, A., Angelier, F., Wisniewska, D. M., Hambly, C., Speakman, J. R., et al. (2020). Acceleration predicts energy expenditure in a fat, flightless, diving bird. Sci. Rep. 10:21493. doi: 10.1038/s41598-020-78025-7
Hummel, D. (1995). Formation flight as an energy-saving mechanism. Israel J. Ecol. Evol. 41, 261–278. doi: 10.1080/00212210.1995.10688799
Karasov, W. H. (2015). Daily Energy Expenditure and the Cost of Activity in Mammals1. Am. Zool. 32, 238–248. doi: 10.1093/icb/32.2.238
Klaassen, R. H. G., Schlaich, A. E., Bouten, W., and Koks, B. J. (2017). Migrating Montagu’s harriers frequently interrupt daily flights in both Europe and Africa. J. Avian Biol. 48, 180–190. doi: 10.1111/jav.01362
Laich, A. G., Wilson, R. P., Quintana, F., and Shepard, E. L. C. (2009). Identification of imperial cormorant Phalacrocorax atriceps behaviour using accelerometers. Endangered Species Res. 10, 29–37.
Mallory, M. L., and Gilbert, C. D. (2008). Leg-loop harness design for attaching external transmitters to seabirds. Mar. Ornithol. 36, 183–188.
McGregor, S. J., Busa, M. A., Yaggie, J. A., and Bollt, E. M. (2009). High Resolution MEMS Accelerometers to Estimate VO2 and Compare Running Mechanics between Highly Trained Inter-Collegiate and Untrained Runners. PLoS One 4:e7355. doi: 10.1371/journal.pone.0007355
Muijres, F. T., Henningsson, P., Stuiver, M., and Hedenström, A. (2012). Aerodynamic flight performance in flap-gliding birds and bats. J.Theoretical Biol. 306, 120–128. doi: 10.1016/j.jtbi.2012.04.014
Müller, M. S., Vyssotski, A. L., Yamamoto, M., and Yoda, K. (2017). Heart rate variability reveals that a decrease in parasympathetic (‘rest-and-digest’) activity dominates autonomic stress responses in a free-living seabird. Comp. Biochem. Physiol. A Mol. Integr. Physiol. 212, 117–126. doi: 10.1016/j.cbpa.2017.07.007
Müller, M. S., Vyssotski, A. L., Yamamoto, M., and Yoda, K. (2018). Individual differences in heart rate reveal a broad range of autonomic phenotypes in a free-living seabird population. J. Exper. Biol. 221:jeb182758. doi: 10.1242/jeb.182758
Patrick, B., and Woodrow, B. (2017). Visualization of Regression Models Using visreg. R J. 9, 56–71.
Paziewski, J., and Crespi, M. (2019). High-precision multi-constellation GNSS: methods, selected applications and challenges. Measure. Sci. Technol. 31:010101. doi: 10.1088/1361-6501/ab20a6
Portugal, S. J., Green, J. A., Cassey, P., Frappell, P. B., and Butler, P. J. (2009). Predicting the rate of oxygen consumption from heart rate in barnacle geese Branta leucopsis: effects of captivity and annual changes in body condition. J. Exp. Biol. 212, 2941–2948. doi: 10.1242/jeb.034546
Portugal, S. J., Hubel, T. Y., Fritz, J., Heese, S., Trobe, D., Voelkl, B., et al. (2014). Upwash exploitation and downwash avoidance by flap phasing in ibis formation flight. Nature 505:399. doi: 10.1038/nature12939
Qasem, L., Cardew, A., Wilson, A., Griffiths, I., Halsey, L. G., Shepard, E. L. C., et al. (2012). Tri-Axial Dynamic Acceleration as a Proxy for Animal Energy Expenditure; Should We Be Summing Values or Calculating the Vector? PLoS One 7:e31187. doi: 10.1371/journal.pone.0031187
R Core team. (2020). R: A Language and Environment for Statistical Computing. Vienna, Aus.: R Foundation for Statistical Computing.
Rayner, J. M. V. (1985). Bounding and undulating flight in birds. J. Theoretical Biol. 117, 47–77. doi: 10.1016/S0022-5193(85)80164-8
Rayner, J. M. V. (1995). Flight mechanics and constraints on flight performance. Israel J. Zool. 41, 321–342. doi: 10.1080/00212210.1995.10688803
Rayner, J. M. V. (1996). Biomechanical constraints on size in flying vertebrates. In Miniature vertebrates P. J. Miller (ed.), Symp. Zool. Soc. Lond. 69, 83–109.
Rayner, J. M. V., Viscardi, P. W., Ward, S., and Speakman, J. R. (2001). Aerodynamics and Energetics of Intermittent Flight in Birds. Am. Zool. 41, 188–204. doi: 10.1093/icb/41.2.188
Ropert-Coudert, Y., Wilson, R. P., Gremillet, D., Kato, A., Lewis, S., and Ryan, P. G. (2006). Electrocardiogram recordings in free-ranging gannets reveal minimum difference in heart rate during flapping versus gliding flight. Mar. Ecol. Prog. Series 328, 275–284. doi: 10.3354/meps328275
Sachs, G. (2015). New model of flap-gliding flight. J. Theoretical Biol. 377, 110–116. doi: 10.1016/j.jtbi.2015.03.022
Sachs, G. (2017). Energy saving of aerial roosting swifts by dynamic flap-gliding flight. J. Ornithol. 158, 943–953. doi: 10.1007/s10336-017-1447-6
Schmidt-Nielsen, K. (1972). Locomotion: Energy Cost of Swimming. Flying, and Running. Science 177, 222–228. doi: 10.1126/science.177.4045.222
Shepard, E. L. C., Wilson, R. P., Halsey, L. G., Quintana, F., Gómez Laich, A., Gleiss, A. C., et al. (2008a). Derivation of body motion via appropriate smoothing of acceleration data. Aqua. Biol. 4, 235–241.
Shepard, E. L. C., Wilson, R. P., Quintana, F., Gómez Laich, A., Liebsch, N., Albareda, D. A., et al. (2008b). Identification of animal movement patterns using tri-axial accelerometry. Endangered Species Res. 10, 47–60.
Signer, C., Ruf, T., Schober, F., Fluch, G., Paumann, T., and Arnold, W. (2010). A versatile telemetry system for continuous measurement of heart rate, body temperature and locomotor activity in free-ranging ruminants. Methods Ecol. Evol. 1, 75–85. doi: 10.1111/j.2041-210X.2009.00010.x
Takasu, T. (2020). RTKLIB: An Open Source Program Package for GNSS Positioning. URL: http://www.rtklib.com/rtklib.htm)
Tobalske, B. W. (1996). Scaling of Muscle Composition, Wing Morphology, and Intermittent Flight Behavior in Woodpeckers. Auk 113, 151–177. doi: 10.2307/4088943
Tobalske, B. W. (2001). Morphology, Velocity, and Intermittent Flight in Birds. Am. Zool. 41, 177–187. doi: 10.1242/jeb.035691
Tobalske, B. W. (2010). Hovering and intermittent flight in birds. Bioinspir. Biomim. 5:045004. doi: 10.1088/1748-3182/5/4/045004
Tobalske, B., and Dial, K. (1994). NEUROMUSCULAR CONTROL AND KINEMATICS OF INTERMITTENT FLIGHT IN BUDGERIGARS (MELOPSITTACUS UNDULATUS). J. Exper. Biol. 187, 1–18. doi: 10.1242/jeb.187.1.1
Voelkl, B., and Fritz, J. (2017). Relation between travel strategy and social organization of migrating birds with special consideration of formation flight in the northern bald ibis. Philos. Trans.R. Soc. B 372:20160235. doi: 10.1098/rstb.2016.0235
Vyssotski, A. L., Dell’Omo, G., Dell’Ariccia, G., Abramchuk, A. N., Serkov, A. N., Latanov, A. V., et al. (2009). EEG responses to visual landmarks in flying pigeons. Curr. Biol. 19, 1159–1166. doi: 10.1016/j.cub.2009.05.070
Ward, S., Möller, U., Rayner, J. M. V., Jackson, D. M., Nachtigall, W., and Speakman, J. R. (2004). Metabolic power of European starlings Sturnus vulgaris during flight in a wind tunnel, estimated from heat transfer modelling, doubly labelled water and mask respirometry. J. Exper. Biol. 207, 4291–4298. doi: 10.1242/jeb.01281
Ward-Smith, A. J. (1984). Aerodynamic and energetic considerations relating to undulating and bounding flight in birds. J. Theoretical Biol. 111, 407–417. doi: 10.1016/S0022-5193(84)80219-2
Wehner, H., Fritz, J., and Voelkl, B. (2022). Soaring and intermittent flap-gliding during migratory flights of Northern Bald Ibis. J. Ornithol. doi: 10.1007/s10336-022-01978-1
Weimerskirch, H., Bishop, C., Jeanniard-du-Dot, T., Prudor, A., and Sachs, G. (2016). Frigate birds track atmospheric conditions over months-long transoceanic flights. Science 353, 74–78. doi: 10.1126/science.aaf4374
Weimerskirch, H., Guionnet, T., Martin, J., Shaffer, S. A., and Costa, D. P. (2000). Fast and fuel efficient? Optimal use of wind by flying albatrosses. Proc.R. Soc. London. Series B 267, 1869–1874. doi: 10.1098/rspb.2000.1223
Weimerskirch, H., Martin, J., Clerquin, Y., Alexandre, P., and Jiraskova, S. (2001). Energy saving in flight formation. Nature 413, 697–698. doi: 10.1038/35099670
Weimerskirch, H., Shaffer, S. A., Mabille, G., Martin, J., Boutard, O., and Rouanet, J. L. (2002). Heart rate and energy expenditure of incubating wandering albatrosses: basal levels, natural variation, and the effects of human disturbance. J. Exper. Biol. 205, 475–483. doi: 10.1242/jeb.205.4.475
Wickham, H., François, R., Henry, L., and Müller, K. (2021). dplyr: A Grammar of Data Manipulation. R package version 1.0.7. https://CRAN.R-project.org/package=dplyr”.)
Wilson, R. P., Börger, L., Holton, M. D., Scantlebury, D. M., Gómez-Laich, A., Quintana, F., et al. (2020). Estimates for energy expenditure in free-living animals using acceleration proxies: A reappraisal. J. Anim. Ecol. 89, 161–172. doi: 10.1111/1365-2656.13040
Wilson, R. P., White, C. R., Quintana, F., Halsey, L. G., Liebsch, N., Martin, G. R., et al. (2006). Moving towards acceleration for estimates of activity-specific metabolic rate in free-living animals: the case of the cormorant. J. Anim. Ecol. 75, 1081–1090. doi: 10.1111/j.1365-2656.2006.01127.x
Wood, S. N. (2003). Thin plate regression splines. J. R. Stat. Soc. 65, 95–114. doi: 10.1111/1467-9868.00374
Wood, S. N. (2004). Stable and Efficient Multiple Smoothing Parameter Estimation for Generalized Additive Models. J. Am. Stat. Associat. 99, 673–686. doi: 10.1198/016214504000000980
Yamamoto, M., Kato, A., Ropert-Coudert, Y., Kuwahara, M., Hayama, S., and Naito, Y. (2009). Evidence of dominant parasympathetic nervous activity of great cormorants (Phalacrocorax carbo). J. Comp. Physiol. A Neuroethol. Sens. Neural. Behav. Physiol. 195, 365–373. doi: 10.1007/s00359-009-0414-y
Keywords: intermittent flight, energy expenditure, gliding, heart rate, ODBA, migration, flapping flight
Citation: Mizrahy-Rewald O, Perinot E, Fritz J, Vyssotski AL, Fusani L, Voelkl B and Ruf T (2022) Empirical Evidence for Energy Efficiency Using Intermittent Gliding Flight in Northern Bald Ibises. Front. Ecol. Evol. 10:891079. doi: 10.3389/fevo.2022.891079
Received: 07 March 2022; Accepted: 16 May 2022;
Published: 13 June 2022.
Edited by:
Jose A. Masero, University of Extremadura, SpainReviewed by:
Anders Hedenström, Lund University, SwedenChristopher G. Guglielmo, Western University, Canada
Copyright © 2022 Mizrahy-Rewald, Perinot, Fritz, Vyssotski, Fusani, Voelkl and Ruf. This is an open-access article distributed under the terms of the Creative Commons Attribution License (CC BY). The use, distribution or reproduction in other forums is permitted, provided the original author(s) and the copyright owner(s) are credited and that the original publication in this journal is cited, in accordance with accepted academic practice. No use, distribution or reproduction is permitted which does not comply with these terms.
*Correspondence: Ortal Mizrahy-Rewald, b3J0YWxtNzlAZ21haWwuY29t
†ORCID: Ortal Mizrahy-Rewald, orcid.org/0000-0003-1909-0459; Elisa Perinot, orcid.org/0000-0003-0379-8508; Johannes Fritz, orcid.org/0000-0003-4691-2892; Alexei L. Vyssotski, orcid.org/0000-0002-9021-1471; Leonida Fusani, orcid.org/0000-0001-8900-796X; Bernhard Voelkl, orcid.org/0000-0001-5454-2508; Thomas Ruf, orcid.org/0000-0002-9235-7079