 Amin Golpour1*
 Marek Šmejkal1
 Martin Čech1Rômulo A. dos Santos1Allan T. Souza1Tomáš Jůza1
 Carlos Martínez1Daniel Bartoň1
 Mojmír Vašek1
 Vladislav Draštík1Tomáš Kolařík1Luboš Kočvara1Milan Říha1Jiří Peterka1
 Petr Blabolil1,2
- 1Biology Centre of the Czech Academy of Sciences, Institute of Hydrobiology, České Budějovice, Czechia
- 2University of South Bohemia in České Budějovice, Faculty of Science, České Budějovice, Czechia
It is difficult to understand the composition and diversity of biological communities in complex and heterogeneous environments using traditional sampling methods. Recently, developments in environmental DNA metabarcoding have emerged as a powerful, non-invasive method for comprehensive community characterization and biodiversity monitoring in different types of aquatic ecosystems. In this study, water eDNA targeting fish (wf-eDNA) and four traditional fish sampling methods (electrofishing, gill netting, seining, trawling) were compared to evaluate the reliability and efficiency of wf-eDNA (vertebrate mitochondrial 12S ribosomal RNA (rRNA) as an alternative approach to assess the diversity and composition of freshwater fish communities. The results of wf-eDNA showed a consistency between the traditional sampling methods regarding species detection. However, some fish species detected using wf-eDNA assay were not detected using traditional sampling methods and vice versa. Comparison of wf-eDNA and traditional sampling methods revealed spatial homogeneity in fish community composition in all reservoirs. Ordination analysis showed that the wf-eDNA approach covers all traditional sampling methods and occupies an intermediate position. In addition, based on the Shannon diversity index, we found that in one reservoir the wf-eDNA method yielded similar fish community diversity to traditional sampling methods. However, in other reservoirs, the calculated Shannon diversity index of the wf-eDNA method was significantly higher than traditional sampling methods. In general, significant positive correlations were found between the wf-eDNA method and almost all traditional sampling methods. We conclude that wf-eDNA seems to be a reliable and complementary approach for biomonitoring and ecosystem management of freshwater ichthyofauna.
Introduction
Assessing fish community composition is central to provide information on species structure and characteristics of whole aquatic ecosystems (Facey and Grossman, 1990; McElroy et al., 2020). Despite the implementation of the EU Water Framework Directive (2000/60/EC), the ecological status of natural water bodies requires a broader collection of information on the composition of the fish community. Reservoirs are considered widespread examples of heterogeneous aquatic ecosystems that are intermediate between rivers and lakes (Banerjee et al., 2017). Therefore, monitoring ecological indicators such as fish composition in reservoirs based on traditional sampling methods provides fragmented information and is challenging because they represent a transitional environmental system between lakes and rivers (Irz et al., 2002; Straškraba, 2005). Reliable assessment of fish species diversity in these systems is difficult to achieve using traditional sampling methods. Different fish species utilize different depths, flows, and water temperature habitats due to which, multi-gear sampling approaches require high demand for know-how and professional labor (Eggleton et al., 2010; Mueller et al., 2017). Information on fish abundance and composition has traditionally been obtained using electrofishing, fish traps, gill nets, and seine nets (Fischer and Quist, 2014; Merz et al., 2021). However, the limitations in commonly used sampling methods have hampered standardization and comparison of monitoring in a range of freshwater habitats (Revenga et al., 2005; Jurajda et al., 2009). Furthermore, the implementation of traditional sampling methods in the field is relatively laborious, expensive, and destructive (Iknayan et al., 2014; Thomsen and Willerslev, 2015; Blabolil et al., 2021a), resulting in low precision in fish community monitoring (Kubečka et al., 2009). Therefore, to standardize an accurate and reliable monitoring method for fish communities in aquatic ecosystems we need to implement a universal and affordable non-invasive tool that characterizes the richness, relative abundance, and presence of taxa throughout a water body.
Recently, environmental DNA metabarcoding (eDNA) has been considered as a promising non-invasive tool for monitoring the spatial and temporal distribution of species and communities in aquatic ecosystems (Deiner et al., 2017; Bylemans et al., 2018; Lawson Handley et al., 2019; Crane et al., 2021). The eDNA technique is based on the molecular identification of organisms whose genetic material has entered the water (Olds et al., 2016), soil (Epp et al., 2012), and sediment (Evrard et al., 2019). Water eDNA targeting fish (hereafter), wf-eDNA based on the two-level terminology proposed by Pawlowski et al. (2020) and Rodriguez-Ezpeleta et al. (2021) has recently been suggested as a complementary biomonitoring strategy for the European Union Water Framework Directive (2000/60/EC) to detect elusive and rare species (Seymour et al., 2020). It is particularly useful for detecting cryptic species and identifying new taxa (Grey et al., 2018; McElroy et al., 2020; Seymour et al., 2020). This approach has also facilitated remote sampling in diverse water bodies, such as rivers, ponds, reservoirs, and marine environments (Yamanaka and Minamoto, 2016; Harper et al., 2019; Djurhuus et al., 2020; Hayami et al., 2020). However, sampling strategies, laboratory protocols, and analytical pipelines can affect wf-eDNA performance (Bylemans et al., 2018). The main advantage of traditional sampling methods is that biometric data (e.g., length, weight, sex, maturity stage, etc.) can be obtained during sampling, whereas the wf-eDNA approach can only identify samples at genus or species level. Most comparisons of the wf-eDNA approach with traditional sampling methods to characterize ecological communities have been conducted at the local scale and show how wf-eDNA and traditional sampling methods represent community composition in lakes, reservoirs, and rivers (Murienne et al., 2019; Czeglédi et al., 2021; Gehri et al., 2021). Several studies have also shown that wf-eDNA is a complementary approach to traditional sampling methods to assess fish community composition in lakes and rivers (Shaw et al., 2016; Doi et al., 2019; Sard et al., 2019; Antognazza et al., 2021; Ritterbusch et al., 2022). In general, wf-eDNA may characterize a large number of taxa with less sampling effort than traditional sampling methods for detecting fish in low-diversity freshwater systems (McElroy et al., 2020). In this context, Hänfling et al. (2016) showed that water samples collected for wf-eDNA along gillnet sampling sites detected 14 of the 16 fish species previously detected in a lake in the United Kingdom. Several studies have also shown that wf-eDNA can detect more taxa than traditional capture methods (Civade et al., 2016; Yamamoto et al., 2017; Sard et al., 2019; Zou et al., 2020).
In the present study, the wf-eDNA approach was used to assess fish communities in three reservoirs in the Czech Republic for two consecutive years. This study was conducted to compare the ability of wf-eDNA with data from traditional survey methods (day and night electrofishing, multiple mesh gill nets, day and night seine nets, and night trawling) to identify differences and/or similarities regarding fish community composition. Specifically, we aimed to (1) characterize and estimates of fish community composition between traditional and wf-eDNA sampling methods in each reservoir (2) compare and assess fish species diversity and richness across sampling methods in each reservoir, and (3) examine the relationships between wf-eDNA and site occupancy (i.e., number of positive samples divided by total number of samples) and scores derived from all traditional sampling methods in each reservoir.
Materials and Methods
Site Description
This study was conducted in three reservoirs (Římov, Klíčava and Žlutice) in the Czech Republic, which were constructed as drinking water reservoirs and are not accessible to the public. All reservoirs possess canyon-shape morphology with one main inflow (Supplementary Figure 1), resulting in longitudinal gradients of nutrients and water quality from the inflow to the dam. All studied reservoirs serve as drinking water storages and are therefore restricted to public access. The reservoirs have different trophic conditions but similar canyon-shaped morphologies with the main inflow and a side bay (see Supplementary Table 1). Římov and Žlutice reservoirs are eutrophic reservoirs (average year total phosphorus concentration, TP: 22 and 24 μg/L), while Klíčava possesses mesotrophic condition (TP: 17 μg/L). The largest one is the Římov (surface area 2.1 km2), middle size Žlutice (1.1 km2) and the smallest Klíčava (0.54 km2). The maximum depth in Klíčava, Římov, and Žlutice was 31, 41, and 22 m, respectively.
Traditional Sampling
Traditional fish sampling was conducted during summer (August) 2018 and 2019 using gill nets, day and night electrofishing, seine nets, and trawls. Benthic and pelagic gillnets with 12 mesh sizes following the protocol of CEN (2015) [hereafter standard benthic (SBG) and pelagic gillnets (SPG)] and additional gillnets with four mesh sizes (70, 90, 110, and 135 mm) to capture larger fish (Šmejkal et al., 2015); [hereafter benthic (LBG) and pelagic (LPG) large-mesh gillnets] were distributed across the sampling area of each reservoir to sample benthic and pelagic habitats, respectively (Supplementary Table 17; Blabolil et al., 2021b). All gillnets were deployed 2 h before sunset and lifted 2 h after sunrise to capture the maximum peaks of fish activity. The total length of the standard gillnets was 30 m (12 m × 2.5 m panels) and that of large-mesh gillnets was 40 m (4 m × 10 m panels). Electrofishing from a boat was limited to nearshore areas (i.e., less than 2 m deep) to capture species during the day (DE) and night (NE) (Miranda and Kratochvíl, 2008). Electrofishing (electrofisher EL 65 II GL DC, Hans Grassel, Schönau am Königsee, Germany, 13 kW, 300/600 V) was conducted in transects at a distance of 100 m (Supplementary Table 18). Seining was conducted at night (NAS) to capture adult fishes using a 50 m long and 4 m high net with a mesh size of 10 mm (Říha et al., 2008), and also during the day (DFS) and at night (NFS) for juveniles using a 10 m long and 2 m high net with a mesh size of 1.7 mm (Supplementary Table 19; Blabolil et al., 2016). In addition, a fixed-frame pelagic trawl (FT) with a mouth opening of 3 m × 3 m, length of 5.4 m, and a mesh size of 6 mm at the belly and 3 mm at the cod end was used for fry night trawling. Trawling was conducted throughout the reservoir at depths of 0–3 m and based on the maximum depth in the depth strata of 3–6 and 6–9 m (Supplementary Table 20).
Catches from each net or transect were processed separately. All fish caught were identified to the species level, measured (standard length in mm) and weighted (in g). To compare the different sampling methods and obtain comparable data sets, catch data were standardized to an area of 1,000 m2 for gillnets, 100 m2 for seine, the trajectory of 100 m for electrofishing, and a volume of 1,000 m3 for trawling. Data were quantified using two quantitative methods: catch estimation rate, biomass per unit effort (BPUE), and catch per unit effort (CPUE) for species caught. All calculations and statistical analyses were performed using the calculated BPUE and CPUE datasets.
wf-eDNA Sampling, Extraction, and Library Preparation
Water samples were collected for two consecutive years (2018 and 2019) during the same weeks as traditional fish sampling following Blabolil et al. (2021a). The total number of samples collected during the summer in each reservoir were 38, 29, and 28 in Římov, Klíčava, and Žlutice respectively (Supplementary Table 21). Eight localities across the longitudinal gradient from the dam toward the tributary were sampled in Římov and five sites in Klíčava and Žlutice (Supplementary Figure 1). At each locality, water samples were collected from different depth layers (surface, 5, 10, and 20 m) to capture different ecological gradients (Prchalová et al., 2008). A Friedinger sampler was used for water collection. In the field, water samples (2 L) were pre-filtered to prevent clogging by excessive seston, stored in sterile, labeled bottles, and kept in an icebox until laboratory processing. Within 24 h of sampling, 1 L of each sample was filtered individually through open filters in the laboratory. The Mu-DNA water protocol (Sellers et al., 2018) was used to extract the DNA. Primers (forward 12S-V5-F, 5′-ACTGGGATTAGATACCCC-3′ and reverse 12S-V5-R, TAGAACAGGCTCCTCTAG) were used to amplify a 73–110 bp fragment of the vertebrate mitochondrial 12S ribosomal RNA (rRNA) gene (Riaz et al., 2011). Field blanks (purified water passed through the sampler and sterile plankton net), negative PCR controls (molecular grade water) and positive PCR controls (tissue of Maylandia zebra DNA 0.05 ng μl–1) were included in each set of the individual sampling campaign to detect possible contamination and inhibition. All PCRs were performed with individually attached caps in a UV and bleach sterilized laminar flow hood in the eDNA laboratory to minimize the risk of contamination. The sequencing library was generated from the PCR amplicons and run on an Illumina MiSeq sequencer.
Raw sequences were demultiplexed and processed using the metaBEAT v0.97.11 pipeline1. Average read quality was assessed in 5-bp sliding windows starting at 3′ of the read, and reads were clipped until the average quality per window was above Phred score of 30. Reads shorter than 90 bp were discarded. The filtered sequences were clustered with 100% identity. Clusters represented by less than three sequences were excluded from further analysis. Non-redundant sequences were compared with a reference database using BLAST (Zhang et al., 2002). The reference database was developed at the University of Hull, England2 and supplemented with Leuciscus aspius (GenBank accession numbers: MT163435, MT163450, MT163449) and Coregonus maraena (GenBank accession numbers: MT163451, MT163458, MT163460) to represent all fish species in the study catchment. The BLAST output was interpreted using a custom Python function that implements the lowest common ancestor approach for taxonomic assignment, and the hits were only considered if they had a minimum identity of 99% and query coverage of 90%. Taxa with a read frequency below 0.1% were excluded as possible false-positive detections. Compared to Blabolil et al. (2021a), the assigned species pairs presented identical sequences in the amplified regions of Leuciscus aspius + Scardinius erythrophthalmus, Sander lucioperca + Perca fluviatilis, and L. leuciscus + L. idus were retained in the downstream analyses. On the other hand, detection of lampreys (Lamperta spp.) in wf-eDNA was excluded as the taxa are not the target of any of the traditional methods used. To follow the wf-eDNA data consistency, the six species determined by the traditional methods were merged into two species pairs. Similarly, uncertain species (species with identical sequences in amplified regions creating natural and/or artificial hybrids) were assigned to genus level Coregonus, Hypophthalmichthys, and Acipenser.
Data Analysis
Prior to statistical analysis and comparison of all traditional sampling methods with eDNA, Hellinger’s transformation was employed on datasets (Laporte et al., 2021). Beta diversity (non-metric multidimensional scaling) was calculated using the vegdist function from the vegan package with Jaccard and Bray-Curtis dissimilarity matrices (Oksanen et al., 2019). Permutational multivariate analysis of variance (PERMANOVA) was performed using the adonis function to test whether species composition showed statistically significant differences between the methods. Alpha diversity, including Shannon (H = −Σ[(pi) × ln(pi)]) and richness indices, was calculated using the diversity function from the vegan package (Oksanen et al., 2019). Analyses of variance and post hoc Tukey honest significant difference tests were performed to test whether the difference in alpha diversity between groups was statistically significant and to compare the diversity of each group. The aov, ANOVA, and TukeyHSD functions from the package stats were used to perform the analysis of variance and Tukey’s tests (R Core Team, 2020). We calculated sample-based site occupancy estimates for each taxon (calculated detection rates and relative rank abundance of species detected in both eDNA and traditional approaches). Spearman’s rank correlation coefficient was used to test the relationship between eDNA-based site occupancy and the taxon score derived from traditional sampling methods (R Core Team, 2020). All statistical analyses were performed using R software version v4.0.3 (R Core Team, 2020).
Results
The 12S libraries generated 22.06 million raw sequence reads, with 17.63 million reads passing bioinformatic filters. During the quality filtering and removal of chimeric sequences 9.9 million reads were discarded.
Comparisons of Traditional Capture and wf-eDNA Data
The number of taxa captured/detected by traditional sampling methods and their assigned wf-eDNA sequences in each reservoir is listed in Table 1. Of the traditional sampling methods, only DE recorded more taxa than the other methods in all the reservoirs. More taxa were detected with wf-eDNA than with traditional methods in all the reservoirs (Table 1). A total of 31 fish taxa were identified in all reservoir samples. The Římov reservoir had the highest number of taxa (28), while the Klíčava reservoir had the lowest number (13 each) (Supplementary Tables 2–4). In the Klíčava reservoir, the wf-eDNA method detected all listed species, except for Hypophthalmichthys sp. (Supplementary Table 2). Two taxa (Carassius gibelio and Gobio gobio) were only identified using the wf-eDNA method and were not captured using traditional sampling methods (Supplementary Table 2). Cyprinids were the dominant taxa, with nine species (Supplementary Table 2).
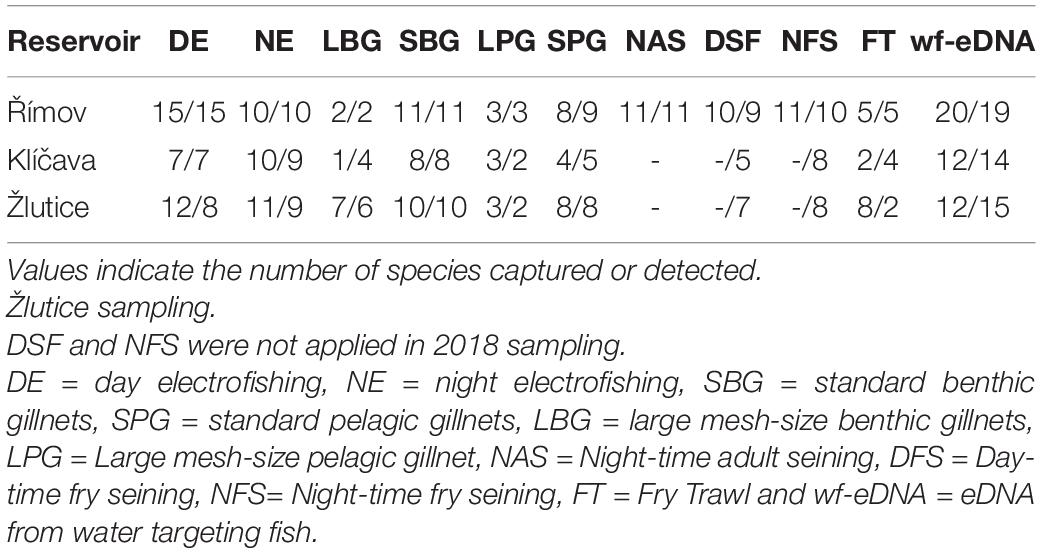
Table 1. Number of taxa (species) caught or detected in sampled reservoirs using different sampling methods in 2018 (before slash) and 2019 (after slash).
In the Římov reservoir, almost all taxa were identified by the wf-eDNA method, except for three taxa that were captured only by traditional sampling methods (Coregonus sp., Pseudorasbora parva, and Squalius cephalus) (Supplementary Table 3). Indeed, the number of taxa detected or captured between the wf-eDNA and traditional sampling methods did not show significant differences (Supplementary Table 3). The dominant taxa were cyprinids, with 14 species (Supplementary Table 3).
In the Žlutice reservoir, a total of 20 taxa were detected by combining all traditional sampling methods and the wf-eDNA assay (Supplementary Table 4). Of the taxa identified by the traditional sampling methods, 12 species belonged to the cyprinid family as the dominant taxa (Supplementary Table 4). All taxa listed in Supplementary Table 4 were identified using the wf-eDNA assay, except for four fish species (Anguilla anguilla, Carassius carassius, Hypophthalmichthys sp., and Lota lota).
Comparing Fish Communities Between Traditional Capture and wf-eDNA Data
In the Klíčava reservoir, NMDS analysis of BPUE datasets showed that fish communities varied slightly between gillnet methods and wf-eDNA, although there were similarities in fish composition between wf-eDNA and the other traditional methods (Figures 1A,B). PERMANOVA analysis (Supplementary Tables 5, 6) revealed significant similarity between all methods, but statistically no significant similarity was found between some methods, such as DE and NE (F = 5.60, R2 = 0.02, p = 0.640), LBG and FT (F = −2.07, R2 = 1.00, p = 1.0), SPG and FT (F = 2.69, R2 = 0.02, p = 0.681), SBG and wf-eDNA (F = 2.42, R2 = 0.05, p = 0.065), FT and wf-eDNA (F = 7.72, R2 = 0.02, p = 0.597), and DE and FT (F = 4.44, R2 = 0.28, p = 0.069). There were slight differences in community composition between wf-eDNA, LPG and LBG in the CPUE datasets, however, there were similarities between wf-eDNA and all traditional sampling methods (Figures 2A,B). Furthermore, PERMANOVA analysis revealed no significant similarity between DE and NE (F = 1.87, R2 = 0.07, p = 0.098), DE and FT (F = 3.64, R2 = 0.24, p = 0.161), FT and SPG (F = 2.03, R2 = 0.01, p = 0.801), FT and wf-eDNA (F = 6.45, R2 = 0.02, p = 0.686), FT and SBG (F = 1.30, R2 = 0.06, p = 0.305), LBG, and FT (F = −2.07, R2 = 1.00, p = 1.0) in CPUE 2018 (Supplementary Tables 7, 8). However, in CPUE 2019, no statistically significant similarity (Supplementary Table 8) was observed between DE and NE (F = 1.70, R2 = 0.07, p = 0.223) and DFS and NFS (F = 1.52, R2 = 0.05, p = 0.146).
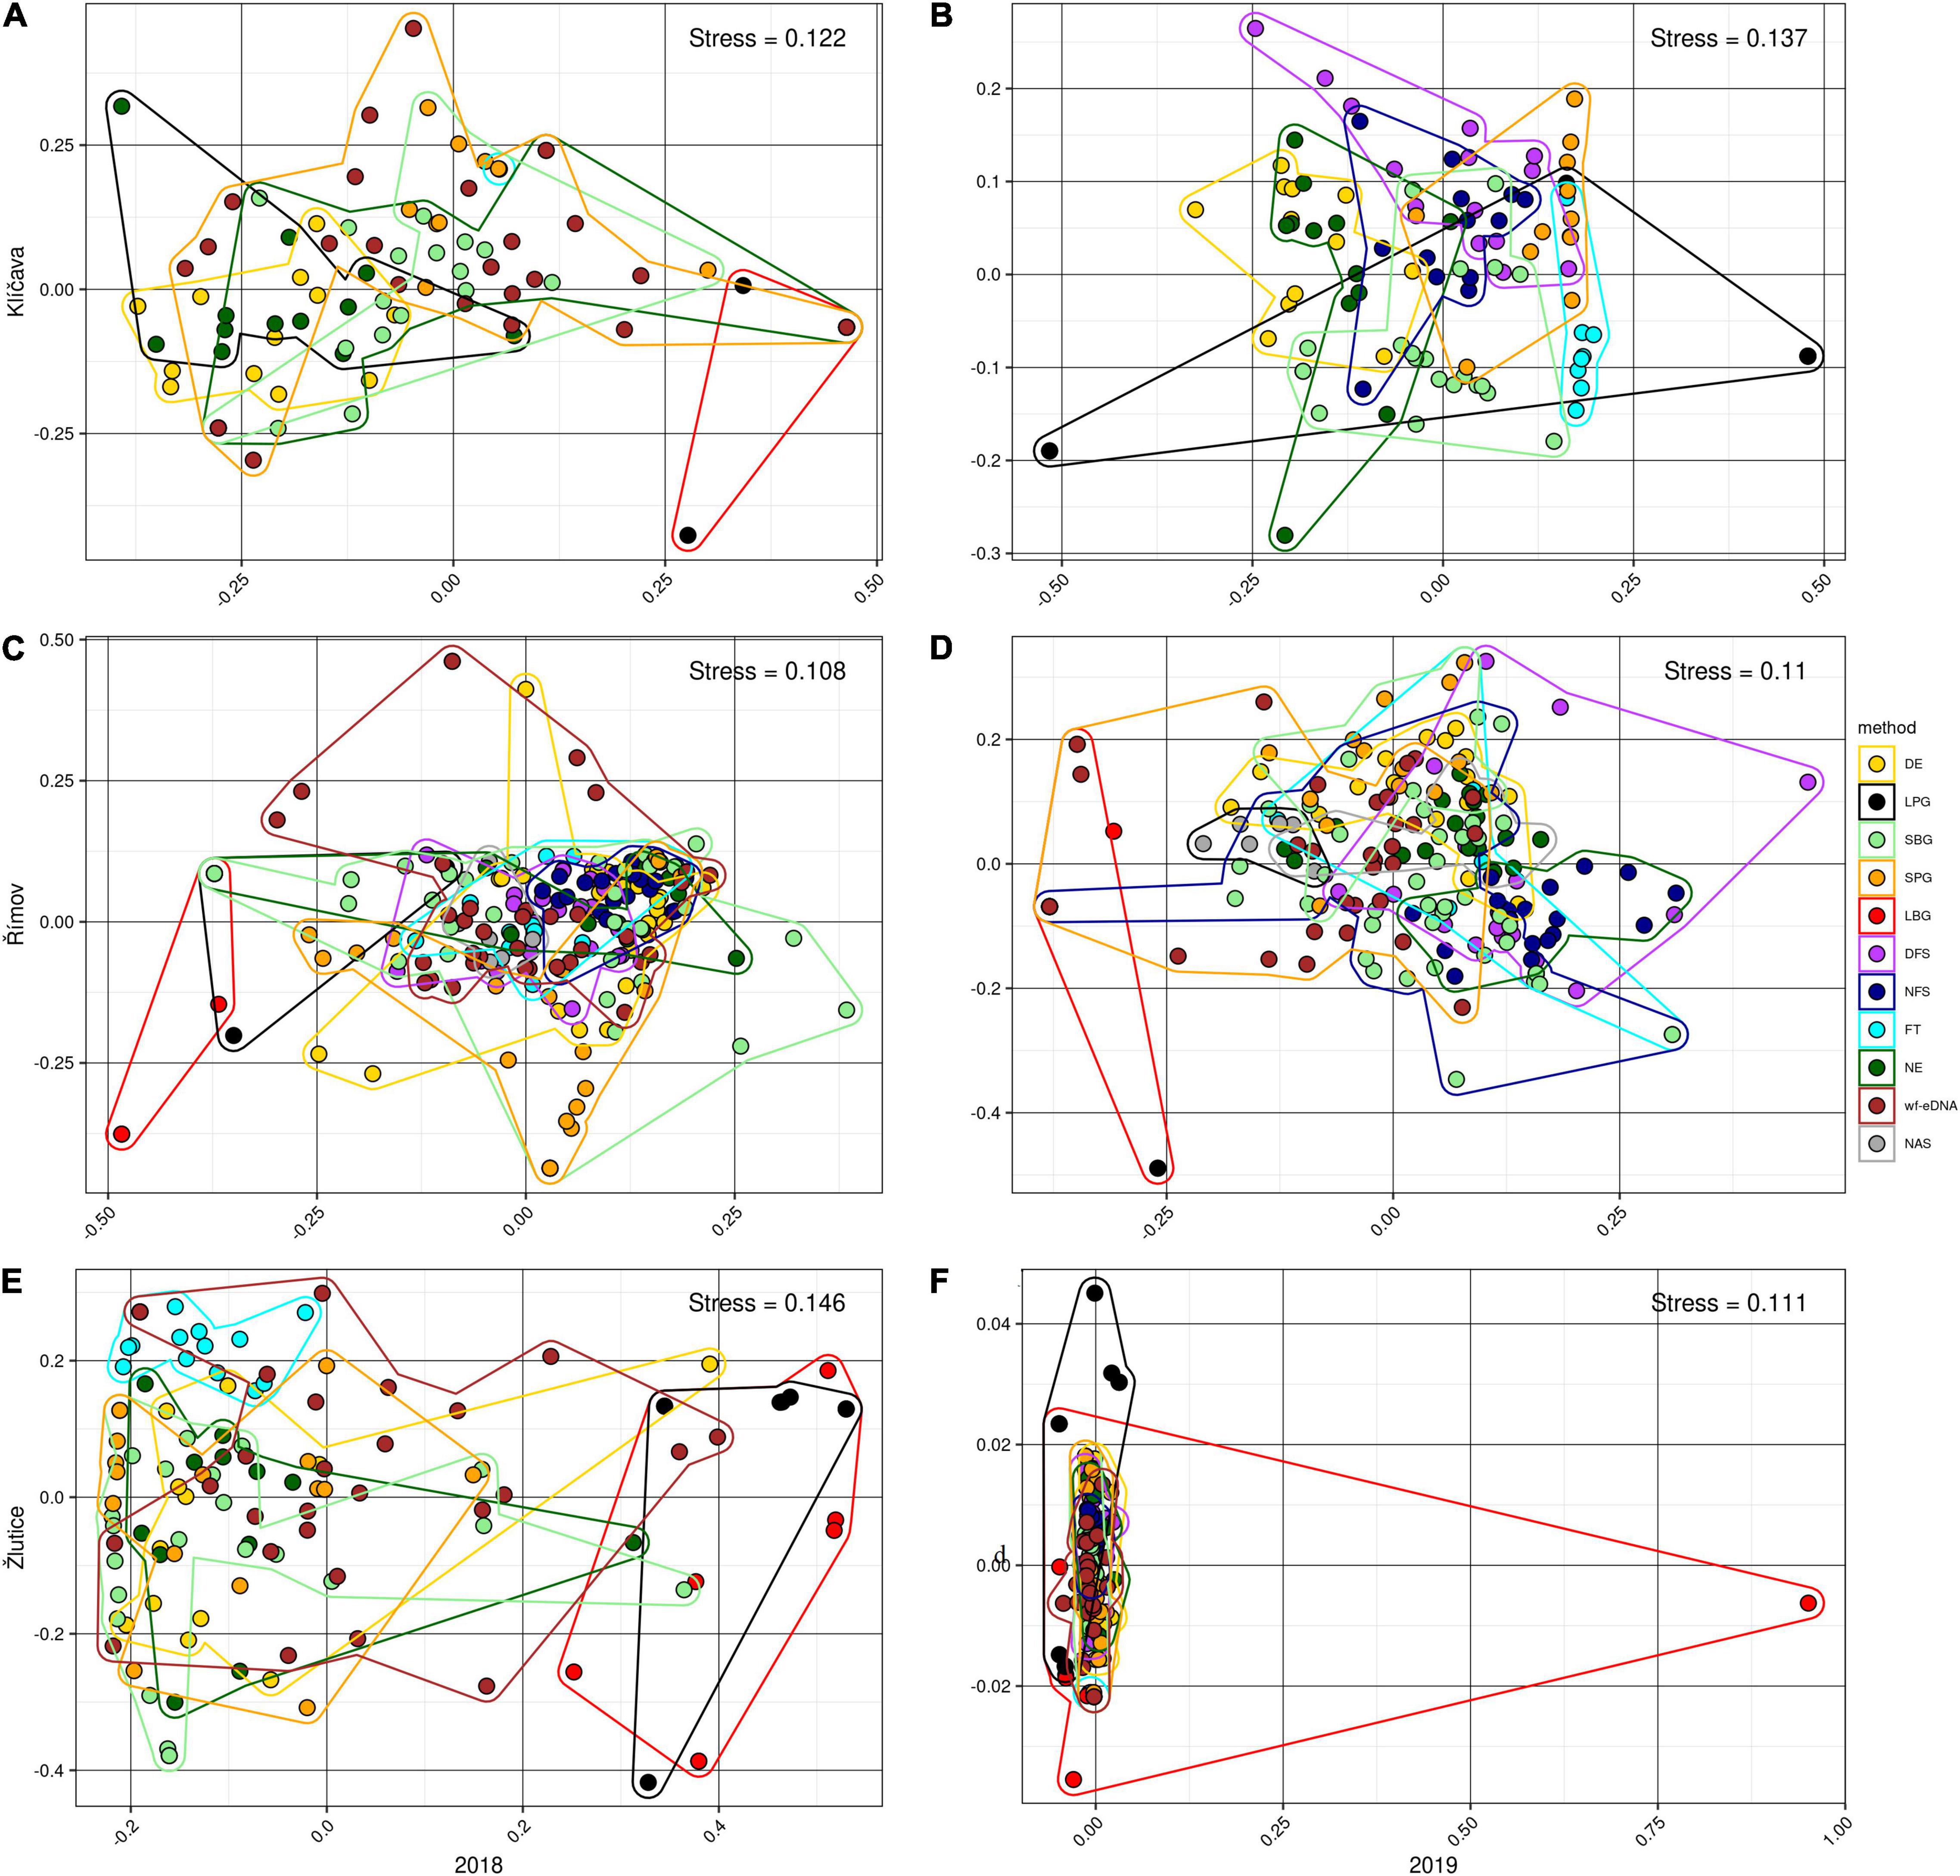
Figure 1. Beta- diversity visualized using non-metric multidimensional scaling (NMDS) based on BPUE data in 2018 (left plots) and 2019 (right plots) with Bray-Curtis dissimilarity distances of community compositions for the wf-eDNA assay and traditional sampling methods in Klíčava, Římov and Žlutice reservoirs. NMDS plots on rank order using Bray-Curtis distances were used to evaluate relationships based on intersample variation in estimated fish community composition between sampling methods. Plot ellipses represent the 95% confidence regions for the group clusters. Traditional sampling methods are abbreviated as follows: DE = day electrofishing, NE = night electrofishing, SBG = standard benthic gillnets, SPG = standard pelagic gillnets, LBG = large mesh-size benthic gillnets, LPG = large mesh-size pelagic gillnets, NAS = night-time adult seining, DFS = day-time fry seining, NFS= night-time fry seining, FT = fry trawl and wf-eDNA = eDNA from water targeting fish.
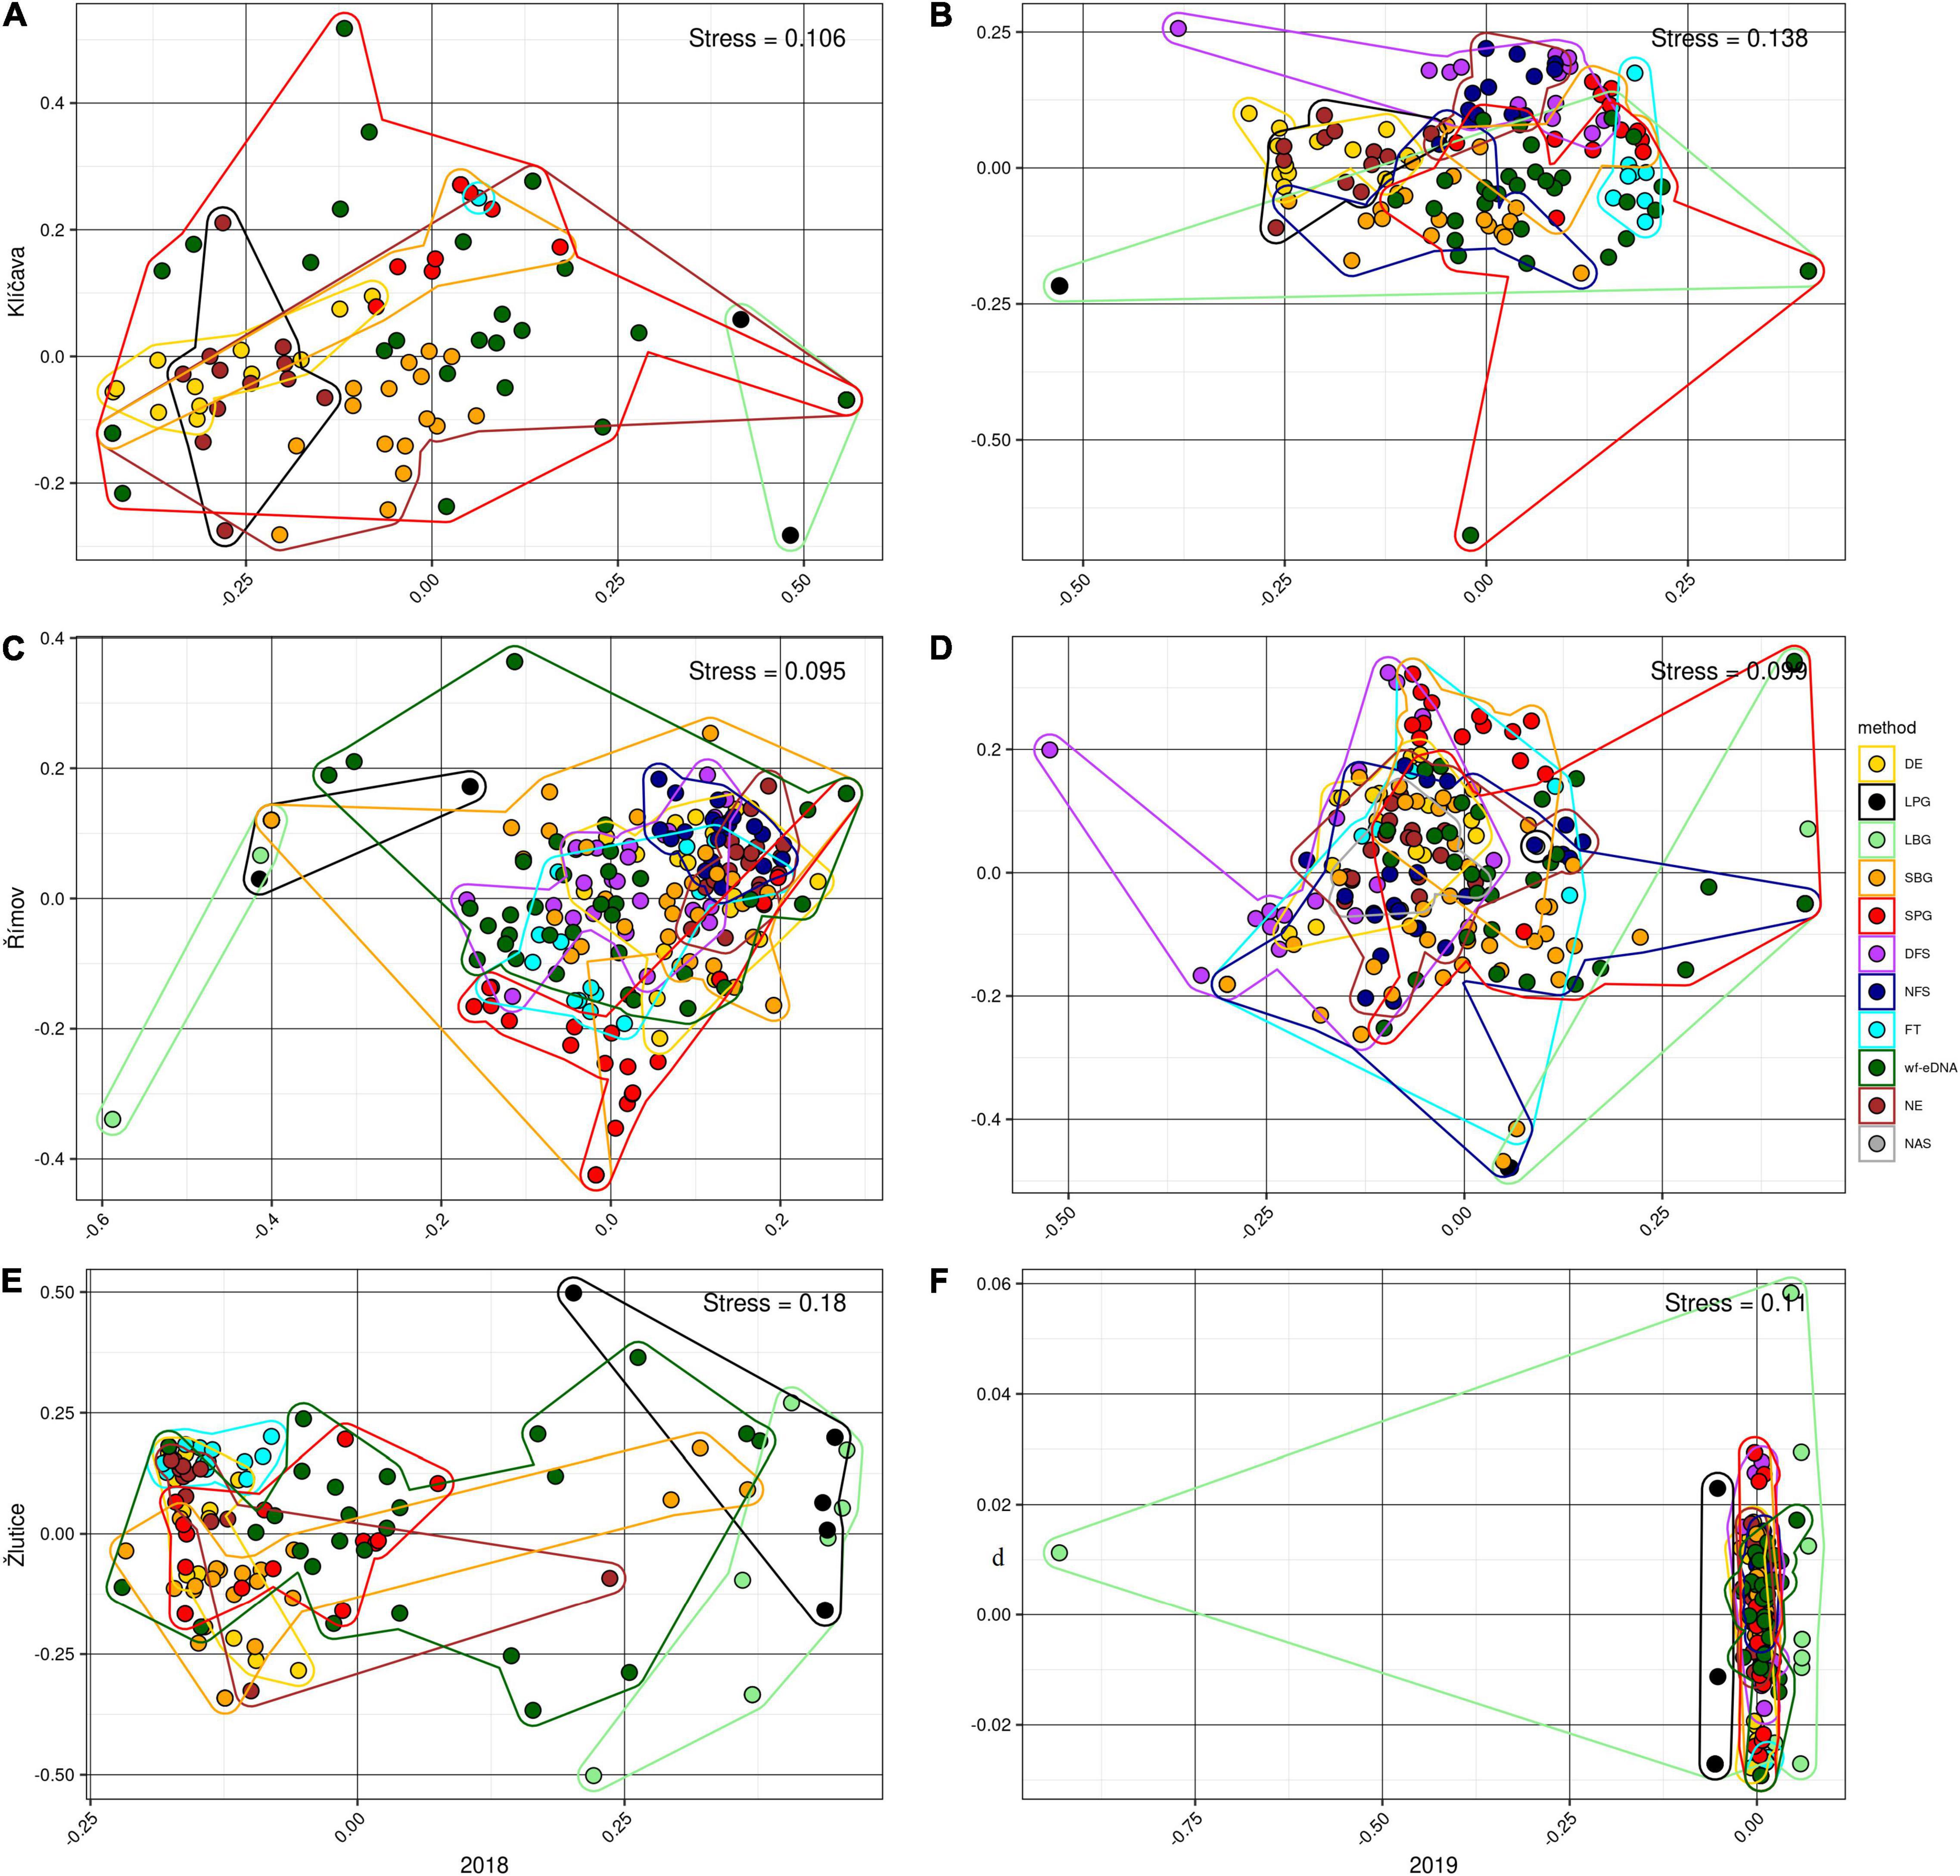
Figure 2. Beta-diversity visualized using non-metric multidimensional scaling (NMDS) based on CPUE data in 2018 (left plots) and 2019 (right plots) with Bray-Curtis dissimilarity distances community compositions for wf-eDNA assay and all traditional sampling methods in Klíčava, Římov and Žlutice reservoirs. NMDS plots on rank order using Bray-Curtis distances were used to assess relationship based on intersample variation in estimated fish community composition between sampling methods. Plot ellipses represent the 95% confidence regions for group clusters. Traditional sampling methods are abbreviated as follow: DE = day electrofishing, NE = night electrofishing, SBG = standard benthic gillnets, SPG = standard pelagic gillnets, LBG = large mesh-size benthic gillnets, LPG = large mesh-size pelagic gillnets, NAS = night-time adult seining, DFS = day-time fry seining, NFS= night-time fry seining, FT = fry trawl and wf-eDNA = eDNA from water targeting fish.
In Římov reservoir, NMDS in the BPUE dataset showed similarities in fish community between wf-eDNA and almost all traditional methods, however, community composition revealed slight differed between methods such as LBG, DE, SBG, and wf-eDNA (Figures 1C,D). The PERMANOVA test showed statistically significant similarity between all sampling methods in the 2018 sampling year, except between DE and SBG (F = 0.77, R2 = 0.01, p = 0.552). In 2019, BPUE datasets showed that fish communities varied slightly between gillnet LBG, SPG, DFS and wf-eDNA. PERMANOVA analysis revealed statistically significant similarity between all sampling methods, but no statistically significant similarity was found between LPG and LBG (F = 0.40, R2 = 0.01, p = 0.617) (Supplementary Tables 9, 10). For the CPUE datasets in 2018, NMDS ordinations of fish communities were partially differed between the wf-eDNA and LBG, SPG, and DE methods (Figure 2C). Only PERMANOVA analysis revealed no statistically significant similarity between LPG and LBG (F = 0.50, R2 = 0.02, p = 0.784) (Supplementary Table 11). In the 2019 CPUE datasets, NMDS ordinations of fish communities differed in part between the wf-eDNA and LBG, SPG, and DE methods (Figure 2D). In addition, PERMANOVA test showed no statistically significant similarity between wf-eDNA and NAS (F = 2.31 R2 = 0.06, p = 0.083), wf-eDNA and FT (F = 1.53, R2 = 0.03, p = 0.162), DE and FT (F = 1.53, R2 = 0.06, p = 0.172), SBG and FT (F = 2.01, R2 = 0.038, p = 0.101), SPG and FT (F = 2.20, R2 = 0.08, p = 0.107), DFS and FT (F = 2.44, R2 = 0.08, p = 0.083), and DFS and NFS (F = 2.43, R2 = 0.06, p = 0.059) (Supplementary Table 12).
In the Žlutice Reservoir, community composition analysis of BPUE records with NMDS showed slight difference between wf-eDNA, LBG and LPG (Figures 1E,F). The PERMANOVA analysis showed significant similarities among most methods, however, no statistically significant similarity was found between DE and NE (F = 2.16, R2 = 0.08, p = 0.080), NE and SPG (F = 2.35, R2 = 0.08, p = 0.073), and SPG and wf-eDNA (F = 2.03, R2 = 0.05, p = 0.097) in the 2018 (Supplementary Table 13). No statistically significant similarity was also observed between DE and NE (F = 1.36, R2 = 0.05, p = 0.245), DE and SPG (F = 1.77, R2 = 0.06, p = 0.171), DE and DFS (F = 0.73, R2 = 0.02, p = 0.534), SBG and SPG (F = 1.77, R2 = 0.06, p = 0.632), DFS and SPG (F = 1.92, R2 = 0.05, p = 0.139) (Supplementary Table 14). For the CPUE datasets, NMDS ordinations of fish communities were partially differed between the wf-eDNA, LBG and SPG methods (Figures 2E,F). Moreover, PERMANOVA analysis revealed no statistically significant similarity between wf-eDNA and DE (F = 2.22, R2 = 0.05, p = 0.079), wf-eDNA and NE (F = 1.69, R2 = 0.60, p = 0.086), DE and NE (F = 1.36, R2 = 0.05, p = 0.264), NE and SPG (F = 2.17, R2 = 0.07, p = 0.079), NE and FT (F = 2.01, R2 = 0.07, p = 0.131), and LPG and LBG (F = 1.35, R2 = 0.07, p = 0.276) in the 2018 CPUE dataset (Supplementary Table 15). In contrast, in the 2019 CPUE dataset, no statistically significant similarity was observed between DE and NE (F = 0.21, R2 = 0.01, p = 0.919), wf-eDNA and NE (F = 2.26, R2 = 0.05, p = 0.053), DE and DFS (F = 2.14, R2 = 0.07, p = 0.096), DE and SPG (F = 0.95, R2 = 0.03, p = 0.378), NE and SBG (F = 1.91, R2 = 0.05, p = 0.112), NE and SPG (F = 1.61, R2 = 0.05, p = 0.187), NE and DFS (F = 1.73, R2 = 0.06, p = 0.139), and DFS and NFS (F = 0.83, R2 = 0.02, p = 0.481) (Supplementary Table 16).
Fish Species Diversity Between Traditional Sampling and wf-eDNA Methods
Fish species diversity in the Klíčava reservoir showed a statistically significant difference in the Shannon diversity index. The value was significantly higher (p < 0.05) for NE than for other traditional sampling methods and wf-eDNA in the BPUE dataset of 2018 (Figure 3A). However, in the sampling year 2019, the value of wf-eDNA was significantly higher (p < 0.05) than that of other traditional sampling methods (Figure 3B). In addition, the Shannon index in NE was significantly higher (p < 0.05) than that of the other methods in the 2018 CPUE dataset, while wf-eDNA had a significantly higher (p < 0.05) than the traditional sampling methods in 2019 (Figures 4A,B). Based on the BPUE datasets of Římov reservoir in 2018 and 2019, the Shannon diversity index was significantly higher in NAS (p < 0.05) (Figures 3C,D). The highest value of the index in the NAS followed by wf-eDNA and NFS sampling approaches. A similar trend was also observed in the CPUE dataset of the 2018 sampling year, as it was significant in NAS sampling (p < 0.05) (Figure 4C), while in the 2019 sampling year the values were significantly higher in wf-eDNA, NE and DE (p < 0.05) (Figure 4D). In the Žlutice reservoir, the Shannon index for NE was significantly higher (p < 0.05) than that of other traditional methods and wf-eDNA in the BPUE dataset of 2018, while the value for wf-eDNA in 2019 was significantly higher (p < 0.05) than that of the traditional sampling methods (Figures 3E,F). In addition, the Shannon index in wf-eDNA in the CPUE dataset was statistically higher (p < 0.05) than that of the traditional methods in both sampling years (Figures 4E,F).
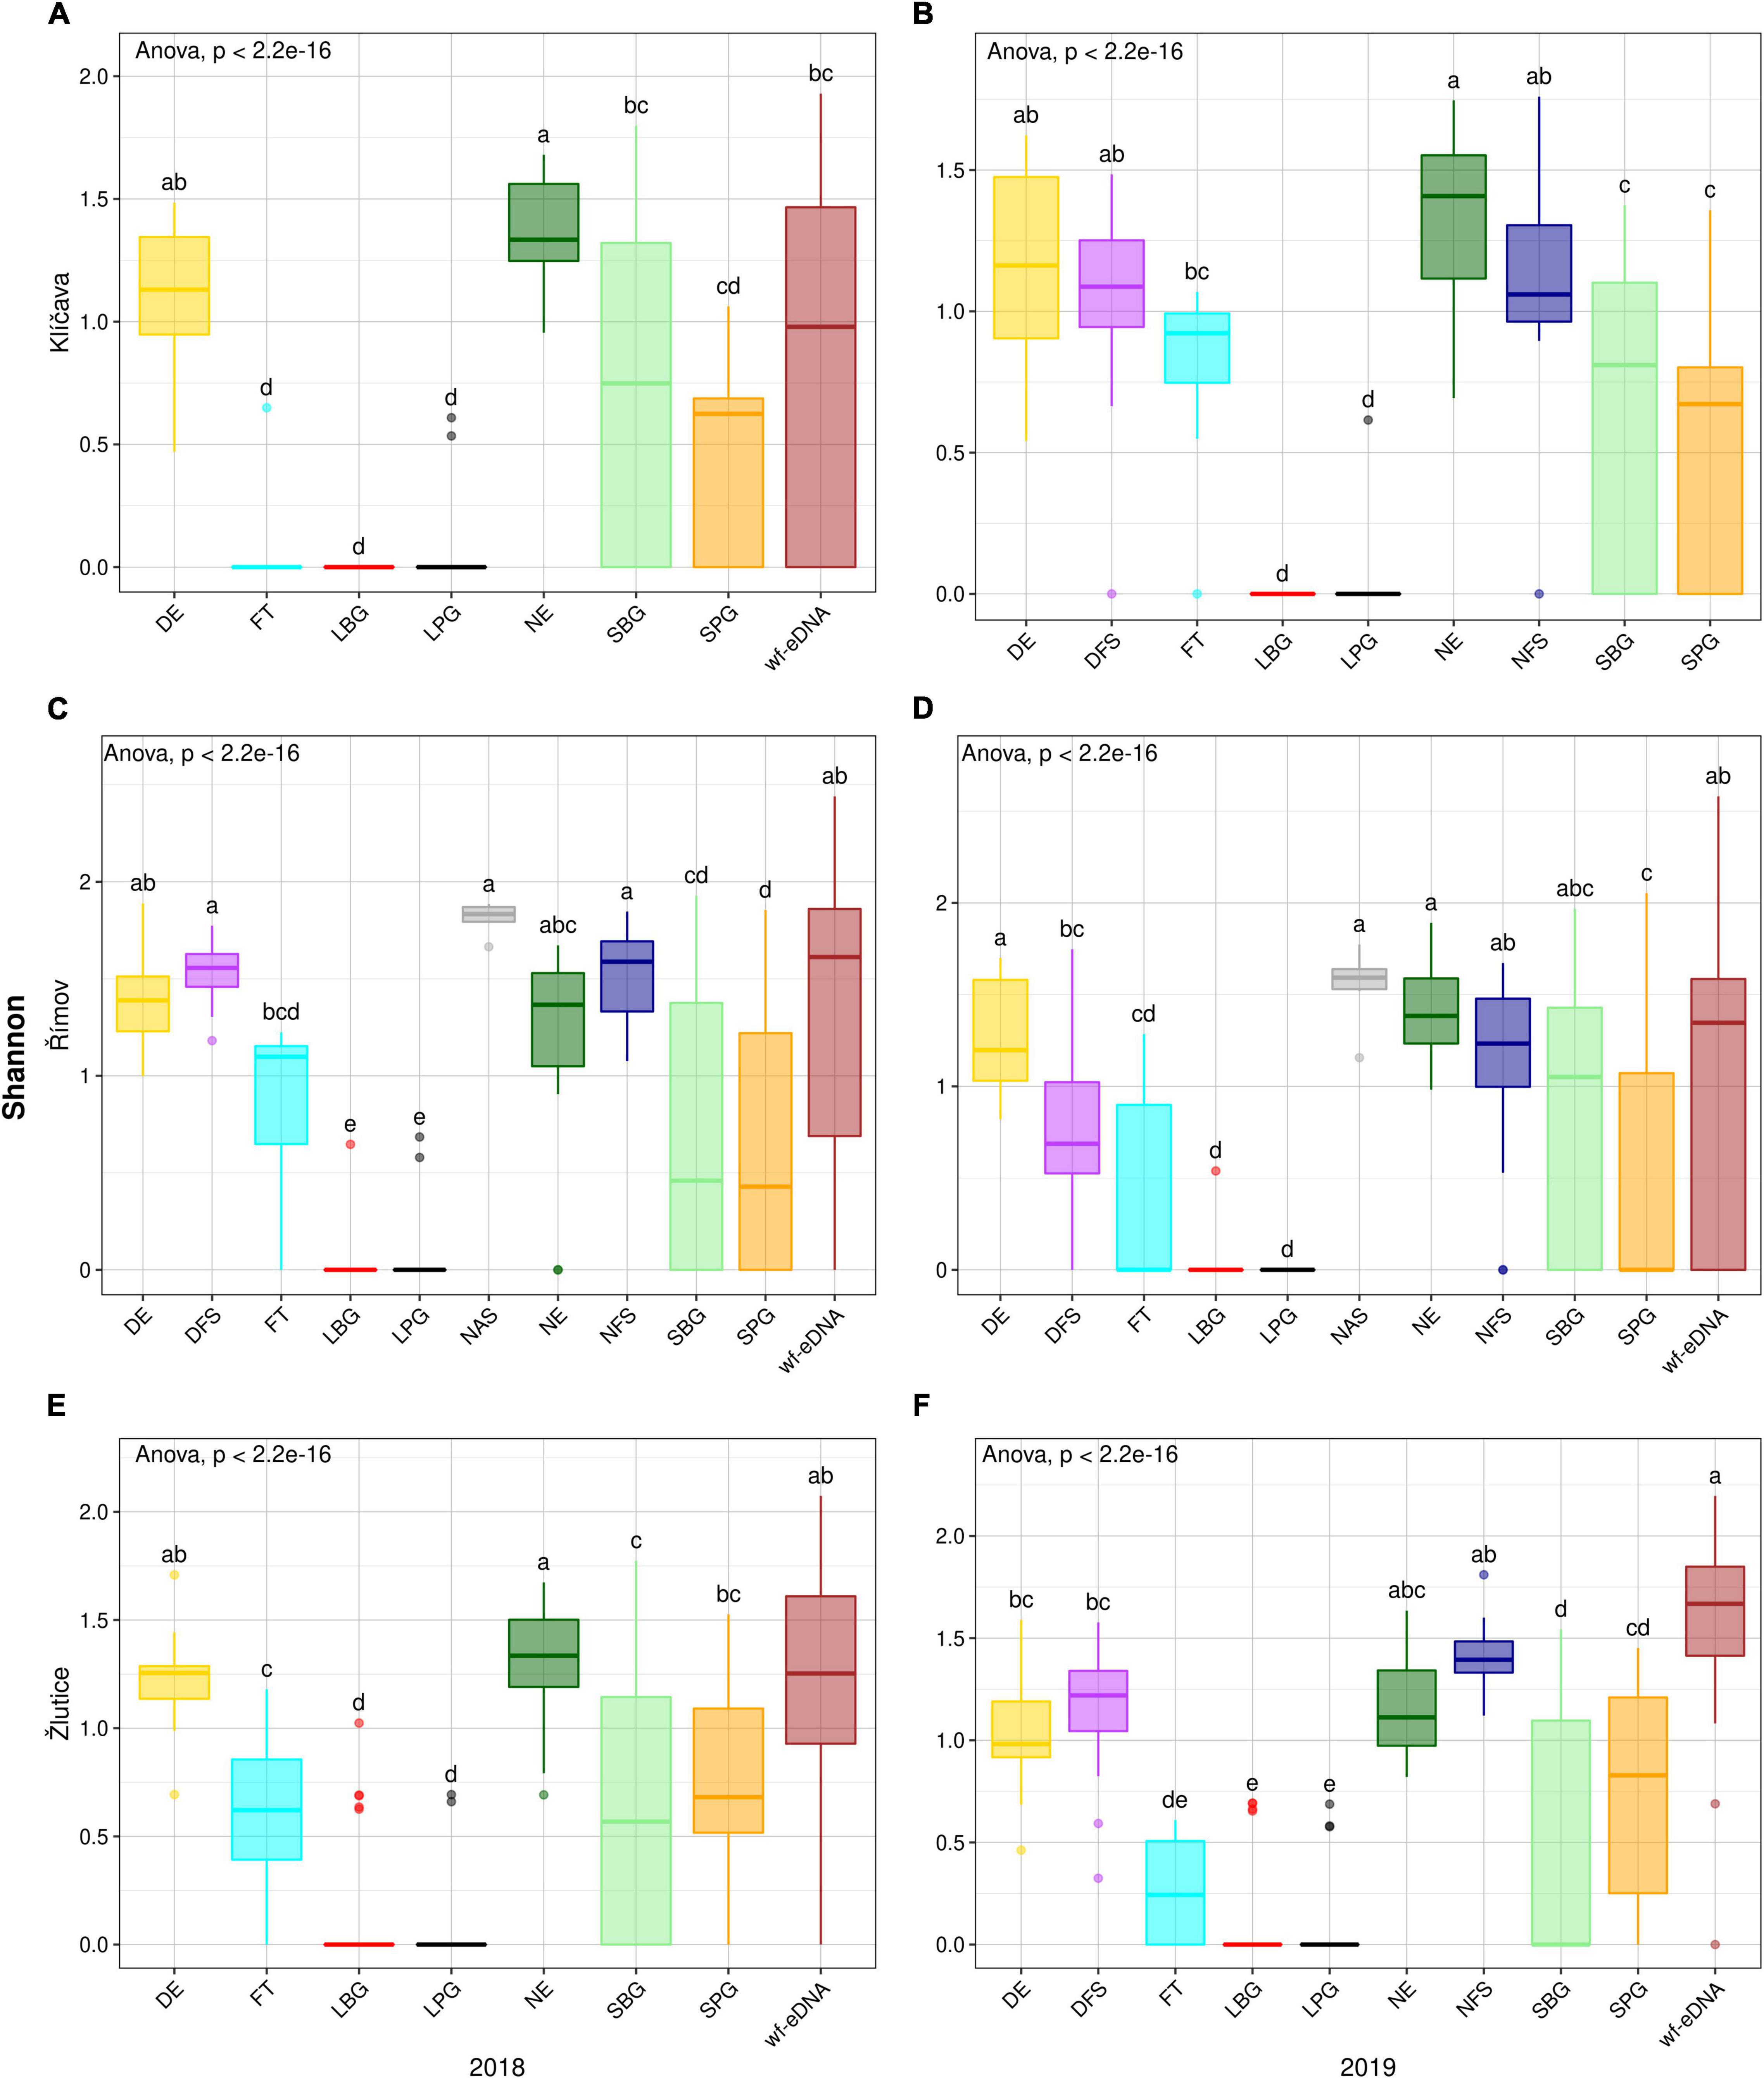
Figure 3. Box plots comparison of alpha diversity (Shannon) based on BPUE data in 2018 (left plots) and 2019 (right plots) between wf-eDNA assay and traditional sampling methods in Klíčava, Římov and Žlutice reservoirs. Significant differences are indicated by different upper superscripts. Horizontal line inside the box indicates the calculated median, box 1st and 3rd quartile, whiskers data range and dots outliers of Shannon value. Traditional sampling methods are abbreviated aS follow: DE = day electrofishing, NE = night electrofishing, SBG = standard benthic gillnets, SPG = standard pelagic gillnets, LBG = large mesh-size benthic gillnets, LPG = large mesh-size pelagic gillnets, NAS = night-time adult seining, DFS = day-time fry seining, NFS= night-time fry seining, FT = fry trawl and wf-eDNA = eDNA from water targeting fish.
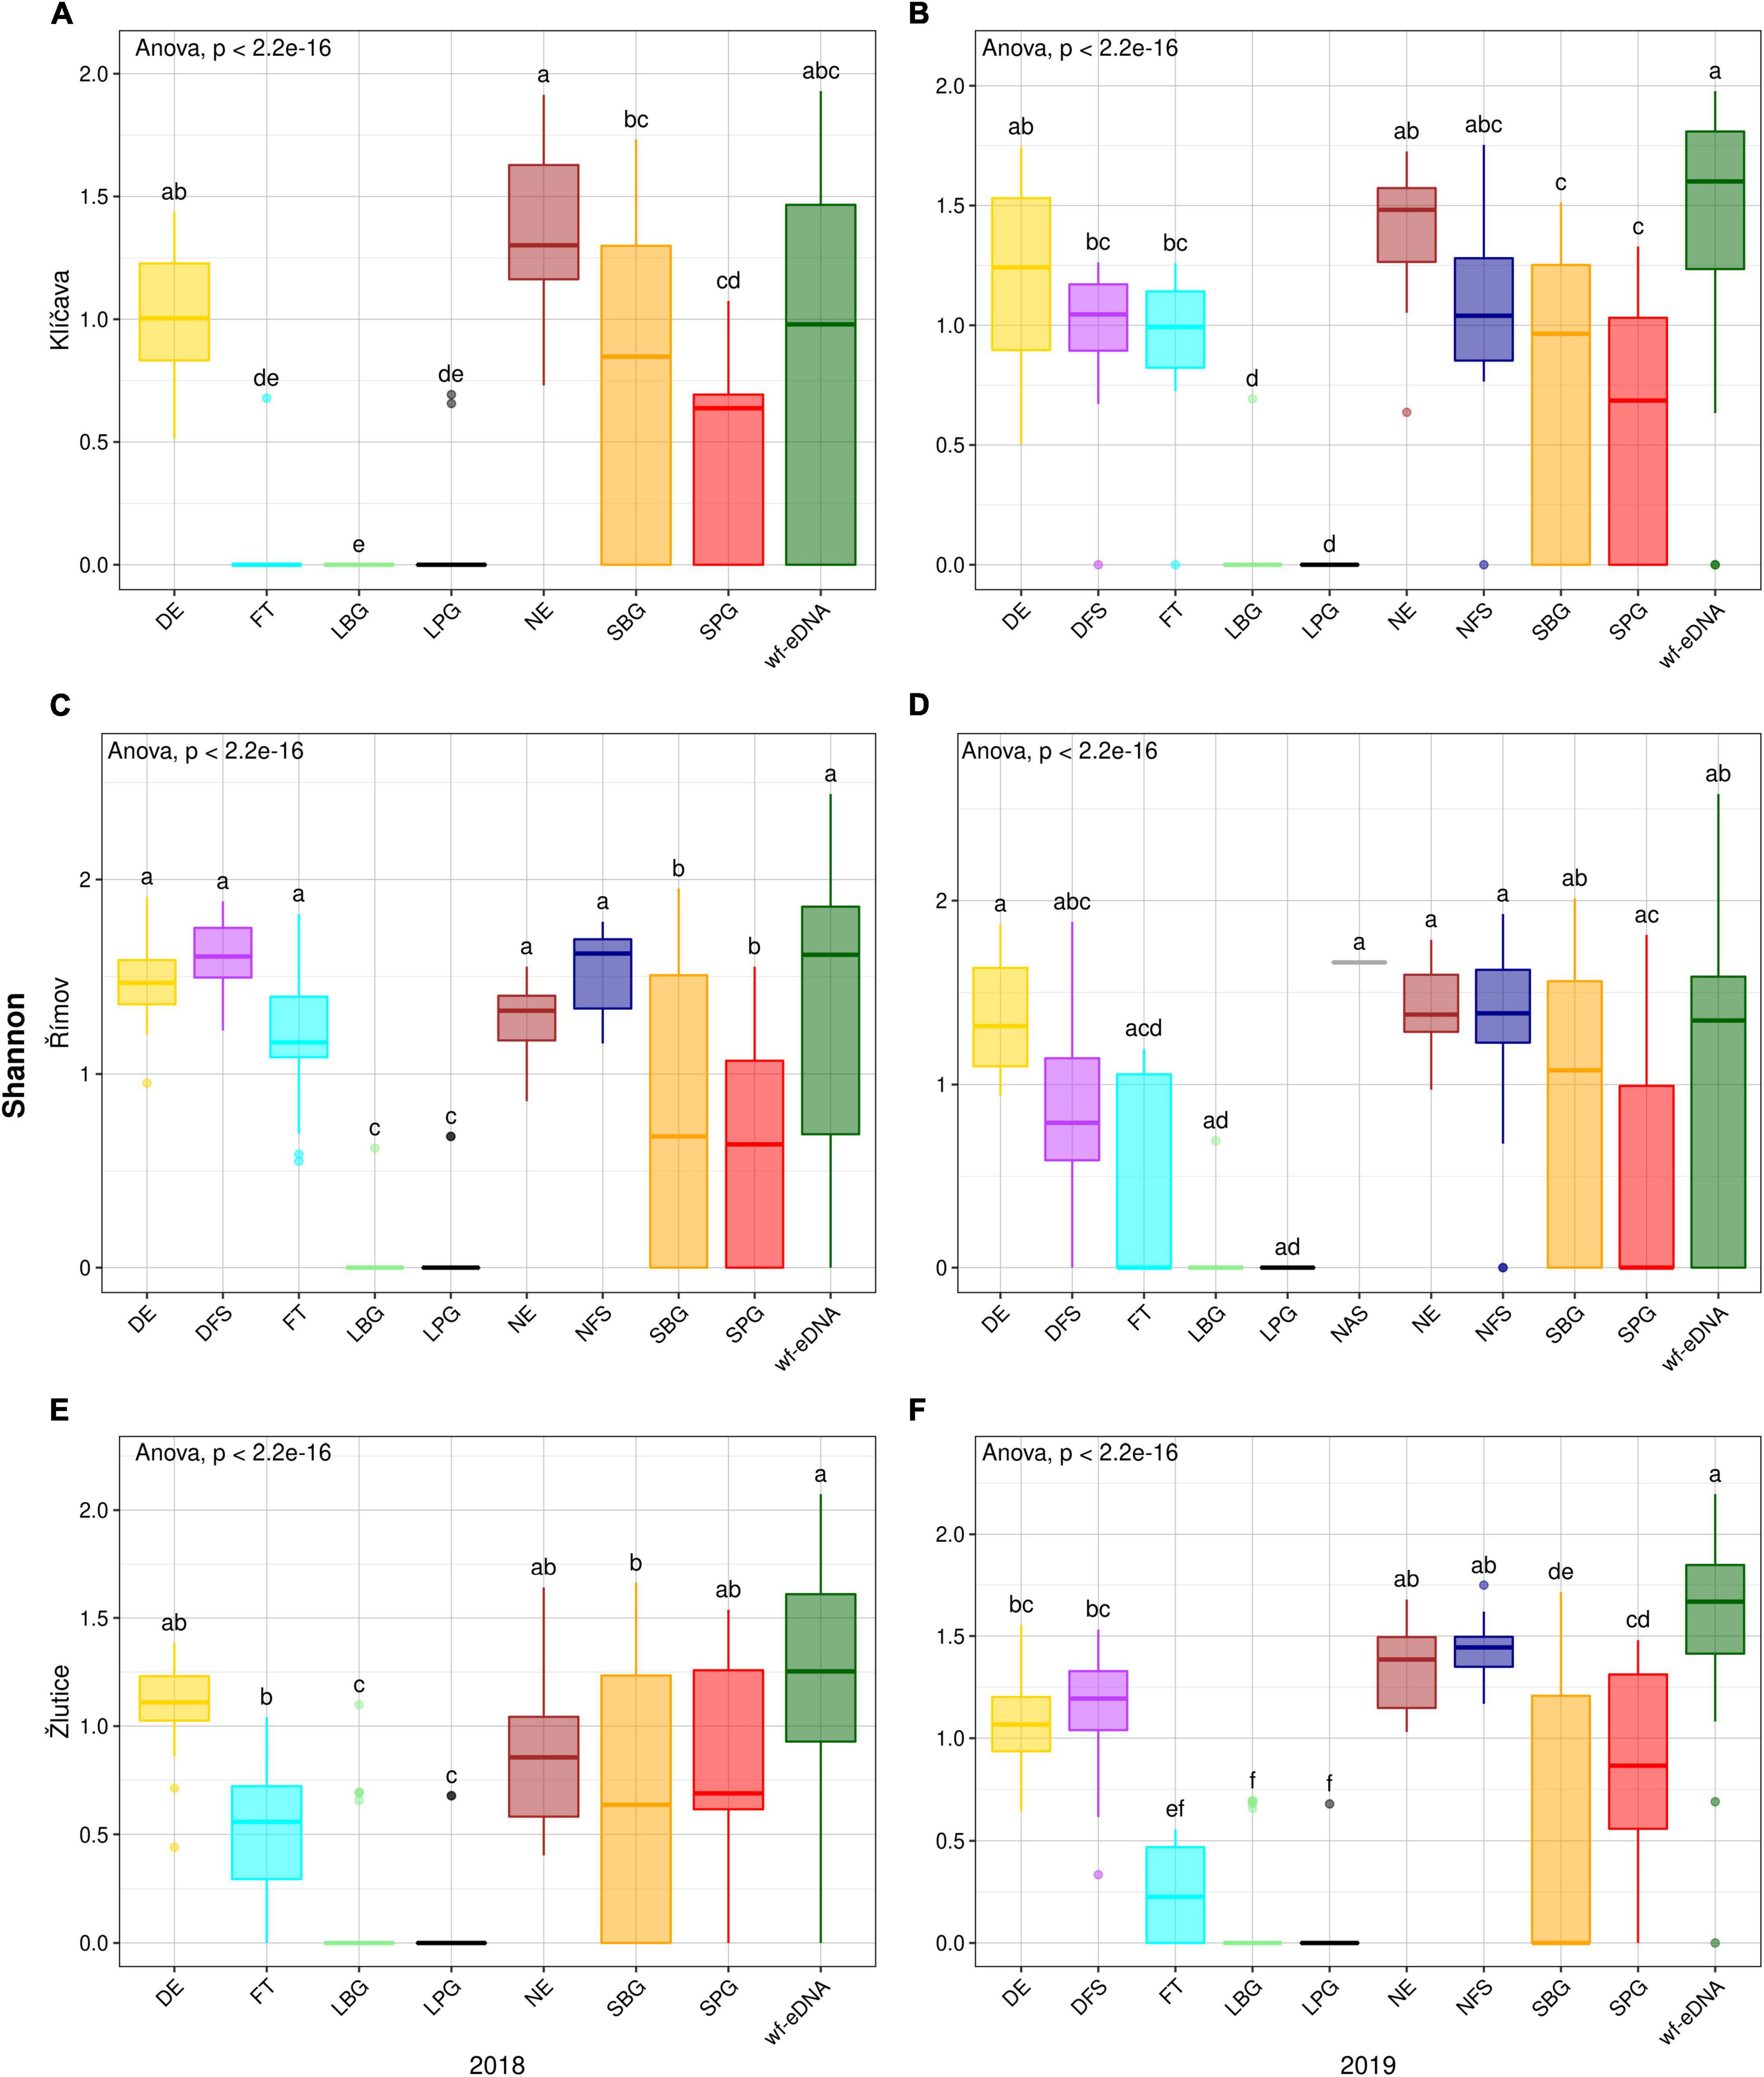
Figure 4. Box plots comparison of alpha diversity (Shannon) based on CPUE data in 2018 (left plots) and 2019 (right plots) between wf-eDNA assay and traditional sampling methods in Klíčava, Římov and Žlutice reservoirs. Significant differences are indicated by different superscripts. Horizontal line inside the box indicates the calculated median, box 1st and 3rd quartile, whiskers data range and dots outliers of Shannon value. Traditional sampling methods are abbreviated as follow: DE = day electrofishing, NE = night electrofishing, SBG = standard benthic gillnets, SPG = standard pelagic gillnets, LBG = large mesh-size benthic gillnets, LPG = large mesh-size pelagic gillnets, NAS = night-time adult seining, DFS = day-time fry seining, NFS= night-time fry seining, FT = fry trawl and wf-eDNA = eDNA from water targeting fish.
In the Klíčava reservoir, there was also a significant difference in richness value (p < 0.05) in NE compared to other traditional sampling methods and wf-eDNA in the 2018 AND 2019 BPUE dataset, (Figures 5A,B). A similar trend was observed in the CPUE datasets (Figures 6A,B). There was also a significant difference in richness value (p < 0.05) in NAS method compared to other traditional methods and wf-eDNA in BPUE dataset (Figures 5C,D) in the Římov reservoir. Based on the CPUE dataset, there was a significant difference in richness between the traditional methods and wf-eDNA. The values were significantly different (p < 0.05) in DFS compared to other traditional sampling methods and wf-eDNA (Figures 6C,D). In addition, the value of species richness in the Žlutice reservoir in DE was significantly higher (p < 0.05) than traditional methods and wf-eDNA in the 2018 BPUE dataset (Figures 5E,F), while wf-eDNA had significantly higher values than traditional methods in 2019. A similar pattern of species richness was also found in the CPUE dataset (Figures 6E,F).
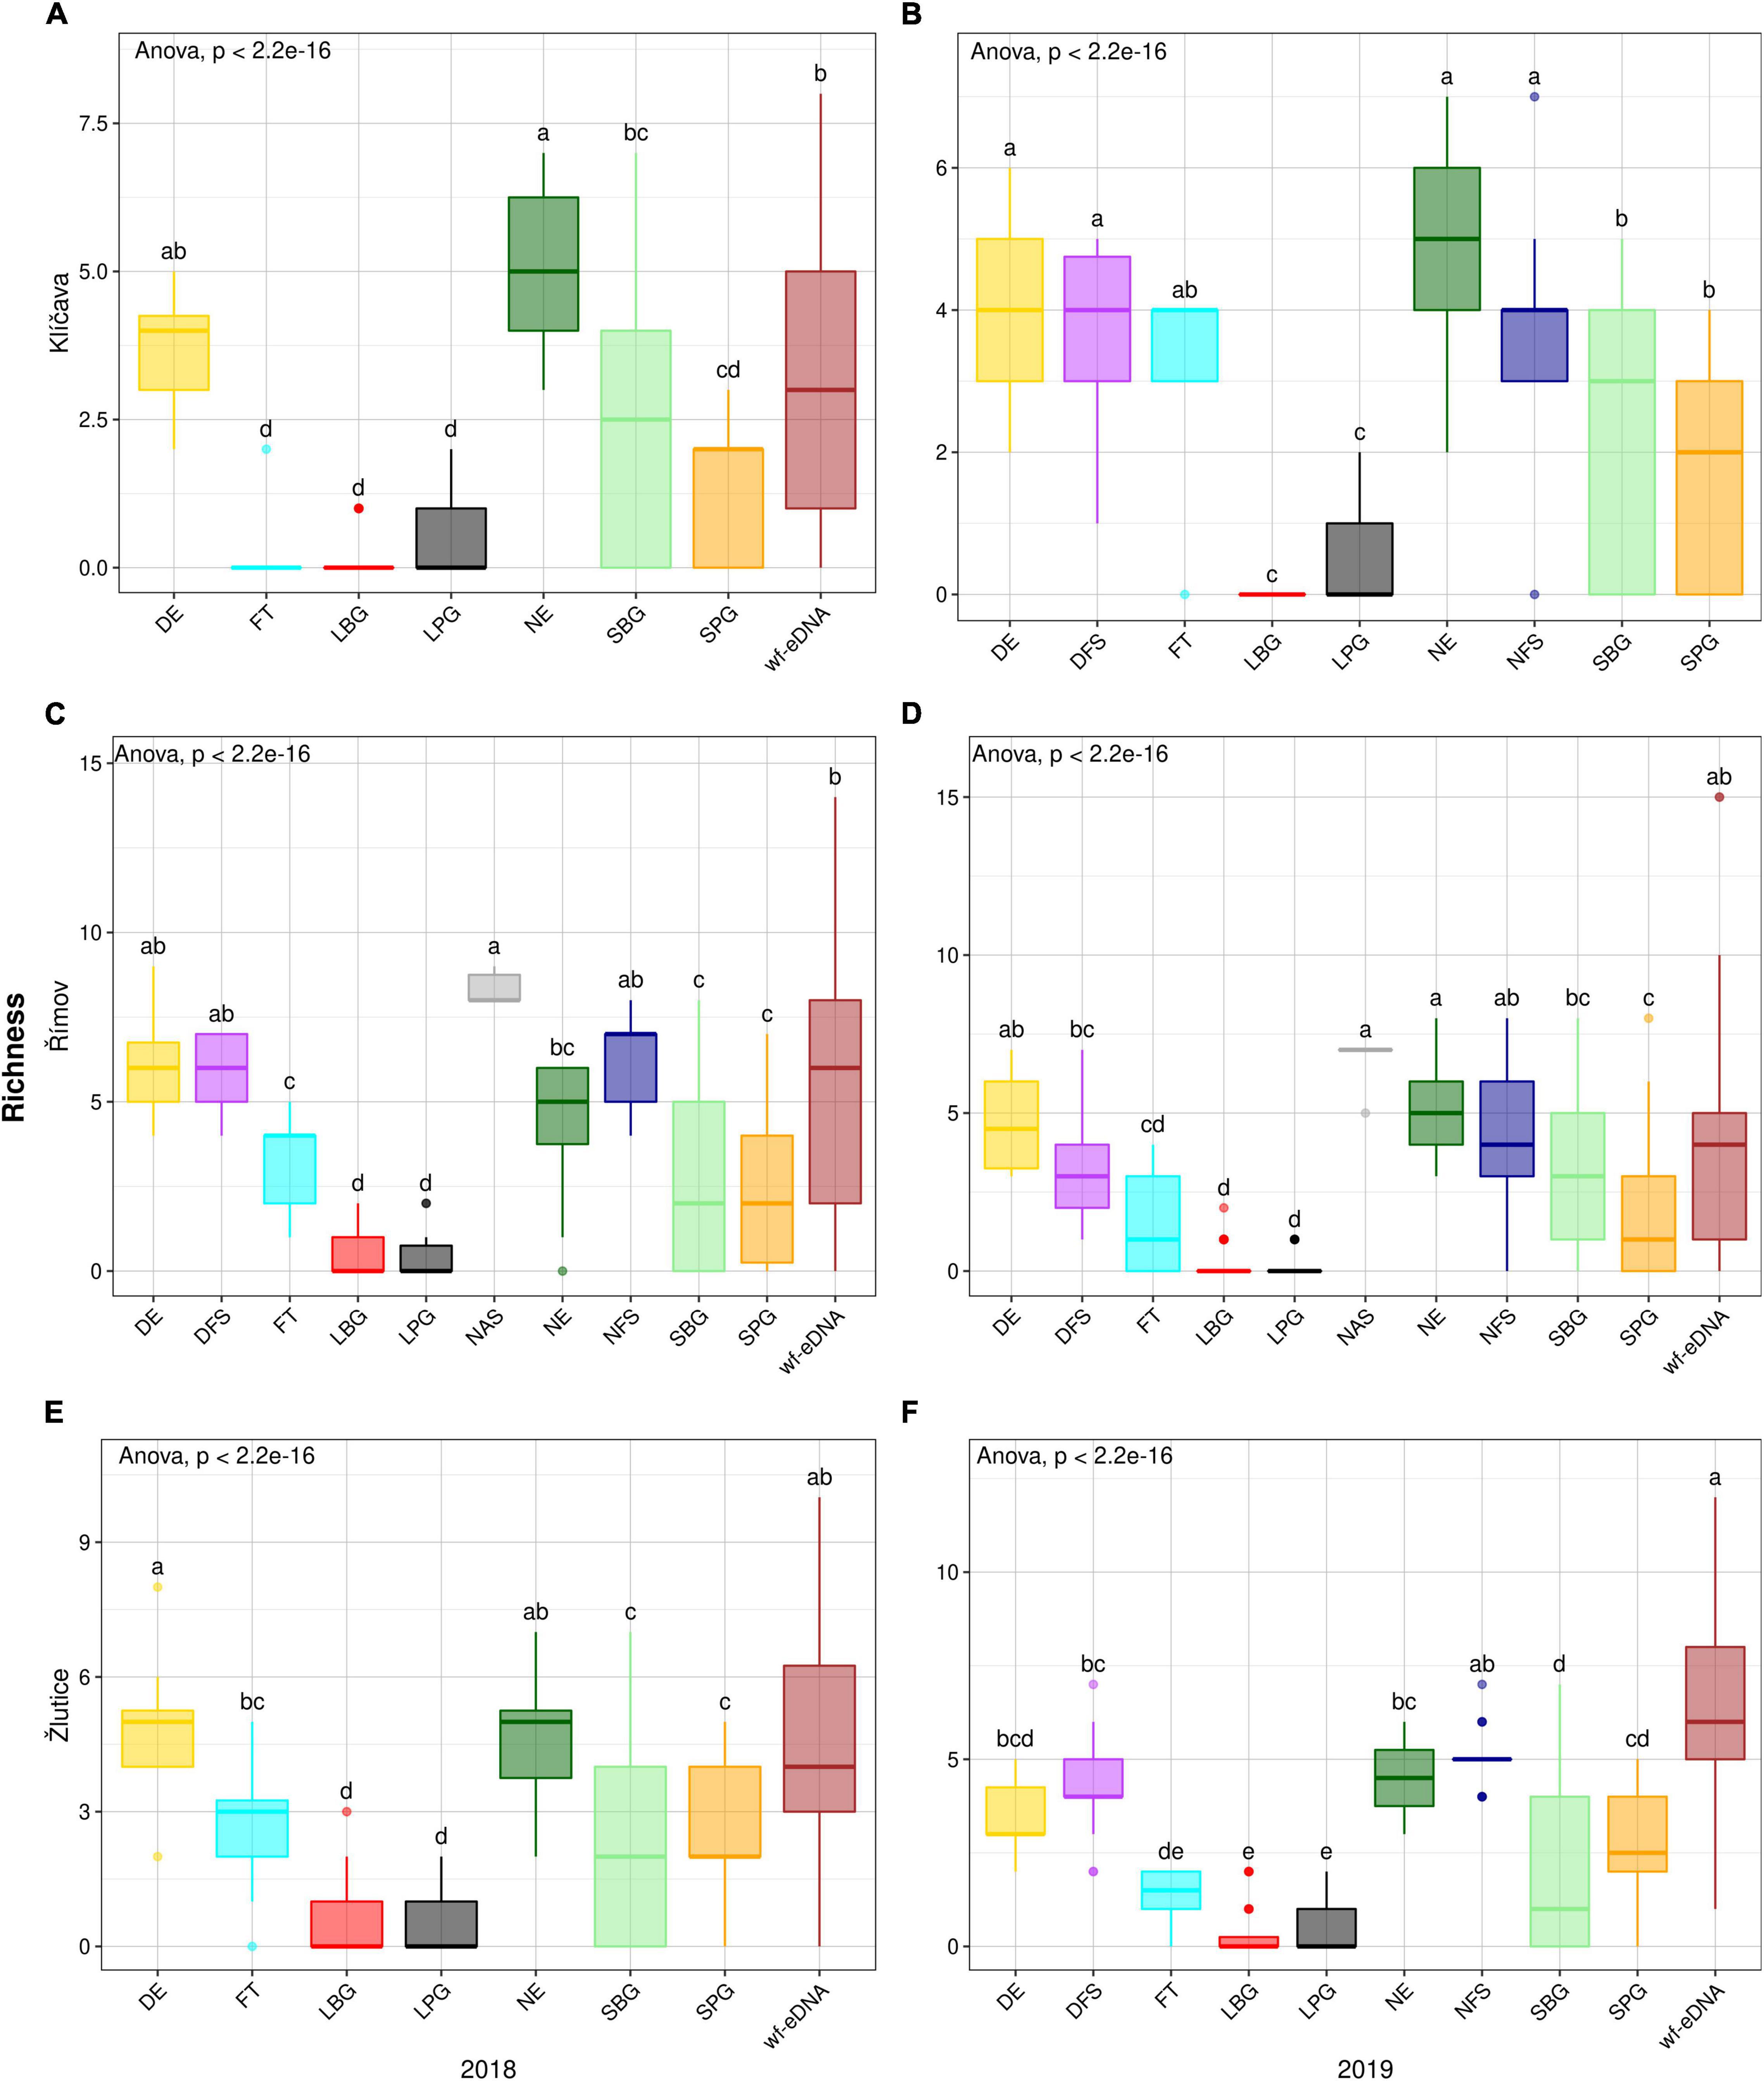
Figure 5. Box plots comparison of alpha diversity (Richness) based on BPUE data in 2018 (left plots) and 2019 (right plots) between wf-eDNA assay and traditional sampling methods in Klíčava, Římov and Žlutice reservoirs. Significant differences are indicated by different superscripts. The horizontal line inside the box indicates calculated median, box 1st and 3rd quartile, whiskers data range and dots outliers of Richness value. Traditional sampling methods are abbreviated as follow: DE = day electrofishing, NE = night electrofishing, SBG = standard benthic gillnets, SPG = standard pelagic gillnets, LBG = large mesh-size benthic gillnets, LPG = large mesh-size pelagic gillnets, NAS = night-time adult seining, DFS = day-time fry seining, NFS= night-time fry seining, FT = fry trawl and wf-eDNA = eDNA from water targeting fish.
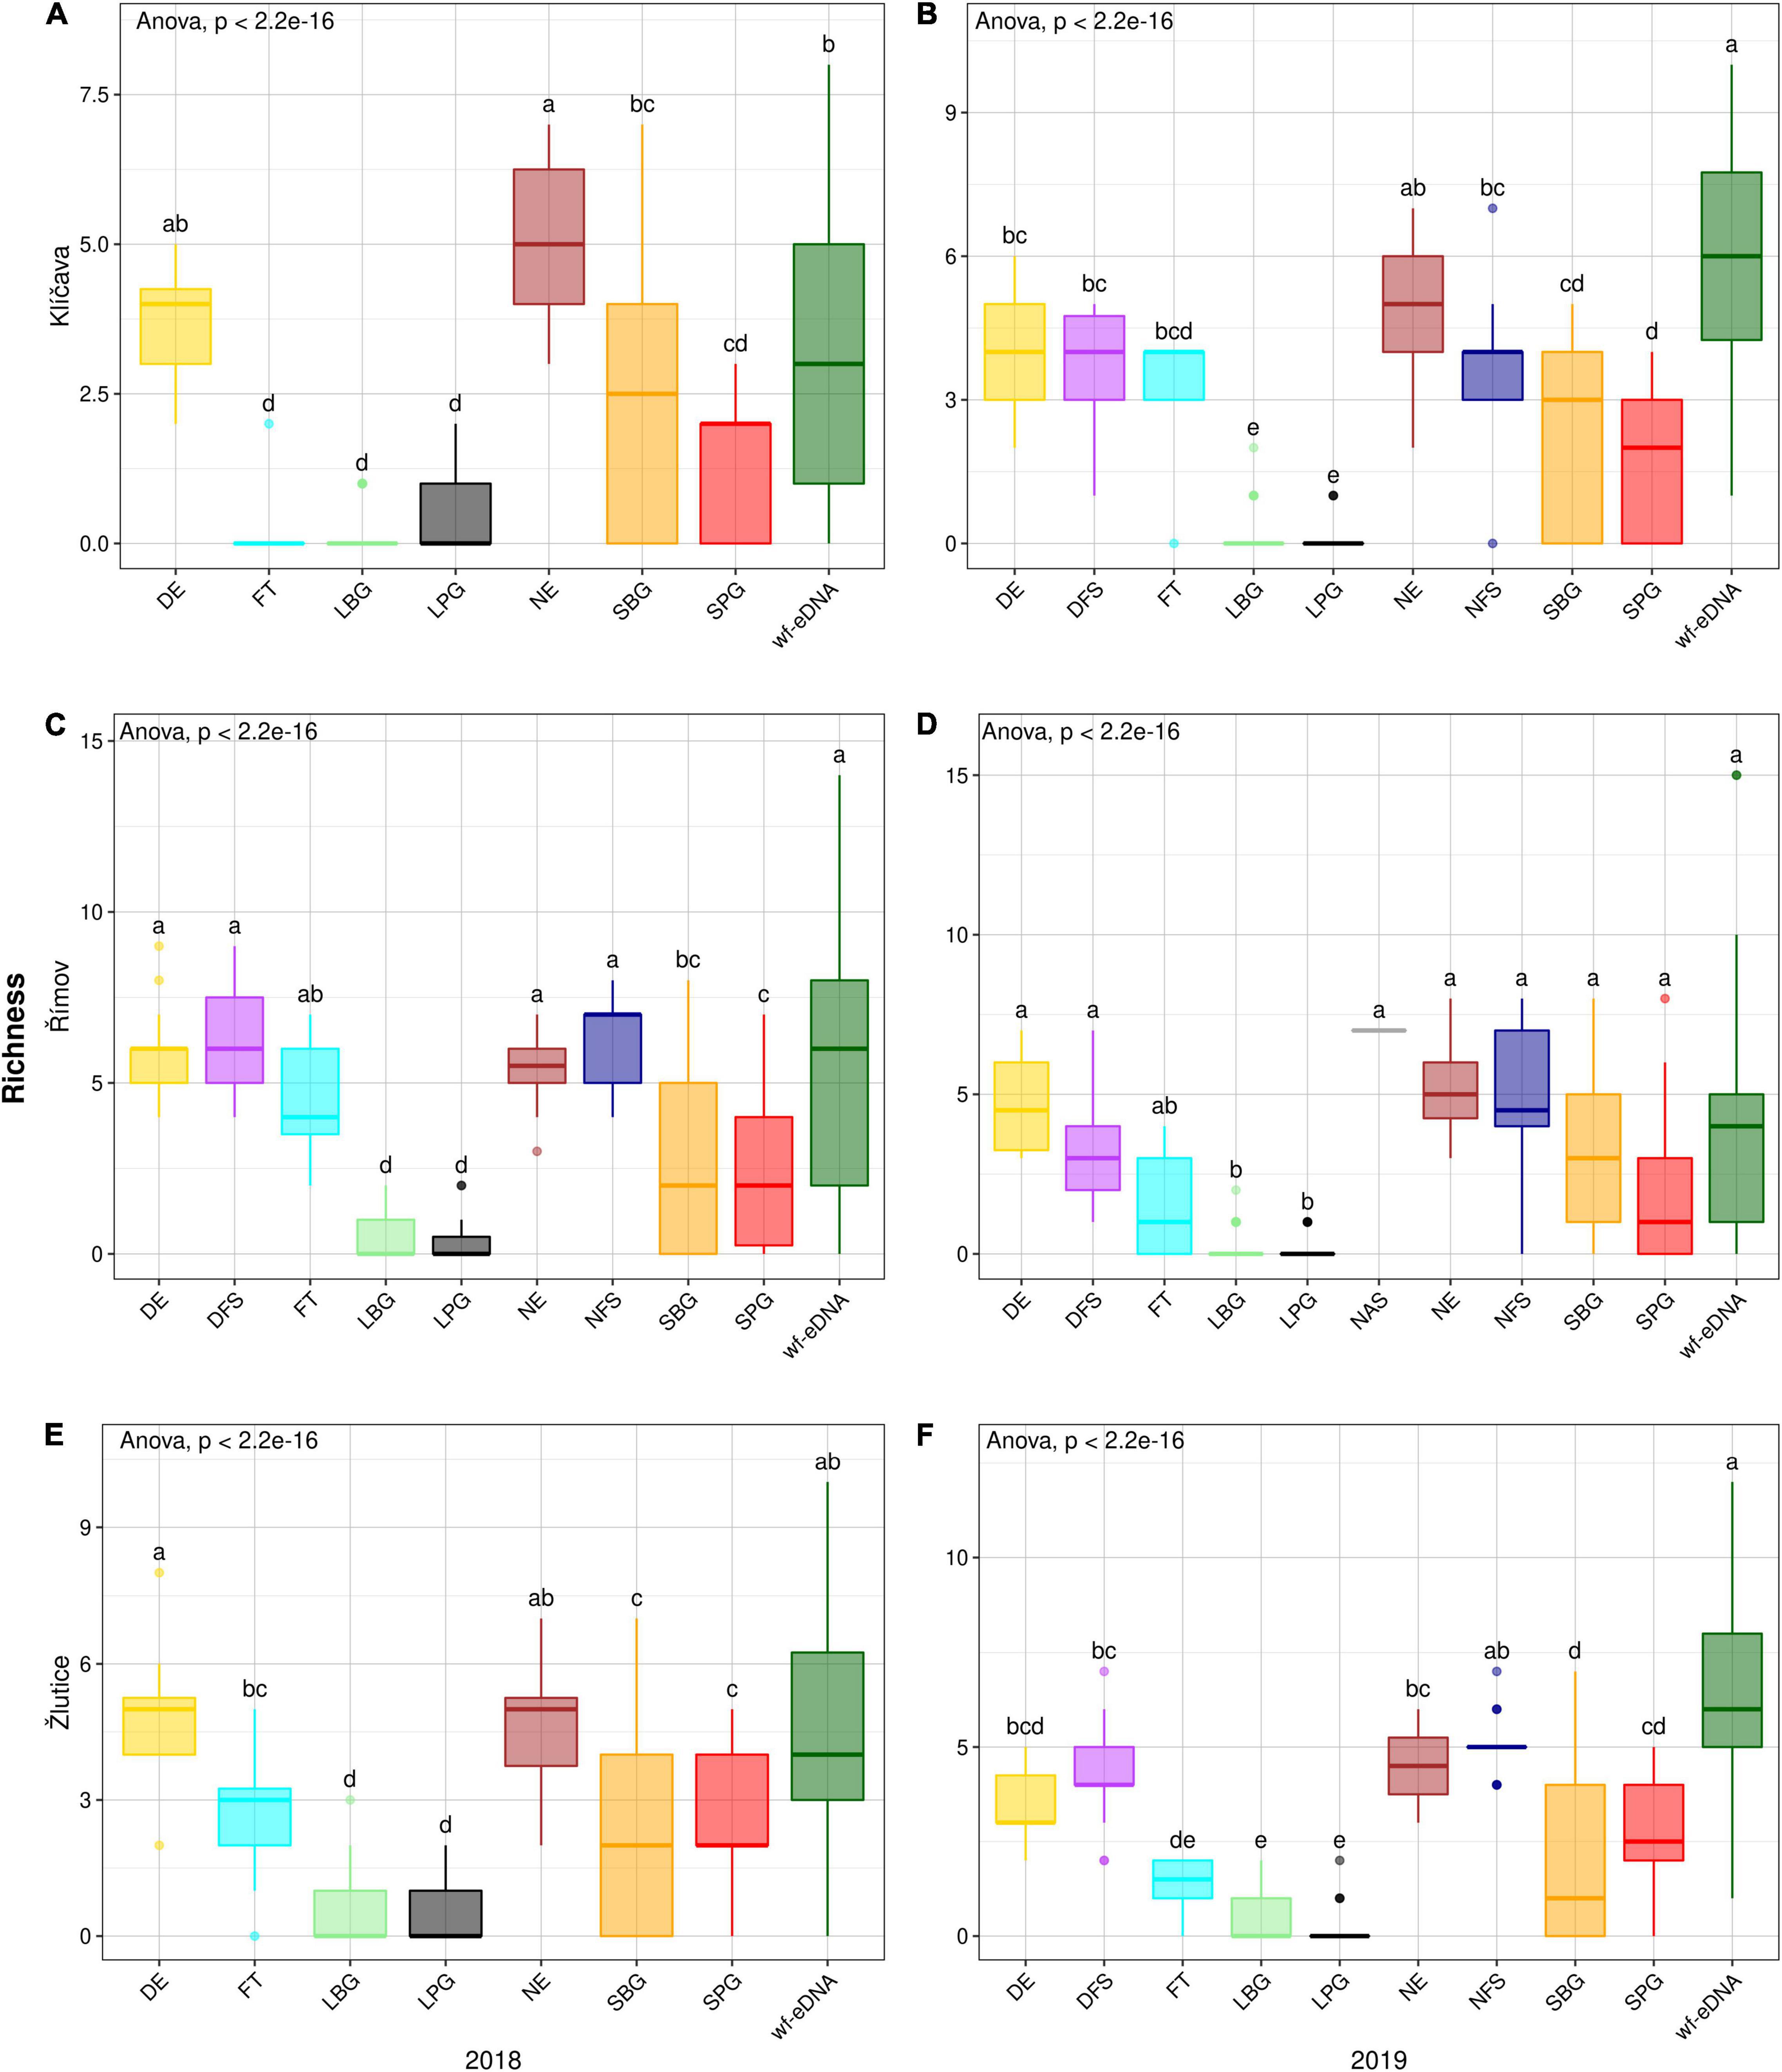
Figure 6. Box plots comparison of alpha diversity (Richness) based on CPUE data in 2018 (left plots) and 2019 (right plots) between wf-eDNA assay and traditional sampling methods in Klíčava, Římov and Žlutice reservoirs. Significant differences are indicated by different superscripts. The horizontal line inside the box indicates the calculated median, box 1st and 3rd quartile, whiskers data range and dots outliers of Richness value. Traditional sampling methods are abbreviated as follow: DE = day electrofishing, NE = night electrofishing, SBG = standard benthic gillnets, SPG = standard pelagic gillnets, LBG = large mesh-size benthic gillnets, LPG = large mesh-size pelagic gillnets, NAS = night-time adult seining, DFS = day-time fry seining, NFS= night-time fry seining, FT = fry trawl and wf-eDNA = eDNA from water targeting fish.
Correlations Between Methods
In the Klíčava reservoir, Spearman’s rank correlation coefficient between wf-eDNA and all traditional sampling methods was highly significant in the 2018 BPUE dataset, except that the correlation between wf-eDNA and LBG was not found. Similarly, a moderately significant Spearman’s rank correlation coefficient was found between wf-eDNA site occupancy and all traditional sampling methods in the 2019 BPUE dataset, but the correlation between wf-eDNA and LPG was not observed (Supplementary Figures 1A,B). In addition, similar to the 2018 BPUE dataset, a moderately significant Spearman’s rank correlation coefficient was observed between wf-eDNA and all traditional sampling methods in the 2018 CPUE dataset. However, Spearman’s rank correlation coefficient was highly significant between wf-eDNA and all traditional sampling methods in the 2018 BPUE dataset, except that the correlation between wf-eDNA, DE, and LPG was not observed in the 2019 CPUE dataset (Supplementary Figures 2A,B). Similar to the Klíčava reservoir, the 2018 Římov BPUE dataset showed a highly significant Spearman’s rank correlation coefficient between wf-eDNA and almost all traditional sampling methods; however, there was no significant Spearman’s rank correlation coefficient between wf-eDNA, NE, and LBG (Supplementary Figures 3A,B). A similar relationship was also observed in the CPUE dataset (Supplementary Figures 4A,B). In addition, Spearman’s rank correlation coefficients between wf-eDNA and all traditional sampling methods were highly significant in the BPUE dataset in Žlutice reservoir in 2018 and 2019 (Supplementary Figures 5A,B), although no correlation was found between wf-eDNA, LBG, LPG, and DE. A similar trend in Spearman’s rank correlation coefficient was also observed between wf-eDNA and all traditional sampling methods in the CPUE dataset in 2018 and 2019 (Supplementary Figures 6A,B).
Discussion
This study is the first to compare multiple traditional sampling methods and wf-eDNA in three independent lentic ecosystems. To date, few studies have used multiple sampling methods (different types of nets and electrofishing) and wf-eDNA to investigate the composition and diversity of biological communities in aquatic environments. Compared to our study, previous studies have used only one or relatively few established traditional methods compared to wf-eDNA to investigate fish community composition and diversity in heterogeneous temperate waters. Most studies have used single or relatively fewer traditional sampling methods, such as electrofishing and gill netting (Lawson Handley et al., 2019; Czeglédi et al., 2021), fyke net and gill netting (Sard et al., 2019; Gehri et al., 2021), cast netting, gill netting, and stationary netting (Hayami et al., 2020) to compare the performance of wf-eDNA with traditional sampling methods and to characterize the ecological communities of an aquatic ecosystem at a regional scale. Fuji et al. (2019) used multiple and complex established traditional sampling methods (traps, longline fishing, gill nets, cast nets, dip nets, trawls, and electrofishing) for community analysis in reservoirs in Japan.
Species Composition Assessment
In our study, NMDS ordination was used to characterize fish community composition between established traditional sampling methods and the wf-eDNA assay. Despite most overlap of most methods in all reservoirs examined in this study, fish communities showed partial difference between traditional methods and wf-eDNA (electrofishing, multiple gillnets, and wf-eDNA). This pattern is confirmed by the results of Boivin-Delisle et al. (2021), who showed that wf-eDNA and fish caught with gillnets provide significantly different portraits of fish communities. Previous studies have also confirmed that the greatest discrepancy in community patterns is based on electrofishing and gill netting (Goffaux et al., 2004; Sutela et al., 2008; Czeglédi et al., 2021). However, in support of our findings, Fuji et al. (2019) found no significant difference between NMDS ordinations using traditional sampling methods and wf-eDNA at different study sites. In the present study, it was found that the similarities in the composition of detected fish between wf-eDNA and traditional sampling methods in the Římov were relatively low compared to other reservoirs studied. This result could be due to the different trophic statuses of the studied reservoirs, where eutrophication-tolerant species (common carp, bream, and roach) are more abundant. This shows some spatial structuring that accurately reflects the ecology of the species (Lawson Handley et al., 2019). In agreement with our results, significantly fewer genera and families of the macroinvertebrate community were found with the traditional sampling method than with wf-eDNA (Erdozain et al., 2019). This is likely due to a combination of limitations associated with primer biases, incompleteness of the reference database, or possible stochasticity in low biomass species. The slight heterogeneity in fish community composition between traditional methods and wf-eDNA observed in the current study is consistent with the congruence between electrofishing, gillnet, and wf-eDNA sampling methods in characterizing fish community structure in oxbow lakes in Hungary (Czeglédi et al., 2021). It has been shown that differences in fish community structure may be due to sampling methods rather than actual differences in fish communities between habitats (Eros et al., 2009a,b). Nevertheless, several studies support the research showing that wf-eDNA provides a practical and comprehensive characterization of fish communities (Hänfling et al., 2016; Port et al., 2016; Valentini et al., 2016; Yamamoto et al., 2017; Lawson Handley et al., 2019; Li et al., 2019). Several authors have shown that capturing actual fish community structure and monitoring using either established traditional methods or wf-eDNA alone cannot provide robust and accurate data, although their combination as complementary approaches can reliably provide a true picture of communities in dynamic freshwater habitats (Lacoursière-Roussel et al., 2016; Hering et al., 2018; Lecaudey et al., 2019; García-Machado et al., 2021), which was evident in the present study. Therefore, we propose that wf-eDNA can be used in the assessment of fish communities in aquatic ecosystems with different trophic statuses to complement traditional sampling methods rather than replace them.
Diversity and Site Occupancy of Fish Communities
Biodiversity estimation is the most fundamental key to ecosystem function through the measurement of Shannon and species richness indices (Gotelli and Colwell, 2011; Goutte et al., 2020). Limited information is available on the effectiveness and performance of wf-eDNA compared to traditional sampling methods for measuring biodiversity indices. However, wf-eDNA has been shown to detect more species than traditional survey methods, particularly in freshwater systems with fewer than 100 species (McElroy et al., 2020). In Římov reservoir, Shannon and richness indices between methods were statistically significant; however, the degree of difference between wf-eDNA and other traditional surveys (DE, NE, and NAS) was negligible. Accordingly, a congruency was found in the regional estimation of richness by comparing wf-eDNA with traditional sampling methods, confirming the potential of wf-eDNA for biodiversity assessment in aquatic ecosystems. Consistent with our results, similarity was found between wf-eDNA and electrofishing for estimating richness in the St. Joseph River, United States (Olds et al., 2016). This shows several advantages, such as identification of species by wf-eDNA without increased effort and habitat disturbance for biomonitoring of fish fauna (Adamson and Hurwood, 2016). The Shannon index calculated from wf-eDNA was significantly higher than traditional sampling methods in the present study in the Klíčava and Žlutice Reservoirs. In contrast, congruence in the richness index was observed in the present study, regardless of the statistically significant differences between the approaches, especially between wf-eDNA and NAS. This discrepancy in the richness index could be related to the less abundant species composition and methods used in the Klíčava and Žlutice reservoirs, suggesting that the wf-eDNA method is sensitive to very rare species that occur at low abundance. In support of our data, species richness was significantly different across methods and consistently higher for the wf-eDNA method than for traditional sampling methods (electrofishing, seining, trawling), despite extensive sampling using traditional methods (Hallam et al., 2021). Recent evidence also confirms that wf-eDNA outperforms gillnet and fyke net methods in measuring species richness in Boardman Lake (Gehri et al., 2021). Correlations between the detection sensitivity and relative abundance of wf-eDNA and conventional survey methods are essential to obtain a comprehensive overview of the distribution of freshwater species in different aquatic environments. Several studies have shown that semi-quantitative abundance estimates of wf-eDNA in reservoirs (i.e., site occupancy) are consistent with data from traditional sampling methods (Evans et al., 2016; Hänfling et al., 2016; Andruszkiewicz et al., 2017; O’Donnell et al., 2017; Lawson Handley et al., 2019; Blabolil et al., 2021a). In the present study, a positive and significant correlation was found between eDNA and BPUE and CPUE data in all the reservoirs studied. Several studies have reported a positive correlation between eDNA and biomass or abundance data in freshwater (Evans et al., 2016; Lacoursière-Roussel et al., 2016; Sard et al., 2019; Czeglédi et al., 2021) and marine aquatic environments (Port et al., 2016; Thomsen et al., 2016; Andruszkiewicz et al., 2017; Afzali et al., 2021). Takahara et al. (2012) highlighted that data on species biomass in natural environments can be obtained more easily and quickly with wf-eDNA than with traditional sampling methods. Nevertheless, a weak quantitative relationship was found between wf-eDNA, and the biomass of marine fish caught with trawls (Knudsen et al., 2019). Lamb et al. (2019) also conducted a meta-analysis and showed a weak quantitative relationship between biomass and wf-eDNA. The insufficient or lack of correlation between abundance and wf-eDNA observed in different natural systems could be attributed to variations associated with environmental factors (Yates et al., 2019; Czeglédi et al., 2021). However, the importance of the environmental factors considered is likely to depend on the species (e.g., body size, age distribution, temperature, time of day, season, etc.) and the system used to measure wf-eDNA (Wilcox et al., 2016).
Utility of wf-eDNA Versus Traditional Survey Methods
In the present study, we demonstrated that wf-eDNA generally covers the broadest taxon range, indicating a more comprehensive characterization of community species diversity and composition than traditional sampling methods. Our results are consistent with those studies that have shown that wf-eDNA surveys provide taxa-detection data and, in many cases, outperform traditional survey methods (Fuji et al., 2019; Lawson Handley et al., 2019; Goutte et al., 2020; Zou et al., 2020; Czeglédi et al., 2021). It can be noted that in the present study, large-mesh gillnets and trawling provided the least information on community composition and diversity compared to other traditional sampling methods. Of the traditional methods used in the present study, daytime electrofishing and standard benthic gill netting surveys provided more comprehensive data in the evaluated reservoirs. Together with the above-mentioned traditional methods and wf-eDNA, we were able to capture and detect most species in each reservoir. Consistent with our results, there is further evidence of higher fish species detection rates with wf-eDNA compared to traditional survey methods in freshwater ecosystems (Civade et al., 2016; Hänfling et al., 2016; Valentini et al., 2016). More species were also detected in the marine ecosystem using wf-eDNA than bottom trawls, with mainly rare species with low abundance (Afzali et al., 2021). In the present study, some fish species collected using traditional methods were not detected with wf-eDNA in any of the reservoirs. These discrepancies are likely due to inconsistent species distribution or different detection methods for species in the three reservoirs studied. This could also be attributed to the fact that the lower detection of species with wf-eDNA and using other traditional methods is due to the different sampling efforts in each reservoir. In Římov reservoir, Coregonus sp., Pseudorasbora parva and Squalius cephalus as well as Hypophthalmichthys sp. in Klíčava reservoir and Carassius carassius and Lota lota in Žlutice reservoir were caught only by traditional methods. This is probably due to the limited amount of eDNA in the water samples released by rare species or the larger spatial structure in the reservoir during the summer months, which failed to detect wf-eDNA. This limitation has also been reported in other studies (Takahara et al., 2012; Dougherty et al., 2016; Doi et al., 2019; Lawson Handley et al., 2019). Numerous studies have also quantitatively assessed the cost-effectiveness of wf-eDNA compared to traditional sampling methods and have shown that the wf-eDNA approach is relatively more cost-effective than traditional methods (Biggs et al., 2015; Davy et al., 2015; Huver et al., 2015; Sigsgaard et al., 2015)., although some technical challenges remain, such as target taxa, site-specific detection rates and budgets (Smart et al., 2016). For instance, a quantitative comparison of financial costs and sampling effort to assess the distribution of native brook trout Salvelinus fontinalis in the Namekagon River watershed in northern Wisconsin found that wf-eDNA analysis required less sampling effort and was 67% cheaper than triple-pass electrofishing (Evans et al., 2017). Similarly, Smart et al. (2016) showed that eDNA analysis is relatively inexpensive compared to traditional sampling methods. Sigsgaard et al. (2015) found that wf-eDNA for the detection of European weather loach (Misgurnus fossilis) was 1.9 times cheaper than a combination of traditional methods. Davy et al. (2015) showed that the cost of detecting nine sympatric freshwater turtles using capture-based methods was 2–10 times higher than that using eDNA. The major drawbacks of wf-eDNA analysis includes the inability of mitochondrial eDNA to distinguish “pure” species from hybrids and the movement of eDNA from site to site both in water and in the organism (Evans et al., 2017; Evans and Lamberti, 2018). However, the latter can be managed through careful wf-eDNA sampling plans and collections. Furthermore, the trade-offs between the accuracy, cost, coverage, and speed of each method in biodiversity monitoring are strongly recommended for managers to assess biodiversity in aquatic environments (Qu and Stewart, 2019).
Conclusion
In summary, the wf-eDNA and traditional sampling methods used in the present study should not be considered as alternative methods for biodiversity assessment and monitoring because they can provide different information. To maximize the number of species detected and obtain a complete overview of species composition and diversity estimates, while reducing the cost, time, and effort associated with sampling, the combination of day electrofishing, benthic gill nets, and wf-eDNA is the most appropriate strategy in aquatic systems, especially for science-based policy decisions. On the other hand, large-mesh gillnets and trawling added little additional information. In addition, how the combination of wf-eDNA and traditional sampling methods is proposed in this study may be influenced by practical considerations, such as the availability of resources (including funding, time, and the knowledge and skills of the individuals conducting the research) and the issues addressed in the study.
Data Availability Statement
The datasets presented in this study can be found in online repositories. The names of the repository/repositories and accession number(s) can be found below: NCBI (accession: PRJNA611963).
Ethics Statement
The study was conducted in accordance with all legal requirements of the Czech Republic. All sampling procedures and experimental protocols used in this study were performed in accordance with the guidelines of and with permission from the Experimental Animal Welfare Commission under the Ministry of Agriculture of the Czech Republic (Ref. No. CZ 01679).
Author Contributions
AG and PB: conceptualization, data curation, writing—original draft, review, and editing. DB, MŘ, and MŠ: review and editing, and sampling. MČ, MV, VD, LK, and TK: sampling. RS and TJ: conceptualization and sampling. CM: Statistical data analysis. AS: conceptualization, review and editing, and sampling. JP: conceptualization and review and editing. All authors contributed to the article and approved the submitted version.
Funding
This study was supported by project QK1920011 “Methodology for quantification of predators in drinking water reservoirs for optimization of aquatic ecosystem management,” MSM200961901 “The true picture of eDNA,” ERDF/ESF project “Biomanipulation as a tool for improving the water quality of reservoirs” (no. CZ.02.1.01/0.0/0.0/16_025/0007417) and by the PPLZ project L200962102 “Fish community assessment using environmental DNA metabarcoding and traditional fishing methods; a promising tool for fisheries management.”
Conflict of Interest
The authors declare that the research was conducted in the absence of any commercial or financial relationships that could be construed as a potential conflict of interest.
Publisher’s Note
All claims expressed in this article are solely those of the authors and do not necessarily represent those of their affiliated organizations, or those of the publisher, the editors and the reviewers. Any product that may be evaluated in this article, or claim that may be made by its manufacturer, is not guaranteed or endorsed by the publisher.
Acknowledgments
We thank the Vltava River State Enterprise (www.pvl.cz) for facilitating the fieldwork and our colleagues at FishEcU (www.fishecu.cz) for the assistance in the field.
Supplementary Material
The Supplementary Material for this article can be found online at: https://www.frontiersin.org/articles/10.3389/fevo.2022.913279/full#supplementary-material
Footnotes
- ^ https://github.com/HullUni-bioinformatics/metaBEAT
- ^ https://github.com/HullUni-bioinformatics/Curated_reference_databases/tree/master/12S_Fish
References
Adamson, E. A., and Hurwood, D. A. (2016). Molecular Ecology and Stock Identification, ed. J. F. Craig (Hoboken, NJ: Wiley), 811–829.
Afzali, S. F., Bourdages, H., Laporte, M., Mérot, C., Normandeau, E., Audet, C., et al. (2021). Comparing environmental metabarcoding and trawling survey of Demersal fish communities in the Gulf of St. Lawrence, Canada. Environ. DNA 3, 22–42. doi: 10.1002/edn3.111
Andruszkiewicz, E. A., Starks, H. A., Chavez, F. P., Sassoubre, L. M., Block, B. A., and Boehm, A. B. (2017). Biomonitoring of marine vertebrates in Monterey Bay using eDNA metabarcoding. PLoS One 12:e0176343. doi: 10.1371/journal.pone.0176343
Antognazza, C. M., Britton, R. J., Read, D. S., Goodall, T., Mantzouratou, A., De Santis, V., et al. (2021). Application of eDNA metabarcoding in a fragmented lowland river: spatial and methodological comparison of fish species composition. Environ. DNA 3, 458–471. doi: 10.1002/edn3.136
Banerjee, M., Mukherjee, J., and Ray, S. (2017). A review on reservoir system and its ecology in Indian perspective. Proc. Zool. Soc. 70, 5–20. doi: 10.1007/s12595-016-0165-z
Biggs, J., Ewald, N., Valentini, A., Gaboriaud, C., Dejean, T., Griffiths, R. A., et al. (2015). Using eDNA to develop a national citizen science-based monitoring programme for the great crested newt (Triturus cristatus). Biol. Conserv. 183, 19–28. doi: 10.1016/j.biocon.2014.11.029
Blabolil, P., Harper, L. R., Říčanová, Š., Sellers, G., Di Muri, C., Jùza, T., et al. (2021a). Environmental DNA metabarcoding uncovers environmental correlates of fish communities in spatially heterogeneous freshwater habitats. Ecol. Indic. 126:107698. doi: 10.1016/j.ecolind.2021.107698
Blabolil, P., Čech, M., Draštík, V., Holubová, M., Kočvara, L., Kubečka, J., et al. (2021b). Less is more–Basic quantitative indices for fish can be achieved with reduced gillnet sampling. Fish. Res. 240:105983. doi: 10.1016/j.fishres.2021.105983
Blabolil, P., Ricard, D., Peterka, J., Říha, M., Jůza, T., Vašek, M., et al. (2016). Predicting asp and pikeperch recruitment in a riverine reservoir. Fish. Res. 173, 45–52. doi: 10.1016/j.fishres.2015.08.003
Boivin-Delisle, D., Laporte, M., Burton, F., Dion, R., Normandeau, E., and Bernatchez, L. (2021). Using environmental DNA for biomonitoring of freshwater fish communities: comparison with established gillnet surveys in a boreal hydroelectric impoundment. Environ. DNA 3, 105–120. doi: 10.1002/edn3.135
Bylemans, J., Gleeson, D. M., Lintermans, M., Hardy, C. M., Beitzel, M., and Furlan, E. M. (2018). Monitoring riverine fish communities through eDNA metabarcoding: determining optimal sampling strategies along an altitudinal and biodiversity gradient. Metabarcoding Metagenom. 2:e30457. doi: 10.3897/mbmg.2.30457
Civade, R., Dejean, T., Valentini, A., Roset, N., Raymond, J. C., Bonin, A., et al. (2016). Spatial representativeness of environmental DNA metabarcoding signal for fish biodiversity assessment in a natural freshwater system. PLoS One 11:e0157366. doi: 10.1371/journal.pone.0157366
Crane, L. C., Goldstein, J. S., Thomas, D. W., Rexroth, K. S., and Watts, A. W. (2021). Effects of life stage on eDNA detection of the invasive European green crab (Carcinus maenas) in estuarine systems. Ecol. Indic. 124:107412.
Czeglédi, I., Sály, P., Specziár, A., Preiszner, B., Szalóky, Z., Maroda, Á, et al. (2021). Congruency between two traditional and eDNA-based sampling methods in characterising taxonomic and trait-based structure of fish communities and community-environment relationships in lentic environment. Ecol. Indic. 129:107952. doi: 10.1016/j.ecolind.2021.107952
Davy, C. M., Kidd, A. G., and Wilson, C. C. (2015). Development and validation of environmental DNA (eDNA) markers for detection of freshwater turtles. PLoS One 10:e0130965. doi: 10.1371/journal.pone.0130965
Deiner, K., Bik, H. M., Mächler, E., Seymour, M., Lacoursière-Roussel, A., Altermatt, F., et al. (2017). Environmental DNA metabarcoding: transforming how we survey animal and plant communities. Mol. Ecol. 26, 5872–5895. doi: 10.1111/mec.14350
Djurhuus, A., Closek, C. J., Kelly, R. P., Pitz, K. J., Michisaki, R. P., Starks, H. A., et al. (2020). Environmental DNA reveals seasonal shifts and potential interactions in a marine community. Nat. Commun. 11:254. doi: 10.1038/s41467-019-14105-1
Doi, H., Inui, R., Matsuoka, S., Akamatsu, Y., Goto, M., and Kono, T. (2019). Evaluation of biodiversity metrics through environmental DNA metabarcoding outperforms visual and capturing surveys. bioRxiv [Preprint] doi: 10.1101/617670
Dougherty, M. M., Larson, E. R., Renshaw, M. A., Gantz, C. A., Egan, S. P., Erickson, D. M., et al. (2016). Environmental DNA (eDNA) detects the invasive rusty crayfish Orconectes rusticus at low abundances. J. Appl. Ecol. 53, 722–732. doi: 10.1111/1365-2664.12621
Eggleton, M. A., Jackson, J. R., and Lubinski, B. J. (2010). Comparison of gears for sampling littoral-zone fishes in floodplain lakes of the Lower White River, Arkansas. N. Am. J. Fish. Manag. 30, 928–939. doi: 10.1577/M09-127.1
Epp, L. S., Boessenkool, S., Bellemain, E. P., Haile, J., Esposito, A., Riaz, T., et al. (2012). New environmental metabarcodes for analysing soil DNA: potential for studying past and present ecosystems. Mol. Ecol. 21, 1821–1833. doi: 10.1111/j.1365-294X.2012.05537.x
Erdozain, M., Thompson, D. G., Porter, T. M., Kidd, K. A., Kreutzweiser, D. P., Sibley, P. K., et al. (2019). Metabarcoding of storage ethanol vs. conventional morphometric identification in relation to the use of stream macroinvertebrates as ecological indicators in forest management. Ecol. Indic. 101, 173–184. doi: 10.1016/j.ecolind.2019.01.014
Eros, T., Specziar, A., and Bíro, P. (2009a). Assessing fish assemblages in reed habitats of a large shallow lake—a comparison between gillnetting and electric fishing. Fish. Res. 96, 70–76. doi: 10.1016/j.fishres.2008.09.009
Eros, T., Heino, J., Schmera, D., and Rask, M. (2009b). Characterizing functional trait diversity and trait-environment relationships in fish assemblages of boreal lakes. Freshw. Biol. 54, 1788–1803. doi: 10.1111/j.1365-2427.2009.02220.x
Evans, N. T., and Lamberti, G. A. (2018). Freshwater fisheries assessment using environmental DNA: a primer on the method, its potential, and shortcomings as a conservation tool. Fish. Res. 197, 60–66. doi: 10.1016/j.fishres.2017.09.013
Evans, N. T., Olds, B. P., Renshaw, M. A., Turner, C. R., Li, Y., Jerde, C. L., et al. (2016). Quantification of mesocosm fish and amphibian species diversity via environmental DNA metabarcoding. Mol. Ecol. Res. 16, 29–41. doi: 10.1111/1755-0998.12433
Evans, N. T., Shirey, P. D., Wieringa, J. G., Mahon, A. R., and Lamberti, G. A. (2017). Comparative cost and effort of fish distribution detection via environmental DNA analysis and electrofishing. Fisheries 42, 90–99. doi: 10.1080/03632415.2017.1276329
Evrard, O., Laceby, J. P., Ficetola, G. F., Gielly, L., Huon, S., Lefevre, I., et al. (2019). Environmental DNA provides information on sediment sources: a study in catchments affected by Fukushima radioactive fallout. Sci. Total Environ. 665, 873–881. doi: 10.1016/j.scitotenv.2019.02.191
Facey, D. E., and Grossman, G. D. (1990). The metabolic cost of maintaining position for four North American stream fishes: effects of season and velocity. Physiol. Zool. 63, 757–776. doi: 10.2307/30158175
Fischer, J. R., and Quist, M. C. (2014). Characterizing lentic freshwater fish assemblages using multiple sampling methods. Environ. Monit. Assess. 186, 4461–4474. doi: 10.1007/s10661-014-3711-z
Fuji, K., Doi, H., Matsuoka, S., Nagano, S., Sato, H., and Yamanaka, H. (2019). Environmental DNA metabarcoding for fish community analysis in backwater lakes: a comparison of capture methods. PLoS One 14:e0210357. doi: 10.1371/journal.pone.0210357
García-Machado, E., Laporte, M., Normandeau, E., Hernández, C., Côté, G., Paradis, Y., et al. (2021). Fish community shifts along a strong fluvial environmental gradient revealed by eDNA metabarcoding. Environ. DNA 4, 117–134. doi: 10.1002/edn3.221
Gehri, R. R., Larson, W. A., Gruenthal, K., Sard, N. M., and Shi, Y. (2021). eDNA metabarcoding outperforms traditional fisheries sampling and reveals fine-scale heterogeneity in a temperate freshwater lake. Environ. DNA 3, 912–929. doi: 10.1002/edn3.197
Goffaux, C., Sánchez-Dehesa, J., and Lambin, P. (2004). Comparison of the sound attenuation efficiency of locally resonant materials and elastic band-gap structures. Phys. Rev. B 70:184302. doi: 10.1103/PhysRevB.70.184302
Goutte, A., Molbert, N., Guérin, S., Richoux, R., and Rocher, V. (2020). Monitoring freshwater fish communities in large rivers using environmental DNA metabarcoding and a long-term electrofishing survey. J. Fish Biol. 97, 444–452. doi: 10.1111/jfb.14383
Grey, E. K., Bernatchez, L., Cassey, P., Deiner, K., Deveney, M., Howland, K. L., et al. (2018). Effects of sampling effort on biodiversity patterns estimated from environmental DNA metabarcoding surveys. Sci. Rep. 8:8843. doi: 10.1038/s41598-018-27048-2
Hallam, J., Clare, E. L., Jones, J. I., and Day, J. J. (2021). Biodiversity assessment across a dynamic riverine system: a comparison of eDNA metabarcoding versus traditional fish surveying methods. Environ. DNA 3, 1247–1266. doi: 10.1002/edn3.241
Hänfling, B., Lawson Handley, L., Read, D. S., Hahn, C., Li, J., Nichols, P., et al. (2016). Environmental DNA metabarcoding of lake fish communities reflects long-term data from established survey methods. Mol. Ecol. 25, 3101–3119. doi: 10.1111/mec.13660
Harper, L. R., Griffiths, N. P., Lawson Handley, L., Sayer, C. D., Read, D. S., Harper, K. J., et al. (2019). Development and application of environmental DNA surveillance for the threatened crucian carp (Carassius carassius). Freshw. Biol. 64, 93–107. doi: 10.1111/fwb.13197
Hayami, K., Sakata, M. K., Inagawa, T., Okitsu, J., Katano, I., Doi, H., et al. (2020). Effects of sampling seasons and locations on fish environmental DNA metabarcoding in dam reservoirs. Ecol. Evol. 10, 5354–5367. doi: 10.1002/ece3.6279
Hering, D., Borja, A., Jones, J. I., Pont, D., Boets, P., Bouchez, A., et al. (2018). Implementation options for DNA-based identification into ecological status assessment under the European Water Framework Directive. Water Res. 138, 192–205. doi: 10.1016/j.watres.2018.03.003
Huver, J. R., Koprivnikar, J., Johnson, P. T. J., and Whyard, S. (2015). Development and application of an eDNA method to detect and quantify a pathogenic parasite in aquatic ecosystems. Ecol. Appl. 25, 991–1002. doi: 10.1890/14-1530.1
Iknayan, K. J., Tingley, M. W., Furnas, B. J., and Beissinger, S. R. (2014). Detecting diversity: emerging methods to estimate species diversity. Trends Ecol. Evol. 29, 97–106. doi: 10.1016/j.tree.2013.10.012
Irz, P., Laurent, A., Messad, S., Pronier, O., and Argillier, C. (2002). Influence of site characteristics on fish community patterns in French reservoirs. Ecol. Freshw. Fish 11, 123–136. doi: 10.1034/j.1600-0633.2002.00004.x
Jurajda, P., Janáč, M., White, S. M., and Ondračková, M. (2009). Small–but not easy: evaluation of sampling methods in floodplain lakes including whole-lake sampling. Fish. Res. 96, 102–108. doi: 10.1016/j.fishres.2008.09.005
Knudsen, S. W., Ebert, R. B., Hesselsøe, M., Kuntke, F., Hassingboe, J., Mortensen, P. B., et al. (2019). Species-specific detection and quantification of environmental DNA from marine fishes in the Baltic Sea. J. Exp. Mar. Biol. Ecol. 510, 31–45. doi: 10.1016/j.jembe.2018.09.004
Kubečka, J., Hohausová, E., Matìna, J., Peterka, J., Amarasinghe, U. S., Bonar, S. A., et al. (2009). The true picture of a lake or reservoir fish stock: a review of needs and progress. Fish. Res. 96, 1–5. doi: 10.1016/j.fishres.2008.09.021
Lacoursière-Roussel, A., Rosabal, M., and Bernatchez, L. (2016). Estimating fish abundance and biomass from eDNA concentrations: variability among capture methods and environmental conditions. Mol. Ecol. Res. 16, 1401–1414. doi: 10.1111/1755-0998.12522
Lamb, P. D., Hunter, E., Pinnegar, J. K., Creer, S., Davies, R. G., and Taylor, M. I. (2019). How quantitative is metabarcoding: a meta-analytical approach. Mol. Ecol. 28, 420–430.
Laporte, M., Reny-Nolin, E., Chouinard, V., Hernandez, C., Normandeau, E., Bougas, B., et al. (2021). Proper environmental DNA metabarcoding data transformation reveals temporal stability of fish communities in a dendritic river system. Environ. DNA 3, 1007–1022. doi: 10.1002/edn3.224
Lawson Handley, L., Read, D. S., Winfield, I. J., Kimbell, H., Johnson, H., Li, J., et al. (2019). Temporal and spatial variation in distribution of fish environmental DNA in England’s largest lake. Environ. DNA 1, 26–39. doi: 10.1002/edn3.5
Lecaudey, L. A., Schletterer, M., Kuzovlev, V. V., Hahn, C., and Weiss, S. J. (2019). Fish diversity assessment in the headwaters of the Volga River using environmental DNA metabarcoding. Aquat. Conserv. 29, 1785–1800. doi: 10.1002/aqc.3163
Li, J., Hatton-Ellis, T. W., Handley, L. J. L., Kimbell, H. S., Benucci, M., Peirson, G., et al. (2019). Ground-truthing of a fish-based environmental DNA metabarcoding method for assessing the quality of lakes. J. Appl. Ecol. 56, 1232–1244. doi: 10.1111/1365-2664.13352
McElroy, M. E., Dressler, T. L., Titcomb, G. C., Wilson, E. A., Deiner, K., Dudley, T. L., et al. (2020). Calibrating environmental DNA metabarcoding to conventional surveys for measuring fish species richness. Front. Ecol. Evol. 8:276. doi: 10.3389/fevo.2020.00276
Merz, J. E., Anderson, J. T., Wiesenfeld, J., and Zeug, S. C. (2021). Comparison of three sampling methods for small-bodied fish in lentic nearshore and open water habitats. Environ. Monit. Assess. 193:255. doi: 10.1007/s10661-021-09027-9
Miranda, L. E., and Kratochvíl, M. (2008). Boat electrofishing relative to anode arrangement. Trans. Am. Fish. Soc. 137, 1358–1362. doi: 10.1577/T07-243.1
Mueller, M., Pander, J., Knott, J., and Geist, J. (2017). Comparison of nine different methods to assess fish communities in lentic flood-plain habitats. J. Fish. Biol. 91, 144–174. doi: 10.1111/jfb.2017.91.issue-110.1111/jfb.13333
Murienne, J., Cantera, I., Cerdan, A., Cilleros, K., Decotte, J. B., Dejean, T., et al. (2019). Aquatic eDNA for monitoring French Guiana biodiversity. Biodivers. Data J. 7:e37518. doi: 10.3897/BDJ.7.e37518
O’Donnell, J. L., Kelly, R. P., Shelton, A. O., Samhouri, J. F., Lowell, N. C., and Williams, G. D. (2017). Spatial distribution of environmental DNA in a nearshore marine habitat. PeerJ 5:e3044. doi: 10.7717/peerj.3044
Oksanen, J., Blanchet, F. G., Friendly, M., Kindt, R., Legendre, P., McGlinn, D., et al. (2019). vegan: Community Ecology Package. R package version 2.5-6.
Olds, B. P., Jerde, C. L., Renshaw, M. A., Li, Y., Evans, N. T., Turner, C. R., et al. (2016). Estimating species richness using environmental DNA. Ecol. Evol. 6, 4214–4226. doi: 10.1002/ece3.2186
Pawlowski, J., Apothéloz-Perret-Gentil, L., and Altermatt, F. (2020). Environmental DNA: what’s behind the term? Clarifying the terminology and recommendations for its future use in biomonitoring. Mol. Ecol. 29, 4258–4264. doi: 10.1111/mec.15643
Port, J. A., O’Donnell, J. L., Romero-Maraccini, O. C., Leary, P. R., Litvin, S. Y., Nickols, K. J., et al. (2016). Assessing vertebrate biodiversity in a kelp forest ecosystem using environmental DNA. Mol. Ecol. 25, 527–541. doi: 10.1111/mec.13481
Prchalová, M., Kubečka, J., Vašek, M., Peterka, J., Seïa, J., Jůza, T., et al. (2008). Patterns of fish distribution in a canyon-shaped reservoir. J. Fish. Biol. 73, 54–78. doi: 10.1111/j.1095-8649.2008.01906.x
Qu, C., and Stewart, K. A. (2019). Evaluating monitoring options for conservation: comparing traditional and environmental DNA tools for a critically endangered mammal. Sci. Nat. 106:9. doi: 10.1007/s00114-019-1605-1
R Core Team (2020). R: A Language and Environment for Statistical Computing. Vienna: R Foundation for Statistical Computing.
Revenga, C., Campbell, I., Abell, R., De Villiers, P., and Bryer, M. (2005). Prospects for monitoring freshwater ecosystems towards the 2010 targets. Philos. Trans. R. Soc. B Biol. Sci. 360, 397–413. doi: 10.1098/rstb.2004.1595
Riaz, T., Shehzad, W., Viari, A., Pompanon, F., Taberlet, P., and Coissac, P. (2011). ecoPrimers: inference of new DNA barcode markers from whole genome sequence analysis. Nucleic Acids Res. 39:e145. doi: 10.1093/nar/gkr732
Říha, M., Kubečka, J., Mrkvička, T., Prchalová, M., Čech, M., Draštík, V., et al. (2008). Dependence of beach seine net efficiency on net length and diel period. Aquat. Living Resour. 21, 411–418. doi: 10.1051/alr:2008061
Ritterbusch, D., Blabolil, P., Breine, J., Erős, T., Mehner, T., Olin, M., et al. (2022). European fish-based assessment reveals high diversity of systems for determining ecological status of lakes. Sci. Total Environ. 802:149620. doi: 10.1016/j.scitotenv.2021.149620
Rodriguez-Ezpeleta, N., Morissette, O., Bean, C., Manu, S., Banerjee, P., Lacoursiere, A., et al. (2021). Trade-offs between reducing complex terminology and producing accurate interpretations from environmental DNA: comment on “Environmental DNA: what’s behind the term?” by Pawlowski et al. (2020). Mol. Ecol. 30, 4601–4605. doi: 10.22541/au.160783291.14092604/v1
Sard, N. M., Herbst, S. J., Nathan, L., Uhrig, G., Kanefsky, J., Robinson, J. D., et al. (2019). Comparison of fish detections, community diversity, and relative abundance using environmental DNA metabarcoding and traditional gears. Environ. DNA 1, 368–384. doi: 10.1002/edn3.38
Sellers, G. S., Di Muri, C., Gomez, A., and Hanfling, B. (2018). Mu-DNA: a modular universal DNA extraction method adaptable for a wide range of sample types. Metabarcoding Metagenom. 2:e24556. doi: 10.17605/OSF.IO/VRB4A
Seymour, M., Edwards, F. K., Cosby, B. J., Kelly, M. G., de Bruyn, M., Carvalho, G. R., et al. (2020). Executing multi-taxa eDNA ecological assessment via traditional metrics and interactive networks. Sci. Total Environ. 729:138801. doi: 10.1016/j.scitotenv.2020.138801
Shaw, J. L. A., Clarke, L. J., Wedderburn, S. D., Barnes, T. C., Weyrich, L. S., and Cooper, A. (2016). Comparison of environmental DNA metabarcoding and conventional fish survey methods in a river system. Biol. Conserv. 197, 131–138. doi: 10.1016/j.biocon.2016.03.010
Sigsgaard, E. E., Carl, H., Mřller, P. R., and Thomsen, P. F. (2015). Monitoring the near-extinct European weather loach in Denmark based on environmental DNA from water samples. Biol. Conserv. 183, 46–52.
Smart, A. S., Weeks, A. R., van Rooyen, A. R., Moore, A., McCarthy, M. A., and Tingley, R. (2016). Assessing the cost-efficiency of environmental DNA sampling. Methods Ecol. Evol. 7, 1291–1298. doi: 10.1111/2041-210X.12598
Šmejkal, M., Ricard, D., Prchalová, M., Říha, M., Muška, M., Blabolil, P., et al. (2015). Biomass and abundance biases in European standard gillnet sampling. PLoS One 10:e0122437. doi: 10.1371/journal.pone.0122437
Straškraba, M. (2005). “Reservoirs and other artificial water bodies,” in The Lakes Handbook: Lake Restoration and Rehabilitation, Vol. 2, eds P. OSullivan and C. Reynolds (Osney Mead: Blackwell Science), 300–328.
Sutela, T., Rask, M., Vehanen, T., and Westermark, A. (2008). Comparison of electrofishing and NORDIC gillnets for sampling littoral fish in boreal lakes. Lakes Res. 13, 215–220. doi: 10.1111/j.1440-1770.2008.00372.x
Takahara, T., Minamoto, T., Yamanaka, H., Doi, H., and Kawabata, Z. I. (2012). Estimation of fish biomass using environmental DNA. PLoS One 7:e35868. doi: 10.1371/journal.pone.0035868
Thomsen, P. F., Mřller, P. R., Sigsgaard, E. E., Knudsen, S. W., Jřrgensen, O. A., and Willerslev, E. (2016). Environmental DNA from seawater samples correlate with trawl catches of subarctic, deepwater fishes. PLoS One 11:e0165252. doi: 10.1371/journal.pone.0165252
Thomsen, P. F., and Willerslev, E. (2015). Environmental DNA – an emerging tool in conservation for monitoring past and present biodiversity. Biol. Conserv. 183, 4–18.
Valentini, A., Taberlet, P., Miaud, C., Civade, R., Herder, J., Thomsen, P. F., et al. (2016). Next-generation monitoring of aquatic biodiversity using environmental DNA metabarcoding. Mol. Ecol. 25, 929–942. doi: 10.1111/mec.13428
Wilcox, T. M., McKelvey, K. S., Young, M. K., Sepulveda, A. J., Shepard, B. B., Jane, S. F., et al. (2016). Understanding environmental DNA detection probabilities: a case study using a stream-dwelling char Salvelinus fontinalis. Biol. Conserv. 194, 209–216. doi: 10.1016/j.biocon.2015.12.023
Yamamoto, S., Masuda, R., Sato, Y., Sado, T., Araki, H., Kondoh, M., et al. (2017). Environmental DNA metabarcoding reveals local fish communities in a species-rich coastal sea. Sci. Rep. 7:40368. doi: 10.1038/srep40368
Yamanaka, H., and Minamoto, T. (2016). The use of environmental DNA of fishes as an efficient method of determining habitat connectivity. Ecol. Indic. 62, 147–153. doi: 10.1016/j.ecolind.2015.11.022
Yates, M. C., Fraser, D. J., and Derry, A. M. (2019). Meta-analysis supports further refinement of eDNA for monitoring aquatic species-specific abundance in nature. Environ. DNA 1, 5–13.
Zhang, K., Wang, X. M., Wu, W., Wang, Z. H., and Huang, S. (2002). Advances in conservation biology of Chinese giant salamander. Biodivers. Sci. 10, 291–297. doi: 10.17520/biods.2002040
Keywords: biomonitoring, environmental DNA, reservoir, sampling method, species detection
Citation: Golpour A, Šmejkal M, Čech M, dos Santos RA, Souza AT, Jůza T, Martínez C, Bartoň D, Vašek M, Draštík V, Kolařík T, Kočvara L, Říha M, Peterka J and Blabolil P (2022) Similarities and Differences in Fish Community Composition Accessed by Electrofishing, Gill Netting, Seining, Trawling, and Water eDNA Metabarcoding in Temperate Reservoirs. Front. Ecol. Evol. 10:913279. doi: 10.3389/fevo.2022.913279
Received: 05 April 2022; Accepted: 02 June 2022;
Published: 01 July 2022.
Edited by:
Xiaodong Qu, China Institute of Water Resources and Hydropower Research, ChinaReviewed by:
Jon Thomassen Hestetun, Norwegian Research Institute (NORCE), NorwayShaowen Ye, Institute of Hydrobiology (CAS), China
Copyright © 2022 Golpour, Šmejkal, Čech, dos Santos, Souza, Jůza, Martínez, Bartoň, Vašek, Draštík, Kolařík, Kočvara, Říha, Peterka and Blabolil. This is an open-access article distributed under the terms of the Creative Commons Attribution License (CC BY). The use, distribution or reproduction in other forums is permitted, provided the original author(s) and the copyright owner(s) are credited and that the original publication in this journal is cited, in accordance with accepted academic practice. No use, distribution or reproduction is permitted which does not comply with these terms.
*Correspondence: Amin Golpour, YW1pbi5nb2xwb3VyQGdtYWlsLmNvbQ==; YW1pbi5nb2xwb3VyQGhidS5jYXMuY3o=