 Debin Sun1,2,3,4†
 Yunzhao Li1,2†
 Junbao Yu1,2*
 Baoquan Li3*
 Bo Guan1,2
 Di Zhou1,2Xuehong Wang1,2Jisong Yang1,2
 Yuanqing Ma5Xin Zhang1,2Xue Li1,2Yue Ling1,2Yuhan Zou1,2Shaoning Jia1,2Fa Shen1,2
- 1Key Laboratory of Ecological Restoration and Conservation of Coastal Wetlands in Universities of Shandong (Ludong University), Yantai, China
- 2The Institute for Advanced Study of Coastal Ecology, Ludong University, Yantai, China
- 3Yantai Institute of Coastal Zone Research, Chinese Academy of Sciences, Yantai, China
- 4University of Chinese Academy of Sciences, Beijing, China
- 5Shandong Marine Resources and Environment Research Institute, Yantai, China
The soils from four typical natural wetlands, namely, Phragmites australis, Tamarix chinensis, Suaeda salsa, and tidal flat, as well as reclaimed wetland, were selected to evaluate the soil quality in the Yellow River Delta. Fourteen soil physicochemical property indexes were employed to build a minimum data set (MDS). Combined with vegetation type and soil depth, the soil quality index (SQI) was conducted. A fuzzy logic model was applied for data normalization. The contrast test was conducted to verify the accuracy of the MDS. The results showed that the MDS consists of TOC, NO-N, soil salinity, TS, TP, Mg, C/N and pH. The soil quality decreased from the inland to the coastline and from reclaimed wetland to tidal flat with the change of vegetation type. The soil quality of 0–10 cm soil depth was better than that of 20–30 cm soil depth. The soil qualities of reclaimed land were significantly better than those of natural wetlands at the same soil depth. Correlation analysis results showed that agricultural reclamation has become an important factor of soil quality change in the study area. Comparative results of two methods of MDS and the total data set (TDS) testified that the method of MDS was credible and accurate for soil quality assessment of the study area. Our results indicated that wetland protection and agricultural reclamation in coastal areas should keep a rational balance.
Introduction
As a natural ecotone between the marine ecosystem and the terrestrial ecosystem, the coastal wetland is a vulnerable ecosystem with various ecological functions (Yu et al., 2016). As the dominant substrate in coastal wetland ecosystems, soil plays an important role in plant growth and system stability (Zhang et al., 2013; Huang and Yuan, 2021). Soil quality, which is sensitive to the dynamic change of soil condition and soil management, can be used as a comprehensive index to evaluate soil function (Chaer et al., 2009; Adebo et al., 2020; Raiesi and Beheshti, 2022). To assess the effects of heavy metals on water and soil, the concept of soil quality was first put forward in the 1970's (Sultana et al., 1970; Peters, 1973). Since then, the connotation of soil quality has been continuously enriched (Shokr et al., 2021). Currently, due to the concept covering a range of synthetical aspects, a widely accepted definition has not been established. According to the existing standpoints, three main elements for soil quality include the abilities of maintaining ecosystem productivity, sustaining environmental quality, and promoting biotic health (Wander et al., 2002; Abdel-Fattah et al., 2021; Mazzon et al., 2021; Rathore et al., 2022). Soil quality assessment is a decision-making method for quantitative reflection of soil quality by selecting suitable evaluation indexes in a certain area (Chen et al., 2021; Yuan et al., 2022).
The accuracy of soil quality assessment is decided by the method and index selection (Armenise et al., 2013; Wang et al., 2018). A number of methods, such as soil quality index (SQI) (Granatstein and Bezdicek, 1992; Andrews et al., 2002, 2003), dynamic soil quality models (Karlen et al., 2003; Nyeck et al., 2018; Fathizad et al., 2020), soil quality cards and test kits (Purakayastha et al., 2019; Kasno, 2021), soil management assessment framework (Cherubin et al., 2017; Jimenez et al., 2022), and fuzzy association rules (Burrough, 1989; Burrough et al., 1992; Wu et al., 2019), have been applied to assess soil quality in various ecosystems of the cropland, forest, grassland, and wetland, etc. SQI has been widely used in numerous ecosystems due to its simplicity, flexibility, and applicability (Andrews et al., 2002; Wang et al., 2018). The SQI includes three essential steps: (1) selecting appropriate indexes to establish datasets; (2) normalizing the index data; and (3) combining index scores to produce the comprehensive SQI (Chaer et al., 2009; Zhang et al., 2016; Wang et al., 2018). Normally, in order to make the assessment results more comprehensive and accurate, a dataset needs to contain abundant indexes, leading to a lot of redundant information being contained in the total data set (TDS) (Wu et al., 2019; Shao et al., 2020). Therefore, the Minimum Data Set (MDS) needs to be established (Raiesi, 2017; Jiang et al., 2020; Guo et al., 2021). The MDS contains a series of representative indexes which are screened from TDS. The MDS is considered a set of sensitive and comprehensive methods to remove redundancy with less information loss (Wang et al., 2018). Several studies showed that the assessment-based MDS was better than TDS in cropland, forest, grassland, and coastal areas (Rahmanipour et al., 2014; Volchko et al., 2014; Wu et al., 2019). The methods of multiple linear regression, factor analysis, discriminant analysis, and scoring functions are employed for index screening (Rezaei et al., 2006; Yao et al., 2013). Factor analysis has been widely used in MDS as the method that can efficiently reduce redundant information (Raiesi, 2017; Shao et al., 2020).
The Yellow River Delta wetland is one of the largest nascent coastal wetland ecosystems in the world (Yu et al., 2016). Due to the serious erosion of soil and water in the middle reaches of the Yellow River, a mass of sediment is carried to the estuary from the Loess Plateau. The typical coastal wetlands in deltas along the Pacific Coast are formed by sediment accumulation over years (Yu et al., 2015; Ji et al., 2022). Phragmites australis, Tamarix chinensis, and Suaeda salsa are dominant vegetation types in the natural wetland of the Yellow River Delta (Jiao et al., 2014). The tidal flat is widely distributed with low vegetation coverage. Most communities are dominated by one plant species with few concomitant species. The natural wetlands with a simple structure, such as Phragmites australis, Tamarix chinensis, Suaeda salsa, and tidal flat, which is the main body of shrub wetland, herbaceous wetland, salt marsh, and tidal flat wetland, are formed (Jiao et al., 2014; Chi et al., 2020). Influenced by land-sea-river interaction, all types of natural wetlands are distributed with a zonal sequence from land to sea (Cao et al., 2015). In addition, a large area of cropland which is reclaimed from natural wetlands over years covers this region (Yu et al., 2016). Due to the biological characteristics of saline-alkali-tolerant, Gossypium spp. has been widely planted and has become the dominant crop type. The wetland reclamation could alter vegetation type and soil physicochemical properties dramatically (Jiao et al., 2019). Therefore, the spatial heterogeneity of soil conditions in the Yellow River Delta wetland is influenced by natural and human factors such as hydrological processes, vegetation types, and land reclamation, which lead to a soil quality with high complexity. At present, only a few references related to the soil quality in the Yellow River Delta are found. Zhang et al. (2016) evaluated the effects of flooding conditions and seasonal variations on soil quality in natural wetlands in five selected natural wetland types over three seasons (Zhang et al., 2016). The results showed that soil salinity might be a characteristic indicator of soil quality assessment in coastal regions. Xia et al. (2019) studied the relationship between soil quality and forest-grass composite patterns in this region using the membership function method (Xia et al., 2019). Wu et al. (2019) found that the soil quality was higher in inland areas than in coastal areas by evaluating the soil quality of the crop land (Wu et al., 2019). Employing the method of SQI, Zhao et al. (2019) assessed the effects of freshwater inputs on soil quality in natural wetlands (Zhao et al., 2019). Yang et al. (2021) used principal component analysis to evaluate the effects of different Tamarix chinensis-grass patterns on the soil quality of coastal saline soil and found that certain community patterns could significantly decrease the salt contents and increase the available nutrient contents in the coastal saline-alkali soil (Yang et al., 2021).
Several problems related to soil quality in the study region still remain. Due to sampling sites and limited participating assessment indexes, the assessment results were insufficient to reflect upon the distribution law and overall situation of regional soil quality. There was no comparative study under a unified assessment framework for the SQI of current studies confined to natural wetlands or cropland. The impact of wetland reclamation on soil quality in this region is not clear. Therefore, the present study assessed the soil qualities under different vegetation types of the natural wetland and reclaimed wetland in the Yellow River Delta applying the MDS based on 14 soil property indexes. The purposes of the study were to (1) reveal the spatial distribution characteristics of the soil quality in the Yellow River Delta, (2) clarify the function of wetland reclamation on soil quality change in a coastal wetland, and (3) verify the suitability of an MDS on coastal wetland soil quality assessment. The result could provide a scientific reference for maintaining the ecological balance of wetland protection and agricultural reclamation in coastal areas.
Materials and methods
Study area
The study was conducted in the Yellow River Delta (37°34′-38°09′N, 118°31′-119°18′E) (Figure 1). The study area has a warm-temperate and continental monsoon climate with distinct seasons. The average annual temperature, precipitation, and evaporation are 12.8°C, 537.3 mm, and 1,928.2 mm, respectively (He and Cui, 2015). The precipitation mainly concentrates in summer and autumn. The main water supplement is atmospheric precipitation, river, and tidal water. Due to the interactive effects of land-sea-river, the soil conditions are complex and changeable. Affected by tidal action and soil evapotranspiration, Phragmites australis wetland (Pa), Tamarix chinensis wetland (Tc), Suaeda salsa wetland (Ss), and tidal flat wetland (Td) showed a regular ribbon distribution from land to sea along different degrees of soil salinity (Figure 1). Reclaimed wetlands (Cp), mainly distributed in the interior region of deltas which are far from the sea, are mostly reclaimed from natural wetlands.
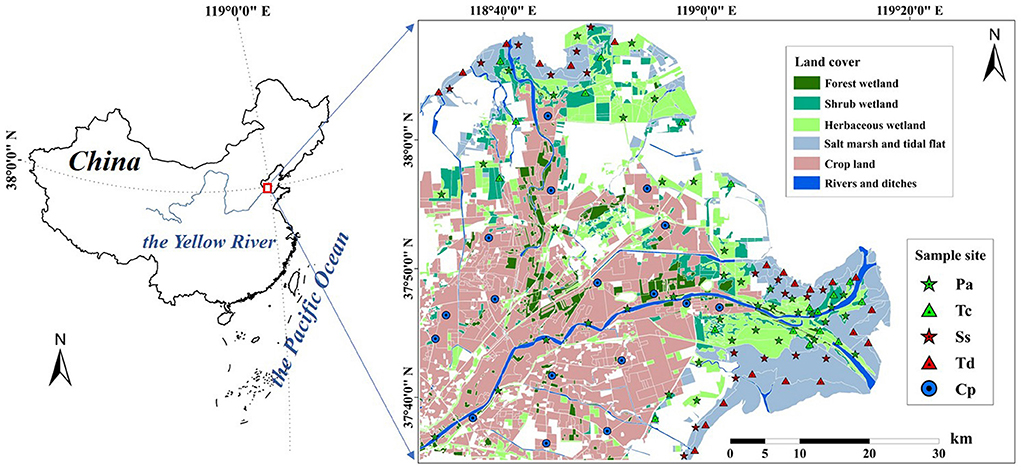
Figure 1. Map of study area and sample sites.
Sample collection and analysis
The Landsat Thematic Mapper (TM) of 2018 digital images (spatial resolution of 30 ×30 m) were used to interpret the land use and land cover in the study area. The land use classification map of the Yellow River Delta was produced after calibration by the field investigation. According to the grid distribution point method, the sampling points were set up in four selected natural wetlands, of Phragmites australis wetland (Pa) (40 sites), Tamarix chinensis wetland (Tc) (18 sites), Suaeda salsa wetland (Ss) (19 sites) and tidal flat wetland (Td) (21 sites), as well as reclaimed wetland (Cp) (20 sites), in mid-August 2019. A total of 118 soil sampling sites were implemented with three parallel treatments at each site (Figure 1). Soil samples of 0–10, 10–20, and 20–30 cm in depth were collected from bottom to top in soil profiles by a core sampler. Three duplicate soil samples were collected and mixed homogeneity in situ after removing plant residues, roots, and debris. The samples were air dried after removing plant debris and stones. The air-dried soil samples were sieved with a 0.149-mm diameter nylon sieve after grinding using a mortar to determine soil properties.
Soil total organic carbon (TOC) was determined by TOC Analyzer (vario TOC cube, Elementar, Germany) after inorganic carbon was eliminated using 1M HCl. Soil total nitrogen (TN) and total phosphorus (TP) were determined by a continuous flow analyzer (Futura A16786, Alliance, France) after digestion and filtration. Soil total sulfur (TS) was measured using the barium sulfate turbidimetric method. Soil total (TK), Na, and Mg were determined by atomic absorption spectrometer (iCE 3300 AAS, Thermo, America) after digestion and filtration. Soil NH-N and NO-N in supernatant liquor, which were filtrated by a 0.45-μm membrane, were determined by a continuous flow analyzer after extraction with 2 M KCl from sieved dry soil samples. Soil pH (water: soil = 2.5:1) and electrical conductivity (EC) (water: soil = 5:1) were determined by a pH meter (FE28-Standard, Mettler Toledo, Switzerland) and an electrical conductivity meter (FE38, Mettler Toledo, Switzerland), respectively. The stoichiometric ratios of C/N, C/P, and N/P were calculated as the ratio of the amount of TOC to TN, TN to TP, and TN to TP, respectively.
Assessment of soil quality index
To calculate the SQI which can represent the comprehensive characteristics of soil quality, the Minimum Data Set (MDS) was screened by the principal component analysis (PCA) of the total data set (TDS). The MDS was screened following these five steps. (1) The results of correlations between different soil property indexes and coefficient of variation (CV) incorporated determine the necessity to screen indexes from TDS. (2) The PCA was used to screen indexes for MDS. Only the components with eigenvalues ≥1 were retained. The soil property indexes with loading ≥0.5 in each component were divided into one group. (3) The vector norm value (Equation 1) was employed to reflect the influence degree of internal factors (i.e., 14 soil properties) on soil quality. A large norm value indicates that the index has a large comprehensive load on all principal components. (4) The improvement methods by Pulido et al. (2017) and Wu et al. (2019) were referenced to select the external factors. The soils under different vegetation types (i.e., Pa, Tc, Ss, Td, and Cp) and soil depth (i.e., 0–10 cm, 10–20 cm, and 20–30 cm) were selected as external factors in the study. Multivariate analysis and normal linear transformation were used to reflect the influence degree of soil type and soil depth on soil quality. The accumulated values of internal and external factors were used to screen indexes of MDS. (5) The soil properties with the highest accumulated value were screened for preliminary indexes in each group. Soil properties within 90% of the highest value were also selected. If the correlation value of any two preliminary indexes were higher than 0.5 in one group, the indicator with a higher value was screened for MDS (Zhang et al., 2016). The weighting of each index was the proportion of its accumulated value to the sum of total values in MDS.
where Nik is the comprehensive loading of soil property i in the first k principal components with eigenvalues≥1, λk is the eigenvalue of PCk, and Uik is the variable loading of soil property. Nik of the indexes within 10% of the highest norm values was selected for the MDS.
The indexes of MDS were normalized by fuzzy set methodology to determine the membership degree. Fuzzy function with a bell-shaped curve was used to calculate the memberships of different indexes (Burrough, 1989; Burrough et al., 1992). The method produced contiguous value distribution of membership value and rejected low information during the analysis process, which was much better than linear transformation for membership calculation (Yang et al., 2021). Three steps were operated in this method. (1) The suitable range of each index in MDS was selected. In order to make an analysis normalization, the 5–95% interval of the normal distribution as the threshold value of each index was used in this study. (2) The bell-shaped curve was employed as the fuzzy logic membership function because the nutrient contents and soil salinity were the predominant soil property indexes in the study (Equation 2). (3) The fuzzy logic model was established after the coefficients b and d of Equation 2 were calculated by the suitable range of each index. If the index value is within the suitable range, the membership value could be determined by Equation 2. Otherwise, it could be chosen 0 or 1 based on the effect of the index. Finally, the membership value and weighting of each index were combined to generate the comprehensive soil quality index (SQI) of each sample using Equation 3.
where MFxi is the individual membership value for ith soil index of x (0≤MFxi≤1), d is the width of the transition zone, which is the difference between the index values where the membership values range from 0.5 to 1, and b is the value of soil index at the ideal point or standard index where the membership value is 1.
where SQI is the joint membership for all indexes within MDS of x (i.e., the comprehensive soil quality index), Wi is the weighting of ith soil index in MDS, MFxi is the individual membership value for ith soil index of x, and n is the number of the index in MDS.
Data analysis
IBM SPSS 24.0 was used for data analysis. The data satisfied the homogeneity of variance and normal distribution assumptions by Shapiro-Wilk's and Levene's tests (p > 0.05). The mean value, standard deviation (SD), and CV of each soil property were calculated, respectively. The differences were tested by a one-way analysis of variance (one-way ANOVA) with LSD (p < 0.05) and linear mixed effects models (p < 0.05). Pearson correlation analysis was performed to reveal the relationships among soil indexes. The significant effects of vegetation type and soil depth on soil properties were assessed by multifactor analysis of variance (multi-way-ANOVA). ArcGIS 10.8 was used to test normal distribution, reject abnormal values, select interpolation method, analyze trend effect, and map spatial distribution. All datasets were projected to WGS84-based Transverse Mercator orthographic projection coordinate system. Space interpolation analyses of SQI were conducted by the Empirical Bayes Kriging method (EBK). The spatial distribution of the rivers, salt pan, culture pond, residence zone, industrial, and mining district were eliminated from interpolation ultimately. Origin 9.8 software was used to draw.
Results
Statistical analysis of soil properties
The averaged contents of soil TOC, TN, TP, TS, TK, Mg, NH-N, and NO-N were 3.94, 0.36, 0.58, 0.86, 20.96, 13.54, 8.00, and 6.02 mg·kg−1 in study area, respectively (Supplementary Table 1). The averaged values of C/N, C/P, and N/P were 12.85, 17.29, and 1.37 by the substance amount. In order to adequately analyze the soil quality of saline-alkali soil, the soil Na, soil salinity (Sa), and pH were selected as characteristic indexes in the study. The mean values of soil Na, Sa, and pH in the study area were 16.97 g·kg−1, 5.82‰, and 8.33. The CV values of NO-N (198.17%), NH-N (77.44%), Sa (60.26%), TN (56.10%), TOC (56.46%), N/P (50.51%), and C/P (51.90%) were higher than 50%, illustrating that these soil indexes have strong spatial variability. Except for TK and pH, the other indexes showed moderate or above moderate variability (CV >10%).
MDS establishment and normalization
The considerably significant correlations (p < 0.01) were observed among 68.13% of soil indexes in TDS by Pearson analysis (Table 1). Therefore, the redundancy existing in TDS and an MDS should be established.
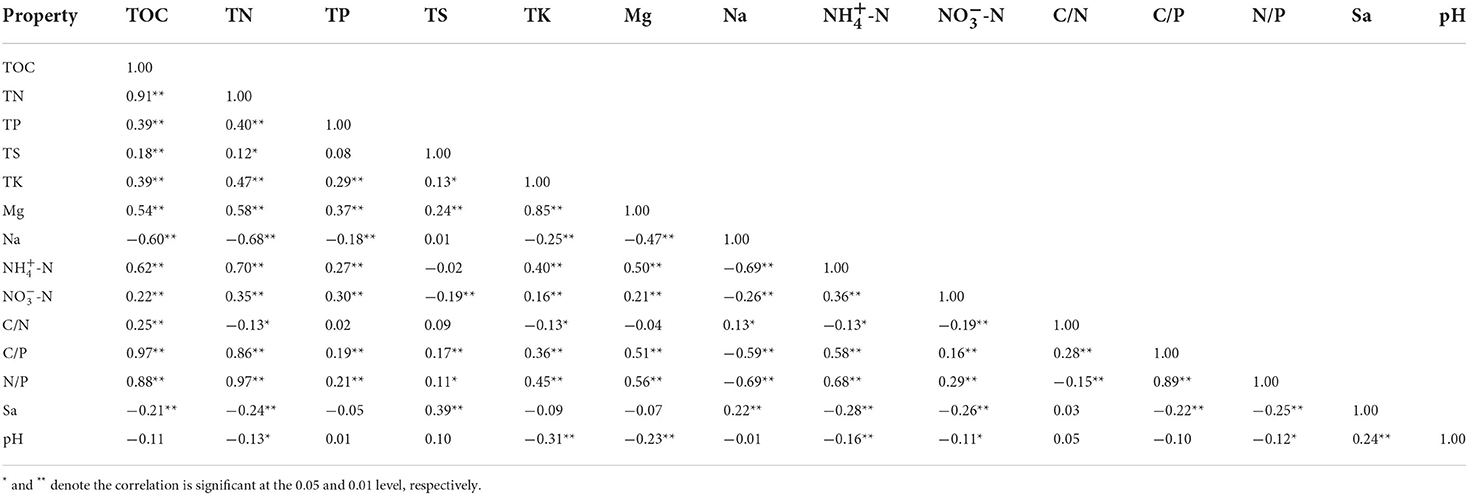
Table 1. Pearson analysis of soil properties.
The cumulative variance of the first five components reached 80.70% (Supplementary Table 2), indicating that the first five components could represent the principal characteristics of total data. The communalities for soil properties showed that the first five components could explain more than 90% of the variance of TOC, TN, C/N, C/P, and N/P and more than 80% of TP, TK, and Mg, which indicates that the most variances of soil properties could be explained by principal components (Table 2).
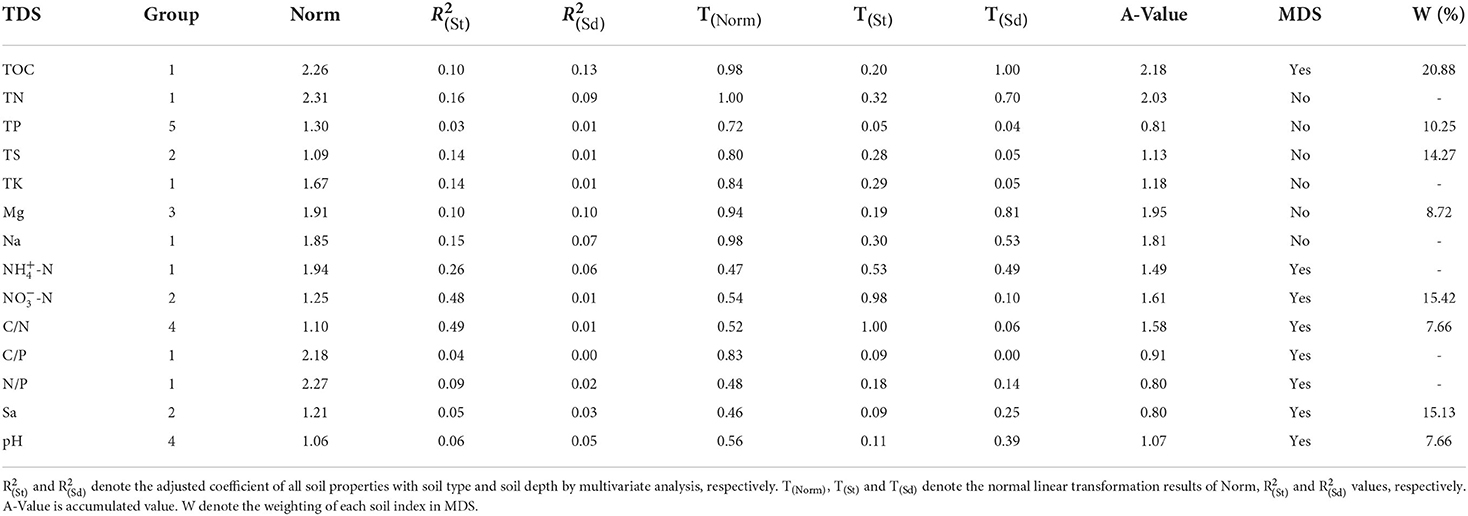
Table 2. The weighting of each soil index in MDS.
Based on the screening regulations for MDS establishment (The soil properties with loadings ≥0.5 in each component were divided into one group. If the loading of one soil property ≥0.5 was observed in more than one component, that should be divided into one group in which the correlation of soil properties was relatively low), five groups were established (Table 2): TOC, TN, TK, Na, NH-N, C/P, and N/P were in group 1, TS, NO-N, and Sa in group 2, Mg in group 3, C/N and pH in group 4, and TP in group 5.
According to Equation 1, the norm value of each index was calculated (Table 2). The adjusted coefficients of all soil properties with soil type () and soil depth () were calculated by multivariate analysis. Then, the norm value, and of each soil property were transformed by normal transformation. At last, the MDS was established using accumulated values and the Pearson analysis results (Table 1). The six indexes including TOC, TS, NO-N, Sa, Mg, C/N, pH, and TP were grouped in MDS ultimately (Table 2).
Indexes related to soil nutrient elements (i.e., TOC, TS, NO-N, Mg, C/N, and TP) were considered as “more is better” so that the asymmetric left variant of the bell-shaped curve was employed, while the Sa and pH were considered as “less is better” due to the characteristics of barren saline-alkali soil in the study area so that the asymmetric right variant was employed. The coefficients b and d were determined in Table 3. When the index value is within the suitable range, the membership value could be determined by Equation 2, and without the range, the membership value could choose 0 or 1 based on the effect of the index (Table 3). The membership values of each index were calculated ultimately.
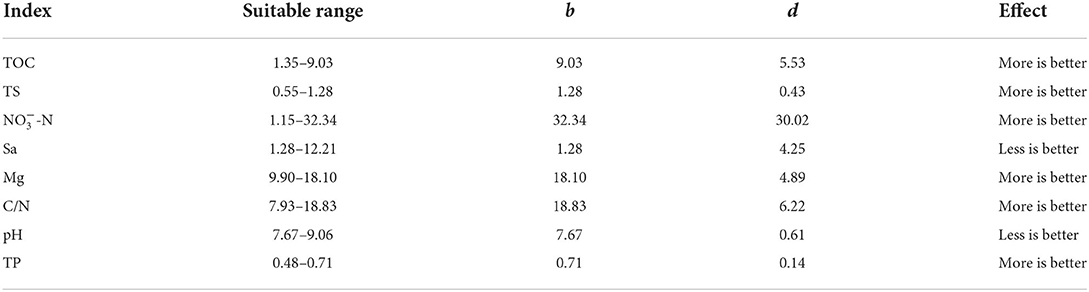
Table 3. The optimal ranges of MDS indexes.
Weighting assessment and soil quality calculation
The weighting of each index was the proportion of its accumulated value to the sum of total values in MDS. The weighting assessment results showed that TOC accounted for the highest weight of 20.88% in the group of “more is better” and that Sa accounted for the highest weight of 15.13% in the group of “less is better” (Tables 2, 3).
According to Equation 3, the mean SQI values of the Yellow River Delta under different vegetation types varied from 0.42 (Ss, 20–30 cm) to 0.70 (Cp, 0–10 cm) (Figure 2A). The mean SQI values in natural wetlands followed the order of Pa (0.56) > Tc (0.52) > Ss (0.47) and Td (0.47). The SQI value of reclaimed wetland (0.64) was considerably higher than that of natural wetlands (p < 0.05). The SQI values in soil profiles showed a decreasing trend with a soil depth increase. The SQI value of 0–10 cm soil layer of all the vegetation types but Tc were significantly higher than those in 20–30 cm soil layer (p < 0.05).
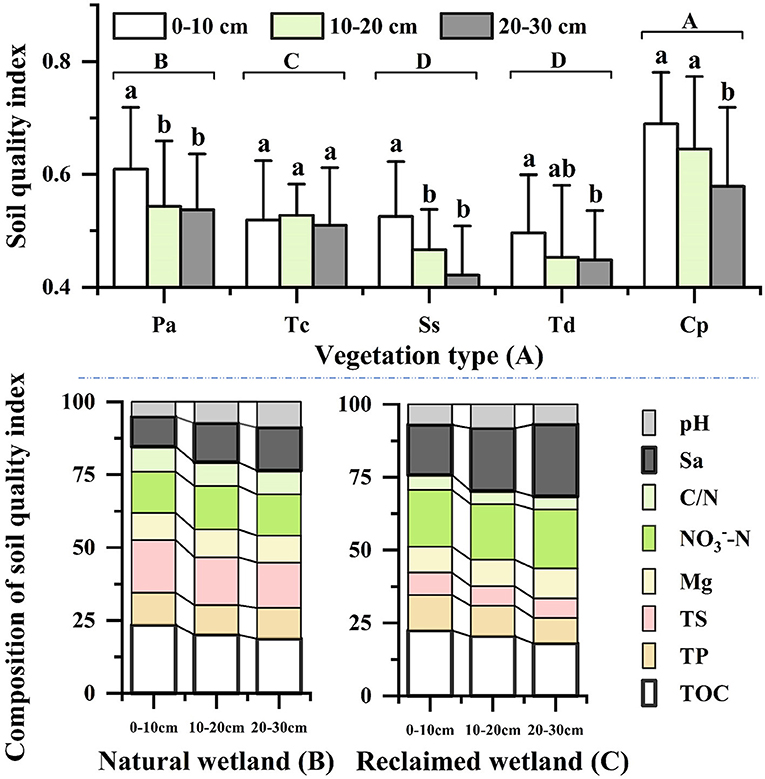
Figure 2. The SQI values in soil profiles under different vegetation types (A) and the composition of SQI in natural wetland (B) and reclaimed wetland (C). The vertical bar is standard deviation; different lower letter denotes the significant differences among soil depth for the same vegetation type (p < 0.05); different upper letter denotes the significant differences among vegetation types in 0–30 cm (p < 0.05).
The influence degree of each index for SQI changed with vegetation type by the analysis of contribution rate (Figures 2B,C). In the study area, the greatest positive contribution of SQI was TOC, followed TS and NO-N. The contribution proportion of TOC was stable (about 20%) among different vegetation types. The proportion of TS in natural wetlands (11–22%) was more than the proportion in the reclaimed wetlands (7%). The NO-N proportion in natural wetlands (13–15%) was lower than the proportion in the reclaimed wetlands (20%). The contribution proportion of TP, Mg, and C/N was relatively low, and there was little difference among different vegetation types except for C/N. The contribution proportion of C/N in natural wetlands was about 1.4–1.8 times that of reclaimed wetlands. The negative effect was mainly mediated by Sa. The tendency of Sa contribution followed Pa (20%) > Tc (12%) > Ss (9%) and Td (9%) in natural wetlands, and the proportion of reclaimed wetlands (21%) was higher than those of natural wetlands. The contribution of TOC decreased with the increase of soil depth, while the changing trend of Sa was the opposite.
The multi-way-ANOVA results showed that SQI was significantly correlated with vegetation type (p < 0.05) and soil depth (p < 0.05) (Supplementary Table 3). A significantly positive correlation was observed between SQI and soil nutrient elements in a 0–30-cm soil layer of natural wetlands (p < 0.05) and reclaimed wetlands (p < 0.05, Table 4). A significant negative correlation between SQI with soil Sa and pH was observed in a 0–30-cm soil layer of natural wetlands (p < 0.05), but this significant correlation was not observed in the reclaimed wetlands (p > 0.05).

Table 4. Pearson relations of SQI with the soil indexes in MDS.
The spatial distribution of SQI
The SQI values of 0–10 cm and 10–20 cm soil layer increased and distributed in a ribbon shape from coastline to inland, while the spatial change gradient of SQI values in a 20–30-cm soil layer was not obvious (Figures 3A–C). The linear fitting analysis results of SQI and the logarithmic function of the distance on vertical distance from the coastline in each sampling point showed that SQI increased with the increase of distance to the coastline (Figures 3A–C). The slope of fitting equation followed the order of 0–10 cm (0.07) > 10–20 cm (0.06) > 20–30 cm (0.05), indicating the spatial heterogeneity of soil quality in horizontal direction decreased with soil depth in 0–30 cm.
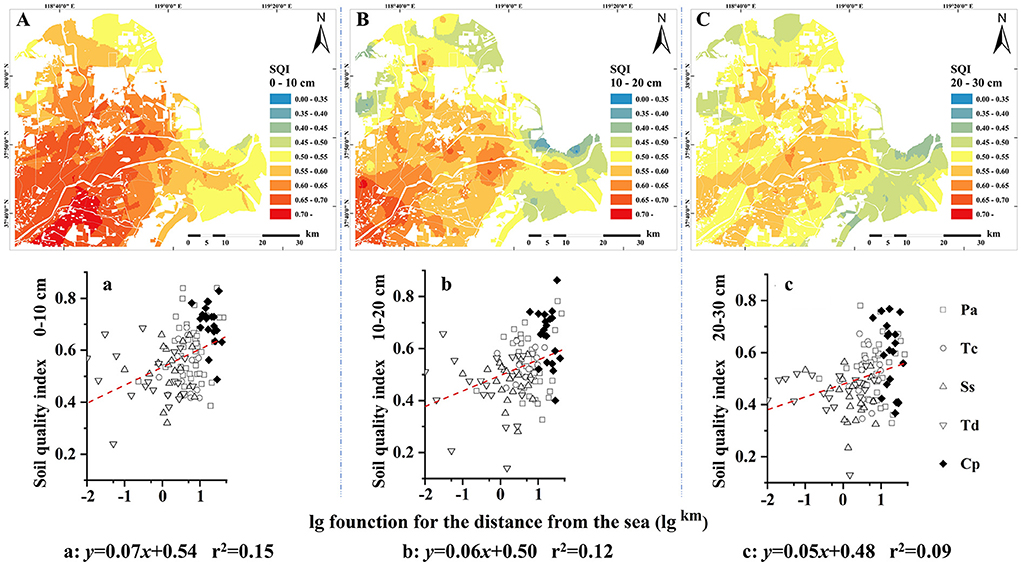
Figure 3. The spatial distribution of SQI in soil profiles of 0–10 cm (A), 10–20 cm (B) and 20–30 cm (C) in the Yellow River Delta.
The highest SQI value of 0–30 cm soil layer is concentratedly distributed in the central region of the delta where there was a reclaimed area that is far away from the sea (Figure 4A). The lowest SQI value is mainly distributed near the coastline of a Td area. To be consistent with the vertical distance to the coastline, the mean values of SQI in 0–30 cm followed: Cp > Pa > Tc > Ss and Td (Figure 4B). The results indicated that the soil quality in the study area decreased gradually from upper soil to lower soil (0–30 cm), from inland to coastline, from reclaimed wetlands to tidal flat.
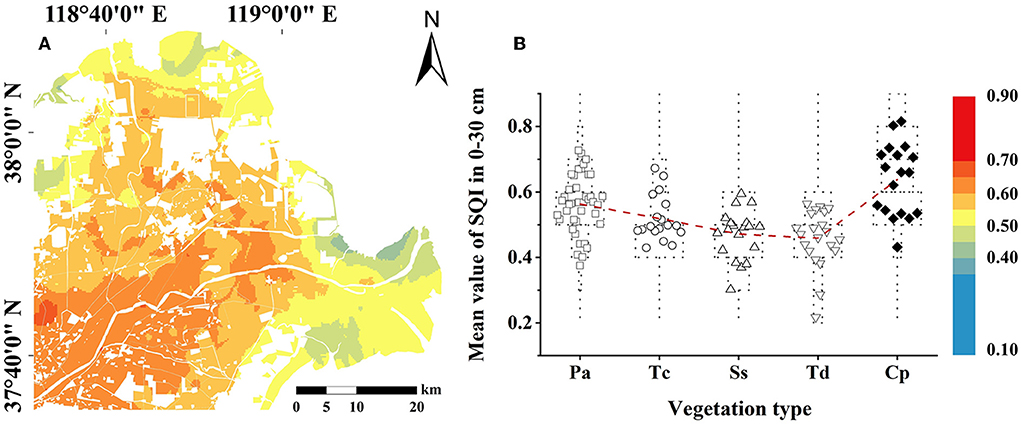
Figure 4. The mean SQI value of 0–30 cm (A) and different vegetation (B) in the Yellow River Delta.
The contrast test of SQIMDS and SQITDS
To test the accuracy of MDS for soil quality assessment in the Yellow River Delta, we compared the SQI results of the MDS (SQIMDS) with the total data set (SQITDS). There was a strong linear relationship between SQIMDS values and SQITDS values under different vegetation types and soil depth (Figure 5). The coefficient of determination (r2) of linear regression in Pa, Tc, Ss, Td, and Cp were 0.83, 0.79, 0.81, 0.79, and 0.86, respectively. The r2 in 0–10 cm, 10–20 cm, and 20–30 cm were 0.81, 0.86, and 0.86, respectively. The results of the contrast test demonstrated that the MDS with high accuracy and credibility was suitable for assessing the soil quality of the Yellow River Delta.
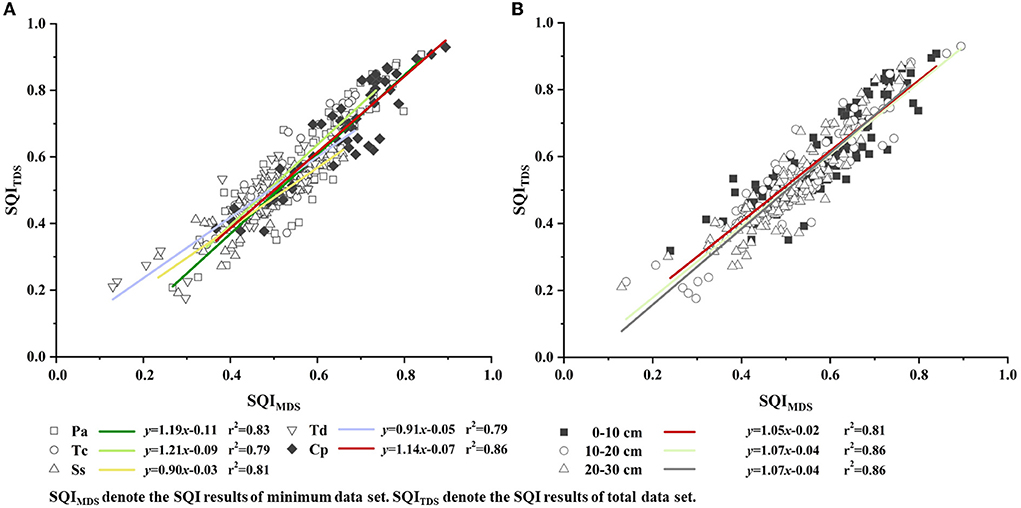
Figure 5. The linear regression and determination coefficient (r2) of SQIMDS and SQITDS under different vegetation types (A) and soil depth (B).
Discussion
The main influencing factors of soil quality spatial distribution in the study area were soil nutrients and soil salinity (Table 2), which was the comprehensive results of soil formation process, vegetation type, and anthropological activities. The soil parent material of the Yellow River Delta was originated from the Loess Plateau (Yu et al., 2016; Ji et al., 2022). A large amount of sediment was carried by the Yellow River and deposited in the estuarine area, and the typical estuarine delta wetlands were formed over years by the accumulation of sediment (Zhao et al., 2003; Yu et al., 2014). Along with the succession, tidal flat, Suaeda salsa, Tamarix chinensis, and Phragmites australis developed zonal with the distance from the sea (Figure 1). And the soil qualities of natural wetlands were decided by soil maturation degree (Liu et al., 2010; Guo et al., 2018). Previous studies showed that the soil nutrient elements such as carbon, nitrogen, phosphorus, and sulfur in the study area had obvious spatial distribution differences (Lu et al., 2016), which were affected by land cover and land formation age (Jiao et al., 2014; Yu et al., 2016). The regulation of SQI that increased with the increase of the distance to the coastline (ordered Cp > Pa > Tc > Ss and Td) was observed in the study (Figure 3). Yu and Wang found that soil salinity decreased from east to west in the study area, i.e., the farther away the coastline, the lower the soil salinity (Yu et al., 2014; Wang et al., 2017). Our results of SQI spatial distribution regulation in natural wetlands were opposite to those of soil salinity because Sa was one of the significant negative factors for SQI of natural wetlands (Table 4). Under the influence of tidal action, the spatial distribution of soil salinity showed a ribbon shape with different distance ranges to the coastline (Yu et al., 2014; Wang et al., 2017). Referring to the map of land use classification (Figure 1) in natural wetlands, Pa is mainly located along the Yellow River or in the supratidal zone, Tc is mainly distributed in the supratidal zone and was submerged by seawater at high tide, Ss and Td are distributed in the intertidal zone, where were submerged by seawater periodically. Various plant communities occupied different ecological niches according to their adaptability for soil salinity-alkali property. The multi-way ANOVA result showed that the values of SQI were significantly correlated with vegetation type and soil depth (p < 0.05) (Supplementary Table 3). The abilities of soil nutrients absorption, utilization, fixation, and return of plants (Jiao et al., 2014) led to the SQI of 0–10 cm soil layer being significantly higher than 20–30 cm of soil layer (p < 0.05) (Figures 2A, 3).
The crucial factor that changed soil quality in the study area was human reclamation activities, which led the SQI of reclaimed wetlands to be significantly higher than those of natural wetlands (Figure 2) (p < 0.05). Similar results were also found in the previous study (Zhang et al., 2015). Different from most freshwater wetlands, the soil types in the study area were mostly saline-alkali soil with low nutrients content and poor original soil fertility (Verhoeven and Setter, 2010; Ouyang et al., 2013; Xu et al., 2019). The soil salinity was reduced greatly and quickly during cultivation under the measures of drainage salinity and freshwater replenishment (Li et al., 2014; Xiao et al., 2022). Meanwhile, the agricultural process could help to loosen surface soil to alleviate the salt enrichment in the topsoil layer (Cheng-Song et al., 2010). The soil TOC, NO-N, and TP increased considerably because of a large amount of fertilizer application in reclaimed wetlands under the agricultural planting mode of high-input and high-yield (Jiao et al., 2019; Wang et al., 2021). Therefore, on the one hand, the reclamation of coastal wetland changed the distribution characteristics of soil nutrients in the study area, which led to the increase in soil fertility in the reclaimed wetland. On the other hand, the process of reclamation could reduce soil salinity and have an obvious improvement effect on saline-alkali land. The above factors contributed to the significant difference in the soil quality between natural wetlands and reclaimed wetlands (p < 0.05). While high intensity fertilization may also lead to high soil nutrient residues and water eutrophication and then lead to a series of ecological problems. This is also an issue that needs further comprehensive consideration in the future study. The anthropological activities in reclaimed wetlands that resulted in the significantly negative correlation between SQI with Sa and pH were not observed in reclaimed wetlands, which was different with that in natural wetlands (Table 4). These differences in SQI between reclaimed wetlands and natural wetlands (Figure 4) indicated that agricultural reclamation could alter natural influence and become an important impact factor on soil quality in the coastal wetlands to a great extent.
Moreover, to test the accuracy of MDS, SQITDS and SQIMDS were compared in our study. The results showed the coefficient of determination (r2) of linear regression in Pa, Tc, Ss, Td, and Cp were 0.83, 0.79, 0.81, 0.79, and 0.86, respectively (Figure 5A). Therefore, the method of MDS with less data redundancy could replace SQITDS for soil quality evaluation in the study area because it could well-explain the soil quality characteristics.
Conclusion
An MDS based on 14 soil property indexes and a fuzzy logic model were employed to execute soil quality assessment in the Yellow River Delta. The contrast test of TDS and MDS was conducted to test the accuracy of SQI results. The results showed that (1) the soil quality of the Yellow River Delta decreased from the inland to the coastline with the change of vegetation type and from topsoil layer to subsoil layer in each soil type; (2) the soil qualities of reclaimed wetlands were significantly higher than those of natural wetlands, indicating that the agricultural reclamation could greatly alter natural influence and become an important factor of soil quality to a great extent; and (3) the method of MDS with less data redundancy could well-explain the soil quality characteristics of the Yellow River Delta.
Data availability statement
The original contributions presented in the study are included in the article/Supplementary material, further inquiries can be directed to the corresponding authors.
Author contributions
DS and YLi wrote the main manuscript text. JYu and BL are supervisors of DS and provided the idea of the manuscript. BG, DZ, XW, and JYa sampled the soils in field and analyzed statistical data related the manuscript. YM and XZ interpreted the remote sensing images and prepared the figures. XL, YLin, YZ, SJ, and FS did the field land cover survey and designed the filed monitoring sites. All authors reviewed the manuscript. All authors contributed to the article and approved the submitted version.
Funding
This work was funded by the Key Program from the National Natural Science Foundation of China (U1806218 and U2006215), the National Natural Science Foundation of China (41871087 and 42171111), the Project of the Cultivation Plan of Superior Discipline Talent Teams of Universities in Shandong Province: the Coastal Resources and Environment team for Blue-Yellow Area.
Conflict of interest
The authors declare that the research was conducted in the absence of any commercial or financial relationships that could be construed as a potential conflict of interest.
Publisher's note
All claims expressed in this article are solely those of the authors and do not necessarily represent those of their affiliated organizations, or those of the publisher, the editors and the reviewers. Any product that may be evaluated in this article, or claim that may be made by its manufacturer, is not guaranteed or endorsed by the publisher.
Supplementary material
The Supplementary Material for this article can be found online at: https://www.frontiersin.org/articles/10.3389/fevo.2022.977899/full#supplementary-material
References
Abdel-Fattah, M. K., Mohamed, E. S., Wagdi, E. M., Shahin, S. A., Aldosari, A. A., Lasaponara, R., et al. (2021). Quantitative evaluation of soil quality using principal component analysis: the case study of El-Fayoum depression Egypt. Sustainability. 13, 1824. doi: 10.3390/su13041824
Adebo, B. O., Aweto, A. O., and Ogedengbe, K. (2020). Assessment of soil quality under different agricultural land use systems: a case study of the ibadan farm settlement. Int. J. Plant Soil Sci. 32, 89–104. doi: 10.9734/ijpss/2020/v32i430275
Andrews, S. S., Flora, C. B., Mitchell, J. P., and Karlen, D. L. (2003). Growers' perceptions and acceptance of soil quality indices. Geoderma. 114, 187–213. doi: 10.1016/S0016-7061(03)00041-7
Andrews, S. S., Karlen, D. L., and Mitchell, J. P. (2002). A comparison of soil quality indexing methods for vegetable production systems in Northern California. Agric. Ecosyst. Environ. 90, 25–45. doi: 10.1016/S0167-8809(01)00174-8
Armenise, E., Redmile-Gordon, M. A., Stellacci, A. M., Ciccarese, A., and Rubino, P. (2013). Developing a soil quality index to compare soil fitness for agricultural use under different managements in the Mediterranean environment. Soil Tillage Res. 130, 91–98. doi: 10.1016/j.still.2013.02.013
Burrough, P. A. (1989). Fuzzy mathematical methods for soil survey and land evaluation. J. Soil Sci. 40, 477–492. doi: 10.1111/j.1365-2389.1989.tb01290.x
Burrough, P. A., MacMillan, R. A., and Van Deursen, W. (1992). Fuzzy classification methods for determining land suitability from soil profile observations and topography. J. Soil Sci. 43, 193–210. doi: 10.1111/j.1365-2389.1992.tb00129.x
Cao, L., Song, J., Li, X., Yuan, H., Li, N., Duan, L., et al. (2015). Geochemical characteristics of soil C, N, P, and their stoichiometrical significance in the coastal wetlands of Laizhou Bay, Bohai Sea. Clean Soil Air Water. 43, 260–270. doi: 10.1002/clen.201300752
Chaer, G. M., Myrold, D. D., and Bottomley, P. J. (2009). A soil quality index based on the equilibrium between soil organic matter and biochemical properties of undisturbed coniferous forest soils of the Pacific Northwest. Soil Biol. Biochem. 41, 822–830. doi: 10.1016/j.soilbio.2009.02.005
Chen, S., Jin, Z., Zhang, J., and Yang, S. (2021). Soil quality assessment in different dammed-valley farmlands in the hilly-gully mountain areas of the Northern Loess Plateau, China. J. Arid Land. 13, 777–789. doi: 10.1007/s40333-021-0014-4
Cheng-Song, X. I., He-Zhong, D. O., Zhen, L. U., Wei, T. A., Zhang, D. M., Wei-Jiang, L. I., et al. (2010). Effects of N, P, and K fertilizer application on cotton growing in saline soil in Yellow River Delta. Acta Agronomica Sinica. 36, 1698–1706. doi: 10.1016/S1875-2780(09)60078-X
Cherubin, M. R., Tormena, C. A., and Karlen, D. L. (2017). Soil quality evaluation using the soil management assessment framework (SMAF) in Brazilian Oxisols with contrasting texture. Revista Brasileira de Ciência do Solo. 41, e0160148. doi: 10.1590/18069657rbcs20160148
Chi, Y., Sun, J., Sun, Y., Liu, S., and Fu, Z. (2020). Multi-temporal characterization of land surface temperature and its relationships with normalized difference vegetation index and soil moisture content in the Yellow River Delta, China. Glob. Ecol. Conserv. 23, e01092. doi: 10.1016/j.gecco.2020.e01092
Fathizad, H., Ardakani, M. A., Heung, B., Sodaiezadeh, H., Rahmani, A., Fathabadi, A., et al. (2020). Spatio-temporal dynamic of soil quality in the central Iranian desert modeled with machine learning and digital soil assessment techniques. Ecol. Indic. 118, 106736. doi: 10.1016/j.ecolind.2020.106736
Granatstein, D., and Bezdicek, D. F. (1992). The need for a soil quality index: local and regional perspectives. Am. J. Alternative Agric. 7, 12–16. doi: 10.1017/S0889189300004380
Guo, J., Luo, Z., Tao, J., Zhang, J., Gan, Z., Lin, F., et al. (2021). Soil chemical quality assessment and spatial distribution of pomelo orchards in acidic red soil hilly regions of China. J. Sci. Food Agric. 102, 2613–2622. doi: 10.1002/jsfa.11603
Guo, S., Han, X., Li, H., Wang, T., Tong, X., Ren, G., et al. (2018). Evaluation of soil quality along two revegetation chronosequences on the Loess Hilly Region of China. Sci. Total Environ. 633, 808–815. doi: 10.1016/j.scitotenv.2018.03.210
He, Q., and Cui, B. (2015). Multiple mechanisms sustain a plant-animal facilitation on a coastal ecotone. Sci. Rep. 5, 8612. doi: 10.1038/srep08612
Huang, J., and Yuan, Z. (2021). Ecological stoichiometric characteristics of Soil SOC, TN, and TP under different restoration methods in qixing river wetland. J. King Saud Univ. Sci. 33, 101407. doi: 10.1016/j.jksus.2021.101407
Ji, H., Chen, S., Pan, S., Xu, C., Tian, Y., Li, P., et al. (2022). Fluvial sediment source to sink transfer at the Yellow River Delta: quantifications, causes, and environmental impacts. J. Hydrol. 608, 127622. doi: 10.1016/j.jhydrol.2022.127622
Jiang, M., Xu, L., Chen, X., Zhu, H., and Fan, H. (2020). Soil quality assessment based on a minimum data set: a case study of a county in the typical river delta wetlands. Sustainability. 12, 9033. doi: 10.3390/su12219033
Jiao, S., Li, J., Li, Y., Jia, J., and Xu, Z. (2019). Soil C, N, and P distribution as affected by plant communities in the Yellow River Delta, China. PLoS ONE. 14, e0226887. doi: 10.1371/journal.pone.0226887
Jiao, S., Zhang, M., Wang, Y., Liu, J., and Li, Y. (2014). Variation of soil nutrients and particle size under different vegetation types in the Yellow River Delta. Acta Ecol. Sin. 34, 148–153. doi: 10.1016/j.chnaes.2014.03.003
Jimenez, L. C., Queiroz, H. M., Cherubin, M. R., and Ferreira, T. O. (2022). Applying the soil management assessment framework (SMAF) to assess mangrove soil quality. Sustainability. 14, 3085. doi: 10.3390/su14053085
Karlen, D. L., Ditzler, C. A., and Andrews, S. S. (2003). Soil quality: why and how. Geoderma. 114, 145–156. doi: 10.1016/S0016-7061(03)00039-9
Kasno, A. (2021). Financial benefits of using soil test kit of PUTS for determining dosage of lowland rice fertilizer. IOP Conf. Ser. Earth Environ. Sci. 648, 012039. doi: 10.1088/1755-1315/648/1/012039
Li, J., Pu, L., Zhu, M., Zhang, J., Li, P., Dai, X., et al. (2014). Evolution of soil properties following reclamation in coastal areas: a review. Geoderma. 226–227, 130–139. doi: 10.1016/j.geoderma.2014.02.003
Liu, P., Wang, Q., Bai, J., Gao, H., Huang, L., and Xiao, R. (2010). Decomposition and return of C and N of plant litters of Phragmites australis and Suaeda salsa in typical wetlands of the Yellow River Delta, China. Procedia Environ. Sci. 2, 1717–1726. doi: 10.1016/j.proenv.2010.10.183
Lu, Q., Bai, J., Zhang, G., Zhao, Q., and Wu, J. (2016). Spatial and seasonal distribution of carbon, nitrogen, phosphorus, and sulfur and their ecological stoichiometry in wetland soils along a water and salt gradient in the Yellow River Delta, China. Phys. Chem. Earth. 104, 9–17. doi: 10.1016/j.pce.2018.04.001
Mazzon, M., Cavani, L., Ciavatta, C., Campanelli, G., Burgio, G., and Marzadori, C. (2021). Conventional versus organic management: application of simple and complex indexes to assess soil quality. Agric. Ecosyst. Environ. 322, 107673. doi: 10.1016/j.agee.2021.107673
Nyeck, B., Mbogba, M. N., Njilah, I. K., Yemefack, M., and Bilong, P. (2018). Contributions of soil chemical and physical properties in the dynamics of soil quality in the southern Cameroon plateau shifting agricultural landscape. Int. J. Biol. Chem. Sci. 12, 1042. doi: 10.4314/ijbcs.v12i2.32
Ouyang, W., Xu, Y., Hao, F., Wang, X., Siyang, C., and Lin, C. (2013). Effect of long-term agricultural cultivation and land use conversion on soil nutrient contents in the Sanjiang plain. Catena. 104, 243–250. doi: 10.1016/j.catena.2012.12.002
Peters, B. C. (1973). Changing ideas about the use of vegetation as an indicator of soil quality: example of New York and Michigan. J. Geogr 72, 18–28. doi: 10.1080/00221347308981021
Pulido, M., Schnabel, S., Contador, J. F., Lozano-Parra, J., and Gómez-Gutiérrez, Á. (2017). Selecting indicators for assessing soil quality and degradation in rangelands of Extremadura (SW Spain). Ecol. Indic. 74, 49–61. doi: 10.1016/j.ecolind.2016.11.016
Purakayastha, T. J., Pathak, H., Kumari, S., Biswas, S., Chakrabarty, B., Padaria, R. N., et al. (2019). Soil health card development for efficient soil management in Haryana, India. Soil Tillage Res. 191, 294–305. doi: 10.1016/j.still.2018.12.024
Rahmanipour, F., Marzaioli, R., Bahrami, H. A., Fereidouni, Z., and Bandarabadi, S. R. (2014). Assessment of soil quality indices in agricultural lands of Qazvin Province, Iran. Ecol. Indic. 40, 19–26. doi: 10.1016/j.ecolind.2013.12.003
Raiesi, F. (2017). A minimum data set and soil quality index to quantify the effect of land use conversion on soil quality and degradation in native rangelands of upland arid and semiarid regions. Ecol. Indic. 75, 307–320. doi: 10.1016/j.ecolind.2016.12.049
Raiesi, F., and Beheshti, A. (2022). Evaluating forest soil quality after deforestation and loss of ecosystem services using network analysis and factor analysis techniques. Catena. 208, 105778. doi: 10.1016/j.catena.2021.105778
Rathore, A. P., Chaudhary, D. R., and Jha, B. (2022). Assessing the effects of Salicornia brachiata Roxb. growth on coastal saline soil quality over temporal and spatial scales. Appl. Soil Ecol. 169, 104196. doi: 10.1016/j.apsoil.2021.104196
Rezaei, S. A., Gilkes, R. J., and Andrews, S. S. (2006). A minimum data set for assessing soil quality in rangelands. Geoderma. 136, 229–234. doi: 10.1016/j.geoderma.2006.03.021
Shao, G., Ai, J., Sun, Q., Hou, L., and Dong, Y. (2020). Soil quality assessment under different forest types in the Mount Tai, central Eastern China. Ecol. Indic. 115, 106439. doi: 10.1016/j.ecolind.2020.106439
Shokr, M. S., Abdellatif, M. A., El Baroudy, A. A., Elnashar, A., Ali, E. F., Belal, A. A., et al. (2021). Development of a spatial model for soil quality assessment under arid and semi-arid conditions. Sustainability. 13, 2893. doi: 10.3390/su13052893
Sultana, M. S., Islam, M. S., Rahman, S., and Al-Mansur, M. A. (1970). Study of surface water and soil quality affected by heavy metals of Pabna Sadar. Bangladesh J. Sci. Ind. Res. 46, 133–140. doi: 10.3329/bjsir.v46i1.8117
Verhoeven, J. T., and Setter, T. L. (2010). Agricultural use of wetlands: opportunities and limitations. Ann. Bot. 105, 155–163. doi: 10.1093/aob/mcp172
Volchko, Y., Norrman, J., Rosèn, L., and Norberg, T. (2014). A minimum data set for evaluating the ecological soil functions in remediation projects. J. Soils Sediments. 14, 1850–1860. doi: 10.1007/s11368-014-0939-8
Wander, M. M., Walter, G. L., Nissen, T. M., Bollero, G. A., Andrews, S. S., and Cavanaugh-Grant, D. A. (2002). Soil quality. Agron. J. 94, 23–32. doi: 10.2134/agronj2002.2300
Wang, D., Bai, J., Wang, W., Zhang, G., Cui, B., Liu, X., et al. (2018). Comprehensive assessment of soil quality for different wetlands in a Chinese delta. Land Degrad. Dev. 29, 3783–3795. doi: 10.1002/ldr.3086
Wang, Y., Liu, G., and Zhao, Z. (2021). Spatial heterogeneity of soil fertility in coastal zones: a case study of the Yellow River Delta, China. J. Soils Sediments. 21, 1826–1839. doi: 10.1007/s11368-021-02891-5
Wang, Z., Zhao, G., Gao, M., and Chang, C. (2017). Spatial variability of soil salinity in coastal saline soil at different scales in the Yellow River Delta, China. Environ. Monit. Assess. 189, 80. doi: 10.1007/s10661-017-5777-x
Wu, C., Liu, G., Huang, C., and Liu, Q. (2019). Soil quality assessment in Yellow River Delta: establishing a minimum data set and fuzzy logic model. Geoderma. 334, 82–89. doi: 10.1016/j.geoderma.2018.07.045
Xia, J., Ren, J., Zhang, S., Wang, Y., and Fang, Y. (2019). Forest and grass composite patterns improve the soil quality in the coastal saline-alkali land of the Yellow River Delta, China. Geoderma. 349, 25–35. doi: 10.1016/j.geoderma.2019.04.032
Xiao, L., Yuan, G., Feng, L., Shah, G. M., and Wei, J. (2022). Biochar to reduce fertilizer use and soil salinity for crop production in the Yellow River Delta. J. Soil Sci. Plant Nutr. 22, 1478–1489. doi: 10.1007/s42729-021-00747-y
Xu, C., Pu, L., Li, J., and Zhu, M. (2019). Effect of reclamation on C, N, and P stoichiometry in soil and soil aggregates of a coastal wetland in eastern China. J. Soils Sediments. 19, 1215–1225. doi: 10.1007/s11368-018-2131-z
Yang, H., Xia, J., Cui, Q., Liu, J., Wei, S., Feng, L., et al. (2021). Effects of different Tamarix chinensis-grass patterns on the soil quality of coastal saline soil in the Yellow River Delta, China. Sci. Total Environ. 772, 145501. doi: 10.1016/j.scitotenv.2021.145501
Yao, R., Yang, J., Gao, P., Zhang, J., and Jin, W. (2013). Determining minimum data set for soil quality assessment of typical salt-affected farmland in the coastal reclamation area. Soil Tillage Res. 128, 137–148. doi: 10.1016/j.still.2012.11.007
Yu, J., Li, Y., Han, G., Zhou, D., Fu, Y., Guan, B., et al. (2014). The spatial distribution characteristics of soil salinity in coastal zone of the Yellow River Delta. Environ. Earth Sci. 72, 589–599. doi: 10.1007/s12665-013-2980-0
Yu, J., Lv, X., Bin, M., Wu, H., Du, S., Zhou, M., et al. (2015). Fractal features of soil particle size distribution in newly formed wetlands in the Yellow River Delta. Sci. Rep. 5, 10540. doi: 10.1038/srep10540
Yu, J., Zhan, C., Li, Y., Zhou, D., Fu, Y., Chu, X., et al. (2016). Distribution of carbon, nitrogen and phosphorus in coastal wetland soil related land use in the Modern Yellow River Delta. Sci. Rep. 6, 37940. doi: 10.1038/srep37940
Yuan, P., Wang, J., Li, C., Xiao, Q., Liu, Q., Sun, Z., et al. (2022). Soil quality indicators of integrated rice-crayfish farming in the Jianghan Plain, China using a minimum data set. Soil Tillage Res. 204, 104732. doi: 10.1016/j.still.2020.104732
Zhang, G., Bai, J., Xi, M., Gao, M, Zhao, Q., Lu, Q., et al. (2015). Comprehensive assessment of soil quality of wetlands in the Yellow River Delta. Wetland Sci. 13, 744–751. doi: 10.13248/j.cnki.wetlandsci.2015.06.014
Zhang, G., Bai, J., Xi, M., Zhao, Q., Lu, Q., and Jia, J. (2016). Soil quality assessment of coastal wetlands in the Yellow River Delta of China based on the minimum data set. Ecol. Indic. 66, 458–466. doi: 10.1016/j.ecolind.2016.01.046
Zhang, Z. S., Song, X. L., Lu, X. G., and Xue, Z. S. (2013). Ecological stoichiometry of carbon, nitrogen, and phosphorus in estuarine wetland soils: influences of vegetation coverage, plant communities, geomorphology, and seawalls. J. Soils Sediments 13, 1043–1052. doi: 10.1007/s11368-013-0693-3
Zhao, G., Shi, Y., Chen, W., Li, J., Ann, S. W., Kim, Y. C., et al. (2003). Dynamic changes of newly formed wetlands in the Yellow River mouth based on GIS and remote sensing. J. Environ. Sci. Int. 12, 133–137. doi: 10.5322/JES.2003.12.2.133
Keywords: soil quality, coastal wetland, vegetation type, the Yellow River Delta, minimum data set
Citation: Sun D, Li Y, Yu J, Li B, Guan B, Zhou D, Wang X, Yang J, Ma Y, Zhang X, Li X, Ling Y, Zou Y, Jia S and Shen F (2022) Spatial distribution of soil quality under different vegetation types in the Yellow River Delta wetland. Front. Ecol. Evol. 10:977899. doi: 10.3389/fevo.2022.977899
Received: 25 June 2022; Accepted: 15 July 2022;
Published: 12 August 2022.
Edited by:
Chuanyu Gao, Northeast Institute of Geography and Agroecology (CAS), ChinaReviewed by:
Junhong Bai, Beijing Normal University, ChinaWenguang Sun, University of Nebraska-Lincoln, United States
Jia Jia, Yellow River Institute of Hydraulic Research, China
Copyright © 2022 Sun, Li, Yu, Li, Guan, Zhou, Wang, Yang, Ma, Zhang, Li, Ling, Zou, Jia and Shen. This is an open-access article distributed under the terms of the Creative Commons Attribution License (CC BY). The use, distribution or reproduction in other forums is permitted, provided the original author(s) and the copyright owner(s) are credited and that the original publication in this journal is cited, in accordance with accepted academic practice. No use, distribution or reproduction is permitted which does not comply with these terms.
*Correspondence: Junbao Yu, anVuYmFvLnl1QGdtYWlsLmNvbQ==; Baoquan Li, YnFsaUB5aWMuYWMuY24=
†These authors have contributed equally to this work