 Roxanne M. W. Banker
 Ashley A. Dineen
 Melanie G. Sorman4
 Carrie L. Tyler
 Peter D. Roopnarine
- 1Department of Invertebrate Zoology and Geology, California Academy of Sciences, San Francisco, CA, United States
- 2Department of Geoscience, University of Nevada, Las Vegas, NV, United States
- 3University of California Museum of Paleontology, University of California, Berkeley, Berkeley, CA, United States
- 4Department of Geology and Environmental Earth Science, Miami University, Oxford, OH, United States
Ecosystem structure—that is the species present, the functions they represent, and how those functions interact—is an important determinant of community stability. This in turn affects how ecosystems respond to natural and anthropogenic crises, and whether species or the ecological functions that they represent are able to persist. Here we use fossil data from museum collections, literature, and the Paleobiology Database to reconstruct trophic networks of Tethyan paleocommunities from the Anisian and Carnian (Triassic), Bathonian (Jurassic), and Aptian (Cretaceous) stages, and compare these to a previously reconstructed trophic network from a modern Jamaican reef community. We generated model food webs consistent with functional structure and taxon richnesses of communities, and compared distributions of guild level parameters among communities, to assess the effect of the Mesozoic Marine Revolution on ecosystem dynamics. We found that the trophic space of communities expanded from the Anisian to the Aptian, but this pattern was not monotonic. We also found that trophic position for a given guild was subject to variation depending on what other guilds were present in that stage. The Bathonian showed the lowest degree of trophic omnivory by top consumers among all Mesozoic networks, and was dominated by longer food chains. In contrast, the Aptian network displayed a greater degree of short food chains and trophic omnivory that we attribute to the presence of large predatory guilds, such as sharks and bony fish. Interestingly, the modern Jamaican community appeared to have a higher proportion of long chains, as was the case in the Bathonian. Overall, results indicate that trophic structure is highly dependent on the taxa and ecological functions present, primary production experienced by the community, and activity of top consumers. Results from this study point to a need to better understand trophic position when planning restoration activities because a community may be so altered by human activity that restoring a species or its interactions may no longer be possible, and alternatives must be considered to restore an important function. Further work may also focus on elucidating the precise roles of top consumers in moderating network structure and community stability.
1. Introduction
The interconnectedness and dependencies among species are fundamental to how ecological systems respond to both natural and anthropogenic stressors, and therefore the indirect effects of those stressors on species themselves (Rooney and McCann, 2012; Oliver et al., 2015; Pita et al., 2018). The importance of interactions stems from the functions that species perform (e.g., detritivore, herbivore), and the community-level processes that emerge from the interactions or organization among functions (e.g., nutrient cycling) (Schleuning et al., 2015; Worden et al., 2015; Guidi et al., 2016). Thus, the importance of species functions to the health of ecological systems, and hence conservation biology, is broadly recognized. For example, one beneficial aspect of biodiversity is functional redundancy, where multiple species perform the same function, ensuring that the function and related processes survive despite the loss of any single taxon (Biggs et al., 2020; Elsberry and Bracken, 2021).
Functions, however, should be considered context-dependent, whereby the position of a function in a food web network, its interactions, and therefore its role in community stability and persistence, may depend on the composition of the rest of the community. For example, coyotes are apex predators in many regions of North America, but this is a historically recent result of the nineteenth and twentieth century extirpation of more powerful predators, such as the gray wolf and brown bear from those regions (Prugh et al., 2009; Levi and Wilmers, 2012; Ripple et al., 2013). Thus, the role of an ecological function is relative to the overall composition of the ecological system in which it is embedded. Furthermore, the histories of the functional and taxonomic compositions of ecological systems can be decoupled or asynchronous, necessitating a conservation paleobiological perspective. For example, Cenozoic mammalian communities that are defined on the basis of common functional traits persist over longer periods of geologic time as opposed to those that are defined based on taxonomic composition (Blanco et al., 2021). Functional diversity, and the manner in which taxon richness is apportioned across functional groups within a community, are key features that influence persistence over ecological and geological timescales (Roopnarine et al., 2019; Roopnarine and Banker, 2021). It is therefore important to better clarify how functional diversity affects the trophic structure of food web networks.
Here, we address the question of whether ecological functions retain their relative trophic positions in networks of species interactions as species composition and functional diversity change. We do this using marine ecosystems on evolutionary time scales, examining four geologic stages distributed throughout the Mesozoic, encompassing both the expansion of major groups of marine planktonic primary producers beginning in the Triassic and the Mesozoic Marine Revolution (MMR) (Vermeij, 1977, 2008; Knoll and Follows, 2016). Specifically, we reconstructed trophic networks from the western Tethys Ocean during the Anisian, Carnian, Bathonian, and Aptian stages. The examination of community composition and dynamics from a functional standpoint is a relatively recent approach, and most of the data describing the long-term structure of communities has been gathered from the fossil record. It is also on geological timescales that we are able to observe ecological changes that coincide with the extremes of environmental change that, while relatively uncommon in the geological record, are completely novel in the anthropogenically-driven modern world.
One particular focus of the study is the trophic organization of the paleocommunities. The concept of trophic level is central to ecology and guides our understanding of how energy flows in food web networks, and hence the sensitivity of those networks to perturbations that degrade species composition or population sizes. Recent work has shown that the trophic positions of taxa in food webs are subject to variation, and subsequently the functional relationships among taxa and the processes that result from functional interactions may likewise be expected to vary (e.g., Thompson et al., 2007; Gibb and Cunningham, 2011). This stands in contrast to conventional views of fixed functional and guild categories, such as a framework of vertical tiering, motility, and feeding mechanism (Bambach, 1983). The variability and context-dependency of functional roles and trophic positions, however, suggest that the addition of a dynamic aspect to guild frameworks might be necessary to more completely understand how ecological systems have changed through the Phanerozoic. Moreover, the implications of those changes have great importance to how we understand the relationship between functional diversity and food web structure in modern ecosystems. For example, one cannot assume that specific functions perform similarly in different communities, nor that species reintroductions will aid in the recovery of ecosystems if the ecological context (community) has already been sufficiently altered. Thus, an improved understanding of trophic organization of paleocommunities will help to inform our ability to target processes instead of species when considering conservation action.
2. Methods
2.1. Data compilation
Four Mesozoic trophic networks were reconstructed from stages with an abundance of occurrence data (>1,000 occurrences) available in the Paleobiology Database (PBDB) from the western Tethys: Anisian (Middle Triassic), Carnian (Late Triassic), Bathonian (Middle Jurassic), and Aptian (Early Cretaceous). We define “trophic network” as the complete set of predator-prey interactions among an assemblage of taxa, and not necessarily those that would be found in a spatio-temporal instantiation or subset of those taxa, which would correspond more precisely to a modern, local community food web. Data from the PBDB were downloaded on November 15th, 2017 using the following parameters: time intervals = Anisian, Carnian, Bathonian, and Aptian, region = Europe, and environment = marine. Duplicates and taxa from lagoonal or brackish water paleoenvironments (i.e., not a part of our target environment) were removed prior to analysis. These data were supplemented with occurrence data obtained from the literature and museum collections, specifically the National Museum of Natural History France (Paris, France), the National Museum of Natural History (London, UK), and the State Museum of Natural History (Stuttgart, Germany).
2.2. Trophic network reconstruction
Trophic network models of paleocommunities were reconstructed using the methodology described in Roopnarine et al. (2018). All taxa were organized into functional groups based on common ecological and environmental characteristics (e.g., Benthic Omnivore/Grazers; Nektobenthic Carnivores; Stationary, Epifaunal Suspension Feeders). Functional groups were further classified into guilds based on body and skull size ranges. The resulting trophic guilds represent ecologically similar groups of taxa that share both environment, overlapping predator, and prey resources, and body size. Potential interactions between guilds were identified using literature surveys of life-mode, feeding ecology, body shape, gape size, body size, gut contents, tooth morphology (similar to Massare, 1987), and data from modern analog species. For guilds composed of predators, such as fish, ammonoids, and marine reptiles, interactions between guilds were additionally constrained by both body size and gape size limitations (Brose et al., 2005). Likewise, molluscs such as bivalves and gastropods were binned according to body size in order to constrain durophagous predation. Guilds of predators were constrained in the ranges of prey body sizes, both above and below their own body size classification (see Section 3). The resulting system of guild interactions, or metanetwork (Roopnarine et al., 2007), allowed us to examine changes in occurrences and contexts of functional dynamics among our reconstructed stages.
2.2.1. Body size
Guild interactions were further constrained by partitioning marine reptiles, fish, and molluscs on the basis of their body size distributions. Species body sizes were obtained from either the literature, the Paleobiology Database (PBDB), or from museum specimens. If multiple specimens could not be measured and averaged, priority was given to the size of the holotype material. Marine reptiles were binned using skull size in order to constrain gape size limitations, using data primarily from the compilations generated by Scheyer et al. (2014) and Stubbs and Benton (2016), along with museum specimens. Molluscs (i.e., bivalves, gastropods, and cephalopods) were measured using the mean (if multiple individuals were available) of the largest dimension (i.e., diameter in ammonites and length/width in bivalves and gastropods), with data derived primarily from Heim et al. (2015, 2017), and the PBDB. Fish body sizes were measured as maximum body length (MSL), and obtained primarily from the compilations generated by Scheyer et al. (2014) and Romano et al. (2016), along with museum specimens. If body size could not be estimated from multiple sources, or a taxon was only partially preserved (i.e., only teeth, partial fragments, etc.), or was determined likely to be a juvenile, it was removed from this study. Lastly, we also acknowledge that some data sources, such as Heim et al. (2015, 2017), use type specimens as a proxy for the entire genus. While not ideal, use of type specimens has been shown to be an accurate way to estimate median body size of a genus, and hence can provide an unbiased measurement (Krause et al., 2007; Miller et al., 2009). Body size data used for the present study were ultimately recorded in mm for all taxa and data are available in https://github.com/Roxanne-Banker/RIME.
2.3. Species-level networks
Interactions between guilds in each stage were used to reconstruct a guild-level food web, or metanetwork, that can be used to estimate species-level networks (SLNs). Although the complete details of SLN's in the fossil record remain uncertain because of taphonomic incompleteness (i.e., soft tissue preservation) and spatio-temporal variability within the system, this approach provides an overview of the system that can be used to accurately characterize changing community dynamics over geologic timescales (Roopnarine and Dineen, 2018). Species-level networks (SLNs), which model species trophic interactions in contrast to those among functional groups and guilds, were generated by stochastically assigning predators and prey to species in a manner consistent with guild level topology, i.e., the metanetwork (Roopnarine, 2006, 2009; Roopnarine et al., 2007, 2018). Interspecific interactions cannot be documented exhaustively from the fossil record, and must be reconstructed from actual evidence, such as predation traces and gut contents, or inferred on the basis of functional morphology, co-occurrence, and uniformitarian interpretations (Roopnarine et al., 2018; Shaw et al., 2021). Nevertheless, out of the total number of interactions that could be conjectured within a set of taxa, only those that are functionally consistent with a metanetwork could actually have existed (Roopnarine et al., 2018). Any species-level network or food web derived from a metanetwork is therefore plausible, but can be refined further using empirical or theoretical expectations (Shaw et al., 2021).
Here we employ an approach where the number of prey interactions for a consumer species, k was determined randomly by assuming that the distribution of the number of prey species per consumer (the in-degree distribution) within a single guild is hyperbolic, a feature that is common in modern food webs (Williams et al., 2002; Roopnarine et al., 2007). We applied a mixed exponential-power law distribution, P (k) (Roopnarine et al., 2007), which has been shown to statistically compensate for trophic chains within a food web being lost or shortened due to taphonomic processes (Roopnarine and Dineen, 2018).
where
M is the total number of prey species available to a guild, i.e., summed across all prey guilds linked to it in the metanetwork, and γ is a power law exponent, here taken to equal 2.5. One thousand model species-level food webs were generated for each paleocommunity (i.e., Anisian, Carnian, Bathonian, and Aptian). Network trophic position (ntp) and maximum food chain length (mcl) were calculated for each species in all SLNs for all paleocommunities. The network trophic position (ntp) of a species is the average of the shortest path lengths, or number of trophic steps, of its prey species to a producer species (Roopnarine and Dineen, 2018). The concept of “trophic level” is problematic for food webs where network topology consists of more than simple linear food chains. Ntp addresses this by considering the trophic position of a species relative to the primary producers within the network, spanning multiple types of topological pathways. The network trophic position of a consumer species i is calculated as:
where ri represents the number of prey species of i and aij = 1 if i consumes species j, and 0 otherwise. Finally, lj is the shortest path length of species j to the primary producer level. Primary producers are assigned an ntp of 1.0; therefore consumers that are strictly herbivores in this model have an ntp of 2.0, because the average shortest distance between their prey and primary producers is zero. Values of ntp > 2.0 represent omnivorous predatory taxa or guilds. Omnivorous taxa, which feed at multiple trophic levels in a food web, will therefore have non-integer ntp values.
2.4. Paleocommunity structure
Paleocommunity dynamics throughout the Mesozoic are described by the stages compiled here, and the resulting community trophic complexities are described by applying several network statistics to the metanetworks and analyses of changing compositions of guilds and functional groups.
2.4.1. Metanetwork statistics
These statistics include richness, or the total number of species, number of functional groups, number of guilds, number of guild interactions, connectance, and link density. Connectance measures the ratio between the number of inter-guild interactions and the maximum number of interactions (links) possible between guilds, and is calculated as:
where C is connectance, L is the number of guild interactions, and G is the number of guilds (Roopnarine, 2010). Connectance describes the density of interactions and has been proposed to be inversely correlated with stability (May, 1974). Link density is the average number of interactions per guild:
where Di is the link density of guild i.
2.4.2. Functional dynamics
Paleocommunity functional dynamics were described at the higher-order guild level based on data derived for each guild from all SLNs from each stage. Guild-level statistics per stage were calculated for a given guild by averaging all species-level measurements in that guild using the pooled set of 1,000 model SLNs. Guild statistics include mean guild network trophic position (), mean guild maximum chain length (), mean guild body size (), and guild richness (number of species per guild). Guild richness was transformed into a percentage of total community richness for that stage.
Guild mean body size was also calculated in the same manner for guilds that contained species for which body size data could be obtained (see Data availability statement for full guild level data set with body sizes), and is reported as the logarithm of mean guild body size ().
2.4.2.1. Persistent, extinct, and new guilds
Differences between guild properties were used to characterize transitional functional dynamics between stages. For each transition, e.g., Anisian to Carnian, guilds were classified as persistent, extinct, or new. Persistent guilds are present in both stages, extinct are restricted to the older stage, and new are restricted to the younger. Comparisons were made of several properties across the three guild classifications, including distributions of , , , and percent guild richness. For example, persistent, extinct and new categories would be compared using the distributions of within each category.
Two types of comparisons were made for each transition. First, the properties of persistent guilds were compared between the two stages of a transition to determine if those properties changed as a result of altered community structure or guild species richness. Second, properties were compared between those of persistent guilds in the earlier stage, guilds that occurred only in the earlier stage (extinct), and guilds that occurred only in the later stage (new). Comparisons of and were restricted to guilds of because by definition those properties cannot change for guilds of . Comparisons of percent guild richness were restricted to guilds of , because species richness was not available for primary producer guilds, and hence do not vary in our data. All comparisons were performed in R (version 4.1.2) using Bayesian routines implemented in the BEST package (version 0.5.4) (Kruschke, 2015). Differences in posterior distributions were produced using the BESTmcmc() function with default parameters and broad priors (priors = NULL). This procedure uses a Bayesian Markov Chain Monte Carlo (MCMC) procedure implemented in JAGS (version 4.3.0) using the package rjags (version 4.12), which generated 100,000 MCMC draws with 1,000 burn in steps (Plummer, 2003, 2021).
2.4.2.2. Bayesian analyses
The brms package (version 2.16.3) was used to perform a Bayesian alternative to the analysis of variance to compare parameter values distributions (, , , percent guild richness) between all communities. This analysis was applied using only guilds with to focus analysis on consumer guild dynamics. The comparison for only included guilds for which body size data could be obtained (133 out of 189 total guilds across all communities). The model call for these tests were specified as brm(var ~stage, data), where var represents , , , or percent guild richness. For all Bayesian comparisons made in the brms or BEST packages, if the difference between 95% credible intervals for the posterior distributions between sets of guild properties was not equal to zero, then the groups compared are considered credibly different. The term credible is used here in lieu of significant to avoid confusion arising from the use of significance in relation to the p-value in null hypothesis significance testing.
The brms package was also used to implement a Bayesian regression analysis to assess the relationships between and other guild-level network parameters: , percent guild richness, and , for each community. Bayesian linear regression was performed on the subset of guilds for which body size data could be collected, but did not exclude guilds with . Bayesian models in brms were implemented in Stan using rstan (Bürkner, 2017, 2018; Carpenter et al., 2017; Stan Development Team, 2021).
The brm() function was used with default parameters and broad priors (priors = NULL), and models were specified as for each stage, where param represented , percent guild richness, and . Differences in posterior interval estimates were generated from 4,000 MCMC draws with 4,000 burn in steps. All code for analyses can be found in https://github.com/Roxanne-Banker/RIME.
A final Bayesian linear regression was performed between and for trophospecies (see Roopnarine and Dineen, 2018) from the trophic network reconstruction of a modern Jamaican reef community obtained from Roopnarine and Hertog (2012). Trophospecies as defined in Roopnarine and Dineen (2018) represent multiple species that were collapsed into a single unit when they shared exactly the same prey and predators. By comparing the Jamaican reef to Mesozoic communities that span gradients of primary production and functional diversity, we can begin to assess large scale patterns and drivers of community structure. Insights from this analysis can in turn be used to build our understanding of how to select for network structures that have positive functional outcomes for community health and stability.
2.5. Sensitivity analyses
We conducted randomization tests to examine the sensitivity of our results to possible errors in assigning guild interactions. Given the density and functional diversity of the stage networks, the possibility arises that some assigned links were not present in reality, or real links were omitted or unrecognized. We did not consider the re-assignment of species to guilds, as we consider it unlikely that taxa would be mistakenly assigned among functional groups, particularly given that many such groups have narrow phylogenetic diversity (e.g., guilds dominated by ammonites, or those by marine reptiles).
Randomizations were conducted by randomly selecting and re-assigning a fixed proportion of links from the binary adjacency matrices of each stage. The predation adjacency matrix is a binary guild by guild matrix, where an entry of 1 indicates that the guild in row i preys on species in the guild in column j. Elements are otherwise zero. The total number of guild interactions vary among the stages as follows: Anisian—11,025; Carnian—10,609; Bathonian—13,689; Aptian—11,236. Ten and 15% of interactions were randomized for each stage, and this was repeated 30 times for each level of randomization. A SLN was derived from each randomized matrix. We then compared the set of ntp distributions for each randomization level using the Bayesian techniques outlined above.
3. Results
3.1. Broad changes in Mesozoic trophic networks
Mesozoic stage trophic networks reconstructed here differed notably in terms of species and guild diversity, and trophic network metrics (Figure 1). Overall, while trophic network measures were distinct from one another, there was no clear temporal trend for increasingly younger communities from the Anisian to the Aptian (Table 1). The Carnian network had the highest species richness but lowest guild richness. The fewest number of functional groups were recovered in the Aptian. Although the Anisian was the least species rich, the Bathonian had the lowest network connectance and link density of all communities (Table 1).
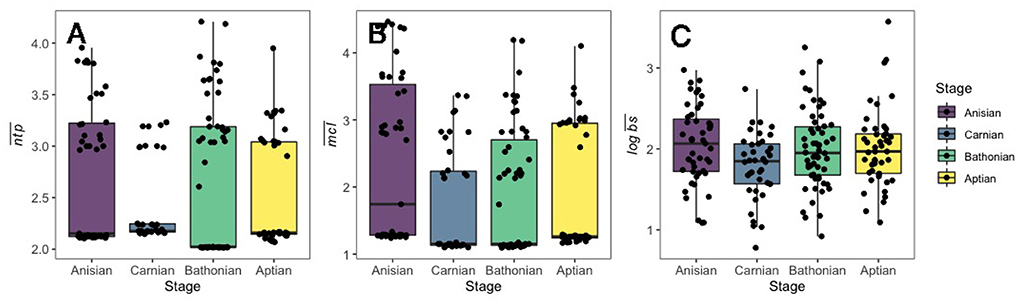
Figure 1. Boxplots displayed for (A) , (B) , and (C) for guilds in Mesozoic communities. Data only shown for guilds with associated body size data, and for those with ntp >2.0. The number of guilds displayed in this figure for each stage are as follows: Anisian: 47; Carnian: 38; Bathonian: 58; Aptian: 46.
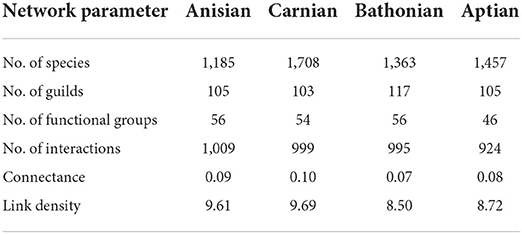
Table 1. Summary of guild-level food web network measures representing Anisian, Carnian, Bathonian, and Aptian communities.
There was a credible decrease in the distribution of mean guild ntp () in the interval between the Anisian and Carnian stages (Figure 2). In contrast, there was a credible increase of guild from the Carnian to the Bathonian, followed by a slight, non-credible decrease in between the Bathonian and Aptian (Figure 2). The only shift that occurred between sequential communities for mean chain length () was a credible increase from the Anisian to the Carnian. Mean body size () was credibly higher in the Anisian compared to the Carnian, and there was also a credible decrease between the Carnian and Bathonian (Figure 2). Comparisons of percent guild richness did not reveal any credible differences in this parameter between stages (Supplementary Table 2). Overall, there was a credible decrease in , , and from the Anisian to the Carnian. This was followed by a credible increase in and from the Carnian to Bathonian. Details of posterior distributions and differences in posterior distributions of these parameters between stages can be found in Supplementary Tables 1, 2, respectively.
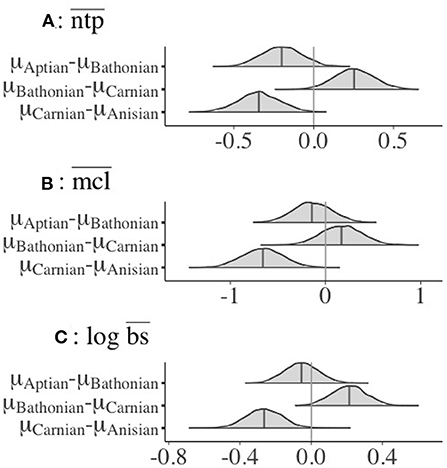
Figure 2. Differences in posterior interval estimates from 4,000 post-warmup MCMC draws for (A) , (B) , and (C) for guilds in all Mesozoic communities. Data only shown for guilds with associated body size data, and for those with ntp >2.0. Colored areas represent the 95% credible interval for that parameter (Supplementary Table 2).
3.2. Parameter differences between extinct, persistent, and new guilds
Pairwise comparisons of parameters between stages for guilds that were categorized as persistent, new, or extinct showed that distributions were dynamic. The most consistent pattern is that guilds that did not persist between stages always had credibly higher values than guilds that persisted from the previous stage (Figure 3). The relationship between guilds that persisted between stages, and those newly originated in the later stage, was more variable. Newly originated guilds had credibly higher values than persistent guilds in both the Bathonian and Aptian, but not the Carnian. Guilds that persisted from the Bathonian to Aptian had credibly higher values in the Aptian than the Bathonian (Figure 3). Guilds that disappeared after the Anisian had credibly higher than guilds that were new in the Carnian.
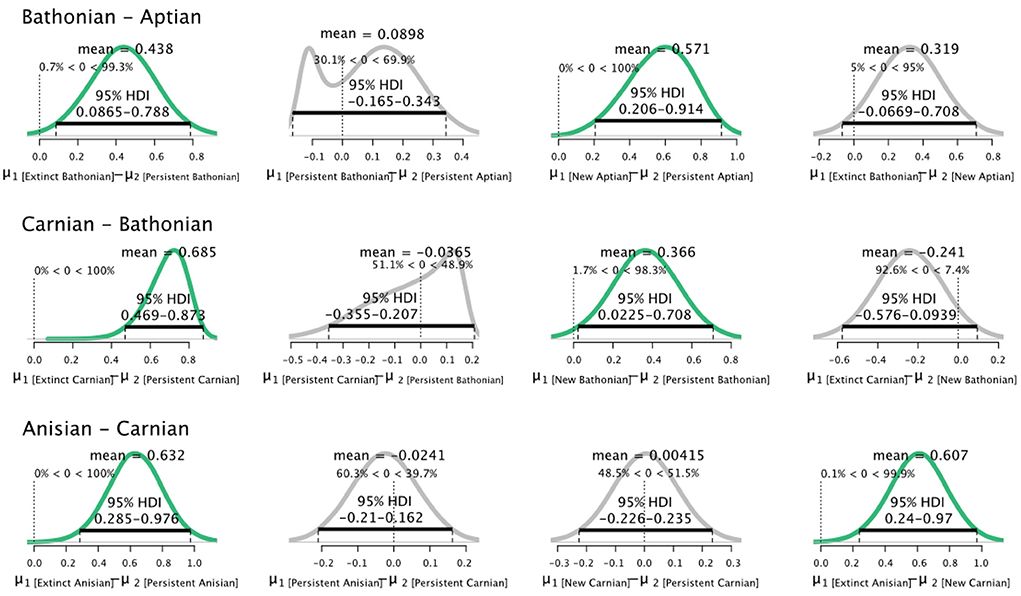
Figure 3. Differences in posterior distributions of for guilds that were extinct, persisted, or were new between sequential pairs of communities. Bathonian–Aptian (top), Carnian–Bathonian (middle), Anisian–Carnian (bottom). The mean is shown for each resulting distribution, as is the 95% High Density Interval (black bar). Finally, the percentage of data that falls below and above zero is shown on the small vertical dotted line.
A similar pattern comparing non-persistent to persistent guilds was found for percent guild richness. Non-persistent guilds always had credibly greater values of percent guild richness than persistent guilds for all pairs of successive stages. Guilds newly originated in our series also had higher percent guild richness than guilds that had persisted from an earlier stage (Figure 4). Notably, guilds that did not persist from the Bathonian to the Aptian had credibly higher percent guild richness than guilds that first appeared in Aptian. The analysis comparing extinct, persistent, and new guild parameter distributions was also applied to , but revealed few differences between populations (data not shown).
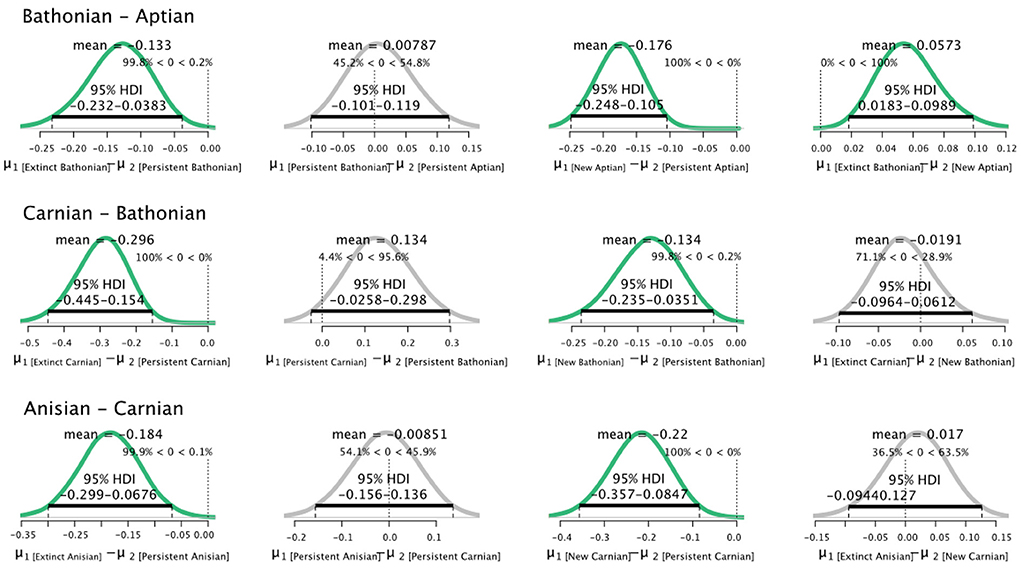
Figure 4. Differences in posterior distributions of percent guild richness for guilds that went extinct, persisted, or were new between pairs of communities. Bathonian–Aptian (top), Carnian–Bathonian (middle), Anisian–Carnian (bottom). The mean is shown for each resulting distribution, as is the 95% High Density Interval (black bar). Finally, the percentage of data that falls below and above zero is shown on the small vertical dotted line.
3.3. Relationship between trophic position and other guild parameters
We applied Bayesian multiple regression to determine which guild measures might have an affect on (Supplementary Table 3). Results indicate that there is a credible relationship between and , and this relationship differs between the Bathonian as compared to the Anisian and Aptian, which are very similar. There is not a well-resolved relationship in the Carnian (Figure 5, Table 2). The Bathonian stage displays the steepest slope for the relationship, which is to be expected given that this network also has the highest values. The Anisian, Aptian, and Carnian had lower slopes and were similar to one another. Finally, the modern Jamaican reef network had a slope that was most similar to the Bathonian in space (Figure 5, Table 2).
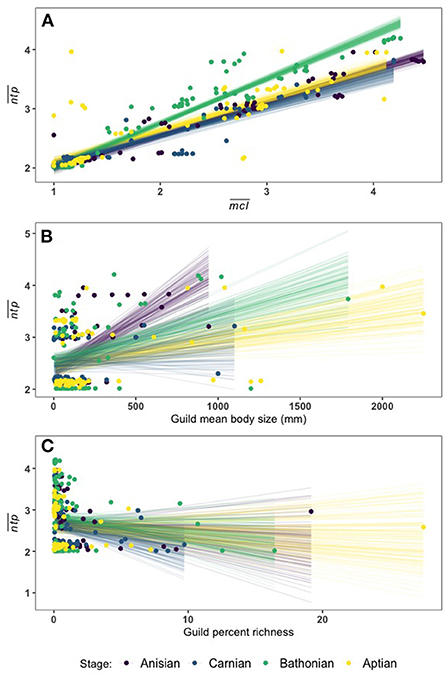
Figure 5. Linear fit lines from 100 MCMC draws relating to (A), (B), and percent guild richness (C). A full report of posterior distributions for linear model parameters can be found in Supplementary Table 3.
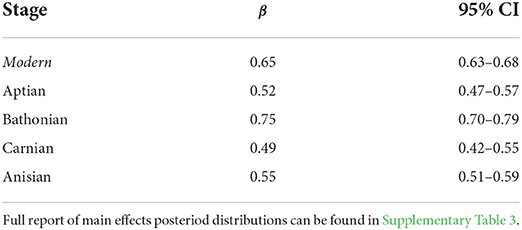
Table 2. Summary of posterior distributions for slopes (β) from the Bayesian linear regressions between and for Mesozoic and modern communities.
There is also a credible relationship between and the logarithm of body size (. Though it is less well defined than the relationship between and , each stage has a distinct relationship, with the exception again of the Carnian (Figure 5). The Anisian network has the steepest size slope, while the Bathonian stage had the second highest slope, and the Aptian had the lowest slope (Supplementary Table 3). There is no credible relationship between and percent guild richness as indicated by the spread of linear fit estimates (Figure 5, Supplementary Table 3).
3.4. Persistent guild trophic position in different communities
To determine how trophic position might vary for the same guild between communities, we plotted for guilds that occurred in all four communities reconstructed for this study (Figure 6), and statistically compared distributions of these guilds between communities. It is clear that a given guild may have a different network trophic position in different community contexts, i.e., when different combinations of guilds are present in their environment. However, this did not cause distributions of to credibly differ from one another for guilds that persisted in all communities (Supplementary Table 4), indicating that at least among persistent guilds, space is largely maintained between communities even if individual guilds undergo change.
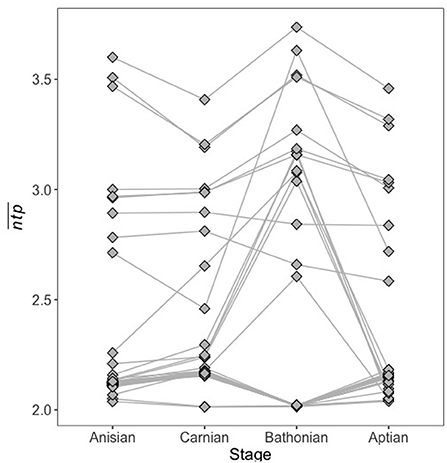
Figure 6. Guild for guilds that occurred in all four stages. for the same guild may vary greatly depending on what other guilds are present in the community at the same time.
3.5. Sensitivity analyses
Randomization tests were performed to determine the extent to which possible errors in guild interaction assignments may have affected results reported here. For the 10 and 15% randomizations, new distributions of from sequential stages were compared to one another to determine whether relationships between stages had changed (Supplementary Figures 1, 3), thus altering the overall conclusions. We also compared distributions of from randomized webs to the original distributions to determine how much each stage varied from the original data sets (Supplementary Figures 2, 4). We found that all stages in both 10 and 15% randomization scenarios increased significantly in (Supplementary Figures 2, 4) and that this shift was greater in magnitude for the 15% than the 10% randomization.
At the same time, when we compared the randomized distributions of sequential stages to one another, we recovered the same patterns of increase and decrease as was reported from the non randomized food webs (Supplementary Figures 1, 3). Therefore, while incorrect guild assignments do affect the community distributions of , the changes are similar across stages and do not alter the interpretations of the results and conclusions reported here.
4. Discussion
There are many practical, moral, and aesthetic reasons for preserving natural systems that are under stress as human-driven threats to biodiversity and ecosystem functioning increase in their numbers and intensities. However, species conservation alone is not a solution to biodiversity loss stemming from the climate crisis (Gallagher et al., 2013; Pimiento et al., 2020b). The persistence of individual taxa and its impact on ecological processes is dependent upon the many networks of antagonistic and mutualistic interactions in an ecosystem (Tylianakis et al., 2010). The functions and processes that emerge from those networks are themselves fundamental to the persistence and health of both natural and human systems, and the members embedded within.
Here we show that community structure varied significantly over the course of the Mesozoic, as illustrated by shifts in stage-level distributions of guild parameters and changing relationships between these parameters. When looking at the Mesozoic communities only, the Bathonian displays an unusual trophic structure in space. When compared to a modern Jamaican reef community, we found that the Bathonian trophic structure instead resembles this more modern ecosystem (Figure 7). Thus, not only did we not find a consistent trophic structure among communities investigated, but there is also not a directional change toward increasingly more modern ecosystem structure in the Mesozoic. The fact that the modern reef network has an relationship that is more similar to the Bathonian rather than the Aptian, and that the Aptian is more similar to the Anisian, implies that the nature of this relationship, and the trophic structure that it describes, is determined by several interacting factors including primary production, functional diversity, and size distributions of consumers. Conservation science has long recognized the central importance of these factors in ecosystem health and functioning. But an explicit understanding of how primary production, functional diversity, and large consumers influence community structure, and therefore persistence, is lacking. Clarifying how these components influence ecosystem structure is a necessary step to operationalizing our understanding of complex ecological networks to promote resilience, or even restore degraded natural systems.
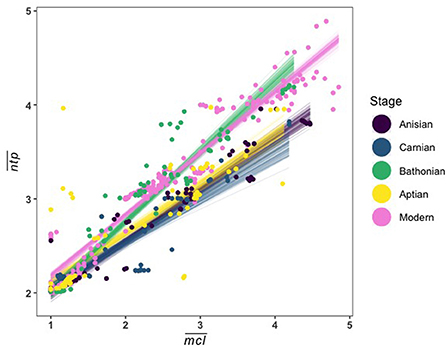
Figure 7. Linear fit lines from 100 MCMC draws relating guild mean and for all Mesozoic communities and a modern Jamaican coral reef.
4.1. Changing ecology and food web structure
4.1.1. Guild parameters and the Mesozoic Marine Revolution
The Permian-Triassic Mass Extinction (PTME) eliminated 69% of marine genera and was hence a transformative event for marine systems that was highly selective against stationary epifauna and other less energetically intensive life modes, resulting in liberated ecospace for more competitive successors to proliferate during the Mesozoic (Bush and Bambach, 2011; Dineen et al., 2019). In addition to changing guild diversity, there was a notable decrease in , , and between the Anisian and Carnian stages. These Carnian shifts of guild parameters may represent a community level signal of the Carnian Pluvial Event (CPE), a period of time 234 to 232 Ma that was characterized by an enhanced hydrological cycle and elevated marine extinction (Ogg, 2015; Miller et al., 2017; Li et al., 2020). However, more work is required to demonstrate definitively whether or not Carnian guild level patterns (, , ) represent a signal of the CPE. For example, we hypothesize that reconstructing Carnian trophic networks at a finer temporal resolution in the future will likely reveal that the relationship between and other guild parameters are better resolved in the Early Carnian, only to breakdown in the later Carnian during the actual extinction event.
Overall, all communities except for the Carnian displayed a clear relationship between trophic position () and body size (), as is observed in modern systems (Robinson and Baum, 2016). The decrease in slope of for progressively younger communities was driven by the appearance of increasingly large body-sized guilds of top consumers throughout the Mesozoic, culminating in the Aptian (Figure 5). Larger body sizes of high level consumers must be supported by enhanced production and biomass at lower trophic levels; therefore the decreasing slope of is likely an ecological signal of the secular increase in primary production observed over the course of the Mesozoic (Knoll and Follows, 2016; Lowery et al., 2020; Martin and Servais, 2020; Antell and Saupe, 2021; Rojas et al., 2021). Thus, results presented here provide direct evidence for escalation, and agree with broad taxonomic patterns reported for the MMR, even considering early examples of megafaunal predation in the Early Triassic (Jiang et al., 2020; Liu et al., 2021). As the energy base for marine ecosystems increased during the Mesozoic in the form of enhanced primary production, predators at higher trophic levels evolved increasingly powerful adaptations, such as high mobility and large body size, to successfully exploit resources.
Differences in the relationship between and mean food chain length () in each stage reveals clear changes in food web dynamics between communities (Figure 8). Guilds at a given were feeding more often at higher trophic levels than lower trophic levels in the Bathonian as compared to the Anisian and Aptian. In other words, top consumers in the Bathonian stage were exhibiting less trophic omnivory (Pimm and Lawton, 1978) than guilds in the Anisian and Aptian. We propose that these top-heavy food chains in the Bathonian were enabled by the significant increase in pelagic primary production from the Triassic to the Jurassic (Knoll and Follows, 2016). It is well-established that the amount of energy entering a trophic level (via consumption) will not be entirely available at the next trophic level because there is energetic loss through respiration as heat and through the expulsion of waste (Pimm, 1982). Therefore, the hierarchical organization of consumers, and particularly the length of food chains, is enabled or restricted by the amount of primary production in an ecosystem (Lindeman, 1942; Oksanen et al., 1981; Kaunzinger and Morin, 1998). The fact that Bathonian communities were able to sustain top consumers that fed more frequently at higher trophic levels indicates that enough energy was being transferred through lower trophic levels to top consumers even though they did not receive the benefit of high ecological efficiency by feeding at lower trophic levels.
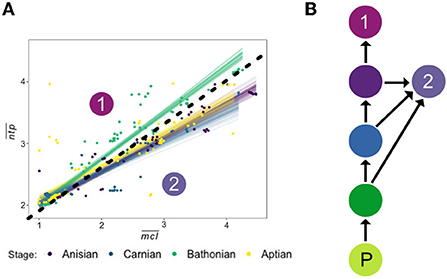
Figure 8. (A) Recreation of Figure 6 (top) representing the relationship between and for all Mesozoic communities. Drawn on the plot is a line delineating two groups referenced in the Discussion, which include the Bathonian in Group 1, and the Anisian, Carnian, and Aptian in Group 2. (B) Schematic diagram of proposed difference in food chain vs. in Group 1 and Group 2. Where in Group 1 the top consumer feeds only high in the food chain, the top consumer of Group 2 displays trophic omnivory by feeding on intermediate consumers lower in the trophic chain. P, primary producer.
After the Bathonian, trophic omnivory re-expanded in the Aptian network, as evidenced by the return to a slope in space that was more similar to those recovered for the Anisian and Carnian. But if enhanced primary production in the Jurassic is the cause for the increase in slope from the Triassic to the Jurassic, why does this slope decrease again in the Aptian (Cretaceous)? In the Bathonian, the largest consumers had the highest values, indicating that these predators were feeding primarily on other guilds that were at the ends of long food chains (Figure 5). The guilds with the largest body sizes in the Aptian, however, were larger than those in the Bathonian and had intermediate values of ~3.0. This indicates that these guilds with very large body sizes in the Aptian were feeding at the end of shorter food chains than their smaller Bathonian counterparts. Trophic omnivory makes ecological sense for these large Aptian consumer guilds given their identities: two guilds of sharks and one guild of fast predatory fish. Sharks in modern reefs are well-known to feed on a variety of prey that occupy a range of trophic levels (Hussey et al., 2015; Bond et al., 2018), which means that they do not often occupy the highest trophic position in an ecosystem (Roopnarine and Dineen, 2018). Isotopic evidence confirms that while true apex predatory sharks may occupy high trophic levels, many reef sharks are mesopredators that occupy a similar trophic position to carnivorous bony fish (Roff et al., 2016), a result that is also recovered in the Aptian stage studied here. Thus, the MMR might also represent a significant rise of powerful mesopredators that play an important role in moderating trophic structure. Further work is required to better characterize the role of mesopredation in determining ecosystem structure, and how this relationship has changed over geologic time.
The difference in contribution of top consumer guilds, in the Bathonian versus the Aptian communities, to short food chains can be attributed to different size and ecologies of the guilds themselves. In the Bathonian, the four largest consumer guilds are reptiles that have high values, and one larger shark guild that also has a lower . In the Aptian, the four largest consumers are two guilds of sharks, one of carnivorous bony fish, and one marine reptile, where the reptile has the smallest body size of the four but the highest . Taken together, this evidence suggests that the predatory marine reptiles, albeit relatively smaller than their Cretaceous shark counterparts, contributed to longer food chains. In the Aptian, the functional group of sharks that was present in the Bathonian saw an increase in body size and was joined by two additional very large predatory guilds that contributed to an increase in short food chains. It remains unclear whether body size alone accounts for differences in contributions to short food chains. Given that dentition of Cretaceous sharks and Mesozoic marine reptiles were found to be distinct in PCA space (Ciampaglio et al., 2005), it is possible that some difference in feeding ecology not related to body size may also explain the difference in trophic omnivory between these two groups. Further work evaluating how body size affects chain length distributions for consumers would be required to resolve this question. Overall, the decrease in slope from the Bathonian to the Aptian in space is due to, at least in part, differing size structure of top consumer guilds in each network.
4.1.2. Guild traits that affect extinction risk
The fact that extinct guilds have high and lower guild percent richness could imply a causal link between these parameters, in that less rich guilds may be more likely to not persist (Figures 3, 4). However, the lack of credible relationship between and guild percent richness for any stage indicates that a given high guild is not necessarily less rich (Figure 5). Therefore, low richness guilds may have failed to persist because of enhanced extinction risk inherent to ecological functions that do not display high redundancy in their community (Pimiento et al., 2020a). This result agrees with previous studies assessing the effect of rarity and taxonomic traits on extinction risk (McKinney, 1997, 2003; Harnik, 2011; Tietje, 2019). But when high guilds failed to persist, they did so because of either intrinsic properties that make them more vulnerable during a perturbation, such as bottom-up disturbances in the food web or habitat restriction (Harnik et al., 2012; Pimiento et al., 2017).
Of great interest to modern conservationists is how to predict which taxa or ecological functions may be most affected, or driven to extinction, as the current climate crisis progresses. Regardless of the stage, top consumers (high guilds) in the Mesozoic always experienced more turnover in the networks examined here. In modern ecosystems, humans pose additional risk to top consumers by directly hunting predators, exploiting common prey, or disrupting key habitat (Strong and Frank, 2010; Oriol-Cotterill et al., 2015), and are top predators in marine systems (Roopnarine, 2014). Predators in turn play an important role in engineering community structure through top-down feedbacks that involve moderating mesopredators in trophic networks (Borrvall and Ebenman, 2006; Darimont et al., 2015). These lines of evidence taken together support further inquiry into investigating how top predator restoration may confer positive change or stability to the ecosystems in which they reside, particularly given their enhanced extinction risk, exacerbated with human interference, and their affect on ecosystem structure (Clemente et al., 2010; Donohue et al., 2017; Wallach et al., 2017). Future conservation efforts should also consider what functions are important to maintain the health and stability of ecosystems, and which of those functions are most at risk of going extinct in the near future due to low redundancy. Further in depth research into what structural network properties cause extinction of different functions (guilds) in a community is necessary to further resolve these questions.
4.1.3. Trophic position is context dependent
The mutable nature of trophic position, even for a single guild or taxon, has important implications for community functioning and stability, and hence species conservation. Within an ecosystem, the structural complexity of the system, that is, its functional diversity, how richness is apportioned among functions, and how those functions interact with one another, determine higher level community properties such as stability and persistence (Roopnarine et al., 2019). Removing or adding taxa or guilds from a trophic network will affect all other interactions within the network to varying degrees, which in turn may confer or reduce community stability (Dunne et al., 2002; Allesina et al., 2009). Whether or not a given ecosystem resembles historical or fossil antecedents, interactions may be sufficiently affected to have altered food web structure such that reintroducing an extirpated species will not be successful, or will not confer the desired effect. For example, Roopnarine et al. (2019) (this volume) examine the extent to which grazing by the now extinct Stellar's Seacow may have buffered giant kelp forests against transformation into the urchin barren state, finding that the positive or negative nature of the mammal's impact depends on both the perturbation, and the presence of other species.
Results from this study align with recent calls to address the recovery of trophic structure when planning restoration efforts in terrestrial, aquatic, and marine systems (Dobson et al., 2006; El-Sabaawi, 2018; Loch et al., 2020). By evaluating patterns of interactions among incumbents that prevent reintroduction or restoration efforts, we can better target species or functions in a community that will help to stabilize the ecosystem from within, thus spurring restoration and long term resilience. Although the present study focuses on paleocommunities that are too ancient to be considered baselines for any modern system, comparing food web structure and dynamics of sequential communities against a backdrop of significant global change, the MMR, can help us to draw insights about the dynamics of modern marine communities.
4.1.4. Lessons from Mesozoic food webs
We also observed commonalities among networks: between all pairs of successive stages, guilds that did not persist had consistently higher values and lower richness. High guilds were not necessarily all less rich though, which implies that low richness guilds that failed to persist did so because functions with less redundancy are more likely to disappear, while high guilds went extinct perhaps because of factors intrinsic to their ecology. Results presented here overwhelmingly suggest that community trophic structure varied considerably during the Mesozoic, which stands in contrast to previous studies that suggest a “Phanerozoic community structure” was in place by the Cambrian (Dunne et al., 2008). While there are certainly features and processes in common among biological communities, such as patterns of extinction and functional turnover addressed here, caution must be exercised in treating communities or even functional groups interchangeably. For example, even though the Anisian and Aptian communities appear similar in space, there are clear differences in the energetics and function of these communities when considering the primary production regimes experienced by each, and the maximum sizes of consumers recovered.
A question central to community ecology is whether there are general principles underlying the organization of marine communities, or ecological communities in general? Such principles appear to operate during community assembly, and communities and other complex systems often share features of both structure, function, and perhaps even evolution. But how do those principles arise, how variable are they, and what are the implications for ecosystem conservation and regeneration? Addressing these questions requires the comparison of marine ecological systems at multiple points in time, observing or modeling the dynamics of communities and, with regard to living communities, the monitoring of community structure and dynamics.
In this paper, we addressed the first of these requirements by reconstructing and modeling several Mesozoic stage ecological networks. In contrast to previous work that has suggested that Phanerozoic marine community structure was in place by the Cambrian (Dunne et al., 2008), results here suggest otherwise. Dunne et al. (2008) reconstructed significantly older middle Cambrian communities from the Chenjiang and Burgess Shale lagerstätte, arguing that those communities were similar enough to modern marine systems to support a hypothesis that any general principles of marine community organization may have been established by the early Phanerozoic. Although the reconstructions presented here are methodologically incommensurate with those of Dunne et al. (2008), the Tethyan Mesozoic communities display significant structural variability.
4.2. Comparing modern and Mesozoic network structure
The Carnian ecosystem differed somewhat from the Anisian and Aptian, but it is likely that those differences stemmed from both the ongoing decline of Paleozoic functionality and its replacement by Mesozoic groups during the later Triassic, as well as the CPE, which our stage-level temporal resolution cannot currently resolve. The Bathonian ecosystem, however, is exceptional in several of its properties. Its significant differences from both the earlier Triassic and later Cretaceous systems is consistent with the MMR hypothesis that the Jurassic was a time of notable innovation, and ecological turnover and diversification (Vermeij, 2008; Close et al., 2015; Reeves et al., 2021). Those same properties that distinguish the Bathonian from the other Mesozoic data are not unique though. Comparison of the Mesozoic systems to a similarly high resolution modern coral reef system from Jamaica shows that in some respects, the Bathonian was remarkably modern (Figure 7).
There are several potential explanations for this. First, the Bathonian-modern similarity could be purely coincidental. Second, the similarity actually represents a type of marine community organization in which long food chains are supported by a diverse producer and primary consumer base. Moreover, the Aptian system, although structurally similar to the older Triassic systems, differs in several fundamental ways, including large bodied high trophic position vertebrate predators supported by high levels of omnivory, that is, feeding at multiple nodes along food chains (Pimm and Lawton, 1978). The Aptian may therefore also resemble some types of modern systems, for example open ocean systems dominated by large bodied cartilaginous and bony fish, and marine mammals, although that cannot be tested at present without commensurate reconstructions of putative modern analogs. Regardless of the support for either hypothesis, it is clear that there is structural and organizational variability of marine community networks.
4.2.1. The Bathonian, Aptian, and modern Jamaica
The data comprising the Jamaican trophic network represent an approximately 50 year time period ending in 2011 (Roopnarine and Hertog, 2012; Roopnarine and Dineen, 2018), which means that these data represent a system that was already heavily affected by human activity (O'Dea et al., 2020). In Jamaican ecosystems, anthropogenic stressors, including agriculture, coastal development, fishing, and climate change have together caused major declines in significant reef groups, such as corals, fish, and macroalgae (Gardner et al., 2003; Mora, 2008; Hardt, 2009). Powerful top predators from these systems have not been exempt, and denticle accumulation rates suggest a 71% decline in shark abundance since the mid-Holocene, and fast, pelagic sharks were particularly affected (Dillon et al., 2021). In the present study, we found that mostly large guilds of sharks and predatory fish in the Aptian were responsible for the higher proportion of short food chains relative to the Bathonian, and many large, predatory sharks have been largely extirpated from the modern reef community.
Given this, would a pre-anthropogenic reconstruction of the Jamaican trophic network remain similar to the Bathonian? Or would the addition of large top consumers drive the slope for the modern community toward the Aptian by creating more short trophic chains? It is already established that human occupation of Jamaica had measurable effects on reefs even in pre-European times (Hardt, 2009). If a pre-anthropogenic reconstruction of the Jamaican food web that included larger groups of top predators still recovered a slope similar to the Bathonian, then this would imply that there are additional, significant controlling factors on short versus long chains other than primary production and top consumer size (Figure 8). Moreover, if a pre-anthropogenic Jamaican reef reconstruction did yield an Aptian-like slope, this would underscore the consensus that powerful top consumers are extremely important to ecosystem structure (Heck and Valentine, 2007; Heithaus et al., 2008; Shackell et al., 2010; Ritchie et al., 2012; Rodŕıguez-Lozano et al., 2015; Antiqueira et al., 2018). Although further work reconstructing a pre-human Jamaican reef trophic network would be needed to evaluate these hypotheses, these results point to a clear mechanism through which top consumers can mediate the stability of an ecosystem by affecting the structure of trophic interactions in a community.
Questions remain, but it is clear that there is a great deal of variation of the distributions of network trophic position and maximum chain length in natural communities, and these qualities are an important aspect of describing food web ecology and energy transfer for modern and fossil systems. The idea that powerful consumers play a central role in the communities in which they are embedded is not new. For example, the top-down effects of wolf reintroduction on riparian watersheds in Yellowstone national park are well recognized (Beschta and Ripple, 2016). But, does this transition represent a return to the pre-human state of this system, or a novel, human-influenced state that was stabilized with the reintroduction of a predator? In regards to the Jamaican reef system studied here, to what extent would recovery of shark diversity and abundance affect the relationship? And do these slopes correspond to community functioning or stability? Future work elucidating the relationship between guild parameter distributions and community stability may be a promising avenue to assess community stability in a computationally tractable manner. Reconstructing a pre-human Jamaican food web, and comparing community structure and stability between the pre- and post-human reef communities would be necessary to resolve these questions.
4.3. Network perspectives on restoration
Ecosystems and their trophic structures, or patterns of interactions among species, are a result of the taxa present, the functions that they represent, and how richness is apportioned among those functions. Here we provide evidence that ecosystem trophic structure is also affected by enabling factors, such as primary production, and selective agencies, such as the activity of top consumers. Primary production may enable long chains by easing constraints of ecological efficiency in progressively longer food chains, while the activity of powerful, generalist consumers decrease the proportion of long chains in a network (Vermeij, 2013; Rosenblatt and Schmitz, 2016).
We propose that vigorous primary production in both the Bathonian and Jamaican systems enables trophic structure with a high proportion of long chains. This may initially appear inconsistent with the assumption that the primary producer base of an ecosystem is the sole determinant of the proportion of long chains in a network, as the relationship of the Aptian community from the productive Cretaceous resembles the Anisian of the less productive Triassic. However, this is because the maximum body size of top consumers, not only primary production, has a significant effect on the amount of long versus short chains in a trophic network. For example, the Bathonian and Aptian experienced a level of planktonic diversity that was likely much higher than was experienced by ecosystems of the Triassic (Knoll and Follows, 2016; Benton and Wu, 2022). This high level of production enabled the presence of long chains, as observed in the Bathonian, but the novel presence of very large consumers in the Aptian lead to a greater degree of short chains, or trophic omnivory by top consumers, in this community.
This is an important finding for conservation because it has implications for how we understand community structure in modern systems: given the loss of large top consumers in the oceans today, what is the effect of the loss of these taxa on the balance of short versus long chains? Does a loss of large consumers necessarily lead to a loss of short food chains? It is possible that large body size necessitates participation in short food chains to achieve greater ecological efficiency and sustain larger body masses, but further work is required to evaluate this hypothesis. These lines of evidence taken together suggest that while the Aptian and Anisian had a similar balance of short and long chains, these communities were energetically distinct and likely functioned very differently from one another given the role of powerful top consumers in mobilizing and recycling nutrients in their ecosystems (Vermeij, 2019). Future work should focus on the specific effect that large, vigorous consumers have on community network structure and dynamics.
Results from this study supports the need for thinking framed around networks in future conservation efforts. Here we found that while the function of different guilds remained the same, their trophic position in networks was subject to variation depending on which other guilds were present in their system. This suggests that restoration, and specifically reintroduction and rewilding efforts, may be hampered because the trophic network from which a species was extirpated may be so altered by extinction, degradation, and other processes that the interactions that supported that species are weakened or totally altered. So even while restoring a species or their ecological function in an ecosystem may be the goal of a project, there may be complex mechanisms underlying why reintroduction is more difficult than expected. This necessitates a better understanding of how to restore interactions in order to restore important ecosystem functions in a community. Similarly, these findings underscore the importance of documenting previous ecosystem states (sometimes referred to as “baseline”) prior to undertaking restoration efforts.
Network thinking can also inform how we think about ecosystem restoration after the removal of a top predator or following an invasion event. Lionfish (i.e., Pterois sp.) are invasive mesopredators in Caribbean ecosystems that have broad diets that feed on a range of taxa and put additional pressure on food chains reducing abundance and diversity of native reef fish (Albins and Hixon, 2008; Green et al., 2012; Albins, 2015). Lionfish have been very successful invaders in the Caribbean and Atlantic, not least of all because they themselves have very few predators in these ecosystems and most of their fish prey fail to react to them as predators (Lönnstedt and McCormick, 2013). As discussed previously, many of the top predators (i.e., sharks) from the Caribbean have been over exploited since pre-European times. Therefore, it is possible that pre-European Caribbean reefs may have been more resistant to invasions by species such as the lionfish that are voracious predators, but are smaller and ecologically distinct from sharks. While lionfish are functionally similar to many other mesopredators in the Caribbean, such as reef sharks, they have a different effect on community structure because they do not have any predators (top down controls) exerted on them in this system (Arias-González et al., 2011; Diller et al., 2014). While it is beyond the scope of this study to advise specific conservation action, results from this study support investigating how apex predator extirpation in the Caribbean may have affected trophic network resilience to lionfish invasion.
5. Concluding remarks
Understanding the complexities of ecosystem structure alone will not inform conservation efforts as we face the mounting climate and biodiversity crises. But by evaluating how factors such as primary production and large consumers affect food web structure, and how food web structure determines system stability and therefore species persistence, scientists can begin to consider ecosystem restoration from a network-stability perspective. Ecological networks are inherently complex and simple questions regarding their variability, evolution and dynamics remain unsatisfactorily answered. Here we addressed both variability and evolution by reconstructing, describing and comparing four large-scale Mesozoic marine networks from a single oceanic basin, spanning more than 130 million years. We uncovered considerable variability wherein there are both general principles and notable exceptions. For example, three of the networks (Anisian, Bathonian, Aptian) display significant relationships between species body size and trophic position, with the relationship becoming weaker over time. The Carnian network, however, displays no such relationship. Networks also displayed variable levels of omnivory, as measured by the relationship between trophic position and food chain lengths. This in turn has implications for both the variability of available energy during the Mesozoic and evolutionarily changing abilities of energy fixation and flux through the networks. Given that the Bathonian network most closely resembles a reconstructed modern coral reef network, and that the Aptian was dominated by very large pelagic vertebrate predators, perhaps not dissimilar to some Neogene and modern systems, do comparable levels of variability exist among marine ecosystem networks today? And more broadly, how does community structure translate to functioning, stability, and resilience in marine systems? Clearly these questions can only be answered with increased documentation of modern networks, but our work suggests a positive answer, emphasizing the central role of biotic interactions and their system-level structures in effective species conservation and ecosystem persistence.
Data availability statement
The datasets presented in this study can be found in online repositories. The names of the repository/repositories and accession number(s) can be found at: https://github.com/Roxanne-Banker/RIME.
Author contributions
AD, PR, and CT conceived of the study and contributed to the final manuscript. AD conceptualized and created the food web network guild structure. AD and MS collected and curated the data. PR created simulation code. RB created all R code and led manuscript composition. All authors contributed to data analyses and approved the final submission.
Funding
This work was supported by NSF EAR-1629776 to PR and NSF EAR-1629786 to CT.
Acknowledgments
The authors acknowledge that the California Academy of Sciences, Miami University, and University of Nevada Las Vegas occupy land that is the ancestral homelands of the Ramaytush Ohlone, Kaskaska, and the Nuwuvi, Southern Paiute People, respectively, the vast majority of whom were forcibly removed from their homelands. UC Berkeley sits on the territory of Xučyun (Huichin), the original landscape of the Chochenyo speaking Ohlone people, the successors of the sovereign Verona Band of Alameda County. We acknowledge this painful history and honor their legacy and continuing contributions to better understanding the natural history of the United States.
Conflict of interest
The authors declare that the research was conducted in the absence of any commercial or financial relationships that could be construed as a potential conflict of interest.
Publisher's note
All claims expressed in this article are solely those of the authors and do not necessarily represent those of their affiliated organizations, or those of the publisher, the editors and the reviewers. Any product that may be evaluated in this article, or claim that may be made by its manufacturer, is not guaranteed or endorsed by the publisher.
Supplementary material
The Supplementary Material for this article can be found online at: https://www.frontiersin.org/articles/10.3389/fevo.2022.983374/full#supplementary-material
References
Albins, M. A. (2015). Invasive pacific lionfish pterois volitans reduce abundance and species richness of native Bahamian coral-reef fishes. Mar. Ecol. Prog. Ser. 522, 231–243. doi: 10.3354/meps11159
Albins M. A. and Hixon, M. A.. (2008). Invasive Indo-Pacific lionfish pterois volitans reduce recruitment of Atlantic coral-reef fishes. Mar. Ecol. Prog. Ser. 367, 233–238. doi: 10.3354/meps07620
Allesina, S., Bodini, A., and Pascual, M. (2009). Functional links and robustness in food webs. Philos. Trans. R. Soc. Lond. B Biol. Sci. 364, 1701–1709. doi: 10.1098/rstb.2008.0214
Antell, G. S., and Saupe, E. E. (2021). Bottom-up controls, ecological revolutions and diversification in the oceans through time. Curr. Biol. 31, R1237–R1251. doi: 10.1016/j.cub.2021.08.069
Antiqueira, P. A. P., Petchey, O. L., and Romero, G. Q. (2018). Warming and top predator loss drive ecosystem multifunctionality. Ecol. Lett. 21, 72–82. doi: 10.1111/ele.12873
Arias-González, J. E., González-Gándara, C., Luis Cabrera, J., and Christensen, V. (2011). Predicted impact of the invasive lionfish pterois volitans on the food web of a Caribbean coral reef. Environ. Res. 111, 917–925. doi: 10.1016/j.envres.2011.07.008
Bambach, R. K. (1983). “Ecospace utilization and guilds in marine communities through the Phanerozoic,” in Biotic Interactions in Recent and Fossil Benthic Communities, eds M. J. S. Tevesz and P. L. McCall (Boston, MA: Springer US), 719–746. doi: 10.1007/978-1-4757-0740-3_15
Benton, M. J., and Wu, F. (2022). Triassic revolution. Front Earth Sci. 10:899541. doi: 10.3389/feart.2022.899541
Beschta, R. L., and Ripple, W. J. (2016). Riparian vegetation recovery in yellowstone: the first two decades after wolf reintroduction. Biol. Conserv. 198, 93–103. doi: 10.1016/j.biocon.2016.03.031
Biggs, C. R., Yeager, L. A., Bolser, D. G., Bonsell, C., Dichiera, A. M., Hou, Z., et al. (2020). Does functional redundancy affect ecological stability and resilience? A review and meta-analysis. Ecosphere 11:e03184. doi: 10.1002/ecs2.3184
Blanco, F., Calatayud, J., Martín-Perea, D. M., Domingo, M. S., Menéndez, I., Müller, J., et al. (2021). Punctuated ecological equilibrium in mammal communities over evolutionary time scales. Science 372, 300–303. doi: 10.1126/science.abd5110
Bond, M. E., Valentin-Albanese, J., Babcock, E. A., Hussey, N. E., Heithaus, M. R., and Chapman, D. D. (2018). The trophic ecology of Caribbean reef sharks (Carcharhinus perezi) relative to other large teleost predators on an isolated coral atoll. Mar. Biol. 165:67. doi: 10.1007/s00227-018-3322-2
Borrvall, C., and Ebenman, B. (2006). Early onset of secondary extinctions in ecological communities following the loss of top predators. Ecol. Lett. 9, 435–442. doi: 10.1111/j.1461-0248.2006.00893.x
Brose, U., Berlow, E. L., and Martinez, N. D. (2005). Scaling up keystone effects from simple to complex ecological networks. Ecol. Lett. 8, 1317–1325. doi: 10.1111/j.1461-0248.2005.00838.x
Bürkner, P.-C. (2017). Brms: An R package for Bayesian multilevel models using Stan. J. Stat. Softw. 80, 1–28. doi: 10.18637/jss.v080.i01
Bürkner, P.-C. (2018). Advanced Bayesian multilevel modeling with the R package brms. R J. 10, 395–411. doi: 10.32614/RJ-2018-017
Bush, A. M., and Bambach, R. K. (2011). Paleoecologic megatrends in marine metazoa. Annu. Rev. Earth Planet. Sci. 39, 241–269. doi: 10.1146/annurev-earth-040809-152556
Carpenter, B., Gelman, A., Hoffman, M. D., Lee, D., Goodrich, B., Betancourt, M., et al. (2017). Stan: a probabilistic programming language. J. Stat. Softw. 76, 1–32. doi: 10.18637/jss.v076.i01
Ciampaglio, C. N., Wray, G. A., and Corliss, B. H. (2005). A toothy tale of evolution: convergence in tooth morphology among marine Mesozoic-Cenozoic sharks, reptiles, and mammals. Sediment. Rec. 3. doi: 10.2110/sedred.2005.4.4
Clemente, S., Hernández, J. C., Rodríguez, A., and Brito, A. (2010). Identifying keystone predators and the importance of preserving functional diversity in sublittoral rocky-bottom areas. Mar. Ecol. Prog. Ser. 413, 55–67. doi: 10.3354/meps08700
Close, R. A., Friedman, M., Lloyd, G. T., and Benson, R. B. J. (2015). Evidence for a Mid-Jurassic adaptive radiation in mammals. Curr. Biol. 25, 2137–2142. doi: 10.1016/j.cub.2015.06.047
Darimont, C. T., Fox, C. H., Bryan, H. M., and Reimchen, T. E. (2015). The unique ecology of human predators. Science 349, 858–860. doi: 10.1126/science.aac4249
Diller, J. L., Frazer, T. K., and Jacoby, C. A. (2014). Coping with the lionfish invasion: evidence that naïve, native predators can learn to help. J. Exp. Mar. Bio. Ecol. 455, 45–49. doi: 10.1016/j.jembe.2014.02.014
Dillon, E. M., McCauley, D. J., Morales-Saldaña, J. M., Leonard, N. D., Zhao, J.-X., and O'Dea, A. (2021). Fossil dermal denticles reveal the preexploitation baseline of a Caribbean coral reef shark community. Proc. Natl. Acad. Sci. U.S.A. 118:34230097. doi: 10.1073/pnas.2017735118
Dineen, A. A., Roopnarine, P. D., and Fraiser, M. L. (2019). Ecological continuity and transformation after the Permo-Triassic mass extinction in northeastern Panthalassa. Biol. Lett. 15:20180902. doi: 10.1098/rsbl.2018.0902
Dobson, A., Lodge, D., Alder, J., Cumming, G. S., Keymer, J., McGlade, J., et al. (2006). Habitat loss, trophic collapse, and the decline of ecosystem services. Ecology 87, 1915–1924. doi: 10.1890/0012-9658(2006)87[1915:HLTCAT]2.0.CO;2
Donohue, I., Petchey, O. L., Kéfi, S., Génin, A., Jackson, A. L., Yang, Q., et al. (2017). Loss of predator species, not intermediate consumers, triggers rapid and dramatic extinction cascades. Glob. Chang. Biol. 23, 2962–2972. doi: 10.1111/gcb.13703
Dunne, J. A., Williams, R. J., and Martinez, N. D. (2002). Network structure and biodiversity loss in food webs: robustness increases with connectance. Ecol. Lett. 5, 558–567. doi: 10.1046/j.1461-0248.2002.00354.x
Dunne, J. A., Williams, R. J., Martinez, N. D., Wood, R. A., and Erwin, D. H. (2008). Compilation and network analyses of Cambrian food webs. PLoS Biol. 6:e102. doi: 10.1371/journal.pbio.0060102
El-Sabaawi, R. (2018). Trophic structure in a rapidly urbanizing planet. Funct. Ecol. 32, 1718–1728. doi: 10.1111/1365-2435.13114
Elsberry, L. A., and Bracken, M. E. S. (2021). Functional redundancy buffers mobile invertebrates against the loss of foundation species on rocky shores. Mar. Ecol. Prog. Ser. 673, 43–54. doi: 10.3354/meps13795
Gallagher, R. V., Hughes, L., and Leishman, M. R. (2013). Species loss and gain in communities under future climate change: consequences for functional diversity. Ecography 36, 531–540. doi: 10.1111/j.1600-0587.2012.07514.x
Gardner, T. A., Côté, I. M., Gill, J. A., Grant, A., and Watkinson, A. R. (2003). Long-term region-wide declines in Caribbean corals. Science 301, 958–960. doi: 10.1126/science.1086050
Gibb, H., and Cunningham, S. A. (2011). Habitat contrasts reveal a shift in the trophic position of ant assemblages. J. Anim. Ecol. 80, 119–127. doi: 10.1111/j.1365-2656.2010.01747.x
Green, S. J., Akins, J. L., Maljković, A., and Côté, I. M. (2012). Invasive lionfish drive Atlantic coral reef fish declines. PLoS ONE 7:e32596. doi: 10.1371/journal.pone.0032596
Guidi, L., Chaffron, S., Bittner, L., Eveillard, D., Larhlimi, A., Roux, S., et al. (2016). Plankton networks driving carbon export in the oligotrophic ocean. Nature 532, 465–470. doi: 10.1038/nature16942
Hardt, M. J. (2009). Lessons from the past: the collapse of Jamaican coral reefs. Fish Fish. 10, 143–158. doi: 10.1111/j.1467-2979.2008.00308.x
Harnik, P. G. (2011). Direct and indirect effects of biological factors on extinction risk in fossil bivalves. Proc. Natl. Acad. Sci. U.S.A. 108, 13594–13599. doi: 10.1073/pnas.1100572108
Harnik, P. G., Simpson, C., and Payne, J. L. (2012). Long-term differences in extinction risk among the seven forms of rarity. Proc. Biol. Sci. 279, 4969–4976. doi: 10.1098/rspb.2012.1902
Heck, K. L., and Valentine, J. F. (2007). The primacy of top-down effects in shallow benthic ecosystems. Estuar. Coasts 30, 371–381. doi: 10.1007/BF02819384
Heim, N. A., Knope, M. L., Schaal, E. K., Wang, S. C., and Payne, J. L. (2015). Animal evolution. Cope's rule in the evolution of marine animals. Science 347, 867–870. doi: 10.1126/science.1260065
Heim, N. A., Payne, J. L., Finnegan, S., Knope, M. L., Kowalewski, M., Lyons, S. K., et al. (2017). Hierarchical complexity and the size limits of life. Proc. Biol. Sci. 284:1857. doi: 10.1098/rspb.2017.1039
Heithaus, M. R., Frid, A., Wirsing, A. J., and Worm, B. (2008). Predicting ecological consequences of marine top predator declines. Trends Ecol. Evol. 23, 202–210. doi: 10.1016/j.tree.2008.01.003
Hussey, N. E., MacNeil, M. A., Siple, M. C., Popp, B. N., Dudley, S. F. J., and Fisk, A. T. (2015). Expanded trophic complexity among large sharks. Food Webs 4, 1–7. doi: 10.1016/j.fooweb.2015.04.002
Jiang, D.-Y., Motani, R., Tintori, A., Rieppel, O., Ji, C., Zhou, M., et al. (2020). Evidence supporting predation of 4-m marine reptile by triassic megapredator. iScience 23:101347. doi: 10.1016/j.isci.2020.101347
Kaunzinger, C. M. K., and Morin, P. J. (1998). Productivity controls food-chain properties in microbial communities. Nature 395, 495–497. doi: 10.1038/26741
Knoll, A. H., and Follows, M. J. (2016). A bottom-up perspective on ecosystem change in Mesozoic oceans. Proc. R. Soc. B Biol. Sci. 283:20161755. doi: 10.1098/rspb.2016.1755
Krause, R. A., Stempien, J. A., Kowalewski, M., and Miller, A. I. (2007). Body size estimates from the literature: utility and potential for macroevolutionary studies. Palaios 22, 60–73. doi: 10.2110/palo.2005.p05-122r
Kruschke, J. K. (ed.)., (2015). Doing Bayesian Data Analysis, 2nd Edn. Boston, MA: Academic Press. doi: 10.1016/B978-0-12-405888-0.00014-3
Levi, T., and Wilmers, C. C. (2012). Wolves-coyotes-foxes: a cascade among carnivores. Ecology 93, 921–929. doi: 10.1890/11-0165.1
Li, Z., Chen, Z.-Q., Zhang, F., Ogg, J. G., and Zhao, L. (2020). Global carbon cycle perturbations triggered by volatile volcanism and ecosystem responses during the Carnian pluvial episode (late triassic). Earth-Sci. Rev. 211:103404. doi: 10.1016/j.earscirev.2020.103404
Lindeman, R. L. (1942). The trophic-dynamic aspect of ecology. Ecology 23, 399–417. doi: 10.2307/1930126
Liu, Q., Yang, T., Cheng, L., Benton, M. J., Moon, B. C., Yan, C., et al. (2021). An injured pachypleurosaur (diapsida: Sauropterygia) from the middle triassic luoping biota indicating predation pressure in the mesozoic. Sci. Rep. 11:21818. doi: 10.1038/s41598-021-01309-z
Loch, J. M. H., Walters, L. J., and Cook, G. S. (2020). Recovering trophic structure through habitat restoration: a review. Food Webs 25:e00162. doi: 10.1016/j.fooweb.2020.e00162
Lönnstedt, O. M., and McCormick, M. I. (2013). Ultimate predators: lionfish have evolved to circumvent prey risk assessment abilities. PLoS ONE 8:e75781. doi: 10.1371/journal.pone.0075781
Lowery, C. M., Bown, P. R., Fraass, A. J., and Hull, P. M. (2020). Ecological response of plankton to environmental change: thresholds for extinction. Annu. Rev. Earth Planet. Sci. 48, 403–429. doi: 10.1146/annurev-earth-081619-052818
Martin R. E. and Servais, T.. (2020). Did the evolution of the phytoplankton fuel the diversification of the marine biosphere? Lethaia 53, 5–31. doi: 10.1111/let.12343
Massare, J. A. (1987). Tooth morphology and prey preference of Mesozoic marine reptiles. J. Vert. Paleontol. 7, 121–137. doi: 10.1080/02724634.1987.10011647
May, R. M. (1974). Stability and Complexity in Model Ecosystems, Vol. 1. Princeton University Press. doi: 10.2307/j.ctvs32rq4
McKinney, M. L. (1997). “How do rare species avoid extinction? A paleontological view,” in The Biology of Rarity: Causes and Consequences of Rare–Common Differences, eds W. E. Kunin and K. J. Gaston (Dordrecht: Springer Netherlands), 110–129. doi: 10.1007/978-94-011-5874-9_7
McKinney, M. L. (2003). Extinction vulnerability and selectivity: combining ecological and paleontological views. Annu Rev Ecol Evol Syst. 28, 495–516. doi: 10.1146/annurev.ecolsys.28.1.495
Miller, A. I., Buick, D. P., Bulinski, K. V., Ferguson, C. A., Hendy, A. J. W., Aberhan, M., et al. (2009). Phanerozoic trends in the global geographic disparity of marine biotas. Paleobiology 35, 612–630. doi: 10.1666/0094-8373-35.4.612
Miller, C. S., Peterse, F., da Silva, A.-C., Baranyi, V., Reichart, G. J., and Kürschner, W. M. (2017). Astronomical age constraints and extinction mechanisms of the late Triassic Carnian crisis. Sci. Rep. 7:2557. doi: 10.1038/s41598-017-02817-7
Mora, C. (2008). A clear human footprint in the coral reefs of the Caribbean. Proc. Biol. Sci. 275, 767–773. doi: 10.1098/rspb.2007.1472
O'Dea, A., Lepore, M., Altieri, A. H., Chan, M., Morales-Salda na, J. M., Mu noz, N.-H., et al. (2020). Defining variation in pre-human ecosystems can guide conservation: an example from a Caribbean coral reef. Sci. Rep. 10:2922. doi: 10.1038/s41598-020-59436-y
Ogg, J. G. (2015). The mysterious Mid-Carnian “wet intermezzo” global event. J. Earth Sci. 26, 181–191. doi: 10.1007/s12583-015-0527-x
Oksanen, L., Fretwell, S. D., Arruda, J., and Niemela, P. (1981). Exploitation ecosystems in gradients of primary productivity. Am. Nat. 118, 240–261. doi: 10.1086/283817
Oliver, T. H., Heard, M. S., Isaac, N. J. B., Roy, D. B., Procter, D., Eigenbrod, F., et al. (2015). Biodiversity and resilience of ecosystem functions. Trends Ecol. Evol. 30, 673–684. doi: 10.1016/j.tree.2015.08.009
Oriol-Cotterill, A., Valeix, M., Frank, L. G., Riginos, C., and Macdonald, D. W. (2015). Landscapes of coexistence for terrestrial carnivores: the ecological consequences of being downgraded from ultimate to penultimate predator by humans. Oikos 124, 1263–1273. doi: 10.1111/oik.02224
Pimiento, C., Bacon, C. D., Silvestro, D., Hendy, A., Jaramillo, C., Zizka, A., et al. (2020a). Selective extinction against redundant species buffers functional diversity. Proc. Biol. Sci. 287:20201162. doi: 10.1098/rspb.2020.1162
Pimiento, C., Griffin, J. N., Clements, C. F., Silvestro, D., Varela, S., Uhen, M. D., and Jaramillo, C. (2017). The Pliocene marine megafauna extinction and its impact on functional diversity. Nat. Ecol. Evol. 1, 1100–1106. doi: 10.1038/s41559-017-0223-6
Pimiento, C., Leprieur, F., Silvestro, D., Lefcheck, J. S., Albouy, C., Rasher, D. B., et al. (2020b). Functional diversity of marine megafauna in the anthropocene. Sci. Adv. 6:eaay7650. doi: 10.1126/sciadv.aay7650
Pimm, S. L. (1982). “Food webs,” in Food Webs, ed S. L. Pimm (Dordrecht: Springer Netherlands), 1–11. doi: 10.1007/978-94-009-5925-5_1
Pimm, S. L., and Lawton, J. H. (1978). On feeding on more than one trophic level. Nature 275, 542–544. doi: 10.1038/275542a0
Pita, L., Rix, L., Slaby, B. M., Franke, A., and Hentschel, U. (2018). The sponge holobiont in a changing ocean: from microbes to ecosystems. Microbiome 6:46. doi: 10.1186/s40168-018-0428-1
Plummer, M. (2003). “JAGS: a program for analysis of Bayesian graphical models using gibbs sampling,” in Proceedings of the 3rd International Workshop on Distributed Statistical Computing, Vol. 124 (Vienna, Austria), 1–10.
Prugh, L. R., Stoner, C. J., Epps, C. W., Bean, W. T., Ripple, W. J., Laliberte, A. S., et al. (2009). The rise of the mesopredator. Bioscience 59, 779–791. doi: 10.1525/bio.2009.59.9.9
Reeves, J. C., Moon, B. C., Benton, M. J., and Stubbs, T. L. (2021). Evolution of ecospace occupancy by mesozoic marine tetrapods. Palaeontology 64, 31–49. doi: 10.1111/pala.12508
Ripple, W. J., Wirsing, A. J., Wilmers, C. C., and Letnic, M. (2013). Widespread mesopredator effects after wolf extirpation. Biol. Conserv. 160, 70–79. doi: 10.1016/j.biocon.2012.12.033
Ritchie, E. G., Elmhagen, B., Glen, A. S., Letnic, M., Ludwig, G., and McDonald, R. A. (2012). Ecosystem restoration with teeth: what role for predators? Trends Ecol. Evol. 27, 265–271. doi: 10.1016/j.tree.2012.01.001
Robinson, J. P. W., and Baum, J. K. (2016). Trophic roles determine coral reef fish community size structure. Can. J. Fish. Aquat. Sci. 73, 496–505. doi: 10.1139/cjfas-2015-0178
Rodríguez-Lozano, P., Verkaik, I., Rieradevall, M., and Prat, N. (2015). Small but powerful: top predator local extinction affects ecosystem structure and function in an intermittent stream. PLoS ONE 10:e0117630. doi: 10.1371/journal.pone.0117630
Roff, G., Doropoulos, C., Rogers, A., Bozec, Y.-M., Krueck, N. C., Aurellado, E., et al. (2016). The ecological role of sharks on coral reefs. Trends Ecol. Evol. 31, 395–407. doi: 10.1016/j.tree.2016.02.014
Rojas, A., Calatayud, J., Kowalewski, M., Neuman, M., and Rosvall, M. (2021). A multiscale view of the phanerozoic fossil record reveals the three major biotic transitions. Commun. Biol. 4:309. doi: 10.1038/s42003-021-01805-y
Romano, C., Koot, M. B., Kogan, I., Brayard, A., Minikh, A. V., Brinkmann, W., et al. (2016). Permian-Triassic osteichthyes (bony fishes): diversity dynamics and body size evolution. Biol. Rev. Camb. Philos. Soc. 91, 106–147. doi: 10.1111/brv.12161
Rooney, N., and McCann, K. S. (2012). Integrating food web diversity, structure and stability. Trends Ecol. Evol. 27, 40–46. doi: 10.1016/j.tree.2011.09.001
Roopnarine, P. (2010). Networks, extinction and paleocommunity food webs. Nat. Prec. doi: 10.1038/npre.2010.4433.2
Roopnarine, P. D. (2006). Extinction cascades and catastrophe in ancient food webs. Paleobiology 32, 1–19. doi: 10.1666/05008.1
Roopnarine, P. D. (2009). Ecological modeling of paleocommunity food webs. Paleontol. Soc. Pap. 15, 195–220.
Roopnarine, P. D. (2014). Humans are apex predators. Proc. Natl. Acad. Sci. U.S.A. 111, E796–E796. doi: 10.1073/pnas.1323645111
Roopnarine, P. D., Angielczyk, K., Weik, A., and Dineen, A. (2019). Ecological persistence, incumbency and reorganization in the Karoo basin during the Permian-Triassic transition. Earth-Science Rev. 189, 244–263. doi: 10.1016/j.earscirev.2018.10.014
Roopnarine, P. D., Angielczyk, K. D., Wang, S. C., and Hertog, R. (2007). Trophic network models explain instability of early Triassic terrestrial communities. Proc. Biol. Sci. 274, 2077–2086. doi: 10.1098/rspb.2007.0515
Roopnarine, P. D., and Banker, R. M. W. (2021). Ecological stasis on geological time scales. Science 372, 237–238. doi: 10.1126/science.abh2853
Roopnarine, P. D., Dietl, G. P., and Flessa, K. W. (2018). Ecological modeling of paleocommunity food webs. Conserv. Paleobiol. 201–305. doi: 10.7208/chicago/9780226506869.003.0011
Roopnarine P. D. and Dineen, A. A.. (2018). “Coral reefs in crisis: the reliability of deep-time food web reconstructions as analogs for the present,” in Marine Conservation Paleobiology (Springer), 105–141. doi: 10.1007/978-3-319-73795-9_6
Roopnarine, P. D., and Hertog, R. (2012). Detailed food web networks of three greater antillean coral reef systems: the Cayman islands, Cuba, and Jamaica. Dataset Pap. Ecol. 2013:857470. doi: 10.7167/2013/857470
Rosenblatt, A. E., and Schmitz, O. J. (2016). Climate change, nutrition, and bottom-up and top-down food web processes. Trends Ecol. Evol. 31, 965–975. doi: 10.1016/j.tree.2016.09.009
Scheyer, T. M., Romano, C., Jenks, J., and Bucher, H. (2014). Early triassic marine biotic recovery: the predators' perspective. PLoS ONE 9:e88987. doi: 10.1371/journal.pone.0088987
Schleuning, M., Fründ, J., and García, D. (2015). Predicting ecosystem functions from biodiversity and mutualistic networks: an extension of trait-based concepts to plant-animal interactions. Ecography 38, 380–392. doi: 10.1111/ecog.00983
Shackell, N. L., Frank, K. T., Fisher, J. A. D., Petrie, B., and Leggett, W. C. (2010). Decline in top predator body size and changing climate alter trophic structure in an oceanic ecosystem. Proc. Biol. Sci. 277, 1353–1360. doi: 10.1098/rspb.2009.1020
Shaw, J. O., Coco, E., Wootton, K., Daems, D., Gillreath-Brown, A., Swain, A., et al. (2021). Disentangling ecological and taphonomic signals in ancient food webs. Paleobiology 47, 385–401. doi: 10.1017/pab.2020.59
Stan Development Team (2021). RStan: the R Interface to Stan. R Package Version 2.21.3. Stan Development Team.
Strong, D. R., and Frank, K. T. (2010). Human involvement in food webs. Annu. Rev. Environ. Resour. 35, 1–23. doi: 10.1146/annurev-environ-031809-133103
Stubbs, T. L., and Benton, M. J. (2016). Ecomorphological diversifications of Mesozoic marine reptiles: the roles of ecological opportunity and extinction. Paleobiology 42, 547–573. doi: 10.1017/pab.2016.15
Thompson, R. M., Hemberg, M., Starzomski, B. M., and Shurin, J. B. (2007). Trophic levels and trophic tangles: the prevalence of omnivory in real food webs. Ecology 88, 612–617. doi: 10.1890/05-1454
Tietje, M. (2019). Combining paleontological and neontological data to assess the extinction risk of amphibians (Ph.D. thesis). Humboldt-Universität zu Berlin, Lebenswissenschaftliche Fakultät, Berlin, Germany.
Tylianakis, J. M., Laliberté, E., Nielsen, A., and Bascompte, J. (2010). Conservation of species interaction networks. Biol. Conserv. 143, 2270–2279. doi: 10.1016/j.biocon.2009.12.004
Vermeij, G. J. (1977). The Mesozoic marine revolution: evidence from snails, predators and grazers. Paleobiology 3, 245–258. doi: 10.1017/S0094837300005352
Vermeij, G. J. (2008). Escalation and its role in Jurassic biotic history. Palaeogeogr. Palaeoclimatol. Palaeoecol. 263, 3–8. doi: 10.1016/j.palaeo.2008.01.023
Vermeij, G. J. (2013). On escalation. Annu. Rev. Earth Planet. Sci. 41, 1–19. doi: 10.1146/annurev-earth-050212-124123
Vermeij, G. J. (2019). The efficiency paradox: how wasteful competitors forge thrifty ecosystems. Proc. Natl. Acad. Sci. U.S.A. 116, 17619–17623. doi: 10.1073/pnas.1901785116
Wallach, A. D., Dekker, A. H., Lurgi, M., Montoya, J. M., Fordham, D. A., and Ritchie, E. G. (2017). Trophic cascades in 3d: network analysis reveals how apex predators structure ecosystems. Methods Ecol. Evol. 8, 135–142. doi: 10.1111/2041-210X.12663
Williams, R. J., Berlow, E. L., Dunne, J. A., Barabási, A.-L., and Martinez, N. D. (2002). Two degrees of separation in complex food webs. Proc. Natl. Acad. Sci. U.S.A. 99, 12913–12916. doi: 10.1073/pnas.192448799
Keywords: Mesozoic Marine Revolution, community ecology, paleoecology, trophic network, food web
Citation: Banker RMW, Dineen AA, Sorman MG, Tyler CL and Roopnarine PD (2022) Beyond functional diversity: The importance of trophic position to understanding functional processes in community evolution. Front. Ecol. Evol. 10:983374. doi: 10.3389/fevo.2022.983374
Received: 30 June 2022; Accepted: 30 September 2022;
Published: 20 October 2022.
Edited by:
Damien Fordham, University of Adelaide, AustraliaReviewed by:
Li Tian, China University of Geosciences Wuhan, ChinaAndrej Spiridonov, Vilnius University Vilnius, Lithuania
Fernando Blanco, Museum of Natural History Berlin (MfN), Germany
Copyright © 2022 Banker, Dineen, Sorman, Tyler and Roopnarine. This is an open-access article distributed under the terms of the Creative Commons Attribution License (CC BY). The use, distribution or reproduction in other forums is permitted, provided the original author(s) and the copyright owner(s) are credited and that the original publication in this journal is cited, in accordance with accepted academic practice. No use, distribution or reproduction is permitted which does not comply with these terms.
*Correspondence: Roxanne M. W. Banker, cmJhbmtlckBjYWxhY2FkZW15Lm9yZw==