 Fei Zhao1,2
 Yiyang Zhang1Zhifang Zhao1,2*Xinrui Wang1Sujin Zhang1Guize Luan3Qiting Zhang1Ling Zhu1Hairong Liu1
- 1School of Earth Sciences, Yunnan University, Kunming, China
- 2Engineering Research Center of Domestic High-resolution Satellite Remote Sensing Geology for Universities of Yunnan Province, Kunming, China
- 3Institute of International Rivers and Eco-Security, Yunnan University, Kunming, China
The Asian elephant (Elephas maximus) have a wide range of foraging needs and heterogeneous habitat preferences that bring them close to the forest edge. Currently, most of the range of wild elephants is located outside protected areas (PA). Nighttime light data (NTL) has been used as a component of human footprint due to its characteristics of characterizing the intensity of human activities and spatio-temporal continuity. We chose Xishuangbanna National Nature Reserve, the main distribution area of Asian elephants, as the study area and used NTL to monitor human activities, supplemented by land cover (LC) type data, to study the Asian elephant sanctuary and its surrounding areas, and found that: 1) NTL features inside and outside the PA are approaching, and the boundary effect of the sanctuary is weakening; 2) The NTL gathering area in the study area is mainly distributed in the south of the PA, 86.21% of the area’s nighttime lights have a significant increase trend, and the human activity range is evolving toward the southeast in the past decade; 3) the percentage of areas with a significant increasing trend of NTL under different LC types is greater than decreasing, nearly 50% of the forest showed an increasing trend of NTL. LC types with reduced forest have been converted to cropland and building in the last decade.
1. Introduction
As the cornerstone of biodiversity conservation, nature reserves (protected areas, PA) can prevent and mitigate potential biological and environmental disturbances caused by human activities (Zheng et al., 2021). Although PA have undergone significant geographical and conceptual expansion in recent years, nearly one-third of the worldwide PA is still under significant human pressure (Watson et al., 2018). Human activities around PA will increase the possibility of human-wildlife conflicts, change the scope and spatial allocation of wildlife habitat, thus exacerbating the threat to species within PA and impede their functioning. Therefore, there is an urgent need to understand the habitat of animals in the nature reserve and its edge, with particular attention to wildlife with larger ranges of activity.
The Asian elephant (Elephas maximus) is the largest existing land animal in Asia, with daily energy intake requirements leading to extensive foraging and heterogeneous habitat preferences that keep them close to forest edges (Kitratporn and Takeuchi, 2022). However, Asian elephants are facing threats of habitat loss, poaching, and human-elephant conflict due to expanding human activities. Most studies on Asian elephant habitat have been conducted in PA and their administrative areas (Liu et al., 2017; Li et al., 2018), and scholars have conducted studies on population size estimation, habitat quality assessment, and human-elephant conflict attribution based on multiple sources of data such as land cover (LC) data and social surveys (Zhang et al., 2015; Liu et al., 2017; Li et al., 2018; Liu et al., 2018; Yu et al., 2020; Chen et al., 2021). Recent studies have shown that the range of Asian elephants is shrinking and more than 70% of them are outside the PA. 17 Asian elephants traveled 500 km north in China in March 2020 and returned to their habitat only after nearly one and a half years of human induced movement, which undoubtedly indicates that the attention and protection of Asian elephant habitats should be strengthened and long-term dynamic monitoring should be carried out.
In recent decades, urbanization and population growth have led to a rapid and continuous increase in the density and extent of artificial lighting, creating a new global nighttime lighting environment (Falchi et al., 2016). Compared with ordinary satellite remote sensing images, night light remote sensing (NTL) has been widely used in the study of urban built-up areas and human activities, as well as environmental issues, such as natural disaster assessment (Zhao et al., 2018), prediction of night sky brightness (Falchi et al., 2016), snow cover detection (Huang et al., 2022) due to its characteristics of characterizing the intensity of human activities, spatio-temporal continuity, and wide coverage (Hao, 2019; Li et al., 2021; Morshed et al., 2022). Recently, NTL has also been used as a component of human footprint and has played a great role in ecological fields, such as carbon emissions (Shi et al., 2016, 2022), ecological light pollution (Jechow et al., 2019; Lian et al., 2021), threats to ecosystems (Davies et al., 2014; Koen et al., 2018), etc. Therefore, it is feasible to use NTL to monitor human intrusion on a spatial scale (Venter et al., 2016; Guetté et al., 2018). Few studies on the detection and evaluation of NTL in PA, mostly from the perspective of large-scale, such as global and national scale (Guetté et al., 2018; Xu et al., 2019; Li et al., 2020; Anand and Kim, 2021). However, few studies have been conducted on small-scale protected areas using nighttime light data, especially for species such as Asian elephants, which are often close to forest edges and are in urgent need of complementary geospatial data sets for fine-scale studies.
In order to better understand the current habitat status of Asian elephants, this study uses NTL to monitor human activities, supplemented by land cover type data, to investigate the current situation of Xishuangbanna National Nature Reserve, with the objectives of: 1) exploring the spatial pattern and temporal characteristics of NTL distribution around Xishuangbanna National Nature Reserve from 2012 to 2021; 2) exploring the impact of human activities and the NTL change trend in the area; 3) studying the land use change around the PA and reveal to reveal the impact of human activities on the habitat of Asian elephants.
2. Data and methods
2.1. Study area
There are currently two national nature reserves in Xishuangbanna Dai Autonomous Prefecture, namely the Xishuangbanna National Nature Reserve and the Napan River Basin National Nature Reserve. Among them, Xishuangbanna National Nature Reserve consists of five sub-reserves, namely Mengyang, Menglun, Shangyong, Mengla and Mangao, which are geographically close to each other but not connected, with geographical coordinates from 21°10’N to 22°24’N and 100°16′E to 101°50′E, with a total area of 242,510 hm2, accounting for 12.9% of the state’s area. In Xishuangbanna, Asian elephants are mainly distributed in and around the three sub-protected areas of Mengyang, Mengla and Shangyong in Xishuangbanna National Nature Reserve. Although there is Asian elephant habitat in the Napanhe Reserve, no Asian elephants are currently active in the area, and because it is separated from the Mengyang Reserve by the Lancang River, elephant herds have not yet entered the area (Lin et al., 2015). Therefore, three sub-protected areas, Mengyang, Mengla and Shangyong, were selected as the study area to investigate the human activities around them (Figure 1).
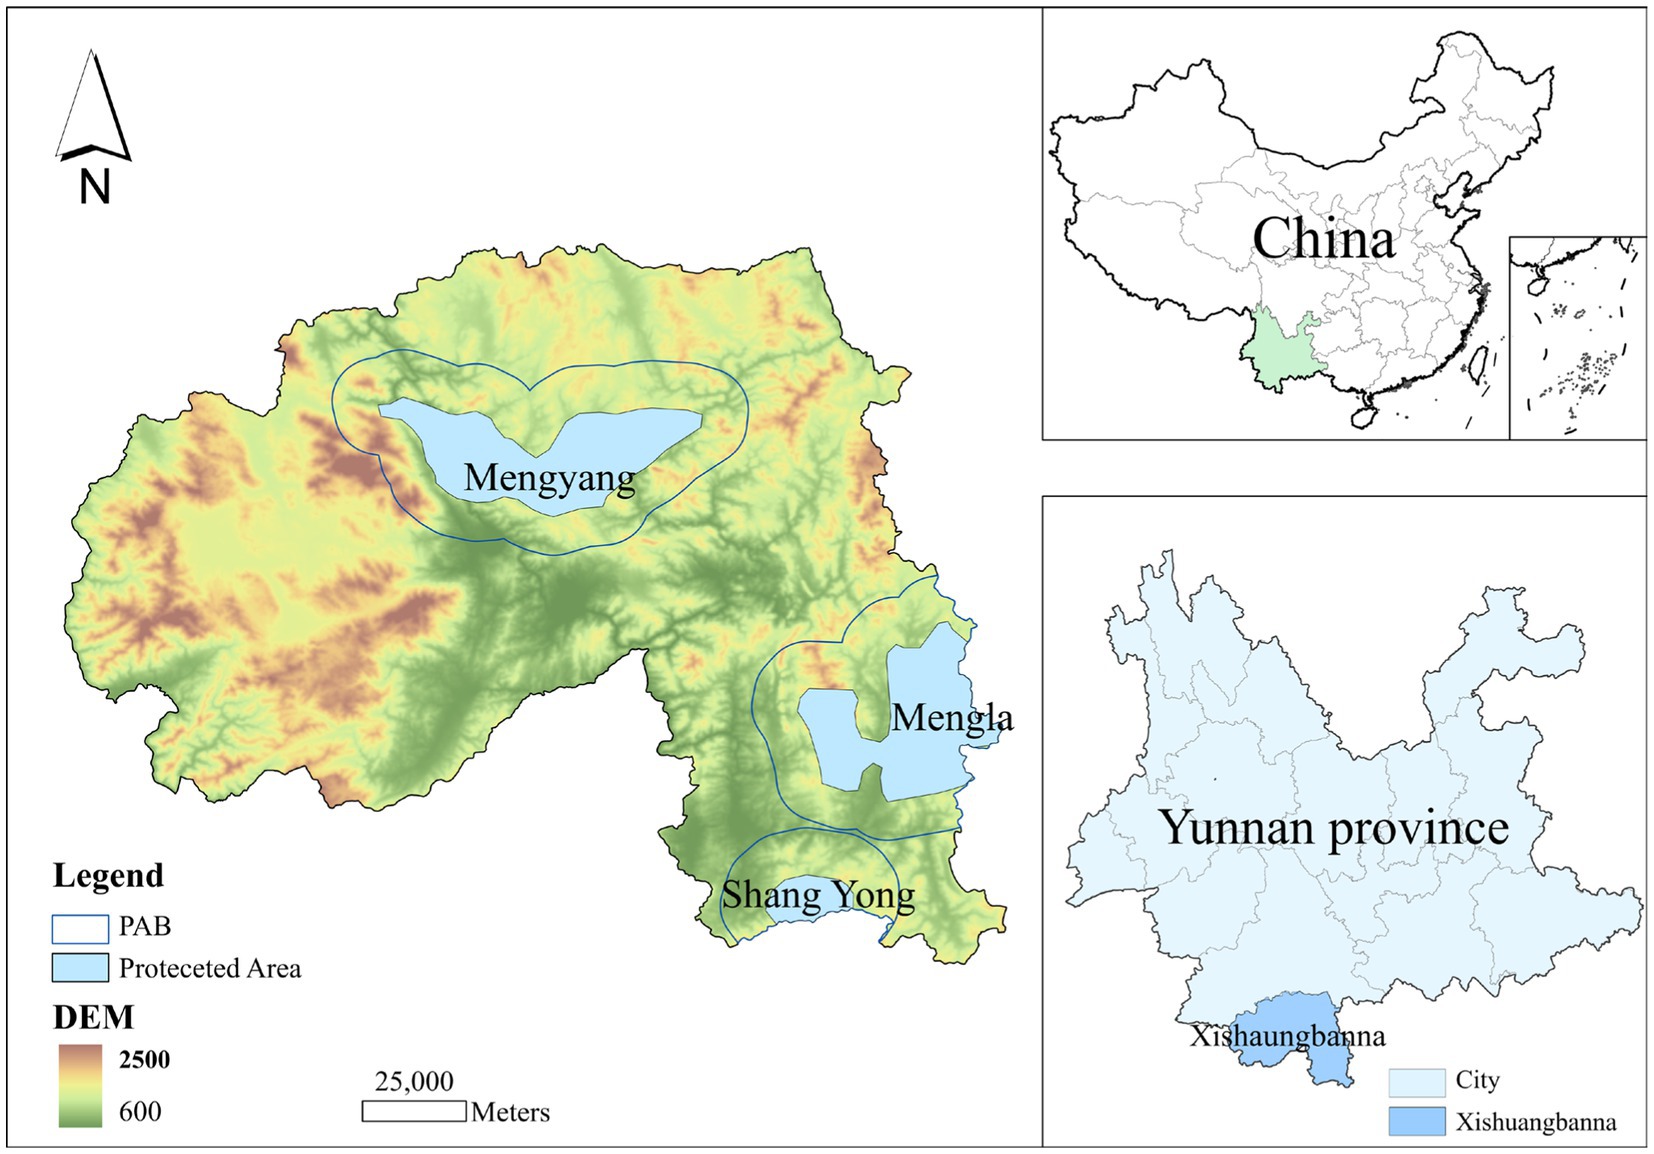
Figure 1. Study Area.
Based on the conclusion that the range of Asian elephant activities may be beyond the existing PA, this paper proposes to establish a 10 km buffer zone for the protected area (PAB) to carry out the study. Rowell (2014) showed that wild Asian and African elephants are estimated to move an average of 5–10 km per day, and the elephants they examined walked an average of 9.05 ± 0.61 km per day. Holdgate et al. (2016) used foot rings equipped with GPS data loggers to measure the daily outdoor walking distance of African and Asian elephants kept in zoos, and concluded that the elephants walked an average of 5.3 km per day conclusion. Zhou and Zeng (2022) monitored Asian elephants entering Menglun Nature Reserve and concluded that Asian elephants had a daily activity radius of 2–15 km. We finally chose a buffer zone of 10 km for the study, and some experts (Li, 2021) also pointed out that the average habitat extent of Asian elephants in natural forests is 10 km2.
2.2. Data
This study mainly used the annual mean products of the NTL dataset from 2012–2021 to characterize human activity space, and the global land cover dataset released by J. Yang and Huang in 2012 and 2021 (Yang and Huang, 2021) to explore the present-day Asian elephant habitat status. In addition, this paper also used the boundary data of China Nature Reserves in June 2020 from the World Database on Protected Areas (WDPA).1
2.2.1. NTL dataset
NTL is a series of satellite observations and derived products based on the detection of anthropogenic lighting present at the earth’s surface (Elvidge et al., 2013). In 2011, the National Aeronautics and Space Administration(NASA) and National Oceanic and Atmospheric Administration (NOAA) launched the Suomi National Polar Partnership (SNPP) satellite, carrying the first Visible Infrared Imaging Radiometer Suite (VIIRS) instrument. The VIIRS collects low-light imaging data and has several improvements over the Operational Linescan System (OLS)’ capabilities, Elvidge et al. (2022) such as in terms of spatial resolution, dynamic range, quantization, calibrations and spectral bands suitable for identifying sources of thermal radiation (Elvidge et al., 2013). This study uses data from the VIIRS NTL v.2 series for the years 2012–2021 to eliminate infrequent noise sources using the temporal levers found in the full time series., which is available for free from the official website of the Group on Earth Observations.2
2.2.2. Landcover dataset
To better understand the current changes in Asian elephant habitat, we used the China land cover type dataset (CLCD) with high spatial resolution. Data for 2012 and 2021 with a spatial resolution of 30 m × 30 m are selected. This product is the first Landsat-derived annual CLCD from 1990–2019 based on the GEE platform studied by Yang and Huang, (2021), including nine major land cover classes: cropland, forest, shrub, grassland, water, snow and ice, bar-ren, impervious, and wetland. The CLCD product are based on 5,463 visual interpretation samples with an overall accuracy of 79.31% (Hou et al., 2022) This dataset can be obtained free of charge from the CLCD website.3
2.3. Methods
2.3.1. NTL index
Based on the NTL annual average data from 2012 to 2021, this study conducts index calculation through statistical analysis to understands the interannual fluctuations, changes and current status of the NTL in the study area over the past decade.
1. Sum of Nighttime Light (SNL) index
The total light (total intensity) intensity of a region can reflect the light characteristics of the region, and the sum of nighttime light index (SNL) is constructed to reflect the overall brightness characteristics of the region, calculated as follows:
where represents the image DN value and represents the count of the image whose DN value is .
2. Area of Nighttime Light (ANL) index
The proportion of all pixels with brightness value greater than 0 to the total pixel in the statistical year can reflect the spatial extension characteristics of NTL and build the area of Nighttime Light (ANL) index. Since the spatial resolution of all grids is the same, the pixel count can be used instead of area, and the calculation formula as:
Where is the brightness value greater than 0 image count, is all image count.
3. Increasing of Nighttime light (INL) index
To assess the evolution of NTL over the study period, the year-on-year growth rate was used to calculate the increasing of Nighttime light (INL) index, the formula as:
Where SNLi is the regional nighttime lighting index. A positive growth rate is considered to be an increase in human activity in the region; a negative growth rate is considered to be a decrease in human activity in the region.
4. Average of Nighttime light (ANLv) index
In order to calculate the Average of NTL according to different research needs, the average index ANLv was constructed with the formula:
Where represents the brightness value, is the number of counting pixels.
2.3.2. Trend analysis
In this study, we use the linear regression trend (LRT) method to analyze the NTL change trend at pixel scale and PA scale. The LRT model can be established by the following formula (Jiang et al., 2017):
Where Y is the night light value, X is the corresponding year, α Is the slope, φ Is the intercept. In addition, α It can be expressed as:
is a variable of time series, from 1 to 10 represents 2012–2021, is the NTL brightness value on the time series, and are the arithmetic mean centers. If α > 0, indicating that the NTL has an obvious increasing trend; If α < 0, there is a decreasing trend.
2.3.3. Spatial–temporal pattern analysis
The standard deviation ellipse analysis (SDE) method can effectively analyze the spatial distribution patterns and transfer states of NTL, which helps to study the overall spatial distribution characteristics of geographic elements from multiple perspectives (Huang et al., 2018; Fang et al., 2022).
The basic idea of SDE is to analyze the center, area, long axis, short axis and azimuth of the ellipse to analyze the evolution process and trend of the center, range, shape and direction of the study area (Gen et al., 2022). The long half-axis of the ellipse characterizes the direction of element distribution, the short half-axis characterizes the dispersion of elements, and the center of gravity of the ellipse portrays the centrality of elements, and the area portrays the main range of element distribution (Jiao et al., 2022). The center of gravity of the standard deviation ellipse (SDEx, SDEy) is calculated as:
where and are the spatial location coordinates of each element, and and are the arithmetic mean centers.
3. Results and discussion
3.1. Time sequence characteristics of light distribution around the protection zone at night
Human activities around Asian elephant habitats have been increasing in the last decade. Despite some interannual fluctuations, there is a clear trend of increasing SNL (Figure 2A) and ANL (Figure 2B) from 2012 to 2021 both within the PA and PAB. SNL represents the variation of total night-time light in the area. In Figure 2A, even though the SNL of the PA is far lower than PAB, the SNL of the PA would increase when the SNL of PAB increases, indicating that the increase and decrease changes of PA and PAB are consistent, e.g., the SNL in both areas are increasing from 2012 to 2014, and the SNL increased first and then decreased around 2016. However, there are also inconsistencies. In 2020, the SNL of PAB decreased compared with the previous year, while the PA increased. ANL indicates the percentage of bright pixels appearing in the region, and the changes of PA and PAB in Figure 2B are more consistent, and both have a significant increasing trend (R2>0.82). When the bright pixels of the PAB decreases, it is also decreasing in the PA, such as in 2015, 2018, and 2020.
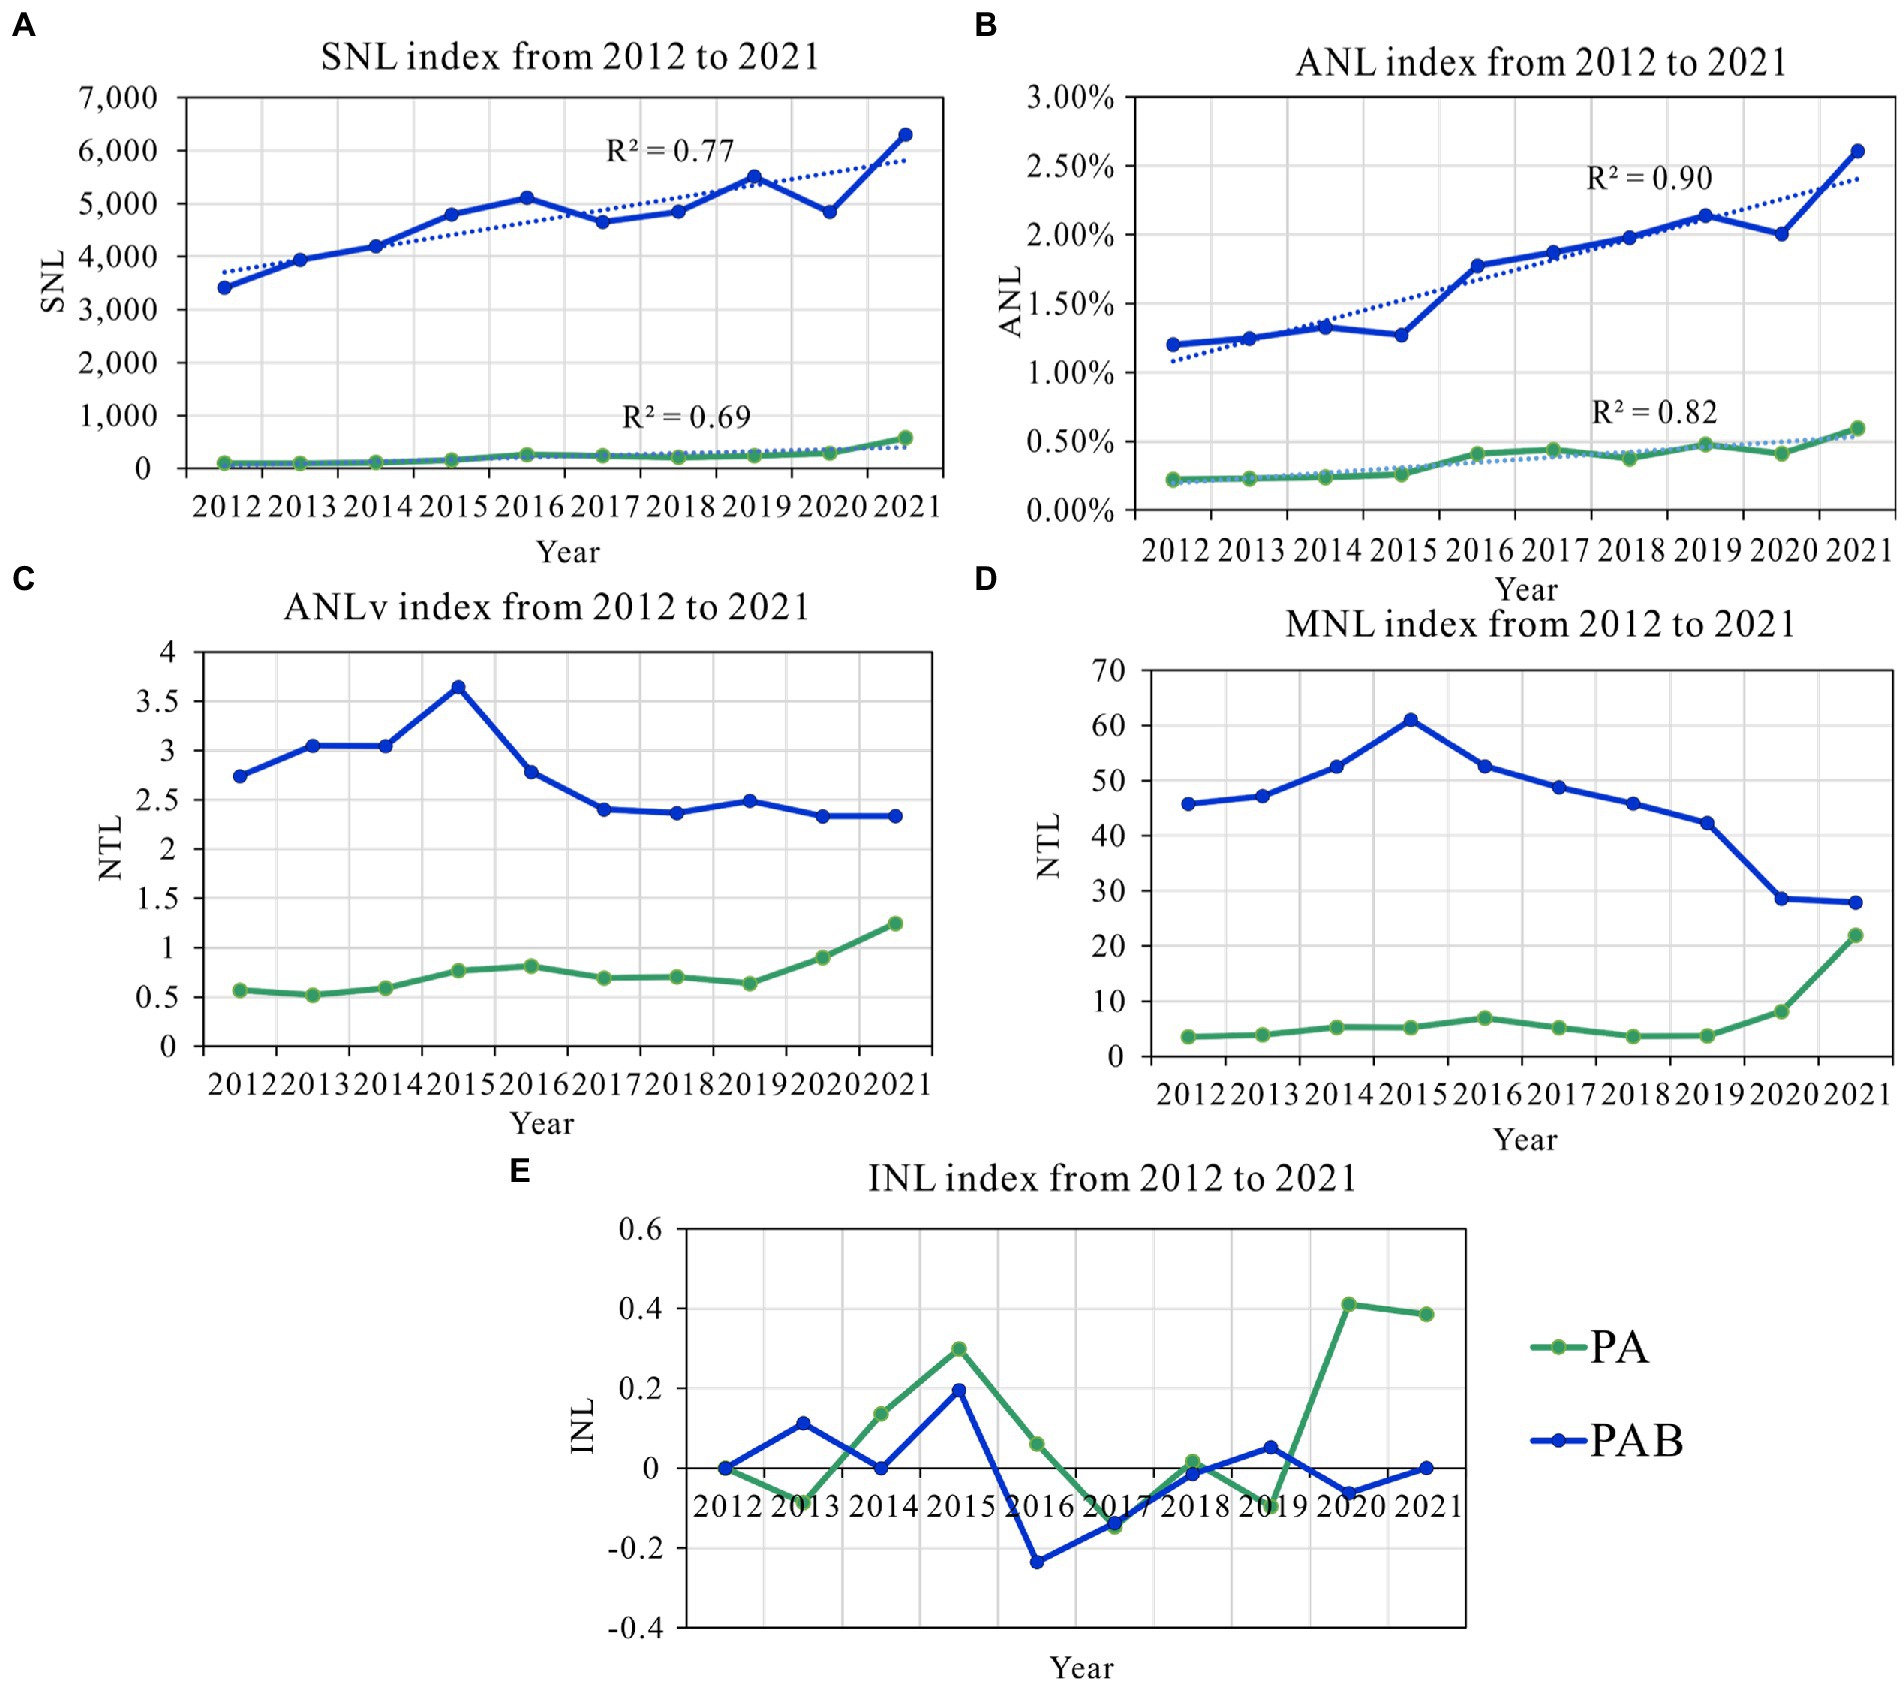
Figure 2. Annual change of nighttime lighting index in nature reserves and nature reserve buffer zones.
Consistency of NTL changes inside and outside the PA is increasing, the average and maximum NTL (ANLv and MNL) in PA and PAB are converging. The interannual fluctuations of PAB’s ANLv are large and have been slowly decreasing in recent years. Unexpectedly, overall ANLv within PA is trending upward and two lines representing different regions have a tendency to approach during Figure 2C. From the regional maximum value (Figure 2D), the MNL of the PAB region also shows a decreasing trend year by year 27.92 in 2021 is much lower than 45.79 in 2012, a decrease of 39.03%. However, the MNL within PA has climbed rapidly since 2019 and gradually approaching to the MNL of PAB. Even though Figures 2C,D show a decreasing trend of both the mean and maximum values in the PAB, the SNL in Figure 2A still shows an increasing trend, indicating that the number of illuminated pixels within the PAB has increased and the range of human activities is expanding. Figure 2B also shows such a feature.
The level of human activity in PA is greater than that in PAB. During Figure 2E, the INL of both PA and PAB fluctuate considerably, with positive and negative values, indicating that NTL has been unstable over the last decade. Nevertheless, the overall values of INL in the PA are larger than those in the PAB, indicating that the increasing trend of human activities in PA is more obvious than PAB.
In a word, the NTL characteristics of Xishuangbanna Reserve and its surrounding areas show an obvious trend of growth in both value and range, and individual areas such as MNL and ANLv are approaching, indicating that the boundary effect of the reserve may be weakening due to human activities. The SNL, ANL, MNL, and ANLv of PA had an increasing trend, and the SNL of PAB is increasing, ANLv decreasing but the percentage of SNL expands, indicating that the area and range of activities are expanding. And the INL changes because the interannual fluctuation of SNL is also influenced by the number and value of pixels.
3.2. Nighttime light spatial distribution pattern refinement detection
From the spatial pattern of Xishuangbanna, the brightest part of the NTL in its middle and close to the PA, and the NTL in 2021 is brighter and broader than in 2012. In 2012, NTL is mainly concentrated in the central part, and some of the southern part of the PA had faint lights (Figure 3A). In 2021, more areas around the PA were lit up, the original lighted area in the south was brighter, and even appeared in the interior and west side (Figure 3B). In addition, in 2012 and 2021, the NTL around PA located in the central region were the brightest, and PA in the western and southern regions will also be illuminated.
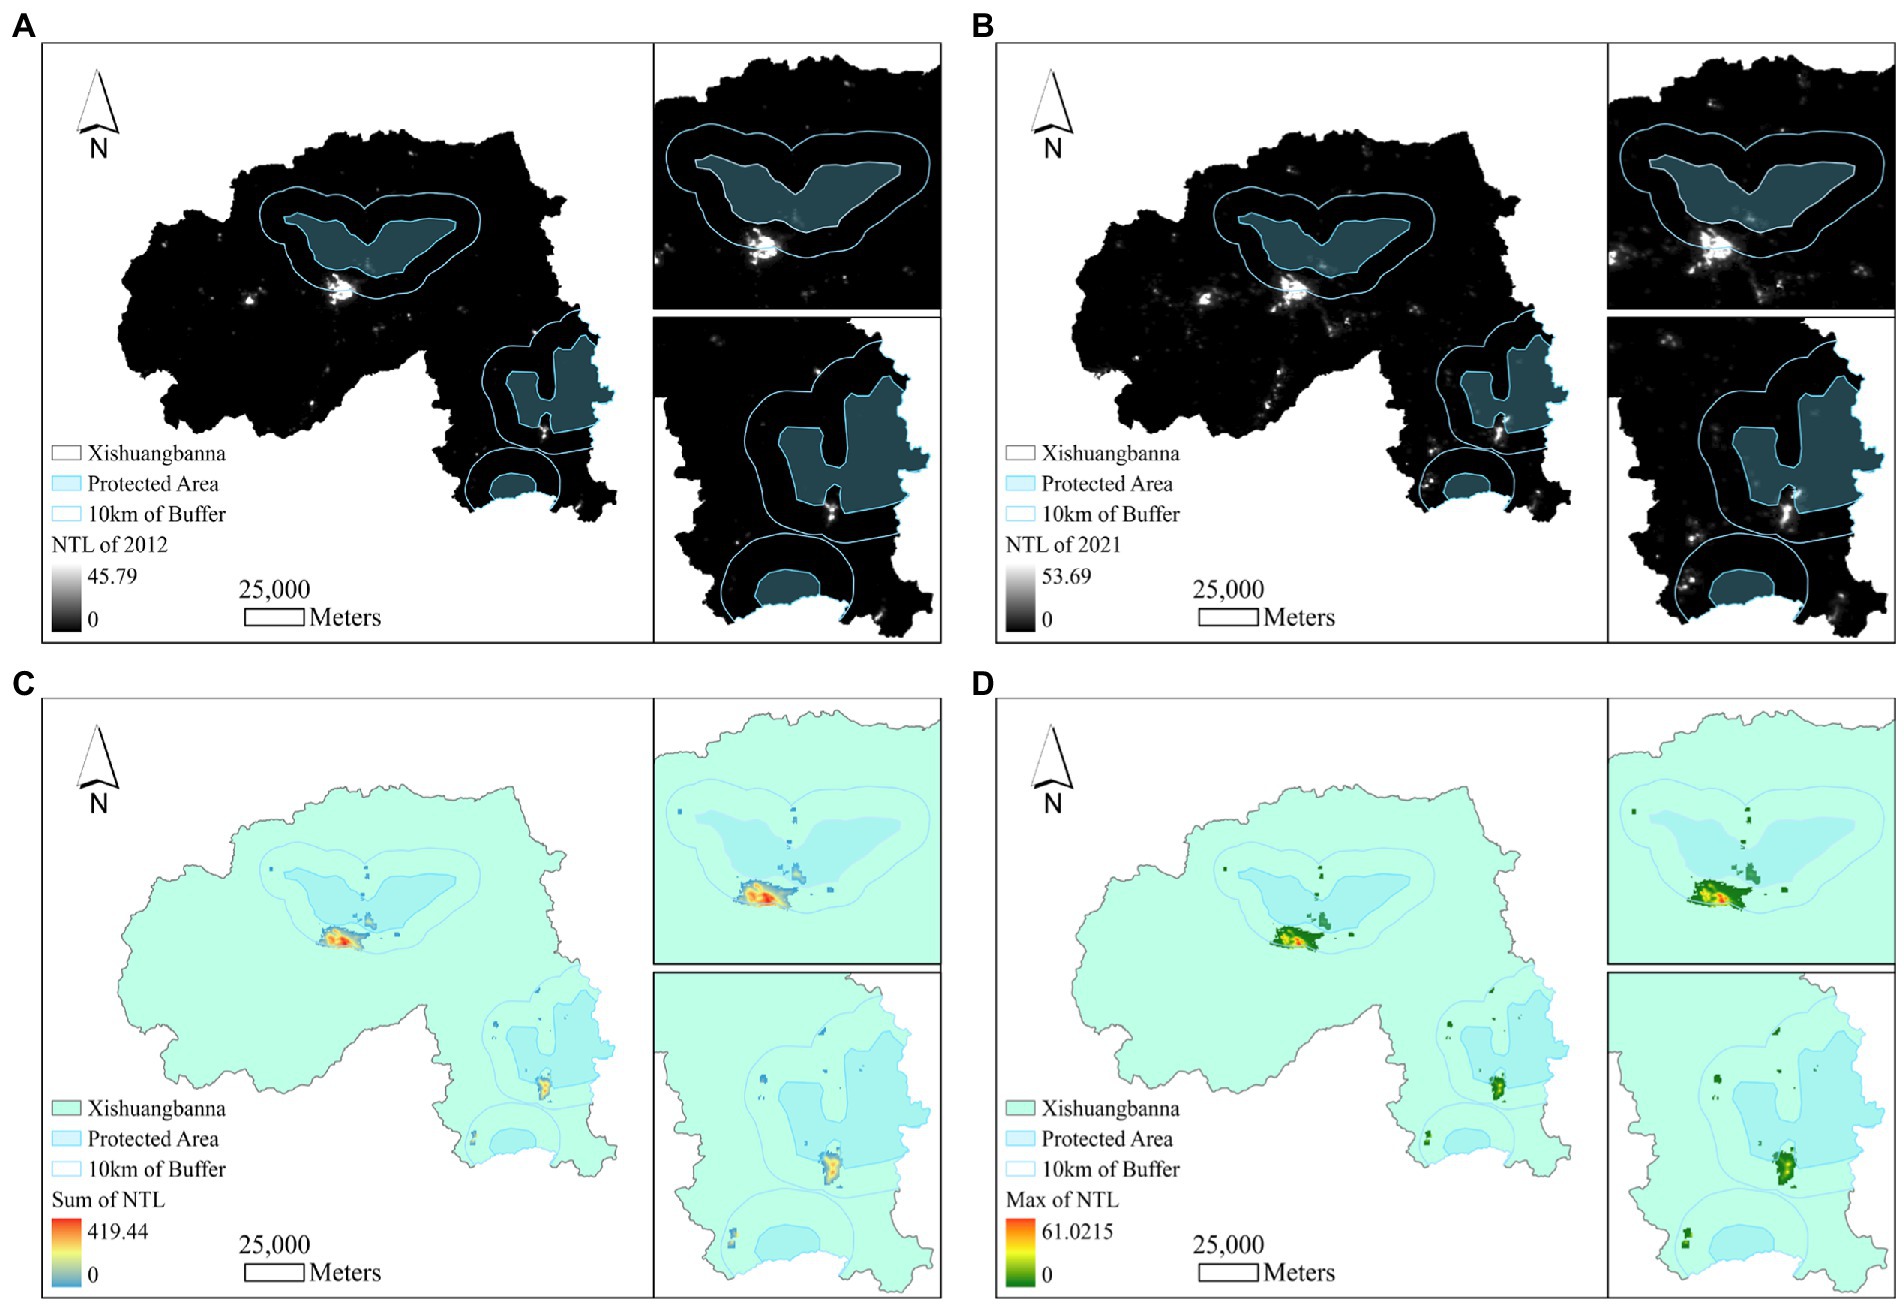
Figure 3. 2012–2021 NTl spatial distribution: (A,B) are the NTL images of Xishuangbanna region in 2012 and 2021, respectively, and (C,D) are the total and maximum NTLs of PAB region on the image metric scale from 2012 to 2021, respectively.
The NTLs in the PAB area show a central clustering trend. Figures 3C,D are the SNL and MNL of NTL around the PA from 2012 to 2021 based on pixel scale statistics. Their spatial distribution is relatively similar. With faint light sources around the three PA, and some of them even inside the PA, such as Mengyang. The SNL and MNL of NTL in the Mengyang are relatively large compared to the other, and there are clusters of NTL within PAB in both the Mengyang and Mengla areas. The southern part of PA has NTL and aggregation phenomenon, especially the NTL of central PA aggregation phenomenon is more obvious, showing an obvious bicentric trend, and the western PA shows a weak bicentric trend.
The scope of human activities outside the PA is gradually expanding, and the impact on the PA is gradually enhancing. The statistics obtained 86.21% of the areas with increasing trend and 13.78% with decreasing trend of NTL in the PAB area from 2012 to 2021 (Figure 4A, p < 0.1). The average NTL per pixel of PAB increased by 1.24 in the last decade, which is equivalent to 2.23 times of the regional mean NTL of 0.57 in PA in 2012. Calculation of NTL trend changes in the PAB over the past 10 years found that the NTL gathering center in the central PAB has a weakening trend, but the NTL around the center has an increasing trend, indicating that human activities have a trend of spreading to the periphery (Mengyang). The NTL aggregation center in Mengla has a higher increasing trend, but the NTL of the part intersected with PA has a decreasing trend, and the southern PA is currently at some distance from the NTL.
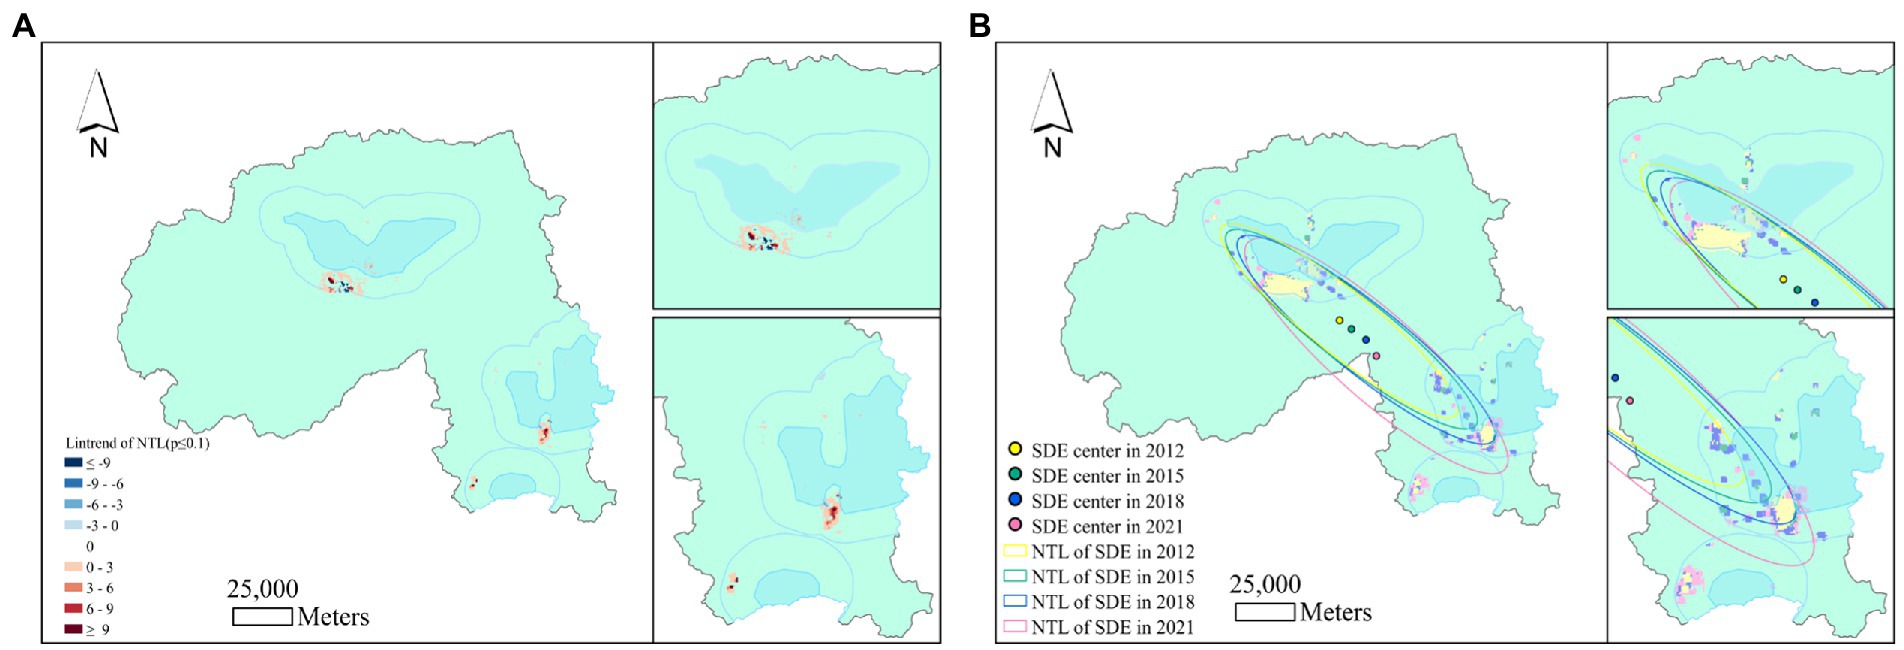
Figure 4. Trend prediction plot and standard deviation ellipse analysis for NTL: (A) the linear trend of NTL changes in PA and PAB regions from 2012 to 2021, and the colored areas in the figure all passed the significance test (p < 0.1). (B) the analysis of NTL concentration and SDE analysis in 2012, 2015, 2018, and 2021.
Human activities in PA and PAB have a tendency to move southeastward and gradually expand in extent. The long semi-axis of the SDE indicates the direction of the center of gravity, which points to the southeast in 2012, 2015, 2018 and 2021 (Figure 4B). The center of the ellipse shifted along the southeast for two consecutive periods, and the period during 2018–2021 was more southerly compared with the period before 2018. It can be inferred that the center of gravity of the NTL distribution in the PAB shifted roughly to the southeast during 2012–2021, indicating a trend of human activities to the southeast.
The areas with greater NTL brightness in Xishuangbanna appear in the southern part of the PA and inside the PAB, and most of the NTL showed an increasing trend. From the SDE, it is clear that there is a tendency for human activities to move in a southeasterly direction, and basing on conclusion of the northward movement of Asian elephants, it is likely that this movement is a “purposeful” trip, which shows that PA is increasingly affected by human activities (Jiang et al., 2023). In the future, monitoring and planning of habitats based on Asian elephant activities should be necessary.
3.3. Spatial and temporal coupling of human activities and NTL around the study area
The main LC type in PA and its surrounding areas is predominantly forest, and reduced forest have been converted to cropland and building in the last decade. Figures 5A,B are the LC classification maps of PAB in 2012 and 2021, respectively. The cropland in PA has increased significantly, and there are a large number of constructions in the south, and the scope has expanded, indicating that human activities are close to PA. Figure 5C shows the statistical analysis of LC in 2012 and 2021, where the forest of PA and PAB decreased by 1.61 and 2.30%, respectively, in 10 years, in which 99.37% of the decreased vegetation in PA area converted into cropland, and 94.78 and 5.22% of the decreased vegetation in PAB converted into farmland and construction, respectively.
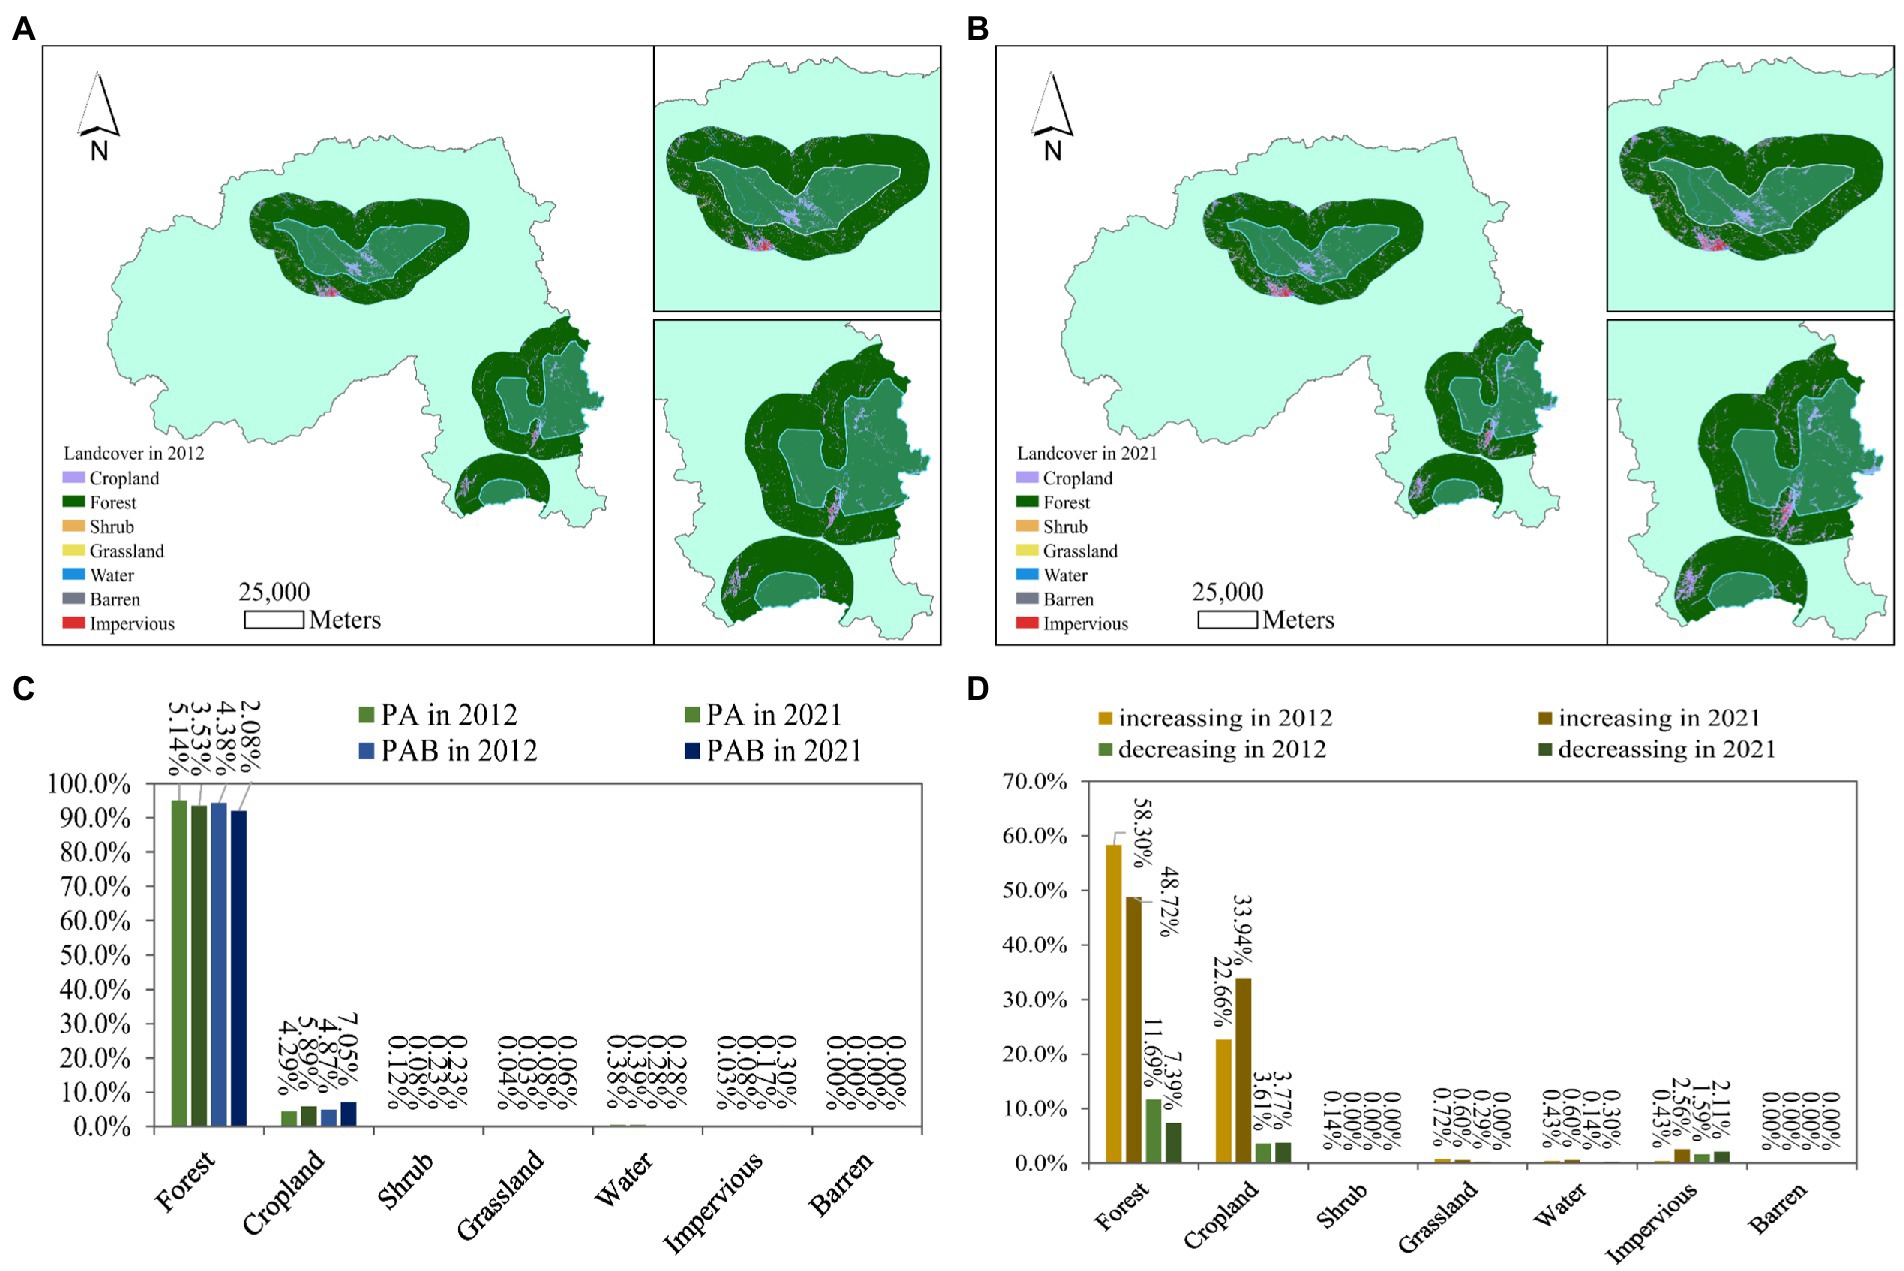
Figure 5. Distribution of LC types in PAB in 2012 and 2021: (A), is the LC types in 2012; (B), is the LC types in 2021; (C), is the LC statistics of PA and PAB in different years; (D), is the past trend of NTL under different LC in different years.
In the past decade, all LC types showed more increasing than decreasing trends in the areas with significant NTL change trends. Nearly 50% of the forest showed an increasing trend of NTL and nearly 10% showed a decreasing trend. Combining with the areas in Figure 4A where NTL showed different trends, we counted the NTL trends of different LC under the same location and plotted Figure 5D. The areas where NTL has a significant trend of change, forest and cropland more dominant, and the areas where forest shows different trend are decreasing and farmland is increasing. The increasing trend of impervious from 2012 to 2021 is not obvious, but the increasing trend presented by NTL is significant, from 0.43 to 2.56%.
The tree cover in the PAB area was higher than 90%, but nearly half of the vegetation cover showed a significant trend of increasing NTL, indicating that the Asian elephant habitat may still have a great risk of human disturbance in the future. However, the data of NPP—VIIRS started from 2012, it is impossible to explore the current status of NTL in the study area by using the same data, which is not conducive to the in-depth analysis of long-term change trajectories. And there are few existing LC products with high spatial resolution, and if multiple datasets are used, some information may be lost due to the uniformity of scale, so if it can be supplemented with more high-precision LC data, the understanding of Asian elephant habitat status in Xishuangbanna region will be more comprehensive.
4. Conclusion
To address the current challenges of habitat threats to Asian elephants, this study explores the spatial changes in Asian elephant habitat and the evolutionary trends of human activities from 2012 to 2021 by combining NPP-VIIRS data and CLCD data, taking the Xishuangbanna region as an example. It is found that firstly, the total amount and range of NTL in the peripheral areas of Xishuangbanna Reserve are expanding, and the brightness of individual areas is decreasing, but the NTL within the PA showed an obvious increasing trend regardless of the total amount, range and mean value, and the NTL characteristics inside and outside the reserve are approaching. Secondly, the increasing trend of NTL in 86.21% of the PAB is significant, among which the NTL of Mengyang and Mengla PA are centrally clustered and distributed in the south, and the scope of human activities in the last decade is evolving to the southeast. Thirdly, all LC types showed a greater percentage of increasing trend of NTL than decreasing trend, and reduced forest had converted to cropland or building.
The NTL indices of the habitats explored in this study and their surrounding areas are all increasing, and the existing vegetation cover areas still show more NTL increasing trends. Although human activities have a tendency to move away from PA in a southeastern direction, the several northward movements of Asian elephants indicate that reasonable planning and regular monitoring of their habitats still cannot be ignored.
Data availability statement
The original contributions presented in the study are included in the article/supplementary material, further inquiries can be directed to the corresponding author.
Author contributions
FZ: conceptualization. YZ, FZ, and ZZ: methodology and validation. YZ, QZ, and FZ: formal analysis. ZZ, XW, YZ, and FZ: data curation. YZ: writing—original draft preparation and visualization. XW, SZ, FZ, GL, ZZ, LZ, HL, and QZ: writing—review and editing. ZZ: supervision. FZ and ZZ: funding acquisition. All authors contributed to the article and approved the submitted version.
Funding
This work was supported by the National Natural Science Foundation of China (grant no. 41961064); the Yunnan Fundamental Research Projects (grant no. 202001BB050030); the Postgraduate Research and Innovation Foundation of Yunnan University (grant no. 2021Y353); the Postgraduate Research and Innovation Foundation of Yunnan University (grant no. KC22222292).
Conflict of interest
The authors declare that the research was conducted in the absence of any commercial or financial relationships that could be construed as a potential conflict of interest.
Publisher’s note
All claims expressed in this article are solely those of the authors and do not necessarily represent those of their affiliated organizations, or those of the publisher, the editors and the reviewers. Any product that may be evaluated in this article, or claim that may be made by its manufacturer, is not guaranteed or endorsed by the publisher.
Footnotes
1. ^https://www.protectedplanet.net/en/thematic-areas/wdpa?tab=WDPA
References
Anand, A., and Kim, D. H. (2021). Pandemic induced changes in economic activity around African protected areas captured through night-time light data. Remote Sens. 13:314. doi: 10.3390/rs13020314
Chen, S., Sun, G. Z., Wang, Y., Huang, C., Chen, Y., Liu, P., et al. (2021). A multistakeholder exercise to identify research and conservation priorities for Asian elephants in China. Glob. Ecol. Conserv. 27:e01561. doi: 10.1016/j.gecco.2021.e01561
Davies, T. W., Duffy, J. P., Bennie, J., and Gaston, K. J. (2014). The nature, extent, and ecological implications of marine light pollution. Front. Ecol. Environ. 12, 347–355. doi: 10.1890/130281
Elvidge, C. D., Baugh, K., Ghosh, T., Zhizhin, M., Hsu, F. C., Sparks, T., et al. (2022). Fifty years of nightly global low-light imaging satellite observations. Front. Remote Sens. 3:919937. doi: 10.3389/frsen.2022.919937
Elvidge, C. D., Baugh, K. E., Zhizhin, M., and Hsu, F. C. (2013). Why VIIRS data are superior to DMSP for mapping nighttime lights. Proc. Asia-Pac. Adv. Netw. 35:62. doi: 10.7125/APAN.35.7
Falchi, F., Cinzano, P., Duriscoe, D., Kyba, C. C., Elvidge, C. D., Baugh, K., et al. (2016). The new world atlas of artificial night sky brightness. Sci. Adv. 2:e1600377. doi: 10.1126/sciadv.1600377
Fang, S., Zhao, Y., Chao, Z., and Kang, X. (2022). Spatial distribution characteristics and influencing factors of Tibetan buddhist monasteries in Amdo Tibetan inhabited regions, China. J. Geovis. Spat Anal. 6:29. doi: 10.1007/s41651-022-00124-y
Gen, D., Tu, K., Chen, H., and Zheng, J. (2022). Spatial-temporal evolution characteristics of surface deformation in mining area based on SBAS-InSAR and high resolution optical remote sensing. J. Nat. Disasters. 31, 251–264. doi: 10.13577/j.jnd.2022.0124
Guetté, A., Godet, L., Juigner, M., and Robin, M. (2018). Worldwide increase in artificial light at night around protected areas and within biodiversity hotspots. Biol. Conserv. 223, 97–103. doi: 10.1016/j.biocon.2018.04.018
Hao, Q. (2019). Research on digital observation and spatial model construction of multi-dimensional urban nighttime light environment. [Master’s Thesis]. Dalian (Liaoning): Dalian University of Technology. Available at: https://kns.cnki.net/KCMS/detail/detail.aspx?dbcode=CMFD&dbname=CMFD202001&filename=1019865316.nh&v=.
Holdgate, M. R., Meehan, C. L., Hogan, J. N., Miller, L. J., Soltis, J., Andrews, J., et al. (2016). Walking behavior of zoo elephants: associations between GPS-measured daily walking distances and environmental factors, social factors, and welfare indicators. Ryan SJ, editor. PLoS One 11:e0150331. doi: 10.1371/journal.pone.0150331
Hou, Y., Chen, Y., Ding, J., Li, Z., Li, Y., and Sun, F. (2022). Ecological impacts of land use change in the arid Tarim River basin of China. Remote Sens. 14:1894. doi: 10.3390/rs14081894
Huang, Y., Song, Z., Yang, H., Yu, B., Liu, H., Che, T., et al. (2022). Snow cover detection in mid-latitude mountainous and polar regions using nighttime light data. Remote Sens. Environ. 268:112766. doi: 10.1016/j.rse.2021.112766
Huang, Y., Yan, Q., and Zhang, C. (2018). Spatial–temporal distribution characteristics of PM2.5 in China in 2016. J. Geovis. Spat. Anal. 2, 1–18. doi: 10.1007/s41651-018-0019-5
Jechow, A., Kyba, C. C., and Hölker, F. (2019). Beyond all-sky: assessing ecological light pollution using multi-spectral full-sphere fisheye lens imaging. J. Imaging 5:46. doi: 10.3390/jimaging5040046
Jiang, W., He, G., and Ni, Y. (2017). Assessment of light pollution impact on protected areas in China. Int arch Photogramm remote Sens spat. Inf. Sci. XLII-2/W7, 1307–1312. doi: 10.5194/isprs-archives-XLII-2-W7-1307-2017
Jiang, L., Liu, Y., and Xu, H. (2023). Losing the way or running off? An unprecedented major movement of Asian elephants in Yunnan, China. Land 12:460. doi: 10.3390/land12020460
Jiao, S., Wu, S., Han, Z., and Peng, K. (2022). Spatial-temporal evolution and correlation mechanism of industrial agglomeration and water pollution degree of ‘one lake, four waters’ in Hunan Province. Econ. Geogr. 42, 132–140. doi: 10.15957/j.cnki.jjdl.2022.04.015
Kitratporn, N., and Takeuchi, W. (2022). Human-elephant conflict risk assessment under coupled climatic and anthropogenic changes in Thailand. Sci. Total Environ. 834:155174. doi: 10.1016/j.scitotenv.2022.155174
Koen, E. L., Minnaar, C., Roever, C. L., and Boyles, J. G. (2018). Emerging threat of the 21st century lightscape to global biodiversity. Glob. Change Biol. 24, 2315–2324. doi: 10.1111/gcb.14146
Li, M. Xishuangbanna reserve experts: The final solution is to build’ Asian elephant National Park’ - China news weekly [internet]. (2021). Available at: http://www.inewsweek.cn/society/2021-06-16/12901.shtml (Accessed October 29, 2022).
Li, G., Gao, J., Li, L., and Hou, P. (2020). Human pressure dynamics in protected areas of China based on nighttime light. Glob. Ecol. Conserv. 24:e01222. doi: 10.1016/j.gecco.2020.e01222
Li, W., Liu, P., Guo, X., Wang, L., Wang, Q., Yu, Y., et al. (2018). Human-elephant conflict in Xishuangbanna prefecture, China: distribution, diffusion, and mitigation. Glob. Ecol. Conserv. 16:e00462. doi: 10.1016/j.gecco.2018.e00462
Li, F., Yan, Q., Zou, Y., and Liu, B. (2021). Improving the accuracy of built-up area extraction based on nighttime light data and POI: a case study of NPP/VIIRS and Luojia 1-01 nighttime light images. Geomat. Inf. Sci. Wuhan. Univ. 46, 825–835. doi: 10.13203/j.whugis20190266
Lian, X., Jiao, L., Zhong, J., Jia, Q., Liu, J., and Liu, Z. (2021). Artificial light pollution inhibits plant phenology advance induced by climate warming. Environ. Pollut. 291:118110. doi: 10.1016/j.envpol.2021.118110
Lin, L., Jin, Y., Yang, H., Luo, A., Guo, X., Wang, L., et al. (2015). Habitat evaluation of Asian elephants in Xishuangbanna. Acta Theriol. Sin. 35, 1–13. doi: 10.16829/j.slxb.2015.01.001
Liu, S., Dong, Y., Cheng, F., Zhang, Y., Hou, X., Dong, S., et al. (2017). Effects of road network on Asian elephant habitat and connectivity between the nature reserves in Xishuangbanna, Southwest China. J. Nat. Conserv. 38, 11–20. doi: 10.1016/j.jnc.2017.05.001
Liu, P., Wen, H., Harich, F. K., He, C., Wang, L., Guo, X., et al. (2017). Conflict between conservation and development: cash forest encroachment in Asian elephant distributions. Sci. Rep. 7, 1–10. doi: 10.1038/s41598-017-06751-6
Liu, S., Yin, Y., Li, J., Cheng, F., Dong, S., and Zhang, Y. (2018). Using cross-scale landscape connectivity indices to identify key habitat resource patches for Asian elephants in Xishuangbanna, China. Landsc. Urban Plan. 171, 80–87. doi: 10.1016/j.landurbplan.2017.09.017
Morshed, M. M., Chakraborty, T., and Mazumder, T. (2022). Measuring Dhaka’s urban transformation using nighttime light data. J. Geovis. Spat. Anal. 6, 1–13. doi: 10.1007/s41651-022-00120-2
Rowell, Z. (2014). Locomotion in captive Asian elephants (Elephas maximus). J. Zoo Aquar. Res. 2, 130–135. doi: 10.19227/jzar.v2i4.50
Shi, K., Chen, Y., Yu, B., Xu, T., Chen, Z., Liu, R., et al. (2016). Modeling spatiotemporal CO2 (carbon dioxide) emission dynamics in China from DMSP-OLS nighttime stable light data using panel data analysis. Appl. Energy 168, 523–533. doi: 10.1016/j.apenergy.2015.11.055
Shi, K., Wu, Y., Li, D., and Li, X. (2022). Population, GDP, and carbon emissions as revealed by SNPP-VIIRS nighttime light data in China with different scales. IEEE Geosci. Remote Sens. Lett. 19, 1–5. doi: 10.1109/LGRS.2022.3195266
Venter, O., Sanderson, E. W., Magrach, A., Allan, J. R., Beher, J., Jones, K. R., et al. (2016). Sixteen years of change in the global terrestrial human footprint and implications for biodiversity conservation. Nat. Commun. 7:12558. doi: 10.1038/ncomms12558
Watson, J. E. M., Negret, P. J., Maxwell, S. L., Allan, J. R., Fuller, R. A., Venter, O., et al. (2018). One-third of global protected land is under intense human pressure. Science 360, 788–791. doi: 10.1126/science.aap9565
Xu, P., Wang, Q., Jin, J., and Jin, P. (2019). An increase in nighttime light detected for protected areas in mainland China based on VIIRS DNB data. Ecol. Indic. 107:105615. doi: 10.1016/j.ecolind.2019.105615
Yang, J., and Huang, X. (2021). The 30 m annual land cover dataset and its dynamics in China from 1990 to 2019. Earth Syst. Sci. Data 13, 3907–3925. doi: 10.5194/essd-13-3907-2021
Yu, J., Li, F., Wang, Y., Lin, Y., Peng, Z., and Cheng, K. (2020). Spatiotemporal evolution of tropical forest degradation and its impact on ecological sensitivity: a case study in Jinghong, Xishuangbanna, China. Sci. Total Environ. 727:138678. doi: 10.1016/j.scitotenv.2020.138678
Zhang, L., Dong, L., Lin, L., Feng, L., Yan, F., Wang, L., et al. (2015). Asian elephants in China: estimating population size and evaluating habitat suitability. PLoS One 10:e0124834. doi: 10.1371/journal.pone.0124834
Zhao, X., Yu, B., Liu, Y., Yao, S., Lian, T., Chen, L., et al. (2018). NPP-VIIRS DBN daily data in natural disaster assessment: evidence from selected case studies. Remote Sens. 10:1526. doi: 10.3390/rs10101526
Zheng, Z., Wu, Z., Chen, Y., Guo, G., Cao, Z., Yang, Z., et al. (2021). Africa’s protected areas are brightening at night: a long-term light pollution monitor based on nighttime light imagery. Glob. Environ. Change. 69:102318. doi: 10.1016/j.gloenvcha.2021.102318
Keywords: night-time light, protected area, Asian elephant, human activities, Xishuangbanna
Citation: Zhao F, Zhang Y, Zhao Z, Wang X, Zhang S, Luan G, Zhang Q, Zhu L and Liu H (2023) Monitoring of human activities around the Asian elephant reserve based on NPP-VIIRS night light remote sensing images: A case study in Xishuangbanna, China. Front. Ecol. Evol. 11:1088722. doi: 10.3389/fevo.2023.1088722
Edited by:
Wei Jiang, China Institute of Water Resources and Hydropower Research, ChinaCopyright © 2023 Zhao, Zhang, Zhao, Wang, Zhang, Luan, Zhang, Zhu and Liu. This is an open-access article distributed under the terms of the Creative Commons Attribution License (CC BY). The use, distribution or reproduction in other forums is permitted, provided the original author(s) and the copyright owner(s) are credited and that the original publication in this journal is cited, in accordance with accepted academic practice. No use, distribution or reproduction is permitted which does not comply with these terms.
*Correspondence: Zhifang Zhao, enpmXzEwMDJAMTYzLmNvbQ==