 Tianyuan Wang
 Benjamin A. Bell
 William J. Fletcher
 Peter A. Ryan1
 Roy A. Wogelius
- 1Quaternary Environments and Geoarchaeology Research Group, Department of Geography, School of Environment, Education and Development, University of Manchester, Manchester, United Kingdom
- 2Interdisciplinary Centre for Ancient Life (ICAL), Department of Earth and Environmental Sciences, School of Natural Sciences, University of Manchester, Manchester, United Kingdom
Introduction: Biological life, atmospheric circulation and the Earth’s climate may be influenced by UV-B radiation. In plants, Ultraviolet Absorbing Compounds (UACs) are an indicator of UV-B exposure, and the abundance of UACs in pollen and spores of embryophytes is measurable using Fourier Transform Infrared (FTIR) micro-Spectroscopy. However, understanding the influence of common chemical pre-treatments on sub-fossil pollen and spores with a view to UV-B reconstruction still requires investigation.
Methods: Here, peat samples collected from a Late Holocene raised bog were treated with different chemicals (HCl, KOH, and acetolysis) for varying treatment times (up to 210 min). Pollen or spores of three common taxa (Alnus, Calluna and Sphagnum) were isolated and FTIR spectra obtained on individual grains. The spectra were compared to modern pollen and spore samples collected nearby.
Results: Spectra of modern and sub-fossil samples show several visible differences related to lipid and protoplast contents. The results of chemical treatments on sub-fossil pollen and spores reveal that HCl produced limited changes, while KOH and acetolysis altered several peaks, including the UAC-related aromatic peak at 1516 cm−1. We observe that all treatments modify the FTIR spectra to some degree, from weakest (HCl) to strongest (acetolysis). With respect to reduction of UAC peak area and treatment time, we observe in some cases a significant log-decay relationship, notably for KOH treatment on Calluna pollen and acetolysis on Sphagnum spores. Compared to untreated control samples, UAC peak area in Alnus, Calluna and Sphagnum reduced by 68%, 69% and 60% respectively, after only 3 min of acetolysis treatment. After 60 minutes of acetolysis treatment UAC peaks were reduced by 77%, 84% and 88%.
Discussion: Due to the potential for taxon-specific effects and significant reductions in UAC peak area even within short treatment times, our recommendation for future applications in palaeoecological studies on palynomorph chemistry is to avoid chemical digestions in the pollen extraction process in favour of separation methods including micro-sieving and density separation.
1. Introduction
Sporopollenin is an organic polymer that makes up the outer wall of pollen and spores. It is one of the most resilient and stable natural polymers known, and serves a vital function in protecting the chromosomal content of pollen and spores when they are released into the environment (Mackenzie et al., 2015). This resilience allows for palaeoecological investigation using pollen and spores preserved in geological deposits spanning millions of years. Sporopollenin is a highly cross-linked biopolymer comprising multiple organic compounds and functional groups. Previous research has revealed the main constituents of sporopollenin to be carbon, oxygen and hydrogen in the form of straight- and branched-aliphatic chains, oxygenated aromatic rings and phenylpropanoid moieties (Ahlers et al., 2000; Li et al., 2018). Organic groups of carboxylic acid, phenol, alkane and alkene were found to be relevant to the antioxidant properties of sporopollenin, radiation absorbance and the resilience of the pollen wall to both chemical and physical degradation (Wiermann and Gubatz, 1992; Kim and Douglas, 2013; Thomasson et al., 2020). The chemical composition of sporopollenin is a key focus of chemical palynology, a promising and growing scientific field that bridges biology, ecology and palaeoecology through the investigation of hereditary and environmental signals registered in palynomorph chemistry, employing varied methodological approaches used for their detection and characterisation (Zimmermann et al., 2015; Seddon et al., 2019).
Ultraviolet Absorbing Compounds (UACs) within sporopollenin including p-coumaric acid and ferulic acid are produced as a direct response to UV-B radiation exposure, where greater exposure results in higher concentrations of these compounds (Rozema et al., 1997; Caldwell et al., 1998). UACs help the plant to mitigate the damaging effects of UV-B radiation (Caldwell and Flint, 1994). There are many analytical methods for UAC detection in sporopollenin including Fourier-Transformed Infrared Spectroscopy (FTIR; Watson et al., 2007; Barry et al., 2008; Fraser et al., 2011), Nuclear Magnetic Resonance (NMR; Rouge et al., 2013), Raman Spectroscopy (Kenđel and Zimmermann, 2020) and Gas Chromatography Mass Spectrometry (GC–MS; Rozema et al., 2001; Willis et al., 2011; Seddon et al., 2017). Among these approaches, FTIR microscopy allows for rapid and non-destructive analysis on individual spores and pollen grains providing semi-quantitative results. Investigations into the effect of UV-B on UAC concentrations have been carried out, including greenhouse experiments (Rozema et al., 2009), where enhanced UAC concentrations in spores and pollen were observed after exposure to UV-B. In another study, Lycopodium spores collected from partially and fully shaded outdoor fields indicated lower levels of UACs in FTIR spectra due to lower UV-B exposure (Fraser et al., 2011; Jardine et al., 2017). In modern Cedrus atlantica pollen collected from the species’ native habitat across Morocco, UAC concentrations were correlated with summer UV-B levels, where higher UV-B exposure resulted in higher amounts of UACs (Bell et al., 2018). These studies indicate a promising avenue to understanding past UV-B flux through building a library of proxy records of UAC peaks from pollen grains and spores (Seddon et al., 2019). A small but growing number of studies explore UAC variability in ancient pollen and spores on a range of timescales (Jardine et al., 2020) and further studies are required to develop a fuller picture of UAC variability in time and space.
A particular challenge for the study of pollen and spores by IR spectroscopy is the difficulty in generating reproducible spectra due to light scattering effects. Such Mie scattering may occur when scanning spherical particles with diameter approximately equal to the wavelength of the incident light. For biological materials of 5–150 μm in size, the corresponding wavenumbers of incident light would be ~60–2000 cm−1, overlapping with majority of near and mid infrared range. The tendency of pollen grains to variously fold or crumple as well as to present in different orientations (e.g., polar vs. equatorial) contribute to the complexity of scattering effects (Zimmermann, 2018; Diehn et al., 2020). Among studies applying FTIR on biological materials, Mie scattering effects were usually considered as “artifacts” that would distort the spectral baseline (Baker et al., 2014), and extra correction was applied through different approaches. One approach is a “physical based” methodology of embedding pollen samples into a soft paraffin matrix medium to avoid scattering caused by the spherical boundary of palynomorph grains (Zimmermann et al., 2016; Diehn et al., 2020). Alternatively, multi-grain measurement using a larger FTIR microscopy aperture size could also diminish spectral artifacts caused by spherical shape of individual grain (Jardine et al., 2021). In contrast to “physical based” methodology, Konevskikh et al. (2018) applied mathematical models on individual spectra from biological cells to explain all sample effects including Mie scattering. Also, individual spectra treated by extended multiplicative signal correction (EMSC) could also be averaged to minimise scattering effects, serving as another approach to calibrate FTIR spectra without complex mathematical models (Zimmermann, 2018). Considering large quantities of spectra for sub-fossil palynomorph analysis, averaged spectra treated by fundamental baseline correction algorithms (e.g., EMSC) could be a practical approach to deal with spectral artifacts from Mie scattering.
With a view to the generation of new records of past UAC variability with FTIR spectroscopy, our main concern is the potential for chemical treatments to influence the sporopollenin chemistry. Standard pollen preparation techniques for the purpose of identification and counting of pollen types require concentration of pollen from peat or sediments and typically involve several chemical treatments, including hydrochloric acid (HCl) for removal of carbonates, potassium hydroxide (KOH) for digestion of humic acids, and acetolysis (strictly, acetylation) for the destruction of cellulose (Erdtman, 1960; Bennett and Willis, 2002). In this study we focus on these three common pretreatments but recognise that other chemicals may be routinely used, such as hydrofluoric acid (HF) for the digestion of silicates and nitric acid (HNO3) for the removal of sulphide minerals (Riding, 2021); indeed, pollen preparation treatments typically vary between research laboratories and must be modified to suit different applications. Palynomorphs are generally resistant to HCl, but some studies indicate that it may chlorinate, hydrolyse and oxidise organic matter, including palynomorphs (Durand and Nicaise, 1980). Alkali digestion is known to damage palynomorphs, particularly over long treatment times, with differential impacts on different pollen types (Godwin, 1934). Acetolysis is also widely recognised to cause significant damage to palynomorphs as well as imparting size and colour changes (Riding, 2021). For the extraction of palynomorphs in classical pollen analysis of Quaternary peats or lake sediments, the influence of chemical treatments is of limited consequence as long as the material retains the key morphological features required for identification and selective loss or destruction of delicate palynomorphs does not occur. Most protocols therefore restrict the application of the more aggressive treatments to short durations, such as up to 10 min for KOH treatment and up to 5 min (rarely up to 30 min) for acetolysis (Charman, 1992). However, an important question is whether such typical applications of common preparation chemicals may impact on the detection and quantification UAC peaks via the FTIR method.
Previously, Jardine et al. (2015) examined the impact of acetolysis treatment on UACs measured using FTIR, on fresh (modern) Lycopodium spores with cold (room temperature) and hot (90°C) acetolysis. Cold acetolysis treatment had little impact on the FTIR spectra while hot acetolysis showed UAC peak height reductions within 2 to 3 min of treatment, followed by further limited changes with longer treatment times. Jardine et al. (2015) attributed the observed changes within the first 10 min to the removal of the protoplasm, intine and other compounds in the modern grains. Correspondingly, they suggested that acetolysis should make little difference to UAC peaks in ancient (sub-fossil) pollen and spores under normal treatment durations (<10 min), as sub-fossil palynomorphs retain exine (sporopollenin) only. However, since Jardine et al. (2015) only used modern spores which contain non-resilient constituent components including the pollenkitt (outer coating) and protoplasm (internal contents), discrimination of FTIR changes resulting from loss of those components vs. impacts on the sporopollenin itself could only be inferred. It is therefore necessary to use sub-fossil samples to investigate directly the impact of chemical treatment on sporopollenin since this is highly relevant for studies on sub-fossil pollen and spores from bogs, lakes and other deposits. In a later study, Jardine et al. (2021) examined the informative “fingerprint” area (1800–1,000 cm−1) of the FTIR spectrum in multiple samples from different case studies that included processing using different chemical treatment protocols (including by HCl, KOH and acetolysis); thus, questions remain about whether any of the noted spectral differences might result from the use of chemical treatments, or simply due to species-specific differences in pollen chemistry, or between modern and sub-fossil samples. Jardine et al. (2021) raised several perspectives from this study: (1) the extent of chemical impacts on sub-fossil samples is still unclear; (2) chemical changes over short geological timescales have to be considered when explaining such spectral difference; (3) further experiments were needed to disentangle the impacts of different processing reagents. Accordingly, there is a need for further investigation of the influence of common palynological extraction techniques on sporopollenin chemistry, specifically for Quaternary sub-fossil material. Additionally, it is important to understand the effect of these treatments across different spore and pollen types.
Here, we report a set of experiments designed to investigate the impacts of chemical treatments on the chemistry of sub-fossil spores and pollen grains, as observed in FTIR spectra, with special attention to the UAC related peak. We select three palynomorphs representing different plant lineages, growth forms and sporulation/pollination times: Sphagnum (family Sphagnaceae), the typical peat-forming bryophyte that produces trilete microspores in summer; Calluna (family Ericaceae), a semi-dwarf evergreen angiosperm shrub that produces pollen in colpate tetrads in late summer; and Alnus (family Betulaceae), an angiosperm tree of damp ground that disperses individual, pentazonoporate pollen grains in late winter to early spring. We test the effects of three treatments (HCl, KOH, and acetolysis), which are commonly used in the extraction of palynomorphs from Quaternary deposits for the digestion of carbonates, humic acids and cellulose, respectively. The reasons for these chemical selections are: (1) HCl and KOH should strongly affect on the acid–base property (pH), which would have potential impacts for samples, especially if heated; (2) acetolysis is a widely used chemical treatment for pollen analysis and is typically used at high temperatures. Therefore, special attention should be paid as to whether it alters the chemical structure of sporopollenin and UACs, which could include introducing additional functional groups into the sample material.
Based on the FTIR analysis of individual pollen grains and spores, we seek to address three questions in this study: (1) What are the differences in FTIR spectra between modern and sub-fossil palynomorphs? (2) What are the impacts of common palynological pre-treatments (HCL, KOH and acetolysis) on the FTIR spectra of sub-fossil pollen and spores? (3) Are there differences between taxa after chemical treatments?
2. Methods
2.1. Sample preparation and chemical treatments
Modern Alnus pollen was extracted from catkins of Alnus trees growing near the River Mersey in Greater Manchester, NW England in February 2020. Modern Calluna pollen and Sphagnum spores were collected from fresh Sphagnum moss from Rindle Moss, near Manchester during October 2022. Pollen and spores were separated from other plant tissues by sieving and washes with type-1 deionised water. Microscopic inspection confirmed the presence of the protoplasm in the pollen and spores. The modern palynomorphs were washed by pyrophosphate (Na4P2O7) and centrifugated in sodium polytungstate (SPT), and then oven-dried (105°C, 8 min), before FTIR analysis; in this way, a consistent pretreatment was ensured between modern and sub-fossil palynomorphs. As described below for sub-fossil samples, we performed checks to ensure that sodium pyrophosphate and SPT were not influential in the results.
The sub-fossil spore and pollen samples were obtained from a 360 cm peat core (HM20), which was collected using a Russian corer from an ombrotrophic raised bog at Holcroft Moss, NW England (53°26′09.4”N, 2°28′31.4”W, 23 m.a.s.l.). Peat samples were taken at seven depth ranges (42–47 cm, 81–89 cm, 121–129 cm, 161–169 cm, 201–209 cm, 241–249 cm, and 281–289 cm). Sample ages were estimated by Bayesian age-depth modelling in the R package “Bchron” (Haslett and Parnell, 2008) incorporating 11 AMS radiocarbon dates and a core-top date constraint (Table 1); the resulting sample ages span the last ca. 2,600 years (Table 2). The full age model is shown in Supplementary Figure 1. Samples of 21–30 g were taken from each depth range, and were further divided into 20 subsamples for chemical treatment experiments (~1.5 g of peat material was used in each treatment group) including control samples.
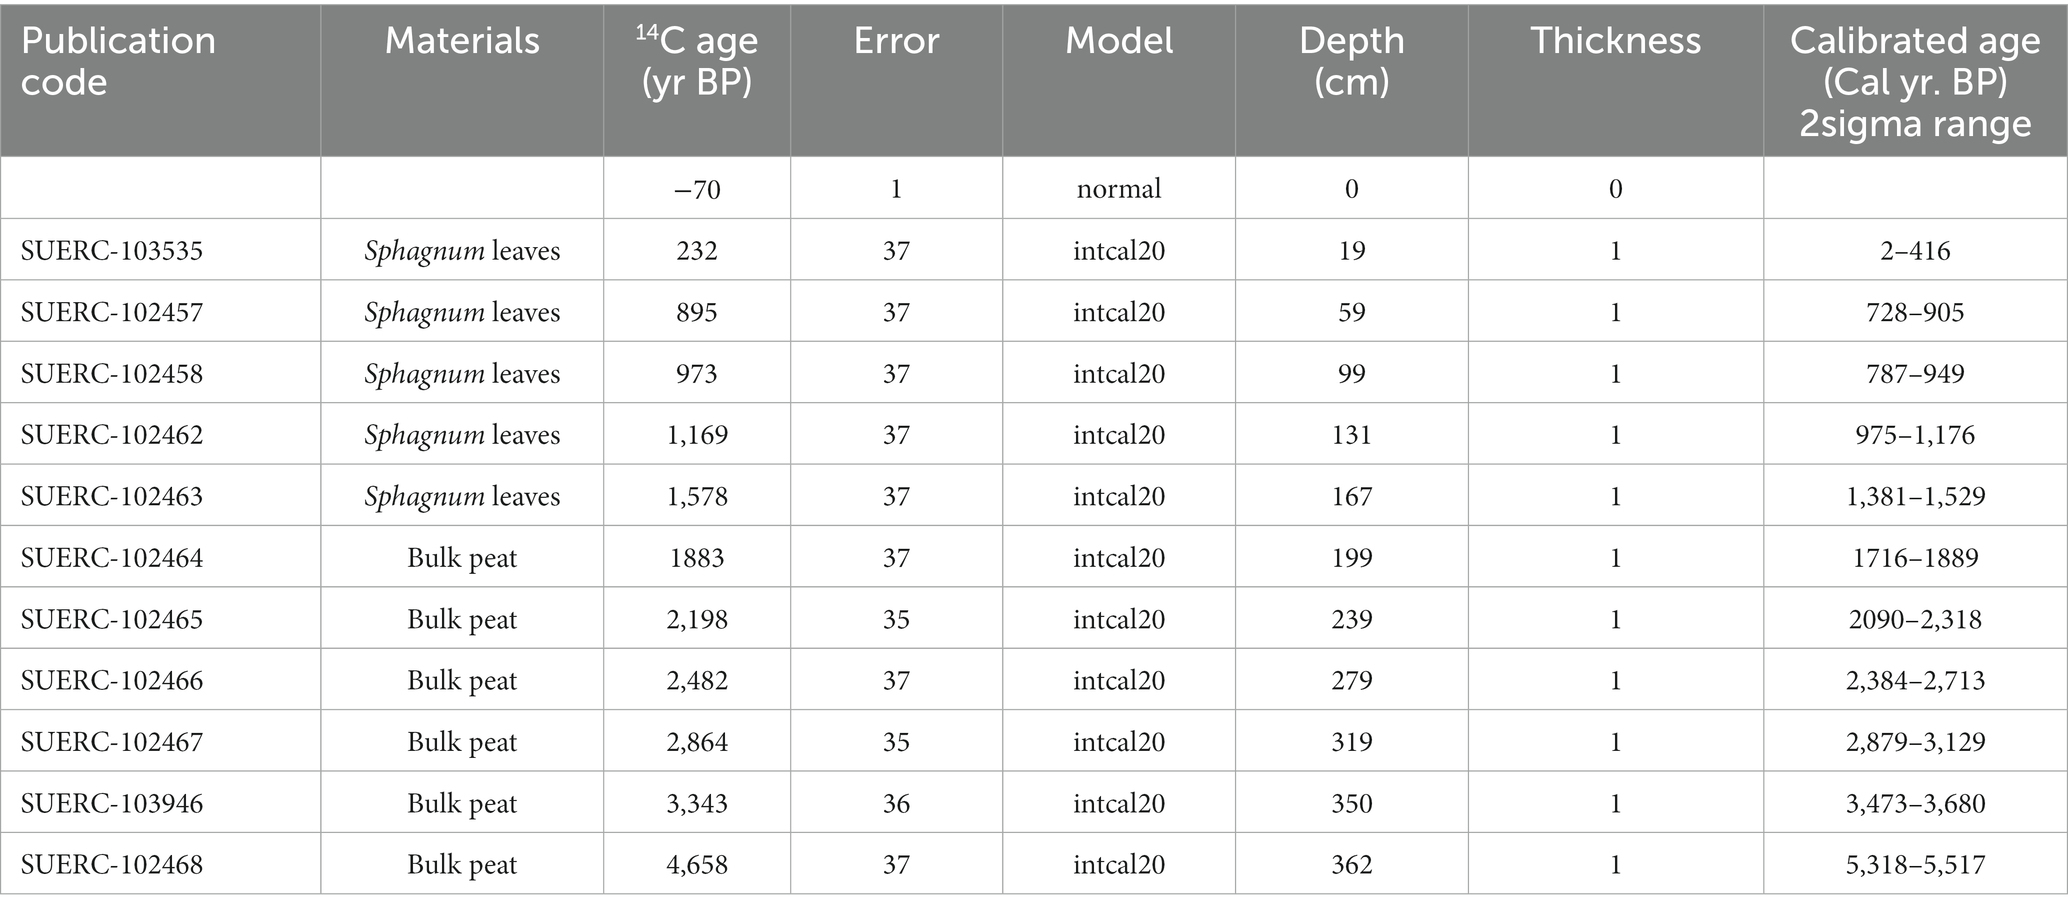
Table 1. Chronological data for HM20 core.
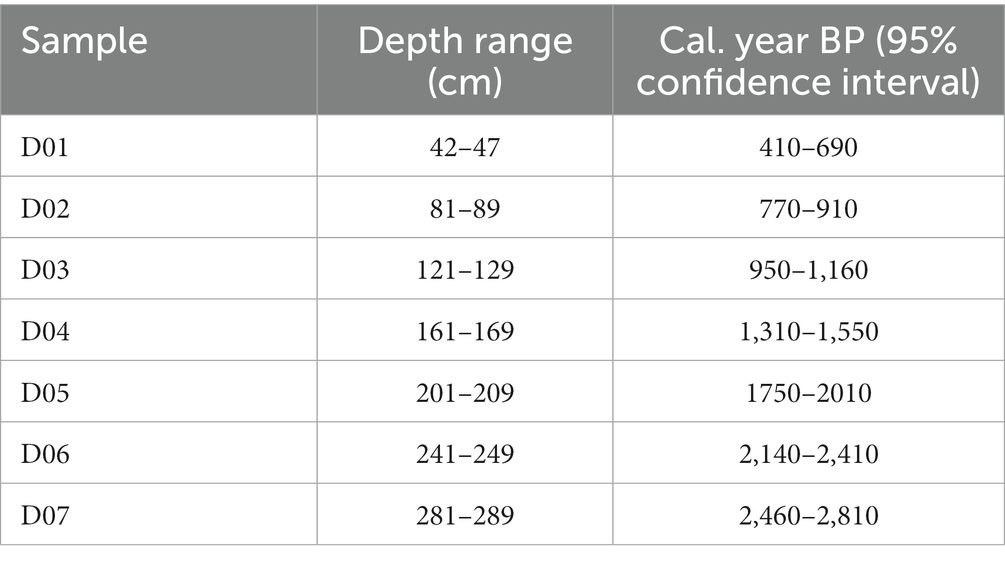
Table 2. Estimated ages of samples based on AMS radiocarbon dating.
For acid and alkali treatments, peat samples were placed in 50 ml centrifuge tubes with either 10% (v/v) hydrochloric acid (HCl) or 10% (w/v) potassium hydroxide (KOH) and placed in the water bath at 90°C for treatment times of 5, 10, 30, 60, 120, and 210 min. For acetolysis, peat samples were firstly dehydrated in glacial acetic acid prior to addition of Erdtman (1960) acetolysis mixture (9 parts acetic anhydride and 1 part concentrated 18.4 M sulphuric acid). Samples were placed in a hot water bath at 90°C for treatment times of 1, 3, 5,10, 30, 60, and 120 min. Immediately on removal from the water bath, the reaction was stopped by topping up the samples with glacial acetic acid. Following all treatments, samples were centrifuged and washed with type-1 deionised water (3 cycles). Different treatment times were chosen to cover a range of typical treatment applications, as well as to extend into much longer than typical treatment times. Control samples received only water washes.
2.2. Isolation of pollen grains
Pollen grains of Alnus and Calluna and Sphagnum spores were subsequently isolated from each sample (control and different treatments). Palynomorphs were first concentrated by micro-sieving (Heusser and Stock, 1984) using mesh sizes of 63 and 32 microns (retaining the intermediate fraction <63 μm and > 32 μm). Then, sodium pyrophosphate (Na4P2O7) washes (Bates et al., 1978) were used help disaggregate the samples prior to density separations using sodium polytungstate (SPT; Nakagawa et al., 1998) following the method outlined in Bell et al. (2019). In this study, we used density floats at 1.6 s.g. and 1.2 s.g, retaining the intermediate fraction with density < 1.6 s.g. and > 1.2 s.g. Lastly, the concentrates were given multiple washes with type-1 deionised water to remove any traces of SPT and to clean the residues.
To investigate any potential impacts on FTIR spectra by Na4P2O7 and SPT used during procedures above, we also isolated one additional sample for each taxon directly acquired from the peat cores without the use of either Na4P2O7 or SPT. These samples were washed in type-1 deionised water only before being sent for FTIR scanning. Spectra of pure Na4P2O7 and SPT (Supplementary Figure 2) were also analysed. We did not find any impact on pollen spectra of the use of Na4P2O7 and SPT in the sample preparation or potential for distortion of the critical UAC peak at ~1,516 cm−1 (Supplementary Figure 3). In the spectra for sodium pyrophosphate, we identified a peak occurring at ~1,084 cm−1 (related to phosphates), and in the SPT, a peak occurring at ~1,616 cm−1, which were within the fingerprint region. There were also additional peaks occurring below ~900 cm−1, outside the fingerprint region. The peak at 1616 cm−1 was already present in pollen and spores (i.e., pollen with only water washes), while there were also peaks occurring near to (but not at) ~1,084 cm−1 in pollen and spores. Comparing the water washed pollen spectra to the sodium spectra, we could see no observable difference in the spectra, and no impact on the UAC peak at 1516 cm−1 (Supplementary Figure 3). At the two identified peaks that were present in the sodium (1,616 cm−1 and 1,084 cm−1), again, there are no observable influences (e.g., peak height seems unaffected in the treated pollen).
A droplet of pollen concentrate was placed onto a well slide using a plastic Pasteur pipette and viewed using a Leica inverted optical microscope (OM) with built-in digital camera. Individual pollen grains and spores were then hand-picked from these residues using a mouth operated pipette (Mensing and Southon, 1999). Pollen and spores were transferred to zinc selenide (ZnSe) microscope slides, with each taxon placed in a separate region of the slide. These slides were then dried in an oven at 105°C for 8 min prior to FTIR analysis.
2.3. FTIR analysis
Samples were analysed using a Perkin Elmer Spotlight 400 Fourier Transform Infrared (FTIR) Imaging System equipped with continuum IR microscope (using a Reflachromat 15 × objective) and fitted with MCT-A liquid nitrogen-cooled detector. FTIR analysis was performed on approximately 30 individual pollen grains and spores for each sample. After comparing spectra qualities from our samples under different aperture sizes (available in Supplementary Figure 4), we used transmission mode with an aperture size of 30 μm × 30 μm for Alnus, and 40 μm × 40 μm for Calluna and Sphagnum. Supplementary Figure 5 shows the common palynomorph grain sizes for three taxa in this study, and indicates the aperture sizes we used covered either most or entire grains/spores. Background spectra on a blank region of ZnSe window were generated before each sample run and subtracted from pollen and spore spectra. To investigate an adequate number of scans, we compared spectral noise with different numbers of scans (Supplementary Figure 6), and a value of 16 was selected, which had adequate noise removal and clear peak information. Also, the Spotlight 400 system employs bi-directional scanning which means we process more data points per scan reducing the noise. Both background and pollen/spore spectra were measured using 16 scans at a resolution of 4 cm−1 in the range between 4,000 and 650 cm−1. In total, we studied 420 samples (20 control or treatment types x 7 depths x 3 taxa). These 420 samples each comprising a mean of 26 ± 6 spores or pollen grains were analysed using FTIR constituting a total body of >11,000 FTIR measurements on individual palynomorphs. When results are averaged across the seven depths, results for each treatment type are based on ~190 individual palynomorphs for each taxon. The numbers of spectra analysed for this study in each sample and taxon are provided in Supplementary Table 1.
2.4. Statistical analysis
Data processing was carried out using R v4.1.2 (R Core Team, 2021), following a spectral-averaging approach as used in recent FTIR pollen studies by Zimmermann (2018) and Jardine et al. (2021). To reduce the effect of noise, individual spectra were first smoothed using a Savitzky–Golay filter using a 2nd degree polynomial with a window size of 11 using the “prospectr” package (Stevens and Ramirez-Lopez, 2020). All individual smoothed spectra were also checked to remove anomalous spectra, which may result where the FTIR aperture has not been well aligned to the palynomorph or if extraneous matter was adjacent or adherent to the palynomorph. The wavenumber position of six peaks of interest (~2,920 cm−1, ~1700 cm−1, ~1,600 cm−1, ~1,510 cm−1, ~1,160 cm−1, ~1,100 cm−1; see Table 3) was checked manually to ensure peaks occurred at their expected location. Spectra where any three of these peaks were undetectable were deemed not to represent pollen or spores and were excluded from the analysis, resulting in 8% of individual spectra being removed across the entire dataset based on these criteria. As non-negligible impacts from Mie-type scattering effects on FTIR spectra from biological materials were reported by previous studies (Baker et al., 2014; Zimmermann, 2018; Diehn et al., 2020) and can be observed in the raw spectra in our analysis (e.g., Figure 1A), we applied extended multiplicative signal correction (EMSC) on individual palynomorph spectrum, using ‘EMSC’ package in R (Liland, 2021), incorporating third order polynomial effects. A baseline corrected mean spectrum of each sample for each taxon was used as reference spectrum in this model (e.g., Figure 1B). A third order polynomial baseline was applied here for the reference spectrum using the ‘baseline’ package in R (Liland et al., 2010). After running the EMSC, mean spectra for each sample (shown in Supplementary Table 1) were calculated to minimise noise level and furthermore offset Mie-type scattering effects (e.g., Figures 1C,D), resulting in 420 EMSC corrected, averaged spectra (henceforth, simply “mean spectrum/a”) for further analysis. We experimented with more advanced ME-EMSC (Mie extinction – extended multiplicative signal correction) methods (Solheim et al., 2019) but did not observe any improvement over the standard EMSC for our samples. A workflow example of the spectral processing described above is presented in Figure 1. Each mean spectrum was normalised to its mean absorbance to make spectra comparable among samples. The mean spectra were used for Principal Components Analysis (PCA) to illustrate clustering patterns of different groups of spectral information, using the ‘ordr’ package (Brunson, 2022). The mean spectra were also used for subsequent peak area calculations.
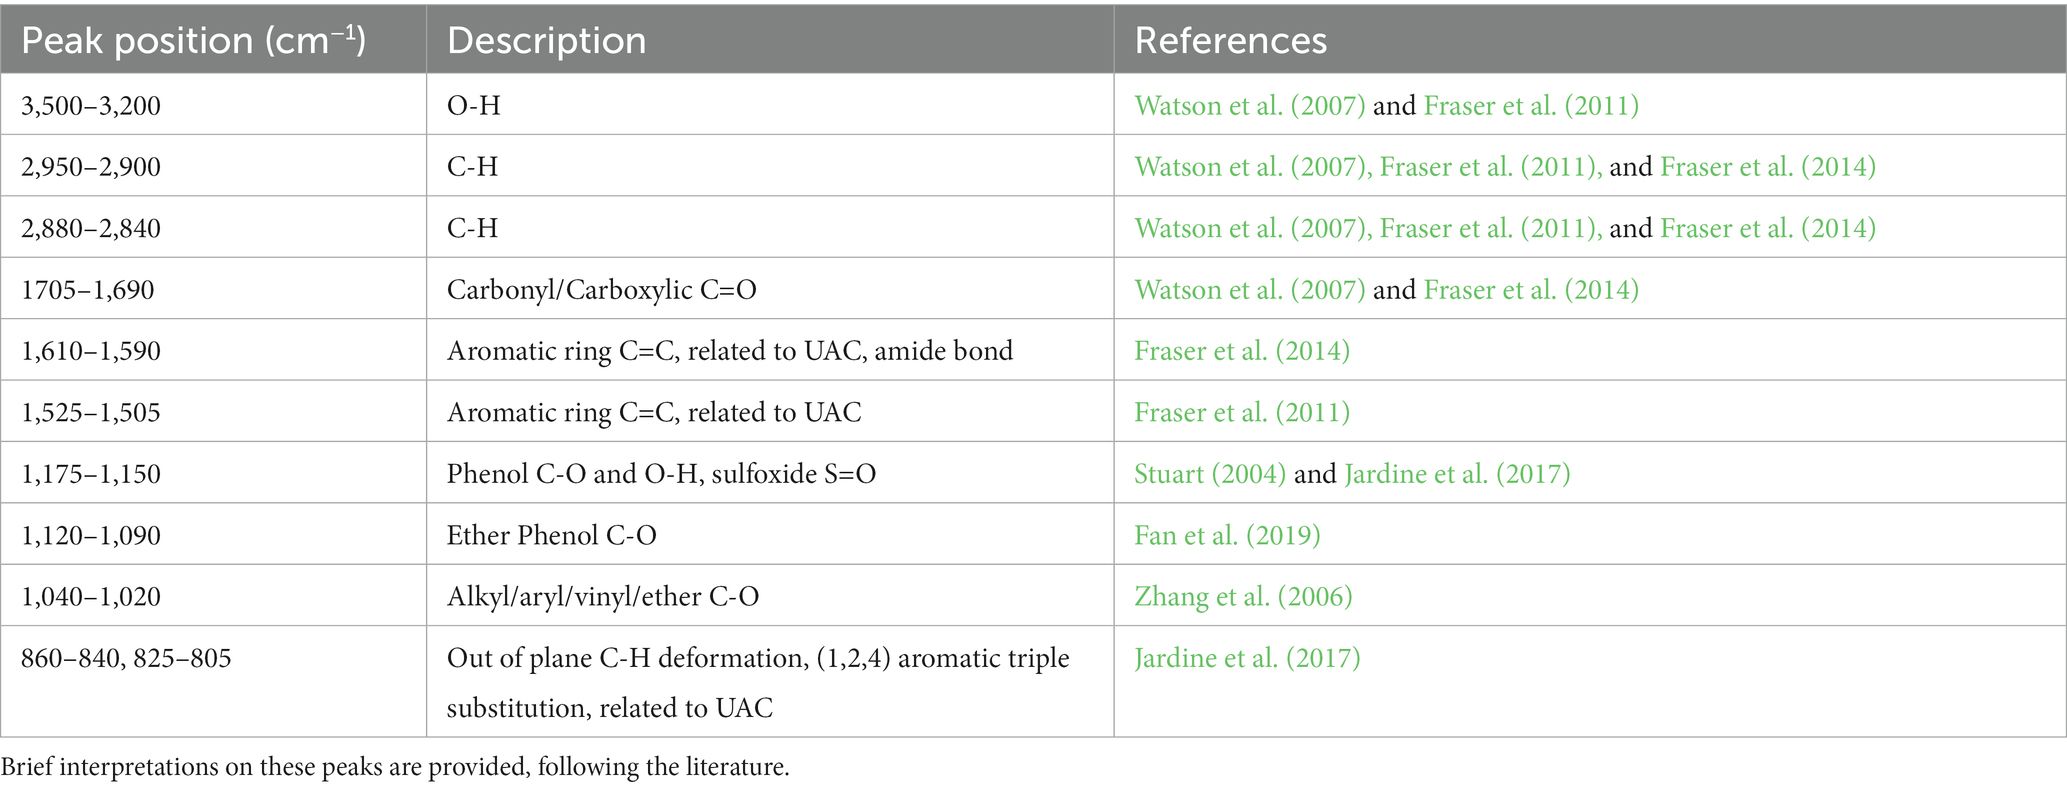
Table 3. Key peaks of interest in the FTIR spectra.
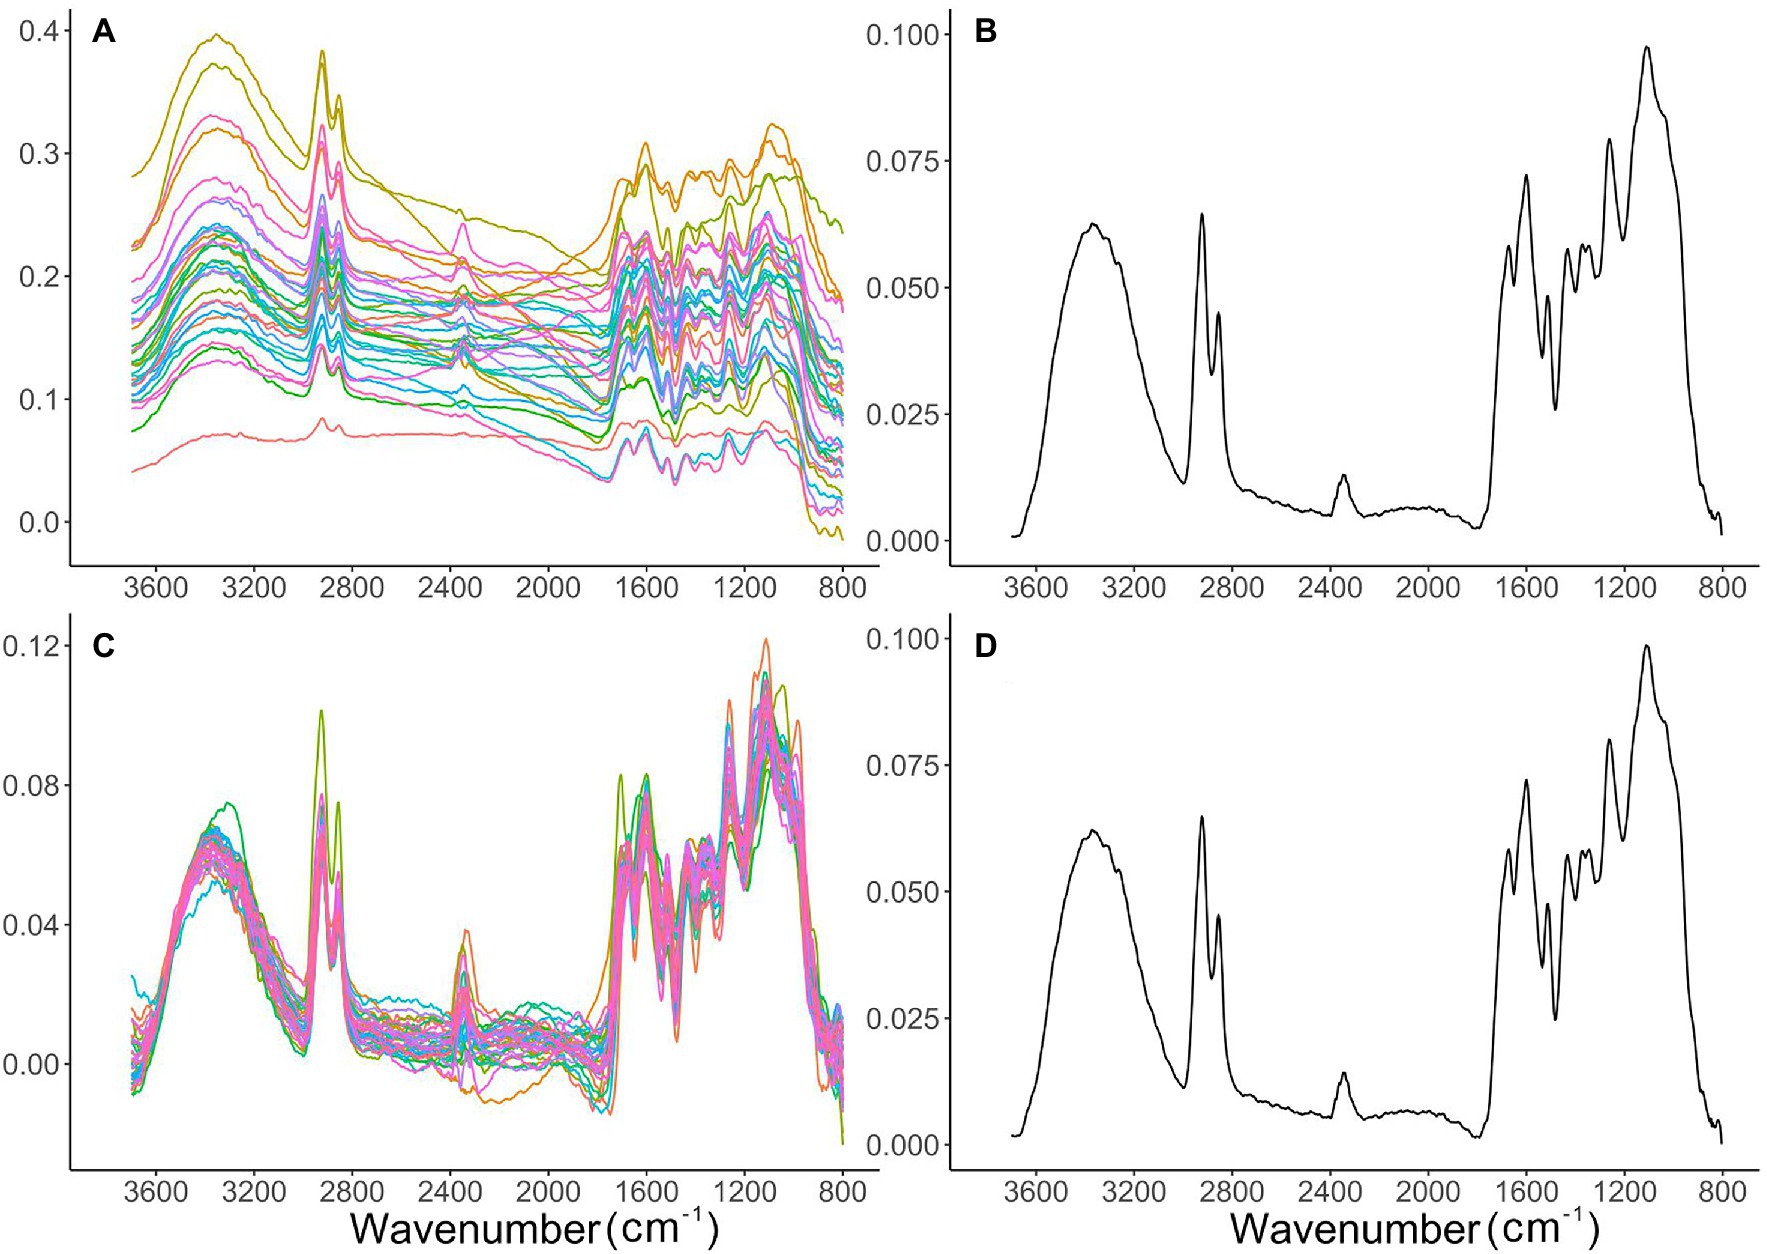
Figure 1. Workflow example of spectral processing. Individual Sphagnum spectra from single palynomorphs in control sample at depth D03 (see Supplementary Table 1) were shown in sequence: (A) smoothed raw spectra; (B) mean spectrum calculated from baseline corrected smoothed raw spectra in (A); (C) extended multiplicative signal correction (EMSC) of smoothed raw spectra in (A), using the spectrum in (B) as the reference spectrum; (D) mean of all EMSC-corrected spectra in (C), which was also the mean spectrum in this sample for further data analysis.
For the detailed analysis of UAC peaks (~1,516 cm−1), peak areas were calculated using a shoelace formula, with a fixed peak range between 1,540 and 1,492 cm−1, similar to Prosr et al. (2016). Peak area offers several advantages over peak height as the unit of measurement, specifically for broadened or overlapped peaks (Prosr et al., 2016). To understand changes in the UAC peak area with treatments, ordinary least squares linear regression was performed on UAC peak area vs. log10 transformed treatment time, due to the mathematically skewed distributions of treatment times. Regression analysis was performed by averaging each treatment type across all core depths, thus minimising any potential influence of variability in humification (decomposition) of the peat material on pollen and spore resilience. Since the control sample had an effective treatment time of 0, we added 1 to all treatment times for the log regression analysis (since log of 0 results in infinity). Mean UAC peak area difference (ΔUAC) between the control sample (no treatment) and the treated samples was calculated. We extracted the slope value of the regression as an indicator of the magnitude of UAC peak reduction across the entire range of treatment times. We also calculated the percentage change in UAC peak area between the control sample and treated sample for each time step to measure the magnitude of peak area change relative to the control (no treatment) sample.
3. Results
3.1. Comparison of modern and sub-fossil spectra by taxon
Figure 2 shows mean spectra of the three taxa investigated from modern (fresh) and control (sub-fossil palynomorphs, no chemical treatment) samples. Overall, there are strong similarities between the modern and sub-fossil material, especially for Calluna and Sphagnum, while the modern and sub-fossil Alnus samples show greater differences, associated with noisier modern spectra for this taxon. In Sphagnum, there is a notable peak occurring at ~3,008 cm−1 (Figure 2, grey shaded bar “i”) in modern spores that is not present in the sub-fossil spores. Additionally, a peak occurring at ~1740 cm−1 (grey shaded bar “ii”) that is evident in all three taxa in modern spores and pollen (albeit weakly so for Calluna), is not evident in the sub-fossil material. Several differences are observed in peaks near 1,600 cm−1 (grey shaded bars “iii-a,b,c”). The UAC peak at ~1,516 cm−1 (grey shaded bar “iv”) is more evident in the sub-fossil samples, consistent with an origin in sporopollenin. Finally, the broad O-H peak (grey shaded bar “v”) is generally reduced in the sub-fossil material relative to the modern.
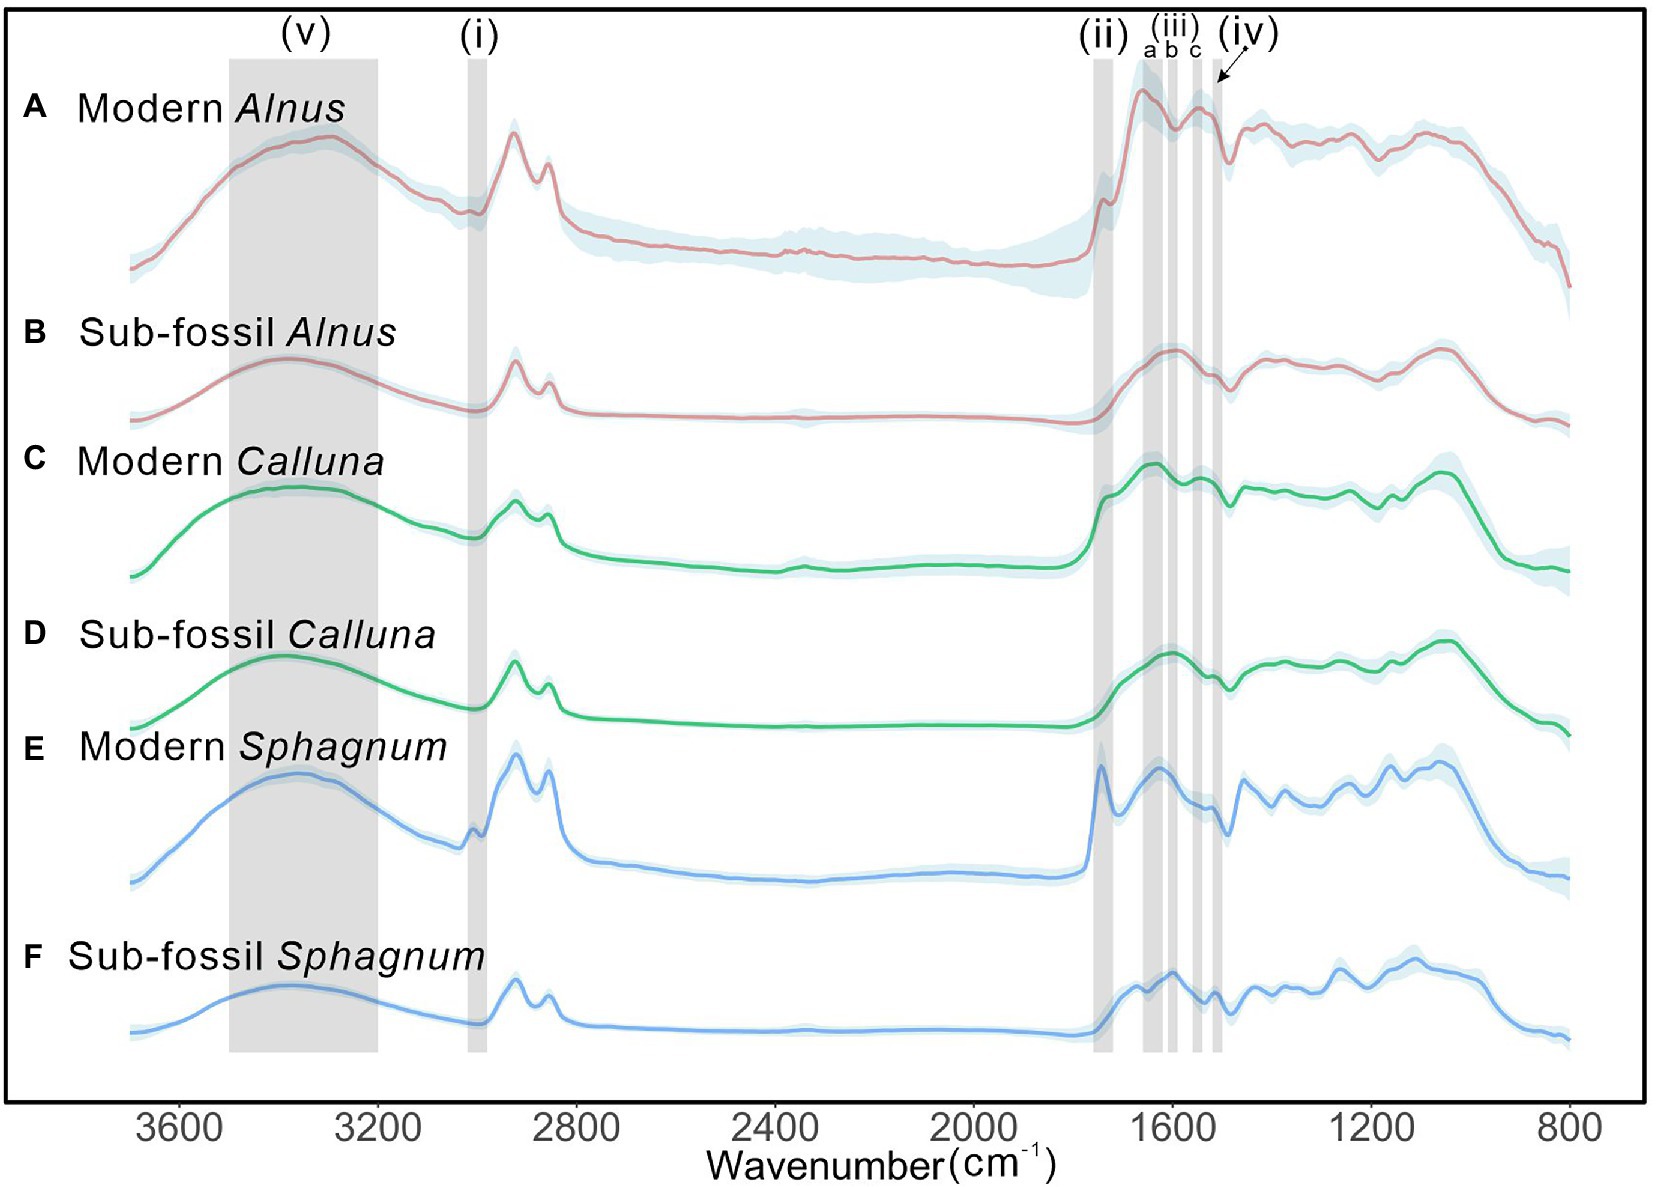
Figure 2. Comparison between FTIR spectra of modern (A,C,E) and sub-fossil (B,D,F) palynomorphs for Alnus (red), Calluna (green) and Sphagnum (blue). Bold lines show the mean spectra and colour-shaded area indicates one standard deviation. Grey bars (i–iii) highlight main regions of difference between modern and sub-fossil spectra, (iv) indicates the UAC peak region at 1516 cm−1, and (v) the O-H peaks around 3,300 cm−1.
3.2. Impacts of chemical treatments on sub-fossil palynomorphs
Figure 3 shows spectral differences between the control (untreated sample) and treated samples for different chemical treatments and treatment durations. HCl treatment does not substantially change the spectra for any of the taxa even at long treatment times, particularly in the fingerprint region (1800–1,000 cm−1). Nevertheless, spectra from the HCl-treated samples for all taxa do show some reduction of the hydroxyl OH peak at ~3,300 cm−1, and we also observe increases in peak height at ~2,850 and ~ 2,930 cm−1 for Alnus at all treatment times, and Calluna and Sphagnum at 210 min treatment.
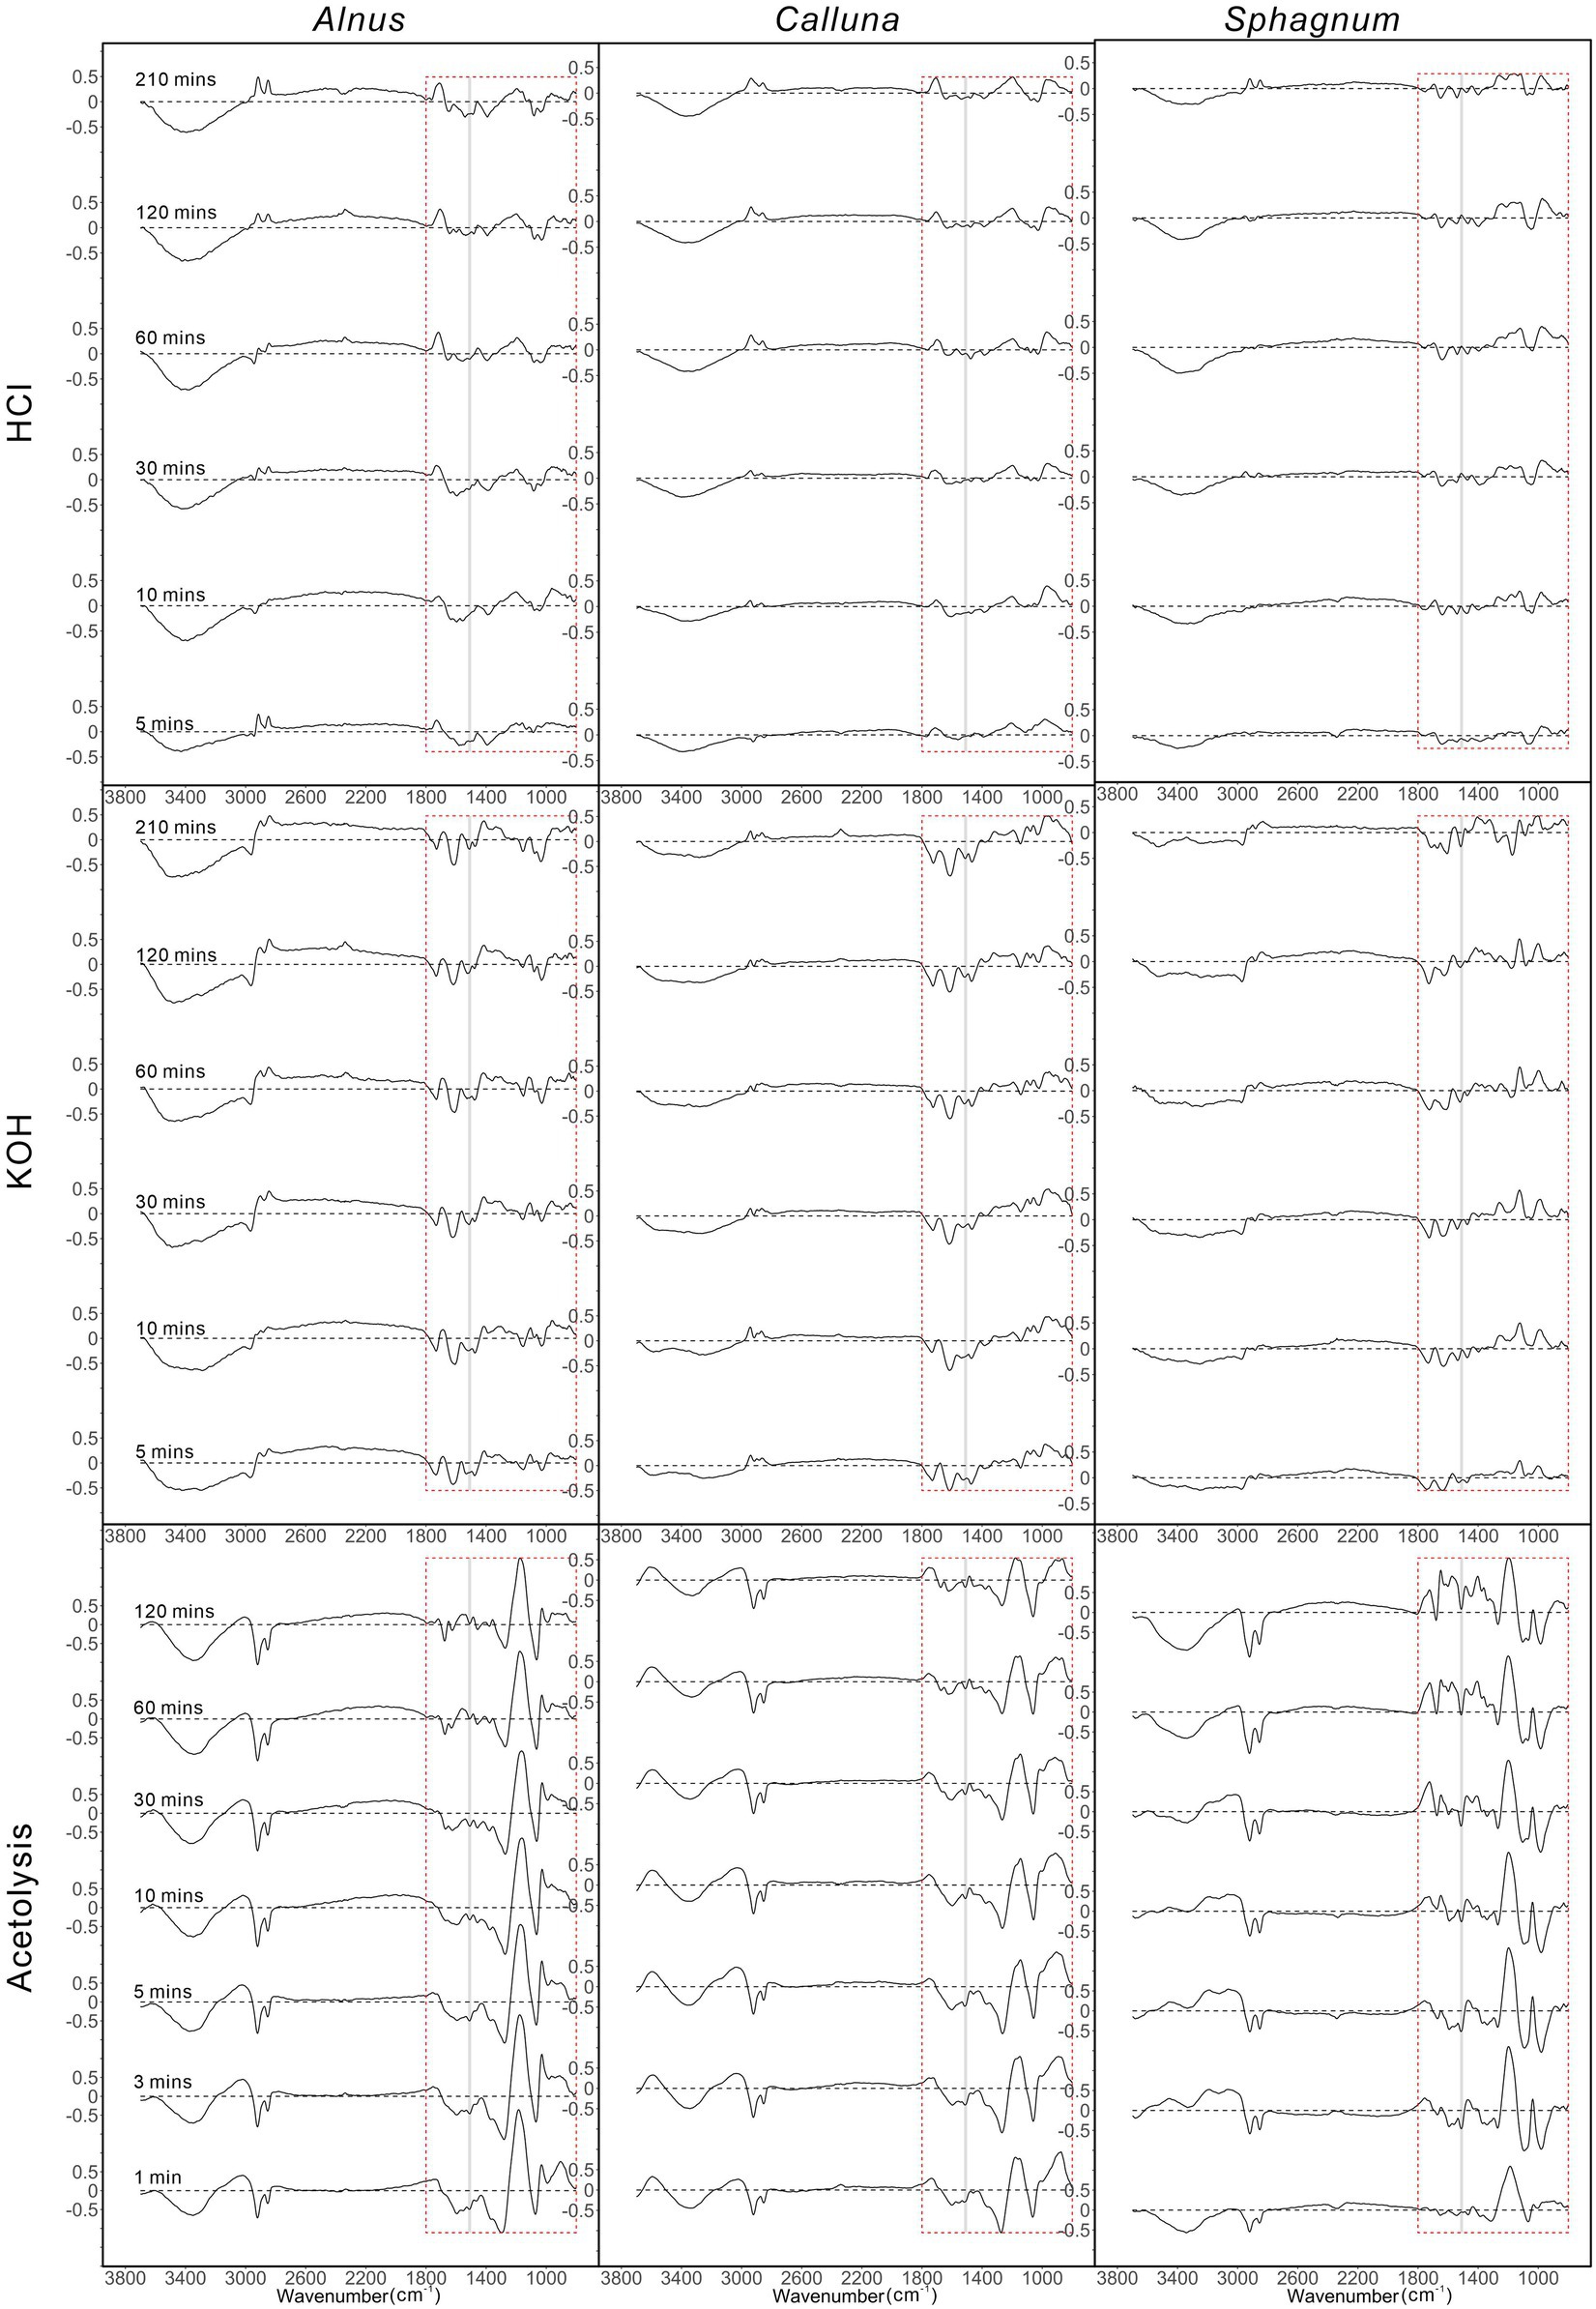
Figure 3. Spectral differences between mean chemical-treated samples and mean control group samples. Grey bar shows the position of the UAC peak related to C=C aromatic bonds at 1516 cm−1. Red dashed boxes outlined the finger-print area.
KOH treatment results in modest changes to the spectra, with spectral changes for all taxa in the fingerprint region. As with HCl, there were reductions to the hydroxyl OH peaks in all taxa, and similarly, increases in peak height for ~2,850 and ~ 2,930 cm−1. The UAC peak at ~1,516 cm−1 is reduced for all treatment times for Alnus and Calluna, but is largely unaffected in Sphagnum for treatment times under 60 min, which is reduced by longer treatment.
Acetolysis treatment shows the most significant spectral changes across all three taxa and all treatment times, even after 1 min of treatment. As with HCl and KOH, the hydroxyl OH peak at ~3,300 cm−1 is reduced for all treatment times for Alnus and Calluna, whereas for Sphagnum, significant reduction occurs after 3 min. In contrast, the peaks at ~2,850 and ~ 2,930 cm−1 are reduced across all three taxa and all treatment times for acetolysis. The UAC peak ~1,516 cm−1 is reduced at all treatment times for Alnus and Calluna, and for treatment times greater than 3 mins for Sphagnum. A strong peak appeared at ~1,140 cm−1 in Alnus and Calluna, and at ~1,200 cm−1 in Sphagnum after being treated for more than 1 min, which was not present in the untreated (control) samples. The ether phenol C-O peak at ~1,100 cm−1 was reduced in all taxa for all treatment times.
The PCA biplot (Figure 4) shows spectral differences among samples between taxa chemical treatments and treatment times. Samples treated with HCl were most similar to the control samples for all taxa and PC scores on both axes are close to the control groups. Similarly, there was a relatively small distance between KOH-treated and control samples. Acetolysed samples plot farther from the control samples and show considerably greater dispersion. PC1 explains 39.5% of the variance and primarily reflects impacts from different treatment chemicals (negative PC1 scores for HCl and KOH treated samples, positive scores for acetolysed samples). PC2 explains 22.3% of the variance and mainly reflects inter-taxon differences, discriminating between all Calluna samples (negative PC2 scores) and the other taxa (positive PC2 scores), and also explaining some variance resulting from treatment time, with generally higher PC2 scores for longer treatment times. The analysis also shows the strongest influence of treatment time for acetolysis treated samples, especially notable for Sphagnum, while there is less effect for HCl and KOH (samples more strongly clustered).
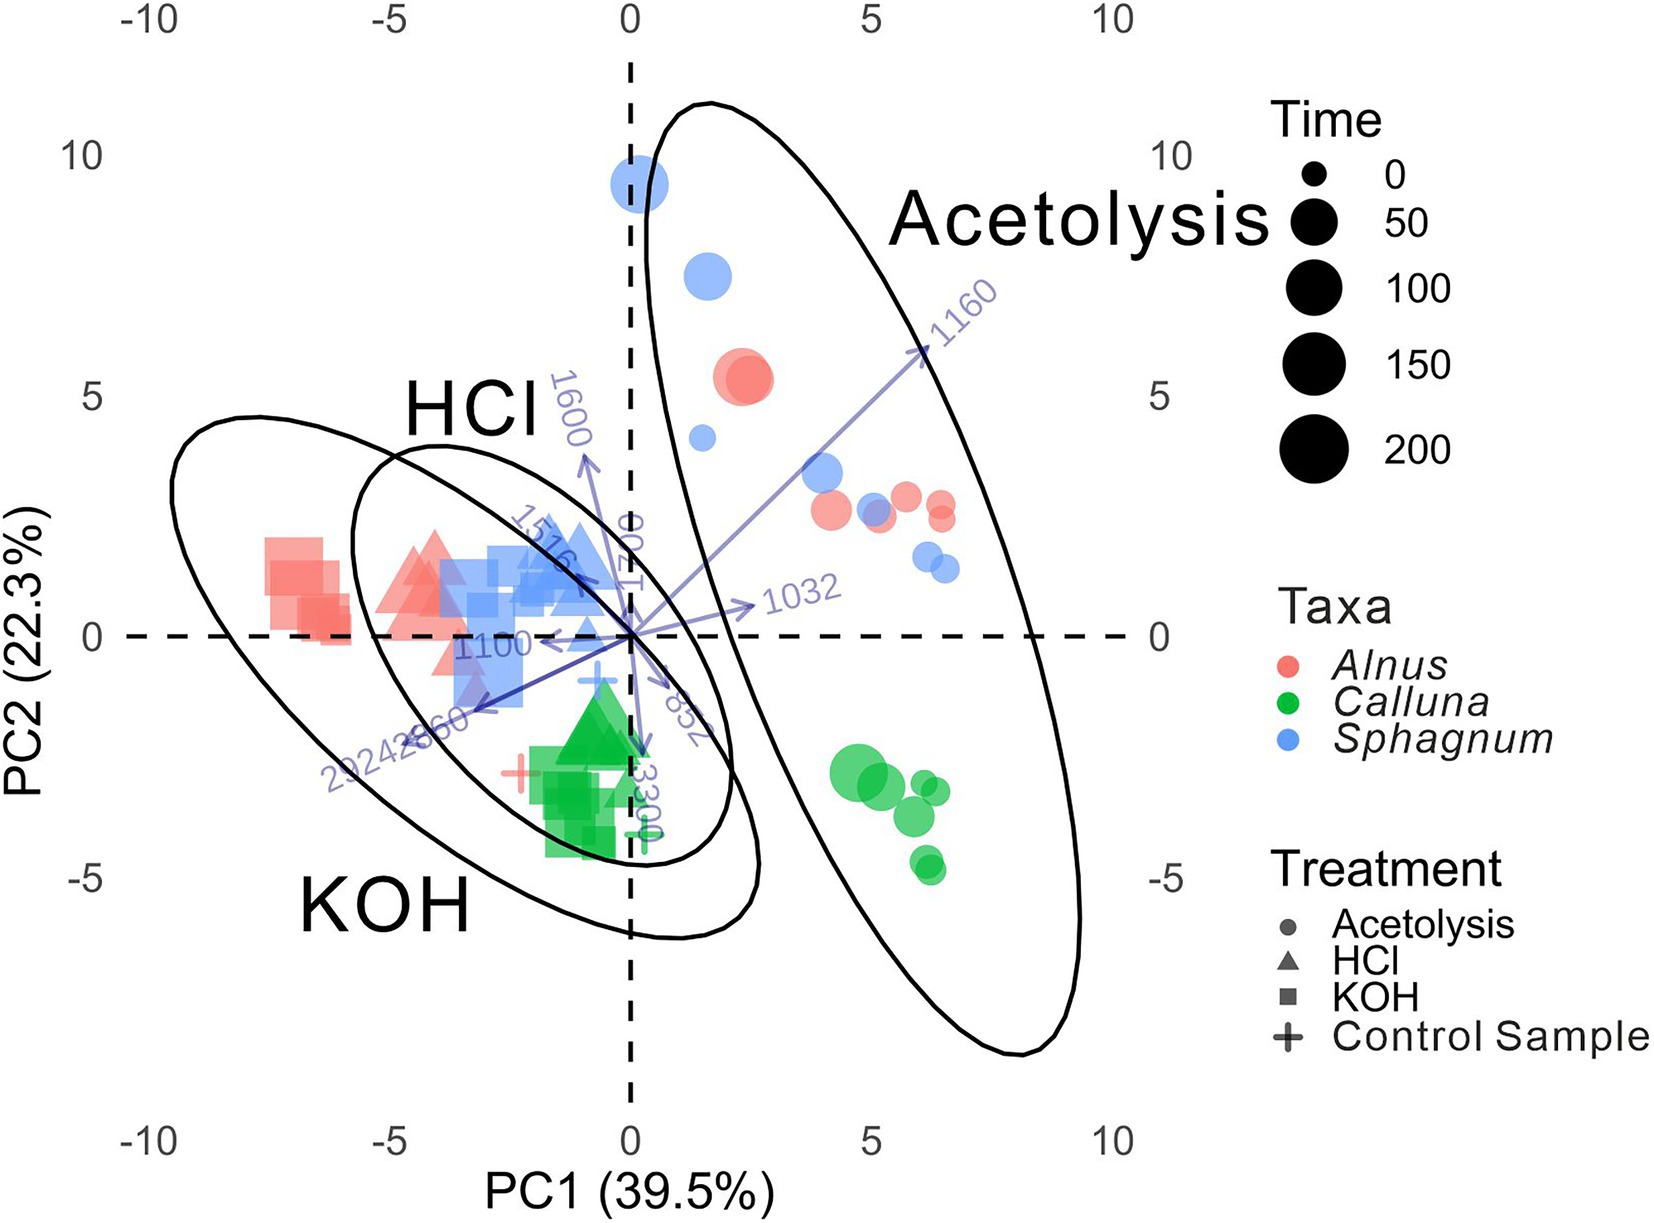
Figure 4. PCA biplot on whole FTIR spectra. Each coloured element represents the average for that chemical treatment, treatment time, and taxon. Distribution ellipses showed the 95% confidence level according to different chemical treatments. Loading vectors of peaks in Table 3 were indicated, with labels representing their wavenumbers, respectively.
3.3. Influence of chemical treatments on UAC peak area
Table 4 reports the average change in UAC peak area as a percentage of the control sample values (∆UAC) for the three taxa. ∆UAC values are visualised in Figure 5, showing the standard deviation across samples from the seven depths (error bars) accompanied by the regression line with 95% confidence interval for the regression of ∆UAC onto log-transformed treatment time. Regression statistics are reported in Table 5. In general, we observe that chemical pretreatments tend to reduce the UAC peak area, although the pattern is not entirely consistent across all treatments and taxa. Regression models for reduction in UAC peak area with time are significant for KOH treatment on Calluna and acetolysis on Sphagnum at the 95% confidence level (p ≤ 0.05) and for acetolysis on Alnus, acetolysis on Calluna, and KOH treatment on Sphagnum at the 90% confidence level (p ≤ 0.1; Table 5). In contrast, a significant increase in UAC peak area is modelled for HCl treatment on Sphagnum (p ≤ 0.05). Broadly, the magnitude of UAC changes is greater for KOH than HCl, and for acetolysis than KOH, reflected in the slope of the regression models (Figure 5; Table 5).
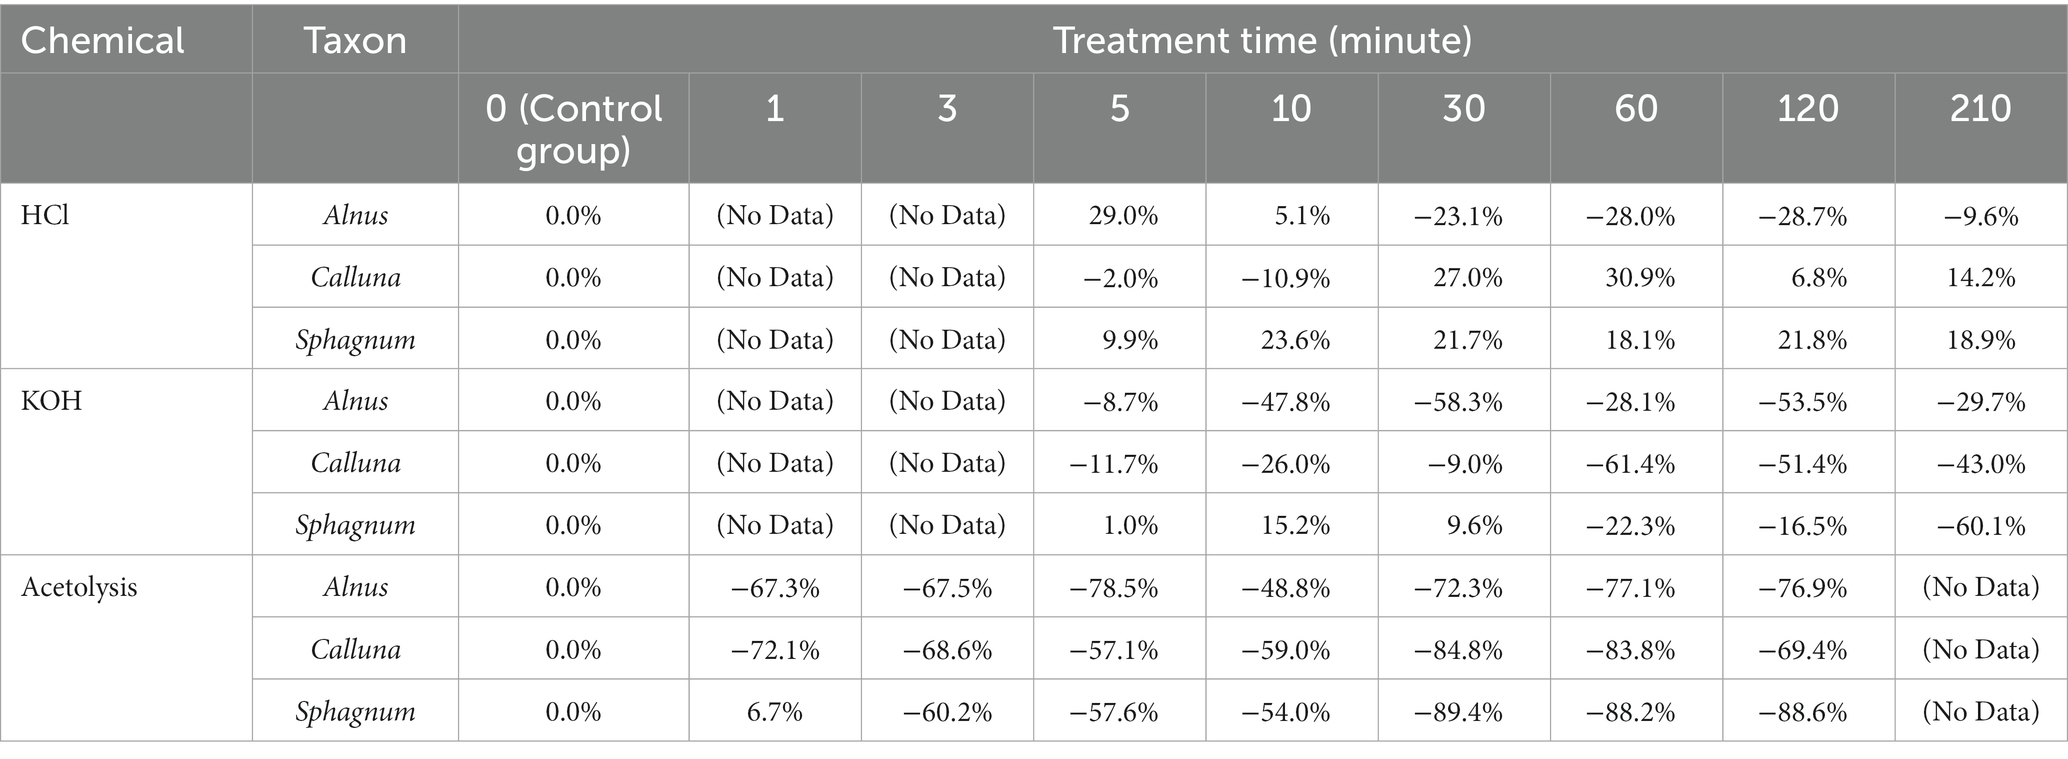
Table 4. UAC difference (ΔUAC) changes (in percentages) again treatment time.
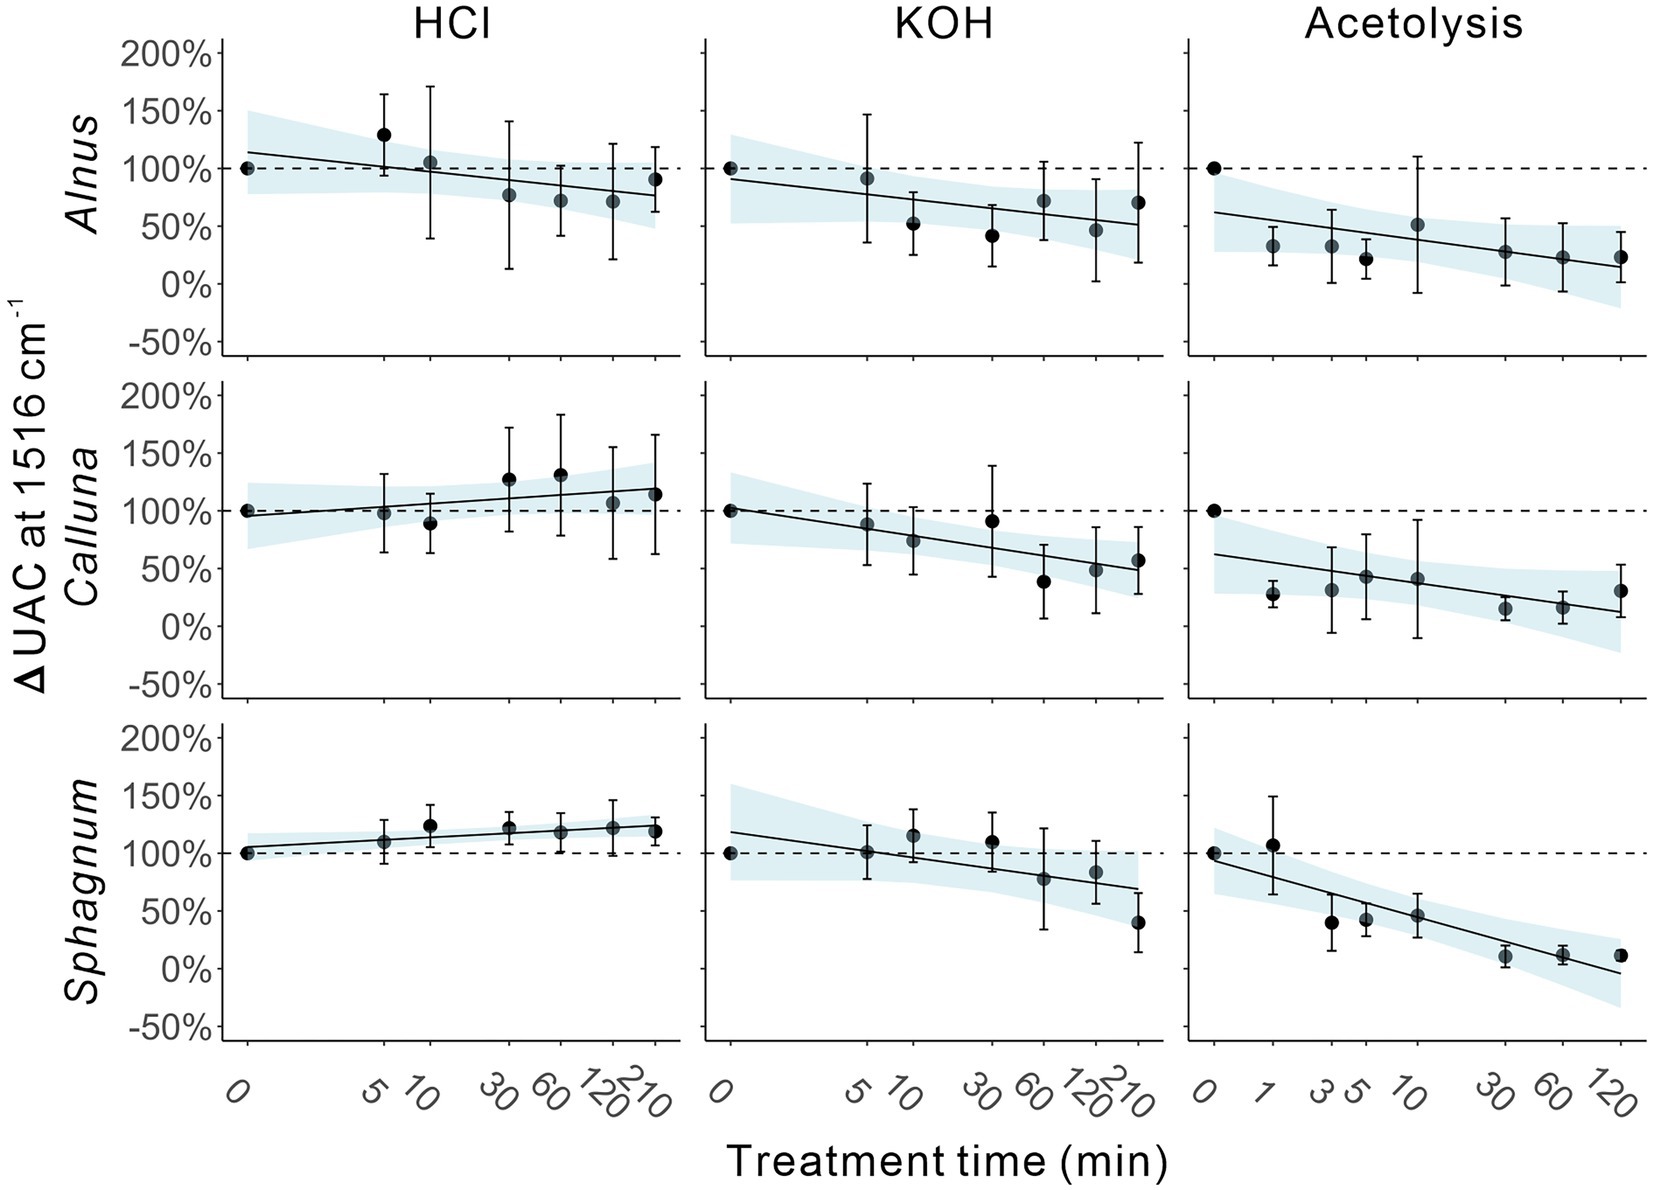
Figure 5. Averaged ∆UAC changes against treatment time (logarithmic horizontal axis). Each point represents the average ∆UAC. Error bars indicate standard variations. Shaded area indicates 95% confidence area of regression analysis.
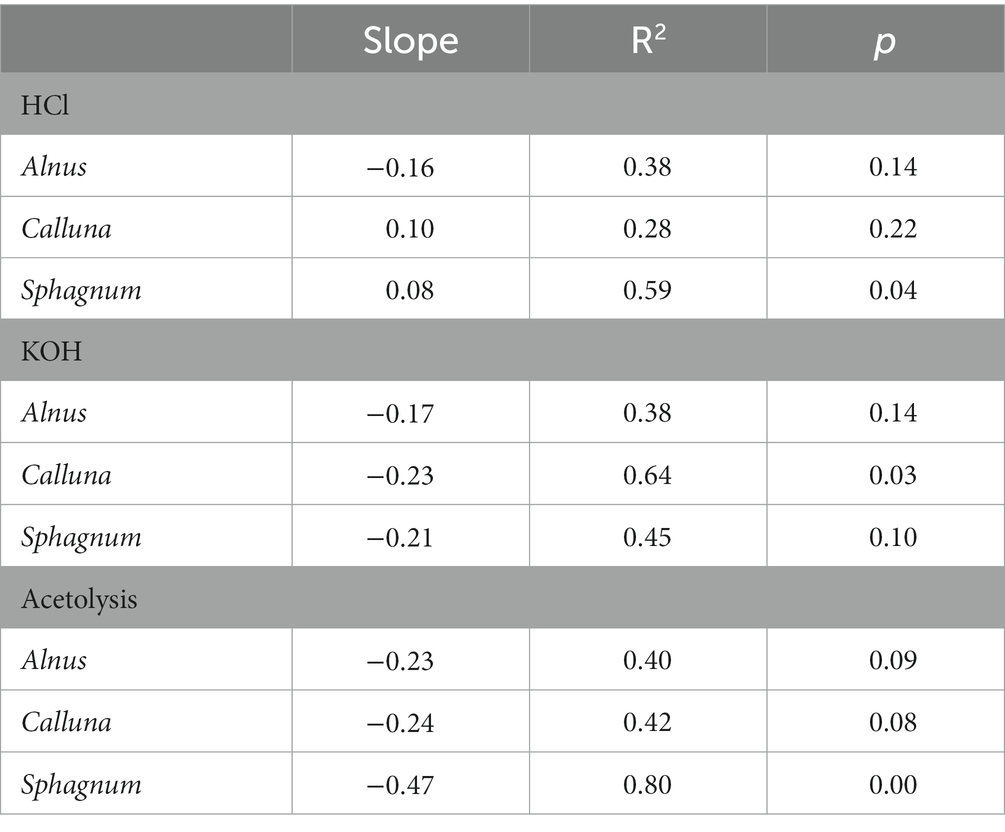
Table 5. Results of regression of averaged ∆UAC against log-transformed treatment time, with significance of independent variable (treatment time).
In detail, HCl treatments yielded variable impacts on UAC peak areas, with positive relationships (across the entire treatment period) for Calluna and Sphagnum, and a negative relationship for Alnus. Sphagnum yielded a significant regression result (p ≤ 0.05) but weak slope coefficient, while the relationships of the other two taxa were insignificant (Table 5). Overall, the total impact of HCl treatment, even after very long treatment times, was modest; ∆UAC values after 210 min were − 9.6%, +14.2%, +18.9% for Alnus, Calluna and Sphagnum, respectively (Table 4).
For KOH, there were negative relationships for all three taxa. The relationships for Calluna and Sphagnum were significant at p ≤ 0.05 and p ≤ 0.1, respectively, but insignificant for Alnus. The detailed pattern of change over time is specific to each taxon: Alnus displays a marked step-like reduction in ΔUAC after 10 min (−47.8%); Calluna, a similar marked reduction is noted after 60 min (−61.4%); and a progressive strong reduction for Sphagnum between 60 (−22.3%) and 120 min (−60.1%; Table 4). Thus a limited impact is detected from KOH on UAC peak areas in pollen and spores within short treatment time (e.g., ≤10 min for Alnus, and < 30 min for Calluna and Sphagnum), and increasing impact of KOH between 10 and 120 min for Alnus, and 60 and 120 min for Calluna and Sphagnum. Extended treatment (210 min) resulted in a strong reduction in UAC peak areas for all taxa: −29.7, −43.0% and − 60.1% for Alnus, Calluna and Sphagnum, respectively (Table 4).
Acetolysis treatments resulted in the strongest negative relationships between ∆UAC and treatment time, significant for Alnus (p ≤ 0.1), Calluna (p ≤ 0.1) and Sphagnum (p ≤ 0.05). Slope values for Sphagnum samples treated by acetolysis had higher negative values than the other two taxa, indicating the greatest degree of UAC reduction during the whole treatment period. For Alnus and Calluna, acetolysis impacts on UAC peak area were notable after 1 min (−67.3% and − 72.1%, respectively), while Sphagnum showed some resilience after 1 min followed by stronger changes from 3 mins onward. Extended treatment (120 min) resulted in a very strong reduction in UAC peak areas for all taxa: −76.9, −69.4% and − 88.6% for Alnus, Calluna and Sphagnum, respectively (Table 4).
4. Discussion
4.1. Spectral differences between modern and sub-fossil palynomorphs
In the comparison between modern and sub-fossil spectra (Figure 2), visible peaks of C=O at ~1740 cm−1 (corresponding to lipids or ester in palynomorphs; Watson et al., 2007), and amide I and amide II at ~1,650 cm−1 (iii-a) and ~ 1,550 cm−1 (iii-c; contributed by protein; Sowa et al., 1991; Lahlali et al., 2014) are observed in modern spectra of three taxa, while not for sub-fossil ones. These differences are likely the result of palynomorph degradation and oxidation from fresh (modern) samples to sub-fossil products in the environment. Also, protoplast contents in nuclei of fresh palynomorphs are important sources of proteins (Ueda and Tanaka, 1994), but they could be rapidly destroyed by bacteria, fungi, oxidation and hydrolysis, all probable impacts suffered by sub-fossil materials (Traverse, 2007). Similarly, a study on Ambrosia pollen showed that the cellulosic intine layer of the pollen wall contains antigenic proteins which are lost on contact with a humid surface (Howlett et al., 1973). For the peak at ~3,008 cm−1 in modern palynomorph spectra, interpretations in other studies on this peak signal attributed it to C=C bonds (Depciuch et al., 2018; Kyselka et al., 2018), and disappearance of this peak in sub-fossil Sphagnum spores may represent losses in degree of carbon unsaturation for this taxon. Van Bilsen et al. (1994) found loss of lipids in pollen grains after storage, resulting in loss of unsaturation of grain chemistry, reinforcing the disappeared peak of both C=C (~3,008 cm−1) and C=O (~1740 cm−1) in modern spectra (Figure 2 “i” and “ii”). These features may explain the insignificant amide peaks we observe in sub-fossil spectra. Since up to 60% of the N content of fresh pollen may be water soluble (Greenfield, 1999), changes in pollen chemistry may be very rapid (hours to days) on deposition in the environment. This may explain the stronger amide peaks detected in the modern Alnus sample, for which pollen was collected directly from catkins, as compared to the modern Calluna and Sphagnum samples, where palynomorphs were scavenged following flowering/sporulation from the surface of living sphagna. Overall, the absence of peaks at 3008 cm−1 and ~ 1740 cm−1 in sub-fossil spectra represents a clear discriminator between modern and sub-fossil pollen and spores, likely related to the loss of pollenkitt, intine and protoplasm in the aerobic peatbog surface layers. The absence of these spectral features is also evident in the untreated control samples from the core, thus confirming that their absence is not due to chemical treatment. This is true for the sub-fossil samples at all depths, including the youngest samples at 44.5 cm (approximately 600 cal years BP), consistent with complete “transformation” to sub-fossil status.
4.2. Influence of HCl, KOH and acetolysis treatments on sporopollenin
Spectra treated by HCl have few observable changes, but peaks attributed to O-H bonds at ~3,300 cm−1 decrease with longer treatment time for all taxa (Figure 3), and peaks at ~2,930 and ~ 2,850 cm−1 (both attributed to C-H bonds) increase after being treated by HCl. They could be the result of hydrophobicity increases on the palynomorph surface. Noma et al. (2018) found increased hydrophobicity for spores treated with HCl, by negatively charging the spore coat. Meanwhile, Yang et al. (2009) compared FTIR spectra for methyl-modified silica films with different levels of hydrophobicity, and found weaker O-H bond peaks and stronger C-H bond peaks adjacent to the wavenumbers in our results.
For KOH, both the decreased O-H ~ 3,300 cm−1 peaks and increased C-H 2930/2850 cm−1 peaks are also observed (Figure 3), but with different reasons. The decreases of O-H peaks could be from decomposition of humic acid. Müller et al. (2021) found negative mean depletion of carbon isotope values (δ13C) for Alnus pollen grains treated by KOH, and attributed this to decreases of more derivatives of humic acids. Considering that strong peaks at around 3,300 cm−1 are observed in humid acid infrared spectra (Yonebayashi and Hattori, 1989), decreases in humic acid could explain the weakened O-H peak. The increases of C-H peaks at ~2930/2850 cm−1 could come from hydrolytic degradation of carbon chains and branching in sporopollenin. Sammon et al. (2000) found increased C-H peaks at ~2930/2850 cm−1 for FTIR spectra of KOH-treated polyethylene, and attribute these changes to change in chemical (electronic) environment occurring during hydrolytic degradation. Sporopollenin also has substantial ester groups (Li et al., 2018), enabling similar hydrolytic degradation processes when treated with KOH. Also, sporopollenin treated by KOH had been found to be similar to IR spectra with K salt glucuronic acid, indicating an oxidised aromatic ring (Traverse, 2007), and this may support the weakened UAC-related signal at ~1,516 cm−1. To deal with this issues, spectral deconvolution with Voigt profiles is usually applied to isolate single peak signals from overlapped peaks (Bandosz et al., 1994; Sadat and Joye, 2020), while an alternative method on peak area calculation of “Tangential integration” has been also been tested to be comparable with the Voigt profile deconvolution (Wieser et al., 2022). We ran both methodologies to isolate UAC 1516 cm−1 peak area, and get comparable results as well.
Samples treated by acetolysis showed several significant changes in spectral peaks (Figure 3). Peaks representing O-H bonds (3,300 cm−1), C-H bonds (2,925 and 2,850 cm−1), aromatic C=C bonds (1,516 cm−1) and ether phenol C-O bonds (1,100 cm−1) were weaker, while peaks belonging to aryl ether C-O bonds (1,040 cm−1) and phenol C-O/C-H bonds (1,150 cm−1) became stronger. Generally speaking, these variations in bond peaks suggest fundamental element gain and loss tendencies for acetolysis treatment on sporopollenin: losses for carbon functional groups and enrichment for oxygen ones (Ahlers et al., 2000). Moreover, weakening of peaks at ~1,516 cm−1 and ~ 1,100 cm−1 was also identified by Dominguez et al. (1999) who observed that unsaturation and ether bonds were oxidised into carboxylic acids. Meanwhile, strengthening of two bonds correlated with phenol and aryl ether is also supported by evidence from Watson et al. (2012) for substitutions of aromatic rings by hydroxyl group, resulting in increased intensity of phenol O-H and C-O bonds. Meanwhile, considering that the peak around 1,150 cm−1 was also correlated with S=O stretch vibrations (Oh and Baiz, 2019), the elevated intensities here could also be the results of newly-formed sulfoxide bond from acetolysis treatment. Traverse (2007) notes the uptake of S by palynomorphs during acetolysis. Overall, the spectral changes point to quite profound impacts of acetolysis on sub-fossil palynomorph chemistry, associated with size and colour (thermal maturation) changes (Supplementary Figure 5).
Considering Euclidean distances in the PCA biplot as an approximation of total spectral changes (Figure 4), all three taxa were fairly resilient to chemical treatment with HCl, moderately resilient to KOH treatment, and least resilient to acetolysis treatment (reflected in PC1). We also observe that taxon-specific differences in the FTIR spectra are retained after chemical treatment (reflected in PC2), for all treatment types and treatment times. This indicates that it should be possible to discriminate between taxa on sub-fossil material following chemical treatment subject to careful application of a systematic set of protocols, which is essential for chemotaxonomic applications of FTIR on pollen (Julier et al., 2016; Diehn et al., 2020). Nevertheless, the evident displacement of samples in the PCA following any of the treatments emphasises the need for careful attention to the impacts of processing methods, especially where these may not be parallel between reference and ancient specimens.
4.3. Impacts of chemical treatments on UACs
Our findings reveal that UAC peak areas are impacted by chemical treatments. Despite variability between treatments and taxa, and fairly high dispersion of results across samples drawn from different depths in the core, a generally consistent pattern of loss of UAC peak area is observed for KOH and acetolysis treatments. Furthermore, in several cases —KOH treatment on Calluna and acetolysis treatments on all taxa— the results conform to a log-decay model (i.e., regression models significant at 95% or 90% confidence level), highlighting a distinctive pattern of rapid loss of UAC peak area during the first minutes of treatment time followed by progressive reduction over longer treatment times. This model has been selected empirically and could be further refined through the development of physico-chemical models for different treatments.
For changes to the UAC peak area, different reactions to acetolysis treatment were observed among three taxa investigated (Figure 5; Tables 4, 5). Sphagnum showed strong resilience to treatment after one minute, but eventually demonstrated the strongest change in UAC peak areas after prolonged treatment. The thicker wall (exine) of Sphagnum spores (Brown et al., 2015), may give them increased initial protection against chemical treatment compared to Alnus and Calluna pollen grains. However, the eventual magnitude of the UAC changes in Sphagnum spores, greater than for Alnus or Calluna, are consistent with a previously reported vulnerability of Sphagnum spores to degradation by acetolysis of 10 min duration (Charman, 1992).
4.4. Implications and recommendations for future research
Our study reveals that chemical treatment can have a significant impact on the chemistry of pollen and spores even under short duration treatment times. This result has important implications for UV-B reconstructions based on UACs in ancient pollen and spores (Seddon et al., 2019). Importantly, our findings have been obtained on sub-fossil palynomorphs, so chemical impacts of the selected treatments cannot be not solely related to the loss of pollenkitt, intine or protoplasm, which are not preserved in sub-fossil grains and spores. Therefore, the progressive reduction in peak area of the aromatic C=C UAC peak at ~1,516 cm−1 with treatment time can only be explained by loss of UACs from within the sporopollenin itself as a result of damage caused to the palynomorphs from the chemical treatment. Not only were strong changes observed with short acetolysis times, KOH treatment also resulted in the reduction of the UAC peak areas albeit at longer treatment times and to a slightly lower overall magnitude (Table 5). In contrast, HCl treatment does not yield a consistent direction of change in the UAC peak areas and only modest proportional changes in UAC peak area. Thus cautious application of HCl, or even KOH for short treatment times (up to 5 min), may not overly impact the UAC peak. We would suggest that for chemical analysis of palynomorphs, researchers should make cautious selection of the pre-treatment protocols and that careful control and consistency when using HCl and KOH treatments are needed, while further investigation of the specific effects of chemical treatments on different taxa are required. This could include, for example, investigation of other chemical treatments that are frequently used in standard pollen preparation techniques, such as hydrofluoric acid.
Due to significant reductions in the UAC peak areas as well as taxon-specific effects (different magnitude and pace of spectral changes), we recommend that acetolysis is avoided for all palynomorph chemistry analysis in palaeoecological studies on pollen and spore chemistry. Since UAC peak areas can be strongly reduced after just 1 min of treatment, even efforts to implement a systematic protocol could risk introducing differential changes to UAC peak areas down core as a result of small changes in exposure time between samples to the acetolysis treatment. In addition, long treatments may introduce additional features to the spectra making peak detection more difficult.
Overall, as we demonstrate in this study, the use of physical separation methods including micro-sieving and density separation is preferable for FTIR analysis of pollen and spores, since it does not impact on UAC peak detection or quantification. However, we recognise this method may not be suitable for all sediment types, and further research is required for pollen extraction from non-peat or non-lake sediments. We recognise that researchers may wish to carry out standard pollen analysis (identification and counting) in addition to chemical analysis of pollen on the same samples. We suggest a practical approach would involve taking two sub-samples from the sample, so that one can be prepared in the standard way (applying chemical digestions as required to maximise the quality of the residues for counting), while the other is prepared using physical separation methods and minimising the use of harsh reagents.
5. Conclusion
Based on experimental treatments of sub-fossil pollen and spores of Alnus, Calluna and Sphagnum isolated from a Late Holocene peat core with commonly used palynological pretreatments (HCL, KOH, acetolysis), we found that:
• All chemical treatments, even for short treatment times, modified the FTIR spectra to some degree; HCl had the weakest impact, KOH had an intermediate impact, and acetolysis had the strongest impact on the FTIR spectra.
• Concerning the critical peak area at ~1,516 cm−1 used for detection of ultraviolet-absorbing compounds (UACs), we found variable, weak impacts of HCl, strong reductions with longer KOH treatment, and powerful impacts of acetolysis. Generally, the pattern of UAC reduction conforms to a log-decay pattern, although considerable variability is observed between treatments and taxa.
• Since loss of peak area was evident in all three taxa after even very short acetolysis times (1–3 min), we strongly recommend against the use of acetolysis treatment in the preparation of pollen and spore samples for UAC detection and UV-B reconstruction.
• While the use of HCl, and of KOH for very short treatment times up to 5 min do not appear likely to influence the results of UAC peak detection by FTIR, the evidence we present for taxon-dependent impacts of the chemical treatments suggests that researchers must check carefully for potential impacts of chemical pretreatments on their chosen target taxon / taxa.
• Overall, we recommend avoiding the use of chemical digestions for chemical palynology in favour of separation methods including micro-sieving and dense media separation.
Data availability statement
The raw data supporting the conclusions of this article are available at the University of Manchester Research Repository at https://doi.org/10.48420/21931257.
Author contributions
TW performed the laboratory analysis and statistical analysis. All authors contributed to the interpretation and writing of the manuscript. All authors contributed to the article and approved the submitted version.
Acknowledgments
We thank the technical team of the Geography Laboratories of the University of Manchester (J. Moore, T. Bishop, J. Yarwood, R. Self) for their support. We gratefully acknowledge capital support of the University of Manchester in establishing the FTIR facility in the Geography Laboratories. We thank the reviewers for constructive comments that helped to improve the manuscript. We acknowledge NEIF grant NE/S011587/1 (allocation number 2352.0321) on constraining the radiocarbon dates. We thank SUERC AMS Laboratory staff for 14C analysis and technical support from NRCF staff (Mark H. Garnett and Pauline Gulliver).
Conflict of interest
The authors declare that the research was conducted in the absence of any commercial or financial relationships that could be construed as a potential conflict of interest.
Publisher’s note
All claims expressed in this article are solely those of the authors and do not necessarily represent those of their affiliated organizations, or those of the publisher, the editors and the reviewers. Any product that may be evaluated in this article, or claim that may be made by its manufacturer, is not guaranteed or endorsed by the publisher.
Supplementary material
The Supplementary material for this article can be found online at: https://www.frontiersin.org/articles/10.3389/fevo.2023.1096099/full#supplementary-material
Supplementary Figure S1 | Bayesian age model for HM20 core, showing posteriors for 14C data, and 95% probability density.
Supplementary Figure S2 | FTIR spectra of sodium pyrophosphate (Na4P2O7) and sodium polytungstate (SPT). Red dashed box indicates the fingerprint zones for palynomorph spectra, and grey bars (i and ii) highlight major peaks observed in this range.
Supplementary Figure S3 | Mean FTIR spectra of water washed (a, c, e), and sodium pyrophosphate and SPT washed (b, d, f) palynomorphs. Subfossil palynomorphs were extracted from control sample at depth D01. Colour-shaded areas indicates the standard deviation, and grey bars (i and ii) correspond to wavenumber positions labelled in Supplementary Figure 1. Each mean spectrum is based on averaging of 28±4 individual grains or spores.
Supplementary Figure S4 | FTIR spectra derived by using different aperture sizes. Spectra were collected from control samples at depth D01. (a)–(c): spectra were acquired from the same palynomorph grain, using different aperture sizes. (d)–(f): mean spectra (black lines) and standard variance (blue shaded areas) from ~50 single grain spectra. Labels beside the spectra indicate the aperture size (µm) used, and those filled in red represent the selected aperture sizes used in the manuscript for corresponding taxon. Red dashed boxes show the fingerprint areas, and grey bars show the position of the UAC 1516 cm-1 peak.
Supplementary Figure S5 | Optical Microscope (OM) photography of palynomorphs treated by acetolysis. Photographs were taken under transmitted light microscopy using an inverted OM with built-in digital camera (Leica DMil). We note a progressive darkening (thermal maturation) of the pollen and spores, accompanied by size changes (initial increase followed by subsequent decrease).
Supplementary Figure S6 | FTIR spectra using different numbers of scans, acquired from the same palynomorph. Spectra were collected from control samples at depth D01. The label beside each spectrum indicates the number of scans, and those filled in red show settings used in this study. Red dashed boxes show the fingerprint area, and grey bars show the position of the UAC 1516 cm-1 peak.
Supplementary Table S1 | Number of palynomorphs analysed in each sample with information on chemical treatment and depth range for every sample.
References
Ahlers, F., Bubert, H., Steuernagel, S., and Wiermann, R. (2000). The nature of oxygen in sporopollenin from the pollen of Typha angustifolia L. Zeitschrift Fur Naturforschung C-a Journal of Biosciences 55, 129–136. doi: 10.1515/znc-2000-3-401
Baker, M. J., Trevisan, J., Bassan, P., Bhargava, R., Butler, H. J., Dorling, K. M., et al. (2014). Using Fourier transform IR spectroscopy to analyze biological materials. Nat. Protoc. 9, 1771–1791. doi: 10.1038/nprot.2014.110
Bandosz, T. J., Jagiełło, J., Putyera, K., and Schwarz, J. A. (1994). Characterization of acidity of pillared clays by proton affinity distribution and DRIFT spectroscopy. J. Chem. Soc. Faraday Trans. 90, 3573–3578. doi: 10.1039/ft9949003573
Barry, H. L., Wesley, T. F., Mark, A. S., Terry, V. C., Stephen, S., Michael, H., et al. (2008). Plant spore walls as a record of long-term changes in ultraviolet-B radiation. Nat. Geosci. 1, 592–596. doi: 10.1038/ngeo278
Bates, C., Coxon, P., and Gibbard, P. (1978). A new method for the preparation of clay-rich sediment samples for palynological investigation. New Phytol. 81, 459–463. doi: 10.1111/j.1469-8137.1978.tb02651.x
Bell, B. A., Fletcher, W. J., Cornelissen, H. L., Campbell, J. F., Ryan, P., Grant, H., et al. (2019). Stable carbon isotope analysis on fossil Cedrus pollen shows summer aridification in Morocco during the last 5000 years. J. Quat. Sci. 34, 323–332. doi: 10.1002/jqs.3103
Bell, B. A., Fletcher, W. J., Ryan, P., Seddon, A. W., Wogelius, R. A., and Ilmen, R. (2018). UV-B-absorbing compounds in modern Cedrus atlantica pollen: the potential for a summer UV-B proxy for Northwest Africa. The Holocene 28, 1382–1394. doi: 10.1177/0959683618777072
Bennett, K. D., and Willis, K. J. (2002). “Pollen” in Tracking environmental change using lake sediments. eds. W. M. Last and J. P. Smol (Germany: Springer), 5–32.
Brown, R. C., Lemmon, B. E., Shimamura, M., Villarreal, J. C., and Renzaglia, K. S. (2015). Spores of relictual bryophytes: diverse adaptations to life on land. Rev. Palaeobot. Palynol. 216, 1–17. doi: 10.1016/j.revpalbo.2015.01.004
Brunson, J. C. (2022). ‘Ordr: A ‘tidyverse’ extension for ordinations and Biplots’. R package version 0.0.2.
Caldwell, M. M., Björn, L. O., Bornman, J. F., Flint, S. D., Kulandaivelu, G., Teramura, A. H., et al. (1998). Effects of increased solar ultraviolet radiation on terrestrial ecosystems. J. Photochem. Photobiol. B Biol. 46, 40–52. doi: 10.1016/S1011-1344(98)00184-5
Caldwell, M. M., and Flint, S. D. (1994). Stratospheric ozone reduction, solar UV-B radiation and terrestrial ecosystems. Clim. Chang. 28, 375–394. doi: 10.1007/BF01104080
Charman, D. J. (1992). The effects of acetylation on fossil pinus pollen and sphagnum spores discovered during routine pollen analysis. Rev. Palaeobot. Palynol. 72, 159–164. doi: 10.1016/0034-6667(92)90183-h
Depciuch, J., Kasprzyk, I., Drzymała, E., and Parlinska-Wojtan, M. (2018). Identification of birch pollen species using FTIR spectroscopy. Aerobiologia 34, 525–538. doi: 10.1007/s10453-018-9528-4
Diehn, S., Zimmermann, B., Tafintseva, V., Bagcioglu, M., Kohler, A., Ohlson, M., et al. (2020). Discrimination of grass pollen of different species by FTIR spectroscopy of individual pollen grains. Anal. Bioanal. Chem. 412, 6459–6474. doi: 10.1007/s00216-020-02628-2
Dominguez, E., Mercado, J. A., Quesada, M. A., and Heredia, A. (1999). Pollen sporopollenin: degradation and structural elucidation. Sex. Plant Reprod. 12, 171–178. doi: 10.1007/s004970050189
Durand, B., and Nicaise, G. (1980). ‘Procedures for kerogen isolation ’. Kerogen: Technip Paris, pp. 35–53.
Fan, T. F., Potroz, M. G., Tan, E. L., Ibrahim, M. S., Miyako, E., and Cho, N. J. (2019). Species-specific biodegradation of sporopollenin-based microcapsules. Sci. Rep. 9:9626. doi: 10.1038/s41598-019-46131-w
Fraser, W. T., Sephton, M. A., Watson, J. S., Self, S., Lomax, B. H., James, D. I., et al. (2011). UV-B absorbing pigments in spores: biochemical responses to shade in a high-latitude birch forest and implications for sporopollenin-based proxies of past environmental change. Polar Res. 30:1. doi: 10.3402/polar.v30i0.8312
Fraser, W. T., Watson, J. S., Sephton, M. A., Lomax, B. H., Harrington, G., Gosling, W. D., et al. (2014). Changes in spore chemistry and appearance with increasing maturity. Rev. Palaeobot. Palynol. 201, 41–46. doi: 10.1016/j.revpalbo.2013.11.001
Godwin, H. (1934). Pollen analysis. An outline of the problems and potentialities of the method part I. technique and interpretation. New Phytol. 33, 278–305. doi: 10.1111/j.1469-8137.1934.tb06815.x
Greenfield, L. G. (1999). Weight loss and release of mineral nitrogen from decomposing pollen. Soil Biol. Biochem. 31, 353–361. doi: 10.1016/s0038-0717(98)00134-5
Haslett, J., and Parnell, A. (2008). A simple monotone process with application to radiocarbon-dated depth chronologies. J. Royal Statistical Society: Series C (Applied Statistics) 57, 399–418. doi: 10.1111/j.1467-9876.2008.00623.x
Heusser, L. E., and Stock, C. E. (1984). Preparation techniques for concentrating pollen from marine sediments and other sediments with low pollen density. Palynology 8, 225–227. doi: 10.1080/01916122.1984.9989279
Howlett, B. J., Knox, R. B., and Heslop-Harrison, J. (1973). Pollen-Wall proteins: release of the allergen antigen E from intine and Exine sites in pollen grains of ragweed and cosmos. J. Cell Sci. 13, 603–619. doi: 10.1242/jcs.13.2.603
Jardine, P. E., Abernethy, F. A., Lomax, B. H., Gosling, W. D., and Fraser, W. T. (2017). Shedding light on sporopollenin chemistry, with reference to UV reconstructions. Rev. Palaeobot. Palynol. 238, 1–6. doi: 10.1016/j.revpalbo.2016.11.014
Jardine, P. E., Fraser, W. T., Gosling, W. D., Roberts, C. N., Eastwood, W. J., and Lomax, B. H. (2020). Proxy reconstruction of ultraviolet-B irradiance at the Earth’s surface, and its relationship with solar activity and ozone thickness. The Holocene 30, 155–161. doi: 10.1177/0959683619875798
Jardine, P., Fraser, W., Lomax, B., and Gosling, W. (2015). The impact of oxidation on spore and pollen chemistry. J. Micropalaeontol. 34, 139–149. doi: 10.1144/jmpaleo2014-022
Jardine, P. E., Hoorn, C., Beer, M. A. M., Barbolini, N., Woutersen, A., Bogota-Angel, G., et al. (2021). Sporopollenin chemistry and its durability in the geological record: an integration of extant and fossil chemical data across the seed plants. Palaeontology 64, 285–305. doi: 10.1111/pala.12523
Julier, A. C. M., Jardine, P. E., Coe, A. L., Gosling, W. D., Lomax, B. H., and Fraser, W. T. (2016). Chemotaxonomy as a tool for interpreting the cryptic diversity of Poaceae pollen. Rev. Palaeobot. Palynol. 235, 140–147. doi: 10.1016/j.revpalbo.2016.08.004
Kenđel, A., and Zimmermann, B. (2020). Chemical analysis of pollen by FT-Raman and FTIR spectroscopies. Front. Plant Sci. 11:352. doi: 10.3389/fpls.2020.00352
Kim, S. S., and Douglas, C. J. (2013). Sporopollenin monomer biosynthesis in arabidopsis. J. Plant Biol. 56, 1–6. doi: 10.1007/s12374-012-0385-3
Konevskikh, T., Lukacs, R., and Kohler, A. (2018). An improved algorithm for fast resonant Mie scatter correction of infrared spectra of cells and tissues. J. Biophotonics 11:e201600307. doi: 10.1002/jbio.201600307
Kyselka, J., Bleha, R., Dragoun, M., Bialasová, K., Horáčková, Š., Schätz, M., et al. (2018). Antifungal polyamides of Hydroxycinnamic acids from sunflower bee pollen. J. Agric. Food Chem. 66, 11018–11026. doi: 10.1021/acs.jafc.8b03976
Lahlali, R., Jiang, Y. F., Kumar, S., Karunakaran, C., Liu, X., Borondics, F., et al. (2014). ATR-FTIR spectroscopy reveals involvement of lipids and proteins of intact pea pollen grains to heat stress tolerance. Front. Plant Sci. 5:10. doi: 10.3389/fpls.2014.00747
Li, F.-S., Phyo, P., Jacobowitz, J., Hong, M., and Weng, J.-K. (2018). The molecular structure of plant sporopollenin. Nature Plants 5, 41–46. doi: 10.1038/s41477-018-0330-7
Liland, K. H. (2021). ‘EMSC: Extended multiplicative signal correction’. R package version 0.9.3. Available at: https://CRAN.R-project.org/package=EMSC.
Liland, K. H., Almøy, T., and Mevik, B.-H. (2010). Optimal choice of baseline correction for multivariate calibration of spectra. Appl. Spectrosc. 64, 1007–1016. doi: 10.1366/000370210792434350
Mackenzie, G., Boa, A. N., Diego-Taboadal, A., Atkin, S. L., and Sathyapalan, T. (2015). Sporopollenin, the least known yet toughest natural biopolymer. Frontiers in Materials 2:66. doi: 10.3389/fmats.2015.00066
Mensing, S. A., and Southon, J. R. (1999). A simple method to separate pollen for AMS radiocarbon dating and its application to lacustrine and marine sediments. Radiocarbon 41, 1–8. doi: 10.1017/S0033822200019287
Müller, C., Hennig, J., Riedel, F., and Helle, G. (2021). Quantifying the impact of chemicals on stable carbon and oxygen isotope values of raw pollen. J. Quat. Sci. 36, 441–449. doi: 10.1002/jqs.3300
Nakagawa, T., Brugiapaglia, E., Digerfeldt, G., Reille, M., Beaulieu, J. L. D., and Yasuda, Y. (1998). Dense-media separation as a more efficient pollen extraction method for use with organic sediment/deposit samples: comparison with the conventional method. Boreas 27, 15–24. doi: 10.1111/j.1502-3885.1998.tb00864.x
Noma, S., Kiyohara, K., Hirokado, R., Yamashita, N., Migita, Y., Tanaka, M., et al. (2018). Increase in hydrophobicity of &ITBacillus subtilis & ITspores by heat, hydrostatic pressure, and pressurized carbon dioxide treatments. J. Biosci. Bioeng. 125, 327–332. doi: 10.1016/j.jbiosc.2017.09.012
Oh, K.-I., and Baiz, C. R. (2019). Empirical S=O stretch vibrational frequency map. J. Chem. Phys. 151:234107. doi: 10.1063/1.5129464
Prosr, P., Polansky, R., and Pihera, J. (2016). ‘Influence of the method of evaluation of infrared spectra on results of spectral analysis’, International Conference on Diagnostic of Electrical Machines and Insulating Systems in Electrical Engineering (DEMISEE), Jun 20–22 2016 Papradno, SLOVAKIA. NEW YORK: Ieee. pp. 52–55.
R Core Team. (2021). ‘R: A language and environment for statistical computing’. Available at: https://www.R-project.org/.
Riding, J. B. (2021). A guide to preparation protocols in palynology. Palynology 45, 1–110. doi: 10.1080/01916122.2021.1878305
Rouge, P., Cornu, A., Biesse-Martin, A. S., Lyan, B., Rochut, N., and Graulet, B. (2013). Identification of quinoline, carboline and glycinamide compounds in cow milk using HRMS and NMR. Food Chem. 141, 1888–1894. doi: 10.1016/j.foodchem.2013.04.072
Rozema, J., Blokker, P., Mayoral Fuertes, M. A., and Broekman, R. (2009). UV-B absorbing compounds in present-day and fossil pollen, spores, cuticles, seed coats and wood: evaluation of a proxy for solar UV radiation. Photochem. Photobiol. Sci. 8, 1233–1243. doi: 10.1039/b904515e
Rozema, J., Broekman, R. A., Blokker, P., Meijkamp, B. B., de Bakker, N., van de Staaij, J., et al. (2001). UV-B absorbance and UV-B absorbing compounds (Para-coumaric acid) in pollen and sporopollenin: the perspective to track historic UV-B levels. J. Photochem. Photobiol. B Biol. 62, 108–117. doi: 10.1016/S1011-1344(01)00155-5
Rozema, J., van de Staaij, J., Björn, L. O., and Caldwell, M. (1997). UV-B as an environmental factor in plant life: stress and regulation. Trends Ecol. Evol. 12, 22–28. doi: 10.1016/S0169-5347(96)10062-8
Sadat, A., and Joye, I. J. (2020). Peak fitting applied to Fourier transform infrared and Raman spectroscopic analysis of proteins. Appl. Sci. 10:5918. doi: 10.3390/app10175918
Sammon, C., Yarwood, J., and Everall, N. (2000). An FT-IR study of the effect of hydrolytic degradation on the structure of thin PET films. Polym. Degrad. Stab. 67, 149–158. doi: 10.1016/s0141-3910(99)00104-4
Seddon, A. W. R., Festi, D., Robson, T. M., and Zimmermann, B. (2019). Fossil pollen and spores as a tool for reconstructing ancient solar-ultraviolet irradiance received by plants: an assessment of prospects and challenges using proxy-system modelling. Photochem. Photobiol. Sci. 18, 275–294. doi: 10.1039/c8pp00490k
Seddon, A. W., Jokerud, M., Barth, T., Birks, H. J. B., Krüger, L. C., Vandvik, V., et al. (2017). Improved quantification of UV-B absorbing compounds in Pinus sylvestris L. pollen grains using an internal standard methodology. Rev. Palaeobot. Palynol. 247, 97–104. doi: 10.1016/j.revpalbo.2017.08.007
Solheim, J. H., Gunko, E., Petersen, D., Grosseruschkamp, F., Gerwert, K., and Kohler, A. (2019). An open-source code for Mie extinction extended multiplicative signal correction for infrared microscopy spectra of cells and tissues. J. Biophotonics 12:e201800415. doi: 10.1002/jbio.201800415
Sowa, S., Connor, K. F., and Towill, L. E. (1991). Temperature-changes in lipid and protein-structure measured by fourier-transform infrared spectrophotometry in intact pollen grains. Plant Sci. 78, 1–9. doi: 10.1016/0168-9452(91)90155-2
Stevens, A., and Ramirez-Lopez, L. (2020). ‘An introduction to the prospectr package’. R package Vignette R package version 0.2.1.
Stuart, B. H. (2004). Infrared spectroscopy: Fundamentals and applications. Chichester. England: John Wiley & Sons Ltd, 224.
Thomasson, M. J., Diego-Taboada, A., Barrier, S., Martin-Guyout, J., Amedjou, E., Atkin, S. L., et al. (2020). Sporopollenin exine capsules (SpECs) derived from Lycopodium clavatum provide practical antioxidant properties by retarding rancidification of an ω-3 oil. Ind. Crop. Prod. 154:112714. doi: 10.1016/j.indcrop.2020.112714
Ueda, K., and Tanaka, I. (1994). The basic proteins of male gametic nuclei isolated from pollen grains of Lilium longiflorum. Planta 192, 446–452. doi: 10.1007/bf00198582
Van Bilsen, D. G. J. L., Van Roekel, T., and Hoekstra, F. A. (1994). Declining viability and lipid degradation during pollen storage. Sex. Plant Reprod. 7, 303–310. doi: 10.1007/bf00227714
Watson, J. S., Fraser, W. T., and Sephton, M. A. (2012). Formation of a polyalkyl macromolecule from the hydrolysable component within sporopollenin during heating/pyrolysis experiments with lycopodium spores. J. Anal. Appl. Pyrolysis 95, 138–144. doi: 10.1016/j.jaap.2012.01.019
Watson, J. S., Sephton, M. A., Sephton, S. V., Self, S., Fraser, W. T., Lomax, B. H., et al. (2007). Rapid determination of spore chemistry using thermochemolysis gas chromatography-mass spectrometry and micro-Fourier transform infrared spectroscopy. Photochem. Photobiol. Sci. 6, 689–694. doi: 10.1039/b617794h
Wiermann, R., and Gubatz, S. (1992). Pollen wall and sporopollenin. Int. Rev. Cytology-a Survey Cell Biol. 140, 35–72. doi: 10.1016/s0074-7696(08)61093-1
Wieser, M., Traxl, R., Unterberger, S. H., and Lackner, R. (2022). Assessment of aging state of bitumen based on peak-area evaluation in infrared spectroscopy: influence of data processing and modeling. Constr. Build. Mater. 326:126798. doi: 10.1016/j.conbuildmat.2022.126798
Willis, K. J., Feurdean, A., Birks, H. J. B., Bjune, A. E., Breman, E., Broekman, R., et al. (2011). Quantification of UV-B flux through time using UV-B-absorbing compounds contained in fossil Pinus sporopollenin. New Phytol. 192, 553–560. doi: 10.1111/j.1469-8137.2011.03815.x
Yang, J., Chen, J. R., and Song, J. H. (2009). Studies of the surface wettability and hydrothermal stability of methyl-modified silica films by FT-IR and Raman spectra. Vib. Spectrosc. 50, 178–184. doi: 10.1016/j.vibspec.2008.09.016
Yonebayashi, K., and Hattori, T. (1989). Chemical and biological studies on environmental humic acids. 2. H-1-NMR and IR-spectra of humic acids. Soil Sci. Plant Nutr. 35, 383–392. doi: 10.1080/00380768.1989.10434771
Zhang, D. Y., Wang, J. L., and Pan, X. L. (2006). Cadmium sorption by EPSs produced by anaerobic sludge under sulfate-reducing conditions. J. Hazard. Mater. 138, 589–593. doi: 10.1016/j.jhazmat.2006.05.092
Zimmermann, B. (2018). Chemical characterization and identification of Pinaceae pollen by infrared microspectroscopy. Planta 247, 171–180. doi: 10.1007/s00425-017-2774-9
Zimmermann, B., Baciolu, M., Sandt, C., and Kohler, A. (2015). Vibrational microspectroscopy enables chemical characterization of single pollen grains as well as comparative analysis of plant species based on pollen ultrastructure. Planta 242, 1237–1250. doi: 10.1007/s00425-015-2380-7
Keywords: Fourier transform infrared spectroscopy, chemical palynology, ultraviolet absorbing compounds, Sphagnum, Calluna, Alnus
Citation: Wang T, Bell BA, Fletcher WJ, Ryan PA and Wogelius RA (2023) Influence of common palynological extraction treatments on ultraviolet absorbing compounds (UACs) in sub-fossil pollen and spores observed in FTIR spectra. Front. Ecol. Evol. 11:1096099. doi: 10.3389/fevo.2023.1096099
Edited by:
Irene Tunno, Lawrence Livermore National Laboratory (DOE), United StatesReviewed by:
Michela Mariani, University of Nottingham, United KingdomYannick Miras, UMR7194 Histoire naturelle de l’Homme préhistorique (HNHP), France
Copyright © 2023 Wang, Bell, Fletcher, Ryan and Wogelius. This is an open-access article distributed under the terms of the Creative Commons Attribution License (CC BY). The use, distribution or reproduction in other forums is permitted, provided the original author(s) and the copyright owner(s) are credited and that the original publication in this journal is cited, in accordance with accepted academic practice. No use, distribution or reproduction is permitted which does not comply with these terms.
*Correspondence: Tianyuan Wang, dGlhbnl1YW4ud2FuZ0BtYW5jaGVzdGVyLmFjLnVr; William J. Fletcher, d2lsbC5mbGV0Y2hlckBtYW5jaGVzdGVyLmFjLnVr