 Isabella W. de Beer
 Cang Hui
 Christophe Botella
 David M. Richardson
- 1Centre for Invasion Biology, Department of Botany and Zoology, Stellenbosch University, Stellenbosch, South Africa
- 2Centre for Invasion Biology, Department of Mathematical Sciences, Stellenbosch University, Stellenbosch, South Africa
- 3Biodiversity Informatics Unit, African Institute for Mathematical Sciences, Cape Town, South Africa
- 4National Institute for Theoretical and Computational Sciences (NITheCS), Stellenbosch University, Stellenbosch, South Africa
- 5Department of Invasion Ecology, Institute of Botany, Czech Academy of Sciences, Průhonice, Czechia
Introduction: Alien trees and shrubs have become increasingly common invaders globally and have caused major negative impacts to ecosystems and society. Non-native woody plant species make up the majority of legislated invasive alien taxa in South Africa and contribute substantially to recorded negative impacts. It is of management interest to elucidate the macroecological processes that mediate the assembly of alien taxa, as this is expected to be associated with anthropogenic factors (e.g., human activity, introduction events, pathways of propagule dispersal mediated by humans) and bioclimatic factors (such as diurnal temperature range and precipitation gradients). These analyses require large species-occurrence datasets with comprehensive sampling across broad environmental conditions. Efforts of citizen scientists produce large numbers of occurrence records in a consistent manner which may be utilised for scientific investigations.
Methods: Research Grade occurrence data on naturalised plants of South Africa were extracted from the citizen scientist platform iNaturalist. Sampling bias was mitigated using statistical modelling of background points estimated from a Target Group of species which identifies well sampled communities. The drivers of assembly for alien plants at different range sizes were identified using multi-site generalised dissimilarity modelling (MS-GDM) of zeta diversity. The predicted compositional similarity between all cells was computed based on the subset of identified well sampled communities and using generalised dissimilarity modelling (GDM). From this, alien bioregions were identified using a k-means cluster analysis.
Results and Discussion: Bioclimatic factors significantly influenced community turnover in inland areas with large diurnal temperature ranges, and in areas with high precipitation. Communities separated by large geographical distances had significantly different compositions, indicating little contribution of long-range propagule movement by humans, and the presence of localised introduction hubs within the country which harbour unique species compositions. Analyses also showed a significant contribution of road density to turnover, which may be moderated by the habitat service provided by road verges. The same is true for natural dispersal via rivers in arid areas. The distribution of naturalised tree and shrub species is geographically clustered and forms six alien bioregions that are distinct from the South African biomes defined by native species distributionanalysis.
1. Introduction
The consequences of introductions of non-native species have been investigated globally and remain a major concern. Invasions of non-native trees and shrubs have increased rapidly in many parts of the world in recent decades, and these growth forms now feature prominently on many lists of the most problematic invasive species worldwide (Richardson and Rejmánek, 2011; Richardson et al., 2014). In South Africa, woody tree and shrub species are overrepresented in the invasive alien flora (Richardson et al., 2020). In reviewing the impacts of alien plant species in South Africa, van Wilgen et al. (2022) showed that invasive trees and shrubs contribute the majority of recorded impacts. The cause of impacts in invaded ecosystems is mainly through competitive exclusion of native species and by changes to ecosystem functioning. Formal impact assessments of species in the genus Acacia have shown that these species consistently have massive and major impact potential across many habitat types in South Africa (Jansen and Kumschick, 2022). The management of these impacts can be aided by understanding large-scale macroecological processes which govern the community assembly of taxa. Such insights can inform regional strategies to reduce the impacts of invasions.
Little attention has been given to the assemblage-level drivers of alien taxa. This is akin to studying assembly processes of native vegetation units, or biomes, which have been shaped over evolutionary time scales. Biomes can be defined using multiple criteria, but because of the evolutionary time scale, regional climatic conditions or climate niches are often used (Rutherford et al., 2006). In contrast, assemblages of alien taxa have had relatively little residence time to form stable communities (Hui et al., 2013). Their distributions may thus be largely constrained by processes like introduction history and diverse dispersal pathways which act during the initial spread of alien populations (Donaldson et al., 2014). Of the many natural and human-mediated dispersal pathways, river systems have been found to contribute substantially to turnover at the local and regional scales (Merritt et al., 2010). Evidently, dependent on river flow dynamics and the physical properties of propagules, hydrochorous seeds often accumulate seedbanks in riparian zones (Gurnell et al., 2008). In contrast, human-mediated dispersal, such as along road verges (Christen and Matlack, 2009) can facilitate long-distance spread of alien species that possess specific reproductive strategies (Skultety and Matthews, 2017). For instance, cultivation of ornamental and horticultural species by commercial nurseries has increasingly contributed to plant invasions (van Kleunen et al., 2018).
It may be informative for the management of invasions, therefore, to investigate whether the assembly processes of alien species are influenced by the relatively short time scale of introduction in new ranges, and their close association with anthropogenic factors (e.g., Lenzner et al., 2022). We would expect a close association between anthropogenic factors (such as the presence of roads which are correlated with human activity), introduction history and alien plant distribution. In studying the drivers of community composition of alien assemblages it is thus appropriate to include both climatic conditions which place fundamental constraints on plant survival and reproduction, and factors associated with human mediation and facilitation of invasions.
Alien biomes in South Africa have been studied using a phytogeographic classification which clusters communities as regions with distinct species composition. In South Africa, the geography of alien phytochoria, or regions inhabited by unique communities of alien plants, was first investigated by Hugo et al. (2012); they found eight clusters of communities of naturalised and invasive plant taxa closely associated with biomes and prevailing climatic conditions, but with limited influence of human activities like irrigation and agriculture. Similar results were reported by Rouget et al. (2015) using a classification tree. The five clusters found by Rouget et al. (2015) were best explained by climatic niches and overlapped with biomes, although biomes are also shaped by climatic conditions. Little evidence was found for the role of introduction histories, disturbance, and possible emerging competition between native and alien plants, which is unexpected given the close association between anthropogenic factors and invasions. Richardson et al. (2020) followed similar methods to divide alien plant taxa into four distinct regions, although the drivers of alien composition were only informed by literature and expert knowledge. Questions remain regarding the number of distinct alien biomes and drivers of alien compositional turnover in South Africa.
Another option for determining alien biomes is to apply Generalised Dissimilarity Modelling (GDM; Ferrier et al., 2007) using the relationship between species turnover (i.e., beta diversity, between two sites) and change in environmental drivers. Mapped species turnover can further determine areas likely to contain unique species composition and unveil spatial regionalisation of biodiversity (Basel et al., 2021; Mokany et al., 2022). To our knowledge, this method has not been applied previously in a study of non-native species assemblages over large spatial scales. Estimated contributions of different drivers to species turnover can be tentatively projected to under-sampled areas for compositional similarity mapping of the entire region. However, identified drivers from GDM of pairwise beta diversity are biassed towards explaining compositional turnover by predominantly narrow-ranged species present in few sites. To alleviate this bias, a newer method, multi-site generalised dissimilarity modelling (MS-GDM) of Zeta diversity (ζ), was designed to explicitly account for the different contributions to compositional turnover of narrow-ranged versus widespread species (Hui and McGeoch, 2014; McGeoch et al., 2019). Zeta diversity is the average number of species shared by a given number (order) of sites and has diverse applications when investigating compositional similarity of communities (e.g., of stream invertebrates between different streams, Simons et al., 2019; the parasites associated with small mammal hosts, Krasnov et al., 2020; or of native versus invasive ants across oceanic islands, Latombe et al., 2019). What makes the concept of zeta diversity particularly useful in the context of biological invasions is that it allows us to use MS-GDM and extract the drivers responsible for different stages of the introduction-naturalisation-invasion continuum (hereafter the invasion continuum; Blackburn et al., 2011). Indeed, according to Richardson et al. (2000) the naturalised (self-sustaining populations in the invaded range) and invasive (naturalised species which have spread significantly from their point of introduction and are reproductively successful at distant locations) stages of the continuum are generally associated with different range sizes (see also Richardson and Pyšek, 2012). Considering the zeta diversity metric in this context, lower-order zeta diversity thus represents compositional turnover from predominantly newly established and thus narrow-ranged alien species, with identified drivers thus primarily associated with the establishment stage. In contrast, higher-order zeta diversity reflects compositional turnover of more widespread alien species, and identified drivers are thus associated with the invasion stage (Hui and McGeoch, 2014; Latombe et al., 2017). Previous work using zeta diversity in understanding drivers of community turnover has described unique drivers at play for native and alien plant species with different range sizes in the Czech Republic (Latombe et al., 2017). This method has not been applied to non-native taxa in South Africa.
Most literature on the biogeography and macroecology of non-native plants in South Africa is based on analyses of professionally curated data sources. Occurrence databases like the South African Plant Invaders Atlas (SAPIA) have been widely used in studies of alien taxa for which species identifications were confirmed by members of the scientific community (Henderson and Wilson, 2017). Occurrence records in SAPIA are largely from roadside surveys (Rouget et al., 2015). Standardised data such as local abundance, percentage cover and occurrence of alien introductions are exclusively mapped during focussed expert studies (Watt et al., 2009; Kalwij et al., 2014; Cheek and Semple, 2016). However, these methods are limited by time and resources and may be too data poor to address macroecological questions. A review by Richardson et al. (2020) on the biogeography of terrestrial plant invasions highlights the need for accurate and extensive data on the distributions of alien plants in order to manage present invasions and assess their possible future impacts. The increasing popularity of crowdsourced data platforms may contribute to fill this data gap where large datasets are needed to guide biodiversity conservation (MacFadyen et al., 2022).
Crowdsourced presence-only data are useful to the scientific community since they continuously produce massive amounts of information in a consistent format and a sustainable manner. Such data have been used in investigations of the distribution of invasive species, like the African carder bee in Australia (Dart et al., 2022). Although bias and low data quality are potentially problematic, methods are available to reduce the influence of these issues (Bird et al., 2014). When using such data, it is important to account for users’ sampling behaviour and spatial sampling bias in data collection, as reviewed by Dickinson et al. (2010), which can result in filtrating uninformative data. Spatial sampling bias, namely the distortion of species distributions due to spatial heterogeneity in sampling effort of the observers, can be approximated by the spatial concentration of records from a group of species generally sampled together by the observers (called a Target-Group, TG; Phillips et al., 2009). This approximation is justified if the cumulated distribution of TG species does not vary greatly over space (Botella et al., 2020) and if observers have similar sampling preferences towards TG species (although not necessarily true as observer experience can influence species reporting rate; Johnston et al., 2018). Accounting for sampling heterogeneity, this study aimed at capitalising on crowdsourced plant records generated through iNaturalist (iNaturalist, 2022), a popular global crowdsourcing platform. Observers can upload geolocated records of any species, and the community assists in verifying species identifications. Although this data source is appealing, not all studies will benefit from using iNaturalist data over those collected and collated by experts. This is because some taxonomic groups receive less attention on citizen science platforms, and some cannot easily be recorded with standard smart-phone cameras (Hochmair et al., 2020). Nonetheless, there are indications of the valuable contribution that this dataset offers to the scientific community, especially in countries or regions where there are many active users and where the subject species are conspicuous (Mesaglio and Callaghan, 2021), which is the case for naturalised trees and shrubs in South Africa.
Our aim is to understand the drivers of community assembly of woody naturalised trees and shrubs in South Africa, and to investigate whether these drivers differ between species at different stages along the invasion continuum, particularly species at an early stage of establishment with localised spread versus those that have attained larger geographical ranges. We hypothesise that the drivers of narrow-ranged and widespread species will differ. Specifically, narrow-ranged species are hypothesised to be driven by anthropogenic factors since these species are still confined to areas close to sites of introduction, whereas invasions of widespread species should be driven more by environmental conditions since these species would have been filtered by the environment in the expanded range. For better area-based management, we also aim to describe spatial clusters of alien tree and shrub species across South Africa and summarise properties of these groupings, making use of data curated by citizens on iNaturalist. Although this project aims to investigate many factors, we can do so because of the versatile method of multi-site generalised dissimilarity modelling with zeta diversity.
2. Methods
2.1. Focal species
Focal species of this investigation included tree and shrub species naturalised in South Africa. These species were identified using the definitions of trees and shrubs proposed by Richardson and Rejmánek (2011) and additional expert advice whilst cross-referencing the classifications of alien trees and shrubs made by Henderson (2020) (Supplementary Table S1).
In this study, the species composition of a single quarter-degree grid cell, an area of approximately 25 × 25 km, is considered a ‘community’. Occurrence data were extracted from the iNaturalist website on 27 July 2022 with a query specifying the iNaturalist project “Naturalized Plants of South Africa”1. This extraction contained all Research Grade (RG) observations made by iNaturalist observers within South Africa’s national borders for naturalised plant species listed in Richardson et al. (2020) based largely on the list compiled for South Africa’s National Status Report (Zengeya and Wilson, 2020) with additions as detailed on the iNaturalist project page. Plant observations labelled RG are expected to be wild-growing individuals where species identification have been verified and where two-thirds of identifications agree. However, even with this stringency measure in place there is still not absolute confidence in the data quality as identifications may be mislabelled, especially in cases where subspecies are identified, and where cultivated specimens are incorrectly recorded as growing wild. For research on invasions, the separation of wild-growing, self-sustaining populations from planted individuals is crucial for the understanding of spread and progression of the invasion. Consequently, substantial effort was made to manually filter the iNaturalist records to ensure correct identifications and labelling. As a further measure to ensure data quality, we only used records identified to the species level; if a record was identified at a finer level (e.g., subspecies), we retained only the species name.
This occurrence dataset was converted to a presence/absence matrix based on the grid of quarter-degree cells widely used for biodiversity atlases in South Africa, using the letsR package v4.0 (Vilela and Villalobos, 2015). All analyses were conducted in R version 4.1.2 (R Core Team, 2021). We initially identified a total of 246 naturalised tree and shrub species (all used to build the Target-Group, explained below), but finally kept for the analysis only the 190 species that were present in the 68 selected cells (see section 2.2). These species are hereafter called the focal species. Focal species occurred in 801 quarter-degree grid cells of South Africa (42% of all 1900 grid cells across the country) (Figure 1A) based on 40,491 records uploaded between the period of 2011–2022 by 3,153 observer, with Acacia mearnsii having the largest coverage of 265 grid cells (13.9%). The number of FS occurrence records showed near identical trends in concentration of richness (Figure 1B), indicating that high species richness may be skewed by sampling effort in those cells, and not necessarily representative of true richness. When visualising the relationship between record count and richness, we see that cells around the Cape Peninsula in the southwest are consistently highly sampled with many records per species, and many regions are poorly sampled in the country (Figure 2). The distribution of record counts per cell was highly left-skewed, ranging from 1 to 6,334, with an average of 51 and a median of 5 observations per cell.
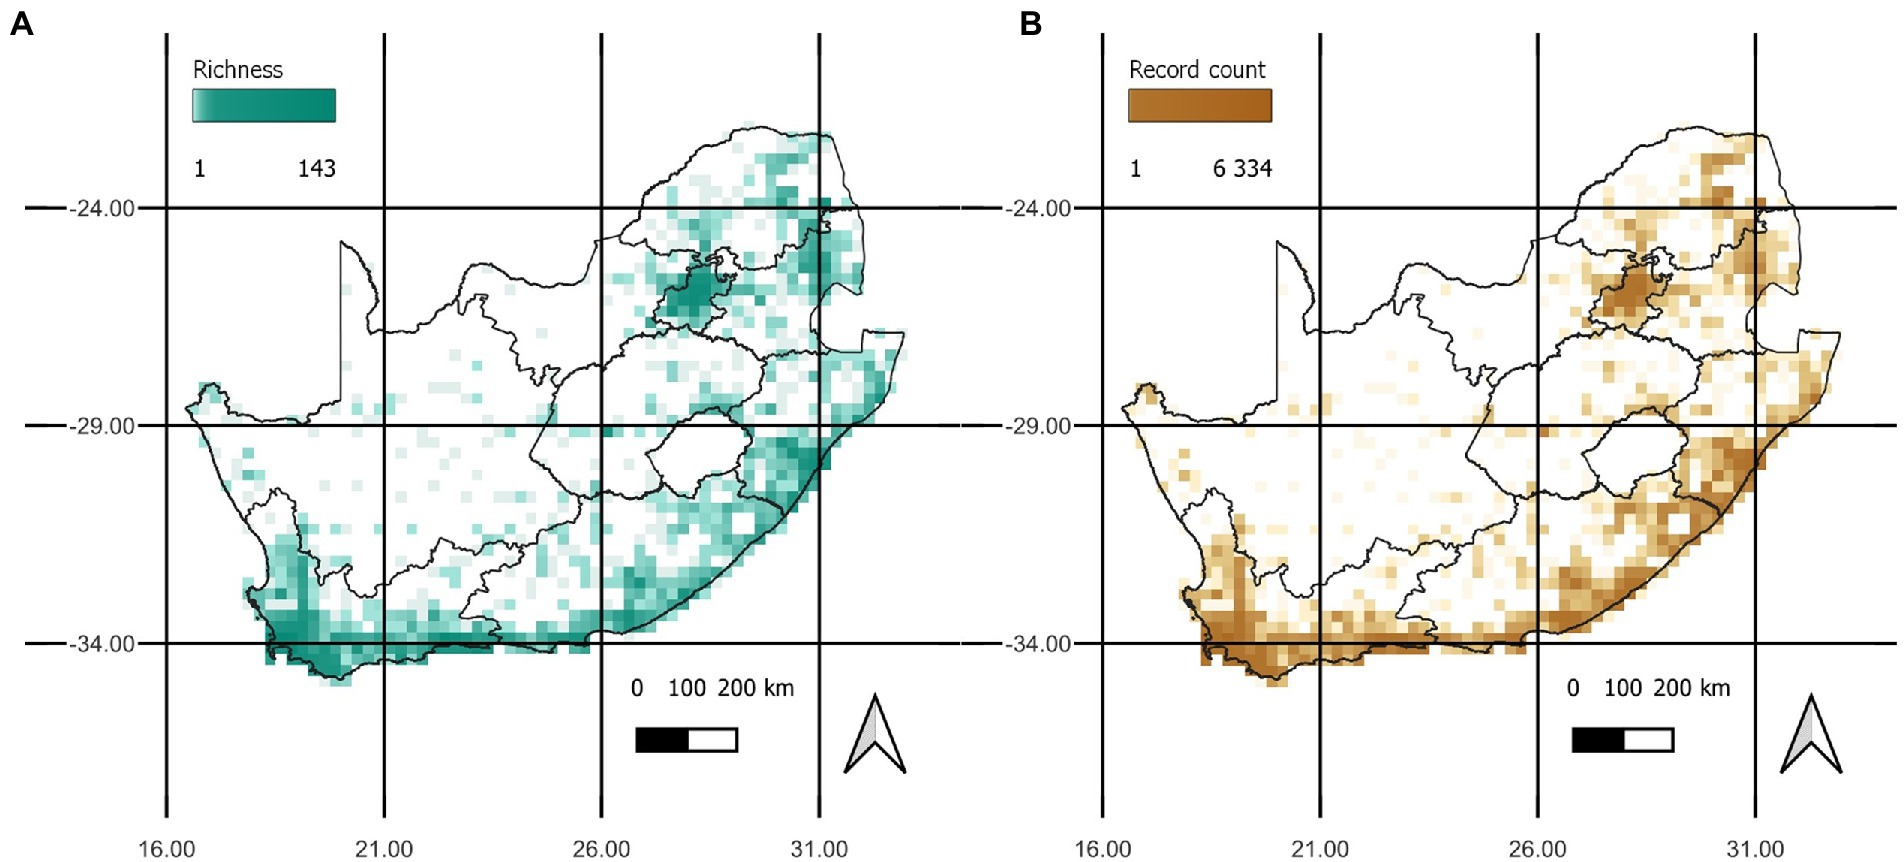
Figure 1. (A) The distribution of focal species richness, presented as the number of species per grid cell. (B) The distribution of record counts per grid cell, which relates to sampling effort for focal species. The similar patterns in the two plots highlight that the richness per cell may be biased by the sampling effort in those cells.
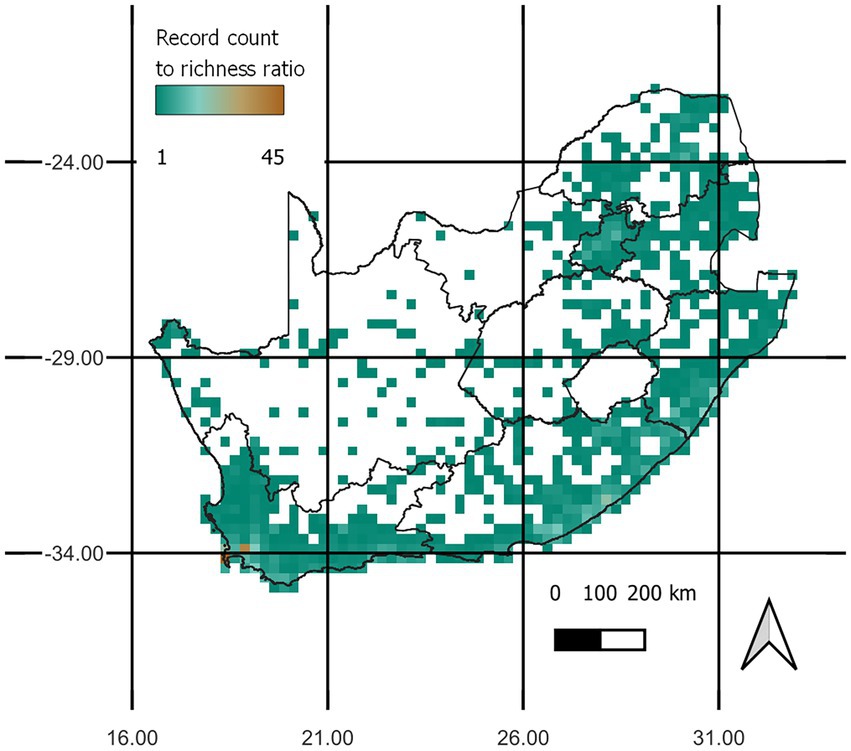
Figure 2. The record count of focal species per grid cell divided by the species richness per grid cell highlights the distribution of multiple records per focal species in the study area.
The least visited cells will likely have many false absences, under-representing their true species richness, with a likely detection bias towards the most conspicuous species. Following the rationale presented in Botella et al. (2020) and implemented in Botella et al. (2022), we designed a procedure to tackle this problem and detection variability across observers. Briefly, we first computed an approximation of sampling effort per cell which is positively correlated with the detection probability of all focal species. We then minimised the effects of sampling bias by retaining only cells with minimal numbers of potentially undetected species estimated from the sampling effort approximation per cell.
Botella et al. (2020) showed that the spatial variations of sampling effort may be well approximated by the total number of records of a Target-Group (TG) of species under certain conditions. Firstly, the TG species must be generally reported together with the focal species by the observers, so that cells having more TG occurrences can be assumed to have been better sampled for the focal species, thereby increasing the chances of detecting the ones that are present. Since our focal species are trees and shrubs, we selected all terrestrial plant species in the generic sense as our candidate TG; hence we extracted all the Research Grade (RG) iNaturalist observations of terrestrial plants from the Global Biodiversity Information Facility extracted through (GBIF.org, 2022). Secondly, to reduce observer bias, we kept only records from observers who reported more records than species, thereby favouring observers who have repeatedly sampled some species and thus are assumed to sample species irrespective of whether they recorded these species previously. Thirdly, the TG species must be selected so that their cumulated abundances across space is roughly constant (Botella et al., 2020), otherwise species-rich areas would have more TG record counts even under constant sampling effort (this is likely to be the case here given the spatial variability of richness across South Africa; see, e.g., Supplementary Figure S1). To approximate this spatially homogeneous situation, we used a heuristic method for TG selection proposed by Botella et al. (2022). The procedure sequentially adds species to the TG, firstly maximising the spatial coverage of TG species to increase the breadth of environments sampled, and secondly maximising the evenness of richness (Shannon entropy) of TG species across cells to reduce the unequal distribution of richness of the TG. It follows that the species with the highest number of presences across grid cells would be selected first, and that each subsequent addition of species to the TG should increase the coverage of the TG and then the evenness of species richness across cells. From the GBIF dataset, a subset of 1,788 species was included in the TG, covering all 1,548 grid cells of the GBIF dataset with the Shannon entropy improved from 6.214 to 6.355.
The number of TG occurrences per grid cell provides an estimate of the sampling effort. We used this sampling effort estimate and one extra parameter, called K, to determine, for each cell and each undetected focal species in that cell, whether the focal species absence was certain or not. The value of K (integer between 1 and 100) determines the amount of sampling effort required to detect each species in any cell. Specifically, we computed one detection threshold per focal species as the Kth percentile of the sampling effort values across cells where this species was detected. Finally, a cell was selected if the number of focal species whose absence is uncertain divided by the number of detected focal species in the cell was less than a threshold called ratio. After investigating the influence of changing the two parameters, K, and ratio, with differing levels of stringency, the values of K = 10, and ratio = 1 were decided and 68 grid cells selected in South Africa. These parameter values were selected to retain enough cells for subsequent analyses, whilst still limiting the false-absence errors. These selected cells were all distributed in highly sampled areas, i.e., around urban centres (Supplementary Figure S2).
2.2. Drivers of turnover
Plant distributions are shaped by environmental factors such as local bioclimates defined by precipitation and temperature variables (Mod et al., 2016). We included bioclimatic variables to test the hypothesis that prevailing environmental conditions drive the turnover of naturalised trees and shrubs. Given the limited number of selected cells and to avoid over-parameterization, the 19 bioclimatic variables at 30-s resolution from the WorldClim database (Fick and Hijmans, 2017) were reduced via a principal component analysis. Fine-grained raster datasets were cropped to South Africa and then resampled to quarter-degree resolution using the bilinear method in R statistical software. This dimension reduction makes the interpretation of contribution to turnover less explicit since each principal component axis now captures the variation of the linear combination of variables. The contribution of each axis to bioclimatic variation is indicated by the corresponding eigenvalues, whilst the contribution of each bioclimatic variable in an axis is the variable’s weight in the linear combination. The first and third axes explained 35.8 and 14.8% of bioclimatic variation, respectively. The second axis was dropped due to its strong correlation with other included predictors (particularly, river density). According to bioclimatic variable weights of these two selected principal component axes (Supplementary Table S2), the first axis reflects mainly the effect of diurnal temperature range, and the third axis precipitation.
Road density is a measure of human activity in the Human Footprint Index (HFP) (Venter et al., 2016). To investigate the role of pathways created by all roads and trails in naturalised plant community assembly, the road density per quarter-degree cell was computed based on the complete vector shapefile of roads in South Africa (Humanitarian OpenStreetMap Team, 2022) in QGIS and included in the analyses.
River systems can affect community turnover via mediating propagule dispersal and storage. The river density per quarter-degree cell was included as a predictor to capture the contribution of rivers and streams to turnover. We computed river density using the line density interpolation function in QGIS software version 3.18.0-Zurich (QGIS Development Team, 2022) based on a complete vector shapefile of South African rivers and streams. All projections were according to standard WGS84 projection.
The iNaturalist interface allows its users to label species observations as cultivated. We can expect that species labelled as cultivated were planted in the area and that such occurrences are the result of current or historical horticultural practices in the area. To test the hypothesis that local horticultural activities are a driver of turnover of focal species, a planting effort metric was computed by dividing the number of cultivated iNaturalist records of all terrestrial plants, by the sum of focal species and cultivated observations per cell in order to control for sampling bias. Observations of planted specimens were extracted from the iNaturalist website on 28 July 2022 with a query specifying only cultivated plant records within South Africa.
Variable pairs were checked for collinearity with the accepted level indicated by Pearson’s correlation coefficient below 0.7. Variance Inflation Factor (VIF) measures how much of the variance of a coefficient in the regression model is attributed to multicollinearity within the model, where a VIF below 10 is acceptable. This was tested using the car package v3.1–0 in R (Fox and Weisberg, 2019). The variable with the highest VIF above 10 was removed and the VIFs of all other variables recalculated and assessed, and this procedure was repeated till all the remaining variables had their VIFs below 10. Key variables for hypothesis testing were retained whilst checking collinearity and VIF (Araújo et al., 2019). Consequently, only six variables reflecting various mechanisms of turnover were included in the final analyses, including site-based factors (two bioclimatic axes, PC1 and PC3), dispersal pathways (road density, river density and geographical distance between quarter-degree cells) and human disturbance activity (road density and planting effort).
2.3. Statistical analyses
2.3.1. Zeta diversity
We aim to understand the processes mediating the assembly of species of alien trees and shrubs. The broadscale assembly processes can be investigated by analysing the behaviour of the zeta diversity metric with its order, called the zeta-decline. This can describe whether compositional turnover is governed by deterministic or stochastic processes. If deterministic processes such as niche differentiation shape the turnover in species composition, the curve of zeta-decline would necessarily be explained by a power-law regression function. If stochastic processes such as introduction history and pathway-based factors shape the turnover in species composition, the curve of zeta-decline would necessarily be described by a negative exponential regression function (Hui and McGeoch, 2014). The significance of these regressions was tested using the zeta decline function in the zetadiv package v1.2.1 in R (Latombe et al., 2022). We acknowledge that this binary interpretation of zeta decline can be oversimplified (Deane et al., 2023) and thus included further regression analyses with predictors.
2.3.2. Species richness
The first order of zeta describes the average number of species in a single cell which is the species richness. The drivers of change in species richness across sites were investigated using a generalised additive model (GAM) with restricted maximum likelihood (REML) estimation. This method is similar to GDM models except that it considers the non-linear relationship between explanatory variables and species richness, as opposed to turnover of species. This was tested to understand the determinants of higher levels of biodiversity within sites.
2.3.3. Multi-site generalized dissimilarity modelling
We aim to understand the drivers of compositional turnover by relating variations of zeta diversity to environmental gradients. In generalised dissimilarity modelling (GDM), species turnover between sites are regressed with changes in selected predictor variables. Using zeta diversity as a metric of multi-site compositional turnover, the GDM model is adapted to Multi-Site Generalised Dissimilarity Modelling (MS-GDM). In this model, is equivalent to the GDM, quantifying pairwise site dissimilarity (beta diversity) driven largely by the gain and loss of narrow-ranged species between sites, whereas higher orders of zeta are equivalent to compositional turnover amongst more than two sites, hence driven largely by more widespread species. In this study, we selected the I-spline regression in the MS-GDM which captures the local and nonlinear response of compositional turnover to predictor gradients (Latombe et al., 2017). That is, a change in the value of a predictor variable, like temperature, does not affect the compositional turnover equally along the range of values. This is important since an equal amount of change at different ranges of a predictor can have very different ecologically meaningful effects. For example, increasing 1°C in cold regions has a different impact on compositional turnover when compared to increasing 1°C in warm regions. The I-splines were specified with three knots, thus allowing us to disentangle contribution to turnover throughout the low, medium, and high ranges of a predictor which corresponds to the three knots. The range of distances influencing turnover in this study is interpreted as change within a bioregion (short distance), change between adjacent bioregions (medium distance) and change between distant bioregions (long distance), where the longest distance would be between the south-western (around Cape Town) and the north-eastern parts of South Africa (around Mbombela).The MS-GDM for Simpson-equivalent zeta diversity was constructed for zeta orders of two and five to describe, respectively, the drivers of turnover of narrow-range (order two) and widespread (order five) naturalised species.
2.3.4. Mapping alien biomes
To predict species composition of alien trees and shrubs across South Africa, even in unsampled and under-sampled areas, we first trained a GDM with species compositions in the 68 selected cells and associated environments (whilst including geographical distance between cells). From this trained GDM model, the predicted compositional dissimilarity between site pairs was mapped using the predict function in the gdm package v1.5.0–3 in R (Fitzpatrick et al., 2022) by multidimensional scaling (MDS) and plotted as a Red-Green-Blue (RGB) plot of the principal component scores of sites. Alien biomes (bioregion clusters) of predicted compositional dissimilarity were identified using the K-means algorithm, with the optimal number of clusters investigated using cluster visualisation methods (Supplementary Figures S3, S4). Choosing the optimal number of clusters is not definitive and we could equally well have chosen between five and seven clusters. Informed by the number of native biomes in South Africa, we chose to present six clusters to relate the communities of these alien species to native vegetation communities. The characteristic species of each cluster were identified as the 10 species with the highest count of presence per cluster (Supplementary Table S3).
3. Results
3.1. Zeta diversity
Communities of naturalised trees and shrubs appeared to be structured by deterministic rather than stochastic processes. Indeed, the shape of the zeta decline (Figure 3) for the selected 68 cells conforms best to a power-law regression function ( with AIC = −18.21) compared to an exponential decline regression function ( with AIC = −9.35) for the first 20 orders of zeta. The zeta diversity declines to below 1 after order eight, which means that very few species overlap with more than eight grid cells. The average number of shared species between two sites is 14.45 ± 12.90 (mean ± standard deviation), amongst three sites 6.81 ± 6.07, amongst four sites 3.87 ± 3.70, amongst five sites 2.49 ± 2.58.
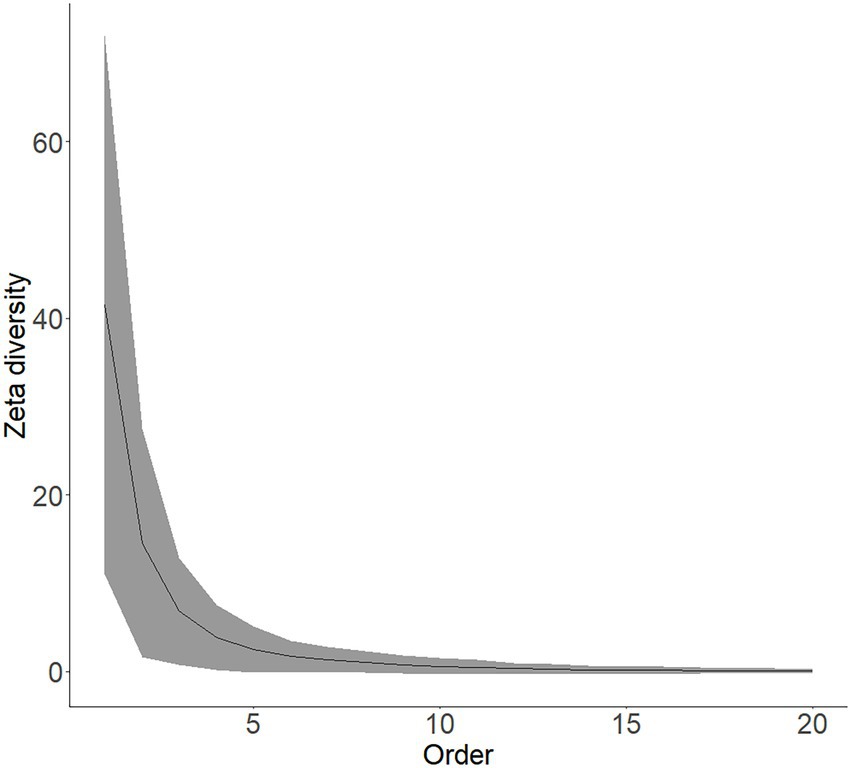
Figure 3. The relationship between zeta diversity and the order of zeta is shown as the zeta diversity decline. The zeta diversity decline was fitted to an exponential and a power-law regression function to test whether the assembly is driven largely by stochastic or deterministic factors. The solid line indicates mean zeta diversity and is bounded by the values of standard deviation.
3.2. Species richness
The average number of species found in a single site of the 68 selected cells was 41.50 ± 30.52 (mean ± standard deviation) (Figure 3). Species richness of selected cells was best explained by the planting effort and secondly by the diurnal temperature range (Table 1) (53.3% deviance explained by the GAM). There was a marginally non-significant effect of road density (p = 0.053) and no significant effect of precipitation and river density (Table 1).
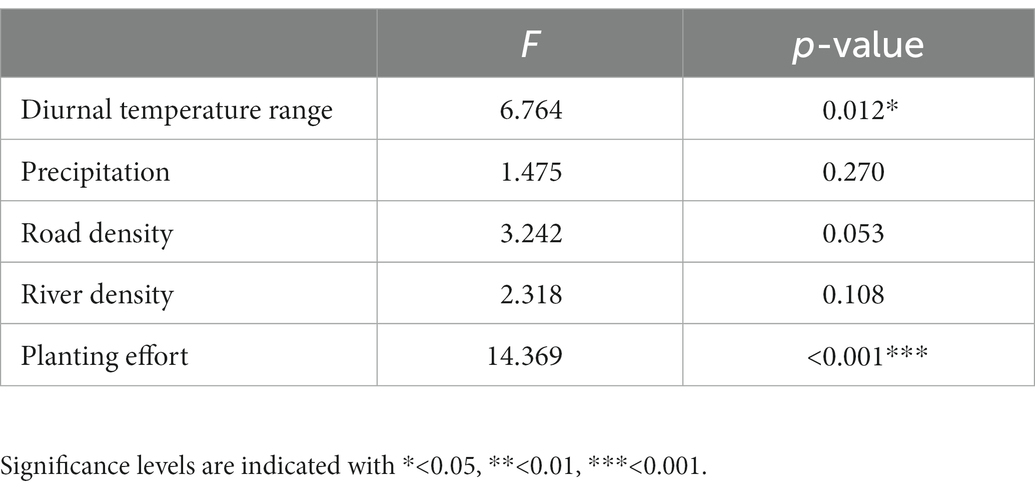
Table 1. Results of GAM testing contribution of predictors to change in species richness of selected cells.
3.3. Multi-site generalized dissimilarity modelling
Compositional similarity of narrow-ranged species at decayed mainly with increasing distance between sites (Table 2; note the significantly negative estimates), as indicated by the high magnitude of the distance I-spline (i.e., its contribution to compositional turnover) relative to those of other drivers (Figure 4A), and secondly diurnal temperature range and river density. It is important to note that the compositional similarity of zeta diversity is the opposite of the compositional dissimilarity (i.e., compositional turnover). As the compositional zeta similarity were fitted with three knots, we could understand contribution to turnover across the low, medium, and high range of each predictor. Changes in diurnal temperature range of areas with larger difference between temperature extremes, and changes in precipitation in wet areas, not in arid zones, affected compositional turnover of narrow ranged species (Table 2). Changes in the road density at lower values of the predictor which corresponds to rural areas with few roads, and changes in river density lower values of the predictor which corresponds to areas with little drainage, were found to significantly affect compositional turnover of narrow-ranged species. Additionally, river density was marginally significant at medium ranges (p < 0.1). Compositional turnover of narrow-ranged species was sensitive to distance change across high (roughly more than 1,000 km) and low (roughly less than 500 km) ranges; note the significantly negative estimates in Table 2 and the notable steepness over these ranges for the distance I-spline in Figure 4A. Notice that it is marginally significant for medium ranges (p < 0.1). Planting effort had no significant impact on compositional turnover of narrow ranged species. The model performed well, with 24.1% deviance explained. When not accounting for the distance between sites, the variance explained decreases by half to 12.6% deviance explained and negligible changes in the contribution to compositional turnover of predictors, with no additional significant predictors.
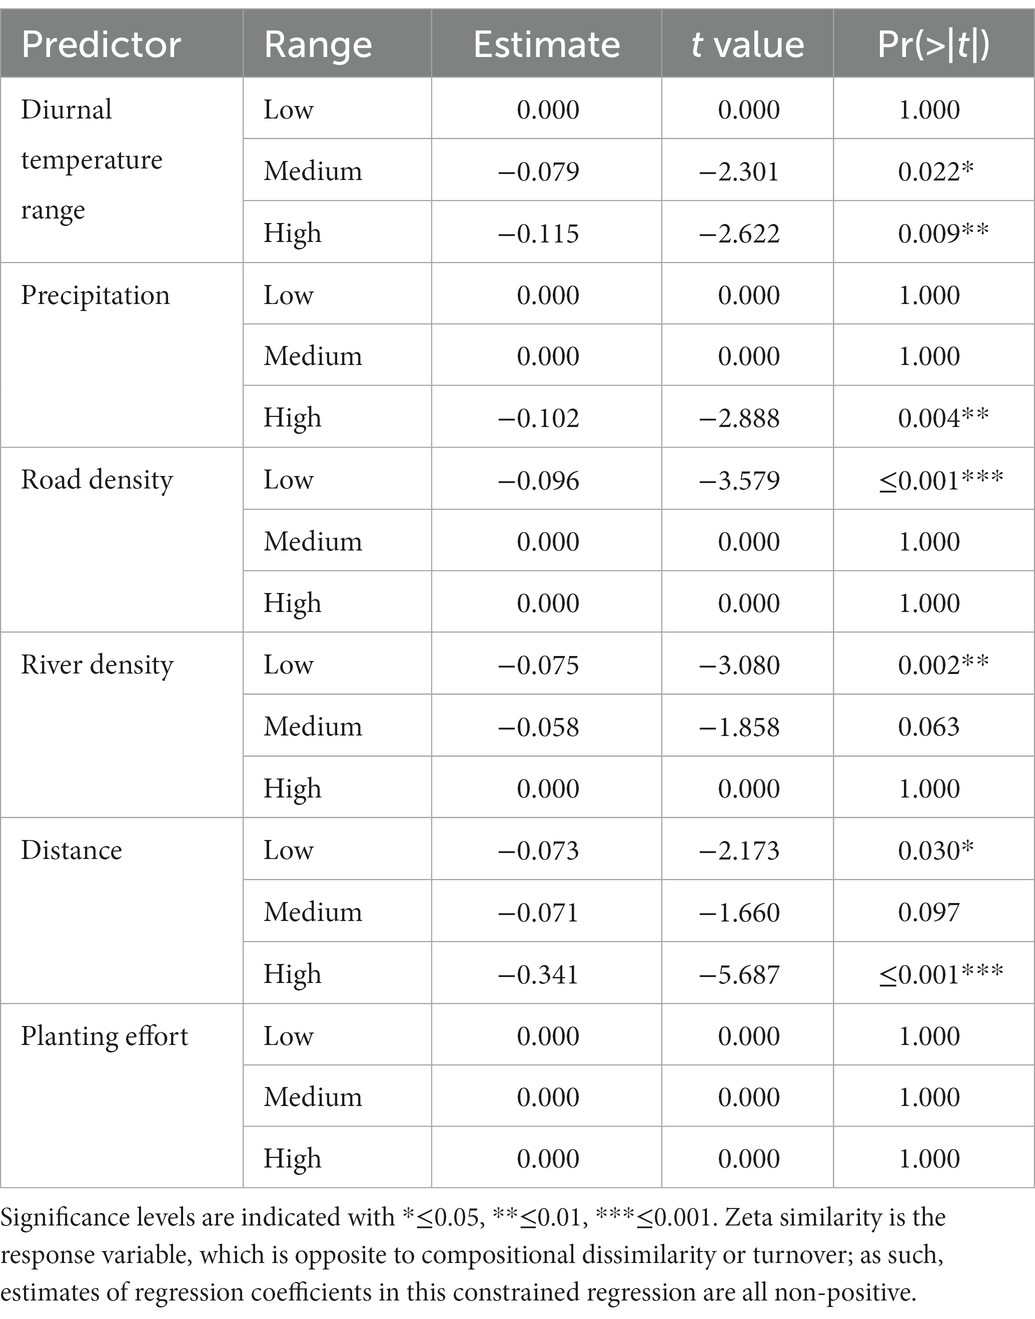
Table 2. Results of multi-site generalised dissimilarity modelling of narrow-ranged species (ζ2).
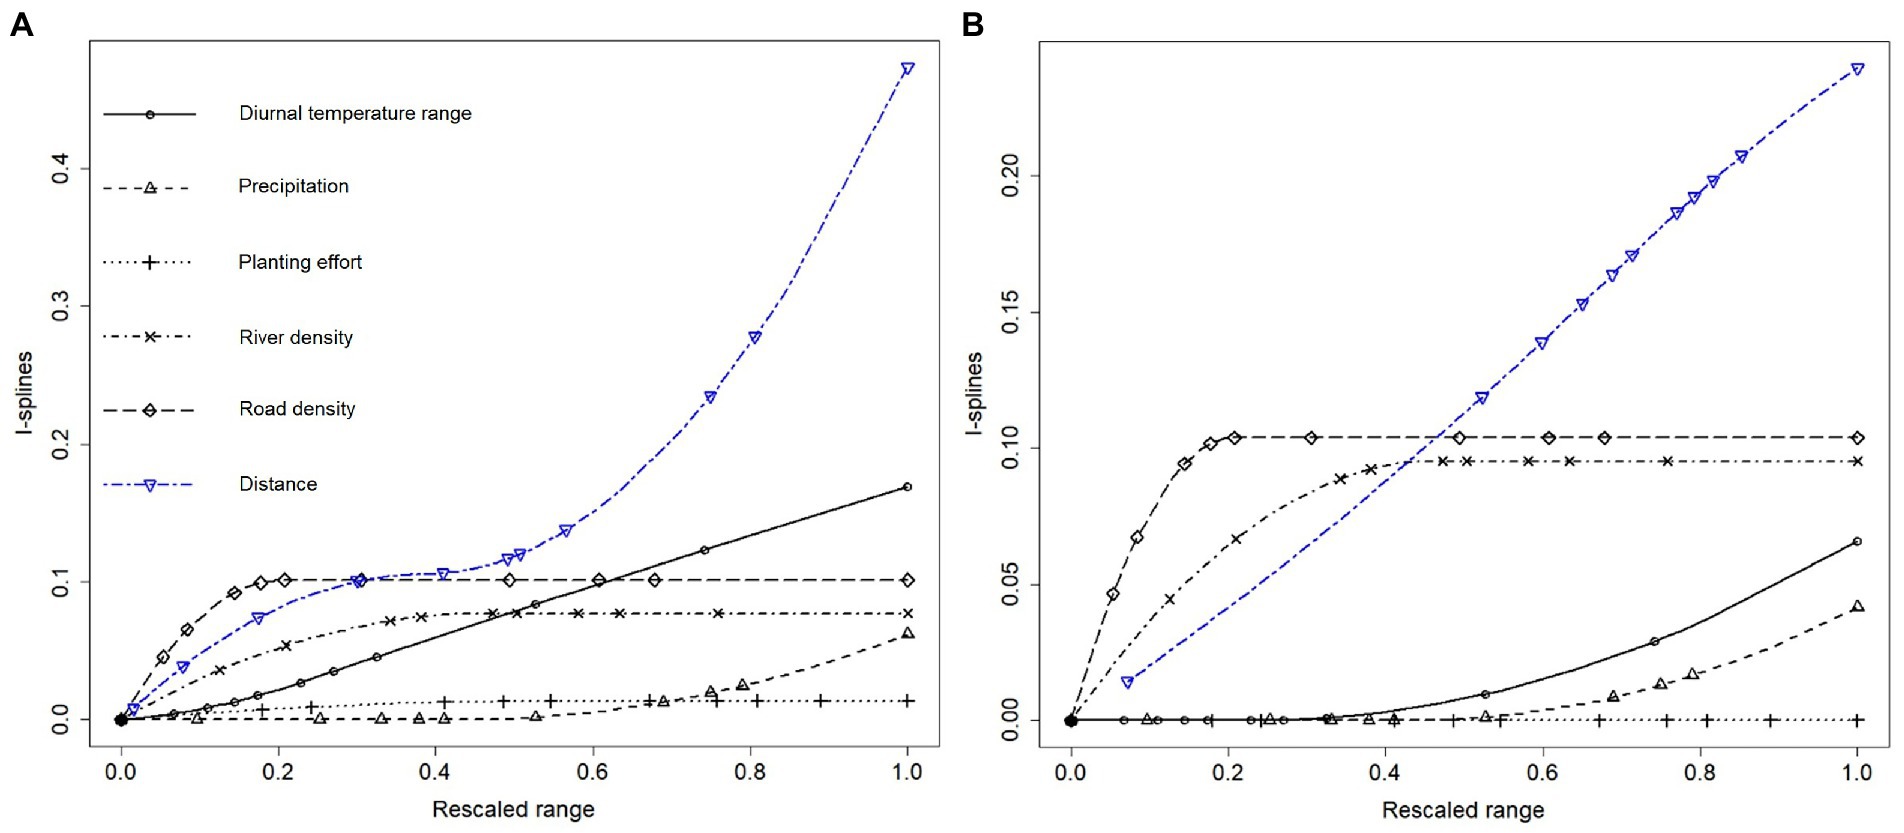
Figure 4. (A) I-spline regression of narrow-ranged species (zeta order two) and (B) widespread species (zeta order five) naturalised trees and shrubs, for which the magnitude of an I-spline is interpreted as the total contribution of the predictor to compositional turnover (i.e., the opposite to compositional zeta similarity). Following the convention of dissimilarity modelling, the vertical axis of I-splines represents compositional dissimilarity or turnover, which is opposite to zeta similarity. Notably, distance is consistently a strong predictor at all ranges, but with low road density being more important than distance for turnover of widespread species. The steepness of the response curve at a particular value for a predictor represents the contribution of the predictor to compositional turnover at this value. For instance, river density contributes more to compositional turnover in low-drainage areas (a steeper response curve for river density < 0.3) than in high-drainage areas (a flatter response curve for river density > 0.5). Each variable is rescaled to a value between minimum and maximum, with markers separating 10th percentiles. Distance is rescaled between zero and maximum and thus the minimum distance between sites (the leftmost marker) is above zero.
Community turnover of increasingly widespread species at was driven by very similar drivers to those for narrow-ranged species (Figure 4B for compositional turnover, Table 3 for compositional similarity) although for these species changes at medium distance ranges significantly affected turnover, compared to low distance ranges for narrow-ranged species. Road density was the second most important predictor for widespread species, followed by river density, which was again marginally significant in the low range. Lower road density in more rural areas was a very strong influence of compositional turnover, even stronger than distance for this range of the predictor (Figure 4B). Again, planting effort had no significant contribution to turnover. The model had a slightly weaker performance, which is expected as the order of zeta increases, with 19.9% deviance explained.
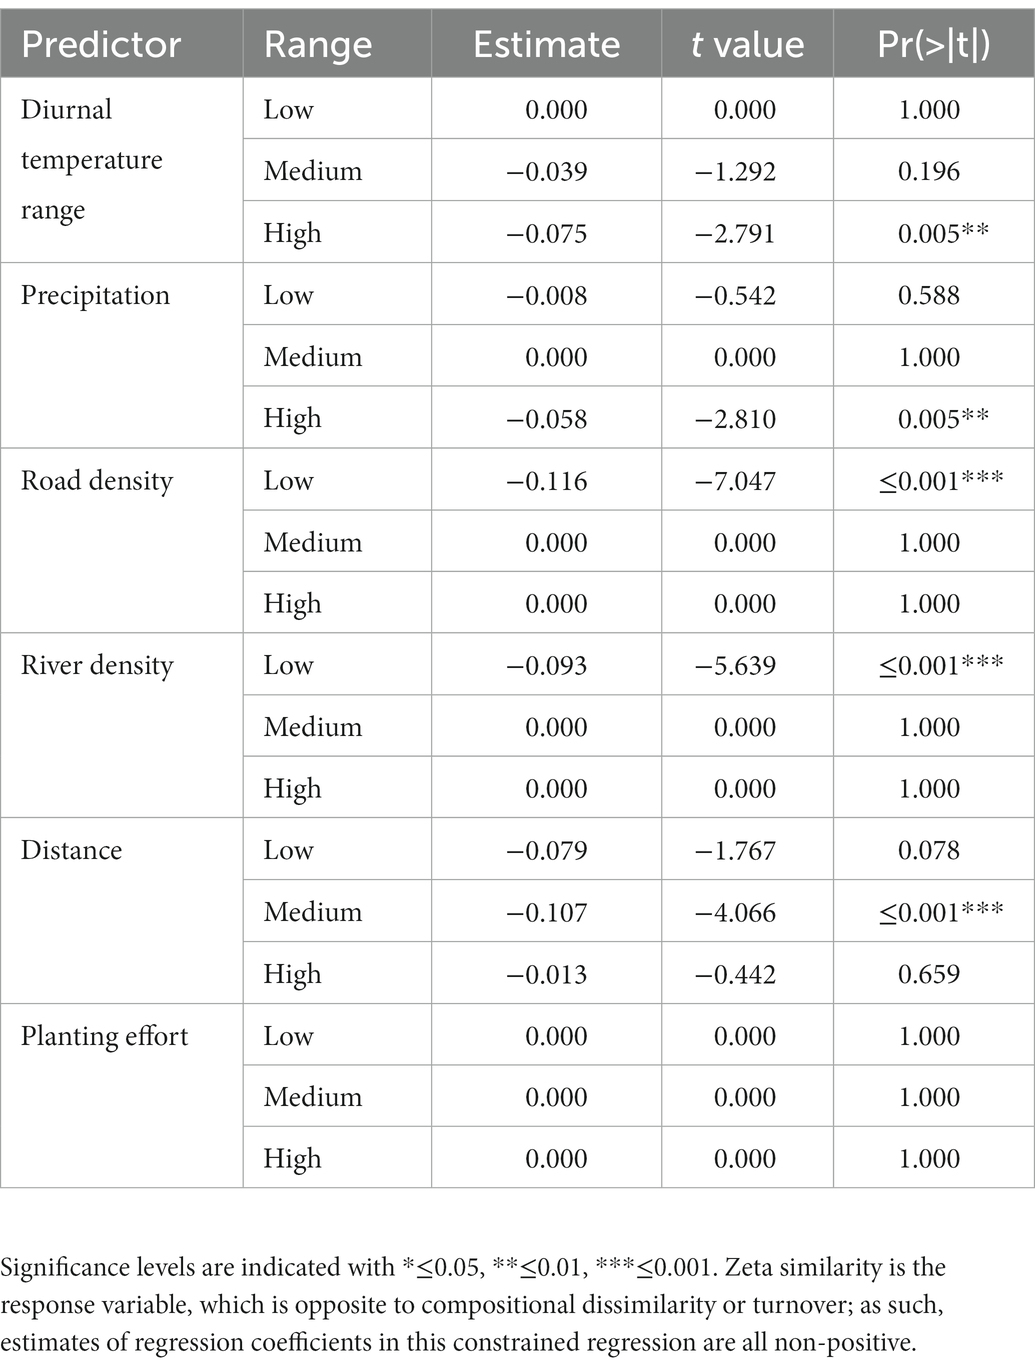
Table 3. Results of multi-site generalised dissimilarity modelling of widespread species (ζ5).
3.4. Predicted compositional similarity
The GDM model explained reasonably well the pairwise compositional dissimilarity between the selected cells with 34.1% of the deviance explained by the predictors. The visualisation of the predicted compositional similarity via GDM shows areas of similar community composition with similar colours in the Red-Green-Blue space (Figure 5A). Results of the K-means cluster analysis shows the geographical distributions of the six clusters (Figure 5B). Many species are present in multiple clusters, indicating that there are many widespread species which homogenises alien communities across South Africa (see Table S3). These clusters are compared to the native biomes of South Africa (Figure 5C). The planting effort metric was not considered to predict dissimilarity across all pairs of cells as it cannot be computed for the many cells without focal species and planted species since this results in dividing by zero (Figure 5D). Including planting effort would have limited our capacity to predict across South Africa since planting effort could only be computed for 732 cells (Figure 5D). We consider it justified to remove planting effort from GDM modelling since it consistently made no significant contribution to turnover.
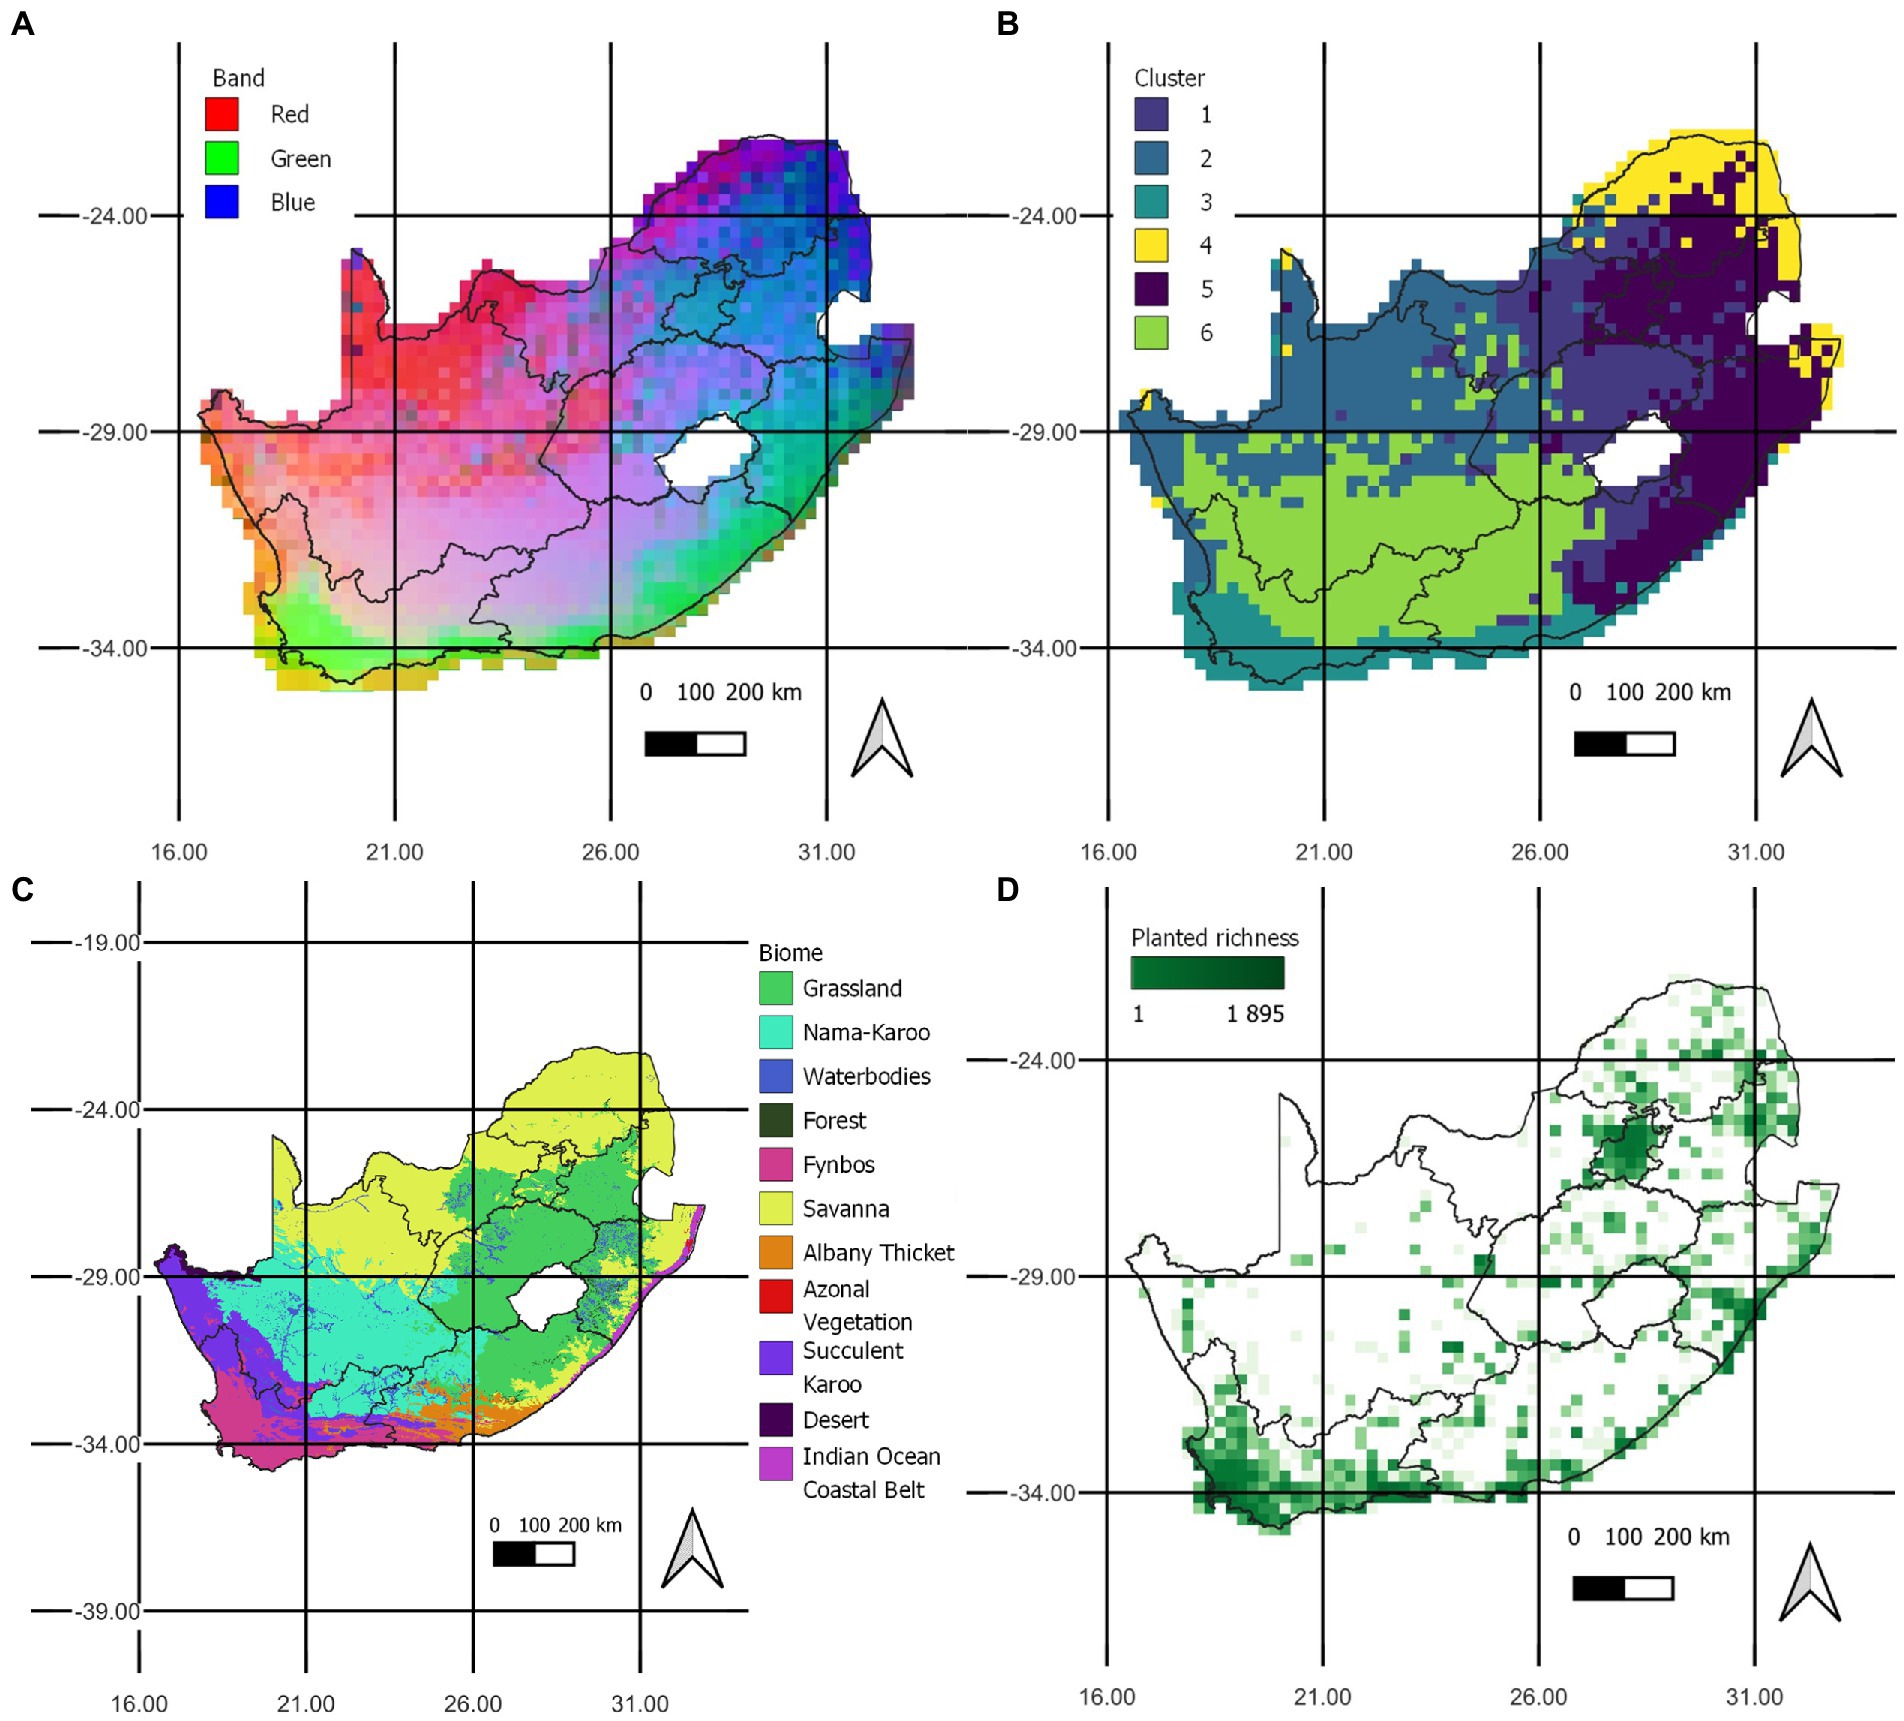
Figure 5. (A) The predicted compositional similarity of alien biomes of trees and shrubs in the RGB space and (B) the predicted geographies of communities of trees and shrubs as results from a cluster analysis of k-means when specifying k = 6 compared to (C) the native biomes of South Africa (South African National Biodiversity Institute (SANBI), 2012) and (D) the coverage of record counts of planting effort.
4. Discussion
The drivers of compositional turnover of narrow-ranged and widespread naturalised trees and shrubs in South Africa are largely similar (Table 2 and Table 3) and composition showed a strong response to geographic distance in both cases. This study also revealed for the first time the importance of pathway-based factors in shaping the compositional turnover of naturalised woody plant communities in South Africa. This highlights the central role of introduction history and dispersal constraints in shaping the distribution of these species, along with the documented role of bioclimatic factors (Hugo et al., 2012; Rouget et al., 2015). However, narrow-ranged and widespread species compositions differ in their sensitivity to the range of distance. The difference in their response to distance between sites merits further investigation. When species are not limited by distance, and with enough residence time, they are expected to be distributed across all biotically and abiotically suitable environments. In reality, the dispersal capabilities of organisms are limited, and the physical distance between sites poses a limit to movement. Physical barriers such as mountain ranges, rivers, and regions of unsuitable habitat through which they cannot traverse further modify the distribution of species (i.e., the connectivity between sites; Vasudev et al., 2015). However, this distance predictor may also serve as a surrogate for environmental variables which are autocorrelated with distance. This is known as the Moran effect, where populations geographically close to each other, and which experience more similar environmental variables in space and time, have similar population dynamics (Hansen et al., 2020). Thus, it may be that a change in distance is synonymous with changing some environmental factors not considered in this study because of the limited number of well-sampled sites available. The relationship between distance and community turnover is likely further modulated by the long-distance or haphazard movement and introduction of propagules and organisms through diverse human activities (Auffret et al., 2014). Thus, geographical distance in this study may be representative of not just a limit to the natural dispersal abilities of species, but also the effect of untested autocorrelated variables and the influence of humans which are known to modulate alien species movements.
There is high turnover within bioregions for narrow-ranged species, for which the communities also differ between distant bioregions. There is little evidence for dispersal over short distances since they remain unhomogenised even over very short ranges; this may reflect the influence of competitive exclusion between species. Propagules rarely disperse via natural long-distance dispersal and rather a large proportion of dispersal events occur at the local scale. Thus, the distinction between distant communities more likely reflects the influence of human movement or introduction of propagules to these sites (Nathan et al., 2008). These narrow-ranged species thus have a patchy distribution across South Africa, which may reflect multiple introduction hubs, which may also differ in the species they harbour. This may be due to a difference in the history of ornamental plantings in different parts of the country, different agricultural crops and ornamental species, and different forestry species, a view that is supported by the findings of Thuiller et al. (2006). This indicates a close association of human use of alien plants and their distribution in South Africa. This interpretation requires further research into the regional scale, current and historical trends in the use of alien trees and shrubs by humans.
In contrast, widespread species showed high turnover across medium distances, indicating little homogenisation at these ranges and thus low rates of natural dispersal by species between adjacent bioregions, where only some species successively spread far from introduction hubs. The high density of invasions in urban centres may reflect communities outside the radius of major introduction hubs which differ from those within the introduction hub. This could thus indicate a concentration of widespread species at sites of introduction, with high levels of homogenisation within these sites, and high turnover of species at the outskirts, possibly from a handful of particularly successful invaders having spread to this distance. These species have low turnover at local scales which indicates homogenisation of communities within regions, possibly reflecting frequent within-region dispersal. This is likely the effect of a few very widely distributed species having spread substantially across the country, or those which have been introduced to multiple distant locations. If this distance reflects the Moran effect, we can understand that these very widespread species are generalist invaders that occur widely across many habitats and climatic conditions. This complex effect of distance on turnover could be further elucidated by studies of network topology and connectivity between sites (e.g., Banks et al. (2015) that may reflect contributions to propagule movement from multiple human-mediated vectors.
Passive dispersal of propagules via roads likely only acts over short distances. Parendes and Jones (2000) indicate that dispersal pathways such as rivers and roads may provide a more complex contribution to turnover than simply through dispersal of propagules. Rauschert et al. (2017) found evidence for dispersal of seeds across a maximum distance of a few hundred metres on rural roads, and this via the action of local road maintenance. However, there is strong evidence that these pathways contribute to turnover through more complex mechanisms as they have been shown to simultaneously provide suitable habitat for species, act as a store of propagules, and aid dispersal via physical propagule movement. Kalwij et al. (2008) found little role for dispersal along the road verges, but rather that the nature of the road explained turnover. This was divided into rural gravel roads and tar roads, with high and low road traffic. Areas with higher road density had higher species richness and the distance of these roads from urban centres did not predict species richness. In a survey along South African roads, Milton and Dean (1998) found high alien species richness on road verges across all biomes. Higher species richness was found to be closely associated with cultivated areas, rather than rangelands. Thus, the high turnover of species in regions of low road density found in this study may be attributed to short-distance dispersal of some species for which seeds are able to disperse along the road verges. The effect of turnover at relatively rural sites is more likely associated with the habitat features provided by the road verges, and possibly untested land-use practices at these sites.
An interesting observation is that species in areas with high road densities, such as urban centres, are more homogenised. This means that urban invaders are interspersed with little turnover, possibly reflecting suites of invaders widespread throughout urban areas. These areas likely contain the highest species richness, the planting effort per grid cell, which is associated with urban areas and human cultivation, was a strong contributor to richness. This indicates that urban areas with higher planting effort facilitate higher species richness of wild-growing trees and shrubs, possibly as a consequence of the nurturing of parent populations (Donaldson et al., 2014). Thus, although the planting effort does not increase spatial turnover between sites of wild growing naturalised trees and shrubs, it still influences the presence of these species. This may be as a possible consequence of the urban landscape with high road densities, rather than a direct consequence of cultivation, although these factors are tightly linked. In contrast, bioclimatic factors are likely sorting the communities of wild-growing species.
Rivers likely contribute in a complex way to turnover, via both propagule dispersal and storage. For example, Foxcroft et al. (2007) showed the possibility of spread of riparian invaders along river corridors. On the other hand, Gurnell et al. (2008) found that a large proportion of propagules deposited in the riverbed of a UK river were of species present much higher up along the river. The inundation cycle of the river allows these propagules to be moved out of the riparian zone to colonise new sites. However, this depends on the physical nature of propagules which determines their deposition and germination. The alternative would be that the river systems act as a barrier to dispersal which has been identified in old river systems in Amazonia (Dambros et al., 2020). In this case, a higher river density would equal higher compositional turnover because of limitations to dispersal between sites across rivers. However, this is not the case, and rather we see that the river systems increase dispersal by homogenising compositions between sites in areas with high river density. In this study, river corridors likely act to disperse propagules of both narrow ranged and widespread species over significant distances. This is also true in more arid regions where the river may act as refugia for these species, thus harbouring and homogenising communities rather than limiting dispersal.
We see high turnover in areas which experience high temperature variation and precipitation, for both narrow-ranged and widespread species. High-altitude inland areas which experience greater temperature extremes have high compositional turnover, compared to moderate coastal plains. Wetter areas such as in the eastern half of the country, along with the southern coast and near the Cape Peninsula, have high species turnover, with little turnover in more arid regions. There is thus little evidence of unique environmental drivers of species turnover of comparatively less progressed alien taxa, versus more progressed widespread taxa. The finding that narrow-ranged and widespread species turnover are influenced by the same factors sheds light on the determinants of invasion by these species. This suggests that range expansion of invaders is ongoing and not characterised by any particular predictors tested in this study. However, this study was limited to few predictors and future studies should incorporate biotic factors to fully investigate the determinants of range expansion of these species.
The geographical distribution of naturalised tree and shrub communities has little resemblance to native biomes. The strong effect of introduction hubs and road density as a driver of turnover indicates that there is an association with areas of urbanisation or human activity and use of alien species. This is supported by the finding that species richness is higher in areas of high planting effort which are around urban areas. The influence of diurnal temperature ranges is seen to explain clusters two and five along the coast in areas that experience moderate temperatures and relatively high precipitation. Further inland, clusters are separated between the east and west which corresponds to the influence of precipitation gradients. This seems to be further modulated by different road densities in the sparsely populated Northern Cape province in the north-west which is represented roughly by clusters three and six, and the densely populated province of Gauteng in the north-east, which is mainly contained in cluster five.
5. Conclusion
Similar to the results of Hugo et al. (2012) and Rouget et al. (2015), our study provided evidence for the role of bioclimatic factors in shaping alien biomes. New evidence emerged of the role of human introduction and movement of species, and both natural and human-made pathways in aiding dispersal and providing habitat. However, the limitations of the presence-only dataset meant that not all possible drivers could be tested. This study did not include biotic factors in the analysis, nor land-use practices. Further work, including these factors, is needed to further clarify the dynamics of species assemblages of naturalised trees and shrubs in South Africa. Turnover of narrow-ranged and widespread species are maintained by similar drivers and there is little evidence for unique drivers which determine range expansion of naturalised trees and shrubs. The geographical clustering of species indicates that mainly roads, rivers and to some extent distance explains within-bioregion compositional turnover; these factors are related to dispersal pathways. Between bioregions the effect of bioclimatic factors and introduction hubs with distinct species drive compositional turnover. Further research could apply this to the entire suite of alien taxa present in South Africa to see whether results of this larger grouping would mimic more closely the results of Hugo et al. (2012) and Rouget et al. (2015) for the geographical distribution of alien plant biomes. Overall, this investigation has showed evidence for the role of human activity in the assembly processes of naturalised trees and shrubs in South Africa, with little evidence found for environmental drivers which may assist the range expansion of alien taxa. Further studies are needed to compare the results of analysis of data from this platform to results from professionally curated sources to further our knowledge on the usability of this dataset.
Data availability statement
The original contributions presented in the study are included in the article/Supplementary material, further inquiries can be directed to the corresponding author.
Author contributions
All authors listed have made a substantial, direct, and intellectual contribution to the work and approved it for publication.
Funding
We thank the DSI-NRF Centre of Excellence for support. DMR acknowledges support from Mobility 2020 project no. CZ.02.2.69/0.0/0.0/18_053/0017850 (Ministry of Education, Youth, and Sports of the Czech Republic) and long-term research development project RVO 67985939 (Czech Academy of Sciences). CH and CB acknowledge support from the NRF (grant 89967). We are grateful to Guillaume Latombe for useful discussions on the methodology. We thank the Department of Botany and Zoology at Stellenbosch University for their support during the research process.
Conflict of interest
The authors declare that the research was conducted in the absence of any commercial or financial relationships that could be construed as a potential conflict of interest.
Publisher’s note
All claims expressed in this article are solely those of the authors and do not necessarily represent those of their affiliated organizations, or those of the publisher, the editors and the reviewers. Any product that may be evaluated in this article, or claim that may be made by its manufacturer, is not guaranteed or endorsed by the publisher.
Supplementary material
The Supplementary material for this article can be found online at: https://www.frontiersin.org/articles/10.3389/fevo.2023.1106197/full#supplementary-material
Footnotes
References
Araújo, M. B., Anderson, R. P., Barbosa, A. M., Beale, C. M., Dormann, C. F., Early, R., et al. (2019). Standards for distribution models in biodiversity assessments. Sci. Adv. 5, eaat4858–eaat4874. doi: 10.1126/sciadv.aat4858
Auffret, A. G., Berg, J., and Cousins, S. A. O. (2014). The geography of human-mediated dispersal. Divers. Distrib. 20, 1450–1456. doi: 10.1111/ddi.12251
Banks, N. C., Paini, D. R., Bayliss, K. L., and Hodda, M. (2015). The role of global trade and transport network topology in the human-mediated dispersal of alien species. Ecol. Lett. 18, 188–199. doi: 10.1111/ele.12397
Basel, A. M., Simaika, J. P., Samways, M. J., Midgley, G. F., MacFadyen, S., and Hui, C. (2021). Assemblage reorganization of south African dragonflies due to climate change. Divers. Distrib. 27, 2542–2558. doi: 10.1111/ddi.13422
Bird, T. J., Bates, A. E., Lefcheck, J. S., Hill, N. A., Thomson, R. J., Edgar, G. J., et al. (2014). Statistical solutions for error and bias in global citizen science datasets. Biol. Conserv. 173, 144–154. doi: 10.1016/j.biocon.2013.07.037
Blackburn, T. M., Pyšek, P., Bacher, S., Carlton, J. T., Duncan, R. P., Jarošík, V., et al. (2011). A proposed unified framework for biological invasions. Trends Ecol. Evol. 26, 333–339. doi: 10.1016/j.tree.2011.03.023
Botella, C., Bonnet, P., Hui, C., Joly, A., and Richardson, D. M. (2022). Dynamic species distribution modeling reveals the pivotal role of human-mediated long-distance dispersal in plant invasion. Biol. 11:1293. doi: 10.3390/biology11091293
Botella, C., Joly, A., Monestiez, P., Bonnet, P., and Munoz, F. (2020). Bias in presence-only niche models related to sampling effort and species niches: lessons for background point selection. PLoS One 15:e0232078. doi: 10.1371/journal.pone.0232078
Cheek, M. D., and Semple, J. C. (2016). First official record of naturalised populations of Solidago altissima L. var. pluricephala M.C. Johnst. (Asteraceae: Astereae) in Africa. S. Afr. J. Bot. 105, 333–336. doi: 10.1016/j.sajb.2016.05.001
Christen, D. C., and Matlack, G. R. (2009). The habitat and conduit functions of roads in the spread of three invasive plant species. Biol. Invasions 11, 453–465. doi: 10.1007/s10530-008-9262-x
Dambros, C., Zuquim, G., Moulatlet, G. M., Costa, F. R. C., Tuomisto, H., Ribas, C. C., et al. (2020). The role of environmental filtering, geographic distance and dispersal barriers in shaping the turnover of plant and animal species in Amazonia. Biodivers Conserv 29, 3609–3634. doi: 10.1007/s10531-020-02040-3
Dart, K., Latty, T., and Greenville, A. (2022). Citizen science reveals current distribution, predicted habitat suitability and resource requirements of the introduced African carder bee Pseudoanthidium (Immanthidium) repetitum in Australia. Biol. Invasions 24, 1827–1838. doi: 10.1007/s10530-022-02753-2
Deane, D., Hui, C., and McGeoch, M. A. (2023). Two dominant forms of multisite similarity decline – their origins and interpretation. Ecol. Evol. in press
Dickinson, J. L., Zuckerberg, B., and Bonter, D. N. (2010). Citizen science as an ecological research tool: challenges and benefits. Annu. Rev. Ecol. Evol. Syst. 41, 149–172. doi: 10.1146/annurev-ecolsys-102209-144636
Donaldson, J. E., Hui, C., Richardson, D. M., Robertson, M. P., Webber, B. L., and Wilson, J. R. U. (2014). Invasion trajectory of alien trees: the role of introduction pathway and planting history. Glob. Chang. Biol. 20, 1527–1537. doi: 10.1111/gcb.12486
Ferrier, S., Manion, G., Elith, J., and Richardson, K. (2007). Using generalized dissimilarity modelling to analyse and predict patterns of beta diversity in regional biodiversity assessment. Divers. Distrib. 13, 252–264. doi: 10.1111/j.1472-4642.2007.00341.x
Fick, S. E., and Hijmans, R. J. (2017). WorldClim 2: new 1km spatial resolution climate surfaces for global land areas. Int. J. Climatol. 37, 4302–4315. doi: 10.1002/joc.5086
Fitzpatrick, M., Mokany, K., Manion, G., Nieto-Lugilde, D., and Ferrier, S. (2022). gdm: generalized dissimilarity modeling. Available at: https://CRAN.R-project.org/package=gdm (Accessed October 24, 2022).
Fox, J., and Weisberg, S. (2019). An {R} companion to applied regression. Available at: https://socialsciences.mcmaster.ca/jfox/Books/Companion/ (Accessed October 18, 2022).
Foxcroft, L. C., Rouget, M., and Richardson, D. M. (2007). Risk assessment of riparian plant invasions into protected areas. Conserv. Biol. 21, 412–421. doi: 10.1111/j.1523-1739.2007.00673.x
Gurnell, A., Thompson, K., Goodson, J., and Moggridge, H. (2008). Propagule deposition along river margins: linking hydrology and ecology. J. Ecol. 96, 553–565. doi: 10.1111/j.1365-2745.2008.01358.x
Hansen, B. B., Grøtan, V., Herfindal, I., and Lee, A. M. (2020). The Moran effect revisited: spatial population synchrony under global warming. Ecography 43, 1591–1602. doi: 10.1111/ecog.04962
Henderson, L. (2020). Invasive Alien Plants in South Africa. Pretoria: Agricultural Research Council.
Henderson, L., and Wilson, J. R. U. (2017). Changes in the composition and distribution of alien plants in South Africa: an update from the southern African plant invaders atlas. Bothalia Afr. Biodivers. Conserv. 47, 1–26. doi: 10.4102/abc.v47i2.2172
Hochmair, H. H., Scheffrahn, R. H., Basille, M., and Boone, M. (2020). Evaluating the data quality of iNaturalist termite records. PLoS One 15:e0226534. doi: 10.1371/journal.pone.0226534
Hugo, S., van Rensburg, B. J., van Wyk, A. E., and Steenkamp, Y. (2012). Alien phytogeographic regions of southern Africa: numerical classification, possible drivers, and regional threats. PLoS One 7:e36269. doi: 10.1371/journal.pone.0036269
Hui, C., and McGeoch, M. A. (2014). Zeta diversity as a concept and metric that unifies incidence-based biodiversity patterns. Am. Nat. 184, 684–694. doi: 10.1086/678125
Hui, C., Richardson, D. M., Pyšek, P., Le Roux, J. J., Kučera, T., and Jarošík, V. (2013). Increasing functional modularity with residence time in the co-distribution of native and introduced vascular plants. Nat. Commun. 4:2454. doi: 10.1038/ncomms3454
Humanitarian OpenStreetMap Team (2022). HOTOSM South Africa Roads (OpenStreetMap Export). Available at: https://data.humdata.org/ (Accessed March 18, 2022).
iNaturalist (2022). iNaturalist. Available at: https://www.inaturalist.org (Accessed March 18, 2022).
Jansen, C., and Kumschick, S. (2022). A global impact assessment of acacia species introduced to South Africa. Biol. Invasions 24, 175–187. doi: 10.1007/s10530-021-02642-0
Johnston, A., Fink, D., Hochachka, W. M., and Kelling, S. (2018). Estimates of observer expertise improve species distributions from citizen science data. Methods Ecol. Evol. 9, 88–97. doi: 10.1111/2041-210X.12838
Kalwij, J. M., Milton, S. J., and McGeoch, M. A. (2008). Road verges as invasion corridors? A spatial hierarchical test in an arid ecosystem. Landsc. Ecol. 23, 439–451. doi: 10.1007/s10980-008-9201-3
Kalwij, J. M., Steyn, C., and le Roux, P. C. (2014). Repeated monitoring as an effective early detection means: first records of naturalised Solidago gigantea Aiton (Asteraceae) in southern Africa. S. Afr. J. Bot. 93, 204–206. doi: 10.1016/j.sajb.2014.04.013
Krasnov, B. R., Shenbrot, G. I., van der Mescht, L., and Khokhlova, I. S. (2020). Drivers of compositional turnover are related to species’ commonness in flea assemblages from four biogeographic realms: zeta diversity and multi-site generalised dissimilarity modelling. Int. J. Parasitol. 50, 331–344. doi: 10.1016/j.ijpara.2020.03.001
Latombe, G., Hui, C., and McGeoch, M. A. (2017). Multi-site generalised dissimilarity modelling: using zeta diversity to differentiate drivers of turnover in rare and widespread species. Methods Ecol. Evol. 8, 431–442. doi: 10.1111/2041-210X.12756
Latombe, G., McGeoch, M., Nipperess, D., and Hui, C. (2022). Zetadiv: Functions to compute compositional turnover using zeta diversity. R package version 1.2.1. Available at: https://CRAN.R-project.org/package=zetadiv>.
Latombe, G., Roura-Pascual, N., and Hui, C. (2019). Similar compositional turnover but distinct insular environmental and geographical drivers of native and exotic ants in two oceans. J. Biogeogr. 46, 2299–2310. doi: 10.1111/jbi.13671
Lenzner, B., Latombe, G., Schertler, A., Seebens, H., Yang, Q., Winter, M., et al. (2022). Naturalized alien floras still carry the legacy of European colonialism. Nat. Ecol. Evol. 6, 1723–1732. doi: 10.1038/s41559-022-01865-1
MacFadyen, S., Allsopp, N., Altwegg, R., Archibald, S., Botha, J., Bradshaw, K., et al. (2022). Drowning in data, thirsty for information and starved for understanding: a biodiversity information hub for cooperative environmental monitoring in South Africa. Biol. Conserv. 274:109736. doi: 10.1016/j.biocon.2022.109736
McGeoch, M. A., Latombe, G., Andrew, N. R., Nakagawa, S., Nipperess, D. A., Roigé, M., et al. (2019). Measuring continuous compositional change using decline and decay in zeta diversity. Ecology 100:e02832. doi: 10.1002/ecy.2832
Merritt, D. M., Nilsson, C., and Jansson, R. (2010). Consequences of propagule dispersal and river fragmentation for riparian plant community diversity and turnover. Ecol. Monogr. 80, 609–626. doi: 10.1890/09-1533.1
Mesaglio, T., and Callaghan, C. T. (2021). An overview of the history, current contributions and future outlook of iNaturalist in Australia. Wildl. Res. 48, 289–303. doi: 10.1071/WR20154
Milton, S. J., and Dean, W. R. J. (1998). Alien plant assemblages near roads in arid and semi-arid South Africa. Divers. Distrib. 4, 175–187. doi: 10.1046/j.1472-4642.1998.00024.x
Mod, H. K., Scherrer, D., Luoto, M., and Guisan, A. (2016). What we use is not what we know: environmental predictors in plant distribution models. J. Veg. Sci. 27, 1308–1322. doi: 10.1111/jvs.12444
Mokany, K., Ware, C., Woolley, S. N. C., Ferrier, S., and Fitzpatrick, M. C. (2022). A working guide to harnessing generalized dissimilarity modelling for biodiversity analysis and conservation assessment. Glob. Ecol. Biogeogr. 31, 802–821. doi: 10.1111/geb.13459
Nathan, R., Schurr, F. M., Spiegel, O., Steinitz, O., Trakhtenbrot, A., and Tsoar, A. (2008). Mechanisms of long-distance seed dispersal. Trends Ecol. Evol. 23, 638–647. doi: 10.1016/j.tree.2008.08.003
Parendes, L. A., and Jones, J. A. (2000). Role of light availability and dispersal in exotic plant invasion along roads and streams in the H.J. Andrews experimental Forest. Oreg. Conserv. Biol. 14, 64–75. doi: 10.1046/j.1523-1739.2000.99089.x
Phillips, S. J., Dudik, M., Dudik, D., Elith, J., Graham, C. H., Lehmann, A., et al. (2009). Sample selection bias and presence-only distribution models: implications for background and pseudo-absence data. Ecol. Appl. 19, 181–197. doi: 10.1890/07-2153.1
QGIS Development Team (2022). QGIS geographic information system. Available at: http://qgis.osgeo.org.
R Core Team (2021). R: A language and environment for statistical computing. Available at: https://www.R-project.org/.
Rauschert, E. S. J., Mortensen, D. A., and Bloser, S. M. (2017). Human-mediated dispersal via rural road maintenance can move invasive propagules. Biol. Invasions 19, 2047–2058. doi: 10.1007/s10530-017-1416-2
Richardson, D.M., Foxcroft, L.C., Latombe, G., Le Maitre, D.C., Rouget, M., and Wilson, J. R. (2020). “The biogeography of south African terrestrial plant invasions,” in Biological Invasions in South Africa, eds B.W. van Wilgen, J. Measey, D.M. Richardson, J. R. Wilson, and T. A. Zengeya. Cham: Springer.
Richardson, D. M., Hui, C., Nuñez, M. A., and Pauchard, A. (2014). Tree invasions: patterns, processes, challenges and opportunities. Biol. Invasions 16, 473–481. doi: 10.1007/s10530-013-0606-9
Richardson, D. M., and Pyšek, P. (2012). Naturalization of introduced plants: ecological drivers of biogeographical patterns. New Phytol. 196, 383–396. doi: 10.1111/j.1469-8137.2012.04292.x
Richardson, D. M., Pyšek, P., Rejmánek, M., Barbour, M. G., Panetta, F. D., and West, C. J. (2000). Naturalization and invasion of alien plants: concepts and definitions. Divers. Distrib. 6, 93–107. doi: 10.1046/j.1472-4642.2000.00083.x
Richardson, D. M., and Rejmánek, M. (2011). Trees and shrubs as invasive alien species - a global review. Divers. Distrib. 17, 788–809. doi: 10.1111/j.1472-4642.2011.00782.x
Rouget, M., Hui, C., Renteria, J., Richardson, D. M., and Wilson, J. R. U. (2015). Plant invasions as a biogeographical assay: vegetation biomes constrain the distribution of invasive alien species assemblages. S. Afr. J. Bot. 101, 24–31. doi: 10.1016/j.sajb.2015.04.009
Rutherford, M. C., Mucina, L., and Powrie, L. W. (2006). “Biomes and bioregions of South Africa” in Vegetation of South Africa, Lesotho and Swaziland. eds. M. C. Rutherford and L. Mucina (Pretoria: South African National Biodiversity Institute), 32–51.
Simons, A. L., Mazor, R., Stein, E. D., and Nuzhdin, S. (2019). Using alpha, beta, and zeta diversity in describing the health of stream-based benthic macroinvertebrate communities. Ecol. Appl. 29:e01896. doi: 10.1002/eap.1896
Skultety, D., and Matthews, J. W. (2017). Urbanization and roads drive non-native plant invasion in the Chicago metropolitan region. Biol. Invasions 19, 2553–2566. doi: 10.1007/s10530-017-1464-7
South African National Biodiversity Institute (SANBI) (2012). Vegetation Map of South Africa, Lesotho and Swaziland. Pretoria. SANBI. [vector geospatial dataset]. Available at: http://bgis.sanbi.org/SpatialDataset/Detail/18 (Accessed April 26, 2022).
Thuiller, W., Richardson, D. M., Rouget, M., Procheş, Ş., and Wilson, J. R. U. (2006). Interactions between environment, species traits, and human uses describe patterns of plant invasions. Ecology 87, 1755–1769. doi: 10.1890/0012-9658(2006)87[1755,IBESTA]2.0.CO;2
van Kleunen, M., Essl, F., Pergl, J., Brundu, G., Carboni, M., Dullinger, S., et al. (2018). The changing role of ornamental horticulture in alien plant invasions. Biol. Rev. 93, 1421–1437. doi: 10.1111/brv.12402
van Wilgen, B. W., Zengeya, T. A., and Richardson, D. M. (2022). A review of the impacts of biological invasions in South Africa. Biol. Invasions 24, 27–50. doi: 10.1007/s10530-021-02623-3
Vasudev, D., Fletcher, R. J., Goswami, V. R., and Krishnadas, M. (2015). From dispersal constraints to landscape connectivity: lessons from species distribution modelling. Ecography 38, 967–978. doi: 10.1111/ecog.01306
Venter, O., Sanderson, E. W., Magrach, A., Allan, J. R., Beher, J., Jones, K. R., et al. (2016). Global terrestrial human footprint maps for 1993 and 2009. Sci. Data 3:160067. doi: 10.1038/sdata.2016.67
Vilela, B., and Villalobos, F. (2015). letsR: a new R package for data handling and analysis in macroecology. Methods Ecol. Evol. 6, 1229–1234. doi: 10.1111/2041-210X.12401
Watt, M. S., Kriticos, D. J., and Manning, L. K. (2009). The current and future potential distribution of Melaleuca quinquenervia. Weed Res. 49, 381–390. doi: 10.1111/j.1365-3180.2009.00704.x
Keywords: invasion biology, generalized dissimilarity model, zeta diversity, iNaturalist, species occurrence data, biogeography
Citation: de Beer IW, Hui C, Botella C and Richardson DM (2023) Drivers of compositional turnover of narrow-ranged versus widespread naturalised woody plants in South Africa. Front. Ecol. Evol. 11:1106197. doi: 10.3389/fevo.2023.1106197
Edited by:
Rubén G. Mateo, Autonomous University of Madrid, SpainReviewed by:
Res Altwegg, University of Cape Town, South AfricaIrene Martin-Fores, University of Adelaide, Australia
Copyright © 2023 de Beer, Hui, Botella and Richardson. This is an open-access article distributed under the terms of the Creative Commons Attribution License (CC BY). The use, distribution or reproduction in other forums is permitted, provided the original author(s) and the copyright owner(s) are credited and that the original publication in this journal is cited, in accordance with accepted academic practice. No use, distribution or reproduction is permitted which does not comply with these terms.
*Correspondence: Isabella W. de Beer, ✉ aXNhYmVsbGEuZGViZWVyOEBnbWFpbC5jb20=
†These authors have contributed equally to this work
‡ORCID: Isabella W. de Beer https://orcid.org/0000-0002-6576-7646
Cang Hui https://orcid.org/0000-0002-3660-8160
Christophe Botella https://orcid.org/0000-0002-5249-911X
David M. Richardson https://orcid.org/0000-0001-9574-8297