 Artemis D. Treindl
 Jessica Stapley3
 Adrian Leuchtmann
- 1Plant Ecological Genetics Group, Institute of Integrative Biology, ETH Zurich, Zurich, Switzerland
- 2Biodiversity and Conservation Biology, Swiss Federal Institute for Forest, Snow and Landscape Research WSL, Birmensdorf, Switzerland
- 3Plant Pathology Group, Institute of Integrative Biology, ETH Zurich, Zurich, Switzerland
Understanding the population genetic processes driving the evolution of plant pathogens is of central interest to plant pathologists and evolutionary biologists alike. However, most studies focus on host-pathogen associations in agricultural systems of high genetic and environmental homogeneity and less is known about the genetic structure of pathogen populations infecting wild plants in natural ecosystems. We performed parallel population sampling of two pathogenic Epichloë species occurring sympatrically on different host grasses in natural and seminatural grasslands in Europe: E. typhina infecting Dactylis glomerata and E. clarkii infecting Holcus lanatus. We sequenced 422 haploid isolates and generated genome-wide SNP datasets to investigate genetic diversity and population structure. In both species geographically separated populations formed genetically distinct groups, however, population separation was less distinct in E. typhina compared to E. clarkii. The patterns of among population admixture also differed between species across the same geographic range: we found higher levels of population genetic differentiation and a stronger effect of isolation by distance in E. clarkii compared to E. typhina, consistent with lower levels of gene flow in the former. This pattern may be explained by the different dispersal abilities of the two pathogens and is expected to be influenced by the genetic structure of host populations. In addition, genetic diversity was higher in E. typhina populations compared to E. clarkii, indicative of higher effective population size in E. typhina. These results suggest that the effect of genetic drift and the efficacy of selection may differ in the two species. Our study provides evidence of how ecologically similar species occupying the same geographical space can experience different evolutionary contexts, which could influence local adaptation and co-evolutionary dynamics of these fungal pathogens.
1. Introduction
Fungal plant pathogens are fundamental and ubiquitous components of natural biodiversity (Bradley et al., 2008; Burdon and Laine, 2019). And yet, fungal plant pathogens are not commonly studied in natural ecosystems but rather in an agricultural setting, because they cause yield losses in important crop plants and may have negative impacts on human or animal health (Fisher et al., 2012). Evolutionary research in the field of plant pathology therefore heavily focuses on mechanisms leading to disease outbreaks in agricultural ecosystems usually associated with the rapid evolution of virulence or fungicide resistance related traits (McDonald and Linde, 2002). Agricultural systems are useful for the study of antagonistic coevolution because these systems are characterized by strong selection and rapid adaptation, providing, in a way, short-term evolutionary “experiments” (Stukenbrock and McDonald, 2008). A potential drawback, however, is the fact that the starting conditions of all these “experiments” are essentially the same: pathogens emerge under environmental and genetic uniformity. How plant pathogens evolve under more natural conditions remains less well understood. The impact of fungal plant pathogens on wild plants has received some attention in the case of invasive diseases [for example Hymenoscyphus fraxineus causing ash-dieback (McMullan et al., 2018), or the chestnut blight fungus Cryphonectria parasitica (Milgroom et al., 2008)], but mechanisms underlying persistence and evolutionary dynamics of host-pathogen associations in native systems remain much more elusive. Exploring the genetic structure of populations is central to the study of the evolutionary interactions between fungal pathogens and their host plants. The distribution of genetic variation within populations (genetic diversity) and among populations (genetic differentiation/patterns of gene flow) can provide insights into the evolutionary histories, distributions and disease dynamics of interacting species and determines their evolutionary potential (Thompson, 2005, Chapter 2, Raw Materials for Coevolution I; Barrett et al., 2008). For instance, the lack of genetic structure in host populations of cultivated plants favors the contagious spread of few (or a single) fungal pathogen genotypes and has been linked to devastating epidemics in agricultural systems (Stukenbrock and McDonald, 2008; Persoons et al., 2017). In contrast, persistent antagonistic coevolution of pathogens with their hosts as it is observed in natural systems requires generation and maintenance of genetic variation in both partners. For example the analysis of natural populations of the flax rust pathogen Melampsora lini in Australia showed extensive genetic variation and population differentiation at loci associated with pathogenicity, suggesting that local evolutionary processes such as selection and genetic drift maintain high diversity between fungal pathogen populations (Barrett et al., 2009). In another well studied model pathosystem, the anther-smut fungus Microbotryum lynchnidis-dioicae infecting Silene latifolia, patterns of genetic structure were consistent with recolonization from ancient glacial refugia (Vercken et al., 2010; Badouin et al., 2017), and the population structure of the fungal pathogen was strongly congruent with the population structure of its host plant across the distribution range, a pattern likely driven by co-evolutionary processes (Feurtey et al., 2016). It appears that genetic structure of both the pathogen and the host underlies dynamics of disease prevalence at temporal and spatial scales and, for example in the case of powdery mildew Podosphaera plantaginis infecting Plantago lanceolata, this genetic and environmental heterogeneity among populations may buffer large-scale disease outbreaks (Jousimo et al., 2014). In order to increase our understanding of the evolutionary forces governing plant-pathogen interactions, more empirical studies on natural populations of fungal pathogens are needed that consider populations across a broad geographic range and encompass multiple comparable species.
Members of the ascomycete genus Epichloë, notably the E. typhina species complex, are an intriguing system in which to investigate the diversity and population structure of fungal pathogens in natural environments (Bultman et al., 2011). Fungi of the E. typhina complex reproduce sexually and sterilize their host plant while doing so. Since infections are systemic and long-lasting, the effect on host plant fitness is detrimental and infected plants may have no more reproductive output for the rest of their lifetime. In sterilizing systems such as this, interaction partners are engaged in a tight arms-race with strong selection pressures acting on the host plant to develop resistance and, on the pathogen, to overcome this resistance (Ashby and Gupta, 2014; Tellier et al., 2014). While different Epichloë species are usually highly specialized on a single host grass species, these pathogens often occur in sympatric settings in natural grasslands hosting a variety of different grass species. This system thus provides an exceptional opportunity to sample sympatric populations and study ecologically similar pathogen species occupying the same geographic space.
In this study we investigated the population genetic structure of sympatric populations of two sibling species of the E. typhina complex occurring on distinct host grasses from natural grasslands across Europe. Using genome-wide SNPs we found differences in the amount of population genetic structure between the two species. To fully explore how these species differ and to provide insight into the causes and consequences of observed differences in population genetic structure, we addressed the following questions: (1) How does the population genetic structure differ between two species that have overlapping distributions? (2) Do patterns of gene flow, isolation by distance and genetic differentiation (FST) differ between the two species? (3) How do genetic diversity statistics (π, Tajima’s D) vary between these species? The parallel sampling of multiple populations from two species allows us to investigate population genetic structure within-species and compare between two species across the same geographic range. Our study provide insights into how two species with similar lifestyles can experience distinct evolutionary contexts, and increases our understanding of how population genetic processes can affect fungal pathogens in natural ecosystems.
2. Materials and methods
2.1. Study system
2.1.1. Fungal pathogens
The sexually reproducing members of the ascomycete genus Epichloë are highly specialized biotrophic endophytes and pathogens of many pooid grasses forming long-lasting systemic infections (Craven et al., 2001; Leuchtmann et al., 2014). Whole plants are usually infected by a single haploid genotype (Leuchtmann and Clay, 1997), and obligate outcrossing takes place between two genotypes of opposite mating types, each infecting a different host individual (bipolar heterothallic mating system) (White and Bultman, 1987; Schardl et al., 2014). As endophytes they form systemic and symptomless infections in vegetative tissues of the host grasses and then hijack grass flowering tillers to produce gametes and complete their own sexual cycle (Clay and Schardl, 2002). The formation of the fungal reproductive structure (stroma) around the grass inflorescence causes choke disease, usually affecting all host inflorescences and therefore sterilizing the entire plant by preventing production of pollen and seed (Chung and Schardl, 1997).
Here we focus on two closely related Epichloë species within the E. typhina species complex occurring on different Poaceae hosts: E. typhina infecting Dactylis glomerata and E. clarkii infecting Holcus lanatus. Hereafter we use the name E. typhina meaning solely the lineage specialized on D. glomerata. Note, however, that this name has also been used to refer to the aggregate of genetically distinct lineages from different hosts which are phylogenetically not clearly resolved (Treindl et al., 2021a). The two taxa are currently assigned the taxonomic rank of subspecies based on their sexual compatibility, i.e., their ability to hybridize in experimental crosses (Leuchtmann and Schardl, 1998; Leuchtmann et al., 2014). Indeed, hybrid ascospores between E. typhina and E. clarkii have been observed in natural sympatric populations (Bultman et al., 2011), indicating that at least the potential for gene-flow is retained. However, there is no evidence of host grasses infected by hybrid strains in natural populations suggesting the existence of post-zygotic barriers. In line with our previous work which provided evidence of reproductive isolation and genome-wide high levels of genetic differentiation (Schirrmann et al., 2015, 2018; Treindl and Leuchtmann, 2019), we consider E. typhina and E. clarkii as closely related yet distinct species at an advanced stage of divergence.
In a previous study, we generated high-quality genome assemblies of reference strains for both species which provide an essential genomic resource for the work conducted here (Treindl et al., 2021b). Analyses of the structural organization of Epichloë genomes revealed a clear pattern of genome compartmentalization into gene-rich and AT-rich compartments, consistent with the so called “two-speed” model of genome evolution (see also Winter et al., 2018). This particular genome organization shared by some but not all plant-pathogenic fungi is thought to play an important role in driving rapid adaptation in the co-evolutionary arms-race between host and pathogen (Raffaele and Kamoun, 2012; Möller and Stukenbrock, 2017; Torres et al., 2020). A comparison of the E. typhina and E. clarkii reference genomes showed a high degree of genomic synteny between the sibling species, however, also revealed striking differences in genome size and compartmentalization likely related to an underlying difference in effective population size (Treindl et al., 2021b). Besides the differences in genome structure and the obvious distinction based on host specificity, E. typhina and E. clarkii also differ in morphological characteristics including the size and disarticulation patterns of their ascospores (White, 1993; Leuchtmann and Clay, 1997).
2.1.2. Host grasses
The host species D. glomerata (orchard grass or cocksfoot), and H. lanatus (Yorkshire fog) are both long-lived perennial grasses native to Europe (Tutin et al., 1980). They are wind-pollinated outcrossers, flowering typically May to July and are common and widely distributed in nutrient rich grasslands, where they often co-occur. Cultivars of D. glomerata may also be sown as part of commercial forage grass mixtures (e.g., see UFA-Samen, Herzogenbuchsee, Switzerland, and BARENBRUG France, Montévrain), while H. lanatus is not commercially sown. Although choke disease caused by E. typhina infections has been shown to cause yield reductions in commercial seed production of D. glomerata (Large, 1954; Pfender and Alderman, 2006), to our knowledge there has been no attempt to control pathogen prevalence in natural, semi-natural or pasture grasslands in Europe besides measures of selective breeding in commercial fields of seed producers and recommendations concerning mowing practices (Raynal, 1991).
2.2. Sample collection and isolation of fungi
Sampling was performed at seven locations across Western Europe between May and July 2016–2018. Because sympatric populations are not common in Europe, selection of sites was governed by availability and chance while they covered a good portion of the hosts’ North–South distribution. At these locations large numbers (>20) of infected host grasses (D. glomerata and H. lanatus or, in one location H. mollis) occurred intermixed or in close proximity less than 50 meters apart as evidenced by the presence of fungal reproductive structure on flowering tillers (large circles in Figure 1 and Table 1). The majority of the sampled populations were located in permanent natural meadows with no apparent evidence of recent high-intensity agricultural use such as regular sowing, fertilizing or grazing by livestock. One population (So) was located in a permanent semi-natural meadow which may be under low-intensity agricultural use. It is noteworthy that the transition between completely natural (no management) and semi-natural (extensive management) grasslands is fluid and even natural meadows often experience anthropogenic influences such as occasional mowing (e.g., in the Aub and Kew populations). However, stroma forming grasses were not observed in intensively managed meadows such as highly fertilized meadows or grass sown as an annual crop under crop rotation for high-intensity silage or hay production although single infected plants were observed around the rims of such fields (personal observation). It appears that agricultural practices that involve regular mowing (i.e., usually before host grasses flower) negatively affect the pathogen prevalence. We consider our populations to be «natural populations» in the sense that they are part of permanent grasslands not under strong human disturbance. From each host species 21–33 infected plants per location were sampled by picking one choked flowering tiller per plant individual. Each sample represents a different haploid genotype, since an individual plant is assumed to be infected by a single fungal strain resulting from horizontal transmission of meiotic ascospores (Leuchtmann and Clay, 1997). In Kew Gardens (London, UK) E. clarkii was sampled from a previously unknown host species, Holcus mollis, occurring in sympatry with E. typhina on D. glomerata. Holcus mollis, unlike H. lanatus, can reproduce clonally through the formation of rhizomes in addition to normal sexual reproduction and prefers less nutrient rich sites in natural meadows or light woodland (Ovington and Scurfield, 1956). Therefore, we cannot exclude the possibility that some isolates from this population originate from a single fungal genotype systemically propagated via rhizomes within the population of H. mollis, although tillers were collected from plants at a distance of at least five meters. The sympatric population in Western Switzerland (Aub) had been sampled previously 13 years prior to this study in 2005 (Steinebrunner and Leuchtmann, unpubl. data). We included these for sequencing and hereafter designate the isolates as Aub (sampled in 2018) and AubX (sampled in 2005). At locations where only one infected host species was found (small circles in Figure 1 and Table 1) we collected infected flowering tillers from 1 to 4 individuals per population (Bret, Other 1–4) and refer to these as “additional” samples.
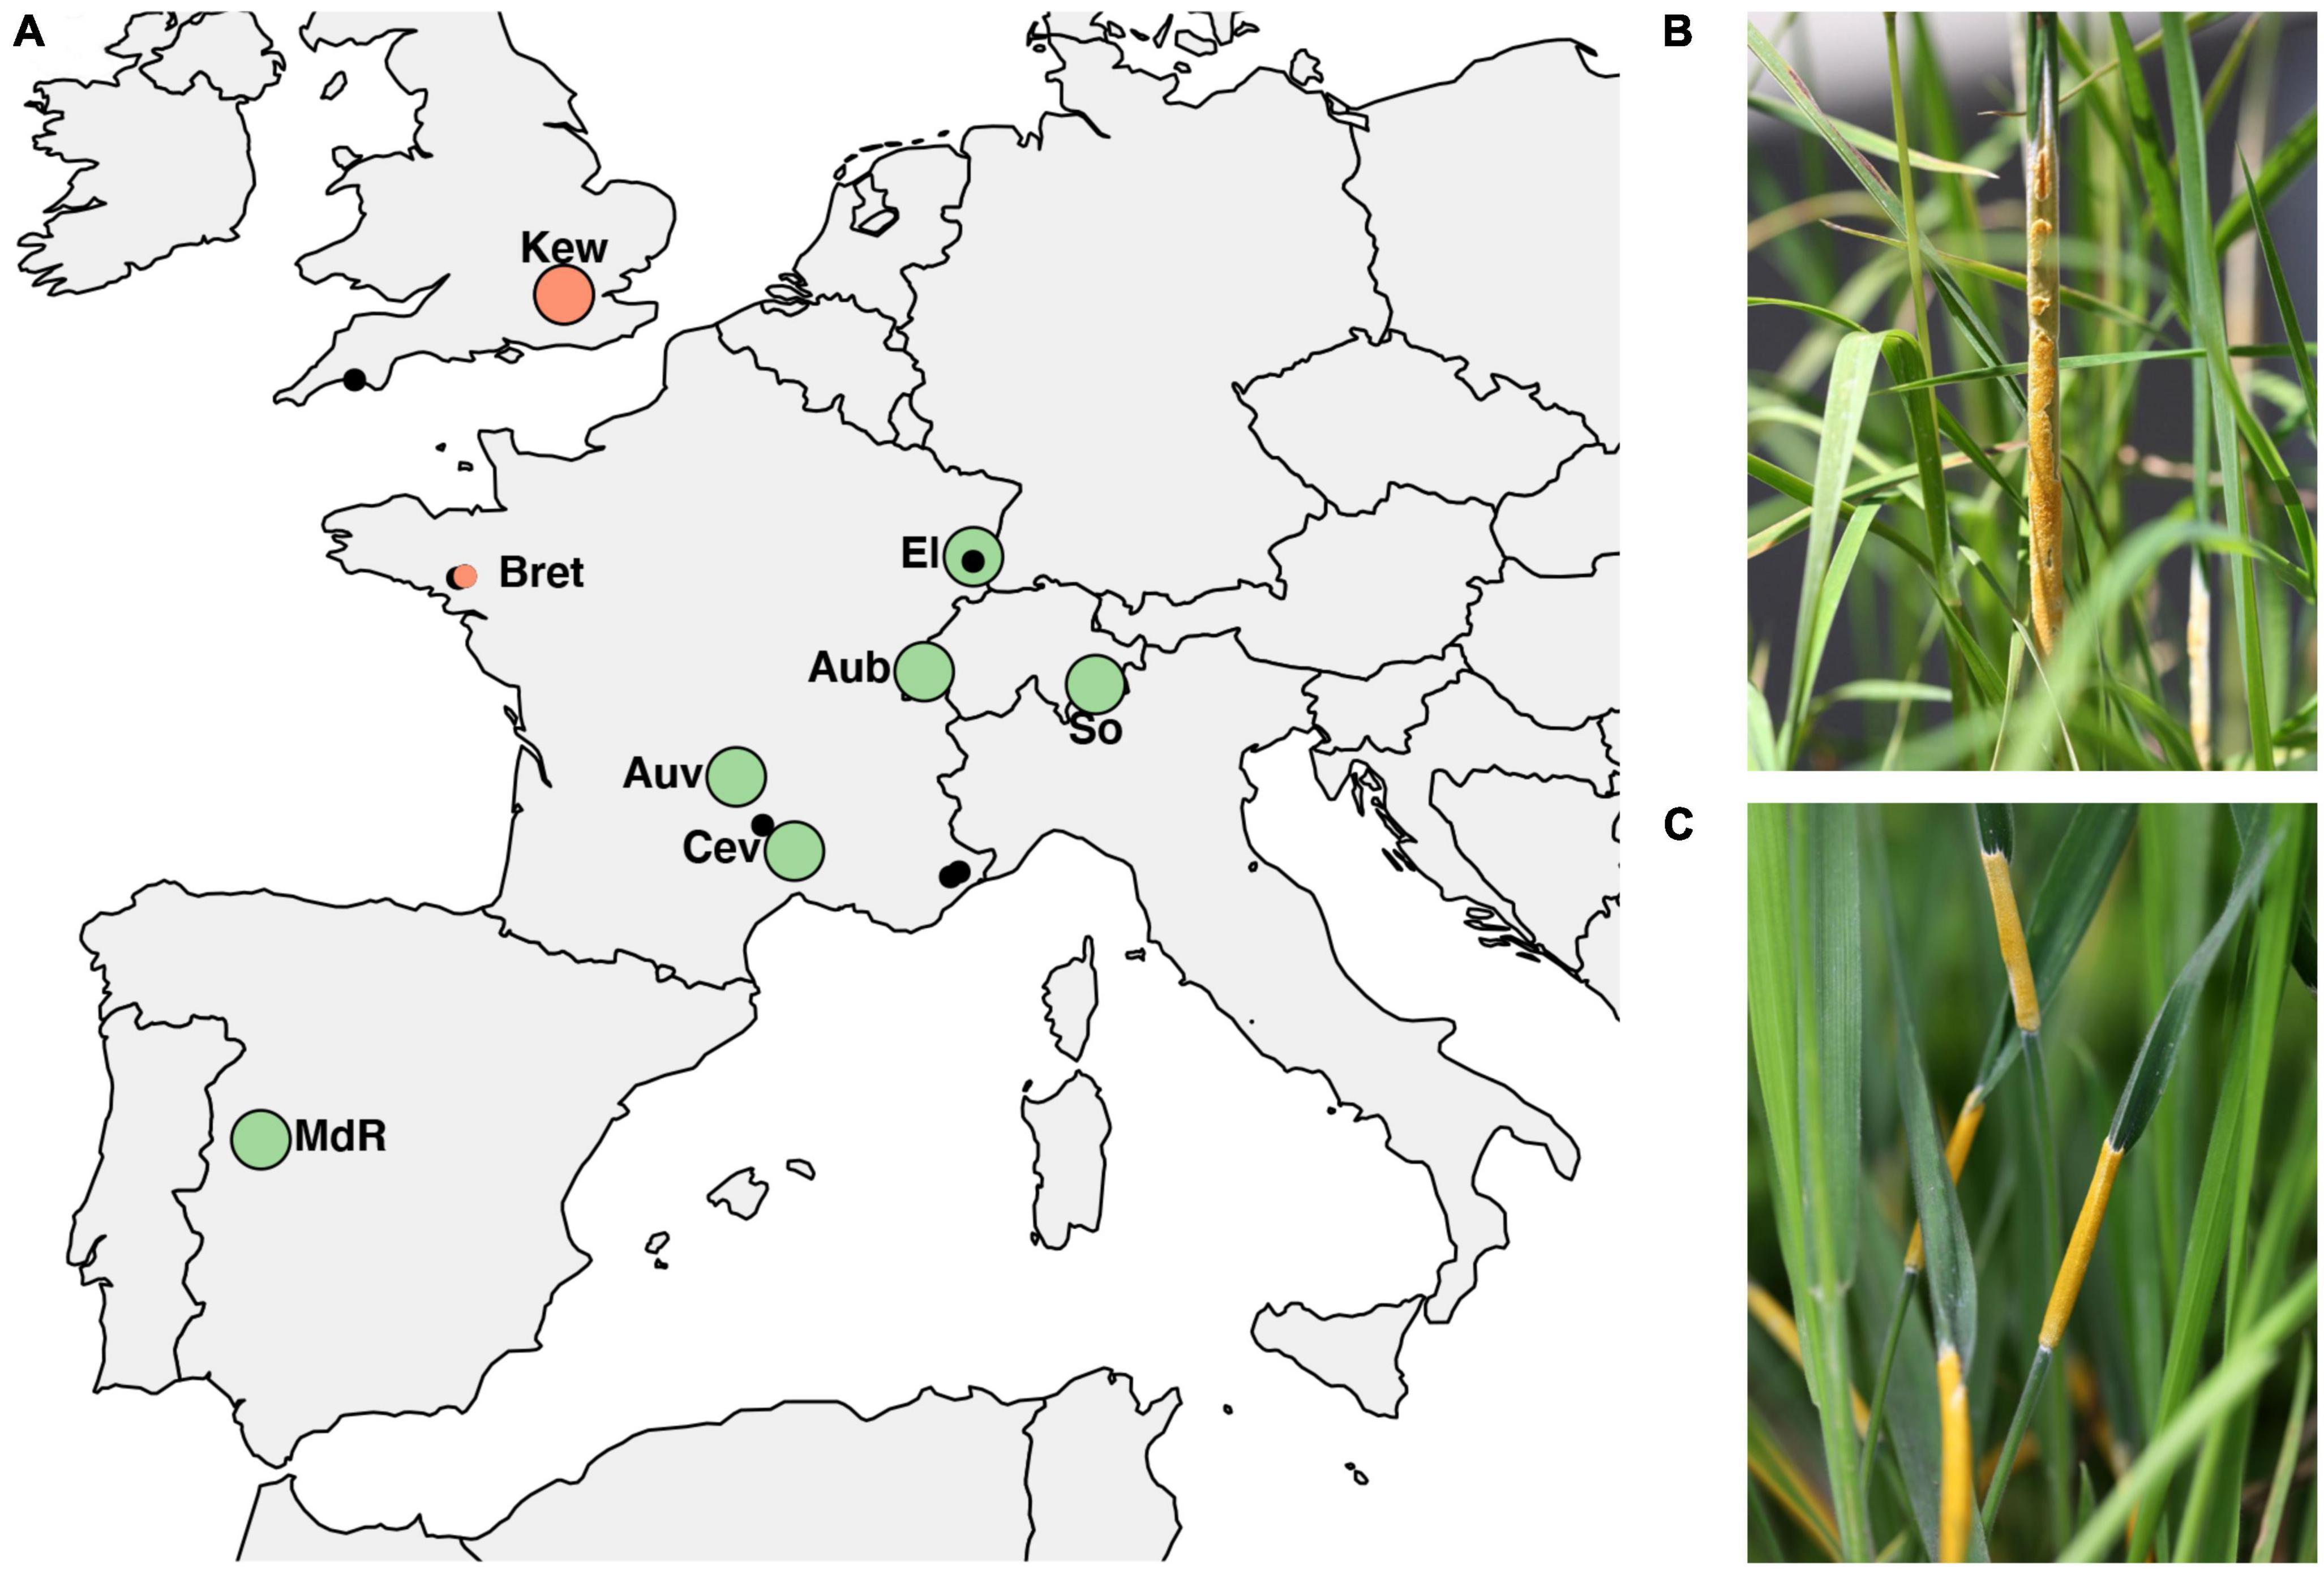
Figure 1. (A) Populations of Epichloë isolates across Europe used in the study. Large circles indicate sampling locations of sympatric populations where E. typhina is infecting D. glomerata and E. clarkii is infecting H. lanatus (green) or H. mollis (red), respectively. Smaller circles indicate additional samples collected from allopatric populations where only one of the two host species was found to be infected, either H. mollis (red) or D. glomerata (black). Among these are five locations (small black circles) where E. typhina occurred alone (n = 2–4), collectively designated as “Other”. The population in Western Switzerland (Aub) was sampled twice thirteen years apart, in 2005 and 2018. (B) Ripe fungal fruiting body (stroma) of E. typhina infecting D. glomerata. (C) Stromata of E. clarkii infecting H. lanatus. For code and origin of populations see Table 1.
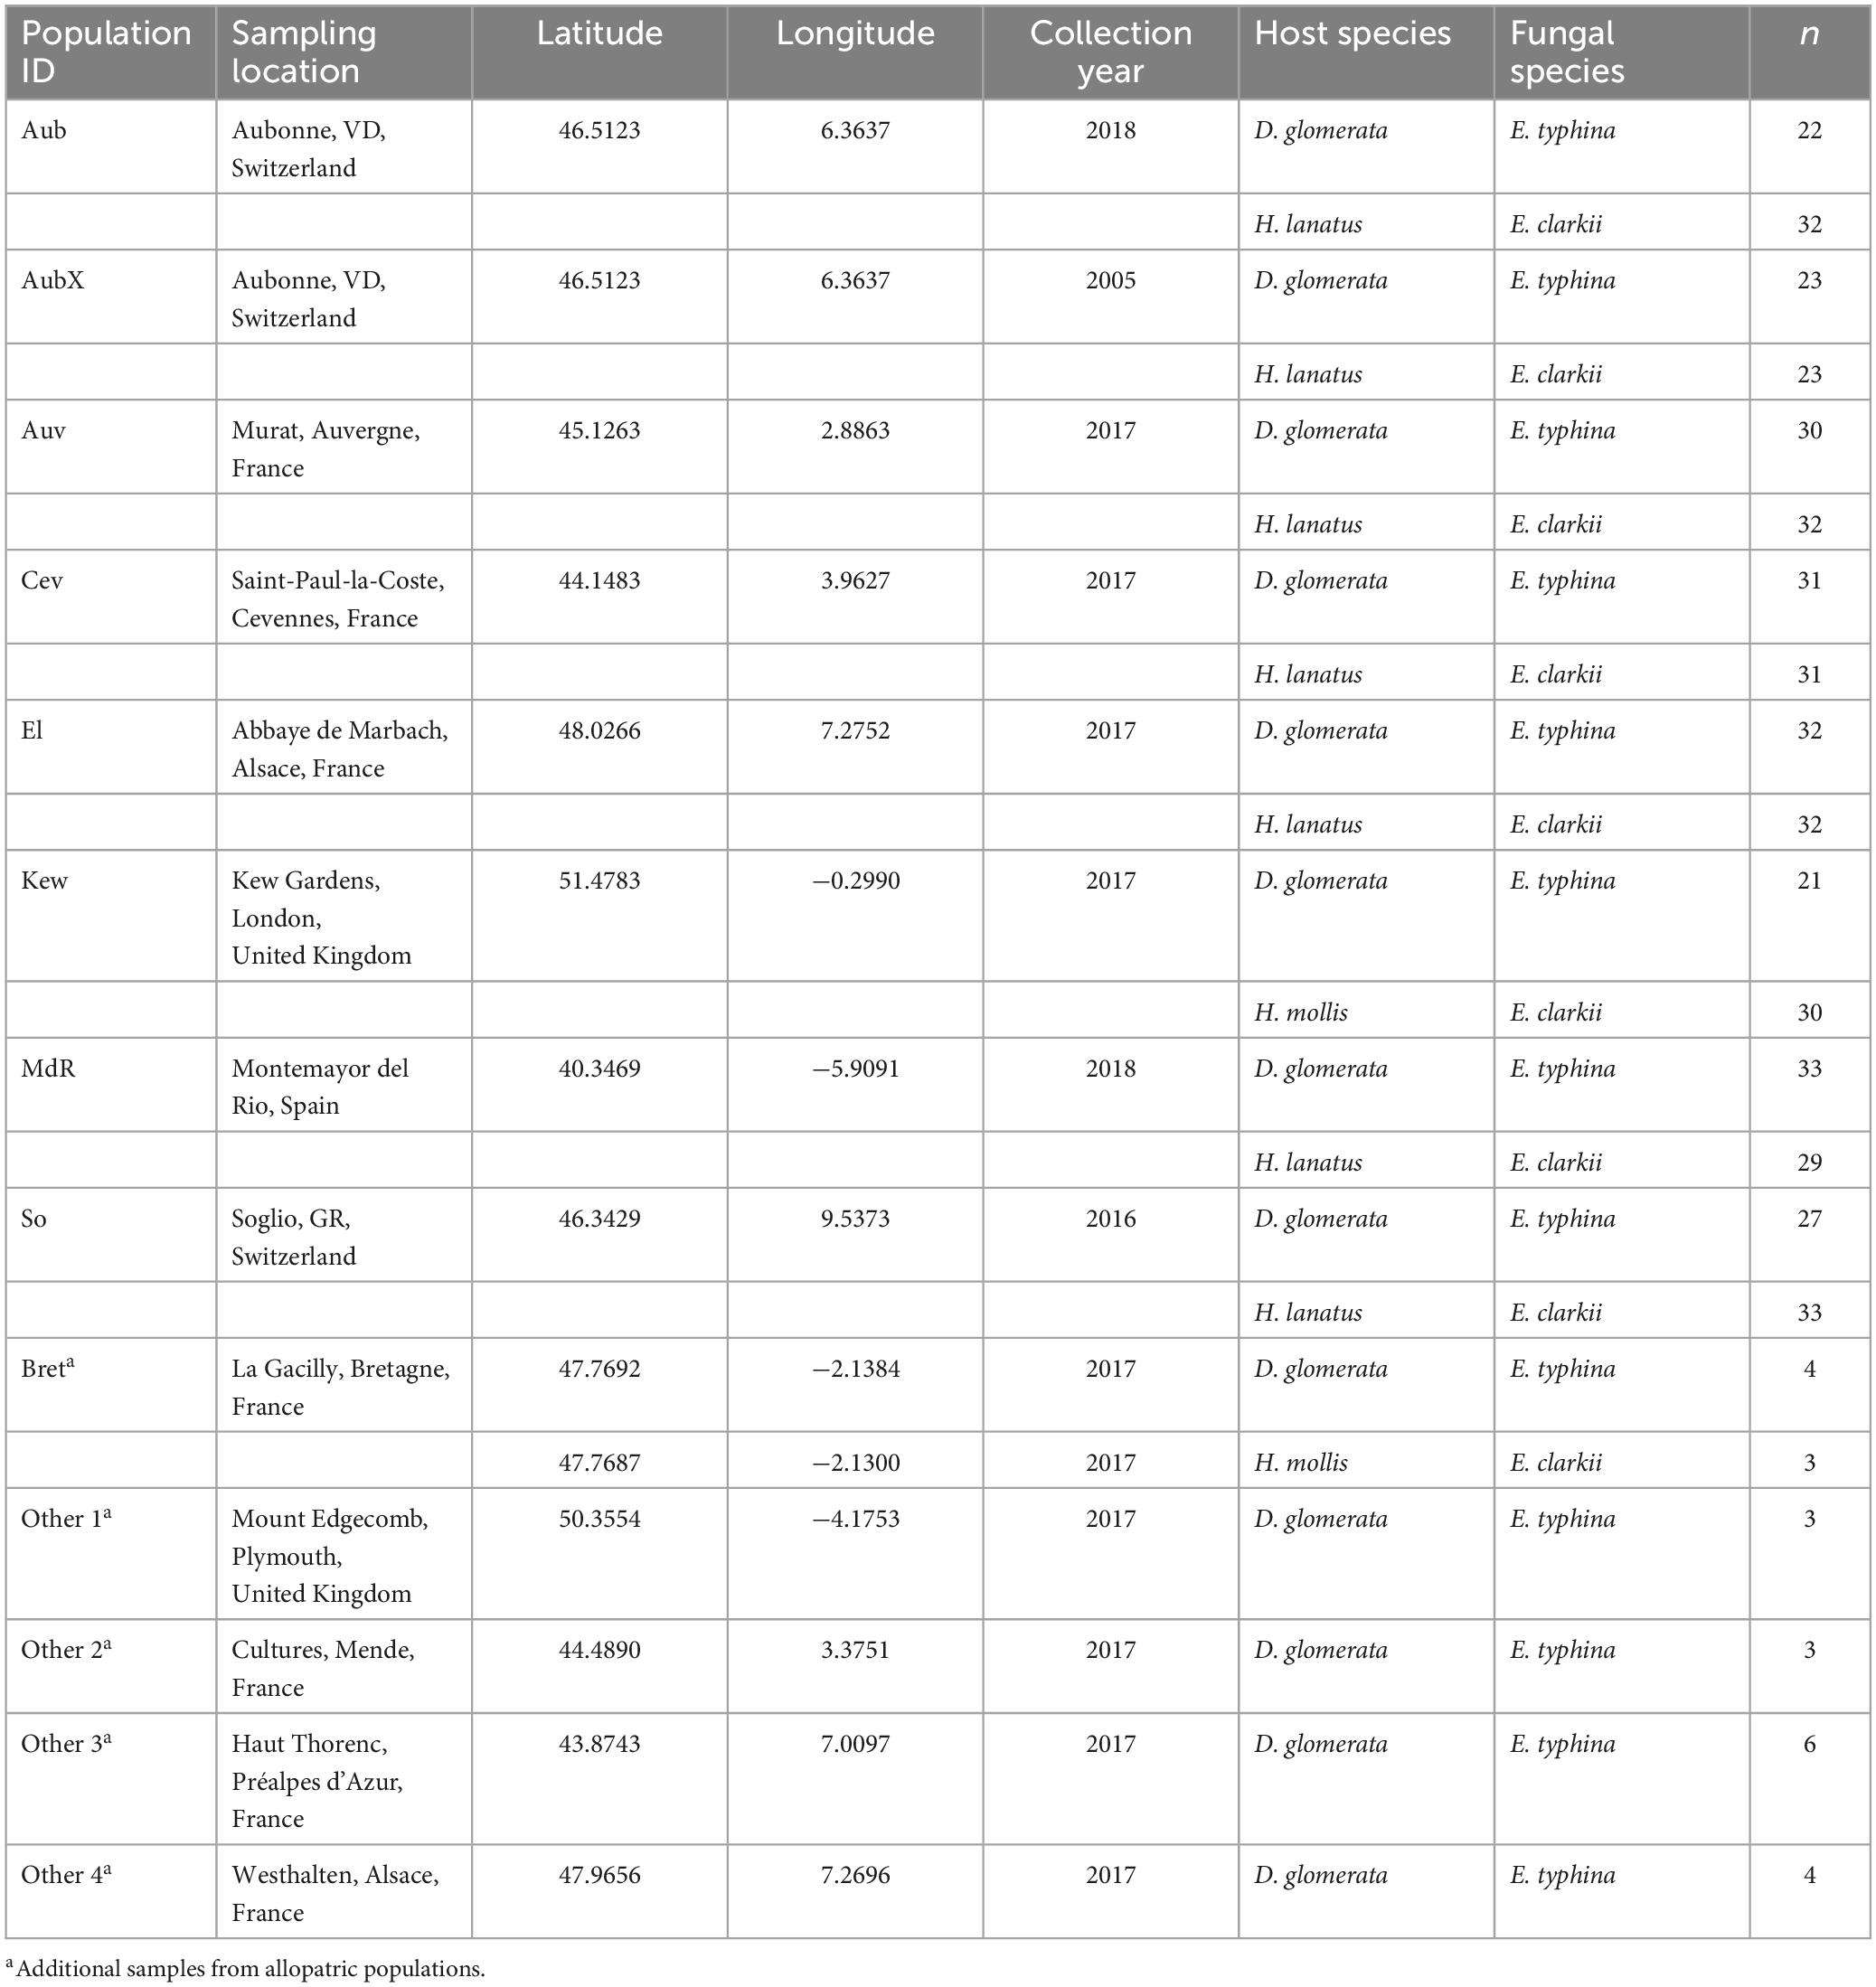
Table 1. Populations of Epichloë infecting Dactylis and Holcus host species with sampling location, year of collection, host and fungal species, and number of isolates (n) analyzed in this study.
Fungal strains were isolated from freshly collected tillers by splitting open the stromata with a sterile blade to expose the interstitial fungal mycelium between undeveloped inflorescence and leaf blades. Pieces of mycelium were then transferred with sterile tweezers and subsequently grown on supplemented malt extract-agar (SMA) plates containing 1% malt extract, 1% glucose, 0.25% bacto peptone, 0.25% yeast extract, 1.5% bacto agar and 0.005% oxytetracycline (Pfizer, New York, NY, USA). Isolates were carefully checked under the dissecting scope for purity and Epichloë identity as described previously (Christensen et al., 1993). Pure cultures were grown in V8 liquid media on a rotary shaker at 120 rpm for 10–14 days at room temperature. Mycelium was vacuum filtered, freeze dried for 24 h and then ground using liquid nitrogen. All live axenic cultures were also stored on SMA in tubes covered with mineral oil at 4°C at ETH Zürich.
2.3. DNA preparation and sequencing
Genomic DNA was extracted from 10 mg freeze dried material using the sbeadex mini plant kit (LGC Genomics, Berlin, Germany), but replacing the lysis buffer with PVP (sbeadex livestock kit) as this buffer had previously shown improved DNA yields. Extraction was automated on a KingFisher system following the manufacturers protocol (Thermo Fisher Scientific, Waltham, MA, USA). The DNA concentration of extracted samples was quantified using a Spark® Multimode Microplate Reader (Tecan Trading AG, Switzerland). Paired-end libraries of 2 × 150 bp fragments with an insert size of 330 bp were prepared with NEBNext® Ultra II DNA Library Prep Kits (New England Biolabs, Ipswich, MA, USA), and sequencing was performed on a HiSeq4000 Illumina sequencer (Illumina, San Diego, CA, USA), at 16× coverage on average. We sequenced whole genomes of 240 individuals of E. typhina and 240 individuals of E. clarkii of which 211 each yielded sufficient data for the analyses. All Illumina sequence data have been uploaded to ENA (see data availability statement).
2.4. Mapping and variant calling
Reads were mapped against the high-quality reference genomes of E. typhina (Ety_1756, BioProject ID PRJNA533210) and E. clarkii (Ecl_1605_22, BioProject ID PRJNA533212) (Treindl et al., 2021b). Mapping was performed with BWA (Li and Durbin, 2009) and variant calling was done with the Genome Analysis Toolkit (McKenna et al., 2010), using the GATK Short Variant Discovery best practice workflow.1 Details and examples of how each command was run are provided on github.2 In brief, the raw reads were trimmed and adaptors removed using trimmomatic v0.35 (Bolger et al., 2014). The trimmed reads were mapped to the respective reference genomes using bwa mem v0.7.17 (Li and Durbin, 2009). Low quality alignments (qual >10) were removed and duplicates were marked. Mapping statistics were obtained using sambaba v0.6.6 (Tarasov et al., 2015). After mapping, variants were identified using HaplotypeCaller, GatherVCFs and JointGenotyper.
2.5. Filtering
Variants were filtered with custom scripts using vcftools (Danecek et al., 2011), bcftools (Li et al., 2009), and R (R Core Team, 2013), [for example scripts see github repository (see text footnote 2)]. We removed mitochondrial sequences and indels, thus only SNPs in nuclear DNA (Chr1-7) were used in all subsequent analysis. The following hard-filters were applied using vcftools v1.2.8 minor allele count (–mac 3) and maximum mean depth values (–max-meanDP 100). The latter filter removed variants with excessive coverage (mean depth > mean read depth) across all samples as these are indicative of either repetitive regions or paralogs. We filtered out SNPs that were not well sampled across populations by removing SNPs with >30% missing within a single population and removed isolates that had >80% missing data. We then filtered by read quality and read depth following GATK best practice recommendations (Van der Auwera et al., 2013), and based on our evaluation of the data. We removed sites with low mapping quality (MQ value <40, the Root Mean Square of the mapping quality of the reads across all samples) and with a high relative variance in read depth [variance in read depth divided by mean read depth >80 for E. typhina and >30 in E. clarkii (Supplementary Figure 1)]. We visually inspected regions at different SNP densities using Integrative Genomics Viewer [IGV (Robinson et al., 2011)] to assess the variant calls and based on these observations chose to excluded sites where ≥3 SNPs had been called within 10 bp. Lastly, we removed sites that previous filtering steps had rendered monomorphic. Summary statistics including missingness and mean depth of this dataset are shown in Supplementary Figure 2. For some downstream analyses additional filters were applied and are described below and listed in Supplementary Table 1.
2.6. Analyses of genetic structure
We analyzed genetic structure of 211 E. typhina and 211 E. clarkii isolates using three approaches that provide insight into allele frequency variation (see McVean, 2009): Principal component analysis (PCA), Bayesian clustering analysis (STRUCTURE) and discriminant analyses of principal component (DAPC, for details see Supplementary Notes). PCA, was implemented in the R package SNPRelate (Zheng et al., 2012). PCAs were done for the complete SNP datasets, LD-pruned datasets (see below) and datasets with no missing data. We repeated analyses after removing the MdR population from the datasets, as these individuals are so genetically distinct in both species that they obscure the genetic structure of the other populations. We also visualized the amount of sub-structure within each population using PCA (see Supplementary Notes: Population sub-structure). For the STRUCTURE analysis, we applied a minor allele frequency filter of 0.05 using vcftools (–maf 0.05) to exclude rare alleles and singletons, because they can strongly impact clustering by STRUCTURE (Linck and Battey, 2019). Bayesian assignment assumes that loci are independent, so we further removed SNPs that are in linkage disequilibrium (LD), pruning variants with a pairwise r2 greater than 0.3 in 10 kb windows using bcftools v1.9. The LD-pruned datasets included 152,883 biallelic SNPs in E. typhina and 79,352 SNPs in E. clarkii. STRUCTURE v2.3.4 (Pritchard et al., 2000), was run for K = 1–12 with 20,000 Monte Carlo Markov Chain (MCMC) iterations following a 10,000 iteration burn-in for each of twelve replicate runs per K. We used an admixture ancestry model with correlated allele frequencies and no prior information about the demography. The output of the STRUCTURE analysis was processed using STRUCTURE HARVESTER (Earl and vonHoldt, 2012). The model with the maximized rate of change in log likelihood values (ΔK) was considered the optimal number of clusters based on methods described by Evanno et al. (2005). We assessed probability of assignment and genetic admixture among populations by plotting the proportion of membership to each of the inferred ancestry clusters for every individual, using the optimal model parameters (the best run) for each K.
2.7. Summary statistics of genetic variation
Population genetic summary statistics were calculated with vcftools v1.16, using a patch that allows computation with haploid datasets.3 Calculations were performed for the seven sympatric populations only (additional samples from allopatric locations were removed), leaving 191 individuals in E. typhina and 208 individuals in E. clarkii. After removing “additional” isolates we again removed any monomorphic variants. Populations sampled in different years from the Aubonne location (Aub and AubX) were analyzed as separate populations. Step-by-step details and example code is available at: https://github.com/adtreindl/Epichloe_genomics/blob/master/summary_stats.md.
2.7.1. Nucleotide diversity π, Tajimas D
We quantified within-population genetic diversity by calculating nucleotide diversity in 10 kb non-overlapping windows [π, the average number of differences between individuals (Takahata and Nei, 1985)], and Tajima’s D in 10 and 40 kb non-overlapping windows (Tajima, 1989). We calculated the average nucleotide diversity and Tajima’s D per population as the mean across all windows. Within each species we tested if population means were significantly different from each other by performing an ANOVA and least significant difference (LSD) test.
2.7.2. FST
To assess relative genetic differentiation between populations we calculated pairwise fixation indexes FST (Weir and Cockerham, 1984), per site between all populations using vcftools (haploid switch, see above). We then calculated mean FST in non-overlapping windows of 5 kb (10 kb) along each chromosome using R version 4.0.2 (R Core Team, 2013), and genome-wide weighted mean FST between population pairs across all SNPs. To investigate patterns of isolation-by-distance (IBD) in E. typhina and E. clarkii we tested for a positive correlation between genetic distance (the mean weighted FST) and geographic distance. We used the R package lme4 (Bates et al., 2015), to fit a linear mixed-effects model to the data with populations as random effects and distance as a fixed effect. We also calculated divergence as the number of fixed differences between population pairs (SNPs with an FST of 1).
2.7.3. Analysis of linkage disequilibrium
We removed loci with a minor allele frequency below 0.05 (within a population) because differences in allele frequencies can (upwardly) bias estimation of LD. We calculated the coefficient of correlation (r2) between pairs of SNPs that were up to 20 kb apart using plink (v. 1.90) and calculated mean LD within 100 bp windows. We visualized the decay of r2 over physical distance using a locally weighed polynomial regression (LOESS) model using the function geom_smooth in the R package ggplot2 (Wickham, 2016).
2.7.4. Effective population size Ne
To compare effective population sizes within and between species we estimated effective population sizes (Ne) from polymorphism data with the parameter θ = 2Neμ (for more details see Supplementary Notes: Calculation of effective population size). Estimates were based on Watterson’s estimators of θ (Watterson, 1975), which is based on the number of segregating sites in a population relative to the sequence length, and an assumed mutation rate (μ) of 3.3 × 10⁻⁸ per site. This mutation rate is based on estimates in yeast (Lynch et al., 2008), and has been used in other studies (Stukenbrock et al., 2011). The number of segregating sites per populations can be found in Supplementary Table 2. From this we calculated the proportion of segregating sites within each population relative to the total variation among all populations, as a measure of genetic diversity comparable between species (Supplementary Table 3).
We also analyzed the distribution of genetic variation separately for distinct genomic compartments in the Epichloë genomes. Methods and results are presented in (Supplementary Notes: PCA analysis and calculation of summary statistics by compartments). Additionally, we assessed population sex-ratios (Supplementary Notes: Mating types) and interspecific hybridization in two populations (Supplementary Notes: Assessment of hybridization in sympatric populations).
3. Results
3.1. Genetic structure of populations of two Epichloë species
After removal of isolates with low coverage and replicates we retained genome-wide polymorphic sites for 211 isolates in each of the species. We obtained 658,021 biallelic SNPs in the E. typhina dataset and 400,033 SNPs in the E. clarkii dataset after initial filtering (complete dataset, Supplementary Table 1).
We found that population structure of the two species reflected the geographic origin of sampled populations. Looking at the PCA first, the most obvious result was that in both species the Spanish population was highly differentiated (Supplementary Figures 3A, D). In order to better visualize the genetic structure in the PCA plots we removed the Spanish population (Figures 2, 3). In E. typhina, the first PCA axis represents the West-to-East distribution (explaining 3.93% of the variation), and the second axis represents the South-to-North distribution (2.58% variation explained, Figure 2B). Spatially intermediate “additional” samples (Bret and Other 1–4) were also genetically intermediate. In E. clarkii the clustering was more distinct, there were seven clusters each corresponding to a single geographic population, with the exception of the Kew population, which consisted of two genetically distinct groups (Figure 3B). In both species, isolates sampled 13 years apart from the same Western Switzerland location did not form genetically distinct groups (AubX and Aub sampled 2005 and 2018), suggesting little genetic differentiation has occurred during this time. These patterns were robust to different filtering approaches as outlined in the methods section (complete, LD pruned, no missing data) (Supplementary Figures 3, 4). We also visualized the genetic structure using PCA of each population separately and the two populations that were the most spread out in principal component space (E. typhina Cev and E. clarkii Kew) also showed evidence of sub-structure (see Supplementary Notes and Supplementary Figures 5, 6).
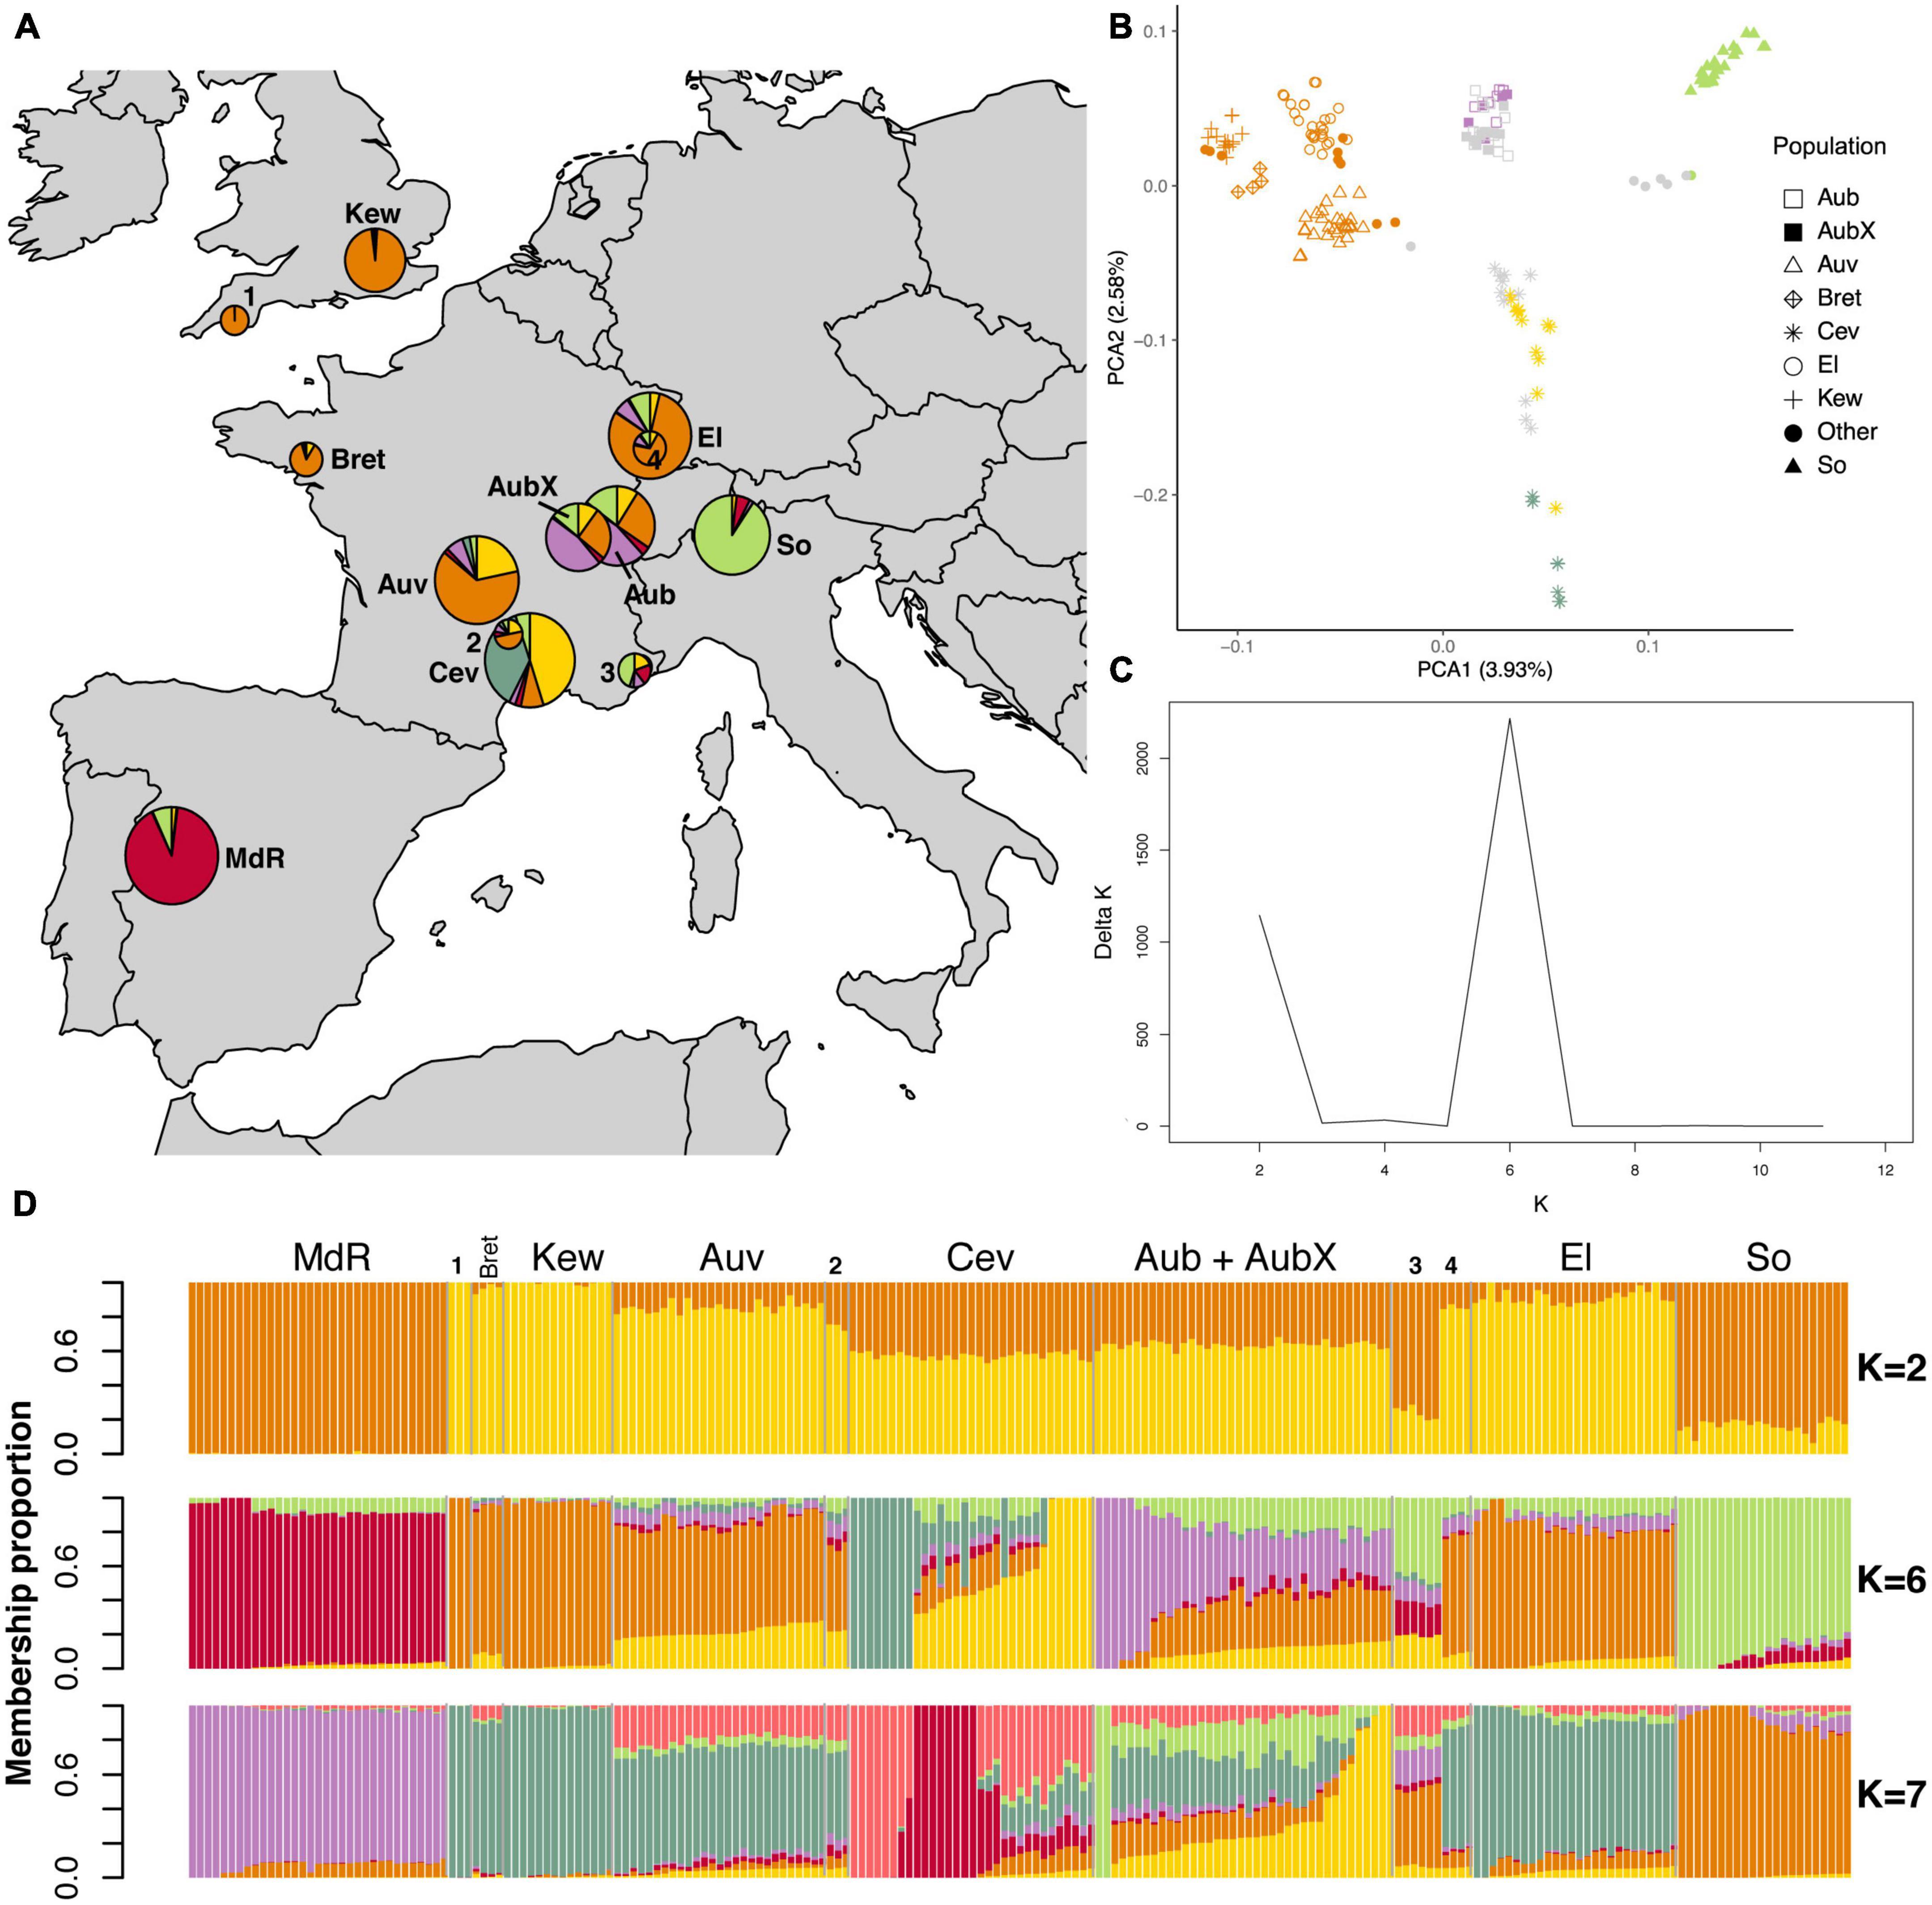
Figure 2. Population structure analyses of 211 E. typhina isolates based on genome-wide SNPs. The LD pruned dataset including 152,883 SNPs was used in the STRUCTURE analyses whereas the complete dataset of 658,021 SNPs was used for the PCA. (A) Sampling locations of E. typhina isolates infecting D. glomerata; pie charts represent Bayesian cluster membership proportion for K = 6, diameters reflect sample size (range n = 3–33). (B) Principal component analysis of genetic differentiation among isolates excluding the population from Spain (MdR); the percentage of variance explained by the first two principal components is shown in parentheses; symbols indicate sampling locations of populations and colors correspond to the genetic clusters at K = 6 assigned to each individual by Bayesian clustering for isolates with ≥0.5 membership to a single cluster; gray symbols are isolates not assigned to any cluster when using the threshold of 0.5. (C) Delta K plot of the STRUCTURE Bayesian clustering analyses for Ks of 2–12. (D) Bar plots of ancestry membership proportions (y-axis) as inferred by STRUCTURE for K = 2, K = 6, and K = 7; each isolate displayed as a vertical bar and populations are indicated on the x-axis; each color represents a cluster and isolates are ordered according to longitude (West to East); sample sizes are: MdR = 33, Bret = 4, Kew = 14, Auv = 27, Cev = 31, Aub = 22, AubX = 16, El = 26, So = 22, Other 1–4 = 3 + 3 + 6 + 4. For code and origin of populations see Table 1.
Figure 3. Population structure analyses of 211 E. clarkii isolates based on genome-wide SNPs. The LD pruned dataset including 79,352 SNPs was used in the STRUCTURE analyses whereas the complete dataset of 400,033 SNPs was used for the PCA. (A) Sampling locations of E. clarkii individuals infecting H. lanatus and H. mollis (Kew and Bret); pie charts represent Bayesian cluster membership proportion for K = 7, diameters reflect sample size (range n = 3–30). (B) Principal component analysis of genetic differentiation among isolates excluding the population from Spain (MdR); The percentage of variance explained by the first two principal components is shown in parentheses; symbols indicate sampling locations of populations and colors correspond to the genetic clusters at K = 7 assigned to each isolate by Bayesian clustering for isolates with ≥ 0.5 membership to a single cluster; gray symbols are isolates not assigned to any cluster when using the threshold of 0.5. (C) Delta K plot of the STRUCTURE Bayesian clustering analyses for Ks of 2–12. (D) Bar plots of ancestry membership proportions (y-axis) as inferred by STRUCTURE for K = 3, K = 7, and K = 8; each isolate displayed as a vertical bar and populations are indicated on the x-axis; each color represents a cluster and isolates are ordered according to longitude (West to East); sample sizes are: MdR = 29, Bret = 3, Kew = 19, Auv = 30, Cev = 28, Aub = 27, AubX = 18, El = 27, So = 30. For code and origin of populations see Table 1.
The STRUCTURE results were largely consistent with the PCA as expected. In both species the Spanish population was assigned to a distinct cluster (K) irrespective of the inferred number of clusters (K = 2 to K = 12), and there was no genetic differentiation between isolates sampled at different time points in the population from Aubonne (AubX and Aub sampled 2005 and 2018). Similar to the PCA results, genetic differentiation was more pronounced in E. clarkii than E. typhina. In E. typhina not all populations formed distinct genetic clusters. The most likely number of clusters was K = 6 as inferred by the maximized likelihood and ΔK values across twelve replicate runs (Figures 2A, C, D). At K = 6, only two of the six clusters contained all isolates from a single location (red: MdR, green: So), whereas three populations were predominantly assigned to the same cluster. Isolates from most locations appeared to have ancestry from the same orange cluster, to varying degrees. Isolates from more Northern locations (El, Kew, Bret) and three isolates from Plymouth showed the highest ancestry proportion to this cluster. The exception was isolates from Cev, the majority of which had genotypes assigned to two distinct clusters (yellow and dark green) but also contained admixed isolates. Additionally, the population from Western Switzerland contained seven isolates assigned to a sixth cluster (purple), three of which were sampled in 2005 (AubX) and four in 2018 (Aub) (see Supplementary Figure 7), but the majority of isolates had mixed ancestry. A number of isolates from Aub and Cev as well as six additional isolates collected in the Southeastern tip of France showed a higher proportion of mixed ancestry with membership proportion <0.5 for any of the inferred clusters (gray symbols in PCA). The relationship among genetic clusters and location did not get much clearer at K = 7.
In E. clarkii the clustering was more distinct and the number of genetic clusters matched the number of sampling locations and nearly all clusters consisted of isolates from a single sampling location. The exceptions were populations from Southern France (Cev) and Southern Switzerland (So), which were assigned to the same cluster (Figures 3A, C, D). At lower and higher Ks (K = 5, K = 6, K = 8, Supplementary Figure 8), however, these two populations were assigned to distinct clusters. The population collected at Kew Gardens (Kew) consisted of genotypes from two distinct clusters as well as a single admixed isolate. Although Central European populations contained a higher number of individuals with mixed ancestry, admixture proportions were lower than in E. typhina. Overall, ten isolates were not assigned to a cluster as they showed <0.5 membership proportion to any single cluster. Of these admixed isolates, all except for three genotypes collected in Western France (Bret) and the admixed isolate from Kew shared the majority of their ancestry with their population of origin.
3.2. Higher genetic differentiation between E. clarkii populations and stronger isolation by distance
Pairwise FST across all loci was lower between E. typhina populations (0.05–0.21, Table 2), indicating higher levels of gene flow, particularly among Central European populations, which is where the clustering analysis inferred mixed ancestry (Kew, Auv, Aub and El). E. clarkii populations had higher values of FST consistent with lower levels of gene flow (0.12–0.49, Table 2). Population pairs with the highest FST values also had the highest number of fixed differences between them, and overall, there were more fixed differences between E. clarkii populations than E. typhina (Supplementary Table 4). We found a positive correlation between genetic differentiation and geographic distance consistent with a pattern of isolation-by-distance (IBD) in both species (Figure 4). A comparison of the slopes of the two linear models showed that the effect of IBD was stronger in E. clarkii compared to E. typhina with higher genetic differentiation between population pairs [Z = 6.964, p = 3.314e-12, “lm_slopes_compare” from R package EMAtools (Kleiman, 2017)].
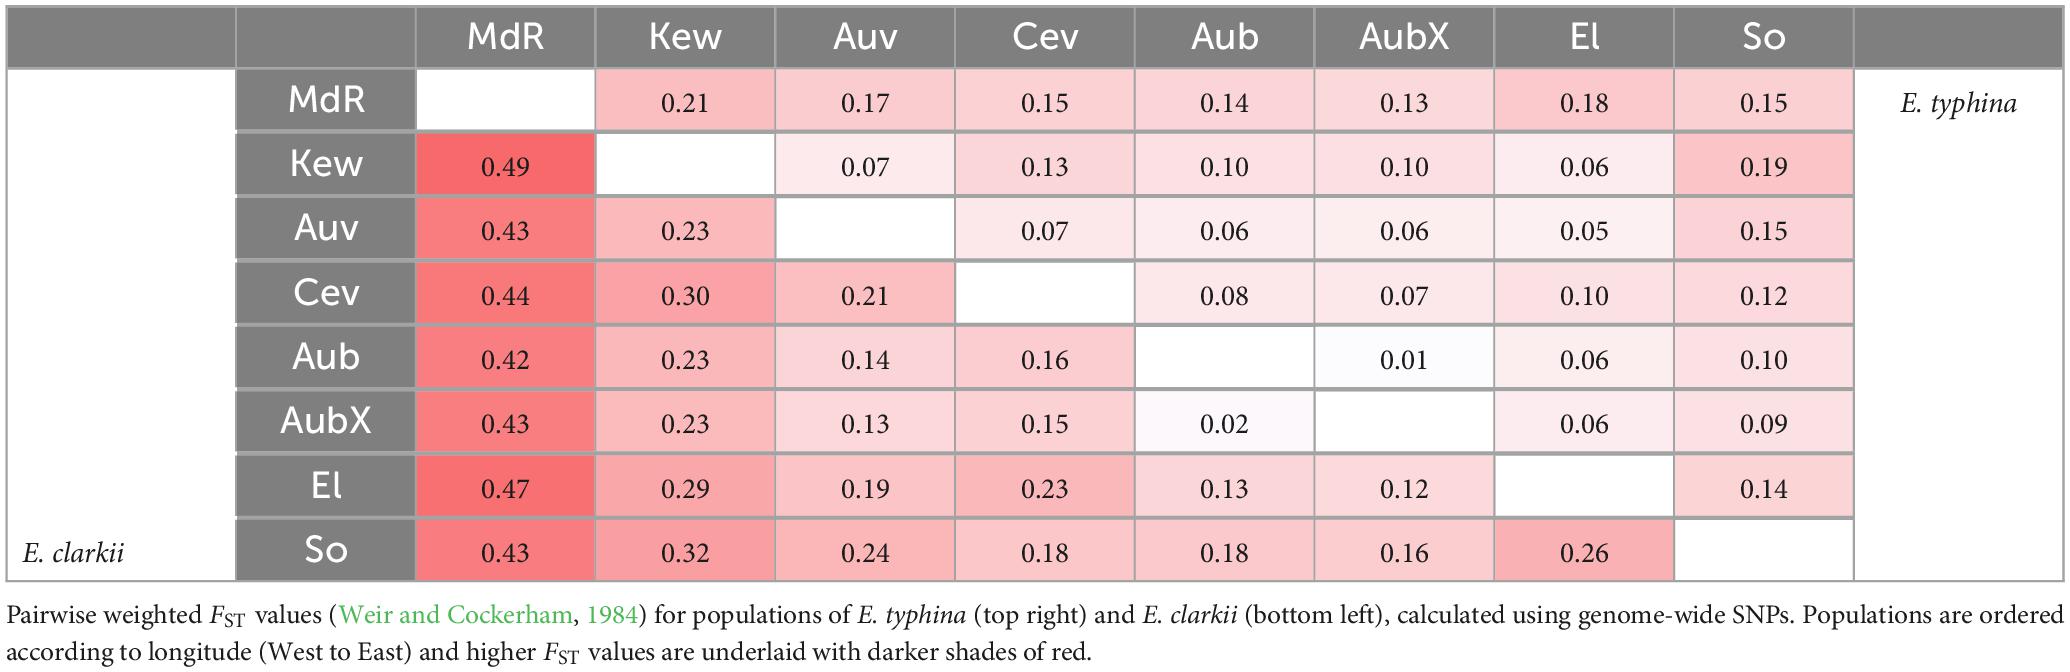
Table 2. Mean genome-wide FST.
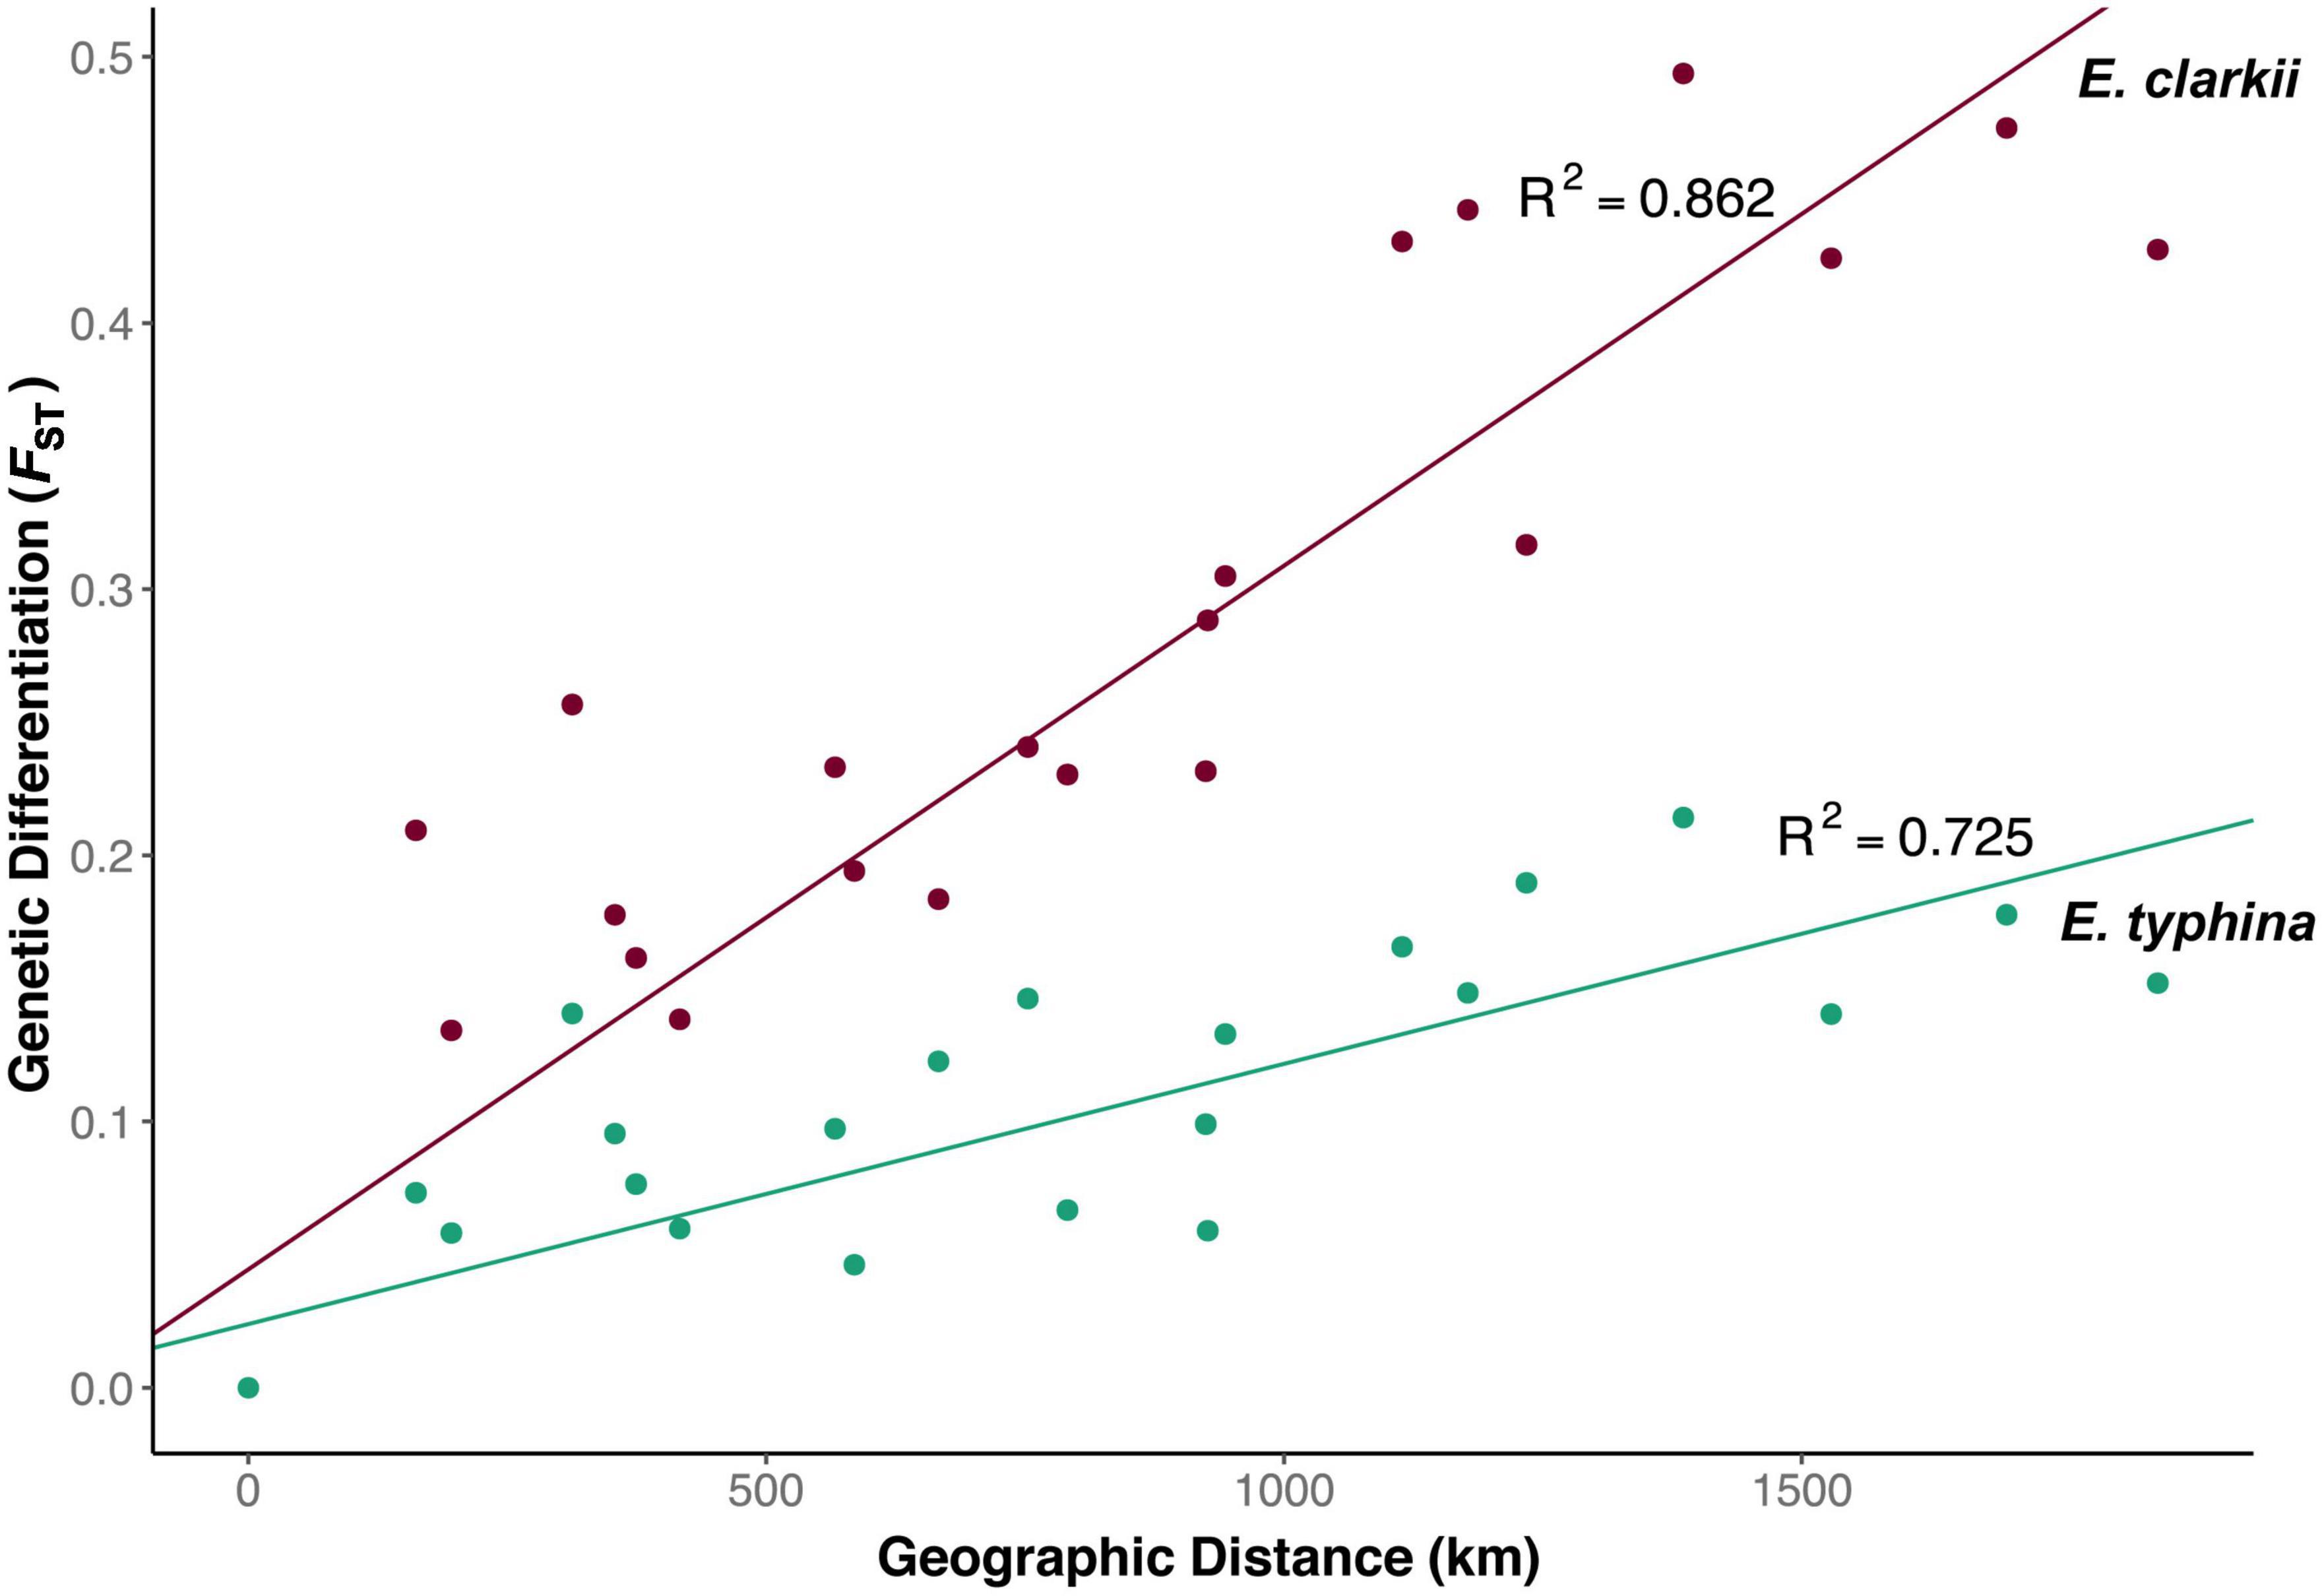
Figure 4. Isolation by distance among Epichloë populations. Relationship between pairwise FST and geographic distance (air distance between population pairs in km) for E. typhina (green) and E. clarkii (purple). Correlations for both species were significant (E. typhina: p > 0.001; E. clarkii: p > 0.001) with increasing geographic distance having a stronger effect in E. clarkii p > 0.001.
3.3. E. typhina has higher genetic diversity within populations
Mean genome wide nucleotide diversity (π) ranged from 0.0024 to 0.0027 in E. typhina populations and from 0.0008 to 0.0012 in E. clarkii populations (Supplementary Figure 9, Supplementary Table 5). This was consistent with a previous study which found higher diversity in E. typhina compared to E. clarkii in one sympatric population pair (Schirrmann et al., 2018).
Mean Tajima’s D was not significantly different from zero across populations of E. typhina, ranging from −0.369 to −0.061 (Supplementary Figure 10, Supplementary Table 6). In E. clarkii mean Tajima’s D was also not different from zero, but there was greater variation between populations ranging from −0.354 to 1.318. Kew and MdR had the highest values with 0.903 (± 0.05) and 1.318 (± 0.05), respectively, and these were significantly different from other population means (see Supplementary Table 6).
3.4. Analysis of linkage disequilibrium
Linkage Disequilibrium (LD) decayed quickly with distance, r2 < 0.2 in 1–2 kb in all E. typhina populations and most E. clarkii populations indicating ongoing recombination (Supplementary Figure 11). Two populations in E. clarkii were exceptions (Supplementary Figure 12): In Kew, LD decayed more slowly with distance, but followed the expected pattern, in contrast in the Spanish population MdR LD began to increase with distance from 200–7000 bp, before declining again.
3.5. Higher effective population size Ne in E. typhina
We used Watterson’s estimators of θ (Watterson, 1975) and an approximate mutation rate of 3.3 × 10⁻⁸ per site to estimate and compare effective population sizes within and between Epichloë species. Note that the estimates of Ne inferred here contain an uncertainty given that the mutation rate was not directly estimated in this system. Actual mutation rates may be lower which would lead to higher estimates of Ne. Effective population sizes in E. typhina were between twofold and fourfold larger than in E. clarkii populations, which also had more variance in Ne estimates among populations (Table 3: Estimates of effective population size Ne). In E. typhina the population from Western Switzerland (Aub) had the largest Ne (43,941) and the British population (Kew) had the smallest (37,034). In E. clarkii the population from Southern Switzerland (So) had the largest Ne (18,809) and the Spanish population (MdR) had the smallest (9,251).
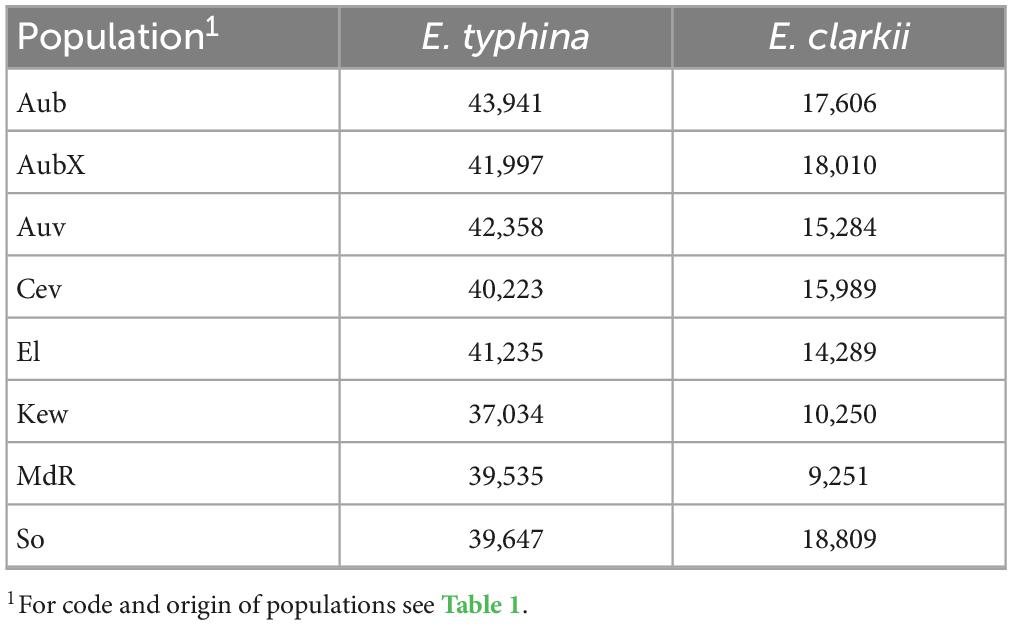
Table 3. Effective population size Ne of different populations of E. typhina and E. clarkii. Ne estimates are based on segregating sites and Watterson’s model of the scaled mutation rate under strict neutrality.
4. Discussion
Our parallel study of two closely related fungal pathogens revealed that even ecologically similar sympatric species can experience distinct evolutionary contexts. Despite the two species sharing a highly specialized host-sterilizing lifestyle, we identified striking differences in their genetic differentiation, genetic variation and effective population size. This has implications for adaptive evolution in these species. In the following we discuss the effects of gene flow on genetic structure and relate this to differences in the pathogen’s biology and phylogeographic history.
4.1. Different levels of gene flow among spatially structured populations
In our analysis of genome-wide variation we found a clear pattern of biogeographic structure in both E. typhina and E. clarkii. Spatially separated populations were genetically differentiated, and there was evidence of clinal variation across the distribution. In both species genetic distance increased with geographic distance and the most remote population in Spain was genetically very distinct. Despite the similarities in population structure at a broad scale, patterns of gene-flow among populations were different between the two species. E. typhina populations had higher genetic diversity and less differentiation between populations, indicating greater gene flow particularly among Central European and Northwestern populations. In contrast, we found lower diversity and higher levels of genetic differentiation among E. clarkii populations and a stronger effect of isolation by distance. Reduced gene flow and greater isolation between populations of E. clarkii could result in these populations experiencing greater effects of drift. The lower genetic diversity and lower effective population size within E. clarkii populations found here supports this hypothesis. In addition, comparison of genome organization and size between the reference genomes of the two species suggested that genome expansion in E. clarkii compared to E. typhina may be linked to a reduction in effective population size leading to stronger effects of drift compared to E. typhina (Treindl et al., 2021b).
Of the total variation assessed in each species, a similar proportion of sites were segregating within most populations indicating that the two species likely have similar mutation rates (Supplementary Table 3). In spite of a lower overall diversity, E. clarkii populations still harbor a considerable amount of standing genetic variation which is not surprising given the obligately outcrossing lifestyle of the pathogen. Indeed, most populations showed a rapid LD decay similar to E. typhina populations reflecting frequent sexual recombination. The exceptions were two populations, Kew and MdR, which were found to have significantly less genetic diversity and high levels of linkage disequilibrium. Variation in LD across all loci is driven by multiple processes, including population substructure, bottlenecks and admixture. However, if high LD is coupled with low genetic diversity, it is unlikely the result of admixture, as this would increase genetic diversity. In Kew, LD decayed more slowly with distance compared to central European populations, a slower decay and lower genetic diversity is most likely the result of a bottleneck and/or increased prevalence of asexual reproduction. In MdR LD decayed with distance until ∼200 bp, but then increased with distance until ∼7 kb. Long range LD (e.g., between loci on different chromosomes) could be the result of a recent strong bottleneck (founder effect), high prevalence of asexual production or admixture. As genetic diversity was also lower in the MdR population we think the observed pattern of LD is unlikely to be driven by admixture. Further genetic studies of these populations are needed to determine what is driving these patterns.
Although Tajima’s D values in these two populations were higher than in other populations, the genome-wide means were not significantly different from zero and so did not support evidence of past reductions in population size or a lack of low frequency of alleles. Nevertheless, such demographic processes affecting genome-wide variation will need to be taken into consideration in future studies when investigating the impact of selection in these populations.
4.2. Pathogen dispersal ability affects geographical and genetic structure
The distribution of Epichloë pathogens is determined by the range and availability of suitable host plants, and the ability of pathogens to reach hosts and establish an infection primarily by means of ascospore dispersal. While both host grass species are widespread across our study area and often co-occur, the abundance of their obligate pathogens differs and Epichloë infections are not everywhere: E. clarkii can be very common locally, such is the case of sympatric populations sampled in this study, but generally has a patchier distribution, whereas infections of E. typhina on D. glomerata are more widely distributed. The population genetic structure would suggest differences in the effective long-range dispersal of these species. We hypothesize that differences in dispersal are related to their spore sizes. E. typhina produces long, thread-like spores which may facilitate efficient long-distance dispersal by wind, whereas E. clarkii produces shorter and wider part-spores (White, 1993; Leuchtmann and Clay, 1997). Higher numbers of part-spores may be more dispersed over shorter distances and increase disease pressure locally. Different dispersal abilities could explain the differences in pathogen distribution and are consistent with our genetic data, suggesting larger population sizes and higher levels of gene flow in E. typhina compared to E. clarkii populations.
Another type of propagule produced by the fungus that could potentially mediate dispersal are spermatia (mitotic spores formed on reproductive tissue) or conidia (formed on vegetative tissue). Spermatia are carried by Botanophila flies among fungal reproductive structures (stromata) within populations but are unlikely to be wind-dispersed and cause new infections in distant host plants (Leuchtmann and Clay, 1997). Spermatia or conidia may also cause chance infections of neighboring plants within a population mediated by slugs or rain splashes (Tadych et al., 2007; Hoffman and Rao, 2013). Even if such local dispersal occurred, we would expect it to have similar effects on E. typhina and E. clarkii and it is unlikely to affect the geographical structuring of genetic variation at the scale observed in this study.
4.3. The impact of host distribution and joint phylogeographic history
Genetic variation in specialized obligate pathogens such as E. typhina infecting D. glomerata and E. clarkii infecting H. lanatus is expected to be strongly influenced by the distribution and genetic structure of their host plants (Wilson et al., 2005; Greischar and Koskella, 2007). Here we provide some discussion about the hosts, first considering their current distribution and secondly considering the more distant past. Both D. glomerata and H. lanatus are native and widely distributed plants in grasslands across Europe and share similar long-distance pollen dispersal mediated by wind whereas seeds usually disperse more locally (Düll and Kutzelnigg, 2016). Our sampling was conducted in natural grassland ecosystems where the impact of anthropogenic use is likely minimal. However, sowing for pasture farming or forage production could have differentially affected the genetic make-up of the two host grass populations. H. lanatus is not commercially sown due to its low nutritional value as a forage grass and may even be considered a weed, whereas D. glomerata cultivars are frequently sown as part of commercial forage grass mixtures. Active sowing of D. glomerata may result in an overall large effective population size and more continuous distribution and this could explain why populations of its pathogen E. typhina also have more gene flow and higher diversity. Considering the more distant past, the observed genetic structure could reflect the joint phylogeographic history of pathogens and hosts dating back to the last ice age. In particular, the existence of three genetically distinct southern ice-age refugia (Iberia, Italy and the Balkans) and subsequent northward recolonization as ice-sheets retreated is a well-established hypothesis supported by phylogeographic studies in a growing number of temperate species including grasses (Hewitt, 2000; Fjellheim et al., 2006; McGrath et al., 2007; François et al., 2008; Provan and Bennett, 2008; von Cräutlein et al., 2019). It also supports population genetic patterns found in a host-pathogen system. In the anther smut pathogen Microbotryum lynchnidis-dioicae and its white campion host (Silene latifolia) three genetically differentiated clusters were identified that reflected the concerted recolonization of the host plant and its fungal pathogen from distinct southern glacial refugia (Vercken et al., 2010; Feurtey et al., 2016; Badouin et al., 2017). Our results do not indicate obvious footprints of distinct glacial refugia, however, this may be because we did not sample the entire distribution. Studies spanning a larger geographic area, including Eastern and Southern European populations would be better suited to test for such patterns.
4.4. Additional host species confirmed for E. clarkii
In our sampling of these natural populations of E. clarkii, we found two locations in the UK and in Northern France where the pathogen occurred on the host grass Holcus mollis. This was surprising given that E. clarkii is considered to be highly specialized on H. lanatus and, moreover, H. mollis is the host of a distinct Epichloë species, E. mollis (Leuchtmann et al., 2014). However, a literature review revealed that this finding indeed backs up previous observations from the UK, where E. clarkii was identified on H. mollis based on its ascospore morphology (Spooner and Kemp, 2005). We now provide additional evidence with genetic data and, for the first time, report H. mollis as an E. clarkii host on European mainland. It needs to be noted that hybrids between H. lanatus and H. mollis have been described (Holcus x hybridus Wein), which usually show morphologically intermediate phenotypes but tend to resemble H. mollis more closely (Beddows, 1961; Carroll and Jones, 1962). In our samples, species identification of the putative H. mollis host grasses was based on the presence of orthotropic shoots/rhizomes indicating clonal propagation and the presence of longer hairs on the nodes compared to H. lanatus. Characters of the inflorescence could not be considered since they were encased in the fungal fruiting structure. Although these morphological characters match well with descriptions of H. mollis, we cannot entirely exclude that samples originate from hybrids, and this will need to be investigated further. In any case, this finding opens up new avenues to investigate the evolution of host specialization and divergence within the Epichloë study system.
5. Conclusion
The comparison of genetic structure within and between populations of E. typhina and E. clarkii indicate distinct evolutionary histories of the two species which could be due to differences in dispersal and/or the underlying genetic structure of host populations. Our data suggests that E. typhina infecting D. glomerata is a more ubiquitous pathogen with higher dispersal abilities and E. clarkii infecting H. lanatus and H. mollis forms more fragmented populations restricted by lower dispersal abilities. These differences could influence the efficacy of selection and the local adaptation in these two species. E. clarkii with its lower effective population size is more likely to experience metapopulation dynamics with frequent local extinction and recolonization events which may lead to loss of genetic diversity within populations and generate genetic differences between populations through bottlenecks and genetic drift. Future work should investigate signatures of adaptive variation in these two pathogens in order to disentangle effects of drift and selection. This study and dataset presented here are the foundations for understanding coevolution and adaptation in the Epichloë study system and provides novel insights into the population structure and patterns of gene flow. It demonstrates how the biology of these species and the interaction with their host plants may influence evolutionary trajectories and helps to increase our understanding of the population genetic processes that generate and maintain diversity of fungal pathogens in natural ecosystems.
Data availability statement
The datasets presented in this study can be found in online repositories. The name of the repository and accession numbers can be found below: ENA; PRJEB59262 and ERR10815001-ERR10815422.
Author contributions
AL and AT conceived the study design. AT and JS developed methodology and did the formal analyses. AT wrote the initial draft. AT, JS, and AL reviewed and edited the manuscript. AL acquired funding. All authors read and agreed to the submitted version of the manuscript.
Funding
This study was supported by the Swiss National Science Foundation (SNSF), Grant Number: 31003A_169269.
Acknowledgments
We thank Martyn Ainsworth (Royal Botanic Gardens, Kew, United Kingdom), Jean-Paul Priou, James M. Neenan, Elisabeth Walder, and Lilith Treindl for assistance with sample collection, and Claudia Michel and Beatrice Arnold for laboratory assistance. Fabrizio Steinebrunner provided samples for DNA extraction from a previous collection at the Aubonne site. We also thank Karsten Rohweder for help with the GPS device and Niklaus Zemp for bioinformatic support. Data presented and analyzed here were generated in collaboration with the Genetic Diversity Centre (GDC), ETH Zurich, the Functional Genomics Center Zurich (FGCZ), and UZH.
Conflict of interest
The authors declare that the research was conducted in the absence of any commercial or financial relationships that could be construed as a potential conflict of interest.
Publisher’s note
All claims expressed in this article are solely those of the authors and do not necessarily represent those of their affiliated organizations, or those of the publisher, the editors and the reviewers. Any product that may be evaluated in this article, or claim that may be made by its manufacturer, is not guaranteed or endorsed by the publisher.
Supplementary material
The Supplementary Material for this article can be found online at: https://www.frontiersin.org/articles/10.3389/fevo.2023.1129867/full#supplementary-material
Footnotes
- ^ https://gatk.broadinstitute.org/hc/en-us/articles/360035535932-Germline-short-variant-discovery-SNPs-Indels-
- ^ https://github.com/adtreindl/Epichloe_genomics
- ^ https://github.com/vcftools/vcftools/pull/69
References
Ashby, B., and Gupta, S. (2014). Parasitic castration promotes coevolutionary cycling but also imposes a cost on sex. Evolution 68, 2234–2244. doi: 10.1111/evo.12425
Badouin, H., Gladieux, P., Gouzy, J., Siguenza, S., Aguileta, G., Snirc, A., et al. (2017). Widespread selective sweeps throughout the genome of model plant pathogenic fungi and identification of effector candidates. Mol. Ecol. 26, 2041–2062. doi: 10.1111/mec.13976
Barrett, L. G., Thrall, P. H., Burdon, J. J., and Linde, C. C. (2008). Life history determines genetic structure and evolutionary potential of host-parasite interactions. Trends Ecol. Evol. 23, 678–685. doi: 10.1016/j.tree.2008.06.017
Barrett, L. G., Thrall, P. H., Dodds, P. N., Van Der Merwe, M., Linde, C. C., Lawrence, G. J., et al. (2009). Diversity and evolution of effector loci in natural populations of the plant pathogen Melampsora lini. Mol. Biol. Evol. 26, 2499–2513. doi: 10.1093/molbev/msp166
Bates, D., Mächler, M., Bolker, B. M., and Walker, S. C. (2015). Fitting linear mixed-effects models using lme4. J. Stat. Softw. 67, 1–48. doi: 10.18637/jss.v067.i01
Bolger, A. M., Lohse, M., and Usadel, B. (2014). Trimmomatic: a flexible trimmer for Illumina sequence data. Bioinformatics 30, 2114–2120. doi: 10.1093/bioinformatics/btu170
Bradley, D. J., Gilbert, G. S., and Martiny, J. B. H. (2008). Pathogens promote plant diversity through a compensatory response. Ecol. Lett, 11, 461–469. doi: 10.1111/j.1461-0248.2008.01162.x
Bultman, T. L., Leuchtmann, A., Sullivan, T. J., and Dreyer, A. P. (2011). Do Botanophila flies provide reproductive isolation between two species of Epichloë fungi? A field test. New Phytologist. 190, 206–212. doi: 10.1111/j.1469-8137.2010.03612.x
Burdon, J. J., and Laine, A.-L. (2019). Evolutionary dynamics of plant-pathogen interactions (Cambridge: Cambridge University Press), 1–28. doi: 10.1017/9781108625517.002
Carroll, C. P., and Jones, K. (1962). Cytotaxonomic studies in Holcus - A morphological study of the triploid F1 hybrid between Holcus lanatus L. and H. mollis L. New Phytologist. 61, 72–84. doi: 10.1111/j.1469-8137.1962.tb06276.x
Christensen, M. J., Leuchtmann, A., Rowan, D. D., and Tapper, B. A. (1993). Taxonomy of Acremonium endophytes of tall fescue (Festuca arundinacea), meadow fescue (F. pratensis) and perennial ryegrass (Lolium perenne). Mycol. Res. 97, 1083–1092.
Chung, K.-R., and Schardl, C. L. (1997). Sexual cycle and horizontal transmission of the grass symbiont. Epichloë typhina. Mycol. Res. 101, 295–301. doi: 10.1017/S0953756296002602
Clay, K., and Schardl, C. (2002). Evolutionary origins and ecological consequences of endophyte symbiosis with grasses. Am. Nat. 160, S99–S127. doi: 10.1086/342161
Craven, K. D., Hsiau, P. T. W., Leuchtmann, A., Hollin, W., and Schardl, C. L. (2001). Multigene phylogeny of Epichloë species, fungal symbionts of grasses. Ann. Missouri Bot. Gard. 88, 14–34. doi: 10.2307/2666129
Danecek, P., Auton, A., Abecasis, G., Albers, C. A., Banks, E., DePristo, M. A., et al. (2011). The variant call format and VCFtools. Bioinformatics 27, 2156–2158. doi: 10.1093/bioinformatics/btr330
Düll, R., and Kutzelnigg, H. (2016). Taschenlexikon der Pflanzen Deutschlands und angrenzender Länder, 8th Edn. Wiebelsheim: Quelle und Meyer.
Earl, D. A., and vonHoldt, B. M. (2012). STRUCTURE HARVESTER: a website and program for visualizing STRUCTURE output and implementing the Evanno method. Conserv. Genet. Resour. 4, 359–361. doi: 10.1007/s12686-011-9548-7
Evanno, G., Regnaut, S., and Goudet, J. (2005). Detecting the number of clusters of individuals using the software structure: a simulation study. Mol. Ecol. 14, 2611–2620. doi: 10.1111/j.1365-294X.2005.02553.x
Feurtey, A., Gladieux, P., Hood, M. E., Snirc, A., Cornille, A., Rosenthal, L., et al. (2016). Strong phylogeographic co-structure between the anther-smut fungus and its white campion host. New Phytologist. 212, 668–679. doi: 10.1111/nph.14125
Fisher, M. C., Henk, D. A., Briggs, C. J., Brownstein, J. S., Madoff, L. C., McCraw, S. L., et al. (2012). Emerging fungal threats to animal, plant and ecosystem health. Nature 484, 186–194.
Fjellheim, S., Rognli, O. A., Fosnes, K., and Brochmann, C. (2006). Phylogeographical history of the widespread meadow fescue (Festuca pratensis Huds.) inferred from chloroplast DNA sequences. J. Biogeogr. 33, 1470–1478. doi: 10.1111/j.1365-2699.2006.01521.x
François, O., Blum, M. G. B., Jakobsson, M., and Rosenberg, N. A. (2008). Demographic history of European populations of Arabidopsis thaliana. PLoS Genet. 4:e1000075. doi: 10.1371/journal.pgen.1000075
Greischar, M. A., and Koskella, B. (2007). A synthesis of experimental work on parasite local adaptation. Ecol. Lett. 10, 418–434. doi: 10.1111/j.1461-0248.2007.01028.x
Hewitt, G. (2000). The genetic legacy of the quaternary ice ages. Nature 405, 907–913. doi: 10.1038/35016000
Hoffman, G. D., and Rao, S. (2013). Association of slugs with the fungal pathogen Epichloë typhina (Ascomycotina: Clavicipitaceae): potential role in stroma fertilisation and disease spread. Ann. Appl. Biol. 162, 324–334.
Jousimo, J., Tack, A. J. M., Ovaskainen, O., Mononen, T., Susi, H., Tollenaere, C., et al. (2014). Ecological and evolutionary effects of fragmentation on infectious disease dynamics. Science 344, 1289–1293. doi: 10.1126/science.1253621
Kleiman, E. (2017). EMAtools: data management tools for real-time monitoring/ecological momentary assessment data. R package version 0.1.3. Available online at: https://cran.r-project.org/package=EMAtools (accessed May 22, 2023).
Large, E. C. (1954). Surveys for choke (Epichloë typhina) in cocksfoot seed crops, 1951–53. Plant Pathol. 3, 6–11. doi: 10.1111/j.1365-3059.1954.tb00674.x
Leuchtmann, A., Bacon, C. W., Schardl, C. L., White, J. F. Jr., and Tadych, M. (2014). Nomenclatural realignment of Neotyphodium species with genus Epichloë. Mycologia 106, 202–215. doi: 10.3852/13-251
Leuchtmann, A., and Clay, K. (1997). “The population biology of grass endophytes,” in The Mycota, Vol. V. Part B, plant relationships, eds G. C. Carroll and P. Tudzynski (Berlin: Springer-Verlag), 185–202. doi: 10.1007/978-3-642-60647-2_12
Leuchtmann, A., and Schardl, C. L. (1998). Mating compatibility and phylogenetic relationships among two new species of Epichloë and other congeneric European species. Mycol. Res. 102, 1169–1182. doi: 10.1017/S0953756298006236
Li, H., and Durbin, R. (2009). Fast and accurate short read alignment with burrows-wheeler transform. Bioinformatics 25, 1754–1760. doi: 10.1093/bioinformatics/btp324
Li, H., Handsaker, B., Wysoker, A., Fennell, T., Ruan, J., Homer, N., et al. (2009). The sequence alignment/map format and SAMtools. Bioinformatics 25, 2078–2079. doi: 10.1093/bioinformatics/btp352
Linck, E., and Battey, C. J. (2019). Minor allele frequency thresholds strongly affect population structure inference with genomic data sets. Mol. Ecol. Resour. 19, 639–647. doi: 10.1111/1755-0998.12995
Lynch, M., Sung, W., Morris, K., Coffey, N., Landry, C. R., Dopman, E. B., et al. (2008). A genome-wide view of the spectrum of spontaneous mutations in yeast. Proc. Natl. Acad. Sci. U.S.A. 105, 9272–9277. doi: 10.1073/pnas.0803466105
McDonald, B. A., and Linde, C. (2002). Pathogen population genetics, evolutionary potential, and durable resistance. Annu. Rev. Phytopathol. 40, 349–379. doi: 10.1146/annurev.phyto.40.120501.101443
McGrath, S., Hodkinson, T. R., and Barth, S. (2007). Extremely high cytoplasmic diversity in natural and breeding populations of Lolium (Poaceae). Heredity 99, 531–544. doi: 10.1038/sj.hdy.6801030
McKenna, A., Hanna, M., Banks, E., Sivachenko, A., Cibulskis, K., Kernytsky, A., et al. (2010). The genome analysis toolkit: a MapReduce framework for analyzing next-generation DNA sequencing data. Genome Res. 20, 1297–1303.
McMullan, M., Rafiqi, M., Kaithakottil, G., Clavijo, B. J., Bilham, L., Orton, E., et al. (2018). The ash dieback invasion of Europe was founded by two genetically divergent individuals. Nat. Ecol. Evol. 2, 1000–1008.
McVean, G. (2009). A genealogical interpretation of principal components analysis. PLoS Genet. 5:e1000686. doi: 10.1371/journal.pgen.1000686
Milgroom, M. G., Sotirovski, K., Spica, D., Davis, J. E., Brewer, M. T., Milev, M., et al. (2008). Clonal population structure of the chestnut blight fungus in expanding ranges in southeastern Europe. Mol. Ecol. 17, 4446–4458. doi: 10.1111/j.1365-294X.2008.03927.x
Möller, M., and Stukenbrock, E. H. (2017). Evolution and genome architecture in fungal plant pathogens. Nat. Rev. Microbiol. 15, 756–771. doi: 10.1038/nrmicro.2017.76
Persoons, A., Hayden, K. J., Fabre, B., Frey, P., De Mita, S., Tellier, A., et al. (2017). The escalatory red queen: population extinction and replacement following arms race dynamics in poplar rust. Mol. Ecol. 26, 1902–1918. doi: 10.1111/mec.13980
Pfender, W. F., and Alderman, S. C. (2006). Regional development of orchardgrass choke and estimation of seed yield loss. Plant Dis. 90, 240–244. doi: 10.1094/PD-90-0240
Pritchard, J. K., Stephens, M., and Donnelly, P. (2000). Inference of population structure using multilocus genotype data. Genetics 155, 945–959.
Provan, J., and Bennett, K. D. (2008). Phylogeographic insights into cryptic glacial refugia. Trends Ecol. Evol. 23, 564–571. doi: 10.1016/j.tree.2008.06.010
Raffaele, S., and Kamoun, S. (2012). Genome evolution in filamentous plant pathogens: why bigger can be better. Nat. Rev. Microbiol. 10, 417–430. doi: 10.1038/nrmicro2790
Raynal, G. (1991). Libération des ascospores d’Epichloë typhina, agent de la quenouille du dactyle. Conséquences pour l’épidémiologie et la lutte. Fourrages 127, 345–358.
Robinson, J. T., Thorvaldsdóttir, H., Winckler, W., Guttman, M., Lander, E. S., Getz, G., et al. (2011). Integrative genomics viewer. Nat. Biotechnol. 29, 24–26. doi: 10.1038/nbt.1754
Schardl, C. L., Young, C. A., Moore, N., Krom, N., Dupont, P.-Y., Pan, J., et al. (2014). Genomes of plant-associated Clavicipitaceae. Adv. Bot. Res. 70, 291–327.
Schirrmann, M. K., Zoller, S., Croll, D., Stukenbrock, E. H., Leuchtmann, A., and Fior, S. (2018). Genomewide signatures of selection in Epichloë reveal candidate genes for host specialization. Mol. Ecol. 27, 3070–3086. doi: 10.1111/mec.14585
Schirrmann, M. K., Zoller, S., Fior, S., and Leuchtmann, A. (2015). Genetic evidence for reproductive isolation among sympatric Epichloë endophytes as inferred from newly developed microsatellite markers. Microb. Ecol. 70, 51–60. doi: 10.1007/s00248-014-0556-5
Spooner, B. M., and Kemp, S. L. (2005). Epichloë in Britain. Mycologist 19, 82–87. doi: 10.1017/S0269915X05002065
Stukenbrock, E. H., Bataillon, T., Dutheil, J. Y., Hansen, T. T., Li, R., Zala, M., et al. (2011). The making of a new pathogen: insights from comparative population genomics of the domesticated wheat pathogen Mycosphaerella graminicola and its wild sister species. Genome Res. 21, 2157–2166. doi: 10.1101/gr.118851.110
Stukenbrock, E. H., and McDonald, B. A. (2008). The origins of plant pathogens in agro-ecosystems. Annu. Rev. Phytopathol. 46, 75–100. doi: 10.1146/annurev.phyto.010708.154114
Tadych, M., Bergen, M., Dugan, F. M., and White, J. F. Jr. (2007). Evaluation of the potential role of water in spread of conidia of the Neotyphodium endophyte of Poa ampla. Mycol. Res. 111, 466–472.
Tajima, F. (1989). Statistical method for testing the neutral mutation hypothesis by DNA polymorphism. Genetics 123, 585–595.
Takahata, N., and Nei, M. (1985). Gene genealogy and variance of interpopulational nucleotide differences. Genetics 110, 325–344.
Tarasov, A., Vilella, A. J., Cuppen, E., Nijman, I. J., and Prins, P. (2015). Sambamba: fast processing of NGS alignment formats. Bioinformatics 31, 2032–2034. doi: 10.1093/bioinformatics/btv098
Tellier, A., Moreno-Gámez, S., and Stephan, W. (2014). Speed of adaptation and genomic footprints of host–parasite coevolution under arms race and trench warfare dynamics. Evolution 68, 2211–2224.
Thompson, J. N. (2005). The geographic mosaic of coevolution. Chicago, IL: University of Chicago Press.
Torres, D. E., Oggenfuss, U., Croll, D., and Seidl, M. F. (2020). Genome evolution in fungal plant pathogens: looking beyond the two-speed genome model. Fungal Biol. Rev. 34, 136–143. doi: 10.1016/j.fbr.2020.07.001
Treindl, A. D., and Leuchtmann, A. (2019). Assortative mating in sympatric ascomycete fungi revealed by experimental fertilizations. Fungal Biol. 123, 676–686. doi: 10.1016/j.funbio.2019.06.005
Treindl, A. D., Stapley, J., and Leuchtmann, A. (2021a). “Resolving the phylogeny of the Epichloe typhina species complex using genome-wide SNPs,” in Into the wild – Adaptation genomics of Epichloe grass pathogens in natural ecosystems, ed. A. Treindl (Zürich: ETH Zurich), 177–192. doi: 10.3929/ethz-b-000521608
Treindl, A. D., Stapley, J., Winter, D. J., Cox, M. P., and Leuchtmann, A. (2021b). Chromosome-level genomes provide insights into genome evolution, organization and size in Epichloe fungi. Genomics 113, 4267–4275. doi: 10.1016/j.ygeno.2021.11.009
Tutin, T. G., Heywood, V. H., Burges, N. A., Moore, D. M., Valentine, D. H., Walters, S. M., et al. (1980). Flora Europaea, Vol. 5. Cambridge: Cambridge University Press.
Van der Auwera, G. A., Carneiro, M. O., Hartl, C., Poplin, R., Del Angel, G., Levy-Moonshine, A., et al. (2013). From FastQ data to high-confidence variant calls: the genome analysis toolkit best practices pipeline. Curr. Protoc. Bioinformatics 43, 10–11.
Vercken, E., Fontaine, M. C., Gladieux, P., Hood, M. E., Jonot, O., and Giraud, T. (2010). Glacial refugia in pathogens: European genetic structure of anther smut pathogens on Silene latifolia and Silene dioica. PLoS Pathog. 6:e1001229. doi: 10.1371/journal.ppat.1001229
von Cräutlein, M., Leinonen, P. H., Korpelainen, H., Helander, M., Väre, H., and Saikkonen, K. (2019). Postglacial colonization history reflects in the genetic structure of natural populations of Festuca rubra in Europe. Ecol. Evol. 9, 3661–3674. doi: 10.1002/ece3.4997
Watterson, G. A. (1975). On the number of segregating sites in genetical models without recombination. Theor. Popul. Biol. 7, 256–276.
Weir, B. S., and Cockerham, C. C. (1984). Estimating F-statistics for the analysis of population structure. Evolution 38, 1358–1370.
White, J. F. Jr. (1993). Endophyte-host associations in grasses. XIX. A systematic study of some sympatric species of Epichloë in England. Mycologia 85, 444–455.
White, J. F. Jr., and Bultman, T. L. (1987). Endophyte-host associations in forage grasses. VIII. Heterothallism in Epichloë typhina. Am. J. Bot. 74, 1716–1721.
Wilson, D. J., Falush, D., and McVean, G. (2005). Germs, genomes and genealogies. Trends Ecol. Evol. 20, 39–45. doi: 10.1016/j.tree.2004.10.009
Winter, D. J., Ganley, A. R. D., Young, C. A., Liachko, I., Schardl, C. L., Dupont, P. Y., et al. (2018). Repeat elements organise 3D genome structure and mediate transcription in the filamentous fungus Epichloë festucae. PLoS Genet. 14:e1007467. doi: 10.1371/journal.pgen.1007467
Keywords: fungal plant pathogen, population structure, phylogeography, gene flow, genetic structure
Citation: Treindl AD, Stapley J and Leuchtmann A (2023) Genetic diversity and population structure of Epichloë fungal pathogens of plants in natural ecosystems. Front. Ecol. Evol. 11:1129867. doi: 10.3389/fevo.2023.1129867
Received: 22 December 2022; Accepted: 17 May 2023;
Published: 08 June 2023.
Edited by:
Matthew B. Hamilton, Georgetown University, United StatesReviewed by:
Leopoldo Javier Iannone, National Scientific and Technical Research Council (CONICET), ArgentinaDaniel A. Bastías, AgResearch Ltd., New Zealand
Copyright © 2023 Treindl, Stapley and Leuchtmann. This is an open-access article distributed under the terms of the Creative Commons Attribution License (CC BY). The use, distribution or reproduction in other forums is permitted, provided the original author(s) and the copyright owner(s) are credited and that the original publication in this journal is cited, in accordance with accepted academic practice. No use, distribution or reproduction is permitted which does not comply with these terms.
*Correspondence: Adrian Leuchtmann, YWRyaWFuLmxldWNodG1hbm5AcmV0aXJlZC5ldGh6LmNo