 Hiroshi Yamashita
 Touya Kamikubo
 Kazuki Muku3
 Nobuhiko J. Suematsu
 Makoto Iima
- 1Graduate School of Integrated Sciences for Life, Hiroshima University, Higashihiroshima, Japan
- 2Department of Mathematics, Hiroshima University, Higashihiroshima, Japan
- 3Department of Integrated Arts and Sciences, Hiroshima University, Higashihiroshima, Japan
- 4Graduate School of Advanced Mathematical Sciences, Meiji University, Nakano, Japan
- 5Meiji Institute for Advanced Study of Mathematical Sciences (MIMS), Meiji University, Nakano, Japan
Microorganisms possess taxes, which are the behavioral response to stimuli. The interaction between taxis and fluid dynamic instability leads to a macroscopic flow called bioconvection. In this study, we demonstrated that an isolated, single, three-dimensional bioconvection cell can exist within Euglena suspension. The isolated convection cell was named a “bioconvection spot.” To reveal the formation of this bioconvection spot in a cylindrical container, position-control experiments were designed in a non-uniform light environment. Upon exposure of Euglena suspensions to varying light conditions with white and red regions, Euglena was determined to aggregate into the red (darker) region. This was attributed to its phototactic response of Euglena, causing its movement toward a darker environment and away from a strong light. Thus, the bioconvection spot was created by manipulating the local cell density of the suspension and the light environments. Using our experimental setup, we observed the structure of the spot and established that it radiated pulses of local cell densities of Euglena.
1. Introduction
Microorganisms can change their mode of locomotion by responding to various stimuli, such as chemicals (Berg, 1975), gravity (Häder et al., 2005), and light (Häder and Iseki, 2017). These behavioral responses are called taxes (Pedley and Kessler, 1992); these responses cause a macroscopic phenomenon called bioconvection. Wager (1911) reported net-like patterns that appeared within dense Euglena suspensions in various containers and demonstrated that variations in aggregation occurred when stimulated by external light targeted vertically down from the top. Platt (1961) considered the reasons for the onset of bioconvection patterns observed in various microorganisms; consequently, these bioconvections were not due to Rayleigh–Bénard thermal convections. The container's depth and the suspension's average cell density were determined to be important for the formation of this bioconvection. Additionally, Williams and Bees (2011) showed the time evolution of pattern formation of Chlamydomonas bioconvections in dense suspensions. Chlamydomonas bioconvection occurs due to three taxes (phototaxis, gyrotaxis, and gravitaxis) which are not completely independent. They showed variation in this time evolution depending on the intensity of light treatment from above and below the suspensions. Recently, Ramamonjy et al. (2022) demonstrated the detailed interaction between phototaxis and bioconvection in Chlamydomonas.
This study focused on the bioconvection that was induced in a Euglena suspension due to negative phototaxis. Euglena is a well-known unicellular flagellate with a body length of approximately 50 μm and spindle-like shape. This flagellate moves forward by moving a single anterior flagellum (puller-type swimmer) (Ogawa et al., 2017; Rossi et al., 2017). Euglena is a photosynthetic microorganism with positive and negative phototaxis (Diehn, 1973). Euglena moves toward a weak light source (positive phototaxis) and away from a strong light source (negative phototaxis). When a strong light from below illuminates the diluted suspension of Euglena, it moves toward the top of the suspension due to the corresponding negative phototaxis. As a result, the local cell density of the microorganisms near the top of the suspension becomes higher. As the specific gravity of Euglena is greater than one, it causes an unstable stratification of mass density, where the top layer is heavier than bottom layer. In such a situation, Rayleigh–Taylor instability occurs, where a downward flow occurs from the top to the bottom of the suspension. In this process, Euglena is swept to the bottom layer by the downward flow. Additionally, simultaneous migration to the upper layer of suspension is maintained via the Euglena-dependent negative phototaxis. The balance between the microorganisms' upward and downward movements generates a macroscopic convective flow (bioconvection) in the suspension, as illustrated in Figure 1A.
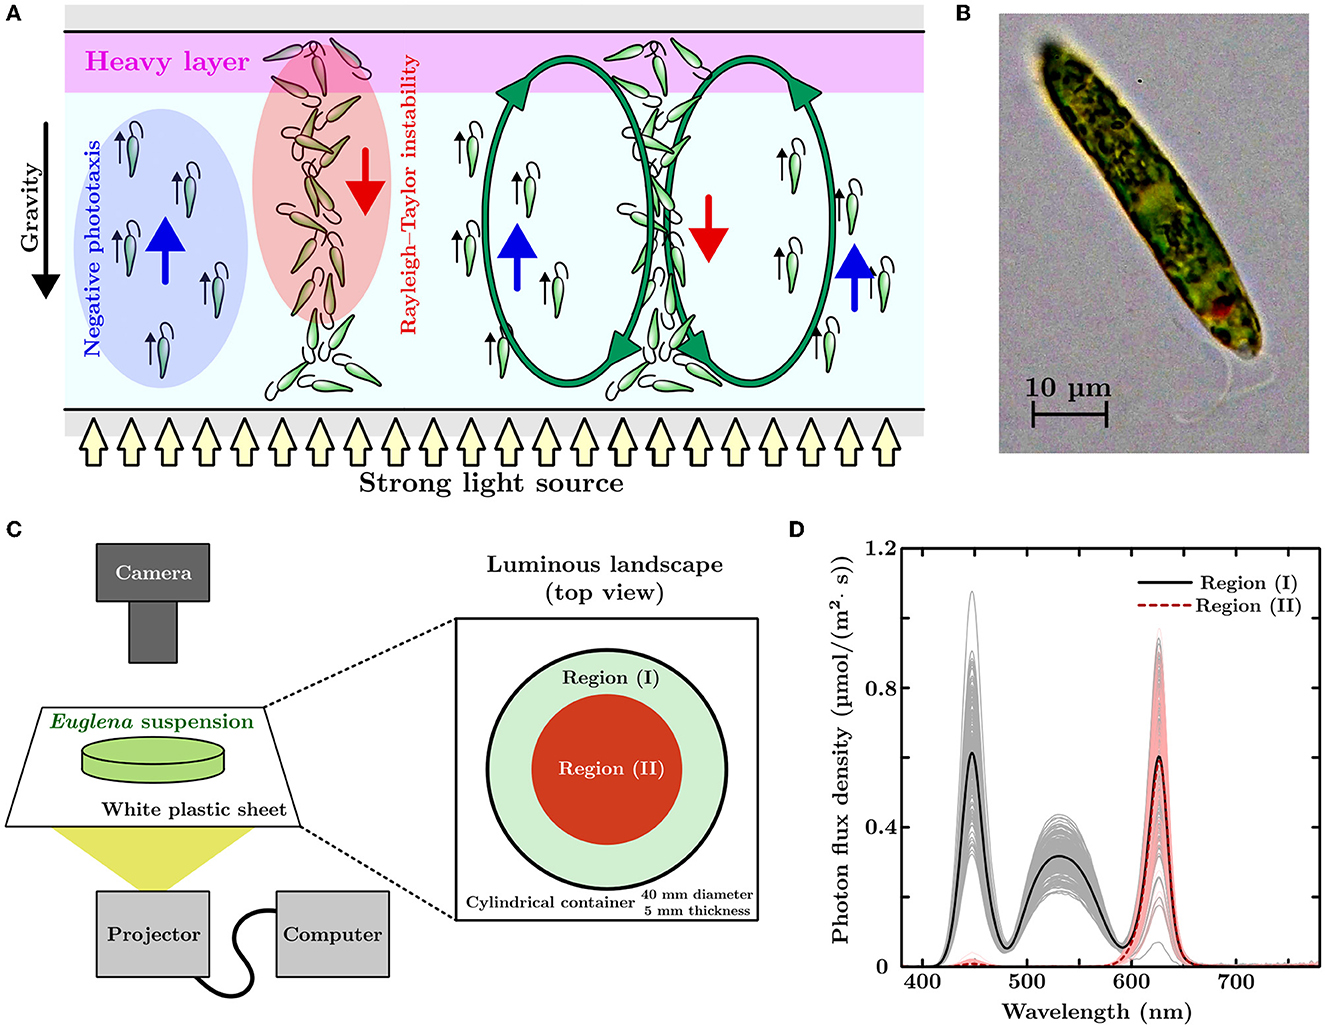
Figure 1. (A) Schematic of bioconvection. (B) Microscopic picture of Euglena gracilis. (C) Experimental setup and luminous landscape. A projector is adopted as the light source and used to illuminate a cylindrical container (diameter of 40 mm and thickness of 5 mm) containing a Euglena suspension. The non-uniform light environment has bright (I) and dark (II) regions. (D) Light brightness of each region in the luminous landscape. The black solid and red dashed lines represent the averaged profiles of photon flux density (PFD) for the white and red lights projected on the screen, respectively. Gray and bright-red lines represent PFD profiles for each measurement.
Recent studies demonstrated that spatially-localized bioconvection can occur within dilute suspensions of Euglena (Suematsu et al., 2011; Shoji et al., 2014). Suematsu et al. (2011) revealed that bioconvection cells appeared when a Euglena suspension was illuminated by a strong light from below and spatially localized in a thin cylindrical container. Overall, the pattern of the localized bioconvection cells depends on the average cell density and container thickness. When the average cell density increases, the number of convection cells increases. However, the size of the bioconvection cells does not change, and there is no considerable change in the distance between the convection cells. This phenomenon differs from Rayleigh–Bénard thermal convection, in which the convection cells cover the entire container. Shoji et al. (2014) investigated the existence and behavioral characteristics of the bioconvection unit consisting of two convection rolls in an annular container with periodicity in a circumferential direction. They demonstrated a two-dimensional-like unit that maintained its structure and moved in a circumferential direction along the side wall. When two bioconvection units exist within a container, they can either merge with time or maintain a constant distance between them. The stable non-equilibrium states of the bioconvection unit in an annular container are similar to thermal convection in binary fluid mixtures (Bensimon et al., 1990; Watanabe et al., 2011, 2012). Nonetheless, the laws governing the motion of bioconvection units remain unknown. No prior study has investigated an isolated, single, three-dimensional bioconvection cell in a container such as a petri dish. Therefore, whether such a bioconvection cell can maintain its structure without other convection cells surrounding it is unclear.
Overall, we aimed to understand the localized bioconvection of Euglena and demonstrate the existence of an isolated, single, three-dimensional bioconvection cell, which was termed a “bioconvection spot.” In this study, we established a “position-control” experiment method to generate a Euglena-dependent bioconvection spot in a container. In addition, we established that this bioconvection spot can exist alone, without a wall nearby, and maintain its corresponding structure via the position-control technique. Recently, Arrieta et al. (2019) reported a control method for the bioconvection plumes of Chlamydomonas. They controlled the local cell density of a dense Chlamydomonas suspension by LED illumination using optical fiber. Alternatively, time-varying non-uniform light fields were used in this study. Ogawa et al. (2016) observed the cell numbers of a Euglena suspension in a capillary laid horizontally, which had two regions illuminated with different light intensities from below. The cell number in each region was biased depending on the differences in the average intensity and the gap between the two light intensities. This indicated that Euglena exhibits lateral movements in response to light. By utilizing this response and exposing the suspension to a controlled light environment with bright and dark regions that changed temporally, we manipulated the local cell density of the Euglena suspension. As a result, the bioconvection spot would emerge at a specific location within the dilute suspension where the local cell density of Euglena reaches a high level, which was mediated by this indirect manipulation with light.
2. Materials and methods
Euglena gracilis strain Z (Figure 1B) was pre-cultured using Koren–Hunter medium with continuous light illumination. The cells were inoculated into a 2g/L HYPONeX aqueous solution with periodic light illumination at room temperature (20±1°C). The light period (4.27 μmol/m2/s, 306 lx) was conducted between 7 a.m. to 10 p.m. (15 h light/9 h dark cycle). The average cell densities of the suspension were prepared by diluting the suspension extracted from the cell culture with a HYPONeX aqueous solution of the same concentration. The suspension was left in the darkroom for an hour before placing it on our experimental device. We conducted all experiments from 1 p.m. to 7 p.m. Figure 1C shows a schematic of the experimental setup used in this study. We used a projector (PicoCube X, Felicross Co. Ltd.) as the light source, and varying light conditions were projected onto a screen made of white polystyrene sheet (thickness: 0.2 mm). The light environment corresponded to a flip drawing controlled by an in-house Python program with library Pygame. The Euglena suspension was placed in a cylindrical acrylic container (40 mm in diameter and 5mm in thickness) with a top cover made of glass. This container was placed on the screen and observed from above using a digital single-lens reflex camera (Z 7II & NIKKOR Z 50 mm f/1.8 S, Nikon).
Euglena migrates away from strong light when the environment suddenly changes (Ogawa et al., 2016; Tsang et al., 2018). By exposing the Euglena suspension to an artificial, non-uniform light environment, we manipulated the local cell density of the Euglena by utilizing this movements. As shown in Figure 1C, the artificial light environment had two regions, (I) and (II), with different light colors and brightness. Region (II) incorporated a darker color than that of region (I). The circle radius for region (II) was initially 20 mm (covering the whole region of the cylindrical container). The radius of this region decreased linearly with time until this region vanished after a specific designated time. The light intensity of the projected pattern fluctuated (50 Hz) due to refreshing the image. To obtain an average light brightness for each region, we measured the light 240 times using a spectrometer (MK350S Premium, UPRtek) with an exposure time of 500 μs. Figure 1D shows the profiles of photon flux density (PFD) for wavelengths from 380 nm to 780 nm. Black-solid and red-dashed lines represent the averaged PFD profiles of the light conditions that were projected in white and red colors, respectively. Gray and bright-red lines indicated the PFD profiles obtained using each measurement. The net light brightness, an integrated PFD with respect to wavelength, of the white and red regions was 55.4 μmol/m2/s (3500 lx) and 15.6 μmol/m2/s (695 lx), respectively.
The following image analysis was performed to quantify the relationship between Euglena-rich regions observed in a container and the average cell density of the suspensions. We extracted the Euglena-rich regions inside a container from the images of a whole region using an in-house Python program with library Pillow. We converted the images taken after region (II) vanished to 8bit-grayscale images; we then inverted the grayscale of these images. We eliminated the regions with bubbles in the images. Additionally, we set an image intensity threshold to 145 (57% of a maximum intensity on 8-bit grayscale) to extract the regions corresponding to the green haze. For all images, we utilized the same threshold value; therefore, the values in each image smaller than this threshold were considered noise and replaced with zero. We calculated the average image intensity of the converted images by dividing the sum of the image intensity of each pixel by the total number of pixels inside the container. This average image intensity was used to represent the extent of pattern formation considering each degree of aggregation of the bioconvection cells induced within the container.
3. Results
3.1. Euglena bioconvection in uniform light
First, we analyzed the induction of Euglena bioconvection in a uniformly lit environment. Euglena suspensions of varying average cell densities were placed on the screen that was irradiated by white-colored light; then, we observed these suspensions for 30 min. The average cell densities in this study were 0.56×10⁵, 1.1×10⁵, and 2.4×10⁵ cells/mL, as shown in Figures 2A–C, respectively. These figures correspond to snapshots taken at t= 15 min; the dark-green-colored haze in Figure 2 represents an area of high cell density. We observed the hazes from above at an angle and confirmed that the densest part of each green haze corresponded to the downward flow of the bioconvection. Figure 2C indicates that the green hazes were observed at various locations in the container, with bioconvection occurring for the 2.4×10⁵ cells/mL suspension. The hazes in the central region correspond to bioconvection cells; in addition, we observed that a few hazes maintained their structure and remained close to the side wall. The bioconvection cells maintained their corresponding structure for at least 30 min; however, Figure 2C alone could not be used to determine whether these bioconvection cells can exist without interacting with other cells and/or the side walls. In contrast, the green haze was not observed for 1.1×10⁵ cells/mL (Figure 1B) or 0.56×10⁵ cells/mL (Figure 1A) suspensions. However, a bioconvection was observed in our experiments two out of five times for a suspension containing approximately 1×10⁵ cells/mL.
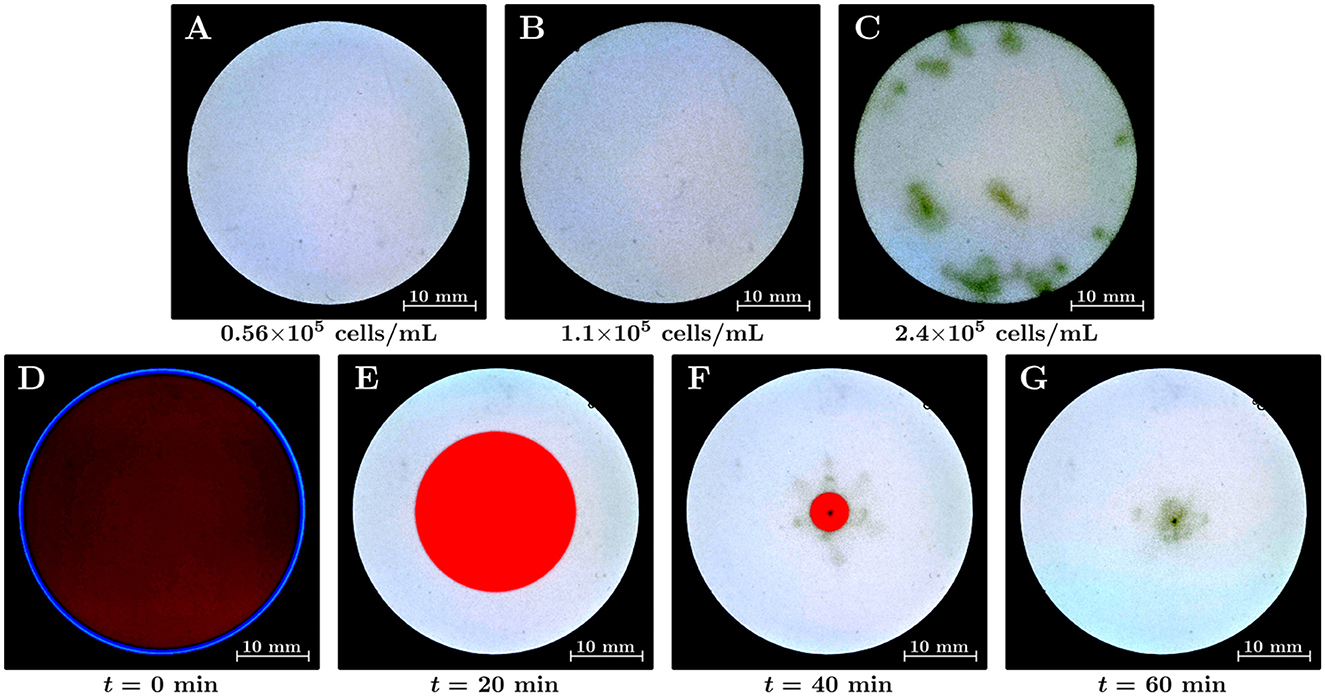
Figure 2. (A–C) Euglena bioconvection in a uniform light environment with varying average cell densities in the suspensions. The suspension is illuminated by white light over the whole region of the container from below. Snapshots are shown at t= 15 min. The average cell densities of the suspensions were (A) 0.56×10⁵ cells/mL, (B) 1.1×10⁵ cells/mL, and (C) 2.4×10⁵ cells/mL. (D–G) The emergence of a bioconvection spot of Euglena by shrinking the red-light region (II). The duration time of the shrinking was 45 min; the average cell density of the suspension was 0.37×10⁵ cells/mL.
3.2. Position-control experiments for the onset of bioconvection spot
We performed the position-control experiments for the emergence of a bioconvection spot using a non-uniform light environment (Figures 2D–G). The radius of region (II) decreased for 45 min, and the luminous area was gradually replaced by white light across the whole region. The average cell density of the suspension was 0.37×10⁵ cells/mL. Figures 2D–G indicate the time variation of the suspension in the container: (D) at the initial state, (E) at t= 20 min, (F) at t= 40 min, and (G) at t= 60 min. The average cell density of the suspension was 0.37×10⁵ cells/mL, which is more diluted than the case with no bioconvection in uniform light environment (0.56×10⁵ cells/mL). We observed that a bioconvection spot emerged near the center of the container when region (II) gradually decreased in size (Figure 2F). This indicated that Euglena moved toward the inner side of region (II), and the local cell density inside the red region (II) became higher than that in the bright region (I). In a non-uniform stationary light environment with red and white lights, the cell density in the region illuminated by red light increases (Muku et al., 2023). The bioconvection spot maintained its structure for at least 30 min after region (II) vanished. The bioconvection spot radiates clusters of Euglena individuals, as pulses of local cell density, in various directions (Supplementary Movie S1).
Position-control experiments were performed with different average cell densities. The duration time of the shrinking was set to 45 min. Figures 3A–D show the corresponding results for the 0.37×10⁵, 0.79×10⁵, 1.1×10⁵, and 1.5×10⁵ cells/mL suspensions, respectively. The upper and lower parts of each figure represent snapshots taken before and after region (II) vanished. We determined that, in all suspensions, the bioconvection spot emerges at the region of the shrinking red light. However, as the average cell density increases, the bioconvection spots emerged at locations other than the target position before the region (II) vanishes. This suggests that during the shrinking for the region (II), the local cell density in the central region becomes larger than the critical density for bioconvection.
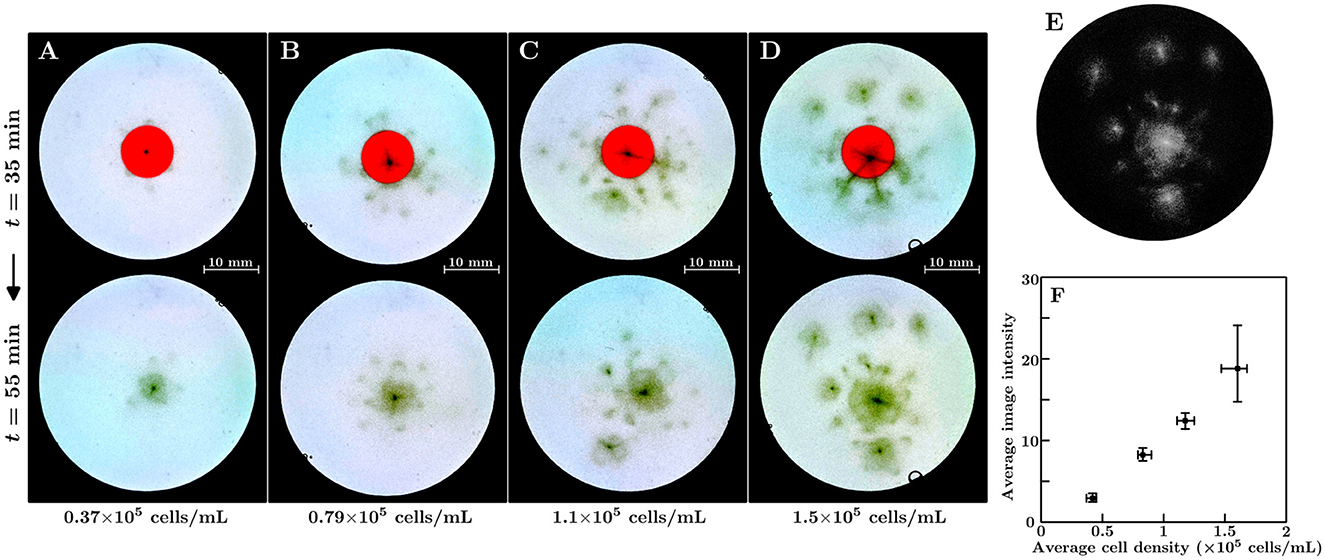
Figure 3. (A–D) Emergence of the bioconvection spot depends on the suspension's average cell density. The average cell density of the suspensions were as follows: (A) 0.37×10⁵ cells/mL, (B) 0.79×10⁵ cells/mL, (C) 1.1×10⁵ cells/mL, and (D) 1.5×10⁵ cells/mL. (E) Extraction of the dense regions in the container. The grayscale image corresponds to the lower panel of (D). (F) The average image intensity of the extracted dense regions in the containers for the average cell density of suspension 10 min after region (II) vanished. Squares indicate mean values, and whiskers represent the minimum and maximum values.
Figure 3E shows the converted image of the lower part of Figure 3D. Figure 3F shows the average image intensities for the different average cell densities of the suspensions 10 min after region (II) vanished. A linear relationship was found between average intensity and average cell density. We performed experiments with various duration times of the shrinking for region (II) across the 15–60 min range. The average cell density of each suspension was set to 0.7–0.9×10⁵ cells/mL. We determined that a bioconvection spot emerges at the shrinking region for all duration times tested. Even for the shortest duration time of the shrinking (15 min), we confirmed the onset of a bioconvection spot 11 out of 12 times.
Bioconvection spots in Figures 3A, B (Supplementary Movies S1, S2) were not stationary after region (II) vanishes; we determined that the pulses radiated from the spot were different regarding frequency. To characterize of the pulse radiation, we defined the spot center as the point of minimum intensity of the gray image to track the position of the bioconvection spot (Figure 4A). The white curve in Figure 4A corresponds to the trajectory of the spot center; the red circle is centered at the spot center, and the radius is 5 mm. Figures 4B, C show the intensity variations along the red closed path with respect to time, where t= 0 corresponds to 2 min after region (II) vanished. The darker area in the figure represents the area of high cell density. The number of pulses radiating from the center of a bioconvection spot per unit time differed in Figures 4B, C. During 0 ≤ t ≤ 28 min, the total number of the radiated pulses was 55 and 150 in Figures 4B, C, respectively. Thus, the spot in the higher average cell density suspension of 0.79×10⁵ cells/mL was determined to radiate more pulses.
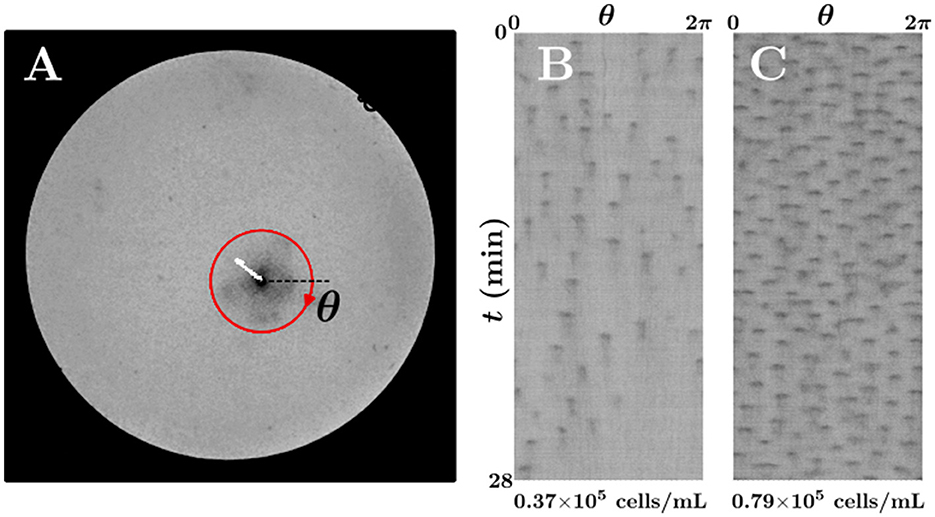
Figure 4. Time variations of the local cell density around the bioconvection spot. (A) Tracking of the spot center (white line). (B, C) Time variations of the image intensity along the red closed path in (A) for (B) 0.37×10⁵ cells/mL and (C) 0.79×10⁵ cells/mL suspensions.
4. Discussion
The occurrence of a bioconvection spot in Euglena suspension and the external light environment in this study may or may not exist in natural environment. Our experimental setups involved artificial environments designed to demonstrate that a bioconvection spot can maintain its structure alone. Further, they are used to test the behavior of the bioconvection spot, by which we can analyze the characteristics of collective motion. We call such a well-designed environment “diorama environment”. We expect Euglena's potential ability or adaptability that may be hidden in a complex natural environment can emerge using the diorama environment. This study could contribute to understanding microorganisms' behavioral characteristics and fluid dynamics. In an annular container, the behavior of Euglena bioconvection resembles that of thermal convection in binary fluid; nonetheless, their convection mechanisms are different. Overall, our position-control technique can be used for more controlled experiments, leading to an essential understanding of the dynamics of spatially localized structures.
Bioconvection did not always occur for the suspension with approximately 1×10⁵ cells/mL in a uniformly lit environment. This implies that 1×10⁵ cells/mL is close to the critical cell density required for bioconvection. We presumed the initial uniform distribution of cell density; however, the slight difference in initial distributions may contribute to the occurrence of bioconvection. In a uniformly lit environment, experiments for non-uniform initial distributions are difficult to conduct because of distribution control. To observe the induction of a bioconvection spot in a container, it is essential to perform position-control experiments, which manipulate the local cell density of the suspension.
We demonstrated the linear relationship between the average image intensity of bioconvection observed and the average cell density of the corresponding suspensions (Figure 3F). One factor for the linear relationship is that the number of spots increases as the suspension of average cell density increases (Figures 3B–D). However, the average image intensities differed in the suspensions of 0.37×10⁵ cells/mL (Figure 3A) and 0.79×10⁵ cells/mL (Figure 3B), nonetheless the number of a bioconvection spot formed was one in both suspensions. Figures 4B, C show that the spot observed in Figure 3B radiated more pulses than that in Figure 3A. These indicate that the spot in Figure 3B contains more microorganisms than that in Figure 3A. In addition, an upper limit on the number of cells in which a bioconvection spot can be constructed exists, because several bioconvection spots emerged in the higher average cell density suspension (Figures 3C, D). Considering the lower limit (the critical density for bioconvection), we suggest that the effective cell number range exists to maintain the bioconvection spot structure.
5. Conclusion
We established position-control experiments and determined that a bioconvection spot can exist independently and radiate pulses of local cell density. Moreover, we showed that the behavior of pulses changes depending on the average cell density of the suspension used. Our new experimental setup is expected to understand the localized bioconvection of Euglena and to reveal the behavioral characteristics of an isolated single three-dimensional bioconvection cell (bioconvection spot). For example, by using this setup, we can investigate the competition between the spots in events such as collision and coexistence. This can be conducted by generating two controlled bioconvection spots in a container that approach each other. In future studies, we will investigate the factors involved in the structural changes of bioconvection spots and aim to elucidate the mechanism of these radiated pulses and the laws of motion that govern them.
Data availability statement
The original contributions presented in the study are included in the article/Supplementary material, further inquiries can be directed to the corresponding author.
Author contributions
HY, NS, and MI conceptualized the research and designed the experimental setup. SI cultivated and provided Euglena. HY, TK, and KM conducted preliminary experiments to establish the experiments. HY performed the experiments, analyzed the data, and drafted the manuscript. All authors confirmed the manuscript and contributed to the revision. All authors contributed to the article and approved the submitted version.
Funding
This work was partially supported by JSPS KAKENHI (21H05311).
Acknowledgments
The authors thank Dr. Charles Fosseprez and Prof. Yukinori Nishigami at Hokkaido University for their helpful comments on the experimental setup and analyses.
Conflict of interest
The authors declare that the research was conducted in the absence of any commercial or financial relationships that could be construed as a potential conflict of interest.
Publisher's note
All claims expressed in this article are solely those of the authors and do not necessarily represent those of their affiliated organizations, or those of the publisher, the editors and the reviewers. Any product that may be evaluated in this article, or claim that may be made by its manufacturer, is not guaranteed or endorsed by the publisher.
Supplementary material
The Supplementary Material for this article can be found online at: https://www.frontiersin.org/articles/10.3389/fevo.2023.1132956/full#supplementary-material
References
Arrieta, J., Polin, M., Saleta-Piersanti, R., and Tuval, I. (2019). Light control of localized photobioconvection. Phys. Rev. Lett. 123, 158101. doi: 10.1103/PhysRevLett.123.158101
Bensimon, D., Kolodner, P., Surko, C. M., Williams, H., and Croquette, V. (1990). Competing and coexisting dynamical states of travelling-wave convection in an annulus. J. Fluid Mech. 217, 441–467. doi: 10.1017/S0022112090000799
Diehn, B. (1973). Phototaxis and sensory transduction in E uglena. Science 181, 1009–1015. doi: 10.1126/science.181.4104.1009
Häder Häder, D.-P., and Iseki, M. (2017). Photomovement in Euglena. Cham: Springer International Publishing.
Häder, D.-P., Hemmersbach, R., and Lebert, M. (2005). “Gravity and the behavior of unicellular organisms,” in Developmental and Cell Biology Series. Cambridge: Cambridge University Press.
Muku, K., Yamashita, H., Kamikubo, T., Suematsu, N. J., and Iima, M. (2023). Long-time behavior of swimming Euglena gracilis in a heterogenous light environment. Front. Cell Dev. Biol. 11, 1133028. doi: 10.3389/fcell.2023.1133028
Ogawa, T., Izumi, S., and Iima, M. (2017). Statistics and stochastic models of an individual motion of photosensitive alga Euglena gracilis. J. Phys. Soc. Jpn 86, 074401. doi: 10.7566/JPSJ.86.074401
Ogawa, T., Shoji, E., Suematsu, N. J., Nishimori, H., Izumi, S., Awazu, A., et al. (2016). The flux of Euglena gracilis cells depends on the gradient of light intensity. PLoS ONE 11, e0168114. doi: 10.1371/journal.pone.0168114
Pedley, T. J., and Kessler, J. O. (1992). Hydrodynamic phenomena in suspensions of swimming microorganisms. Annu. Rev. Fluid Mech. 24, 313–358. doi: 10.1146/annurev.fl.24.010192.001525
Platt, J. R. (1961). “bioconvection patterns” in cultures of free-swimming organisms. Science 133, 1766–1767. doi: 10.1126/science.133.3466.1766
Ramamonjy, A., Dervaux, J., and Brunet, P. (2022). Nonlinear phototaxis and instabilities in suspensions of light-seeking algae. Phys. Rev. Lett. 128, 258101. doi: 10.1103/PhysRevLett.128.258101
Rossi, M., Cicconofri, G., Beran, A., Noselli, G., and DeSimone, A. (2017). Kinematics of flagellar swimming in Euglena gracilis: helical trajectories and flagellar shapes. Proc. Natl. Acad. Sci. 114, 13085–13090. doi: 10.1073/pnas.1708064114
Shoji, E., Nishimori, H., Awazu, A., Izumi, S., and Iima, M. (2014). Localized bioconvection patterns and their initial state dependency in Euglena gracilis suspensions in an annular container. J. Phys. Soc. Jpn. 83, 043001. doi: 10.7566/JPSJ.83.043001
Suematsu, N. J., Awazu, A., Izumi, S., Noda, S., Nakata, S., and Nishimori, H. (2011). Localized bioconvection of Euglena caused by phototaxis in the lateral direction. J. Phys. Soc. Jpn. 80, 064003. doi: 10.1143/JPSJ.80.064003
Tsang, A. C. H., Lam, A. T., and Riedel-Kruse, I. H. (2018). Polygonal motion and adaptable phototaxis via flagellar beat switching in the microswimmer Euglena gracilis. Nat. Phys. 14, 1216–1222. doi: 10.1038/s41567-018-0277-7
Wager, H. W. T. (1911). On the effect of gravity upon the movements and aggregation of Euglena viridis, Ehrb., and other micro-organisms. Philos. Trans. R. Soc. B 201, 333–390. doi: 10.1098/rstb.1911.0007
Watanabe, T., Iima, M., and Nishiura, Y. (2012). Spontaneous formation of travelling localized structures and their asymptotic behaviour in binary fluid convection. J. Fluid. Mech. 712, 219–243. doi: 10.1017/jfm.2012.413
Watanabe, T., Toyabe, K., Iima, M., and Nishiura, Y. (2011). Time-periodic traveling solutions of localized convection cells in binary fluid mixture. Theor. Appl. Mech. Jpn. 59, 211–219. doi: 10.11345/nctam.59.211
Keywords: bioconvection, collective motion, microorganisms, plankton, Euglena, phototaxis, photo response
Citation: Yamashita H, Kamikubo T, Muku K, Suematsu NJ, Izumi S and Iima M (2023) Emergence of a Euglena bioconvection spot controlled by non-uniform light. Front. Ecol. Evol. 11:1132956. doi: 10.3389/fevo.2023.1132956
Received: 28 December 2022; Accepted: 03 April 2023;
Published: 20 April 2023.
Edited by:
Takuji Ishikawa, Tohoku University, JapanCopyright © 2023 Yamashita, Kamikubo, Muku, Suematsu, Izumi and Iima. This is an open-access article distributed under the terms of the Creative Commons Attribution License (CC BY). The use, distribution or reproduction in other forums is permitted, provided the original author(s) and the copyright owner(s) are credited and that the original publication in this journal is cited, in accordance with accepted academic practice. No use, distribution or reproduction is permitted which does not comply with these terms.
*Correspondence: Makoto Iima, aWltYUBoaXJvc2hpbWEtdS5hYy5qcA==