 Wang Xiaohui1Che Qian1
 Wang Longsheng1*Li Guangyu2*Sun Haiyan1Qin Weishan1Chen Shuang3Yao Shimou4Meng Liwei1Yu Xiaoqian1
- 1Coast Institute of Ludong University, Yantai, China
- 2Environmental Development Center of the Ministry of Ecology and Environment, Beijing, China
- 3School of geographical sciences, Nanjing University of Information Science and Technology, Nanjing, China
- 4Nanjing Institute of Geography and Limnology, Chinese Academy of Sciences, Nanjing, China
Introduction: Urban ecological instruction is an important method of sustainable development that couples the needs of the population and the environment, thus facilitating high-quality development. This study aimed to transform existing large-scale considerations of ecological urban construction to provide a more grounded evaluation framework. We constructed an integrated framework that considers economic, environmental, social, cultural, and ecological factors and their contribution to urban ecological construction.
Methods: We used methods of subjective and objective empowerment, exploratory spatial data analysis, and the obstacle degree model to explore spatiotemporal variations in urban ecological construction.
Results: Our results showed that: (1) From 2006 to 2018, urban ecological construction in the Yellow River basin (YRB) exhibited a “polycentric” spatial differentiation pattern and a significant, gradually decreasing “center-periphery” spatial distribution trend. (2) High–high areas (with high agglomeration and high urban ecological construction) in the YRB are mainly distributed in Shandong Province and the adjacent regions, whereas low–low areas are mainly distributed in south–central Ningxia Province and southern Gansu Province. (3) Analysis of urban ecological construction characteristics across different city scales, functional types, spatial carriers, and basin locations shows that the urban ecological construction level is directly proportional to the scale of the city. The level of urban ecological construction is relatively higher in the Shandong Peninsula urban agglomeration, in the priority development area of the North China Plain, and in the downstream and right bank of the YRB. Spatial differences are mainly controlled by the net difference between regions from the upstream and midstream scales, as well as intra-regional differences between the left and right banks. (4) Marked differences can be observed in the obstacles to ecological construction in different types of cities.
Discussion: Typical barriers in cities in the YRB include the total water resources per capita, energy consumption per unit of GDP, the proportion of research and development investment in fiscal expenditure, the number of books in public libraries per 10,000 people, and land use efficiency. In the future, urban ecological construction should be based on the development conditions of each individual city, and should be improved according to local conditions to achieve the construction high-quality ecological cities.
1. Introduction
Ecological city is the ideal mode of urban ecological development. However, in order to ensure sustainable development, the city continuously demands various material resources from the natural ecosystem, which makes the ecological pressure continuously rise. The rapid development of economy and technology also accelerated the deterioration of the natural balance, resulting in great changes in the urban ecosystem (Burçak and Demet, 2016). With the acceleration of urbanization and industrialization in the world, a series of negative effects such as heat island effect, reduction of water system and loss of farmland (Neil and Marshall, 2015; Chen et al., 2020) have come one after another in recent years. People increasingly agree that the construction of eco-city has become one of the key countermeasures to deal with the global ecological crisis.
Urban ecological construction considers the theory and construction practices of ecological cities. It integrates goal-oriented, problem-oriented, and experience-oriented thinking and considers ecological city development from the perspectives of environmental construction, economic and ecological transformation, urban planning systems, cultural system construction, and spatial structure optimization (Faeth et al., 2011; Alexi and Romero, 2016; Burçak and Demet, 2016; Gong and Zhou, 2021). Against the backdrop of high-quality development, urban ecological construction improves the quality of ecological cities and promotes sustainable urban development. Research into the theory of ecological cities and urban ecological construction mainly concentrated in two aspects: firstly, researches were focused on the concept and framework, process and mechanism, theory and method evolution of eco-city, urban ecological construction and the relationship between man and land (Balland et al., 2020; Wang et al., 2021; Fan and Fang, 2022), secondly, the theory of ecological cities and urban ecological construction has led to the development of an index system based on economic–natural–social conditions or structural–functional–coordination dimensions (Jansson, 2013; Samuel et al., 2013). Such index systems have been used to record urban ecology in provinces (Dong et al., 2016), river basins (Tong and Guo, 2000), urban areas (Chen et al., 2020), and urban agglomerations (Li, 2019). Zhang et al. (2022) constructed an eco-city evaluation index system for global cities from the four aspects of urban system structure, function, coordination degree and well-being. Different from the general eco-city evaluation index system, this system marks global cities and covers all aspects of urban development. On this basis, it pays special attention to the well-being of urban residents and the satisfaction of their needs, meets the needs of the advanced development stage of super-large cities, and can better guide the ecological construction of domestic cities. Research has also recognized the importance of urban ecological construction in the correction of unsustainable and “non-ecological” urban construction. Specific methods for improving urban ecological construction consider intersections of economy–ecology, environment–ecology, social–ecology, space–ecology, and culture–ecology (Kaushal and Belt, 2012; Ramaswami et al., 2012; Neil and Marshall, 2015; Ren and Zhang, 2019; Xu et al., 2019). Although research into urban ecological construction has been conducted, several outstanding challenges remain. Although current index systems consider many social, economic, and environmental aspects, the indicators are typically too broad, making them difficult to apply in specific planning management and design practice. To achieve ecological civilization construction, high-quality economic development, the improvement of cultural soft power, and space governance, existing eco-city evaluation systems must be improved, particularly in the areas of space and culture. Previous research into urban ecological construction has mostly focused on one type of environment. The construction of a comprehensive “whole system” urban ecological construction framework can contribute to the timely adjustment of the goals and functional positioning of the construction of an ecological city.
The Yellow River basin (YRB) plays an important role in China’s economic and social development. Promoting ecological protection and high-quality development of the YRB has therefore become one of China’s key targets (Xi, 2019; Miao and Zhang, 2021; Ren and Du, 2021). Obstacles to achieving these targets include shortage of water resources, soil erosion, partial degradation of ecosystem structure and/or function, natural disasters (e.g., floods, droughts), and uncoordinated interaction between population and land use (Wang, 2020; Zhang and Miao, 2020; Liao and Du, 2021). Rapid urbanization and industrial development of the YRB are limited by both resource and environmental factors. The mismatch between the scale of development and the carrying capacity is among the main contradictions in the development and protection of the YRB (Fang, 2020; Wang et al., 2020; Li and Miao, 2022). Therefore, it is urgently necessary to explore strategies for sustainable development in this region. A new developmental concept has been proposed, whereby ecological protection and the high-quality development of the YRB emphasize “ecological priority and green development” and suggests urban ecological construction to be an important approach for achieving sustainable development (Ren and Du, 2021). This novel development concept is conducive to forming a scientific development model that meets the requirements of high-quality urban development and spatial governance. Additionally, it lays the foundation for governance of the YRB and helps formulate a sustainable development strategy that considers the spatiotemporal evolution of several factors.
On the basis of ecological protection and high-quality development, how to measure the urban ecological construction in the Yellow River basin, systematically classify the types of urban ecological construction, put forward the multi-dimensional path of urban ecological construction, and explore the “Yellow River experience” and “Yellow River model” of urban ecological construction has become an important topic facing the ecological protection and high-quality development in the Yellow River basin at this stage. In this study, firstly, we transformed existing large-scale evaluations of ecological cities into a more grounded framework for urban ecological construction. Through reconstructing the existing index system by considering economic, environmental, social, cultural, and spatial factors, we evaluated the urban ecological construction level based on case studies of cities along the YRB in 2006, 2010, 2014, and 2018. Secondly, considering significant environmental and developmental differences exist between the upper and lower reaches, left and right banks of the YRB, especially the development pattern of “three districts and seven groups” and the geographical division of the upper, middle and lower reaches, we systematically analyzed types of urban ecological construction in the region and assessed spatial variation and different sources of urban ecological construction. Finally, we used the obstacle factor model to propose a practical path toward urban ecological construction that is consistent with high-quality development of the YRB from a multi-dimensional perspective.
2. Research framework and index system construction
2.1. Research framework
Eco-city is an urban ecosystem with coordinated development of social, economic and natural dimensions and factors built according to ecological principles. It mainly studies the correlation between various elements of the system. Urban ecological construction deepens the theory of eco-cities by optimizing the associated theoretical and practical aspects. Urban ecological construction coordinates the economic, environmental, social, cultural, and spatial ecosystems of a city to achieve a stable and orderly state (Vergnes et al., 2012; Schewenius et al., 2014; Zhang et al., 2014; Fu and Liu, 2021). Based on steady economic growth, ecological and environmental protection, quality of life, guaranteed public services, cultural soft power, space structure optimization, and sustainable development goals, We considered that high-quality economic growth, green and safe ecological environment, livable and moderate living space, integrated culture and space are the five key dimensions needed to evaluate urban ecological construction, and their efficient combination will form a theoretical guiding framework (Figure 1).
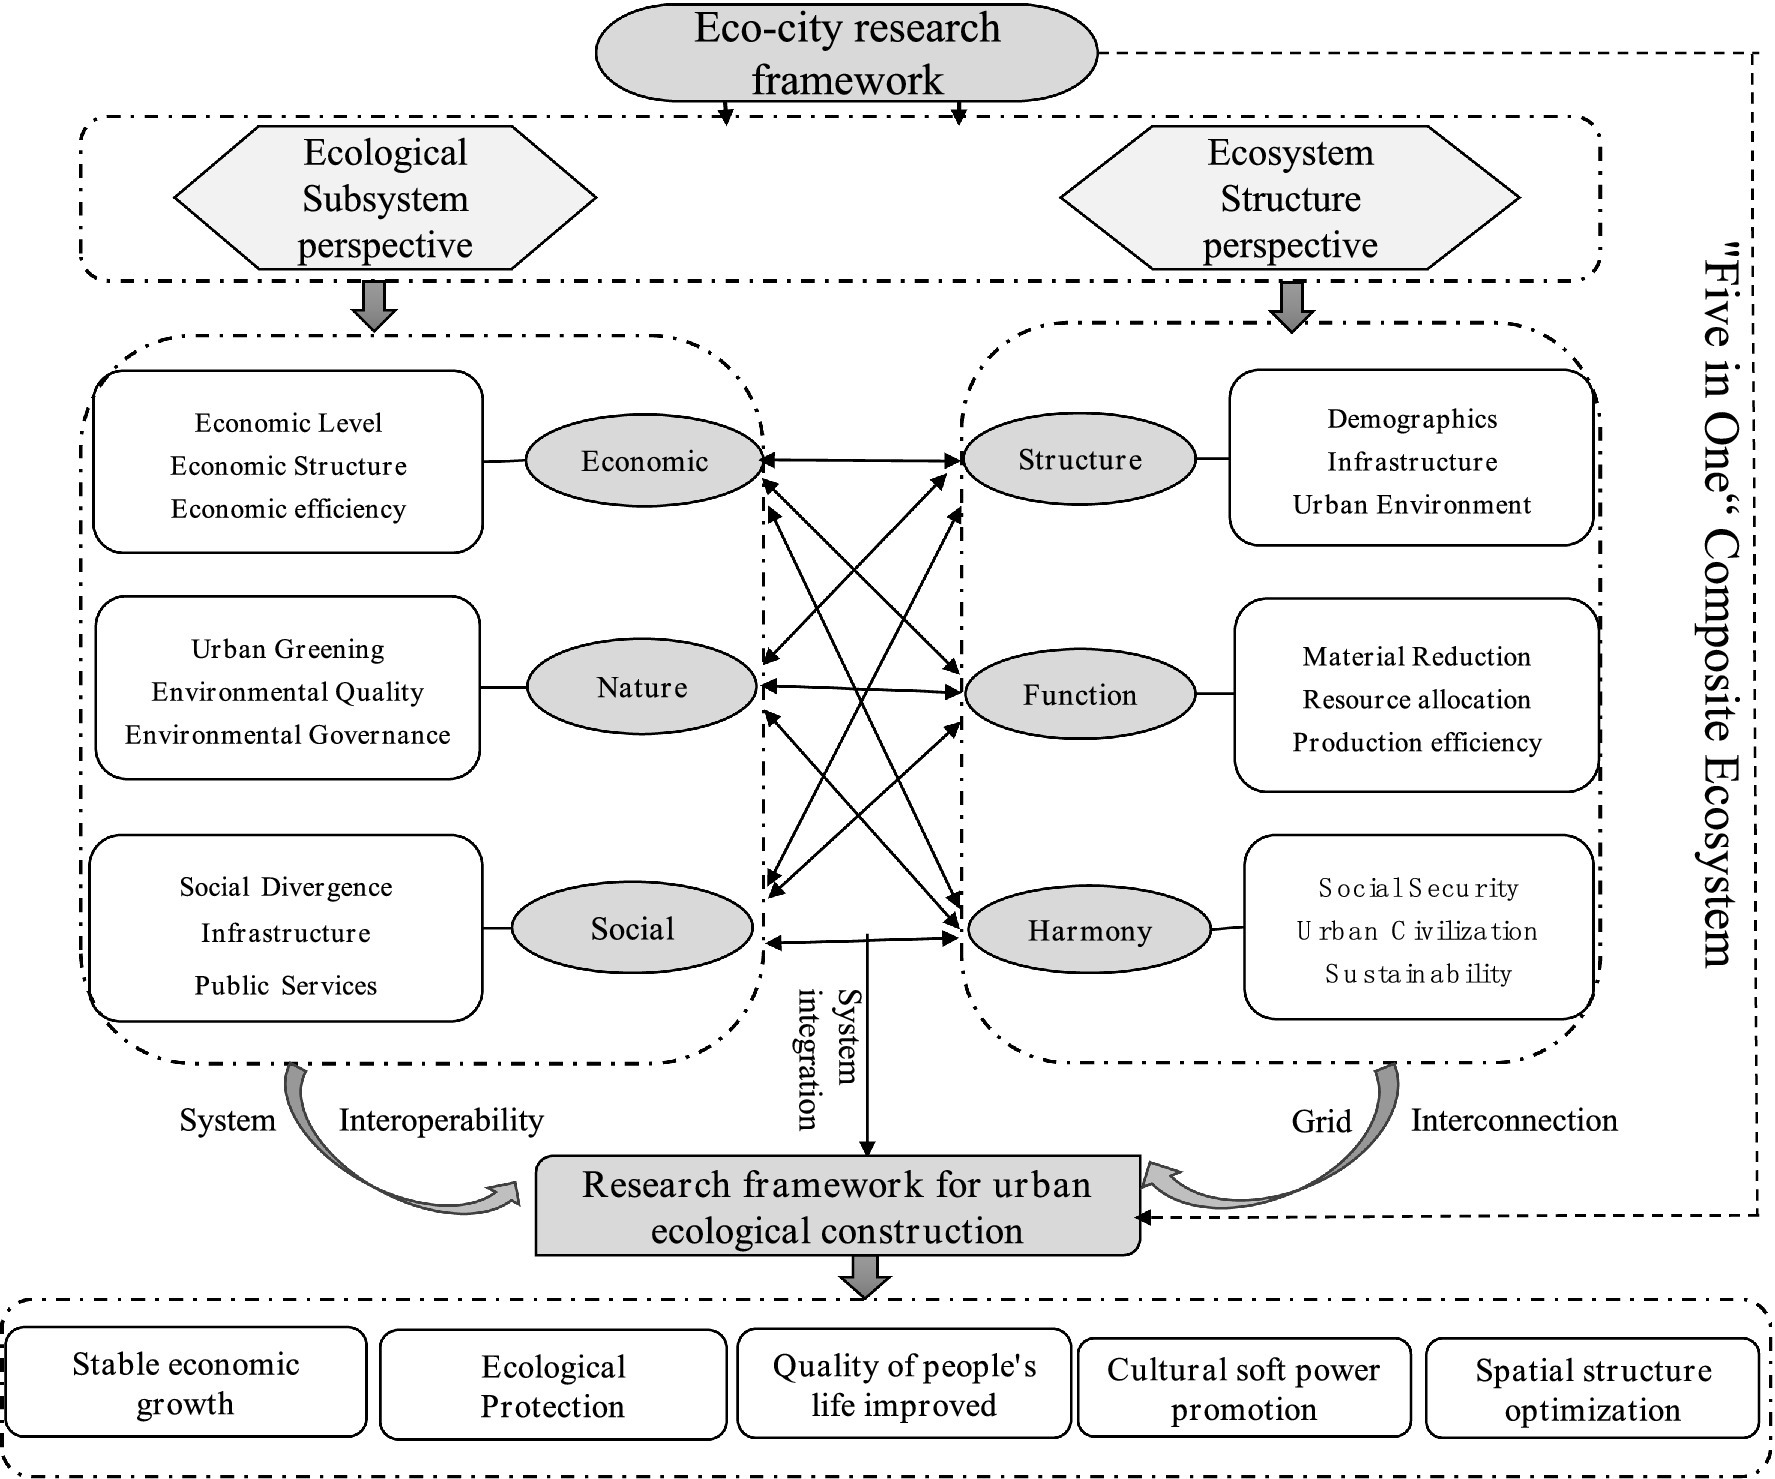
Figure 1. Framework for urban ecological construction.
2.2. Index system construction
We created an index system for the YRB based on the research framework and according to the scientific and systematic principles of urban ecological construction (Table 1). Economic ecology aims to develop both the economy and the ecology, thereby improving the sustainability of economic development. Economic ecology of the YRB emphasizes the coordination of economic growth and environment (Chen et al., 2020), and can be measured by energy consumption per unit of Gross Domestic Product (GDP) and research and development (R&D) input. Social ecology takes into account the need to satisfy the growing consumer demand, to improve the quality of life and the level of equality, and to optimize the supply structure of public services. The indicators of social ecology consider social equity and stability factors, such as the income difference between urban and rural residents, as well as living conditions. Environmental ecology characterizes the micro-construction levels of ecological restoration, pollution control, and resource utilization (Li, 2019). The ecological environment of the YRB includes resources, ecology, environmental protection, and governance. Factors used to assess the ecological environment include the total water resources per capita, the harmless treatment rate of household garbage, and the soil erosion index. Imbalanced cultural ecology is alleviated by strengthening cultural carriers and multicultural symbiotic coexistence (Chen, 2019; Zhan, 2021). The assessment index system we proposed therefore focuses on the construction of cultural carriers and input communication. The economic benefits generated by ecological construction are mainly reflected in the fact that it considers the role of “ecological guidance” in urban construction and development (Bo, 2019), and uses land use efficiency and landscape diversity indices as assessment dimensions.
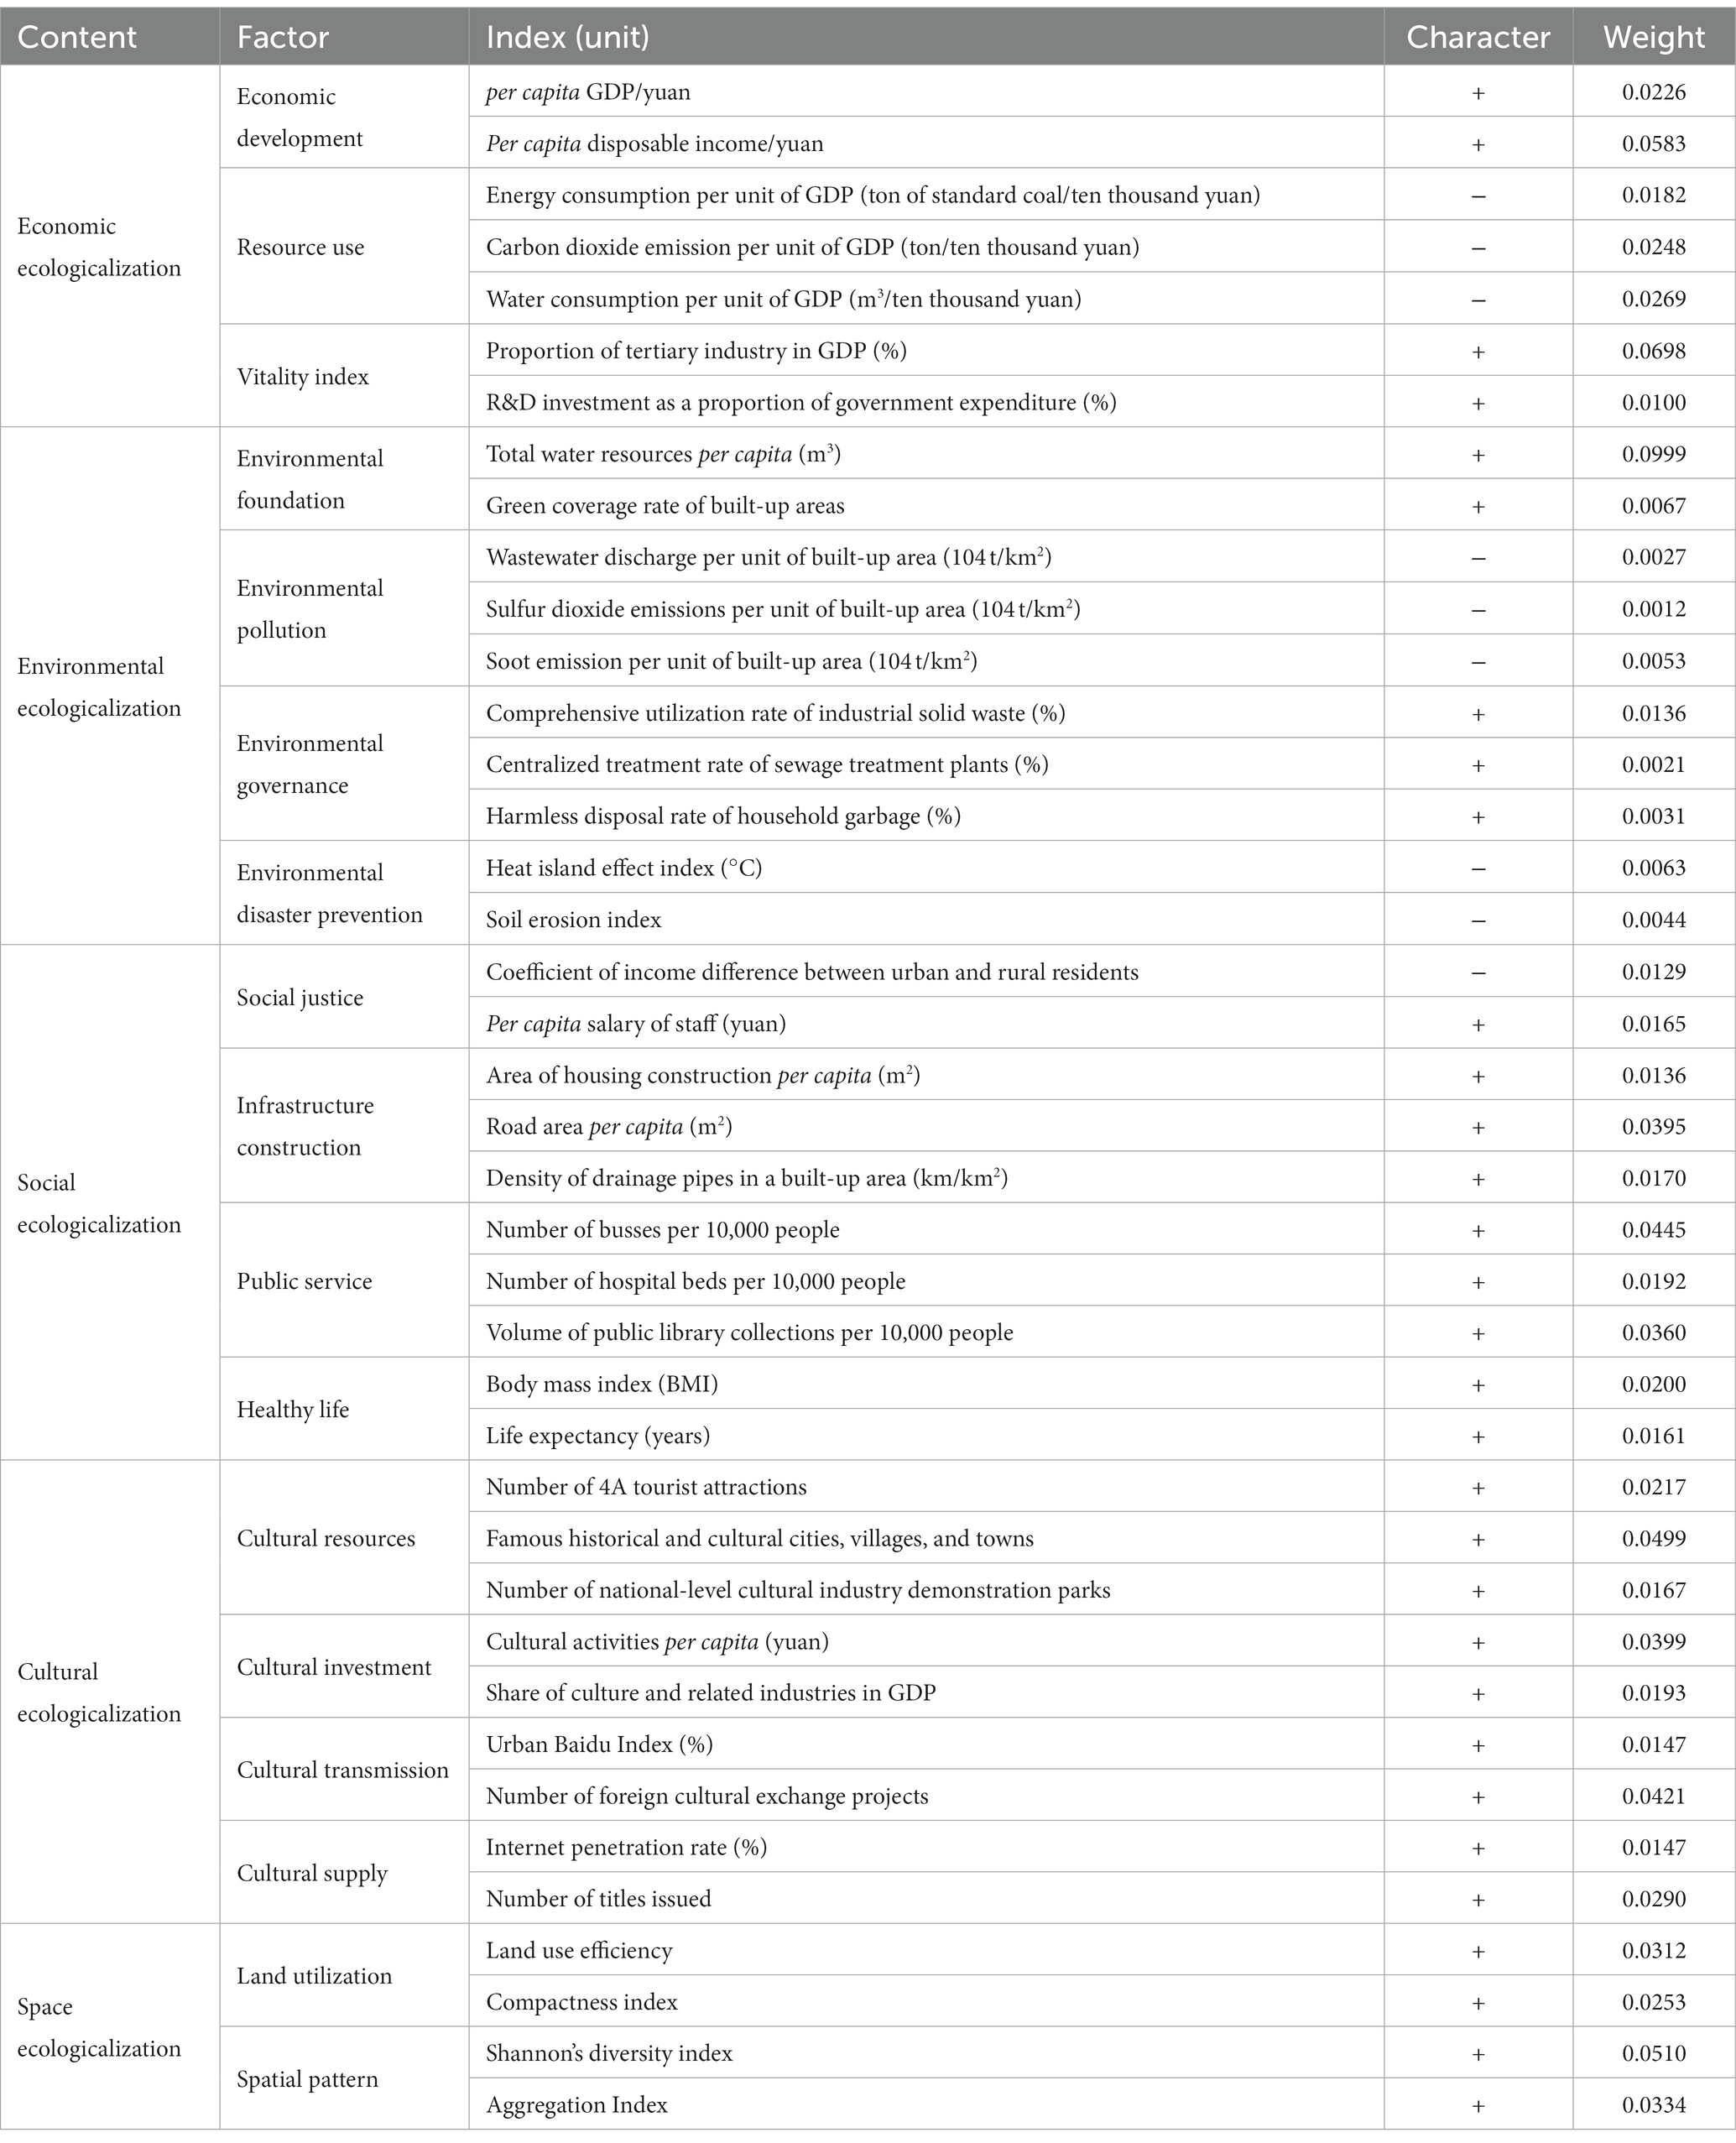
Table 1. Assessment index system indicating quality of urban ecological construction.
3. Methods and data
3.1. Research and data source
The YRB flows through nine provincial administrative units in Qinghai, Sichuan, Gansu, Ningxia, Inner Mongolia, Shanxi, Shaanxi, Henan, and Shandong. Because Sichuan province is included in the Yangtze River Economic Belt and eastern Inner Mongolia is closely connected to northeast China, Inner Mongolia has been included in the Northeast China Revitalization Plan (Xue et al., 2020). Here, we collated data from 79 cities in these regions.
Our data were mainly categorized into statistical and spatial data. Statistical data were obtained from the 2007–2019 China City Statistical Yearbooks, the China Statistical Yearbook on Culture and Related Industries, the China Water Conservancy Statistical Yearbook, and seven series of national historical and cultural data for villages and cities released by the Ministry of Construction and the State Administration of Cultural Heritage. The spatial data were obtained from the Geographic Information Bureau1 of the Chinese State Bureau of Surveying and Mapping, the Data Sharing and Service Portal by the Chinese Academy of Sciences,2 and the Socioeconomic Data and Applications Center at Columbia University.3 We used ArcGIS to extract the heat island and land use efficiency indices.
3.2. Methods
3.2.1. Calculation of ecological construction level of cities
The entropy weight method is a commonly used information-weighting method that can effectively overcome the disadvantages of subjective value assignment (Richard, 1987). We adopted the entropy weight method to measure the level of urban ecological construction, , in the YRB as follows:
where is a standardized value, is the weight of j indicators in the YRB, is the proportion of the i city in the index under the j index, is the entropy value of the j index, is the difference coefficient of the j index, m is the number of indicators, and n is the total number of research objects.
3.2.2. Nuclear probability density functions
The nuclear density estimation method, a method for non-parametric testing, was used to evaluate the unknown density function in probability theory. The method is advantageous in that it does not consider the influence of interval length, and thus yields results with excellent continuity. Therefore, this method is suitable for analyzing the temporal evolution of urban ecological construction in the YRB (Xu et al., 2019; Kaushal et al., 2012). The calculation formula is as follows:
where f(x) is the m density function estimated according to the value x1, x2,.., xn of the urban ecological construction level in the YRB, k is a kernel function, i is an area within the study area, and h is the bandwidth.
3.2.3. The exploratory spatial data analysis (ESDA) method
We used the ESDA method to test spatial correlation via global and local spatial autocorrelation analyses. We also used this method to analyze the spatial agglomeration status of the level of urban ecological construction in the YRB. We followed the specific calculation procedure outlined.
(1) Global spatial autocorrelation analysis. Global spatial autocorrelation reflects the correlation between a geographical phenomenon or an attribute value in a region and the same phenomenon in neighboring regions, so as to reflect the spatial distribution of geographical phenomenon or an attribute. In this paper, global spatial autocorrelation is used to analyze whether urban ecological construction in Shandong Province has spatial agglomeration characteristics. The calculation formula is as follows:
Where I is the Global Moran’I; n is the total number of cities; and is the mean value of the classification index of region y and region i, is the mean value of the classification index, is the weight matrix. The range of I is between [−1,1]. When I > 0, it means that the index is positively correlated and clustered in space. When I = 0, it means the index is randomly distributed in space. When I < 0, it indicates that the indicators are negatively correlated and anisotropic in space.
1. (2) Local spatial autocorrelation analysis. Local spatial autocorrelation analysis can measure the local spatial correlation between each region and the surrounding region. In this paper, Local Moran’s I is used to measure local spatial autocorrelation, and the formula is as follows:
Where represents the local spatial autocorrelation index; Zi and Zj are the standardized forms of observed values, respectively. Wij is the standardized spatial weight system matrix; is positive, indicating that adjacent units of the region belong to similar value cluster. is negative, indicating that the adjacent units of the region belong to the cluster of non-similar values. If is 0, the value of adjacent units in the region belongs to random distribution.
3.2.4. Dagum’s Decomposition of the Gini coefficient
The Dagum Gini coefficient measures the degree of spatial disequilibrium by performing a source or regional decomposition of the regional differences. Compared to the Theil index that only considers differences between the subsamples, the Gini coefficient fully considers the spatial distribution of the subsamples (Dagum, 1997). In this study, we used Gini coefficients established via the Shorrocks–Mukherjee decomposition method, whereby the regional population Gini coefficient, G, is calculated as follows:
where n is the number of samples in the group, is the mean of the samples in the group, and yi and yj are the urban ecological construction level of areas i and j in the YRB. The decomposition formula of the Gini coefficient is as follows:
where G is the overall Gini coefficient, which represents the overall spatial imbalance of urban ecological construction in the YRB, and are the sample number shares of groups k and h, and and are ratios of the average urban ecological construction level of group k and h to the average urban ecological construction level of all samples, and is the Gini coefficient of group k.
3.2.5. Establishment of obstacle diagnosis model
To design a more targeted strategy for improving the urban ecological construction level, we adopted the obstacle degree model to comprehensively measure the main constraints of the urban ecological construction level in the YRB. The specific calculation formulae are as follows:
and
where is the index deviation degree, is the factor contribution degree, is the standardized value of the individual index, and is the obstacle degree. Higher values reflect a greater impact of a given factor on the urban ecological construction level, indicating that they present a greater obstacle to ecological construction.
4. Results and analysis
4.1. Spatiotemporal evolution of urban ecological construction levels
4.1.1. Temporal trend evolution of urban ecological construction level
The entropy method was used to weight calculations for the index system so that scores for urban ecological construction level in the YRB from 2006 to 2018 could be obtained. We explored the trend using core density analysis in Stata (version 15.0). We obtained nuclear density estimates for urban ecological construction in the YRB from 2006 to 2018 (Figure 2). The peak of the nuclear density curve shifted from 0.33 in 2006 to approximately 0.48 in 2018, Showing a remarkable growing “long tail” on the right. The speed of the kernel density curve increased after 2014, indicating that cities with low levels of urban ecological construction exhibit a “catching up effect.” We found that the level of urban ecological construction in the YRB increased significantly in this time period. The nuclear density value decreased from 2006 to 2010, and increased after 2010. A particularly strong increase in nuclear density was observed from 2010 to 2014. In addition, the peak center tends to the right side, with most cities’ ecological construction level ranging from 0.3 to 0.5, and some cities with higher ecological construction level reaching more than 0.6, indicating that the absolute difference in urban ecological construction between 2006 and 2010 increased, but the absolute difference decreased after 2010. A single peak was observed in the nuclear density curve for 2006–2018 in a certain time range, and the nuclear density curve range exhibited a downward trend. This showed that differences in ecological construction level between cities in the YRB decreased, and no characteristics indicative of polarization were found.
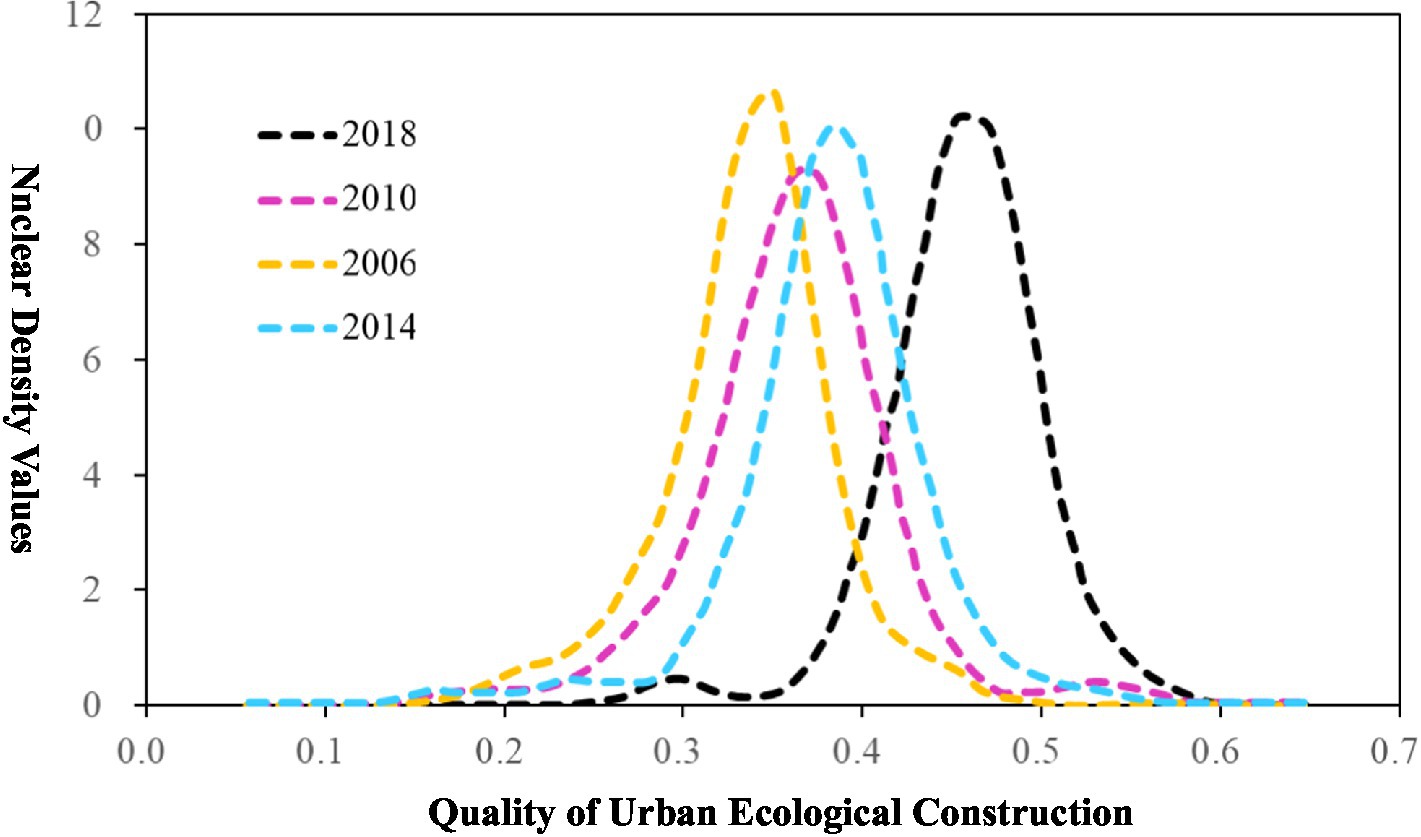
Figure 2. Kernel density estimation of quality of urban ecological construction in the Yellow River basin.
4.1.2. Spatial analysis of urban ecological construction level
We analyzed spatial patterns of urban ecological construction in the YRB. ArcGIS10.3 was used to create a map of the level of urban ecological construction in various time periods (Figure 3). We used the natural breakpoint method to categorize the levels of urban ecological construction into five levels: highest level, higher level, medium level, lower level and lowest level.
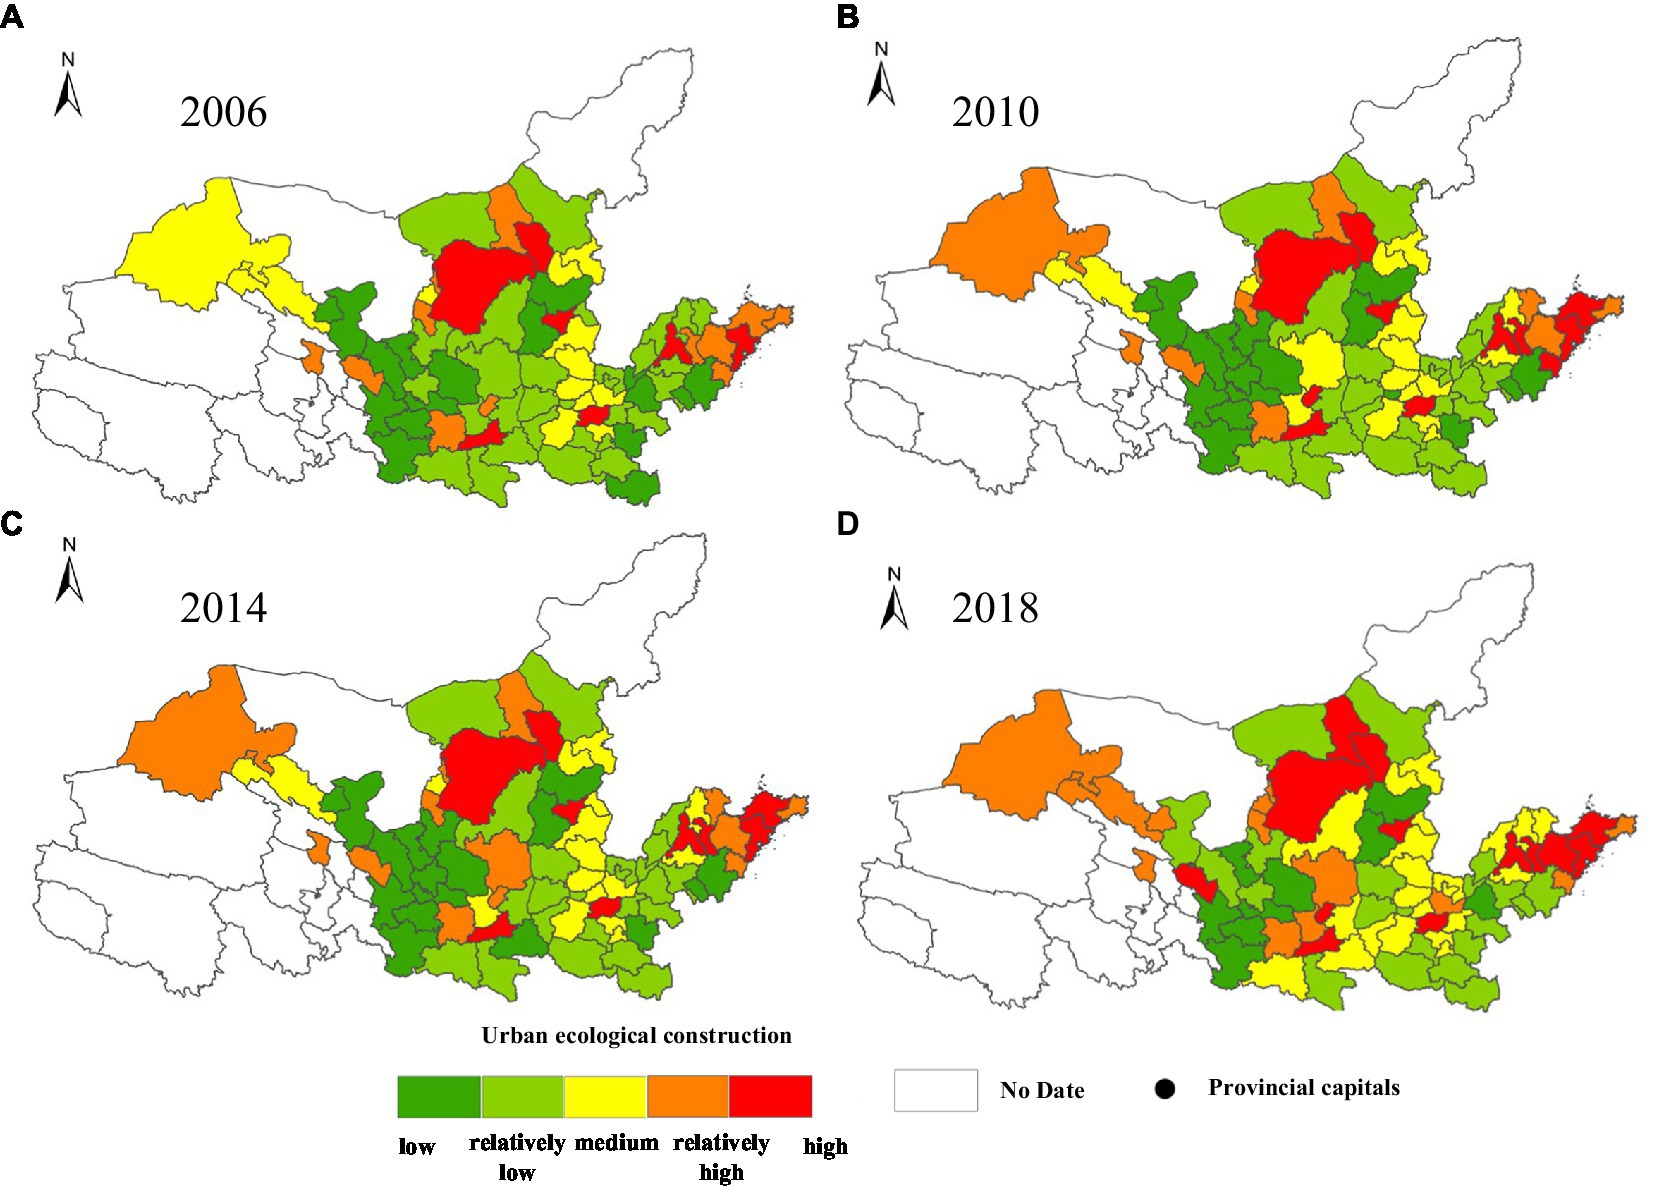
Figure 3. Spatial distribution of quality of urban ecological construction in the Yellow River basin.
As shown in Figure 3, urban ecological construction in the YRB is high in the Yinshan Mountains, Taihang Mountains, Qinling, and the North China Plain. The mountains form an area of increased ecological construction value, compared with a decreased ecological construction level in the center of the region. In 2006, highest level of urban ecological construction were mainly concentrated in the middle and lower reaches of the YRB. The areas of Jinan, Qingdao, Zhengzhou, Taiyuan, and Hohhot formed a “bulge” in urban ecological construction. Lowest levels of urban ecological construction were mainly concentrated in the middle of the YRB in the cities of Xinzhou, lvliang, Guyuan, Pingliang, Tianshui, Dingxi, and Longnan, forming a “collapse” in urban ecological construction. Cities at a lower level (31) and lowest level (18) accounted for 22.78 and 39.24%, respectively. The spatial distribution of urban ecological construction in the YRB in 2010 and 2014 was similar to that in 2006, with an increase in both highest level and medium level cities, which were mainly distributed in Shandong Province and Shaanxi Province. Lowest level cities were mainly distributed in western Gansu Province and Shanxi Province. The level of urban ecological construction in southeastern Henan Province improved significantly. In 2018, cities with highest level and higher level increased. These cities were mainly distributed around Jinan–Qingdao, Hohhot, Zhengzhou, and Xi’an, and low-level cities in particular were mainly distributed in the southern part of Gansu Province. In general, from 2006 to 2018, the proportion of cities with lower levels of ecological construction in the YRB decreased, while the proportion of middle level cities increased significantly. Cities with medium or above level of urban ecological construction are mainly distributed in the middle and lower reaches of the YRB, and the proportion of cities increased significantly.
4.1.3. Spatial agglomeration analysis of urban ecological construction level
(1) Global spatial auto-correlation analysis.
To explore the global spatial agglomeration characteristics of urban ecological construction in the YRB, we used ArcGIS (version 10.3) to perform spatial auto-correlation tests across 79 cities in the YRB and obtain Moran’s I index values. The results showed that the Moran’s I index of urban ecological construction in 2006, 2010, 2014, and 2018 were 0.2076, 0.1857, 0.2356, and 0.34014, respectively. These results showed that the spatial agglomeration characteristics of urban ecological construction in the YRB were statistically significant. This indicated a mutual influence between adjacent cities, i.e., cities with high ecological construction levels are adjacent, as are those with low ecological construction levels.
(2) Local spatial auto-correlation analysis.
Figure 4 shows cities with both high agglomeration and high levels of ecological construction (High–High areas) and cities with low agglomeration and low levels of ecological construction (Low–Low areas). In 2006–2018, urban ecological construction in High–High areas was focused in Shandong Province. The Shandong Peninsula hosts the only mature urban agglomeration along the Yellow River. This agglomeration had good resource endowment, an advantageous location, a good economic foundation, and relatively close urban cooperation that allows the effect of ecological construction to radiate to adjacent cities and form a continuous and efficient spatial mode. In 2010–2018, Low–Low agglomeration areas were concentrated in the central and southern part of Ningxia Province and the southern part of Gansu Province. Geological disasters occur frequently in the region, resulting in a fragile ecological environment. Furthermore, reduced levels of urban ecological construction result in low levels of economic income and expenditure, living conditions, culture, infrastructure, public services, social security, environmental quality, and organizational management. The High–High areas in 2006–2018 were mainly distributed in the lower reaches of the YRB, whereas the Low–Low agglomeration areas were mainly distributed in the upper reaches of the YRB.
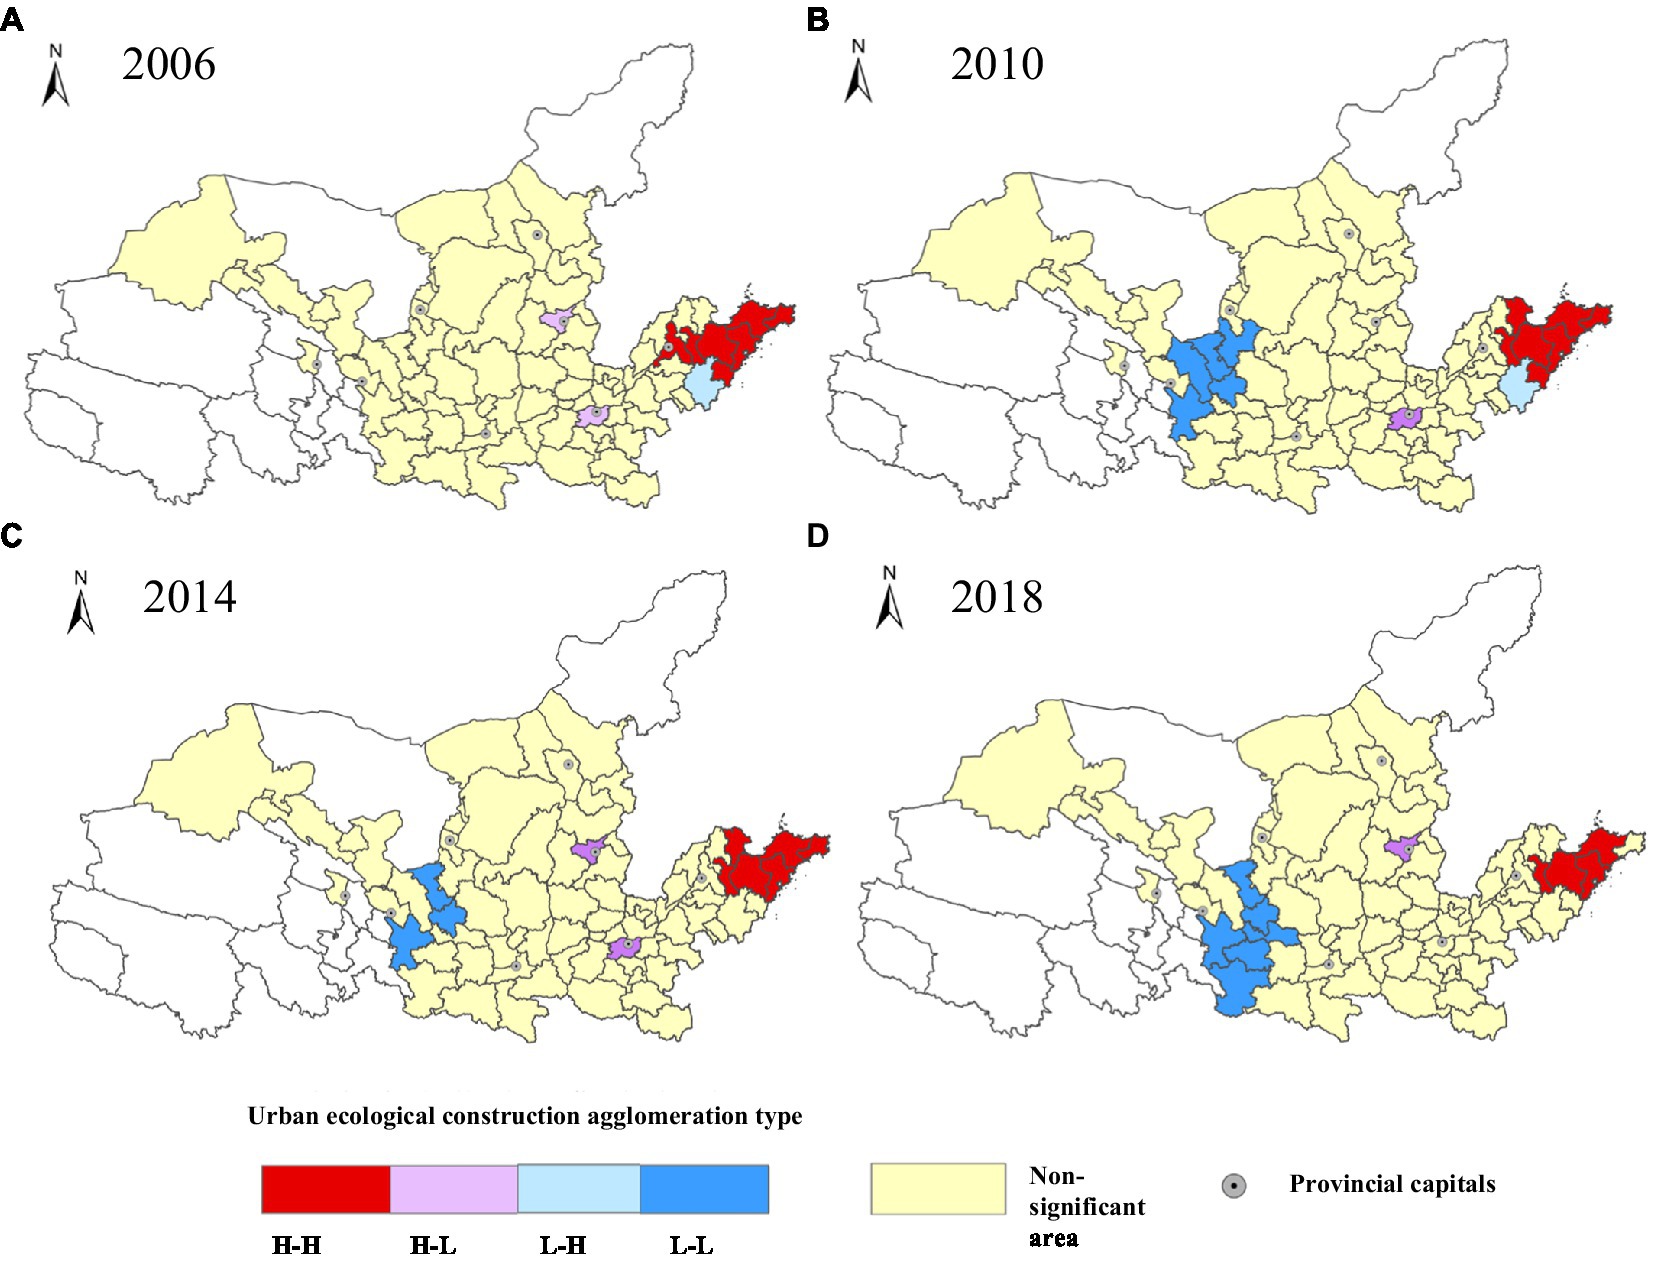
Figure 4. LISA map showing the quality of urban ecological construction in the Yellow River basin.
High–Low areas refer to cities with high levels of ecological construction but low levels of agglomeration, while Low–High cities have low levels of ecological construction and high levels of agglomeration. From 2006 to 2018, the High-Low agglomeration cities are located in the provincial capitals of Zhengzhou and Taiyuan. In the central region, which is relatively backward in development, Zhengzhou and Taiyuan have absorbed more talents, resources and capital in the region, and the resulting “siphoning phenomenon” makes their own urban ecological construction level higher. From 2006 to 2010, Linyi City was an Low–High area. Although Linyi city has general location conditions and has a weak foundation for development, it is located close to cities with high levels of ecological construction such as Rizhao, Zibo, and Tai’an, and is in the “low-lying land” of the siphon phenomenon. Overall, High–Low areas in 2006–2018 were mainly distributed in Henan Province and Shanxi Province, while the Low–High areas were mainly distributed in Shandong Province.
4.1.4. Evolution of urban ecological construction level in various city types
(1) Level of urban ecological construction across different city sizes.
We analyzed the level of urban ecological construction across different types of urban centers. Owing to the small number of megacities (i.e., provincial capitals) and metropolitan areas (i.e., sub-provincial cities), we considered the following types of urban center: Type I or above big cities, Type II large and medium-sized cities, and Type I small cities. Cities classified as Type I or above typically showed greater average values of urban ecological construction (Figure 5A). Average values for urban water ecological construction in 2006, 2010, 2014, and 2018 were 0.5172, 0.5387, 0.5793, and 0.5933, respectively. In Type II big cities, average values for urban water ecological construction were 0.2970, 0.3457, 0.3668, and 0.4513. Type II medium-sized cities typically exhibited lower average values for urban water ecological construction of 0.2323, 0.3039, 0.3149, and 0.4233, respectively. Small Type I cities exhibited the lowest average values for urban water ecological construction of 0.2500, 0.2967, 0.3141, and 0.4744, respectively. The level of urban ecological construction was directly proportional to the type of city. This is because city-scale expansion results in agglomeration of various social resources; thus, economic volume is linked to the level of urban ecological construction. The scale effect is also evident in small-scale cities, where measures are difficult to implement and the level of urban ecological construction is improved slowly.
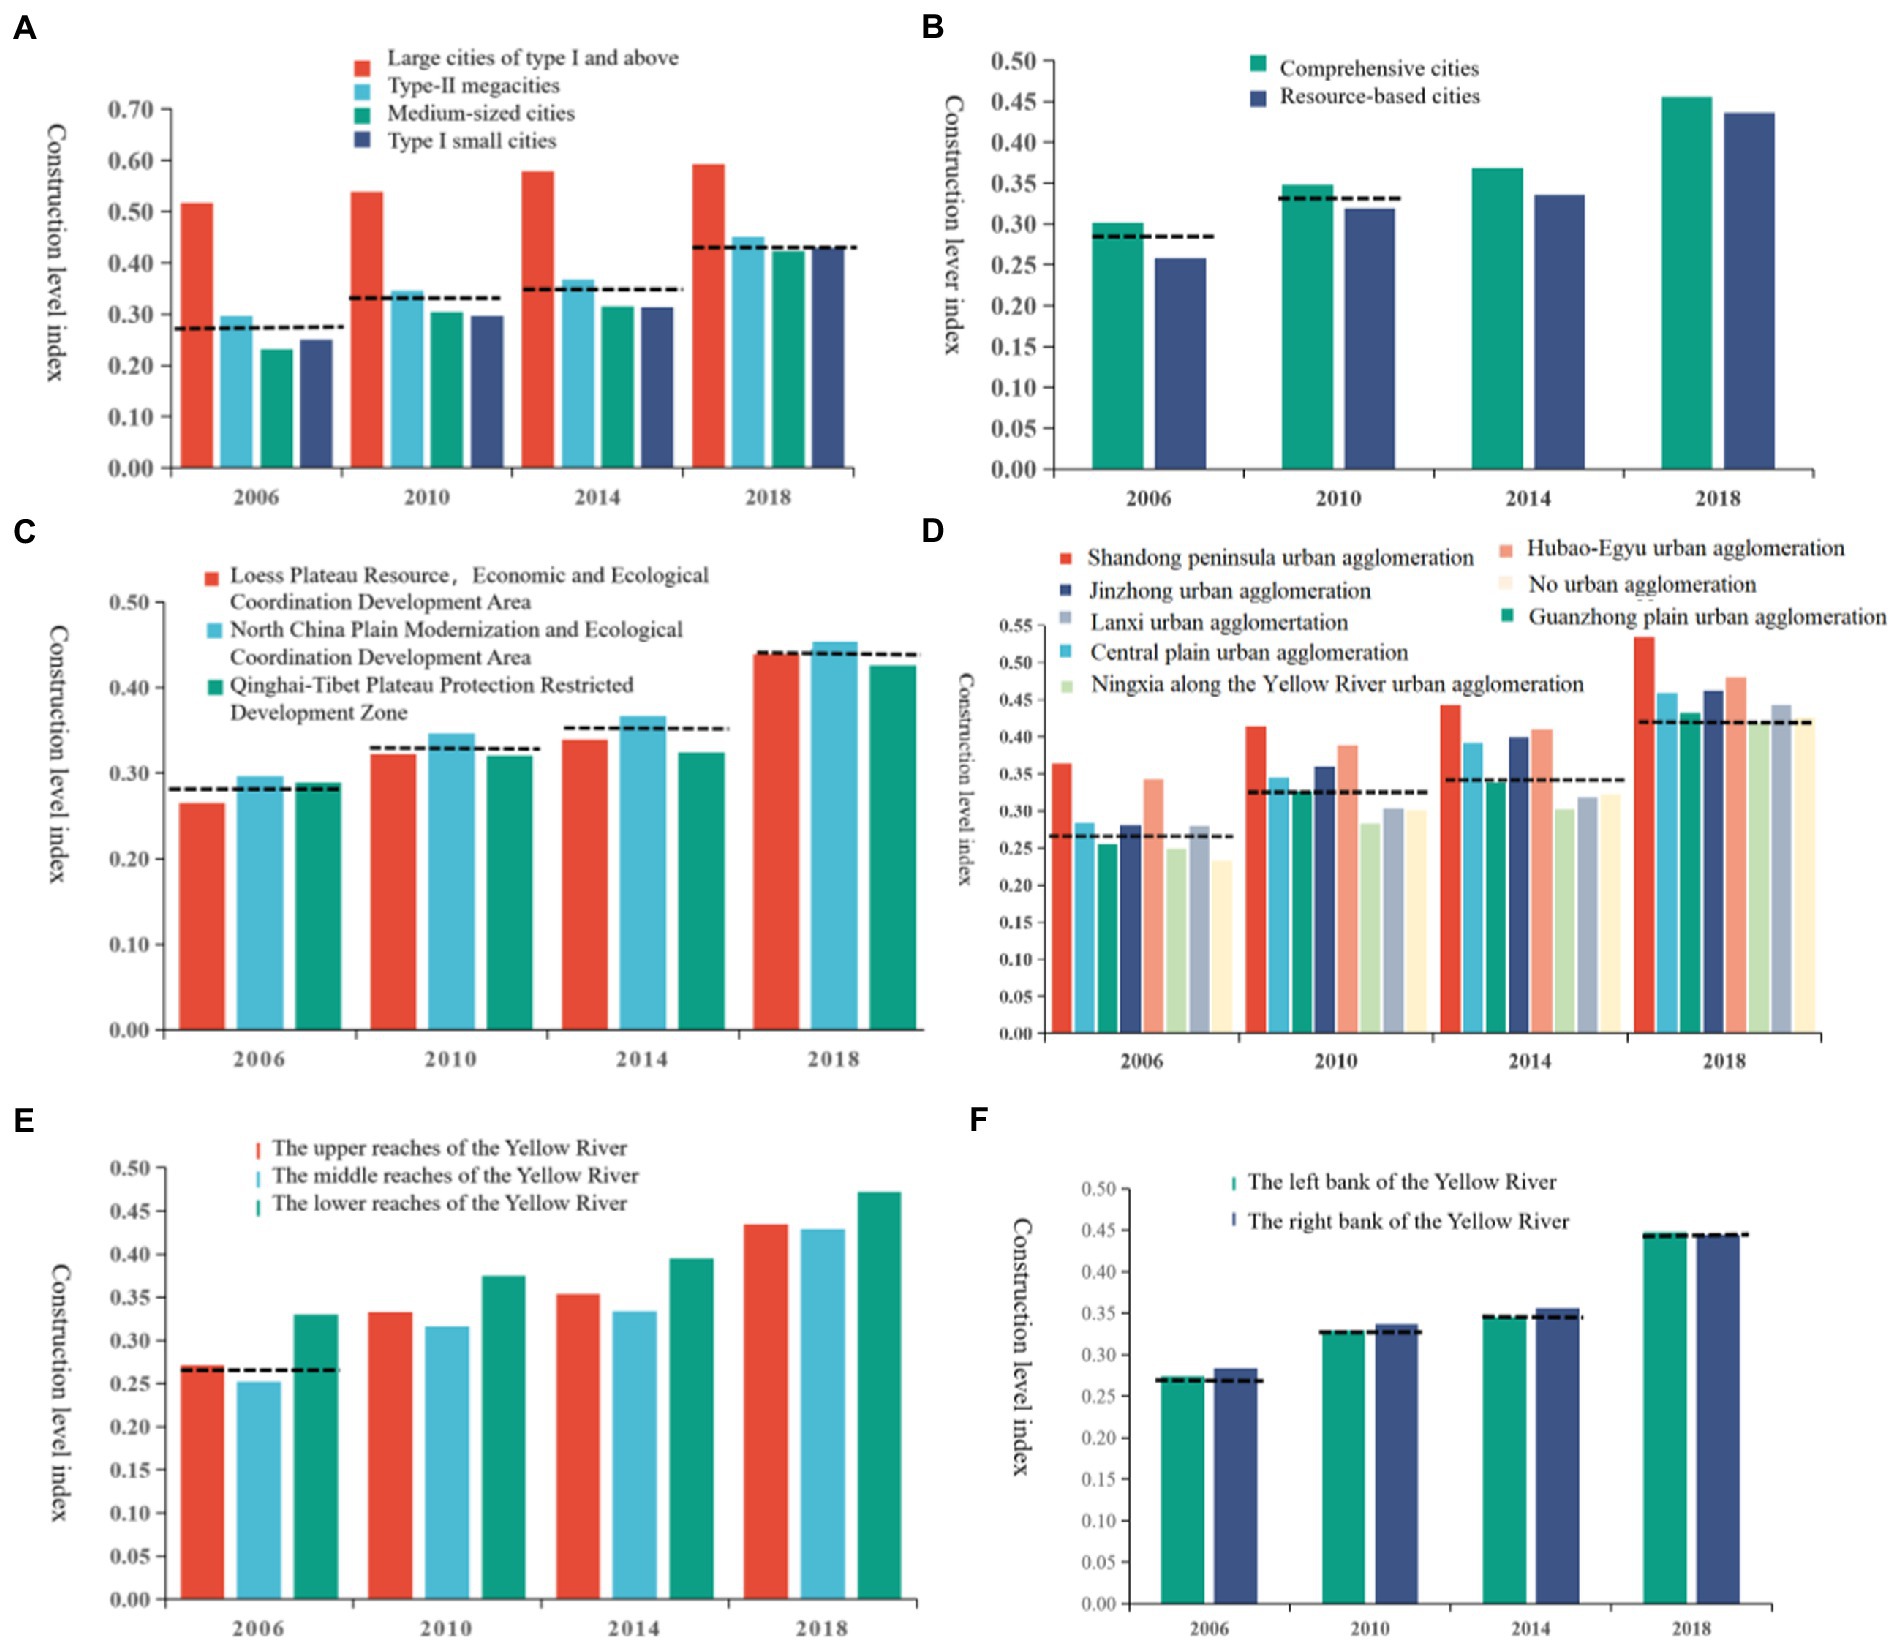
Figure 5. Ecological construction levels for various categories of cities in the Yellow River basin. A: urban ecological construction level of different scale cities; B: urban ecological construction level of different functional types of cities; C: urban ecological construction level of “three areas”; D: urban ecological construction level of “seven urban agglomerations”; E: urban ecological construction level of upper, middle and lower reaches of the Yellow River Basin; F: urban ecological construction level of the left and right bank of the Yellow River Basin. Dashed line shows data for average value of ecological construction in all dimensions in the Yellow River Basin.
(2) Level of urban ecological construction across different city function.
As per the National Sustainable Development Plan for Resource-based Cities (2013–2020), we divided the cities in the YRB into 40 resource-based cities and 39 comprehensive cities. Statistical analysis of the average urban ecological construction for each type of urban center (Figure 5B) showed that the average ecological construction level of comprehensive cities in 2006, 2010, 2014 and 2018 was 0.3016, 0.3483, 0.3688 and 0.4559, the average ecological construction levels of resource-based cities are 0.2577, 0.3191, 0.3352 and 0.4359, indicating that integration of urban functions is necessary to improve urban ecological construction. Structural analysis showed that the advantages of functional comprehensive cities are mainly reflected in the ecological industry and spatial structure rationalization.
(3) Level of urban ecological construction across different spatial carriers.
Based on the construction of a coordinated development pattern for “three districts and seven groups” in the YRB (Jin, 2019), we discuss the characteristics of the urban ecological construction level of different spatial carriers.
The “three districts” refer to the protection and restriction development zone of the Qinghai–Tibet Plateau, the coordinated zone of economic development and ecological and environmental protection of the Loess Plateau, and the modern and high-quality upgrading of and the coordinated development zone of the North China Plain. Combining results for ecological construction levels from the YRB and the three regions (Figure 5c) showed that in 2006–2018, the North China Plain had the highest levels of urban ecological construction water, followed by the average level across the YRB, followed by the Loess Plateau, and finally the Qinghai–Tibet Plateau. The North China Plain was found to have excellent economic, environmental, and cultural ecological construction, while the Qinghai–Tibet Plateau showed excellent performance in social ecological construction, owing to the large and sparsely populated land and the high ownership of public goods per capita. Variation in the level of ecological construction between the three regions is related to characteristics of the natural environment in the YRB and the regional problems associated with its protection and development.
The “seven groups” refer to urban agglomerations of the Shandong peninsula urban agglomeration, Central Plains urban agglomeration, Guanzhong plain urban agglomeration, Jinzhong urban agglomeration, Hubao Eyu urban agglomeration, Ningxia along the Yellow River urban agglomeration and Lanxi urban agglomeration. We combined results of urban ecological construction level from the YRB and these seven urban agglomerations (Figure 5d). Our results showed that ecological construction levels were higher in the mature YRB urban agglomerations in 2006–2018. The urban ecological construction levels in this region were higher than those in the rapidly developing Hubao Eyu urban agglomeration, Jinzhong urban agglomeration, Central plains Urban Agglomeration, Guanzhong plain urban agglomeration, Ningxia urban agglomeration, and Lanxi urban agglomerations, where the average ecological construction level was low. Further subdivision of the indicators revealed that, compared with non-urban agglomerations, the advantages of urban agglomerations are mainly reflected in the ecological construction of economic, social, cultural and spatial dimensions, and there is still room for improvement in both environmental and ecological construction. Taking the Ningxia urban agglomeration, which is located along the Yellow River, as an example, the proportion of secondary industries is 53.17%, most of which are heavy industries. The level of environmental and ecological construction is relatively low. This shows that the degree of development of an urban agglomeration is one of the main spatial carriers of urbanization and affects the level of urban ecological construction. A higher degree of development results in higher levels of urban ecological construction.
(4) Level of urban ecological construction across different watershed locations.
In the new stage of high-quality development, governance of the environmental, ecological, and social conditions of the YRB requires both upstream and downstream coordination, as well as coordination between the left and right banks. Based on the different scales of “upstream, middle and downstream, left and right banks” (Zhao et al., 2021), we analyzed the levels of urban ecological construction in different watershed locations.
We conducted statistical analysis of the urban ecological construction level in the upper, middle, and lower reaches of the YRB (Figure 5E). From 2006 to 2018, the average level of urban ecological construction in the upper reaches of the YRB was higher than that in the middle and lower reaches. Moreover, we found a higher level of urban ecological construction on the right bank than on the left (Figure 5F), exceeding the average value of urban ecological construction in the YRB.
4.2. Measurement analysis of regional differences in urban ecological construction level
Through analysis of the level of urban ecological construction, we found that urban ecological construction is regionally imbalanced. We used MATLAB (version 2018) to calculate the Dagum Gini coefficient. Additionally, we studied regional differences between the middle and lower reaches of the YRB to reveal the size and source of urban ecological construction.
Decomposition of the Gini coefficient for urban ecological construction in the upper, middle, and lower reaches of the YRB is shown in Table 2. The Gini coefficient showed an overall downward trend from 2006 to 2018, indicating an obvious effect of coordinated development between cities, which promoted the gradual narrowing of regional differences. The average Gini coefficient for the lower reaches of the YRB during the study period (0.0572) was higher than that for the upper (0.0312) and middle reaches (0.0423). This indicated that the imbalance in urban ecological construction in the lower reaches of the YRB is higher than that in the middle and lower reaches. From the perspective of regional difference contribution rate, the rate of inter-group difference contribution is highest, followed by the rate of intra-group difference contribution and supervariable density contribution, intra-group difference contribution rate had a small overall change range from 2006 to 2018, and inter-group difference contribution rate showed an upward trend from 40.63 to 44.20% from 2010 to 2018. The contribution rate of supervariable density decreased from 25.50 to 23.55% during 2010–2018.
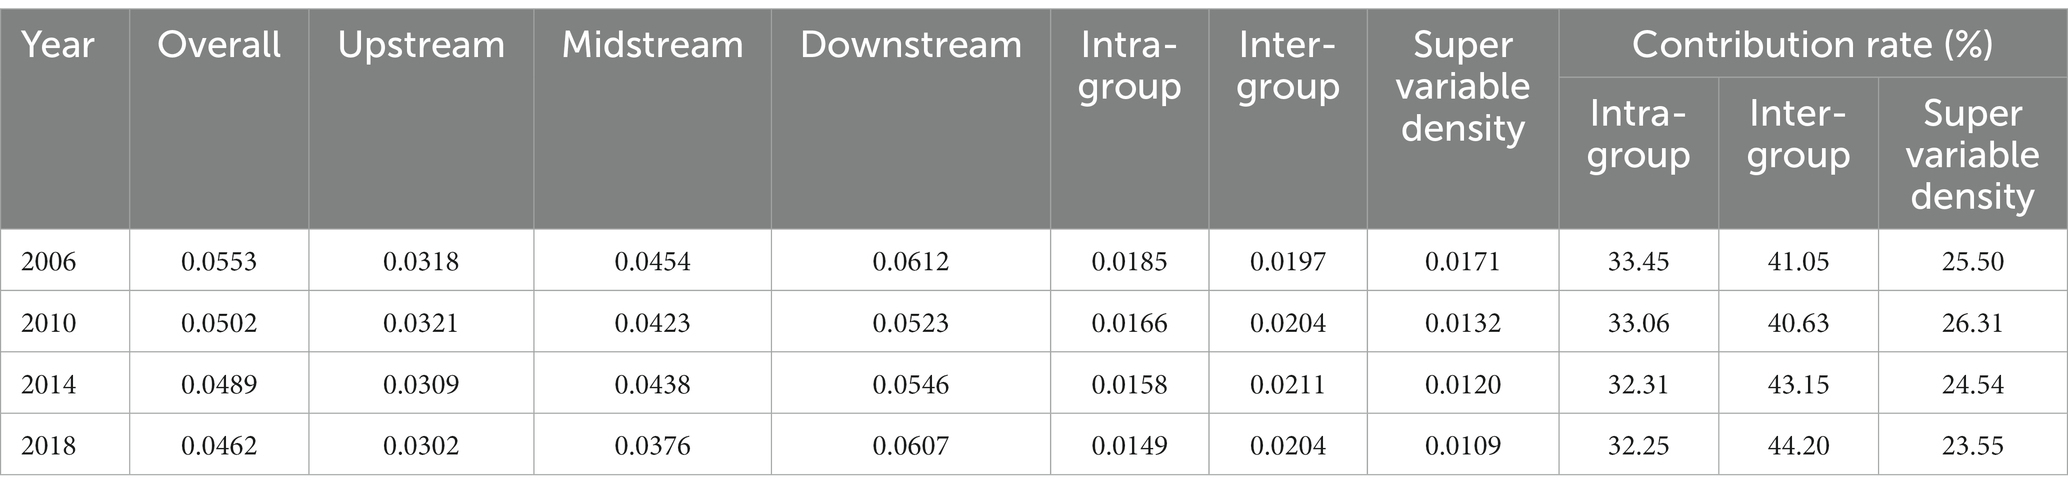
Table 2. Dagum Gini coefficient decomposition for ecological construction levels in the upper, middle, and lower reaches of the Yellow River basin.
Decomposition of the Gini coefficient for urban ecological construction of the left and right banks of the YRB is shown in Table 3. Overall, the Gini coefficient of urban ecological construction on the left bank is slightly higher than that on the right bank, indicating a higher imbalance of urban ecological construction on the left bank. The regional differential contribution rate within the group was comparable to that of the hypervariable density, which was significantly higher than that of the contribution rate between the groups. From 2006 to 2018, the differential contribution rate within groups showed an overall upward trend, rising from 43.73 to 49.57%. The contribution rate of supervariable density changed slightly, and the differential contribution rate between groups decreased from 9.22 to 3.89%.
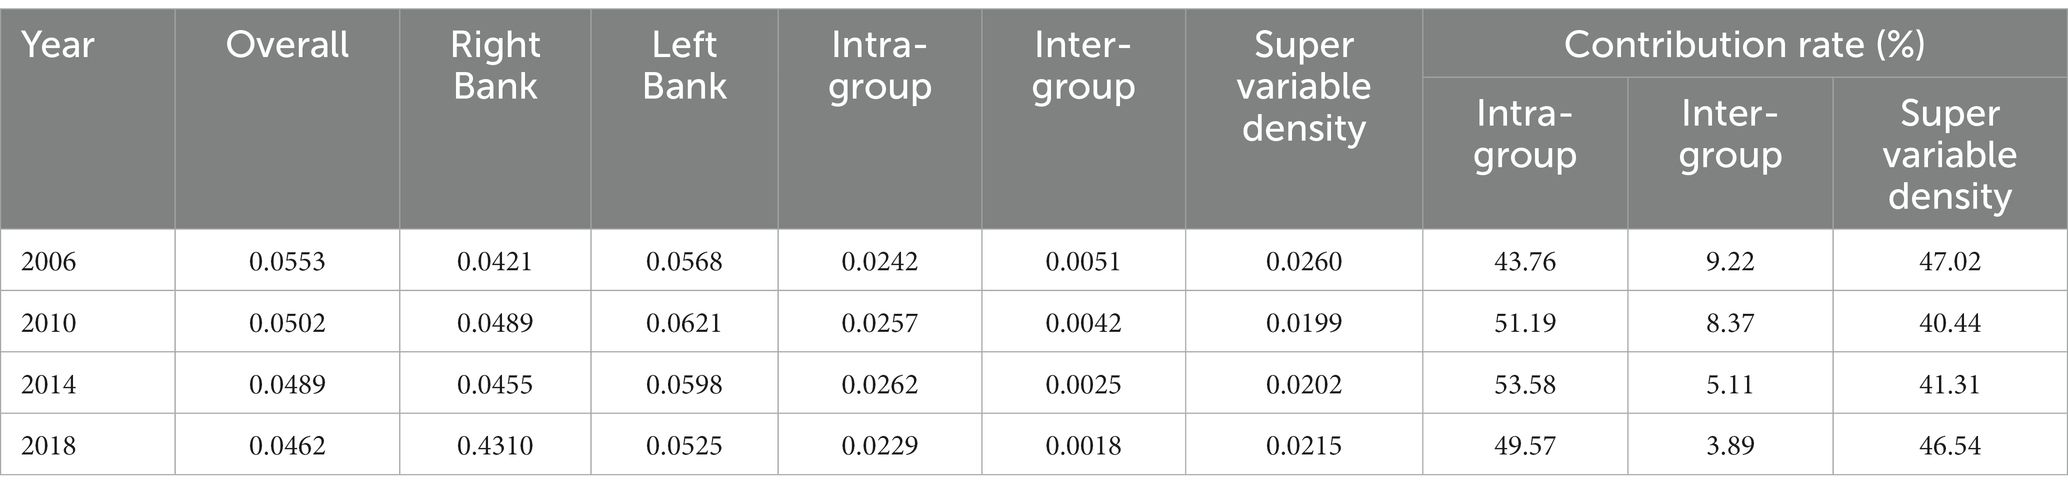
Table 3. Dagum Gini coefficient decomposition for ecological construction levels in the left and right banks of the Yellow River basin.
Comparative analysis of the research results, from the perspective of intra-regional difference, the intra-group difference of the left and right banks of the YRB is higher than that of the upper, middle and lower reaches of the YRB. From the perspective of inter-regional difference, the inter-group difference of the upper, middle and lower banks of the YRB is higher than that of the left and right banks of the YRB. From the perspective of regional difference contribution rate, the intra-group and inter-group contribution rate of the upper, middle and lower reaches of the YRB is higher. In conclusion, the difference between the upper, middle and lower reaches of the region contributes the most to the regional imbalance of urban ecological construction in the YRB.
4.3. Diagnosis of obstacle factors for urban ecological level
The obstacle degree model was used to identify obstacles to ecological construction in 79 cities in the YRB. Based on the study by Xu et al. (2019), the main obstacle factors of ecological construction in each city were determined according to the principle of more than 10% obstacle levels. The mean results of the obstacle degree analysis for all cities in the YRB from 2006 to 2018 are shown in Figure 6.
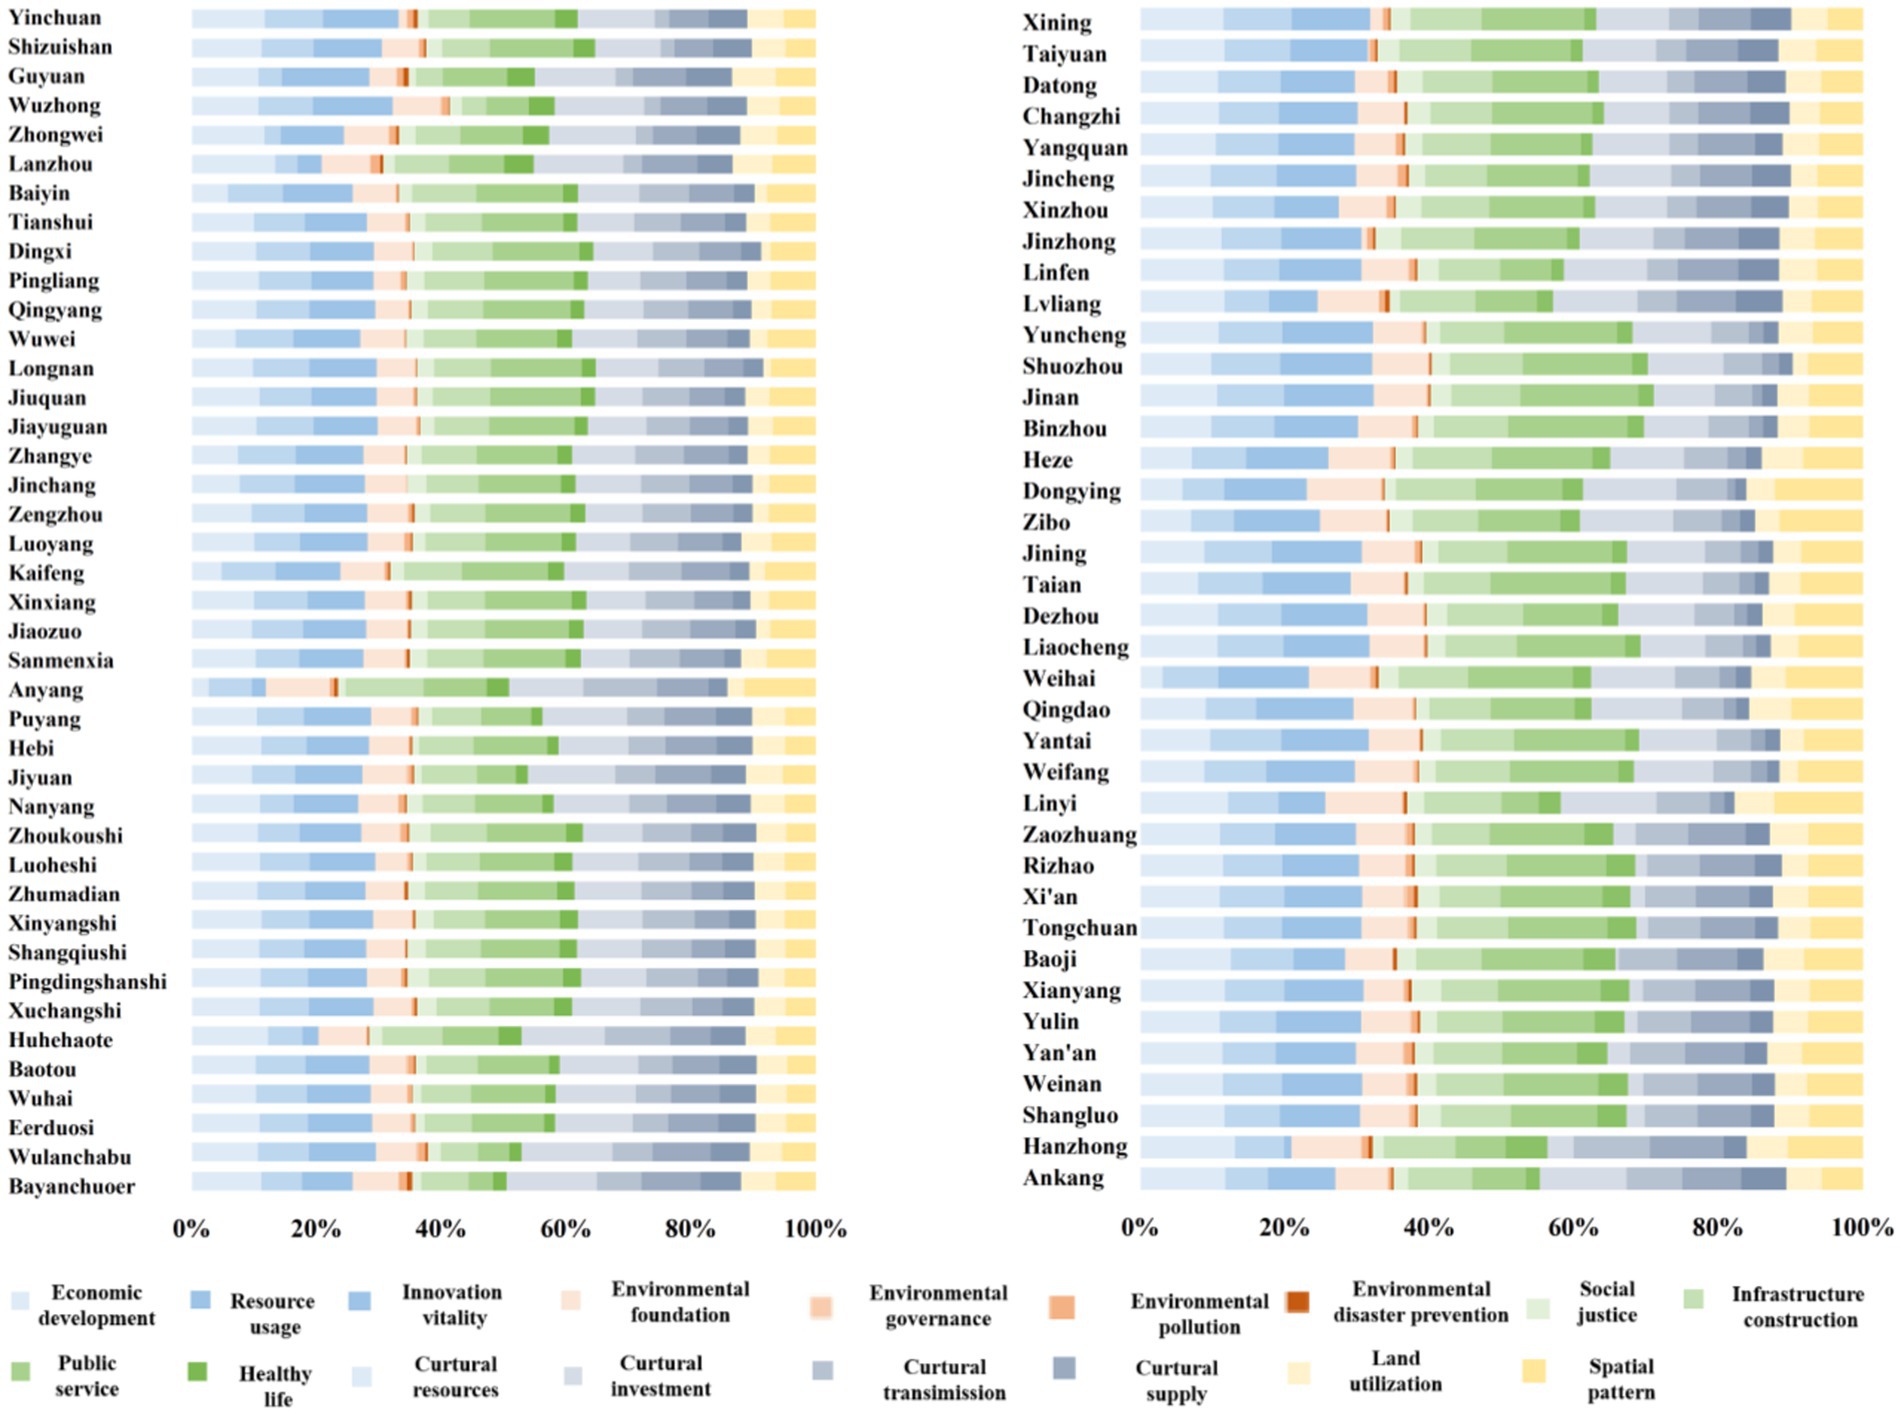
Figure 6. Obstacle degree of main obstacle factors in the index for assessing quality of urban ecological construction in the Yellow River basin, expressed as percentages.
We identified environmental foundation, economic development, innovation vitality, and land use as the main obstacles to ecological construction in most cities in the YRB. Furthermore, we identified that the obstacles accounting for the largest proportion in the indicator layer are, in order, total water resources per capita, disposable income per capita, R&D investment as a proportion of fiscal expenditure, and land use efficiency. The obstacle degree values of resource use, public service, cultural input, spatial pattern, and infrastructure are also large, mainly in terms of energy consumption per unit of GDP, public library collection per 10,000 people, proportion of culture and related industries to GDP, and landscape diversity index. Our study therefore indicates that ecological construction of a city with the goal of high-quality development is subject to various obstacles such as the improvement of cultural soft power and spatial pattern optimization.
Based on the obstacle degree results, we followed the principle of “priority of ecological construction-classification and zoning control-focus on local policies” (Wolman, 1965; William, 1971; Figure 7). We combined this principle with the location and function of different types of cities and considered the ecological protection and high-quality development of the YRB. We explored possible methods of improving the ecological construction level of different types of cities, and found the following methods for improvement:
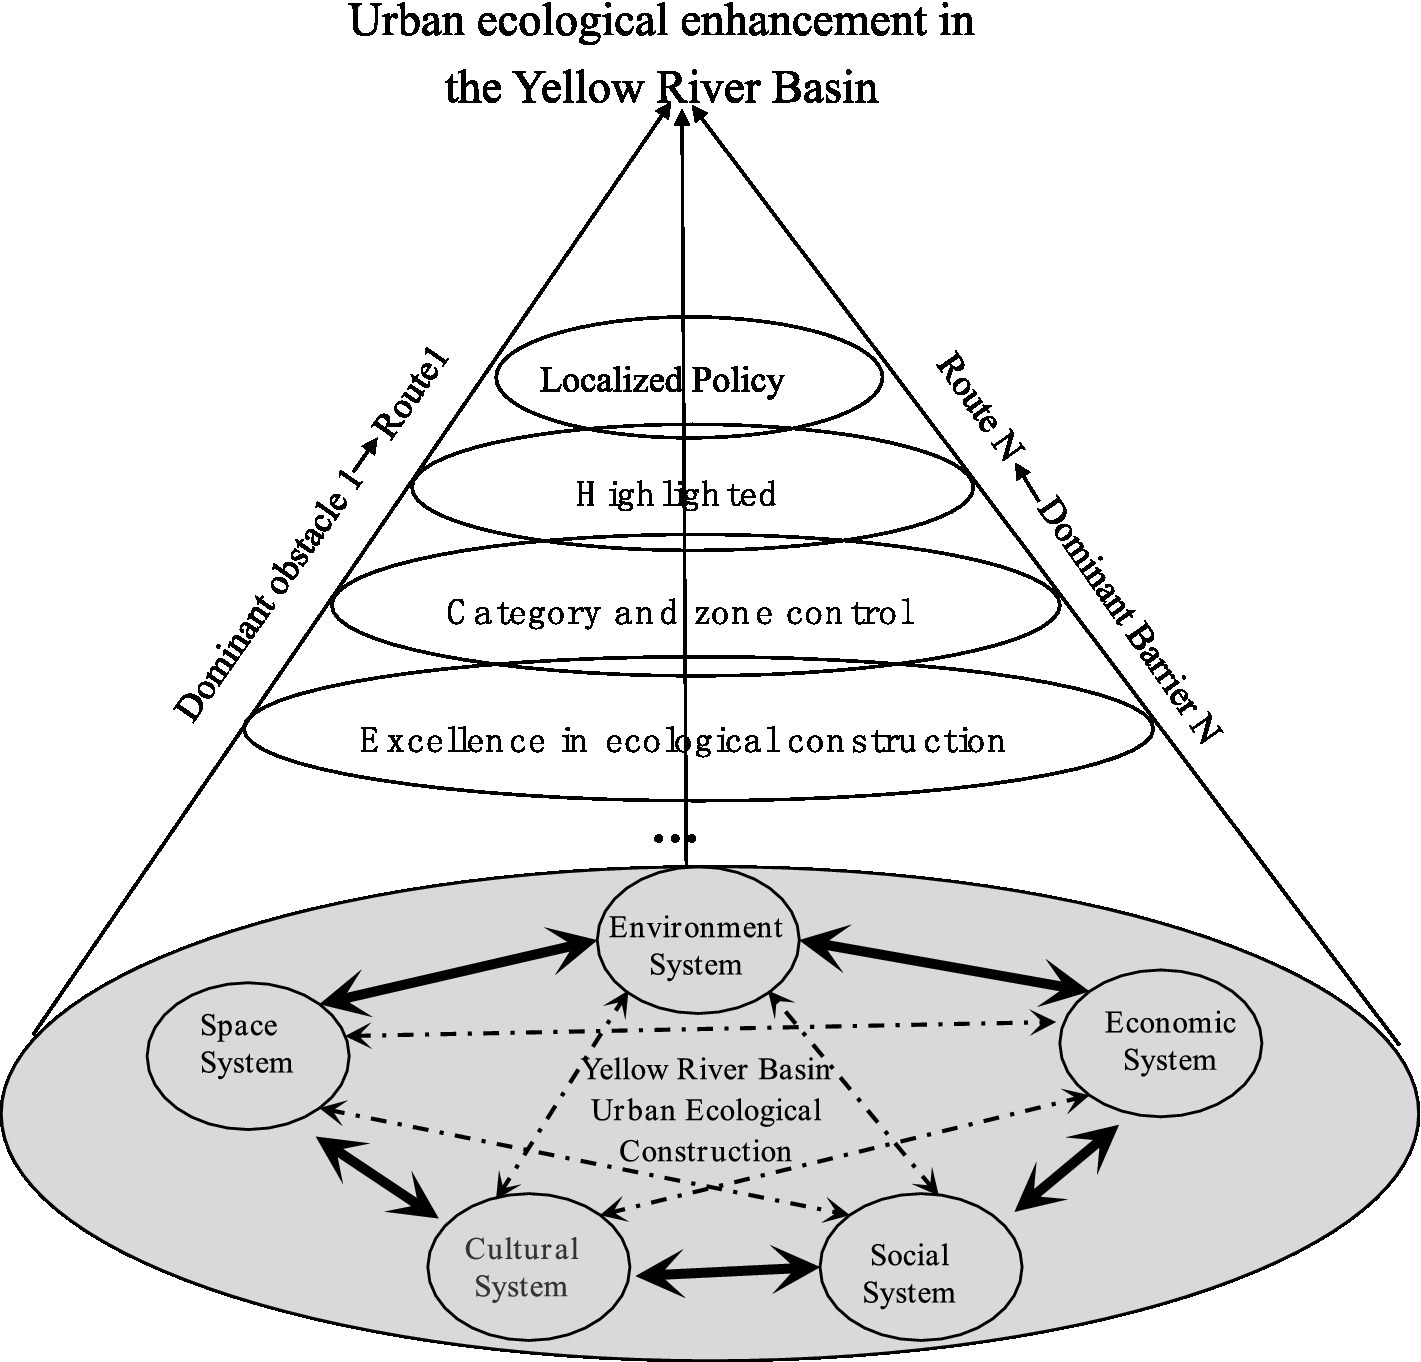
Figure 7. Suggested methods for improving quality of urban ecological construction in the Yellow River basin.
First, Considering cities of different sizes: Type I big cities have advantages in economic development, innovation vitality, and public services. The main obstacles to urban ecological construction are infrastructure, cultural resources, cultural investment, and spatial pattern. In the future, we advise strengthening the structural adjustment of economic development and increasing investment in science, education, and culture, such as Xi ‘an, Qingdao, Zhengzhou and other Type I big cities. These changes will improve the efficiency of urban land use and enable sustainable development. Relatively economically developed cities have a large population and a high degree of agglomeration. The residential land area per capita is, however, relatively small, implying a contradiction between population and land use. Small Type I cities,for example, Guyuan, Dingxi, Zhongwei and other type I small cities need to focus on economic development, innovation vitality, environmental disaster prevention, public services, and infrastructure. Such cities should prioritize the advantages of a good ecological environment. Pursuing combined ecological and economic development leads to enhancement in economic strength and quality. We also suggest improving the quality of urban public services and cultural soft power.
Second, In cities with different functional types, the main obstacles to ecological construction of comprehensive cities are economic development, innovation vitality, infrastructure, and environmental foundation. The obstacles to ecological construction of resource-based cities are environmental governance, economic potential, innovation vitality, public service provision, and land use.
Third, Considering different space carrier cities, the main obstacles to ecological construction faced by the mature urban agglomeration in the Shandong peninsula urban agglomeration are innovation, public services, infrastructure, and space pattern. For agglomerations still in the early stage of development (i.e., Guanzhong plain urban agglomeration, Ningxia along the Yellow River urban agglomeration, Lanxi urban agglomeration), the main obstacles are economic development, economic potential, environmental governance, and cultural communication.
Forth, From the perspective of location along the YRB, the main obstacles to ecological construction are cultural investment, cultural communication, public service, and innovation vitality in the upper and lower reaches of the YRB. The main obstacles upstream are urban ecological level, environmental management, and economic development.
5. Conclusions and suggestions
5.1. Conclusion
This study aims to transform the principles of large-scale ecological city construction into a more grounded framework for urban ecological construction. By constructing a five-pronged theoretical framework of economic, environmental, social, cultural, and spatial ecology, and using the entropy method, ESDA, Dagum Gini coefficient, and the obstacle degree model, we explored the spatial and temporal patterns and obstacles in urban ecological construction. From our study, we conclude:
First, the ecological construction level varied spatially in 2006-2018.The urban ecological construction in the YRB presents a “polycentric” spatial differentiation structure, and has a significant “center-periphery” decreasing spatial distribution trend. The proportion of cities with low level and below of urban ecological construction in the YRB decreases, while the proportion of cities with medium level and above of urban ecological construction increases significantly. Middle and downstream cities show high levels of urban ecological construction, with construction progressing toward cities in the middle and upper reaches over time. The level of urban ecological construction in the YRB shows characteristics of spatial agglomeration. From 2006 to 2018, High–High agglomeration areas were mainly distributed in Shandong Province in the lower reaches of the YRB. Low-Low agglomeration areas were mainly distributed in the central and southern Ningxia Province and southern Gansu Province. High–Low agglomeration areas included Zhengzhou and Taiyuan, and Low-High agglomeration aeras included Linyi.
Second, the level of urban ecological construction in the YRB is directly proportional to the scale and type of city scale. The level of urban ecological construction is relatively high in functional comprehensive cities, such as the Shandong Peninsula city agglomeration with a high degree of development, and the North China Plain with areas of priority development. We found that the lower reaches and the right bank of the YRB exhibited the highest levels of urban ecological construction. Regional differences existed between the middle and lower Yellow River in terms of differential contribution rate and urban ecological construction space imbalance.
Third, we found that the main factors influencing the urban ecological construction level in the YRB are: water resources per capita; disposable income per capita; R&D investment and fiscal expenditure proportion; land use efficiency; energy consumption per unit GDP; public library books per 10,000 people; culture and related industries in GDP; and landscape diversity index. The obstacles to urban ecological construction depend on local conditions. We found that upper and lower reaches require improvement in different dimensions of economy, society, environment, culture, and space.
5.2. Suggestions
Here, with the aim of promoting ecological protection and high-quality development of the YRB, we propose a five-pronged evaluation framework that considers the economy, society, environment, culture, and space. We considered index selection for national urban ecological construction, high-quality economic development, cultural soft power promotion, space management and other major demands, such as innovation, healthy life, cultural investment, and space optimization elements. Our study differed from static, single city, or provincial city research, and we based our research on the size of different cities, space carrier, and river basin location. The comparative analysis of urban ecological construction was complementary to existing research and the use of the obstacle model was helpful in analyzing the main barriers to ecological construction in the YRB. Our results can provide a reference for the coordinated development and central urban agglomeration of cities in the YRB.
Improvement during the early development stage of the urban agglomerations of Guanzhong Plain, Ningxia, and Lanxi requires enhancement of the economic level and quality of life. The most important objective is to maintain environmental quality and resource utilization while aiming for high-quality economic growth and exploring the Jcultural resources of the YRB to effectively improve the cultural quality of agglomerations in the region. During the rapid development stage of the urban agglomerations of Jinzhong and the Central Plains, attention must still be paid to the social progress and spatial governance of some cities in Henan Province and Shanxi Province. Regional differences remain in the YRB. Spatial imbalance mainly arises from the difference between the upper, middle, and lower reaches of the YRB cities. As the difference between cities is relatively small, we suggest changing the current fragmented management mechanism in future urban development planning. This would narrow the development gap between urban agglomerations in the lower and middle Yellow River, ultimately resulting in coordinated development of the YRB.
Evaluation of urban ecological construction is a complex process that requires systematic consideration of economic, social, environmental, cultural, and spatial indicators. Therefore, building a complete and comprehensive evaluation framework for urban ecological construction presents a research challenge. Here, we focused on measuring the level of urban ecological construction based on objective indicators. In the future, subjective interview materials and questionnaire data should be additionally considered when conducting comprehensive analysis of urban ecological construction. Secondly, future research requires further exploration of the mechanisms that govern high and low urban ecological construction to provide targeted suggestions for improving the level of urban ecological construction in the YRB.
Data availability statement
The original contributions presented in the study are included in the article/supplementary material, further inquiries can be directed to the corresponding authors.
Author contributions
XW and SC: conceptualization. HW and HS: methodology. HW and WQ: software. HW: validation. LW: investigation and supervision. SY: resources. XW and LW: writing—original draft preparation. XW, GL, and LW: funding acquisition. XW: formal analysis. GL and SC: writing—review and editing. XY: data curation. LM: visualization. All authors contributed to the article and approved the submitted version.
Funding
This research was funded by Youth Innovation Team Project for Talent Innovation and Cultivation in Universities of Shandong Province (no. 2022RW026, the Shandong Provincial Humanities and Social Sciences Project (2022-YYGL31), the national natural science foundation of China(No. 42207553), the open foundation of State Key Laboratory of Lake Science and Environment (No. 2022SKL005), the open foundation of CAS Key Laboratory of Coastal Environmental Processes and Ecological Remediation, YICCAS (NO. 2020KGJJ10), the open foundation of State Key Laboratory of Loess and Quaternary Geology, Institute of Earth Environment, CAS (NO. SKLLQG2024). Youth Innovation Team Project for Talent Introduction and Cultivation in Universities of Shandong Province, Key project of Undergraduate Teaching Reform in Shandong Province (NO. Z2021177), Key project of Research and Development Program in Shandong Province (NO. 2022RKY07006).
Conflict of interest
The authors declare that the research was conducted in the absence of any commercial or financial relationships that could be construed as a potential conflict of interest.
Publisher’s note
All claims expressed in this article are solely those of the authors and do not necessarily represent those of their affiliated organizations, or those of the publisher, the editors and the reviewers. Any product that may be evaluated in this article, or claim that may be made by its manufacturer, is not guaranteed or endorsed by the publisher.
Footnotes
References
Alexi, D., and Romero, I. (2016). Environmental conflict analysis using an integrated grey clustering and entropy-weight method: a case study of a mining project in Peru. Environ. Modell. 23, 108–121. doi: 10.1016/j.envsoft.2015.12.011
Balland, P. A., Jara-Figueroa, C., Petralia, S. G., Steijn, M. P., Rigby, D. L., and Hidalgo, C. A. (2020). Complex economic activities concentrate in large cities. Nat. Hum. Behav. 4, 248–254. doi: 10.1038/s41562-019-0803-3
Bo, L. M. (2019). The spatial structure pattern and planning strategy of Wuhan ecological development. Central China Archit. 37, 68–72.
Burçak, E. O., and Demet, D. (2016). Sustainable urban spaces: ecological parks. İstanbul Üniversitesi Orman Fakültesi Dergisi 66, 340–355.
Chen, C. (2019). Research on the propagation path of Yellow River ecological culture in the new era. Xinwen Aihaozhe 11, 27–30.
Dagum, C. (1997). A new approach to the decomposition of the Gini income inequality ratio. Empir. Econ. 22, 515–531. doi: 10.1007/BF01205777
Dong, H., Fujita, T., Geng, Y., Dong, L., Ohnishi, S., Sun, L., et al. (2016). A review on eco-city evaluation methods and highlights for integration. Ecol. Indic. 60, 1184–1191. doi: 10.1016/j.ecolind.2015.08.044
Faeth, S. H., Bang, C., and Saari, S. (2011). Urban biodiversity: patterns and mechanisms. Ann. N. Y. Acad 1223, 69–81. doi: 10.1111/j.1749-6632.2010.05925.x
Fan, Y. P., and Fang, C. L. (2022). Eco-city and man-land relationship. Acta Ecol. Sinica 42, 4313–4323.
Fang, C. L. (2020). Spatial organization pattern and high-quality development of urban agglomeration in the Yellow River basin. Econ. Geogr. 40, 1–8.
Fu, G. H., and Liu, W. S. (2021). Evaluation of urban ecological level based on the object meta-topological model: taking city clusters in Jiangsu and Zhejiang provinces as an example. Ecol. Econ. 37, 86–91.
Gong, Y. Y., and Zhou, J. J. (2021). Environmental regulation, industrial structure optimization and high-quality economic development: a case study of prefecture-level cities along the Yellow River basin. Ecol. Econ. 37, 52–60.
Jansson, A. (2013). Reaching for a sustainable, resilient urban future using the lens of ecosystem services. Ecol. Econ. 86, 285–291. doi: 10.1016/j.ecolecon.2012.06.013
Jin, F. J. (2019). Coordinated promotion strategy of ecological protection and high-quality development in the Yellow River Basin. Reformation 11, 33–39.
Kaushal, S. S., and Belt, K. T. (2012). The urban watershed continuum: evolving spatial and temporal dimensions. Urban Ecosyst. 15, 409–435. doi: 10.1007/s11252-012-0226-7
Li, P. F. (2019). Analysis on status quo and optimization path of low-carbon eco-city construction in Zhuhai City. Construction. Sci. Technol. 7:37-39+44.
Li, F. Z., and Miao, Q. (2022). Spatial network characteristics coupled between urban ecological protection and high-quality economic development in the Yellow River basin. Stat. Decis. 38, 80–84.
Liao, J. K., and Du, Q. (2021). Collaborative governance of the Yellow River basin: realistic requirements, realization approaches and legislative emphases. China Popul. Resour. Environ. 31, 39–46.
Miao, C. H., and Zhang, B. F. (2021). Regulation strategy of zoning-gradation-classification for high-quality development in the Yellow River basin. Econ. Geogr. 41, 143–153.
Neil, D. J., and Marshall, S. (2015). The urban heat island effect and city contiguity. Comput. Environ. Urban. Syst. 54, 181–194. doi: 10.1016/j.compenvurbsys.2015.08.002
Ramaswami, A., Weible, C., and Main, D. (2012). A social-ecological-infrastructural systems framework for interdisciplinary study of sustainable city systems an integrative curriculum across seven major disciplines. J. Ind. Ecol. 16, 801–813. doi: 10.1111/j.1530-9290.2012.00566.x
Ren, B. P., and Du, Y. X. (2021). Coupling coordination of economic growth, industrial development and ecology in the Yellow River basin. China Popul. Resour. Environ. 31, 119–129.
Ren, B. P., and Zhang, Q. (2019). The strategic design and supporting system construction of high-quality development in the Yellow River basin. Reformation 10, 26–34.
Richard, R Eco-city Berkeley: Building Cities for a Healthy Future. North Atlantic Books, Berkeley. (1987).
Samuel, V. B., Agamuthu, P., and Hashim, M. A. (2013). Indicators for assessment of sustainable production: a case study of the petrochemical industry in Malaysia. Ecol. Indic. 24, 392–402. doi: 10.1016/j.ecolind.2012.07.017
Schewenius, M., Mcphearson, T., and Elmqvist, T. (2014). Opportunities for increasing resilience and sustainability of urban social-ecological systems: insights from the URBES and the cities and biodiversity outlook projects. Ambio 43, 434–444. doi: 10.1007/s13280-014-0505-z
Tong, G. R., and Guo, X. Z. (2000). Ecological environment' s protection and ecological city' s construction in the Yangtze River basin. Resour. Environ. Yangtze River Basin 2, 154–159.
Vergnes, A., Le, V. I., and Clergeau, P. (2012). Green corridors in urban landscapes affect the arthropod communities of domestic gardens. Biol. Conserv. 145, 171–178. doi: 10.1016/j.biocon.2011.11.002
Wang, C. X. (2020). A new reflection on the theory and practice of typical regional human-land relations in the new era: a review of ecologically fragile human-land systems in the Yellow River Delta. Geogr. Res. 39, 1947–1948.
Wang, F., An, L. Z., and Dang, A. R. (2020). Human-land coupling and sustainable human settlementsin the Yellow River Basin. Geogr. Res. 39, 1707–1724.
Wang, K., Zhang, L. J., Zhang, C., (2021). Dynamic analysis of eco-city development research based on citespace. Acta Ecolo. Sinica 41, 2097–2105.
William, A. (1971). The economics of urban size. Pap. Reg. Sci. Assoc 26, 67–83. doi: 10.1111/j.1435-5597.1971.tb01493.x
Wolman, A. (1965). The metabolism of cities. Sci. Am. 213, 178–190. doi: 10.1038/scientificamerican0965-178
Xi, J. P. (2019). Speech at the symposium on ecological protection and quality development in the Yellow River basin. Seeking Truth 20, 4–11.
Xu, L. T., Yao, S. M., and Chen, S. (2019). Evaluation of eco-city under the concept of high-quality development: a case study of the Yangtze River Delta urban agglomeration. Sci. Geogr. Sin. 39, 1228–1237.
Xue, M. Y., Wang, C. X., and Zhao, J. L. (2020). Spatial differentiation pattern and influencing factors of tourism economy in the Yellow River basin. Econ. Geogr. 40, 19–27.
Chen, Y., Zhu, M., Lu, J., Zhou, Q., and Ma, W. (2020). Evaluation of ecological city and analysis of obstacle factors under the background of high-quality development: taking cities in the Yellow River basin as examples. Ecol. Indic. 118, 1–10.
Zhan, S. Y. (2021). The protection of Yellow River cultural ecology at the nexus of river, landscape and curtural heritage. Folk. Res. 03:15-21+157.
Zhang, B. F., and Miao, C. H. (2020). Spatiotemporal changes and driving forces of land use in the Yellow River basin. Resour. Sci. 42, 460–473. doi: 10.18402/resci.2020.03.05
Zhang, Y., Xu, Y., and Deng, P. X., (2022). Study on the evaluation system and construction experiences of global city oriented eco-city. Ecolo. Econ. 38, 103–110.
Zhang, W., Zhang, H. Y., and Wang, L. J. (2014). A new method to build the eco-city appraisal index system: the combined dynamic appraisal method. Acta Ecol. Sin. 34, 4766–4774.
Keywords: urban ecological construction, spatiotemporal pattern, obstacle degree model, Yellow River basin, China
Citation: Xiaohui W, Qian C, Longsheng W, Guangyu L, Haiyan S, Weishan Q, Shuang C, Shimou Y, Liwei M and Xiaoqian Y (2023) Spatial–temporal pattern of urban ecological construction in the Yellow River basin and its optimization and promotion paths. Front. Ecol. Evol. 11:1147619. doi: 10.3389/fevo.2023.1147619
Edited by:
Yizi Shang, China Institute of Water Resources and Hydropower Research, ChinaReviewed by:
Ting Hua, Beijing Normal University, ChinaZerouali Bilel, University of Chlef, Algeria
Peng Hu, China Institute of Water Resources and Hydropower Research, China
Milad Janalipour, Aerospace Research Institute, Iran
Copyright © 2023 Xiaohui, Qian, Longsheng, Guangyu, Haiyan, Weishan, Shuang, Shimou, Liwei and Xiaoqian. This is an open-access article distributed under the terms of the Creative Commons Attribution License (CC BY). The use, distribution or reproduction in other forums is permitted, provided the original author(s) and the copyright owner(s) are credited and that the original publication in this journal is cited, in accordance with accepted academic practice. No use, distribution or reproduction is permitted which does not comply with these terms.
*Correspondence: Wang Longsheng, NTJ3bHNAMTYzLmNvbQ==; Li Guangyu, bGVlZ3Vhbmd5dUAxMjYuY29t