 Zhentao Cheng
 Xiaolei Huang
- State Key Laboratory of Ecological Pest Control for Fujian and Taiwan Crops, College of Plant Protection, Fujian Agriculture and Forestry University, Fuzhou, China
In recent years, DNA barcoding has rapidly developed as a powerful tool in taxonomy, demonstrating its value in species identification and discovery of cryptic diversity. The number of barcoding sequences of various species continues to grow in the GenBank and BOLD databases; however, the accuracy of sequences and related raw information in public repositories is often questionable. In the present study, based on a dataset of 68,089 Hemiptera COI barcode sequences covering 3,064 species, 1,072 genera, and 48 families, we analyzed genetic differences within and between species and evaluated possible data errors in the insect barcodes. The results showed that errors in the barcode data are not rare, and most of them are due to human errors, such as specimen misidentification, sample confusion, and contamination. A significant portion of these errors can be attributed to inappropriate and imprecise practices in the DNA barcoding workflow. Herein, suggestions are provided to improve the practical operations and workflow of DNA barcoding to reduce human errors.
1. Introduction
DNA barcoding is a tool that uses genetic variation of standard barcode sequences to distinguish species (Hebert et al., 2003; Kekkonen and Hebert, 2014; Mishra et al., 2015). It has proven to be efficient in species identification, both for distinguishing known species and for discovering previously unknown species (Hebert et al., 2004; Foottit et al., 2008; Lumley and Sperling, 2010). For animals, a 658-bp fragment of the 5’ end of mitochondrial cytochrome c oxidase (COI) gene was proposed as the standard barcode (Hebert et al., 2003). The number of publications applying DNA barcoding have accumulated rapidly since 2000 (Figure 1). Moreover, the application of DNA barcoding has expanded to other research fields such as food safety (Carvalho et al., 2015), biodiversity assessment (Jones et al., 2021), environmental monitoring (Carew et al., 2013), and trophic interactions (Hrcek et al., 2011). A vast number of barcode sequences have been produced and uploaded to public databases, such as GenBank and the Barcode of Life Data Systems (BOLD). As a main public database of DNA barcode data and a curation tool, BOLD currently archives barcode sequences for 11,429,650 specimens from animals, plants, fungi, and protists (accessed on July 12, 2022).
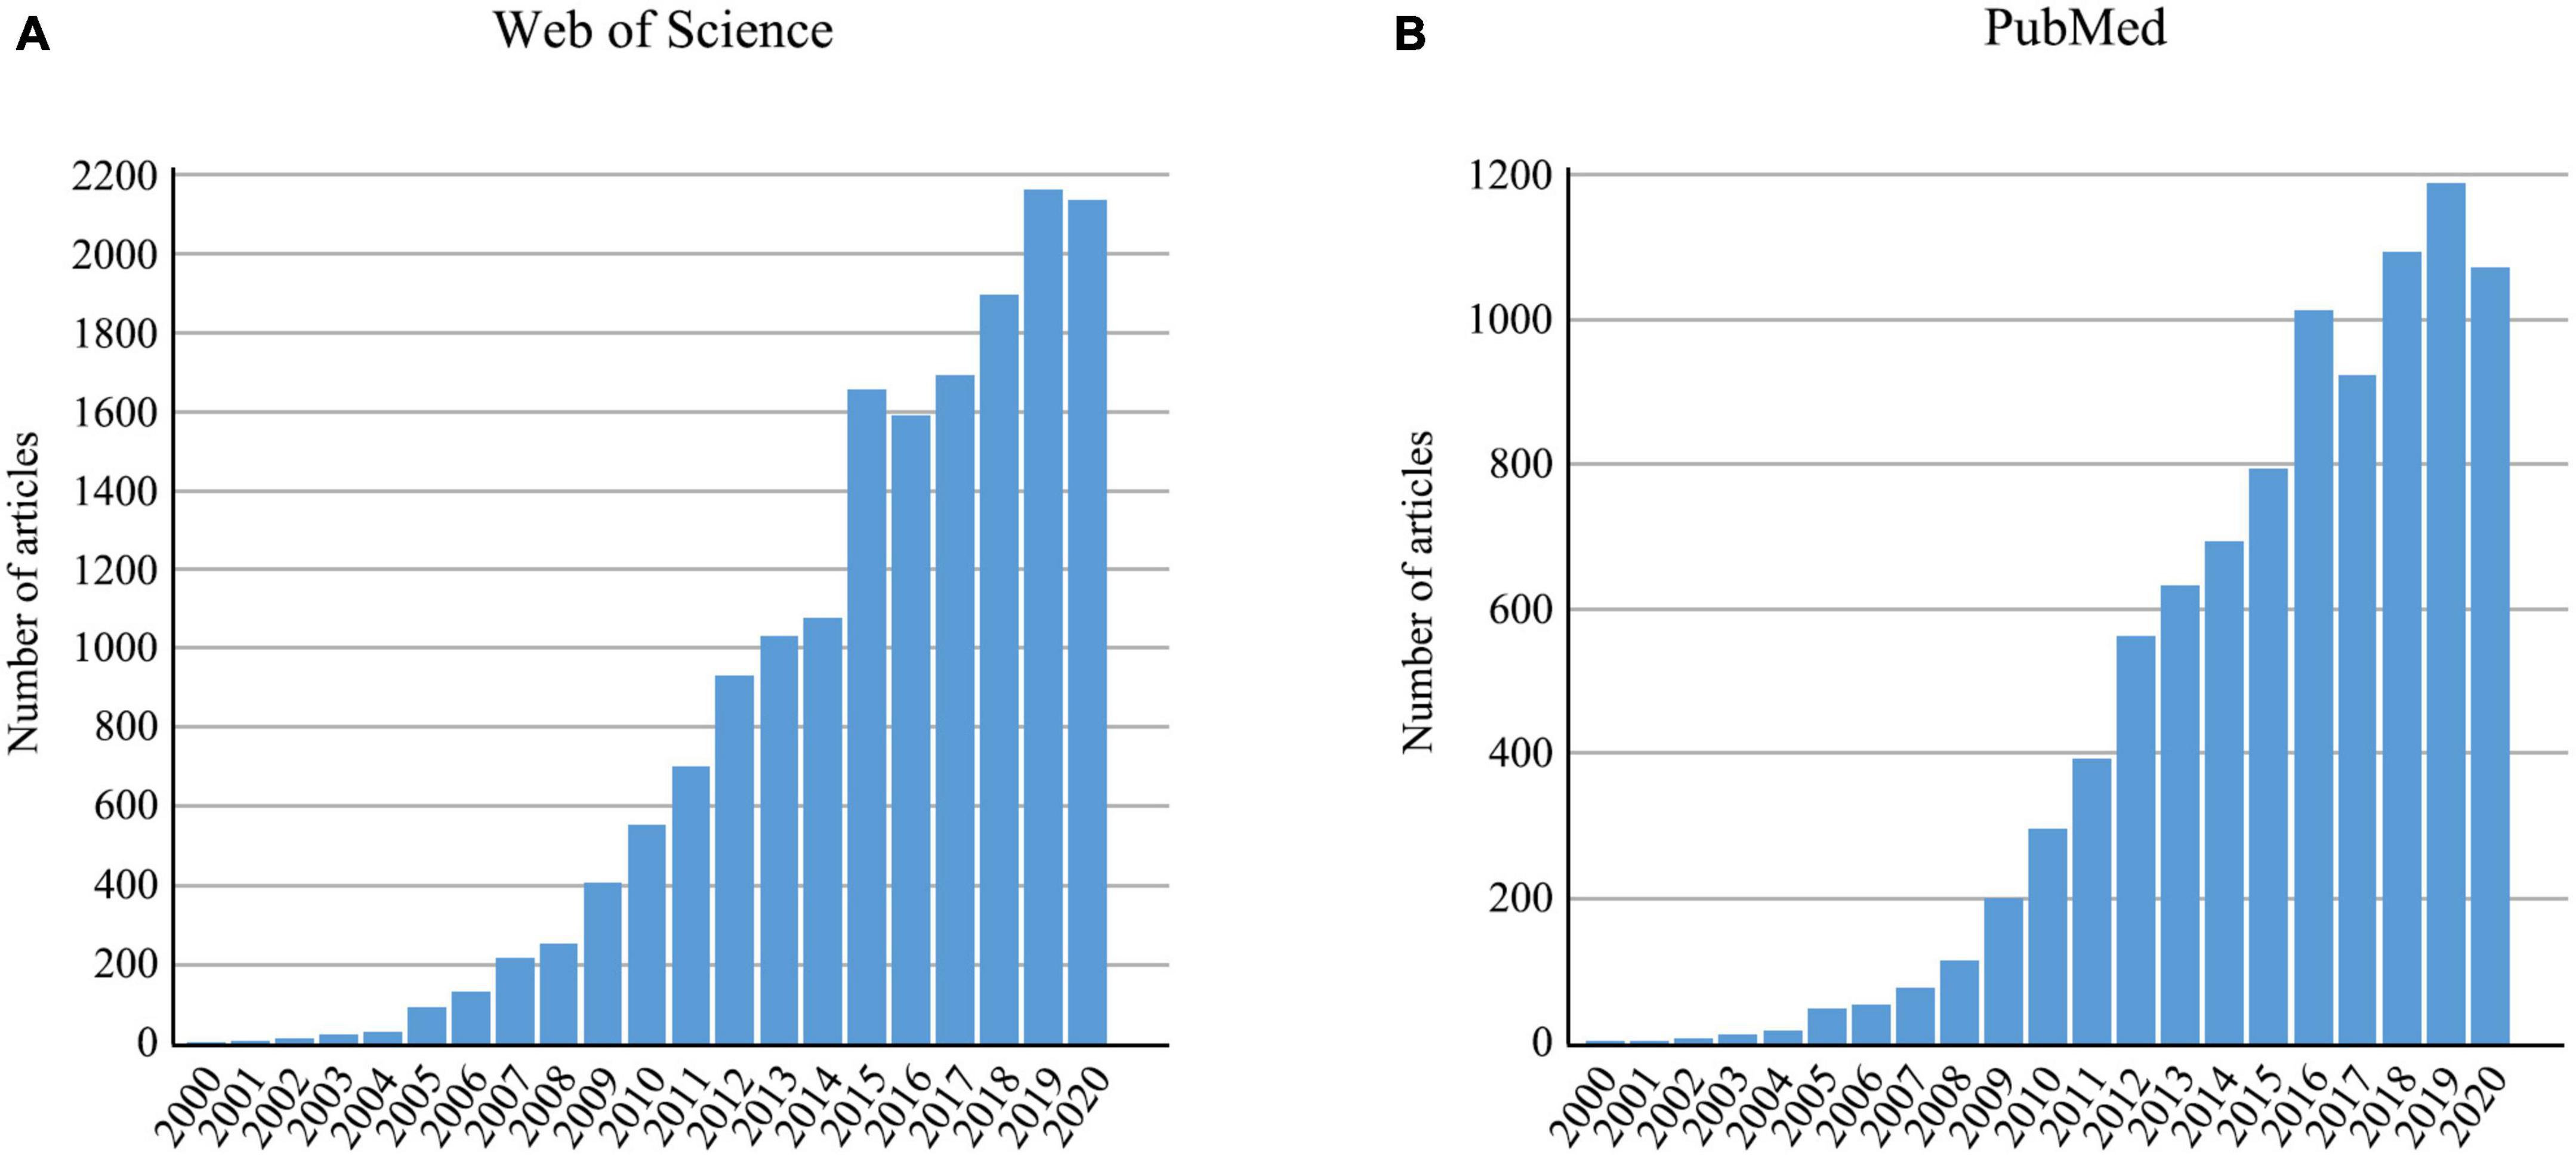
Figure 1. The number of articles retrieved using “DNA barcod*” from 2000 to 2020 in (A) Web of Science and (B) PubMed.
With the explosive growth of data volume, errors are inevitably present in public databases (Shen et al., 2013; Meiklejohn et al., 2019). There is evidence that mtDNA data published in the fields of forensic medicine and anthropology contain errors (Bandelt et al., 2001, 2002). Between 1981 and 2002, more than half of the mtDNA sequences (80/137) in articles related to forensic medicine and anthropology published in journals such as Nature, Science, Cell, and others, have obvious errors, including mistakes in sample description, misread nucleotides, and wholesale rearrangements of the sequence tables (Forster, 2003). Ashelford et al. (2005) also showed that 5% of existing 16S rRNA sequences in public databases harbor substantial errors, such as chimeras, degenerate, and unidentified sequencing errors. In another investigation, Meiklejohn et al. (2019) found that both BOLD and GenBank performed poorly at species-level identification for insects (with accuracy of 35% and 53%, respectively). They suggested that misidentification was attributable to the earlier inclusion of misidentified specimens in public databases, since morphological identification between closely related species is inherently challenging in many orders.
DNA barcoding assigns specimens to their source species by comparing the query sequence with reference libraries (Hebert et al., 2003; Gwiazdowski et al., 2015). Therefore, the quality of libraries determines the accuracy of species assignment using DNA barcodes. The comparison between the query sequence and reference sequences fundamentally depends on the degree of overlap between intraspecific and interspecific genetic divergence. The difference between the greatest intraspecific genetic distance and the smallest interspecific genetic distance is called “barcoding gap.” Usually, the greater the gap, the easier and more accurate the species identification (Meyer and Paulay, 2005). It was recommended that 10 times of the average intraspecific genetic divergence can be used as a possible genetic distance threshold for species identification (Vences et al., 2005).
Fixed genetic distance thresholds have been widely used in various studies. For instance, a 3% threshold was common in earlier barcoding studies (Ross et al., 2008), whereas a 1% threshold is used in the BOLD identification system. For insect identification, a threshold value of 2% K2P genetic distance is generally accepted for the identification of Lepidopteran species (Hebert et al., 2003; Hajibabaei et al., 2006; Zahiri et al., 2014). In Hemiptera, the thresholds for subfamilies Greenideinae (Liu et al., 2013), Chaitophorinae (Zhu et al., 2017), and Calaphidinae (Lee et al., 2017) are considered to be 2%, 2%, and 2.5%, respectively. Analysis of the COI sequences of true bugs revealed that the intraspecific divergence was less than 2% in 90% of the examined taxa, whereas the minimum interspecific distance was more than 3% in 77% of congeneric species pairs (Park et al., 2011). These examples suggest that a threshold value of 2–3% K2P genetic distance is appropriate for Hemiptera species. In cases where an abnormal intraspecific distance greater than the threshold or interspecific distance less than the threshold, misidentifications or other taxonomic issues are probably indicated.
To ensure the quality of reference libraries, certain procedures must be followed for the preparation and uploading of barcode data (Figure 2). The basic operating procedure of species identification using barcodes starts with specimen collection. Collectors typically record geographic information such as coordinates and altitudes in as much detail as possible. Habitat information, including microenvironment and host plant, is also important, particularly for insect collection (Ma and Liu, 2020; Blackman and Eastop, 2021). However, this information is often not well recorded, and therefore can lead to misidentification of species. The next step is species identification based on morphological and/or molecular information (Gwiazdowski et al., 2015). Morphological identification requires experienced taxonomists to compare characters between species (Žurovcová et al., 2010). Sometimes, the differences are too subtle to be distinguished accurately (Jinbo et al., 2011; Chan et al., 2014). The molecular information extracted from specimens can usually identify species accurately (Ivanova et al., 2006; Kekkonen and Hebert, 2014); however, as the COI sequences can be amplified from the DNA of different tissues, unanticipated sources of contamination can occur (Smith et al., 2012; Asghar et al., 2015). For instance, when sampling host tissues for DNA extraction, sequences of symbionts, parasites or commensals may inadvertently be obtained. Other contamination can occur if DNA extraction is not conducted strictly in accordance with experimental specifications (Wilson et al., 2019). Ideally, in a DNA barcoding project, the final species identification results should be based on an interactive validation of morphological characters and barcodes. However, this practice is frequently disregarded.
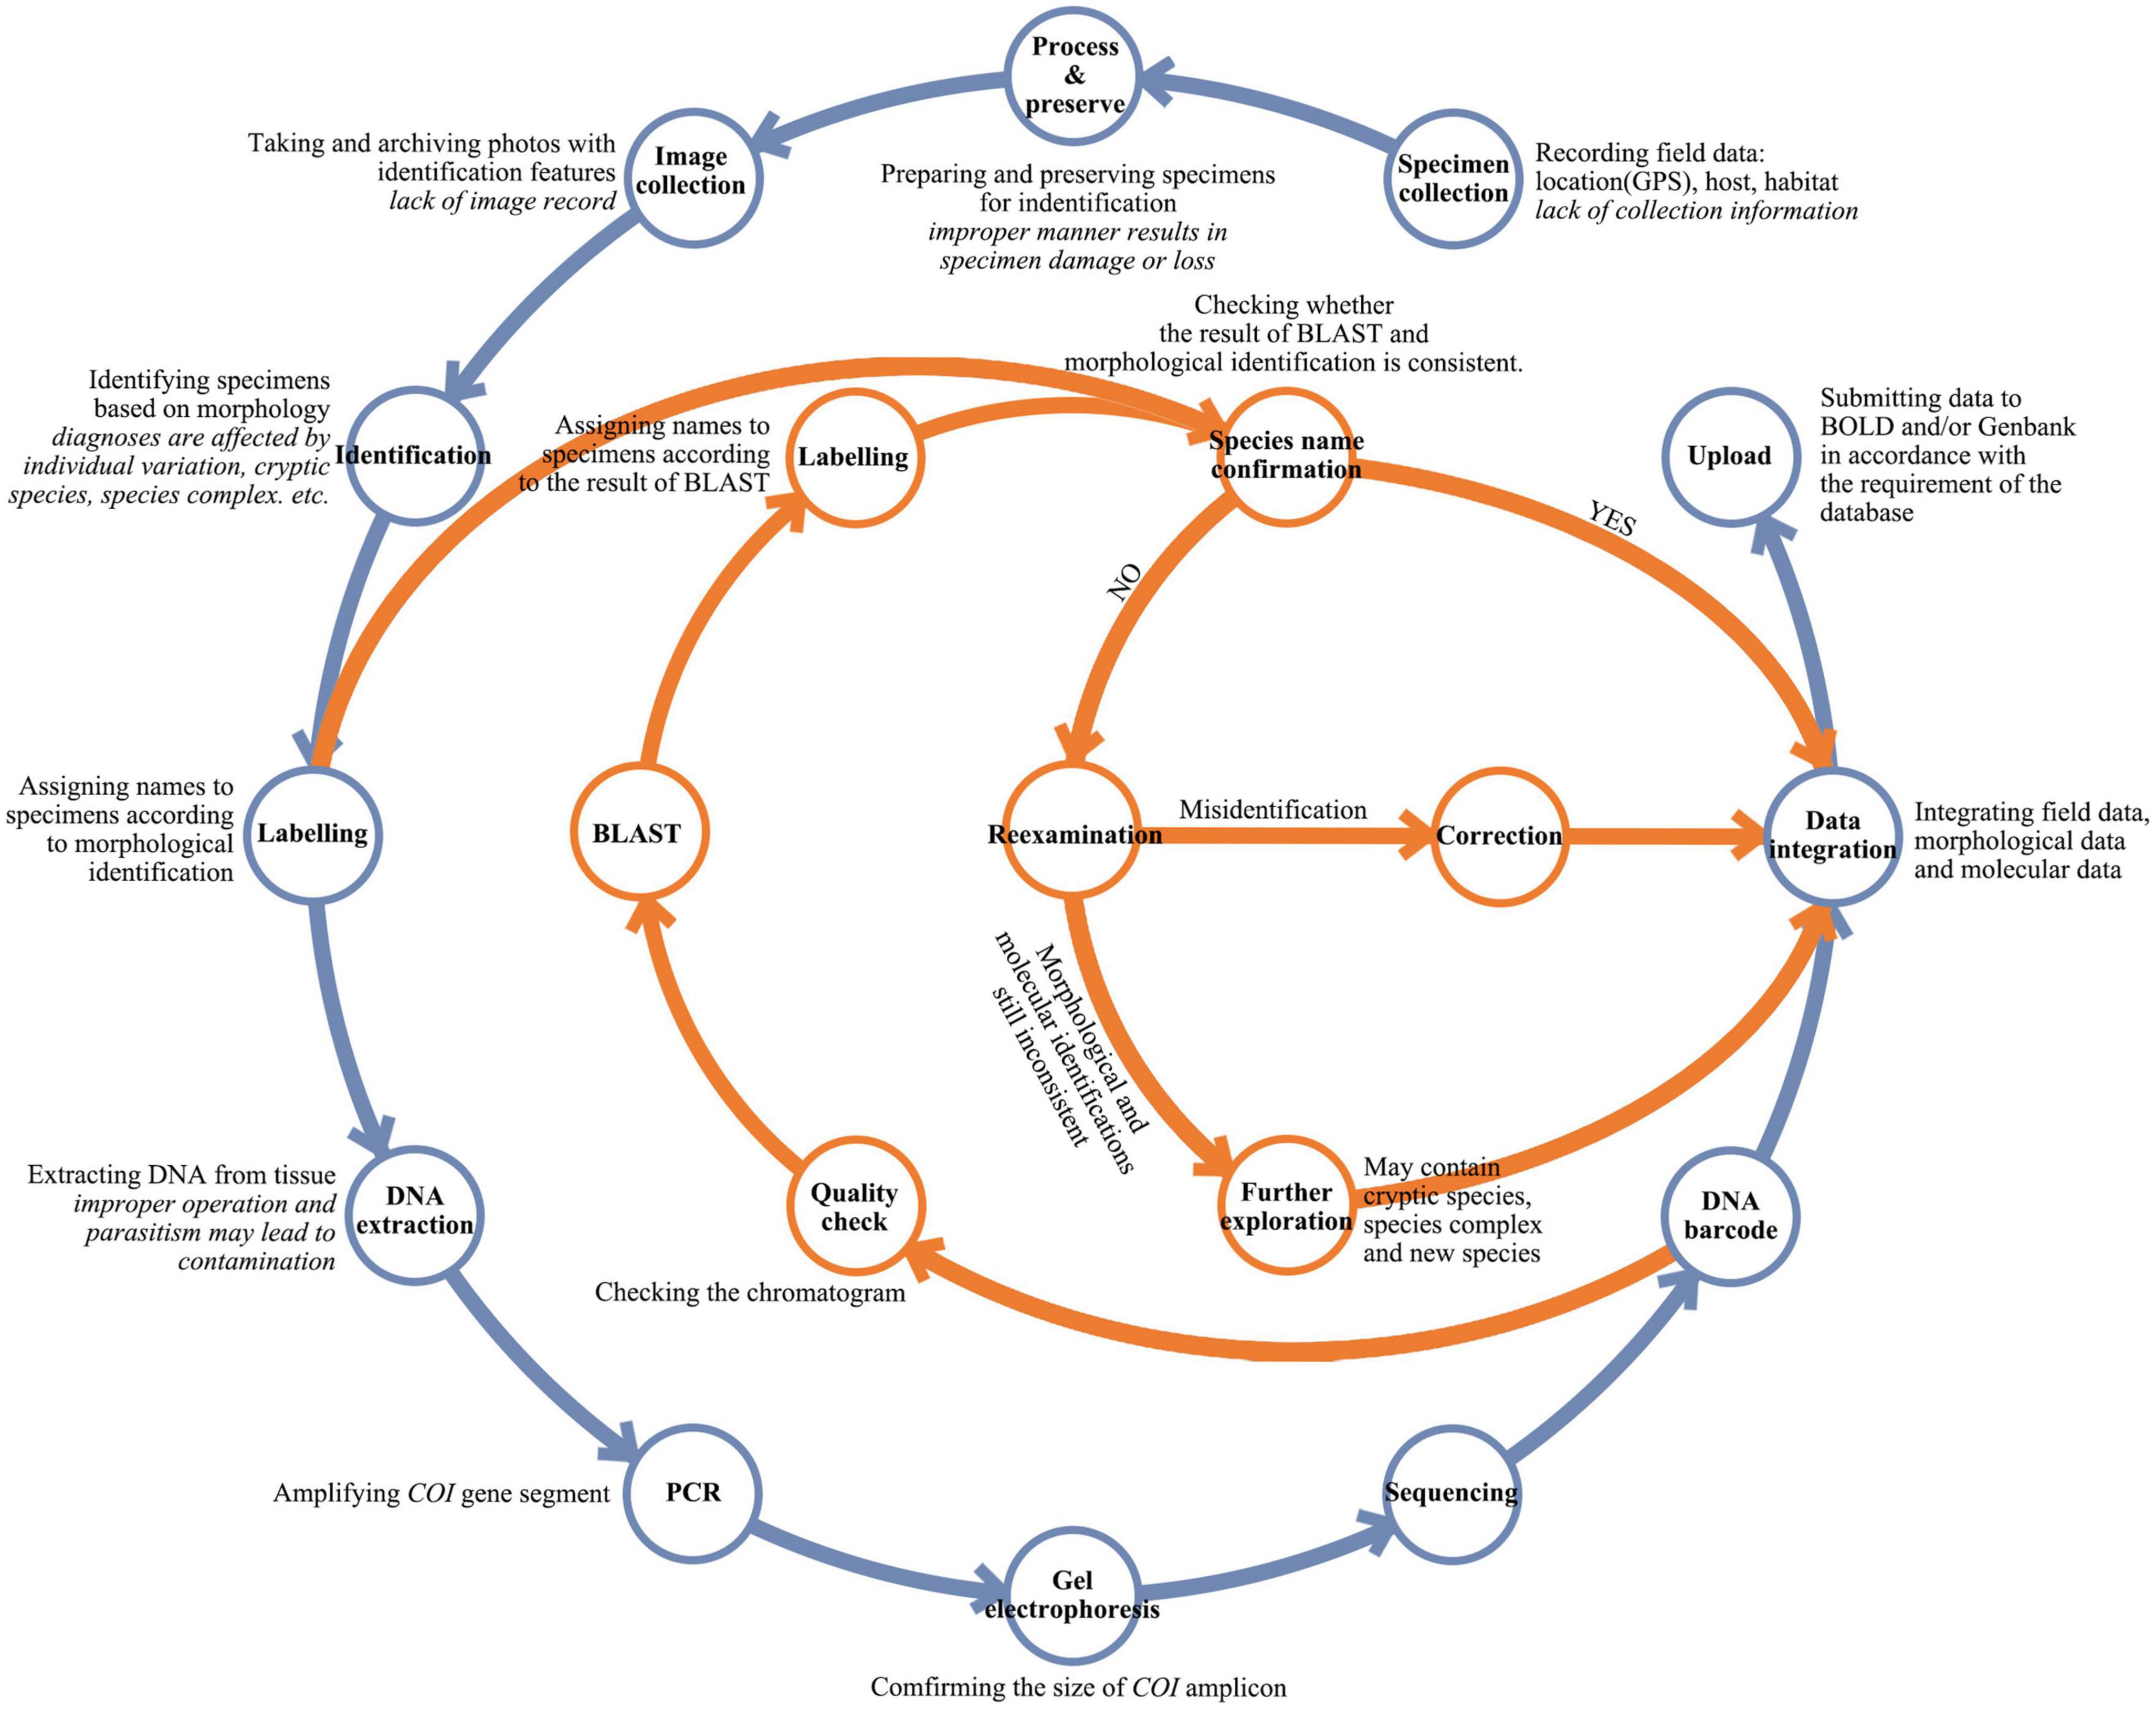
Figure 2. A flow chart for DNA barcoding workflow. Simplified workflow commonly used for DNA barcoding is shown in blue and quality check practices recommended herein are shown in orange. The key steps of the workflow are in bold with explanations in regular font, and possible errors or deficiencies in italics.
If errors occur during the production process of sequence data and public database, they can compromise the reliability of downstream analyses and future data reuse, potentially causing a negative cascade reaction (Barratt et al., 2018; Peres et al., 2021). Despite the potential for these issues to affect the quality of insect barcode data, empirical evidence is lacking. To address this gap, a dataset of 68,089 Hemiptera COI barcode sequences representing 3,064 species, 1,072 genera and 48 families was compiled. Possible data problems were then evaluated through systematic analysis of intraspecific and interspecific genetic divergences and retrieval of raw specimen information of questionable barcodes. Based on our analyses, several suggestions for quality check in the DNA barcoding workflow were recommended.
2. Materials and methods
2.1. Data acquisition and filtering
The sequences of hemipteran insects used herein were downloaded from the BOLD database (accessed 06/08/2018). To ensure the consistency of sequences, all the barcodes used in the analysis required confirmation from the same gene region. Therefore, only sequences of the most commonly used COI-5P region were retained as the barcode fragment, and all other sequences, including COI-3P, Cytb, COII, COXII, ND1, ND2, and others, were excluded. Sequences that were not identified to species level and that were not named using the standard system of binomial nomenclature were also removed. Additionally, species with only one sequence and the genera with only one species were excluded since intra- or inter-specific genetic distances cannot be calculated in such cases. After data filtering, 68,089 COI barcode sequences of 3,064 species, 1,072 genera and 48 families of Hemiptera were selected (Supplementary Table 1). All sequences were given a preliminary alignment by MAFFT (Katoh and Standley, 2013). Then the sequences with large gaps were excluded. A 500 bp long region was specified that contained maximum sequence variation information for the subsequent analyses. The barcode sequences used herein can be downloaded from the DataOpen repository at the link http://dataopen.info/home/datafile/index/id/276.
2.2. Calculation of intra- and inter-specific genetic distances
As mentioned above, very large intraspecific distances or very small interspecific distances were considered abnormal and suggested potential issue with data quality. To identify such sequences, genetic divergences were estimated for all sequences using the K2P distance model (Kimura, 1980) in MEGA 7 (Kumar et al., 2016) and TaxonDNA/SpeciesIdentifier 1.8 (Meier et al., 2006). For cases with large intraspecific or extremely small interspecific K2P distances, their raw specimen information and chromatogram (if available) were retrieved from the public database. These sequences were also searched using BLAST to further validate the accuracy of specimen identification. The top 10 abnormal sequences with largest intraspecific genetic distances and 10 groups with an interspecific genetic distance obviously less than 2% were selected for further analysis. Finally, to present a more reasonable overall distribution of genetic distances, species with less than five sequences were excluded from the calculation of the intra-/inter-specific genetic distances.
2.3. Analysis of questionable sequences
Since the appearance of abnormal intraspecific genetic distances involved multiple species and sequences, retrieving and analyzing the associated raw data on a case by case basis was too difficult. Instead, 10 sequences with most significant abnormal intraspecific genetic distances were selected as examples to evaluate cascade effect of questionable sequences. Sequence BOLD IDs and GenBank accession numbers were retrieved in Web of Science, PubMed, Google, and Google Scholar to search literature that cited these sequences. We then analyzed how the sequences were used and examined whether the use of such sequences led to questionable results.
3. Results
3.1. Overall distribution of genetic distances
After removing species with less than five sequences, the overall distribution of genetic distances of the 64,063 sequences from 1,578 species was shown in Figure 3. The data indicated that around 86.8% of the species had intraspecific genetic distances less than 3%, whereas 7.8% of the species had intraspecific genetic distances greater than 10%, and 12.2% of the species showed interspecific genetic distances less than 5%, (see Figure 4). The presence of apparent anomalies with unusually large intraspecific distances or extremely small interspecific distances indicated potential errors and provided samples for further investigation about data quality.
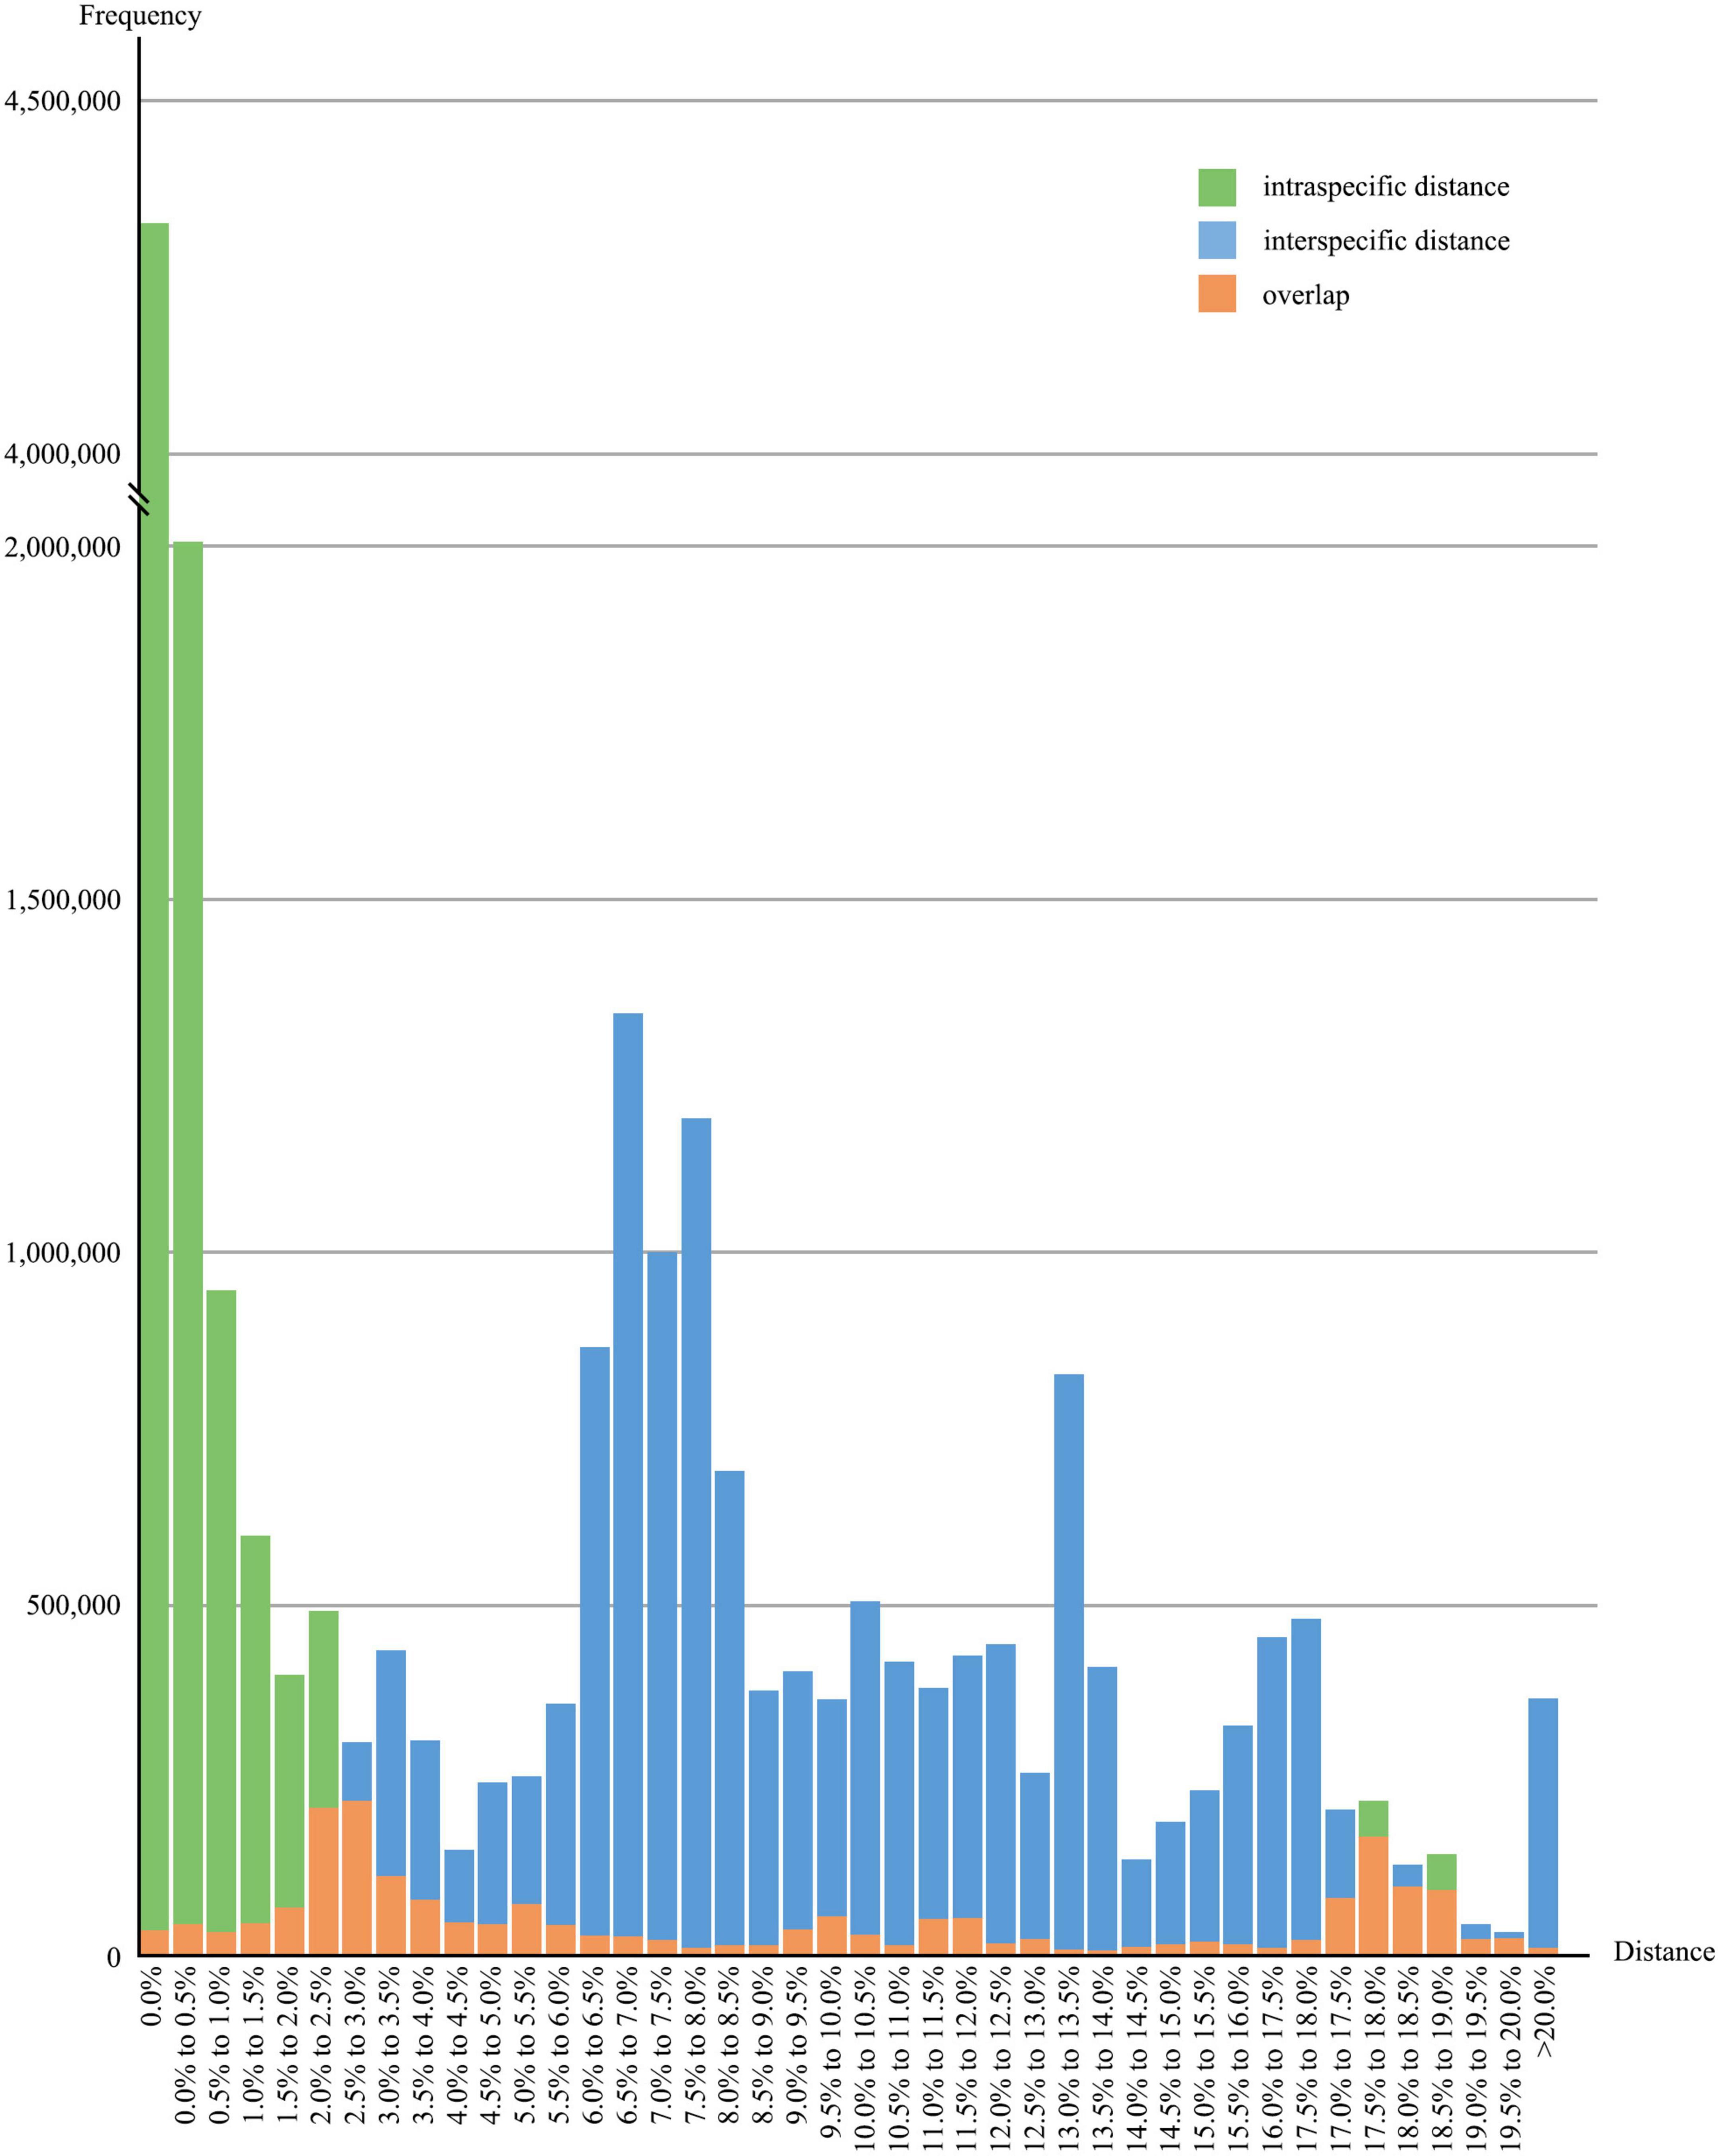
Figure 3. Overall distribution of intra- and interspecific genetic distances. Green and blue bars represent the frequencies of intra- and interspecific K2P genetic distances, respectively; orange bars indicate the overlaps of intra- and interspecific distances.
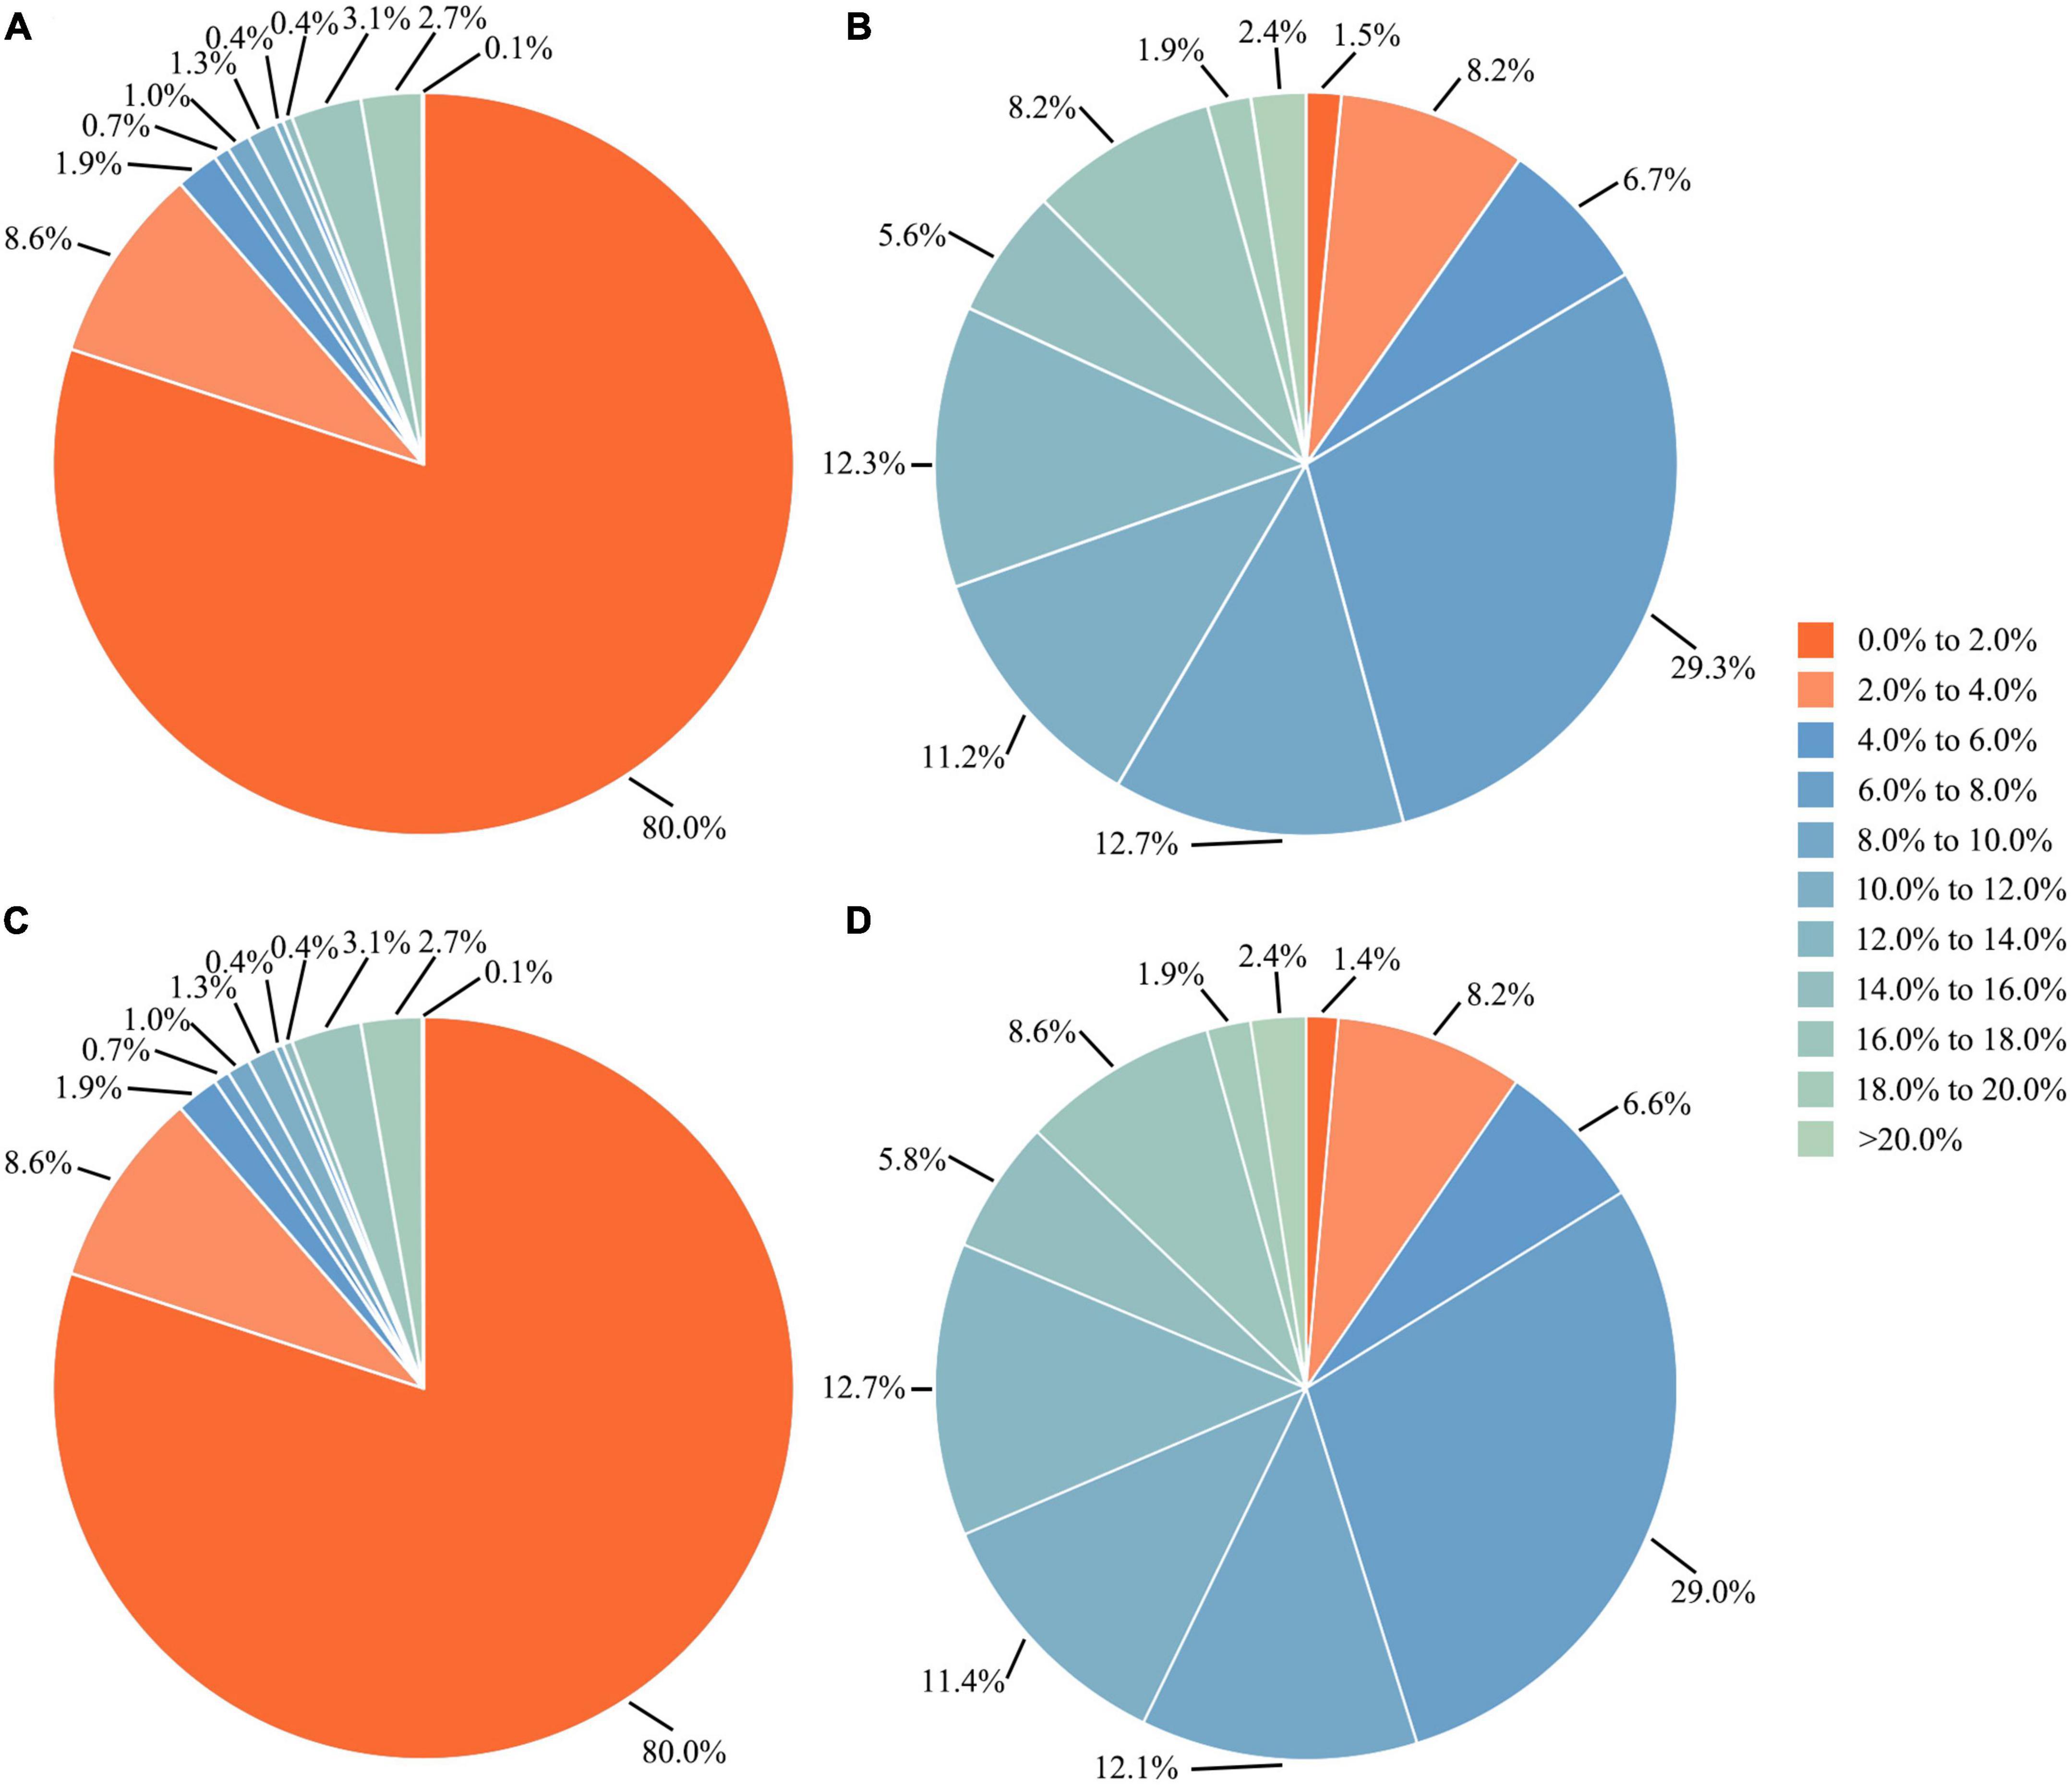
Figure 4. Proportions of (A,C) intra- and (B,D) interspecific genetic distances based on the complete dataset and the dataset excluding species with less than five sequences, respectively.
3.2. Sequences with very large intraspecific genetic distances
Ten sequences with the most significant abnormal intraspecific genetic distances were selected as examples for further analysis, and the causes of abnormal sequences were classified into four types (Table 1; Supplementary Figure 1). The raw data for these sequences in the public database were retrieved. None of the ten sequences contained images of the specimens, half of them omitted the details of collection information, and only one of them had an associated chromatogram. BLAST searches indicated that six of the ten sequences were suspected of misidentification. Of these six suspects, four sequences belonged to the same genus as the species names assigned to them. For example, GBMHH6231-14 (Triatoma dimidiata, Supplementary Figure 1A) and GBMHH8550-16 (Pseudococcus calceolariae, Supplementary Figure 1I) were closely matched to Homo sapiens (identity = 100%) and Encarsia brimblecombei (identity = 89.9%), respectively. ANGEN341-16 (Cletus schmidti, Supplementary Figure 1G) was found to be a case of reverse complementarity and misidentification. Even after correcting for the reverse complementarity, the corrected sequence still showed significant genetic differences from the Cletus schmidti sequences (mean distance = 0.89). ANGEN365-16 (Trigonotylus tenuis, Supplementary Figure 1J), ANGEN338-16 (Spilostethus pandurus, Supplementary Figure 1H) and ANGEN331-16 (Harmostes reflexulus, Supplementary Figure 1F) also had a similar reverse complementarity problem as ANGEN341-16. After correction, ANGEN341-16 matched Cletus pugnator (identity > 98%), but ANGEN331-16 did not have a good match (identity lower than 93%). The BLAST result for GBMTG4583-16 (Adelphocoris lineolatus, Supplementary Figure 1C) indicated a match with a Cytb sequence. GBMIN23751-13 (Brachycaudus lateralis, Supplementary Figure 1E) showed a 95.1% identity match with Brachycaudus helichrysi (FJ965596.1), as well as matches with other species in different genera, including Acyrthosiphon, Myzus, Fibriaphis, and Uroleucon with identity ranging from 92% to 94%. GBMTG4605-16 (Eurydema gebleri, Supplementary Figure 1B) had a 92.3% identity match with Eurydema dominulus. Moreover, GBMHH6231-14, BIPR006-13, and GBMHH8550-16 in the BOLD database were transferred from the GenBank, where they were annotated as “unverified” or “record removed.” However, this information was not updated in BOLD.
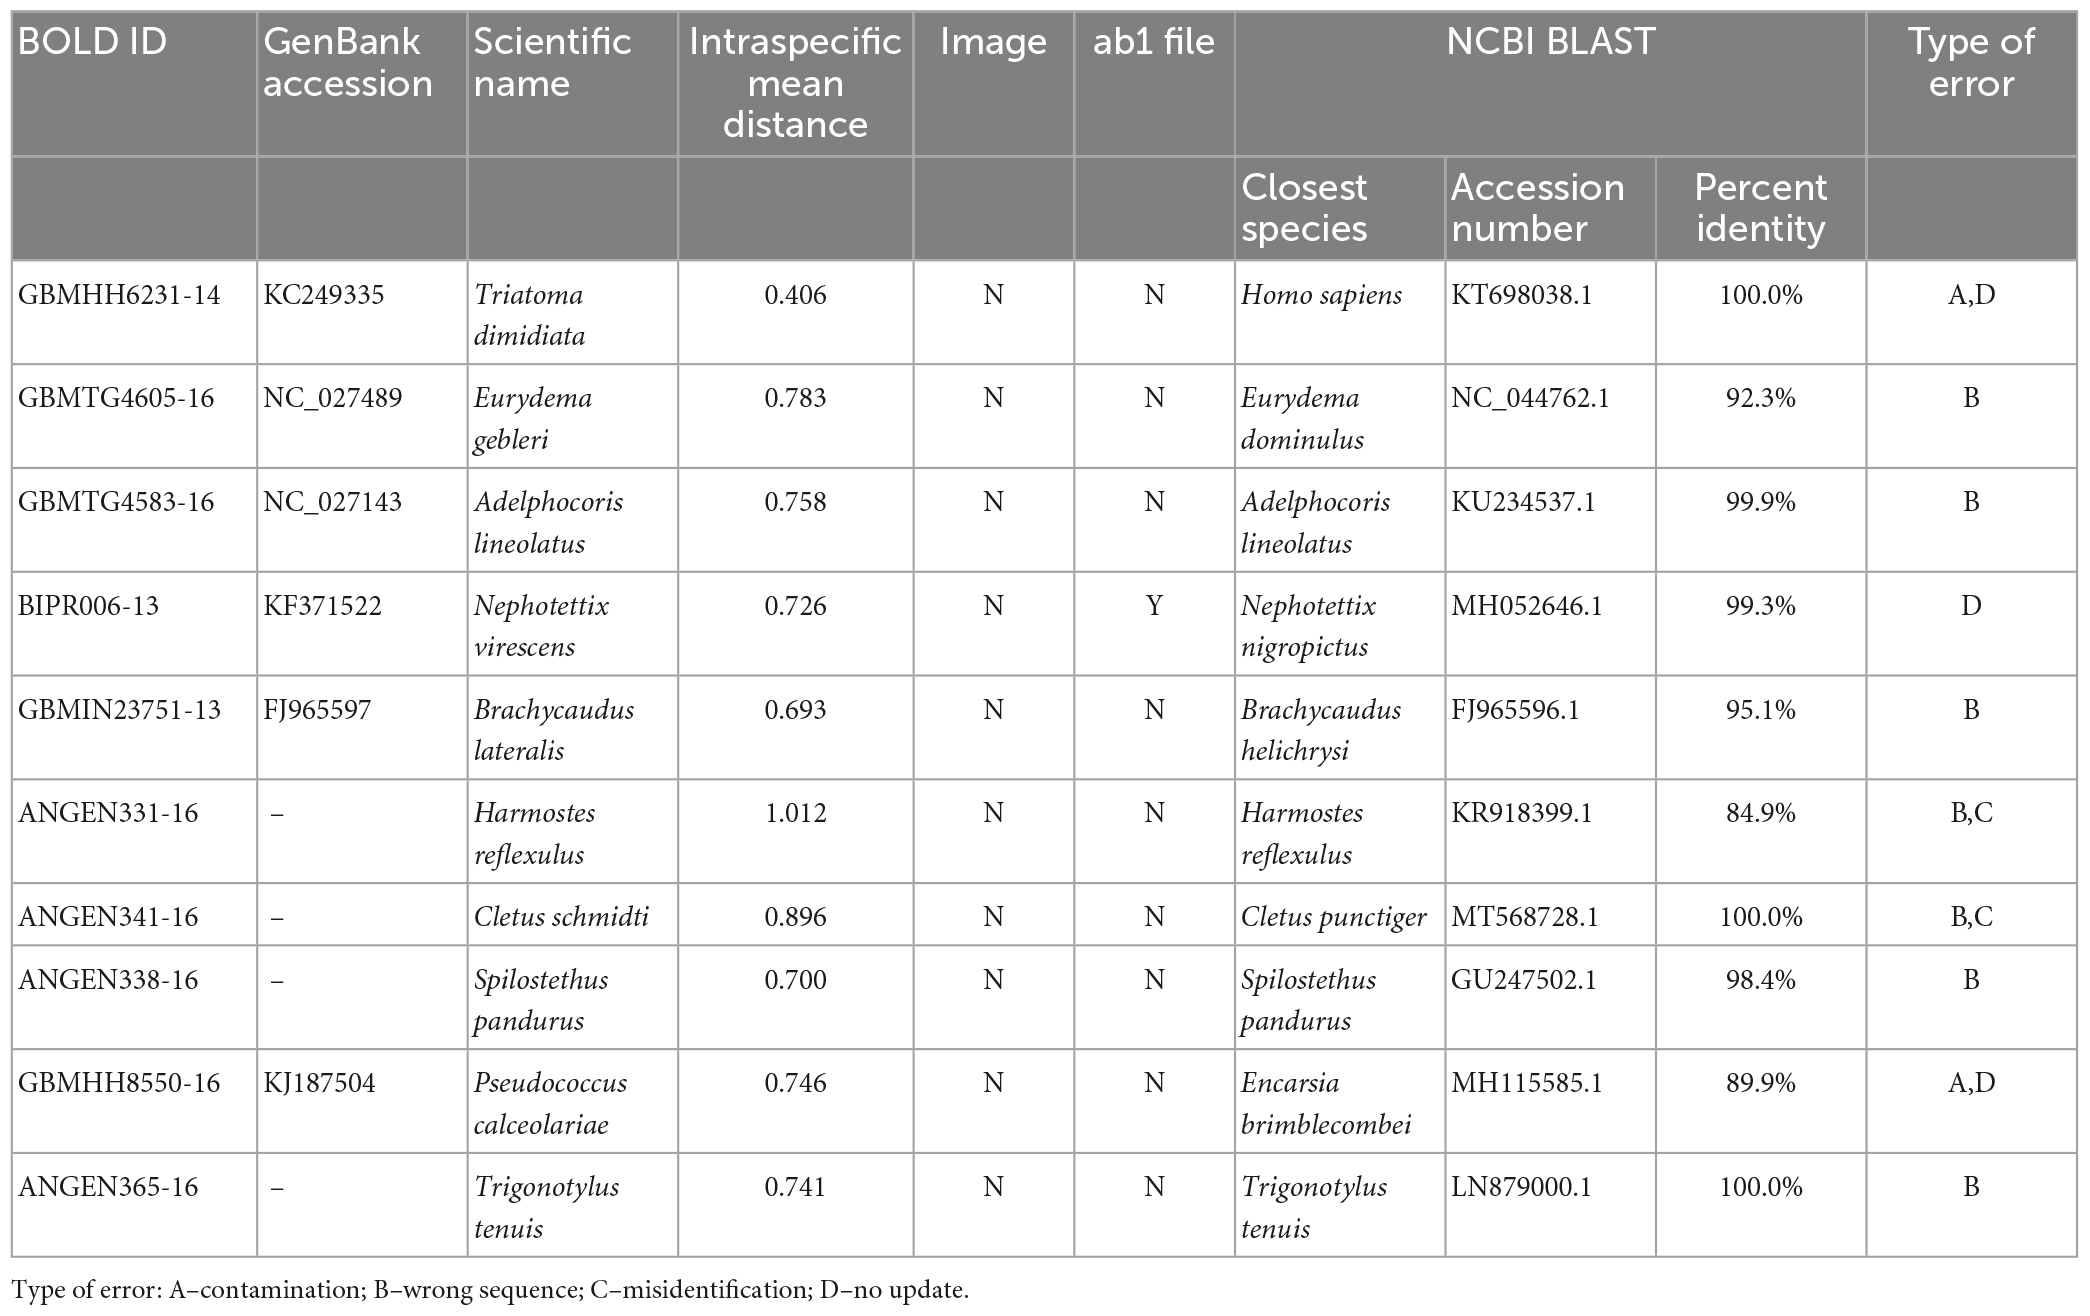
Table 1. BLAST results of ten sequences with very large intraspecific genetic distances.
3.3. Species groups with extremely small interspecific genetic distances
Ten groups of species pairs with very small interspecific genetic distances were selected to represent interspecific anomalies (Table 2). Retrieval of raw information related to these sequences, including specimen images and related literature, revealed three causes of extremely small interspecific distances can be divided into three types: (1) specimen misidentification (outliers cannot be matched with either species in a pair), (2) species confusion (outliers may be misidentified as another species in a pair), and (3) species complex (interspecific distances between two species in a pair are very small, but literature supports the presence of a species complex). After correcting or deleting the sequences that caused the distance anomalies, the revised data better distinguished the species within each pair— although most of them (8 out of 10) still had interspecific genetic distances less than 3%.
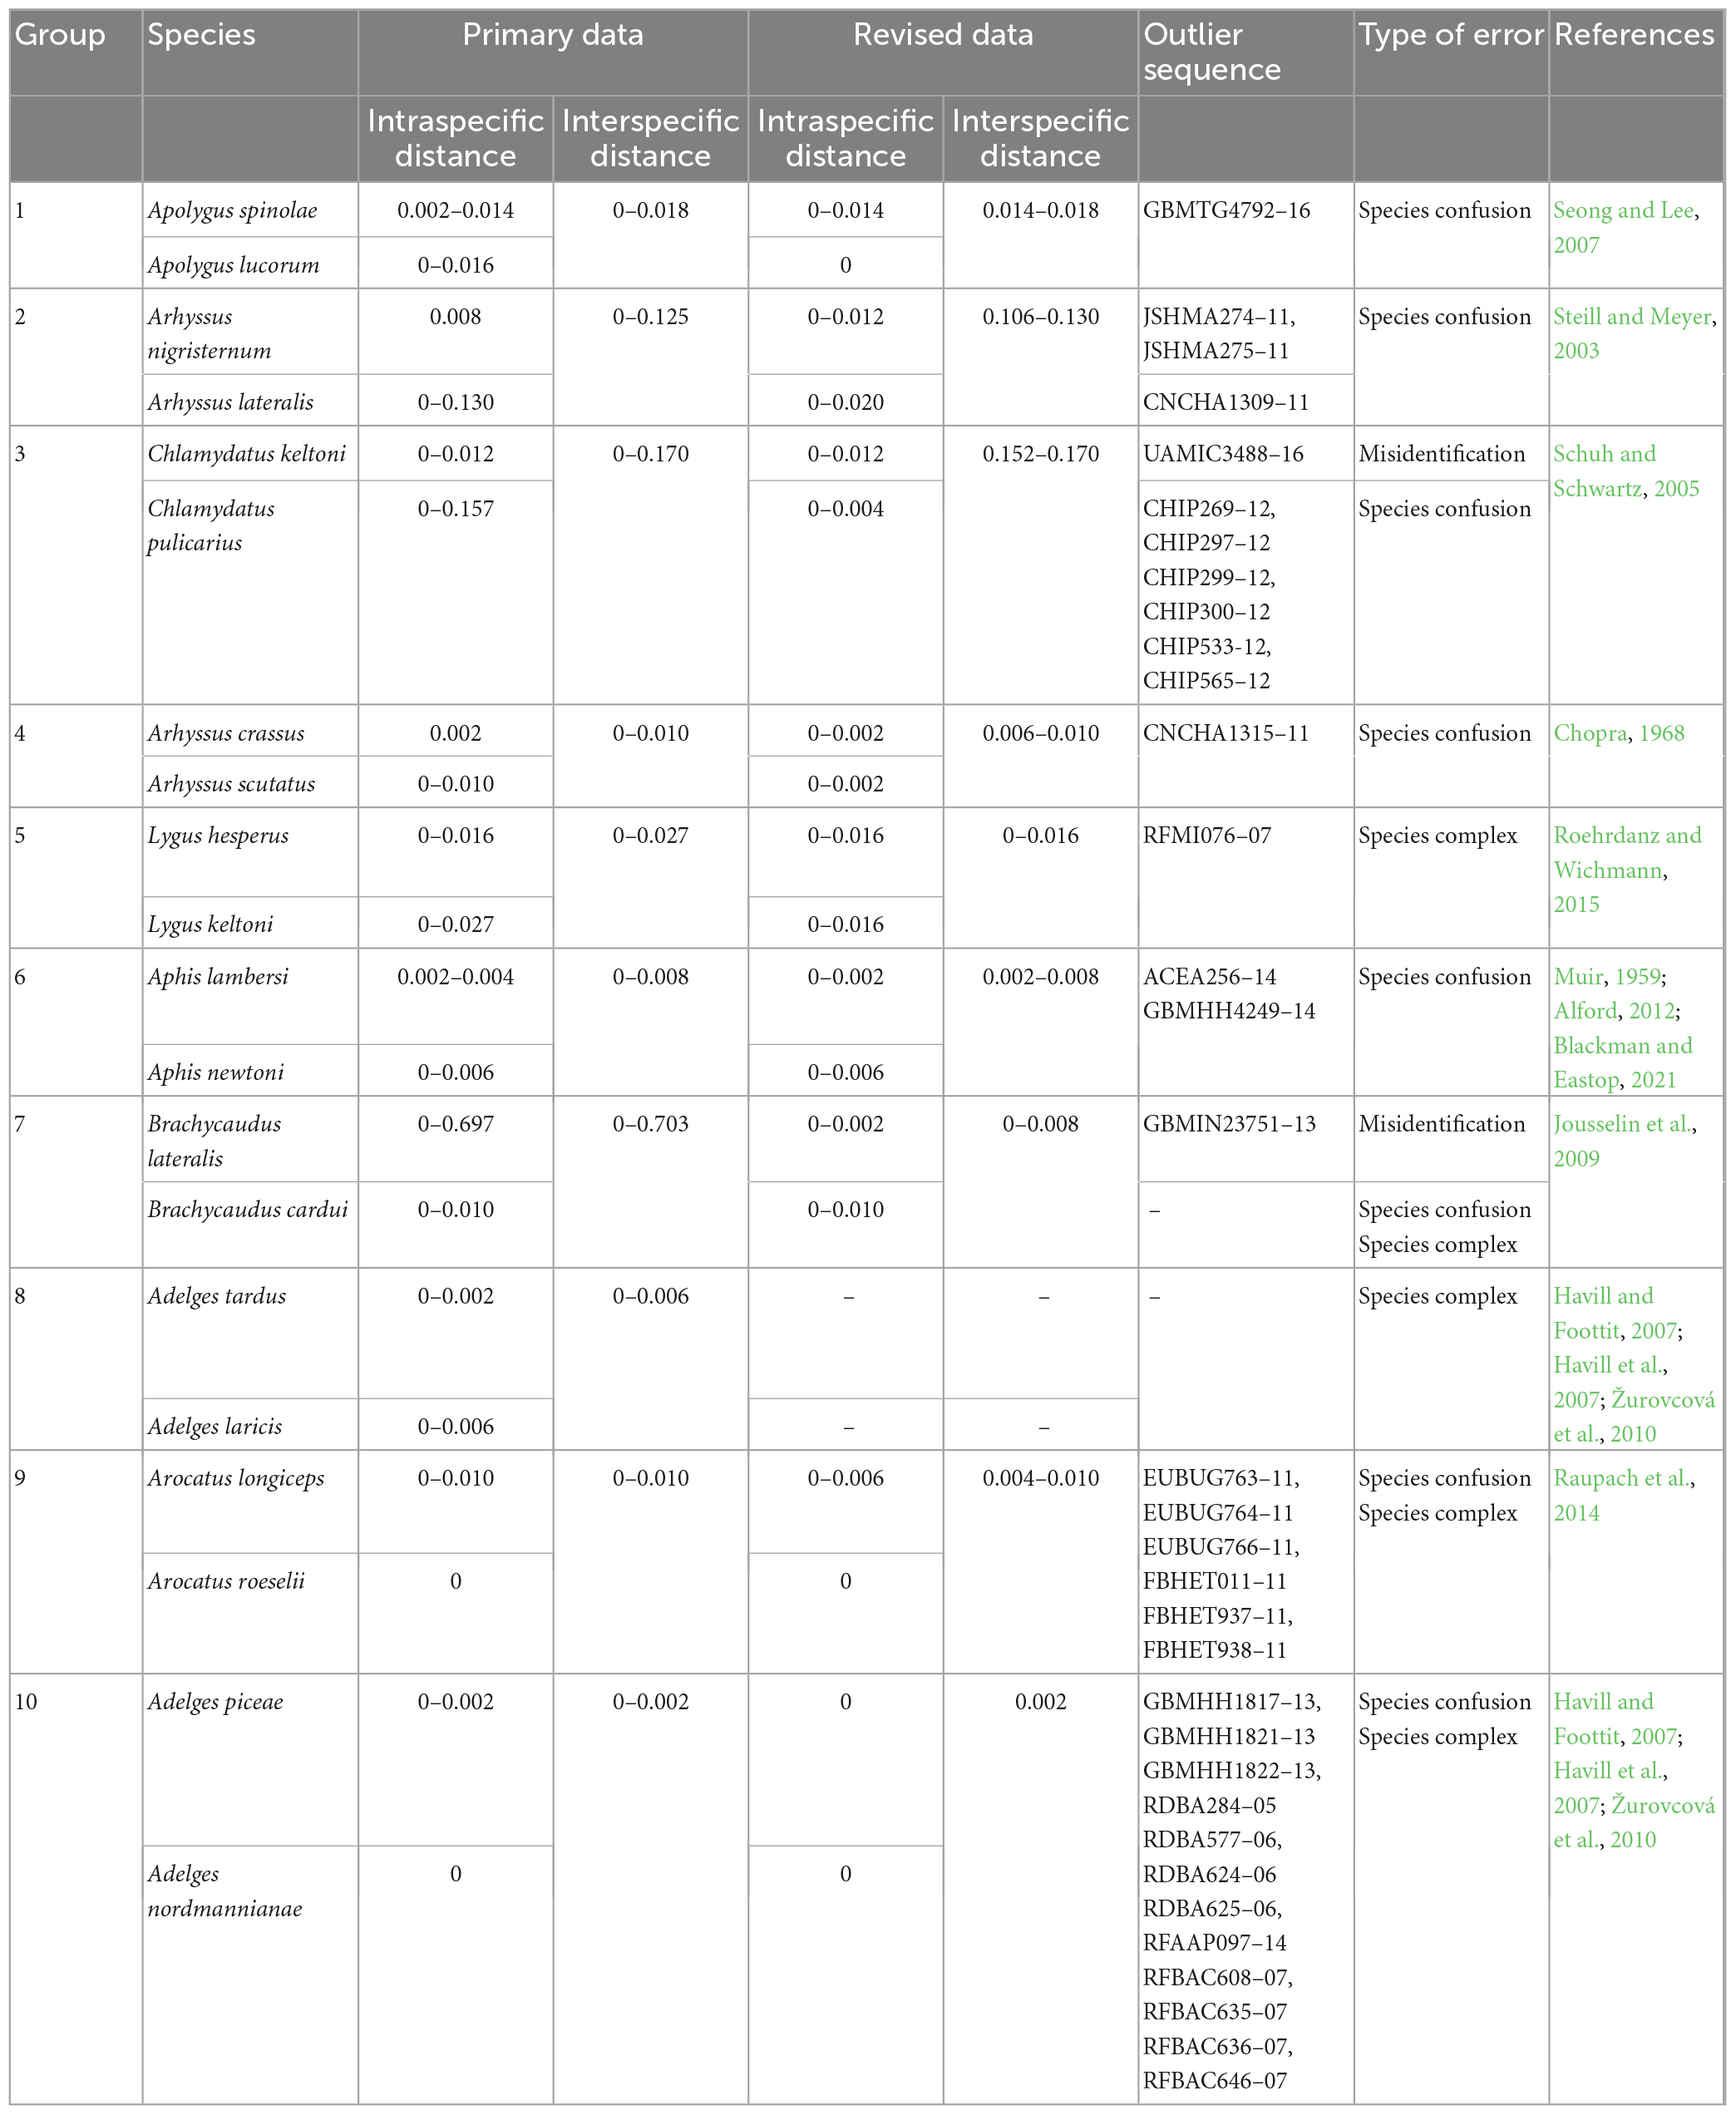
Table 2. Ten species pairs as interspecific genetic distance anomalies.
The zero interspecific distance observed in some pairs of species is likely due to species confusion. In group 1, GBMTG4792-16 was more closely related to Apolygus spinolae (with a mean distance of 0.006) but was misidentified as Apolygus lucorum. After revision, the intraspecific genetic distance of Apolygus lucorum decreased from 0.016 to 0, and the minimum interspecific genetic distance between Apolygus lucorum and Apolygus spinolae was increased from 0 to 0.014.
Interspecific distance anomalies may also be caused by misidentification. For example, UAMIC3488-16 in group 3 showed significant genetic differences with both Chlamydatus keltoni (0.131–0.146) and Chlamydatus pulicarius (0.046–0.050). However, based on the result of BLAST analysis, UAMIC3488-16 did not match neither of the two species and is probably a case of misidentification.
Sequences of a real species complex can also lead to a zero interspecific distance. For example, Lygus hesperus and Lygus keltoni in group 5 are morphologically indistinguishable (Roehrdanz and Wichmann, 2015), making it easy to assign the wrong species name. The genetic distances between them ranged from 0 to 0.016.
3.4. Cascade effect of questionable sequences
The citations of the ten sequences with abnormal intraspecific genetic distance were checked in Web of Science, PubMed, and Google Scholar to analyze the possible cascade effect of using questionable sequences. The results showed that they were mainly cited as references for reconstructing phylogenetic trees or annotating mitochondrial genomes. For example, GBMTG4605-16 (Genbank accession: NC027489) had only a 92.3% similarity to the closest sequence (Eurydema dominulus, Genbank accession: NC_044762.1). In Wang et al. (2019), GBMTG4605-16 was identified as Eurydema gebleri and clustered with Eurydema maracandica. In the phylogenetic tree of Pentatomidae reconstructed by Zhao et al. (2021), this sequence was considered a sister group or closely related to Pentatoma rufipes. This sequence was also used as a reference for the entire mitochondrial genome annotation of Eysarcoris aeneus, but not used to reconstruct the phylogenetic relationship (Zhao et al., 2019).
BIPR006-13 (Genbank accession: KF371522) was annotated as “unverified” in GenBank, and the mean genetic distance from Nephotettix virescens is as high as 0.72 (Table 1). However, this sequence was cited by Sreejith and Sebastian (2015) to discuss the molecular phylogeny and genetic analysis of Nephotettix virescens. They concluded that this sequence represented a specialized genetic lineage of N. virescens in Orissa region. Considering the accuracy of BIPR006-13 is questionable, their conclusion about population specialization may not be reliable.
4. Discussion
The analysis and comparison of insect barcodes with related raw specimen information indicate that some data errors, such as misidentification of specimen, sample confusion, and contamination, are often encountered in the DNA barcoding workflow. A large part of these errors is due to human factors. To give three examples, the lack of full recording of information in the process of specimen collection may cause incorrect specimen identification; negligence in sample preservation or experimental operation may directly lead to sample confusion; and improper operation during DNA extraction may introduce contamination. Therefore, routine practices must be improved in the DNA barcoding workflow to reduce human errors. Key steps for the improvement of the DNA barcoding workflow are presented and integrated in Figure 2.
Detailed field collection information is essential for retrospective verification of specimen information in a DNA barcoding project. BOLD requires data uploader to provide collection details such as collector names, collection dates, coordinates, and altitudes (Ratnasingham and Hebert, 2007). However, for the 10 sequences with abnormal intraspecific genetic distances analyzed in this study, complete specimen information was not retrievable for any of them. Insects have the ability to adjust their morphological and physiological traits to adapt to different environments or host plants, which can result in speciation (Schuh and Schwartz, 2005; Peccoud and Simon, 2010; Ma and Liu, 2020; Li et al., 2021a,b). As a consequence, habitat and host information can be crucial for species identification. This highlights the importance of considering the ecological context of specimens when analyzing DNA barcodes. Therefore, collectors are urged to record comprehensive details of collection information, including but not limited to geographic and ecological information, and these details should be deposited along with DNA barcode sequences. For example, Aphis lambersi and Aphis newtoni (Table 2) feed on different plants. If the uploader had recorded the host information, the two species would have been easily distinguished (Blackman and Eastop, 2021). Actually, missing coordinates is not the only issue that can cause the coordinates of sample collection sites to be unreliable; there are other factors to be considered as well. For instance, some data have been recorded with the coordinates of research institutions instead of the natural habitats (Peng et al., 2023). Therefore, collectors should carefully validate the accuracy of the raw information before uploading them, also ensure that all the necessary details of collection data are provided.
According to the workflow commonly used for DNA barcoding, specimens are preliminarily identified based on morphological characters and labeled with a species name. However, it remains challenging to perform morphological identification when external characters are damaged due to improper specimen handling (Chan et al., 2014), or when attempting to distinguish closely related species, such as those in a species complex (Jinbo et al., 2011). In fact, only highly skilled taxonomists are able to differentiate between morphologically similar species, which presents a significant barrier for beginners of taxonomy (Ebach and Holdrege, 2005; Žurovcová et al., 2010). Therefore, the inclusion of image data for specimens is critical for DNA barcodes, as it can assist data users in correcting any misidentification that may have occurred.
The acquisition of molecular data is an important prerequisite for species identification based on DNA barcodes. However, errors can occur during the processes of genomic DNA extraction, gene amplification, sequencing, or sequence alignment. For example, during DNA extraction, samples of different species may be mislabeled due to negligence, causing corresponding barcode sequences to be incorrectly labeled with a different species name. Additionally, the mixing of other organisms into target samples may contaminate the extracted DNA, leading to the barcode sequences being labeled with wrong names. GBMHH6231-14 (Triatoma dimidiata; Table 1 and Supplementary Figure 1A) is a typical example of DNA contamination due to the introduction of human DNA. For small insects such as aphids and scale insects, where the entire body is used for DNA extraction (Donald et al., 2012; Asghar et al., 2015), sequence of symbionts or parasites within the insect body may be included. GBMHH8550-16 (Pseudococcus calceolariae, Supplementary Figure 1I) is an example of sequence anomaly caused by parasitic contamination. To avoid such issues, obtained barcode sequences can be partly validated by submitting them to a BLAST search.
Accurate species identification is of great importance in biological research. Incorrect identification could have a negative cascade effect, for instance, leading to misunderstandings of speciation and phylogeny, or resulting in ill-advised recommendations and decisions on species control and protection (Bickford et al., 2007; Barratt et al., 2018; Erlank et al., 2018; Peres et al., 2021). Given that potential errors can arise during species identification based on both morphology and DNA barcodes, interactive validation is required for both identification approaches to provide a quality check for species names (Figure 2).
Apart from accepting barcode data uploaded by users, the BOLD database also periodically mines sequence data from other databases such as GenBank (Meiklejohn et al., 2019). However, GenBank usually does not have metadata such as sequence chromatograms, specimen details or images (Benson et al., 2017). As a result, the mined data in BOLD often lacks detailed specimen information. Furthermore, some sequences, such as GBMHH6231-14 (Triatoma dimidiata, Supplementary Figure 1A), BIPR006-13 (Nephotettix virescens, Supplementary Figure 1D), and GBMHH8550-16 (Pseudococcus calceolariae, Supplementary Figure 1I), have been marked as unreliable sequences (unverified) or have been deleted (record removed) in GenBank. However, BOLD has not updated such information. To ensure the reliability of data for future reuse, the possibility of these inconsistencies in publicly held databases must be carefully considered as a problem.
As for the distribution of genetic distances of the barcode dataset used herein, when species with less than five sequences were excluded, the extent of overlap between intraspecific and interspecific genetic distances ranging from 0 to 10.0% showed a slight decrease (Figure 4), indicating a better demonstration especially for interspecific genetic distances. This suggests that, to better demonstrate intra- and interspecific genetic distances for a large dataset, it is preferable to omit taxa with too few sequences. Additionally, to more accurately estimate intraspecific genetic distances of a species, it is recommended to use sequence data from multiple populations rather than a single one. Otherwise, the intraspecific genetic distances may be underestimated.
Data availability statement
The original contributions presented in this study are included in the article/Supplementary material, further inquiries can be directed to the corresponding author.
Author contributions
XH conceptualized the study. ZC, QLi, and XH collected and analyzed the data. ZC wrote the draft of the manuscript. JD, QLiu, and XH revised the manuscript. All authors contributed to the article and approved the submitted version.
Funding
This research was supported by the National Natural Science Foundation of China (Grant number: 32270499) and the Fujian Provincial Department of Science and Technology (2015J06005).
Acknowledgments
We thank the editor and the reviewers for their constructive comments.
Conflict of interest
The authors declare that the research was conducted in the absence of any commercial or financial relationships that could be construed as a potential conflict of interest.
Publisher’s note
All claims expressed in this article are solely those of the authors and do not necessarily represent those of their affiliated organizations, or those of the publisher, the editors and the reviewers. Any product that may be evaluated in this article, or claim that may be made by its manufacturer, is not guaranteed or endorsed by the publisher.
Supplementary material
The Supplementary Material for this article can be found online at: https://www.frontiersin.org/articles/10.3389/fevo.2023.1149839/full#supplementary-material
Supplementary Figure 1 | Maximum likelihood phylogenetic trees of ten taxonomic groups including sequences with very large intraspecific distances. Orange areas show the sequences with very large intraspecific distances. The maximum likelihood (ML) tree was constructed by IQ-TREE. (A) Triatoma dimidiata; (B) Eurydema gebleri; (C) Adelphocoris lineolatus; (D) Nephotettix virescens; (E) Brachycaudus lateralis; (F) Harmostes reflexulus; (G) Cletus schmidti; (H) Spilostethus pandurus; (I) Pseudococcus calceolariae; (J) Trigonotylus tenuis.
References
Asghar, U., Malik, M. F., Anwar, F., Javed, A., and Raza, A. (2015). DNA extraction from insects by using different techniques: A review. Adv. Entomol. 3, 132–138. doi: 10.4236/ae.2015.34016
Ashelford, K. E., Chuzhanova, N. A., Fry, J. C., Jones, A. J., and Weightman, A. J. (2005). At least 1 in 20 16S rRNA sequence records currently held in public repositories is estimated to contain substantial anomalies. Appl. Environ. Microb. 71, 7724–7736. doi: 10.1128/AEM.71.12.7724-7736.2005
Bandelt, H. J., Lahermo, P., Richards, M., and Macaulay, V. (2001). Detecting errors in mtDNA data by phylogenetic analysis. Int. J. Legal. Med. 115, 64–69. doi: 10.1007/s004140100228
Bandelt, H. J., Quintana-Murci, L., Salas, A., and Macaulay, V. (2002). The fingerprint of phantom mutations in mitochondrial DNA data. Am. J. Hum. Genet. 71, 1150–1160. doi: 10.1086/344397
Barratt, B. I. P., Cock, M. J. W., and Oberprieler, R. G. (2018). Weevils as targets for biological control, and the importance of taxonomy and phylogeny for efficacy and biosafety. Divers. Basel 10:73. doi: 10.3390/d10030073
Benson, D. A., Cavanaugh, M., Clark, K., Karsch-Mizrachi, I., Lipman, D. J., Ostell, J., et al. (2017). GenBank. Nucleic Acids Res. 45, D37–D42. doi: 10.1093/nar/gkw1070
Bickford, D., Lohman, D. J., Sodhi, N. S., Ng, P. K. L., Meier, R., Winker, K., et al. (2007). Cryptic species as a window on diversity and conservation. Trends Ecol. Evol. 22, 148–155. doi: 10.1016/j.tree.2006.11.004
Blackman, R. L., and Eastop, V. F. (2021). Aphids on the World’s plants: An onlineidentification and information guide. Available online at: www.aphidsonworldsplants.info (accessed January 3, 2021).
Carew, M. E., Pettigrove, V. J., Metzeling, L., and Hoffmann, A. A. (2013). Environmental monitoring using next generation sequencing: rapid identification of macroinvertebrate bioindicator species. Front. Zool. 10:45. doi: 10.1186/1742-9994-10-45
Carvalho, D. C., Palhares, R. M., Drummond, M. G., and Frigo, T. B. (2015). DNA Barcoding identification of commercialized seafood in South Brazil: A governmental regulatory forensic program. Food Control 50, 784–788. doi: 10.1016/j.foodcont.2014.10.025
Chan, A., Chiang, L. P., Hapuarachchi, H. C., Tan, C. H., Pang, S. C., Lee, R., et al. (2014). DNA barcoding: Complementing morphological identification of mosquito species in Singapore. Parasites Vector 7:569. doi: 10.1186/s13071-014-0569-4
Chopra, N. P. (1968). A revision of the genus Arhyssus Stål. Ann. Entomol. Soc. Am. 61, 629–655. doi: 10.1093/aesa/61.3.629
Donald, H. M., Wood, C. W., Benowitz, K. M., Johnson, R. A., Brodie, E. D. I. I. I., and Formica, V. A. (2012). Nondestructive sampling of insect DNA from defensive secretion. Mol. Ecol. Resour. 12, 856–860. doi: 10.1111/j.1755-0998.2012.03154.x
Ebach, M. C., and Holdrege, C. (2005). DNA barcoding is no substitute for taxonomy. Nature 434:697. doi: 10.1038/434697b
Erlank, E., Koekemoer, L. L., and Coetzee, M. (2018). The importance of morphological identification of African anopheline mosquitoes (Diptera: Culicidae) for malaria control programmes. Malaria J. 17:43. doi: 10.1186/s12936-018-2189-5
Foottit, R. G., Maw, H. E. L., von Dohlen, C. D., and Hebert, P. D. N. (2008). Species identification of aphids (Insecta: Hemiptera: Aphididae) through DNA barcodes. Mol. Ecol. Resour. 8, 1189–1201. doi: 10.1111/j.1755-0998.2008.02297.x
Forster, P. (2003). To err is human. Ann. Hum. Genet. 67, 2–4. doi: 10.1046/j.1469-1809.2003.00002.x
Gwiazdowski, R. A., Foottit, R. G., Maw, H. E. L., and Hebert, P. D. N. (2015). The Hemiptera (Insecta) of Canada: Constructing a reference library of DNA barcodes. PLoS One 10:e0125635. doi: 10.1371/journal.pone.0125635
Hajibabaei, M., Janzen, D. H., Burns, J. M., Hallwachs, W., and Hebert, P. D. N. (2006). DNA barcodes distinguish species of tropical Lepidoptera. Proc. Natl. Acad. Sci. U.S.A. 103, 968–971. doi: 10.1073/pnas.0510466103
Havill, N. P., and Foottit, R. G. (2007). Biology and evolution of Adelgidae. Annu. Rev. Entomol. 52, 325–349. doi: 10.1146/annurev.ento.52.110405.091303
Havill, N. P., Foottit, R. G., and von Dohlen, C. D. (2007). Evolution of host specialization in the Adelgidae (Insecta: Hemiptera) inferred from molecular phylogenetics. Mol. Phylogenet. Evol. 44, 357–370. doi: 10.1016/j.ympev.2006.11.008
Hebert, P. D. N., Cywinska, A., Ball, S. L., and deWaard, J. R. (2003). Biological identifications through DNA barcodes. Proc. R. Soc. B 270, 313–321. doi: 10.1098/rspb.2002.2218
Hebert, P. D. N., Penton, E. H., Burns, J. M., Janzen, D. H., and Hallwachs, W. (2004). Ten species in one: DNA barcoding reveals cryptic species in the neotropical skipper butterfly Astraptes fulgerator. Proc. Natl. Acad. Sci. U.S.A. 101, 14812–14817. doi: 10.1073/pnas.0406166101
Hrcek, J., Miller, S. E., Quicke, D. L., and Smith, M. A. (2011). Molecular detection of trophic links in a complex insect host-parasitoid food web. Mol. Ecol. Resour. 11, 786–794. doi: 10.1111/j.1755-0998.2011.03016.x
Ivanova, N. V., deWaard, J. R., and Hebert, P. D. N. (2006). An inexpensive, automation-friendly protocol for recovering high-quality DNA. Mol. Ecol. Notes 6, 998–1002. doi: 10.1111/j.1471-8286.2006.01428.x
Jinbo, U., Kato, T., and Ito, M. (2011). Current progress in DNA barcoding and future implications for entomology. Entomol. Sci. 14, 107–124. doi: 10.1111/j.1479-8298.2011.00449.x
Jones, L., Twyford, A. D., Ford, C. R., Rich, T. C. G., Davies, H., Forrest, L. L., et al. (2021). Barcode UK: A complete DNA barcoding resource for the flowering plants and conifers of the United Kingdom. Mol. Ecol. Resour. 21, 2050–2062. doi: 10.1111/1755-0998.13388
Jousselin, E., Desdevises, Y., and Coeur d’acier, A. (2009). Fine-scale cospeciation between Brachycaudus and Buchnera aphidicola: Bacterial genome helps define species and evolutionary relationships in aphids. Proc. R. Soc. B 276, 187–196. doi: 10.1098/rspb.2008.0679
Katoh, K., and Standley, D. M. (2013). MAFFT multiple sequence alignment software version 7: Improvements in performance and usability. Mol. Biol. Evol. 30, 772–780. doi: 10.1093/molbev/mst010
Kekkonen, M., and Hebert, P. D. N. (2014). DNA barcode-based delineation of putative species: Efficient start for taxonomic workflows. Mol. Ecol. Resour. 14, 706–715. doi: 10.1111/1755-0998.12233
Kimura, M. (1980). A simple method for estimating evolutionary rates of base substitutions through comparative studies of nucleotide sequences. J. Mol. Evol. 16, 111–120. doi: 10.1007/BF01731581
Kumar, S., Stecher, G., and Tamura, K. (2016). MEGA7: molecular evolutionary genetics analysis version 7.0 for bigger datasets. Mol. Biol. Evol. 33, 1870–1874. doi: 10.1093/molbev/msw054
Lee, Y., Lee, W., Kanturski, M., Foottit, R. G., Akimoto, S. I., and Lee, S. (2017). Cryptic diversity of the subfamily Calaphidinae (Hemiptera: Aphididae) revealed by comprehensive DNA barcoding. PLoS One 12:e0176582. doi: 10.1371/journal.pone.0176582
Li, Q., Chen, C., Wu, Y. X., Siddiqui, J. A., Lu, C. C., Cheng, Z. T., et al. (2021a). Specialization on Ficus supported by genetic divergence and morphometrics in sympatric host-populations of the camellia aphid, Aphis aurantii. Front. Ecol. Evol. 9:786450. doi: 10.3389/fevo.2021.786450
Li, Q., Lin, X. L., Li, J. J., Liu, B., and Huang, X. L. (2021b). Differentiation in the eastern Asian Periphyllus koelreuteriae (Hemiptera: Aphididae) species complex driven by climate and host plant. Biol. J. Linn. Soc. 132, 509–520. doi: 10.1093/biolinnean/blaa206
Liu, Q. H., Jiang, L. Y., and Qiao, G. X. (2013). DNA barcoding of Greenideinae (Hemiptera: Aphididae) with resolving taxonomy problems. Invertebr. Syst. 27, 428–438. doi: 10.1071/Is13014
Lumley, L. M., and Sperling, F. A. H. (2010). Integrating morphology and mitochondrial DNA for species delimitation within the spruce budworm (Choristoneura fumiferana) cryptic species complex (Lepidoptera: Tortricidae). Syst. Entomol. 35, 416–428. doi: 10.1111/j.1365-3113.2009.00514.x
Ma, L., and Liu, X. D. (2020). Adaptive changes in morph and preference induced by novel host plants mediate host specialization of the cotton–melon aphid. Arthropod Plant Interact. 14, 453–462. doi: 10.1007/s11829-020-09756-7
Meier, R., Shiyang, K., Vaidya, G., and Ng, P. K. L. (2006). DNA barcoding and taxonomy in Diptera: A tale of high intraspecific variability and low identification success. Syst. Biol. 55, 715–728. doi: 10.1080/10635150600969864
Meiklejohn, K. A., Damaso, N., and Robertson, J. M. (2019). Assessment of BOLD and GenBank–Their accuracy and reliability for the identification of biological materials. PLoS One 14:e0217084. doi: 10.1371/journal.pone.0217084
Meyer, C. P., and Paulay, G. (2005). DNA barcoding: error rates based on comprehensive sampling. PLoS Biol. 3:e422. doi: 10.1371/journal.pbio.0030422
Mishra, P., Kumar, A., Nagireddy, A., Mani, D. N., Shukla, A. K., Tiwari, R., et al. (2015). DNA barcoding: an efficient tool to overcome authentication challenges in the herbal market. Plant Biotechnol. J. 14, 8–21. doi: 10.1111/pbi.12419
Muir, D. A. (1959). The ant-aphid-plant relationship in West Dunbartonshire. J. Anim. Ecol. 28, 133–140. doi: 10.2307/2019
Park, D. S., Foottit, R., Maw, E., and Hebert, P. D. N. (2011). Barcoding bugs: DNA-based identification of the true bugs (Insecta: Hemiptera: Heteroptera). PLoS One 6:e18749. doi: 10.1371/journal.pone.0018749
Peccoud, J., and Simon, J. C. (2010). The pea aphid complex as a model of ecological speciation. Ecol. Entomol. 35, 119–130. doi: 10.1111/j.1365-2311.2009.01147.x
Peng, X., Li, Q., Cheng, Z. T., and Huang, X. L. (2023). The geography of genetic data: Current status and future perspectives. Front. Ecol. Evol. 11:1112636. doi: 10.3389/fevo.2023.1112636
Peres, P. H. F., Grotta-Neto, F., Luduvério, D. J., de Oliveira, M. L., and Duarte, J. M. B. (2021). Implications of unreliable species identification methods for Neotropical deer conservation planning. Perspect. Ecol. Conser. 19, 435–442. doi: 10.1016/j.pecon.2021.08.001
Ratnasingham, S., and Hebert, P. D. N. (2007). BOLD: The barcode of life data system (www.barcodinglife.org). Mol. Ecol. Notes 7, 355–364. doi: 10.1111/j.1471-8286.2007.01678.x
Raupach, M. J., Hendrich, L., Küchler, S. M., Deister, F., Morinière, J., and Gossner, M. M. (2014). Building-up of a DNA barcode library for true bugs (Insecta: Hemiptera: Heteroptera) of Germany reveals taxonomic uncertainties and surprises. PLoS One 9:e106940. doi: 10.1371/journal.pone.0106940
Roehrdanz, R. L., and Wichmann, S. S. (2015). 28S ribosomal RNA sequences separate five prominent Lygus (Hemiptera: Miridae) pest species into three species clusters. Ann. Entomol. Soc. Am. 108, 211–214. doi: 10.1093/aesa/sav002
Ross, H. A., Murugan, S., and Li, W. L. S. (2008). Testing the reliability of genetic methods of species identification via simulation. Syst. Biol. 57, 216–230. doi: 10.1080/10635150802032990
Schuh, R. T., and Schwartz, M. D. (2005). Review of North American Chlamydatus Curtis species, with new synonymy and the description of two new species (Heteroptera: Miridae: Phylinae). Am. Mus. Novit. 2005, 1–55.
Seong, J., and Lee, S. (2007). Taxonomic notes on two Apolygus species (Heteroptera: Miridae: Mirinae) in Korea. J. Asia Pac. Entomol. 10, 323–327. doi: 10.1016/s1226-8615(08)60370-2
Shen, Y. Y., Chen, X., and Murphy, R. W. (2013). Assessing DNA barcoding as a tool for species identification and data quality control. PLoS One 8:e57125. doi: 10.1371/journal.pone.0057125
Smith, M. A., Bertrand, C., Crosby, K., Eveleigh, E. S., Fernandez-Triana, J., Fisher, B. L., et al. (2012). Wolbachia and DNA barcoding insects: Patterns, potential, and problems. PLoS One 7:e36514. doi: 10.1371/journal.pone.0036514
Sreejith, K., and Sebastian, C. D. (2015). Molecular phylogeny and genetic analysis of green leafhopper – Nephotettix virescens (distant) using mitochondrial COI gene. Indian J. Sci. Technol. 8, 61–64. doi: 10.17485/ijst/2015/v8i1/52842
Vences, M., Thomas, M., Bonett, R. M., and Vieites, D. R. (2005). Deciphering amphibian diversity through DNA barcoding: chances and challenges. Philos. Trans. R. Soc. B 360, 1859–1868. doi: 10.1098/rstb.2005.1717
Wang, Y. Y., Duan, Y. B., and Yang, X. F. (2019). The complete mitochondrial genome of Plautia crossota (Hemiptera: Pentatomidae). Mitochondrial DNA B 4, 2281–2282. doi: 10.1080/23802359.2019.1627924
Wilson, J. J., Sing, K. W., and Jaturas, N. (2019). “DNA barcoding: Bioinformatics workflows for beginners,” in Encyclopedia of bioinformatics and computational biology, eds S. Ranganathan, K. Nakai, and C. Sconbach (Oxford: Academic Press), 985–995.
Zahiri, R., Lafontaine, J. D., Schmidt, B. C., deWaard, J. R., Zakharov, E. V., and Hebert, P. D. N. (2014). A transcontinental challenge—A test of DNA barcode performance for 1,541 species of Canadian Noctuoidea (Lepidoptera). PLoS One 9:e92797. doi: 10.1371/journal.pone.0092797
Zhao, L., Wei, J. F., Zhao, W. Q., Chen, C., Gao, X. Y., and Zhao, Q. (2021). The complete mitochondrial genome of Pentatoma rufipes (Hemiptera, Pentatomidae) and its phylogenetic implications. Zookeys 1042, 51–72. doi: 10.3897/zookeys.1042.62302
Zhao, Q., Chen, C., Liu, J., and Wei, J. F. (2019). Characterization of the complete mitochondrial genome of Eysarcoris aeneus (Heteroptera: Pentatomidae), with its phylogenetic analysis. Mitochondrial DNA B 4, 2096–2097. doi: 10.1080/23802359.2019.1622465
Zhu, X. C., Chen, J., Chen, R., Jiang, L. Y., and Qiao, G. X. (2017). DNA barcoding and species delimitation of Chaitophorinae (Hemiptera, Aphididae). ZooKeys 656, 25–50. doi: 10.3897/zookeys.656.11440
Keywords: DNA barcode, Hemiptera, sequence data, taxonomy, human errors
Citation: Cheng Z, Li Q, Deng J, Liu Q and Huang X (2023) The devil is in the details: Problems in DNA barcoding practices indicated by systematic evaluation of insect barcodes. Front. Ecol. Evol. 11:1149839. doi: 10.3389/fevo.2023.1149839
Received: 23 January 2023; Accepted: 09 March 2023;
Published: 23 March 2023.
Edited by:
Zheng Wang, Yale University, United StatesReviewed by:
Leonard Munstermann, Yale University, United StatesŁukasz Kajtoch, Institute of Systematics and Evolution of Animals, Polish Academy of Sciences, Poland
Copyright © 2023 Cheng, Li, Deng, Liu and Huang. This is an open-access article distributed under the terms of the Creative Commons Attribution License (CC BY). The use, distribution or reproduction in other forums is permitted, provided the original author(s) and the copyright owner(s) are credited and that the original publication in this journal is cited, in accordance with accepted academic practice. No use, distribution or reproduction is permitted which does not comply with these terms.
*Correspondence: Xiaolei Huang, aHVhbmd4bEBmYWZ1LmVkdS5jbg==