 Anieke Brombacher
 Paul A. Wilson1
 Ian Bailey
 Thomas H. G. Ezard
- 1Ocean & Earth Science, University of Southampton, Waterfront Campus, National Oceanography Centre Southampton, Southampton, United Kingdom
- 2Camborne School of Mines and Environmental Sustainability Institute, University of Exeter, Exeter, United Kingdom
- 3Biological Sciences, University of Southampton, Southampton, United Kingdom
Introduction: Lines of least resistance, or the direction of maximum phenotypic variation, are reliable predictive tools for directions of evolutionary divergence through time. However, the consistency of trait covariation patterns through space, i.e. in different populations of the same taxa inhabiting different environmental settings, remains poorly established.
Methods: To test whether the predicted direction of evolutionary change is the same through time as it is across space, we compare within- and among-population trait covariation patterns across six Atlantic populations of two planktonic foraminifera species. Our study interval is 600,000 years long, spans the Neogene/Quaternary boundary and includes Earth’s most recent major natural shift in global climate state: the intensification of Northern Hemisphere Glaciation.
Results: We show that, despite powerful global temporal changes in climate, there is a strong spatial signal in the evolutionary response. Population-specific trait covariation slopes vary among sites, climate phases and core/edge position within the species’ biogeographic range.
Discussion: Our results imply that the direction of expected evolutionary change does not align across populations. This suggests that trait covariation patterns in the study species are driven by adaptation to local environmental settings rather than species-wide constraints. Single populations should therefore not be used to predict the response of other populations, even if they are faced with similar environmental conditions. We caution against using individual populations to project future response of other/global populations unless the underlying mechanism for trait covariation is shown to be universal.
1. Introduction
To understand changes in morphological diversity through time and across space, we need a predictive framework for species’ response to environmental change. Selection on one trait can generate a response to selection in a covarying trait (Lande, 1979), and this covariance constrains the expected evolutionary change in the direction of maximum variation, called the line of least evolutionary resistance (Schluter, 1996). Lines of least resistance are predictive tools for the most likely direction of future evolutionary divergence on generational (Lande, 1979; Lande and Arnold, 1983; Bégin et al., 2003) and microevolutionary (<1 million years) time scales (Hunt, 2007; Voje et al., 2013; Firmat et al., 2014; Brombacher et al., 2017a). Even on long (>10 million years) macroevolutionary time scales, evolution has been shown to follow lines of least evolutionary resistance (Marroig and Cheverud, 2005; Renaud et al., 2006; Hunt, 2007; Hansen and Houle, 2008; Renaud and Auffray, 2013; Porto et al., 2015; McGlothlin et al., 2018; Chakrabarty and Schielzeth, 2020), although trait covariation constraints can erode after several million years (Hunt, 2007; Voje and Hansen, 2012) and deviation from the lines of least evolutionary resistance increases with phylogenetic distance among species (Marroig and Cheverud, 2005; Chakrabarty and Schielzeth, 2020).
The principles of lines of least evolutionary resistance imply that when patterns in population-specific trait covariance align across space, all populations should respond similarly to the same environmental pressures over generational and microevolutionary time scales (Peiman and Robinson, 2017). Similar trait covariation patterns among populations can therefore project morphological trajectories over long microevolutionary time scales. However, different selection pressures among populations experiencing distinct local conditions can select for different trait combinations (Brombacher et al., 2021), rotate population-specific lines of least resistance (Steppan et al., 2002; Arnold et al., 2008) and thus, predict different directions of divergence. If all sites are on parallel evolutionary trajectories, we might expect large-scale regulation by the internal constraints of trait covariation. However, the consistency of trait covariation patterns across populations in different environmental settings remains poorly established (Peiman and Robinson, 2017).
To test whether the expected direction of evolutionary change aligns among different populations of the same taxa, we reconstruct lines of least evolutionary resistance on 29,438 individuals of two ecologically similar planktonic foraminifera species at six different localities in the Atlantic Ocean. These sites span ~83° of latitude from the species’ northern-most extent in the sub-polar regions of the Northern Hemisphere to the subtropics of the Southern Hemisphere (Figure 1). Our study interval includes Earth’s last major shift in global climate state: the intensification of Northern Hemisphere Glaciation (Westerhold et al., 2020), during which Earth transitioned from a unipolar glacial state, with large ice sheets only on Antarctica (Spray et al., 2019), to one that was sufficiently cool to induce extensive ice sheet growth in the high latitudes of the Northern Hemisphere and rafting of icebergs across the North Atlantic Ocean (Shackleton et al., 1984; Bailey et al., 2013). The climatic effects of this intensification of glaciation in the northern hemisphere were global and include a steepening of latitudinal temperature gradients (Lawrence et al., 2009; Herbert et al., 2010; Naafs et al., 2012), strengthening and/or latitudinal adjustment of major planetary wind systems, a cross-latitude increased supply of wind-blown dust from the continents to the oceans (e.g., Martínez-Garcia et al., 2011; Lang et al., 2014; Abell et al., 2021; Crocker et al., 2022) and the development of major glacial-interglacially paced change in ocean circulation and ventilation (Lang et al., 2016). This provides an attractive system to test the consistency of lines of least resistance through time and across space because, a priori, we might expect the strong temporal signal of climate change to overwhelm the spatial signal in the evolutionary response.
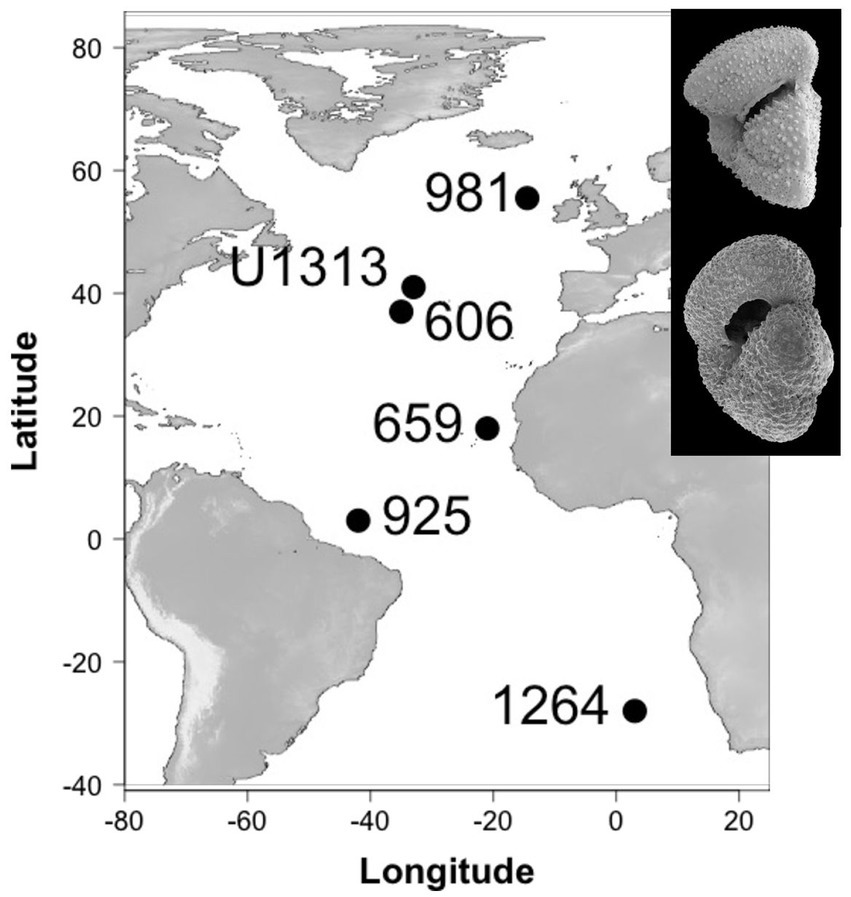
Figure 1. Study site locations and study species (inset, top: Truncorotalia crassaformis, bottom: Globoconella puncticulata).
We divide our 600,000 year-long study interval into an Initial Phase, with environmental conditions most similar to the early Pliocene (Lisiecki and Raymo, 2005; Mudelsee and Raymo, 2005), a Transition Phase starting at Marine Isotope Stage (MIS) G6 (2.72 Ma) that marks the onset of high-amplitude (~1.5 per mill δ18O) 41-kyr-paced glacial–interglacial cycles (Lisiecki and Raymo, 2005), and a Glacial Phase (2.54 Ma), which spans the first three major Northern Hemisphere glacials MIS 100, 98, and 96 (Bailey et al., 2013) and includes the extinction of one of our study species (Figure 2). The amplitude of glacial-interglacial climate change varies across space (Lawrence et al., 2009; Herbert et al., 2010; Naafs et al., 2012) but these three climate phases can be recognized at all study sites. We compare trait covariations through time and across space to investigate whether spatial differences in response to local environmental settings match response to increased glacial-interglacial climate variability through time across all study sites.
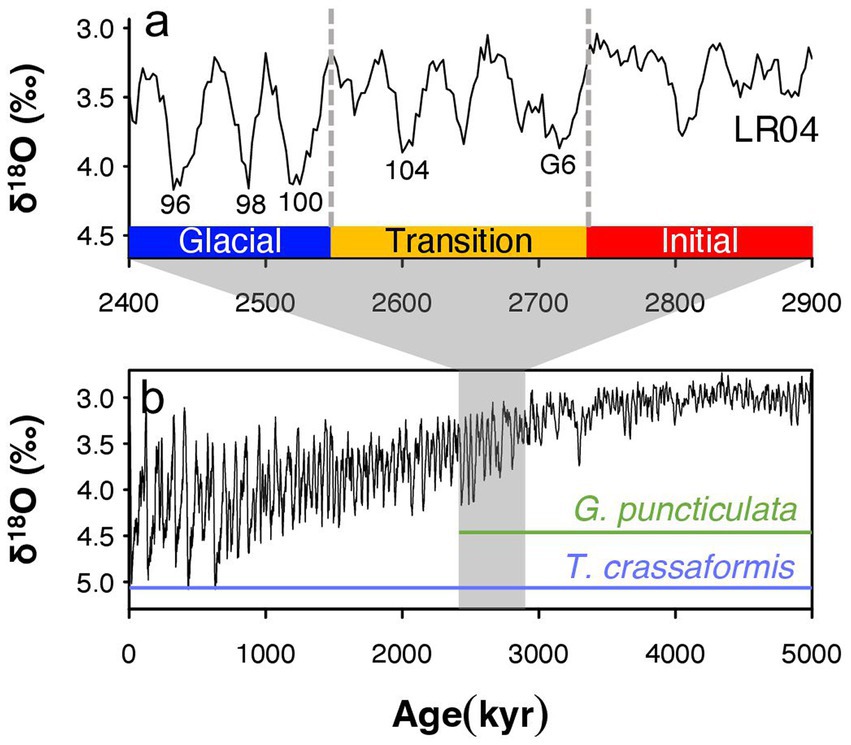
Figure 2. Benthic oxygen isotopes from the Lisiecki and Raymo global benthic stack (Lisiecki and Raymo, 2005) in (A) our study interval (B) and the past 5 million years (Lisiecki and Raymo, 2005). Climate phases are characterized by a transition to 41-kyr glacial cycles (Transition Phase) and increasing glacial intensity (Glacial Phase). Key Marine Isotope Stages and the temporal ranges of the study species Globoconella puncticulata and Truncorotalia crassaformis are indicated as well. Note that 𝛿18O values are inverted, with highest values meaning lowest temperatures and/or largest polar ice sheets.
2. Materials and methods
2.1. Study species
Planktonic foraminifera are predominantly sexually reproducing protists distributed in high abundance throughout the world’s oceans. Their large population size, global distribution and excellent fossil preservation potential of their calcite shells allow for continuous, high-resolution morphological reconstructions at the population level over millions of years. We compared two ecologically similar species, one extinct and one extant, to provide an “experimental control” to test if species with contrasting macroevolutionary fates are impacted similarly by the intensification of Northern Hemisphere glaciation. Both of our study species, Globoconella puncticulata (Deshayes, 1832) and Truncorotalia crassaformis (Galloway and Wissler, 1927), were globally distributed during the Pliocene, and were most abundant in thermocline waters at middle and low latitudes (Kennett and Srinivasan, 1983; Aze et al., 2011). Truncorotalia crassaformis originated around 5.7 Ma and survives to the present day, whereas G. puncticulata first appeared around 4.6 Ma and became extinct at 2.41 Ma (Wei, 1994b), shortly after the onset of significant Northern Hemisphere glaciation at 2.72 Ma (Bailey et al., 2013). Globoconella puncticulata gave rise to one descendant, Globoconella inflata around 3.5 Ma in the southwest Pacific (Wei, 1994a,b). This species was initially restricted to the mid-latitude Southern Hemisphere and did not migrate north until ~2.09 Ma (Berggren et al., 1995; Chapman et al., 1998), ~300,000 years after the extinction of G. puncticulata. Any change observed in Atlantic populations of G. puncticulata is therefore unlikely to be caused by increased morphological variation associated with macroevolutionary processes.
2.2. Material
To study within- and among population dynamics, six populations of G. puncticulata (size and abundance data from Brombacher et al. (2021), shape data from this study) and T. crassaformis (this study) are compared over a 600,000-year interval that ends with the last local extinction of G. puncticulata at ~2.3 Ma (Wei, 1994b). All specimens originate from sediments recovered from six Atlantic sites spanning ~83°: ocean drilling program (ODP) Sites 659, 925, 981 and 1,264, deep sea drilling program (DSDP) Site 606 and Integrated Ocean Drilling Program (IODP) Site U1313 (Figure 1, see Brombacher et al. (2021) and references therein for site-specific oceanographic settings and age models). To avoid time averaging of foraminifera among samples due to bioturbation, we took 20 cc samples at each site at a minimum depth-resolution of 15 cm, corresponding to temporal resolutions of 5–20 kyr (Table 1). Each sample was dry-sieved over a > 150 μm mesh sieve and divided using a microsplitter until a single split contained 50–100 adult individuals of the target species, all of which were picked to avoid size biases. In total, 29,438 individuals were analyzed (16,091 specimens of G. puncticulata and 13,347 of T. crassaformis).
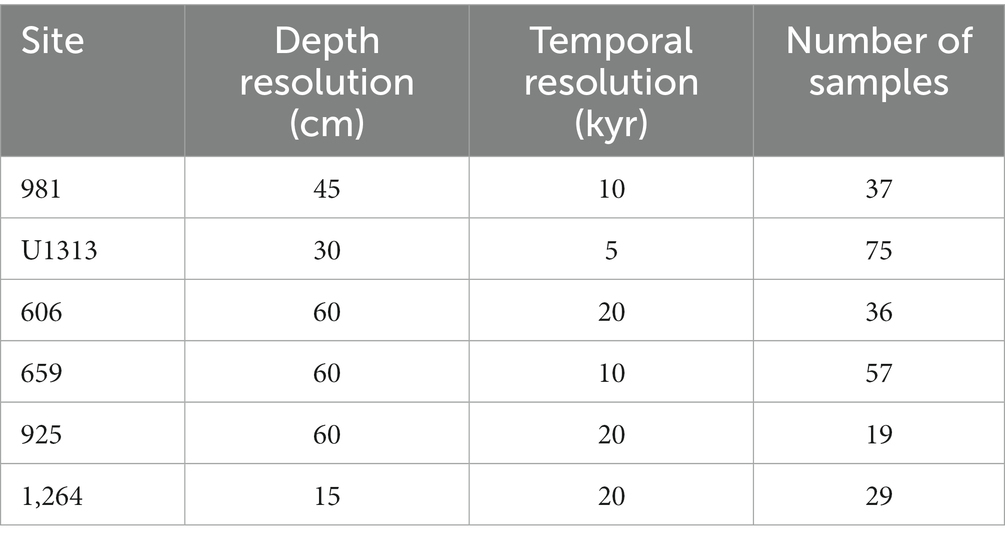
Table 1. Sampling resolution and number of samples analyzed per site.
First we determined which populations lay within the core of their species’ biogeographic range, and which were situated closer to the range edge using changes in abundance. Consistently high abundances are indicative of core populations, whereas populations with lower and more variable abundances and local extirpations are considered edge populations (Brown et al., 1995). Species abundance per time slice (sample) was calculated as flux by dividing the estimated total number of specimens in a sample (the number of individuals found in an analysed split multiplied by the split fraction) per gram sediment by the sample’s dry bulk density and the total time contained in the sample. With the exception of the subpolar Site 981, all studied sites were found to be in the core of the biogeographic range of T. crassaformis (see Supplementary Figure S1 in the supporting information). Brombacher et al. (2021) previously found that both Site 981 and the tropical Site 925 are at the edge of G. puncticulata’s preferred range, whereas Sites 606, U1313, 659 and 1,264 are core sites.
Two morphological traits (Brombacher et al., 2017b) were studied for trait covariation: shell size (area) and shell shape (aspect ratio, the ratio between shell height and width). Shell size reflects a species’ ecological optimum (Hecht, 1976; Schmidt et al., 2004) whereas shell shape impacts the test surface area: volume ratio, influencing respiration and metabolic processes (Caromel et al., 2014). These two traits likely combine to optimize the surface area: volume ratio needed for respiration. To measure morphology, foraminifera shells were mounted on glass slides in groups of 20 individuals using transparent double-sided adhesive tape with the apertures facing upwards. Groups were imaged using an Infinity three Lumenera camera mounted on an Olympus SZX10 light microscope, and shell area and aspect ratio were extracted from the images using an automated image analysis macro in the Image Pro Premier software. All data are privately accessible through this link: https://figshare.com/s/030b3d3cbb289f2342dd, and will be made publicly available upon acceptance of the manuscript.
2.3. Analysis
To compare lines of least resistance within and among populations through time and across space, variance–covariance matrices were constructed per time slice using size and shape measurements of all specimens in that time slice. Measurements were scaled to unit variance to produce values in comparable units. pmax, the dominant eigenvectors of these matrices, describe the direction of maximum variation within a time slice and thus the expected direction of evolutionary change as the line of least resistance (Schluter, 1996; Hunt, 2007). The subdominant eigenvector describes the amount of variation in the direction orthogonal to pmax. Together, the ellipse determined by both eigenvectors describes the variation within the population. Similarly, lines of least resistance per site and climatic phase were calculated using the mean size and shape data of all time slices contained in each site and phase, respectively. Species-specific lines of least resistance were calculated from the mean size and shape data of each site.
To check if phenotypic change from one time slice to the next is constrained by within-population trait covariation, we calculated the angles θ between the line of least resistance at time t and the direction of evolutionary divergence from the sample mean at time t to the sample mean at t + 1 following the approach described by Hunt (2007). A Wilcoxon rank-sum test was performed to check if the distribution of all angles was significantly smaller than a set of randomly generated angles (Hunt, 2007).
To test whether the direction of expected evolutionary change aligns among sites we employed linear mixed effect models on all sites’ data using the ‘lme4’ package (Bates et al., 2014) in R [version 3.6.3 (R Core Team, 2013)], with ‘site’ as a fixed effect to incorporate the dependence at each sampling locale due to the local microclimate. Random effects included shell aspect ratio to include potential covariations between size and shape, climate phase or edge/core location, and all two-way interaction combinations. Finally, we fitted random slope models to test the hypothesis that contrasting climates across different sites yield different size-shape relationships (see (Brombacher et al., 2017a) for a temporal example). We ran models with random intercepts and slopes to allow the trait covariance to potentially change among sites (Van de Pol and Wright, 2009). In total, 24 models per species were assessed and compared using the Akaike Information Criterion (AIC), which finds the best trade-off between model fit and simplicity amongst those models fitted.
3. Results
Populations of both study species were categorized into core (high abundance, i.e., close to the species’ ecological optimum) and edge (lower and more variable abundance, i.e., removed from the ecological optimum) sites based on high-resolution records of species abundance (flux) throughout our study interval (Supplementary Figure 1). Test size is larger in core than edge sites for both species (Wilcoxon rank sum test, W = 9,821, p < 0.001 for G. puncticulata and W = 9,464, p < 0.001 for T. crassaformis; Figure 3). Two Northern Hemisphere core populations of G. puncticulata (Sites U1313 and 606) show the largest shifts in shell size and shape around 2.7 Ma during the late stages of Pliocene glacial intensification (Figures 3A,D). Fitting nested models that assign sites to one of either core or edge of the species’ biogeographic range show that spatial components explain more variation than the climate phases in both species (Table 2).
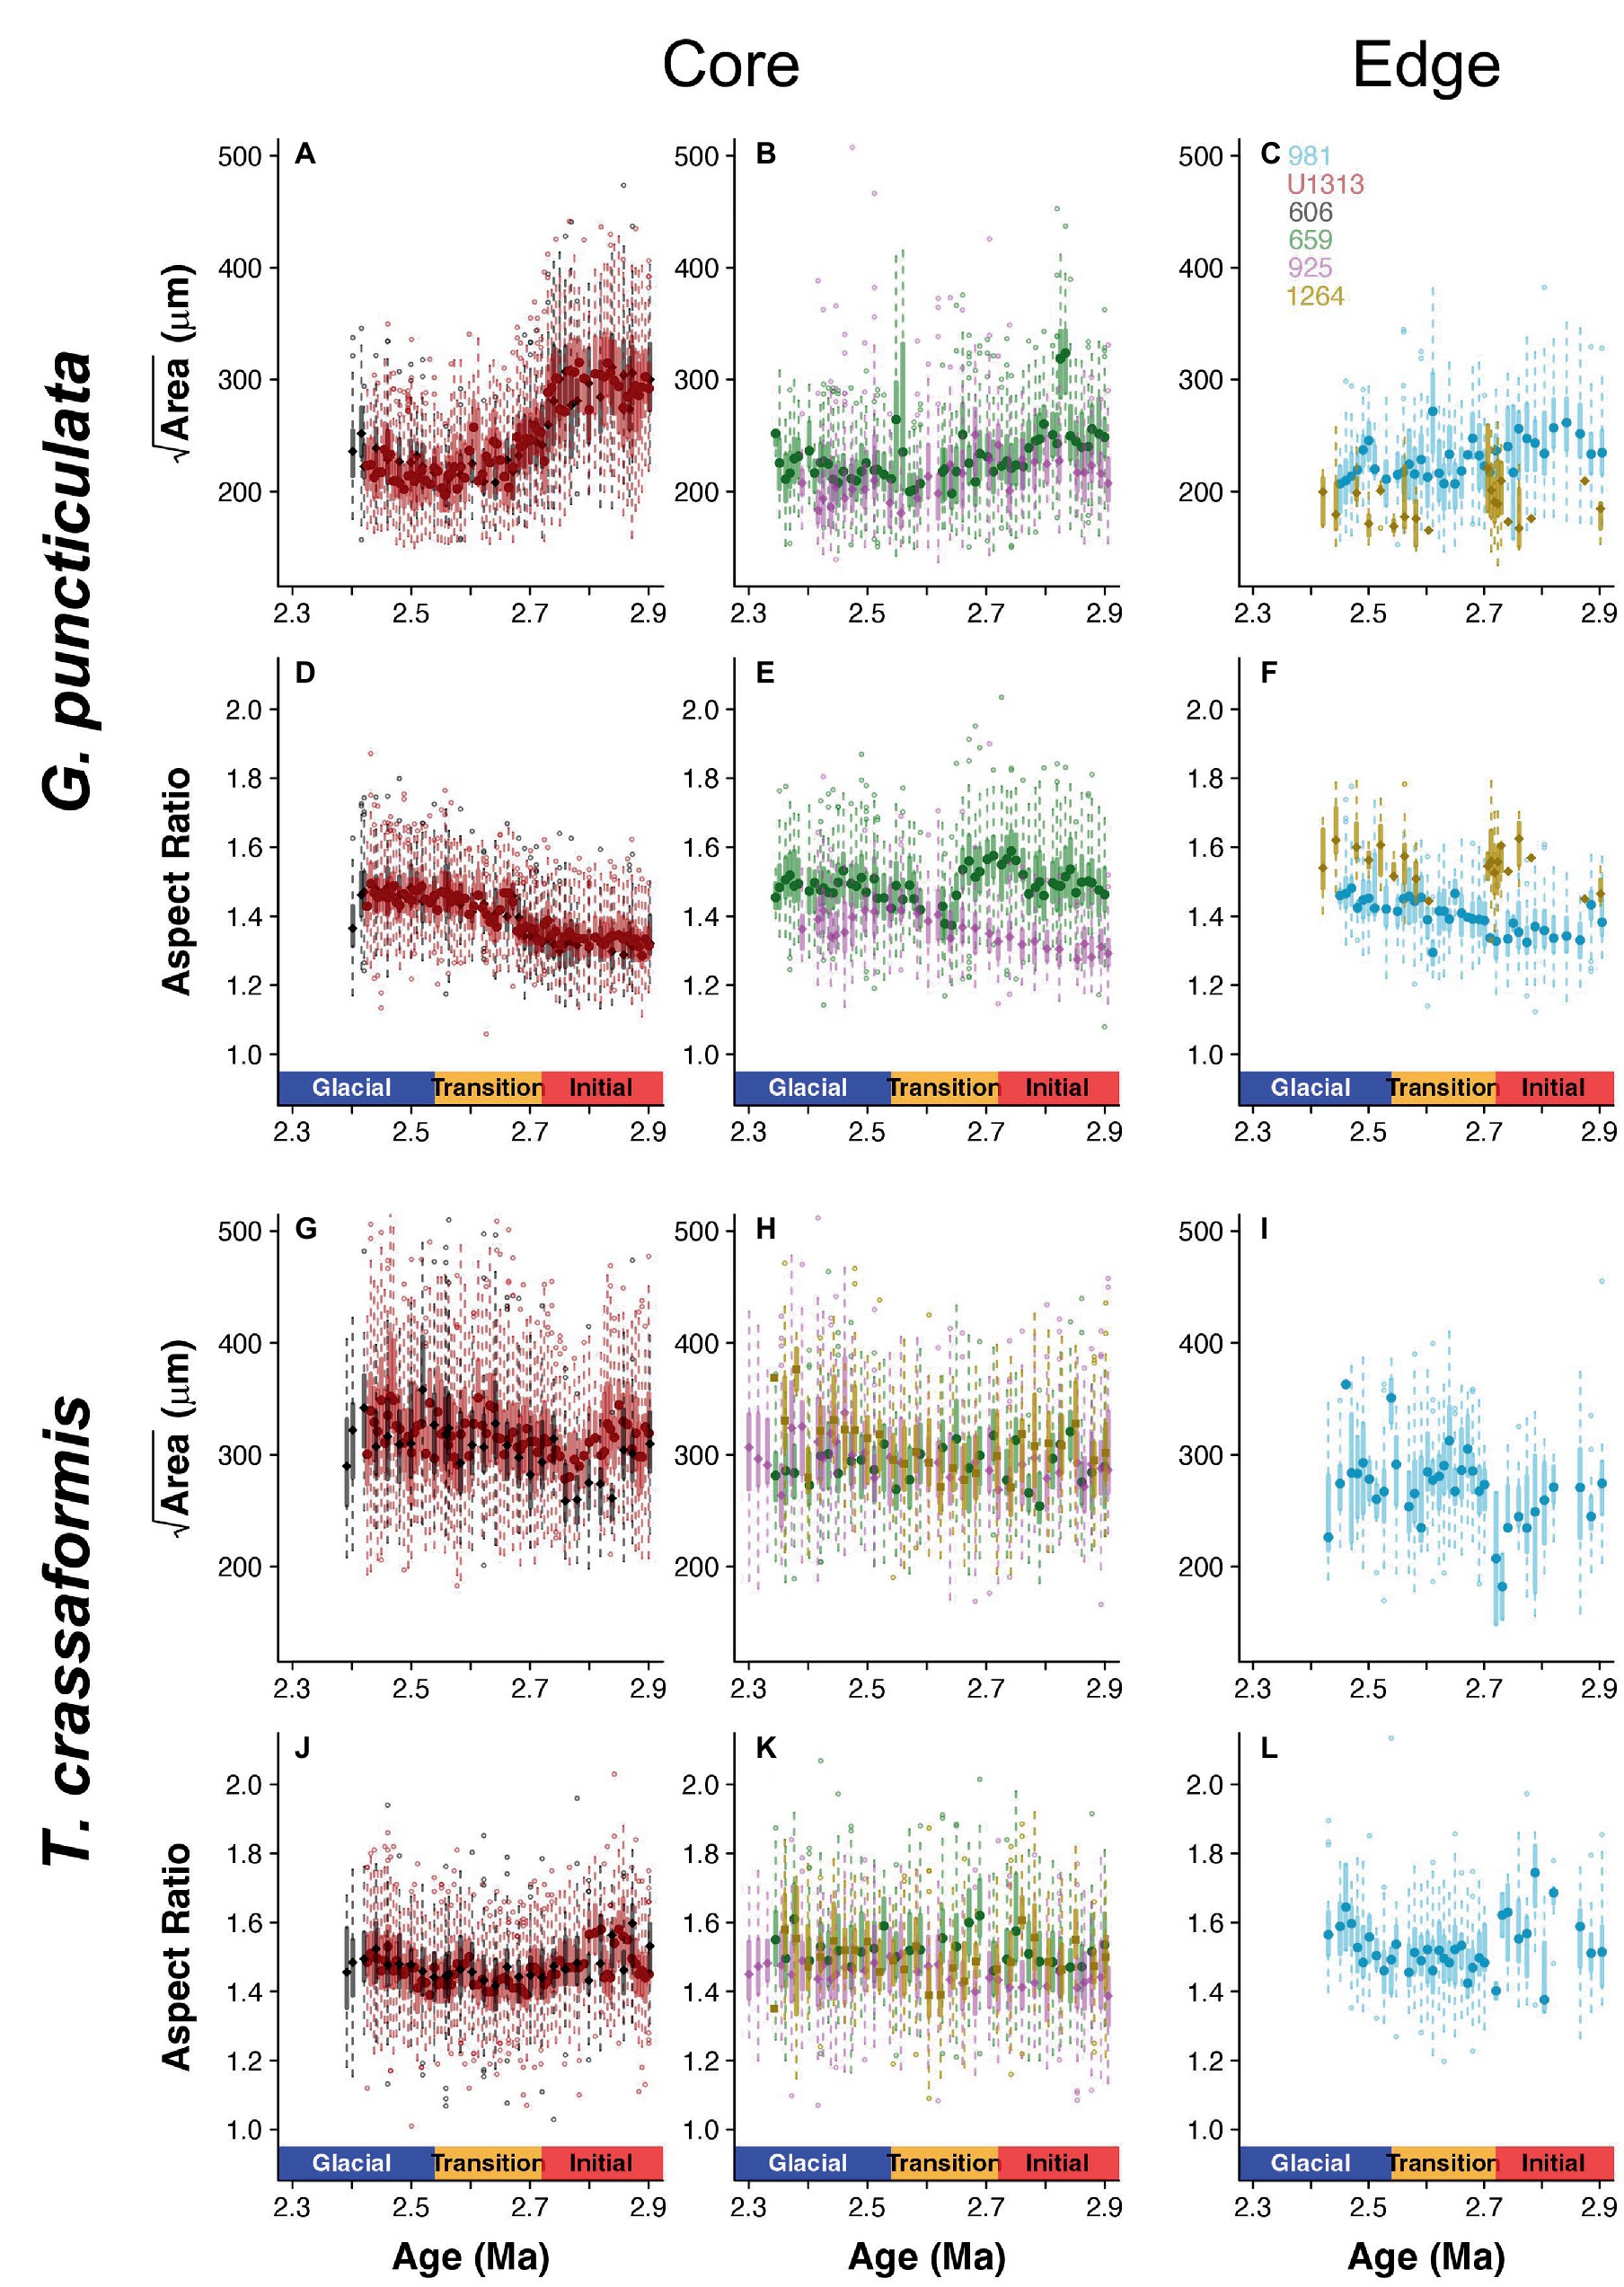
Figure 3. Box-and-whisker plots of size (Area) and shape (Aspect Ratio) data for Globoconella puncticulata (A–F) and Truncorotalia crassaformis (G–L) per time slice across the three climate phases at each of the six study sites, divided into core (left and middle column) and edge populations (right column).
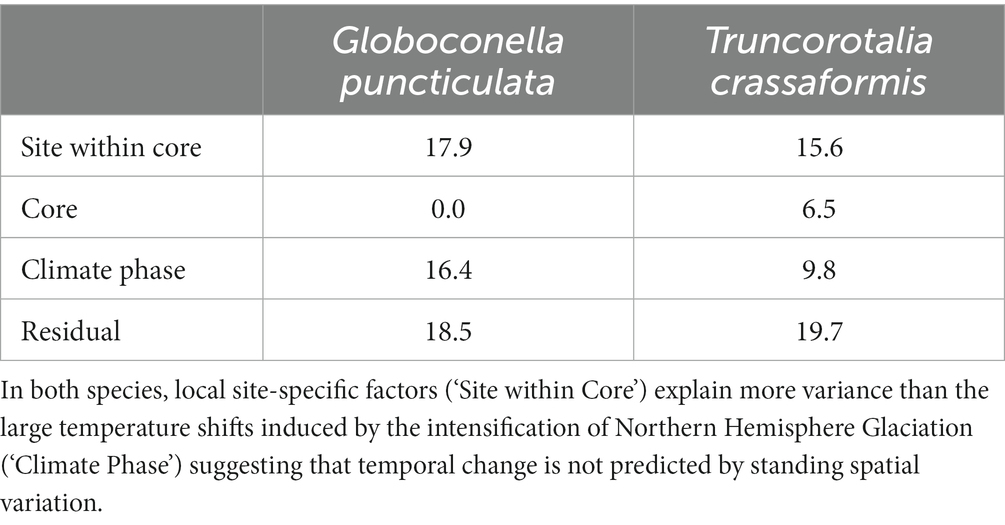
Table 2. Standard deviation of the random effect variance explained by spatial and temporal components of morphological change for the minimum adequate models.
The angles between the lines of least evolutionary resistance at time t, and the direction of evolutionary divergence at time t + 1 are significantly smaller than angles drawn from a random distribution for both species (Wilcoxon rank sum test, p = 0.0037 for G. puncticulata and p = 0.00013 for T. crassaformis, Figure 4), implying that phenotypic change from one time slice to the next occurs preferentially in the direction of maximal phenotypic covariation across species and sites. However, trait covariation patterns within sites do not align among sites over the total study interval (Figures 4A,B) or during specific climate phases within sites (Figures 4C–N). The minimum adequate models (MAM) show that trait covariation slopes vary among sites, among climate phases and between core/edge position, suggesting differential responses to local environmental change related to glacial intensification across space in both species (Tables 3, 4; Supplementary Tables 1, 2). Both species’ MAM had an Akaike weight of >0.99 and included shape as a random slope, which represents overwhelming support that the MAMs are the best descriptors of the variation in covariation patterns. A key feature of both models is the inclusion of “random slopes” among sites; the statistical support for this term means a rejection of a constant size: shape covariance across sites and, with the overwhelming Akaike weight, provides strong evidence for site-specific allometric relationships between size and shape. The conditional R2 of these MAMs, which indicates variation explained by the fixed and random effects, is 75.5% for G. puncticulata and 48.6% for T. crassaformis.
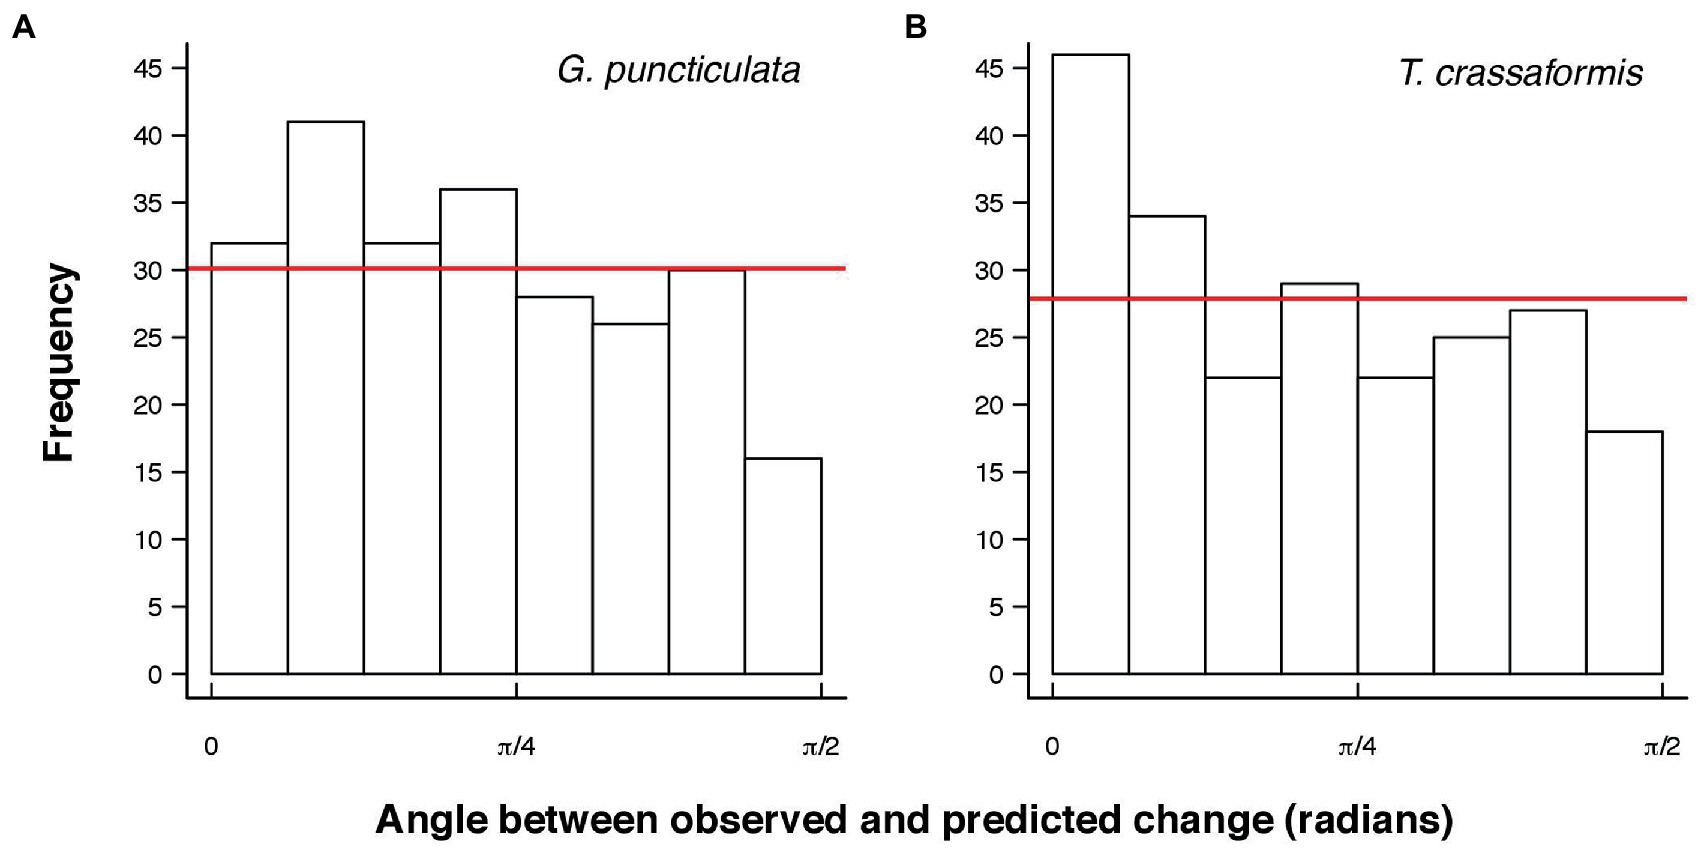
Figure 4. Angles between observed and predicted evolutionary change from one time slice to the next for Globoconella puncticulata (A) and Truncorotalia crassaformis (B). Red lines indicate the expected frequency of the same number of angles drawn from a random distribution. Angles are significantly smaller than expected from a random distribution for both species (Wilcoxon rank sum test, p = 0.0037 for G. puncticulata and p = 0.00013 for T. crassaformis).
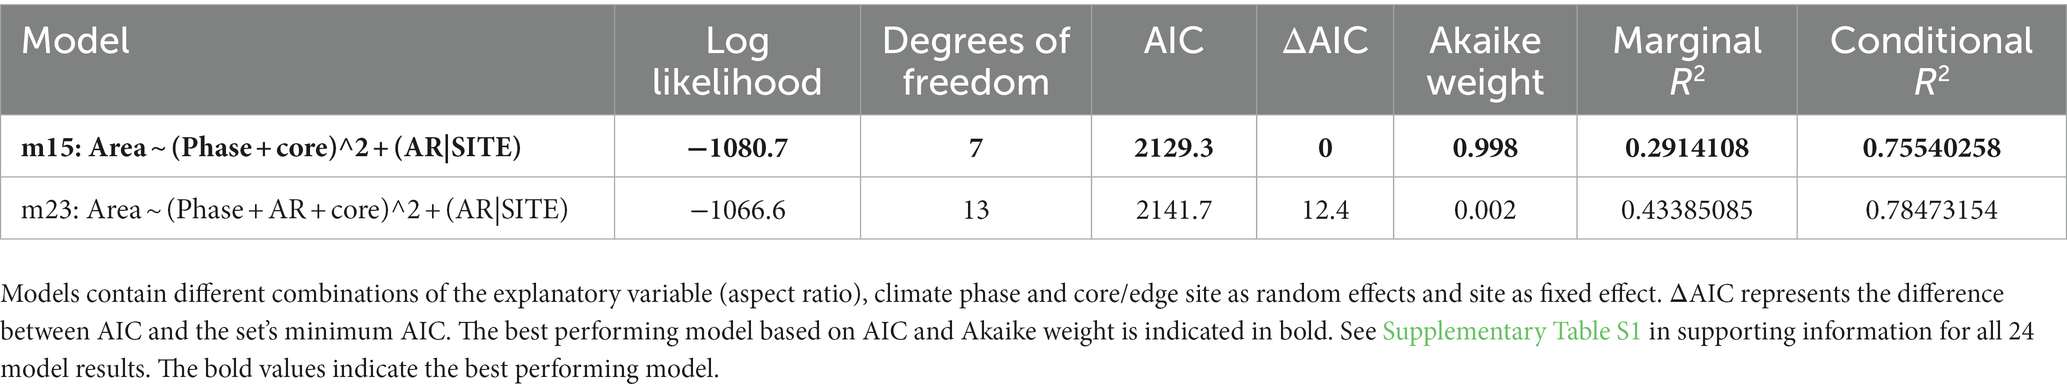
Table 3. Log likelihood, AIC and Akaike weights of all models with non-zero AIC weights for Globoconella puncticulata.
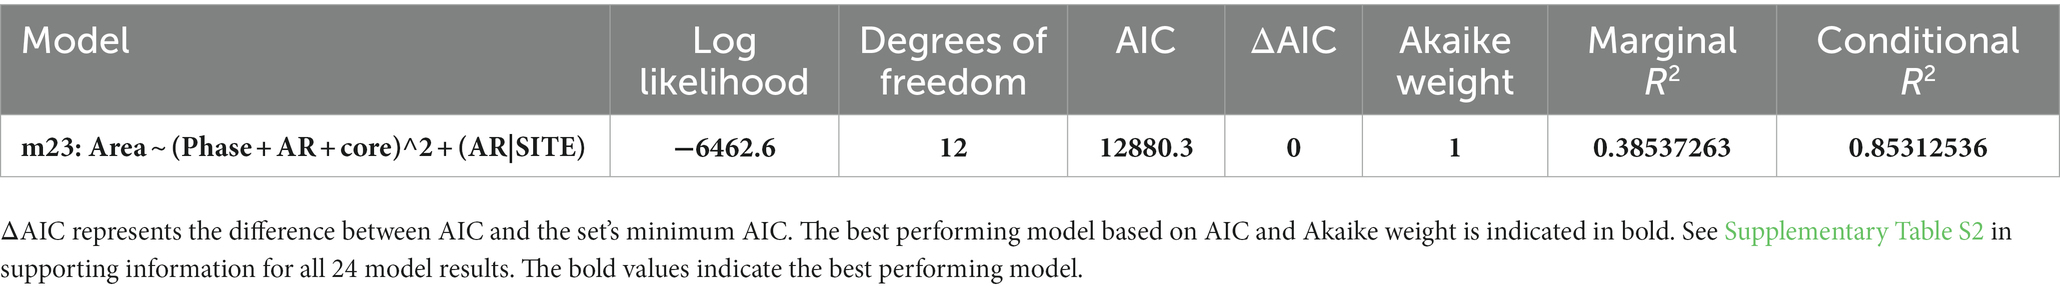
Table 4. Log likelihood, AIC and Akaike weights of the only model with non-zero AIC weight containing the explanatory variable (aspect ratio), climate phase and core/edge site as random effects and site as fixed effect performed on the data of Truncorotalia crassaformis.
4. Discussion
Evolutionary change happens preferentially along lines of least resistance in our study species. However, within-site trait covariations deviate among climatic phases. Similarly, population trait covariation slopes do not align with each other, or with the among-site covariation patterns (Figure 4). These results suggest that the drivers of trait covariations vary across space and during climatic upheaval through time, and thus the size-shape relationship is evolvable in these foraminifera. Aggregated spatial intraspecific variation is therefore a poor predictor of response to the intensification of Northern Hemisphere Glaciation.
The non-alignment of the lines of least resistance across space and through time rules out pleiotropy as an underlying mechanism for the trait covariations observed in our species (Peiman and Robinson, 2017). Instead, populations are more likely to sit on individual peaks on the adaptive landscape through adaptation to local environmental and biotic settings (Simpson, 1944). Previous work by Brombacher et al. (2021) showed that one of the study species, G. puncticulata, responded differently to the same environmental parameters at Sites 981 and U1313, which they hypothesized to be the result of adaptation to local environmental conditions. Our study sites span the tropics to subpolar oceans, with associated differences in environmental conditions. Sea surface temperature scales largely with latitude, whereas nutrient availability depends on the presence or absence of upwelling or downwelling, river runoff, surface water nutrient usage and aeolian dust input from the continents. The spatial heterogeneity of multivariate environmental change means that its predictive use will be similarly non-uniform and inconsistent over interannual and astronomical (104–105 years) timescales, potentially reducing the predictive ability of lines of least resistance.
During our study interval, a time transgressive equatorward expansion of the subpolar gyres and contraction of the subtropical gyres occurred in response to equatorward movement of the westerlies (Naafs et al., 2010; Bolton et al., 2011; Naafs et al., 2012; Friedrich et al., 2013; Bolton et al., 2018). This resulted in regional changes in sea surface temperature and nutrient concentrations throughout the Atlantic Ocean (Herbert et al., 2010; Naafs et al., 2012; Lawrence et al., 2013; Herbert et al., 2015; Bolton et al., 2018). The amplitude of local environmental variability, most notably temperature, increases with latitude. North Atlantic Late Pliocene glacial-interglacial temperatures in the subpolar regions varied by up to 7°C (Lawrence et al., 2009), compared to 5°C in the mid-latitudes (Naafs et al., 2012) and 2–3°C in the tropics (Herbert et al., 2010). Increasing spatial differences through time likely contributed to the misalignment of trait covariations across climatic phases.
One of our study species, G. puncticulata became extinct at the end of our study interval. Brombacher et al. (2021) showed that its biogeographic range contracts through diachronous local extirpations with the sub-polar and equatorial edge populations disappearing first (Sites 981 and 925), followed by the three mid-latitude core populations (Sites U1313, 606 and 1,264). The sub-tropical core population Site 659 lasts another ~100 kyr before marking the species’ global extinction at ~2.3 Ma. This pattern reveals that the link between the extinction and global climate upheaval is more complex than a straightforward extinction driven primarily by uniform species response to glacial intensification—which would have resulted in an extinction chain from North to South, not the contraction to a smaller core biogeography that we observed here. These results further suggest that populations contain local adaptations that do not translate simply across space.
It should be noted that our study sites are not isolated entities. Oceanographic connectivity and passive plankton dispersal could introduce a degree of mixing among our study sites, especially between U1313 and 606 which both lie within the North Atlantic gyre system. However, this is likely a minor contributor to morphological variation among sites because of our sampling strategy and the short generation times of planktonic foraminifera. Every sample contains foraminifera specimens mixed over a ~ 500–3,000 year interval reflecting bioturbation, the effect of which is least time-integrative where sedimentation rates are highest. Assuming a generation time of up to a year (Hemleben et al., 1989), the observed bivariate trait distributions before and after the intensification of Northern Hemisphere Glaciation therefore likely represent the time-averaged optimal expression under the prevailing environmental conditions, i.e., a time-averaged peak on the adaptive landscape rather than evolution of the trait towards some optimum (Simpson, 1944).
Generally, population-specific covariation patterns are more pronounced in the extinct-going G. puncticulata than in the surviving T. crassaformis (Figure 5). Species with weaker trait covariations are more likely to contain the necessary flexibility of trait combinations to cope with a shift in peak locations on the adaptive landscape (Simpson, 1944; Arnold et al., 2001) because within- and among-population variability increases evolvability (Hansen et al., 2003; Hansen and Houle, 2008). However, generalizing from a single species-pair comparison is suboptimal. More comprehensive future sampling should encompass more species and more ecologically relevant trait combinations (Streit and Bellwood, 2022), across a range of environmentally distinct spatial locations. A balanced approach is needed: focusing only on among-species comparisons at the expense of spatio-temporal replication will not increase the resolution required to identify inconsistencies between spatial and temporal variation (Peiman and Robinson, 2017).
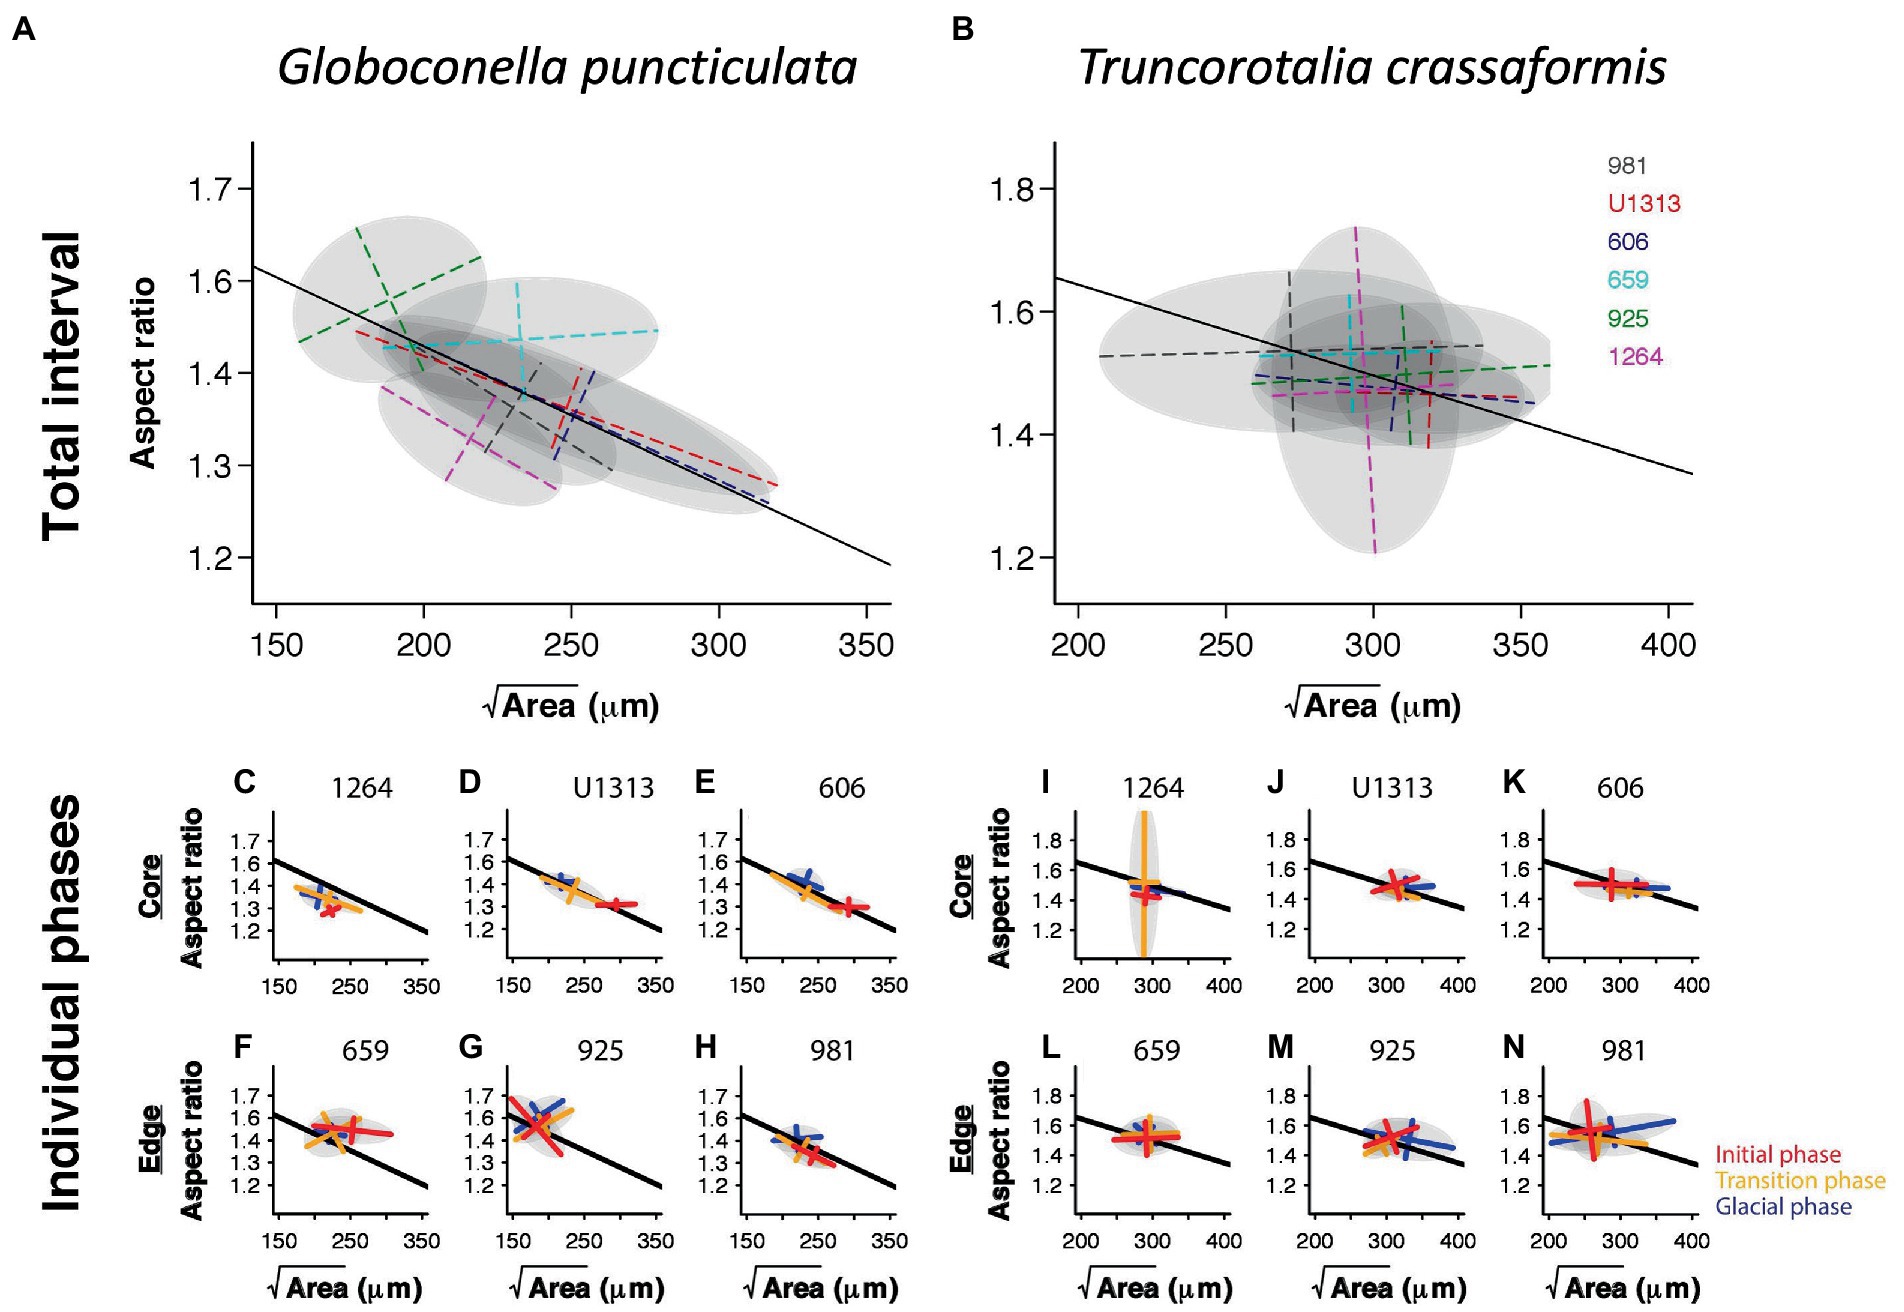
Figure 5. Trait covariation of size and shape in Globoconella puncticulata (left) and Truncorotalia crassaformis (right) based on time-slice averages among sites over the entire study interval (A,B) and within individual climate phases (C–N). Solid lines indicate the regression through all site means. The gray ellipses represent 95% confidence intervals calculated from the eigendecomposition within each panel’s analytical resolution.
Our results emphasize the need for within- and among-population data to understand the drivers of trait covariations. For example, considering only site- and climate-phase average trait expressions would have obscured the diverging trait covariation patterns among populations within species that we document (Figure 5). This would have made a distinction between species-wide internal constraints (e.g., pleiotropy), a universal selection pressure, or local adaptation impossible (Peiman and Robinson, 2017). This distinction is crucial to assess the predictive ability of the observed population-specific trait covariation patterns. In our case, species-wide lines of least resistance are unlikely to predict the direction of phenotypic change in individual populations, and vice versa. Single populations cannot reliably be used to predict the response of others, even if faced with the same environmental conditions. Care should also be taken when using an individual population as a proxy for the entire species, unless trait covariations are known to result from pleiotropy, the species has a restricted biogeographic range and/or environmental settings are comparable across its range. If this is not the case, local adaptation likely introduces some degree of population-specific lines of least resistance, limiting the predictive ability of trait covariation patterns to local future phenotypic change under similar environmental conditions only.
5. Conclusion
Within populations, evolutionary change from one time slice to the next preferentially follows lines of least evolutionary resistance in our study species. However, the consistency of this covariation breaks down following environmental upheaval across all studied sites. Site-specific trait covariation patterns deviate from the species-wide line of least resistance, strongly suggesting that trait covariation patterns in the study species are driven by adaptation to local environmental settings rather than species-wide constraints. The mismatch between within- and among-population variation is particularly pronounced because we tested spatiotemporal consistency in a system hypothesized to show a strong temporal temperature signal. We caution against using individual populations to project future response of other or global populations unless the underlying mechanism for trait covariation is shown to be universal. Because this is often difficult to ascertain, particularly in fossil data, future studies should compare how trait covariation patterns respond to multivariate biotic and abiotic change across distinct populations to gain a more comprehensive understanding of the drivers of trait covariation, and when variation across space is most likely to predict change through time.
Data availability statement
The datasets presented in this study can be found in online repositories. The datasets generated for this study can be found in the Figshare repository: https://figshare.com/s/030b3d3cbb289f2342dd.
Author contributions
AB participated in the design of the study, carried out the lab work, and participated in the statistical analysis and drafted the manuscript. IB and PW participated in the design of the study and helped draft the manuscript. TE designed the study, participated in the statistical analysis of the data, coordinated the study, and helped draft the manuscript. All authors contributed to the article and approved the submitted version.
Funding
This work was supported by the Natural Environment Research Council awards NE/J018163/1 and NE/P019269/1. PW acknowledges a Royal Society Wolfson Research Merit Award. Samples were provided by the Integrated Ocean Drilling Program (IODP), which is sponsored by the US National Science Foundation and participating countries under management of Joint Oceanographic Institutions, Inc.
Acknowledgments
We thank Megan Wilding and Bastian Hambach for laboratory assistance, and Walter Hale and Alex Wuebers for their kind assistance during visits to the Bremen IODP Core Repository.
Conflict of interest
The authors declare that the research was conducted in the absence of any commercial or financial relationships that could be construed as a potential conflict of interest.
Publisher’s note
All claims expressed in this article are solely those of the authors and do not necessarily represent those of their affiliated organizations, or those of the publisher, the editors and the reviewers. Any product that may be evaluated in this article, or claim that may be made by its manufacturer, is not guaranteed or endorsed by the publisher.
Supplementary material
The Supplementary material for this article can be found online at: https://www.frontiersin.org/articles/10.3389/fevo.2023.1165174/full#supplementary-material
References
Abell, J. T., Winckler, G., Anderson, R. F., and Herbert, T. D. (2021). Poleward and weakened westerlies during Pliocene warmth. Nature 589, 70–75. doi: 10.1038/s41586-020-03062-1
Arnold, S. J., Bürger, R., Hohenlohe, P. A., Ajie, B. C., and Jones, A. G. (2008). Understanding the evolution and stability of the G-matrix. Evolution 62, 2451–2461. doi: 10.1111/j.1558-5646.2008.00472.x
Arnold, S. J., Pfrender, M. E., and Jones, A. G. (2001). The adaptive landscape as a conceptual bridge between micro-and macroevolution. Genetica 112-113, 9–32. doi: 10.1007/978-94-010-0585-2_2
Aze, T., Ezard, T. H., Purvis, A., Coxall, H. K., Stewart, D. R., Wade, B. S., et al. (2011). A phylogeny of Cenozoic macroperforate planktonic foraminifera from fossil data. Biol. Rev. Camb. Philos. Soc. 86, 900–927. doi: 10.1111/j.1469-185X.2011.00178.x
Bailey, I., Hole, G. M., Foster, G. L., Wilson, P. A., Storey, C. D., Trueman, C. N., et al. (2013). An alternative suggestion for the Pliocene onset of major northern hemisphere glaciation based on the geochemical provenance of North Atlantic Ocean ice-rafted debris. Quat. Sci. Rev. 75, 181–194. doi: 10.1016/j.quascirev.2013.06.004
Bates, D., Maechler, M., Bolker, B., and Walker, S. (2014). lme4: linear mixed-effects models using Eigen and S4. J. Stat. Softw. 67, 1–48. doi: 10.18637/jss.v067.i01
Bégin, M., Roff, D. A., and Phillips, P. (2003). The constancy of the G matrix through species divergence and the effects of quantitative genetic constraints on phenotypic evolution: a case study in crickets. Evolution 57, 1107–1120. doi: 10.1111/j.0014-3820.2003.tb00320.x
Berggren, W.-A., Hilgen, F., Langereis, C., Kent, D. V., Obradovich, J., Raffi, I., et al. (1995). Late Neogene chronology: new perspectives in high-resolution stratigraphy. Geol. Soc. Am. Bull. 107, 1272–1287. doi: 10.1130/0016-7606(1995)107<1272:LNCNPI>2.3.CO;2
Bolton, C. T., Bailey, I., Friedrich, O., Tachikawa, K., de Garidel-Thoron, T., Vidal, L., et al. (2018). North Atlantic Midlatitude surface-circulation changes through the Plio-Pleistocene intensification of northern hemisphere glaciation. Paleoceanogr. Paleoclimatol. 33, 1186–1205. doi: 10.1029/2018PA003412
Bolton, C. T., Lawrence, K. T., Gibbs, S. J., Wilson, P. A., and Herbert, T. D. (2011). Biotic and geochemical evidence for a global latitudinal shift in ocean biogeochemistry and export productivity during the late Pliocene. Earth Planet. Sci. Lett. 308, 200–210. doi: 10.1016/j.epsl.2011.05.046
Brombacher, A., Wilson, P. A., Bailey, I., and Ezard, T. H. (2017a). The breakdown of static and evolutionary allometries during climatic upheaval. Am. Nat. 190, 350–362. doi: 10.1086/692570
Brombacher, A., Wilson, P. A., Bailey, I., and Ezard, T. H. G. (2021). The dynamics of Diachronous extinction associated with climatic deterioration near the Neogene/quaternary boundary. Paleoceanogr. Paleoclimatol. 36, 1–15. doi: 10.1029/2020PA004205
Brombacher, A., Wilson, P. A., and Ezard, T. H. (2017b). Calibration of the repeatability of foraminiferal test size and shape measures with recommendations for future use. Mar. Micropaleontol. 133, 21–27. doi: 10.1016/j.marmicro.2017.05.003
Brown, J. H., Mehlman, D. W., and Stevens, G. C. (1995). Spatial variation in abundance. Ecology 76, 2028–2043. doi: 10.2307/1941678
Caromel, A. G. M., Schmidt, D. N., Phillips, J. C., and Rayfield, E. J. (2014). Hydrodynamic constraints on the evolution and ecology of planktic foraminifera. Mar. Micropaleontol. 106, 69–78. doi: 10.1016/j.marmicro.2014.01.002
Chakrabarty, A., and Schielzeth, H. (2020). Comparative analysis of the multivariate genetic architecture of morphological traits in three species of Gomphocerine grasshoppers. Heredity 124, 367–382. doi: 10.1038/s41437-019-0276-1
Chapman, M. R., Funnell, B. M., and Weaver, P. P. E. (1998). Isolation, extinction and migration within late Pliocene populations of the planktonic foraminiferal lineage Globorotalia (Globoconella) in the North Atlantic. Mar. Micropaleontol. 33, 203–222. doi: 10.1016/S0377-8398(97)00041-8
Crocker, A. J., Naafs, B. D. A., Westerhold, T., James, R. H., Cooper, M. J., Röhl, U., et al. (2022). Astronomically controlled aridity in the Sahara since at least 11 million years ago. Nat. Geosci. 15, 671–676. doi: 10.1038/s41561-022-00990-7
Firmat, C., Lozano-Fernández, I., Agustí, J., Bolstad, G. H., Cuenca-Bescós, G., Hansen, T. F., et al. (2014). Walk the line: 600000 years of molar evolution constrained by allometry in the fossil rodent Mimomys savini. Philos. Trans. R. Soc. B 369:20140057. doi: 10.1098/rstb.2014.0057
Friedrich, O., Wilson, P. A., Bolton, C. T., Beer, C. J., and Schiebel, R. (2013). Late Pliocene to early Pleistocene changes in the North Atlantic current and suborbital-scale sea-surface temperature variability. Paleoceanography 28, 274–282. doi: 10.1002/palo.20029
Galloway, J. J., and Wissler, S. G. (1927). Pleistocene foraminifera from the Lomita quarry, Palos Verdes Hills, California. J. Paleontol. 1, 35–87.
Hansen, T. F., and Houle, D. (2008). Measuring and comparing evolvability and constraint in multivariate characters. J. Evol. Biol. 21, 1201–1219. doi: 10.1111/j.1420-9101.2008.01573.x
Hansen, T. F., Pélabon, C., Armbruster, W. S., and Carlson, M. L. (2003). Evolvability and genetic constraint in Dalechampia blossoms: components of variance and measures of evolvability. J. Evol. Biol. 16, 754–766. doi: 10.1046/j.1420-9101.2003.00556.x
Hecht, A. D. (1976). An ecologic model for test size variation in recent planktonic foraminifera: applications to the fossil record. J. Foraminifer. Res. 6, 295–311. doi: 10.2113/gsjfr.6.4.295
Hemleben, C., Spindler, M., and Anderson, O. R. (1989). Modern planktonic foraminifera. doi: 10.1007/978-1-4612-3544-6
Herbert, T. D., Ng, G., and Cleaveland Peterson, L. (2015). Evolution of Mediterranean Sea surface temperatures 3.5–1.5 ma: regional and hemispheric influences. Earth Planet. Sci. Lett. 409, 307–318. doi: 10.1016/j.epsl.2014.10.006
Herbert, T. D., Peterson, L. C., Lawrence, K. T., and Liu, Z. (2010). Tropical Ocean temperatures over the past 3.5 million years. Science 328, 1530–1534. doi: 10.1126/science.1185435
Hunt, G. (2007). Evolutionary divergence in directions of high phenotypic variance in the ostracode genus Poseidonamicus. Evolution 61, 1560–1576. doi: 10.1111/j.1558-5646.2007.00129.x
Kennett, J.P., and Srinivasan, M.S., (1983). Neogene Planktonic Foraminifera. A Phylogenetic Atlas. Stroudsburg, Pennsylvania. Hutchinson Ross Publishing Company.
Lande, R. (1979). Quantitative genetic analysis of multivariate evolution, applied to brain:body size allometry. Evolution 33, 402–416. doi: 10.1111/j.1558-5646.1979.tb04694.x
Lande, R., and Arnold, S. J. (1983). The measurement of selection on correlated characters. Evolution 37, 1210–1226. doi: 10.2307/2408842
Lang, D. C., Bailey, I., Wilson, P. A., Beer, C. J., Bolton, C. T., Friedrich, O., et al. (2014). The transition on North America from the warm humid Pliocene to the glaciated quaternary traced by eolian dust deposition at a benchmark North Atlantic Ocean drill site. Quat. Sci. Rev. 93, 125–141. doi: 10.1016/j.quascirev.2014.04.005
Lang, D. C., Bailey, I., Wilson, P. A., Chalk, T. B., Foster, G. L., and Gutjahr, M. (2016). Incursions of southern-sourced water into the deep North Atlantic during late Pliocene glacial intensification. Nat. Geosci. 9, 375–379. doi: 10.1038/ngeo2688
Lawrence, K. T., Herbert, T. D., Brown, C. M., Raymo, M. E., and Haywood, A. M. (2009). High-amplitude variations in North Atlantic Sea surface temperature during the early Pliocene warm period. Paleoceanography 24, 1–15. doi: 10.1029/2008PA001669
Lawrence, K. T., Sigman, D., Herbert, T., Riihimaki, C., Bolton, C., Martinez-Garcia, A., et al. (2013). Time-transgressive North Atlantic productivity changes upon northern hemisphere glaciation. Paleoceanography 28, 740–751. doi: 10.1002/2013PA002546
Lisiecki, L. E., and Raymo, M. E. (2005). A Pliocene-Pleistocene stack of 57 globally distributed benthic δ18O records. Paleoceanography 20:PA1003. doi: 10.1029/2004PA001071
Marroig, G., and Cheverud, J. M. (2005). Size as a line of least evolutionary resistance: diet and adaptive morphological radiation in New World monkeys. Evolution 59, 1128–1142. doi: 10.1111/j.0014-3820.2005.tb01049.x
Martínez-Garcia, A., Rosell-Melé, A., Jaccard, S. L., Geibert, W., Sigman, D. M., and Haug, G. H. (2011). Southern Ocean dust-climate coupling over the past four million years. Nature 476, 312–315. doi: 10.1038/nature10310
McGlothlin, J. W., Kobiela, M. E., Wright, H. V., Mahler, D. L., Kolbe, J. J., Losos, J. B., et al. (2018). Adaptive radiation along a deeply conserved genetic line of least resistance in Anolis lizards. Evol. Lett. 2, 310–322. doi: 10.1002/evl3.72
Mudelsee, M., and Raymo, M. E. (2005). Slow dynamics of the northern hemisphere glaciation. Paleoceanography 20, 1–14. doi: 10.1029/2005PA001153
Naafs, B. D. A., Hefter, J., Acton, G., Haug, G. H., Martínez-Garcia, A., Pancost, R., et al. (2012). Strengthening of north American dust sources during the late Pliocene (2.7 ma). Earth Planet. Sci. Lett. 317-318, 8–19. doi: 10.1016/j.epsl.2011.11.026
Naafs, B. D. A., Stein, R., Hefter, J., Khélifi, N., De Schepper, S., and Haug, G. H. (2010). Late Pliocene changes in the North Atlantic current. Earth Planet. Sci. Lett. 298, 434–442. doi: 10.1016/j.epsl.2010.08.023
Peiman, K. S., and Robinson, B. W. (2017). Comparative analyses of phenotypic trait covariation within and among populations. Am. Nat. 190, 451–468. doi: 10.1086/693482
Porto, A., Sebastiao, H., Pavan, S. E., VandeBerg, J. L., Marroig, G., and Cheverud, J. M. (2015). Rate of evolutionary change in cranial morphology of the marsupial genus Monodelphis is constrained by the availability of additive genetic variation. J. Evol. Biol. 28, 973–985. doi: 10.1111/jeb.12628
R Core Team, (2013). R: A Language and Environment for Statistical Computing, R Foundation for Statiastical Computing, Vienna, Austria.
Renaud, S., and Auffray, J. C. (2013). The direction of main phenotypic variance as a channel to morphological evolution: case studies in murine rodents. Hystrix, Ital. J. Mammal. 24, 85–93. doi: 10.4404/hystrix-24.1-6296
Renaud, S., Auffray, J. C., and Michaux, J. (2006). Conserved phenotypic variation patterns, evolution along lines of least resistance, and departure due to selection in fossil rodents. Evolution 60, 1701–1717. doi: 10.1111/j.0014-3820.2006.tb00514.x
Schluter, D. (1996). Adaptive radiation along genetic lines of least resistence. Evolution 50, 1766–1774. doi: 10.2307/2410734
Schmidt, D. N., Renaud, S., Bollmann, J., Schiebel, R., and Thierstein, H. R. (2004). Size distribution of Holocene planktic foraminifer assemblages: biogeography, ecology and adaptation. Mar. Micropaleontol. 50, 319–338. doi: 10.1016/S0377-8398(03)00098-7
Shackleton, N. J., Backman, J., Zimmerman, H., Kent, D. V., Hall, M. A., Roberts, D. G., et al. (1984). Oxygen isotope calibration of the onset of ice-rafting and history of glaciation in the North Atlantic region. Nature 307, 620–623. doi: 10.1038/307620a0
Spray, J. F., Bohaty, S. M., Davies, A., Bailey, I., Romans, B. W., Cooper, M. J., et al. (2019). North Atlantic evidence for a unipolar icehouse climate state at the Eocene-Oligocene transition. Paleoceanogr. Paleoclimatol. 34, 1124–1138. doi: 10.1029/2019PA003563
Steppan, S. J., Phillips, P. C., and Houle, D. (2002). Comparative quantitative genetics: evolution of the G matrix. Trends Ecol. Evol. 17, 320–327. doi: 10.1016/S0169-5347(02)02505-3
Streit, R. P., and Bellwood, D. R. (2022). To harness traits for ecology, let's abandon 'functionality. Trends Ecol. Evol. in press. doi: 10.1016/j.tree.2022.11.009
Van de Pol, M., and Wright, J. (2009). A simple method for distinguishing within-versus between-subject effects using mixed models. Anim. Behav. 77:753. doi: 10.1016/j.anbehav.2008.11.006
Voje, K. L., and Hansen, T. F. (2012). Evolution of static allometries: adaptive change in allometric slopes of eye span in stalk-eyed flies. Evolution 67, 453–467. doi: 10.1111/j.1558-5646.2012.01777.x
Voje, K. L., Hansen, T. F., Egset, C. K., Bolstad, G. H., and Pelabon, C. (2013). Allometric constraints and the evolution of allometry. Evolution 68, 866–885. doi: 10.1111/evo.12312
Wei, K.-Y. (1994a). Allometric heterochrony in the Pliocene-Pleistocene planktic foraminiferal clade Globoconella. Paleobiology 20, 66–84. doi: 10.1017/S0094837300011143
Wei, K.-Y. (1994b). Stratophenetic tracing of phylogeny using SIMCA pattern recognition technique: a case study of the late Neogene planktic foraminifera Globoconella clade. Paleobiology 20, 52–65. doi: 10.1017/S0094837300011131
Keywords: lines of least resistance, climate change, microevolution, Pliocene, foraminifera, plankton
Citation: Brombacher A, Wilson PA, Bailey I and Ezard THG (2023) Morphological variation across space does not predict phenotypic change through time in two Neogene planktonic foraminifera species. Front. Ecol. Evol. 11:1165174. doi: 10.3389/fevo.2023.1165174
Edited by:
Harry James Dowsett, United States Geological Survey (USGS), United StatesReviewed by:
Marci Robinson, United States Geological Survey (USGS), United StatesAndrej Spiridonov, Vilnius University, Lithuania
Copyright © 2023 Brombacher, Wilson, Bailey and Ezard. This is an open-access article distributed under the terms of the Creative Commons Attribution License (CC BY). The use, distribution or reproduction in other forums is permitted, provided the original author(s) and the copyright owner(s) are credited and that the original publication in this journal is cited, in accordance with accepted academic practice. No use, distribution or reproduction is permitted which does not comply with these terms.
*Correspondence: Anieke Brombacher, QW5pZWtlLkJyb21iYWNoZXJAc290b24uYWMudWs=