 Silvy M. van Kuijk
 Sun O’Brien
 Dena J. Clink
 John G. Blake
 Anthony Di Fiore
- 1Department of Anthropology, The University of Texas at Austin, Austin, TX, United States
- 2Department of Computer Science, The University of Texas at Austin, Austin, TX, United States
- 3K. Lisa Yang Center for Conservation Bioacoustics, Cornell Lab of Ornithology, Cornell University, Ithaca, NY, United States
- 4Department of Wildlife Ecology and Conservation, University of Florida, Gainesville, FL, United States
- 5Estación de Biodiversidad Tiputini, Universidad San Francisco de Quito, Quito, Ecuador
Passive acoustic monitoring (PAM) – an approach that uses autonomous acoustic recording units (ARUs) – can provide insights into the behavior of cryptic or endangered species that produce loud calls. However, extracting useful information from PAM data often requires substantial human effort, along with effective estimates of the detection range of the acoustic units, which can be challenging to obtain. We studied the duetting behavior of pair-living red titi monkeys (Plecturocebus discolor) using PAM coupled with an open-source automated detection tool. Using data on spontaneous duetting by one titi pair, combined with recordings from two Song Meter SM2 ARUs placed within their home range, we estimated that the average source level of titi duets was ~105 dB re 20 μPa at 1 m with an attenuation rate of 8 dB per doubling of distance, and we determined that the detection radius for manual annotation of duets in audio recordings was at least 125 to 200 m, depending on the approach used. We also used a supervised template-based detection algorithm (binary point matching) to evaluate the efficacy of automated detection for titi duets in audio recordings using linear arrays of ARUs within a ~2 km2 area. We used seven titi duet templates and a set of “off-target” howler monkey (Alouatta seniculus) templates to reduce false positive results. For duets with a signal-to-noise (SNR) ratio > 10 dB (corresponding to a detection radius of ~125 m) our detection approach had a recall (the number of all duets that are correctly detected) of 1.0. Performance decreased when including duets with a lower SNR (recall = 0.71, precision = 0.75). The fact that multiple lines of evidence suggest an effective detection radius of 125 to 200 m for titi duets across upland terra firme and seasonally flooded forest lends support to our findings. We suggest that PAM studies of other cryptic but vocally active species would benefit from following similar experimental and analytic procedures to determine an ARU’s effective detection radius and to improve the performance of automated detection algorithms.
1 Introduction
Duetting is an interactive form of acoustic communication that is relatively common in some pair-living species of tropical birds, such as Thryothorus wrens and Cercomacra antbirds (Hilty, 2003; Slater and Mann, 2004; Hall, 2009), but can also be found in pair-living mammals, particularly primates (Méndez-Cárdenas and Zimmermann, 2009). In primates, duets are considered “loud calls”, i.e., species-specific intergroup vocal signals that are structured to propagate over long distances (Waser and Waser, 1977; Mitani and Stuht, 1998). Duetting has been found in all examined species in the subfamily Callicebinae (genera Callicebus, Cheracebus, Plecturocebus: Caselli et al., 2014; Adret et al., 2018), all but two species of the south-east Asian gibbons (family Hylobatidae, Geissmann, 2002), the lemurs Indri indri (Pollock, 1986) and Lepilemur edwardsi (Méndez‐Cárdenas and Zimmermann, 2009), the genus Tarsius (Groves and Shekelle, 2010), and in the colobine Presbytis potenziani (Tilson and Tenaza, 1976; Sangchantr, 2004). The structure of duets can vary considerably among primate taxa. For example, pair mates may coordinate their vocalizations to overlap with one another, as seen in titi monkeys (Müller and Anzenberger, 2002; Adret et al., 2018), or to alternate with the partner’s vocalizations, as seen in gibbons (Fan et al., 2009). Numerous functional hypotheses have been suggested to explain the evolution of duetting behavior in such a diverse set of primate species. These hypotheses can be categorized based on the presumed audience for the vocalization: the pair mate versus other nearby conspecifics. As a pair-mate focused behavior, duetting has been suggested to have evolved as a mechanism to initially form and later maintain the pair-bond (Geissmann, 1999; Fan et al., 2009). As behavior directed at nearby solitary individuals or neighboring pairs, duetting is proposed to have evolved as a mechanism for mate-guarding (Fan et al., 2009), as a mechanism for communicating with neighboring groups to maintain inter-group spacing (Robinson, 1981; Dolotovskaya and Heymann, 2022), or as behavior associated with collective resource or territory defense (Koloff and Mennill, 2013; Caselli et al., 2015; Dolotovskaya and Heymann, 2022). These hypotheses are, of course, not mutually exclusive.
Despite much interest from scientists, however, empirical tests regarding the evolutionary origin and function of duet calls are difficult to perform. This is in part because – although duetting is a very conspicuous signal – it can be difficult to study in elusive species that hide in vegetation while calling and that are sometimes hard to habituate to human presence (Souza-Alves and Ferrari, 2010; Pinto et al., 2013). The use of passive acoustic monitoring (PAM) provides a method that can circumvent some of these difficulties in studying duetting in cryptic yet vocal animals. PAM is an ecological survey tool that makes use of autonomous recording units (ARUs) programmed to automatically record at a set schedule and deployed at an ecologically appropriate temporal and spatial scale (Deichmann et al., 2018; Sugai et al., 2019). Collecting data with ARUs means human presence in the field can be limited. This method has recently proven to be useful in monitoring taxa that are rare or elusive such as Geoffroy’s spider monkeys (Ateles geoffroyi, Lawson et al., 2023), Hainan gibbons (Nomascus hainanus, Dufourq et al., 2021) and black lion-tamarins (Leontopithecus chrysopygus, Zambolli et al., 2023). Although the use of ARUs has great potential for longitudinal monitoring at relatively low cost, it requires careful consideration to calibrate the methodology used to the species of interest.
One important consideration pertains to the propagation and attenuation of vocalizations in different habitats and under different ecological conditions, which can have a major but often overlooked impact on the detection ranges of ARUs across a landscape. Attenuation is commonly discussed in terms of two factors: spherical spreading and excess attenuation. Spherical spreading refers to the natural decrease in sound intensity as soundwaves propagate outward in all directions (e.g., in the shape of a sphere) from a source. In addition to spherical spreading, excess attenuation encompasses additional factors such as scattering (resulting from the interruption of soundwave paths by objects in the environment) and absorption (where sound energy is absorbed by another medium like soil or water) (Bradbury and Vehrencamp, 1998). Source level, frequency range, and call duration are variables that can affect the propagation of vocalizations (Waser and Brown, 1984; Nemeth et al., 2006). For a given frequency, the louder the source level (typically operationalized as the intensity of the sound at 1 meter from the source) of the primates’ vocalizations, the further the call will propagate (Bradbury and Vehrencamp, 1998). However, source levels are known or can be estimated for only a few primates (Table S1, Supplementary Material). Lower frequency sounds attenuate less quickly due to their longer wavelengths (Bradbury and Vehrencamp, 1998), which is why primate loud calls tend to have lower frequencies than other vocalization types (Mitani and Stuht, 1998). Habitat characteristics, including canopy density, ambient noise levels and topography, as well as weather conditions such as temperature, humidity and wind speed also affect propagation distances of calls (Ellinger and Hödl, 2003; Darras et al., 2016; Gibb et al., 2019). Excess attenuation disproportionately affects vocalizations in heavily forested environments like rainforests, where dense vegetation and complex structures contribute to increased absorption and scattering (Brown and Waser, 2017). However, certain frequency ranges may be less affected by attenuation, creating a “sound window” that is more suitable for long-distance communication (Waser and Brown, 1984). Consequently, selection pressures may lead to the emergence of long-distance vocalizations that have much of their intensity within these sound windows of lower attenuation, even resulting in acoustic differences between populations of the same primate species inhabiting different habitats (Sugiura et al., 2006). When recording vocalizations with an ARU, various factors such as device settings, height above the ground of the recorder and microphone (Padgham, 2004; Rempel et al., 2013; Darras et al., 2020), as well as the direction of an animal’s vocalizations (Pérez-Granados et al., 2019) also influence the distance at which calls can be recorded.
The use of ARUs allows us to expand the spatiotemporal scale of our research, but often results in the accumulation of vast amounts of audio data that need to be processed. Manually processing audio recordings to identify the start and stop times of vocalizations of interest (an approach known as annotation) is time-consuming and prone to error and bias. For example, if recordings are being reviewed by multiple observers, then differences in experience or perceptual abilities may be an additional source of variation that needs to be accounted for in analyses (Swiston and Mennill, 2009). Similarly, if recordings are all reviewed manually by the same listener, order effects or listener fatigue could introduce error. For ARUs to be a valuable resource in our scientific endeavors, automated tools for screening recordings to detect and classify calls can be important for addressing this bottleneck in data processing. Classification tools predict categories of a signal of interest, such as its species or vocalization type (Stowell, 2022). Detection tools either generate a binary classification (presence or absence of a signal) for audio files or generate the location of a signal of interest by listing its start and end times within an audio file (Stowell, 2022). Moreover, automated detection tools are often “deterministic algorithms”, meaning that they can improve reproducibility in that, when well documented, the same automated audio file processing pipeline, run on the same dataset should yield exactly the same results. Still, automated detection tools present their own set of errors and biases (Digby et al., 2013), thus the tools are most valuable if the increase in time and space that can be surveyed outweighs the limitations of the detection algorithm and pipeline, or if the errors are more predictable and consistent in nature than those associated with manual annotation; however, error associated with human annotations is often ignored (Swiston and Mennill, 2009; Digby et al., 2013).
Methods for automated detection of acoustic signals within audio recordings are often machine learning-based classification algorithms that can be divided, conceptually, into “supervised”, “semi-supervised”, and “unsupervised” approaches. Whereas supervised and semi-supervised methods use a set of training data that is labeled by an observer (e.g., marking which audio files do and do not have duets after manual inspection), an unsupervised algorithm looks for patterns in the provided data without any prior information given by a human observer. Some of the commonly used supervised detection algorithms include Support Vector Machines (SVM; Noble, 2006; Heinicke et al., 2015; Clink et al., 2020), Gaussian Mixture Models (GMM; Bishop, 2006; Janvier et al., 2013; Heinicke et al., 2015), and K-nearest neighbors (Janvier et al., 2013; Bayestehtashk et al., 2014; Taunk et al., 2019). Some other methods, like Hidden Markov Models (HMM; Eddy, 2004; Porcaro, 2015) and artificial neural networks (ANN; Krogh, 2008; Pozzi et al., 2012) can be used for supervised, semi-supervised, or unsupervised classification. A variety of automated methods have been used to detect primate acoustic signals for at least 16 different primate species (Table S2, Supplementary Material), although very few of these studies have focused on primates of the Americas. In addition, automated detection methods have rarely been used for identifying duetting behavior (e.g., Schroeder and McRae, 2020; Szymański et al., 2021), and, to our knowledge, only three studies have used automated approaches with duetting primates: band-limited energy detection in gibbons (Hylobates funereus, Clink et al., 2023) and convolutional neural networks in gibbons (Nomascus hainanus, Dufourq et al., 2021) and indris (Indri indri: Ravaglia et al., 2023).
In this paper, we describe our approach using PAM and an open-source automated detection tool to study the duetting behavior of red titi monkeys (Plecturocebus discolor). Red titis are small-bodied, pair-living primates found in Colombia, Ecuador, and Perú (Vermeer and Tell-Alvarado, 2015). Though mostly cryptic, titi individuals produce loud calls of various types (e.g., solo calls, duets, and choruses) often in the early morning (Robinson, 1981; Kinzey and Becker, 1983; Aldrich, 2006; Van Kuijk, 2013; Dolotovskaya and Heymann, 2022). In the field, the duet of one pair is often followed by response duets from neighboring pairs (Caselli et al., 2015). The titis’ cryptic behavior means that many duets are sung from within hard-to-observe areas, such as vine tangles or the dense vegetation of sleeping trees (Kinzey and Becker, 1983; De Luna et al., 2010). In addition, unhabituated groups will often cut their calls short when people or other potential threats are nearby. Using PAM, however, it is possible to record duets and other loud calls from multiple groups without interfering with the primates’ natural behavior.
Here we use multiple complementary datasets to explore a number of important methodological issues relevant to using PAM to study titi duetting behavior. These issues have general relevance for PAM studies of other cryptic but vocally active species. First, we determined the average source level of titi monkey duets using data on spontaneous duetting by a titi pair, in combination with recordings from two Song Meter SM2 ARUs within their home range (hereafter “home range dataset”). Second, we examined the detection radius of duets (the radius around a recorder in which duets can be reliably recognized) on Song Meter recording devices using standardized playbacks at known distances from an ARU (hereafter “playback dataset”). Variation in ambient noise levels and other variables can change the detectability of a duet. Therefore, our third aim was to determine the detection probability of duets within the detection radius of the recorder by calculating the proportion of all duets that were recorded by the ARU. Fourth, the ability to detect vocalizations (by ear or on an ARU) is also influenced by the intensity of the call in comparison to the intensity of ambient noise and the amount of excess attenuation that affects the call as it propagates through the environment. Therefore, we examined how the signal-to-noise ratio (SNR) of duets decreases with distance using a combination of the home range dataset, playback dataset and audio recordings collected systematically during the early morning hours (05:45 to 08:10) from ARUs placed along a series of linear N–S transects from across the study area (hereafter “transect dataset”). We also estimated the amount of excess attenuation the duets experience on top of spherical spreading. Then, using a supervised template-based detection algorithm (binary point matching), we automatically detected the duets in the audio of the transect dataset. We also used our data to evaluate the SNR of duets that are detected by the automated algorithms and used this result to estimate the detection radius of duets on the Song Meter ARU. Finally, we highlight some methodological issues that must be considered when using PAM and automated algorithms to study duetting primates.
2 Methods
2.1 Study location
We conducted this study at the Tiputini Biodiversity Station (TBS, 00°37’05” S, 76°10’19” W, 190–270 m a.s.l.), located on the northern bank of the Tiputini River, in the province of Orellana in Ecuador (Figure 1A). TBS is adjacent to the Yasuní National Park and is part of the larger Yasuní Biosphere Reserve. The station’s presence preserves a ~700 ha tract of primary tropical rainforest consisting of mostly terra firme forest (lowland evergreen forest) along with some várzea and igapó regions (two types of flooded lowland evergreen forest) near streams, rivers, and a small lake. Annual precipitation averages 2924 mm ± SD 267 mm and temperature has a monthly average ranging from 23–25°C throughout the year (Van Belle et al., 2018).
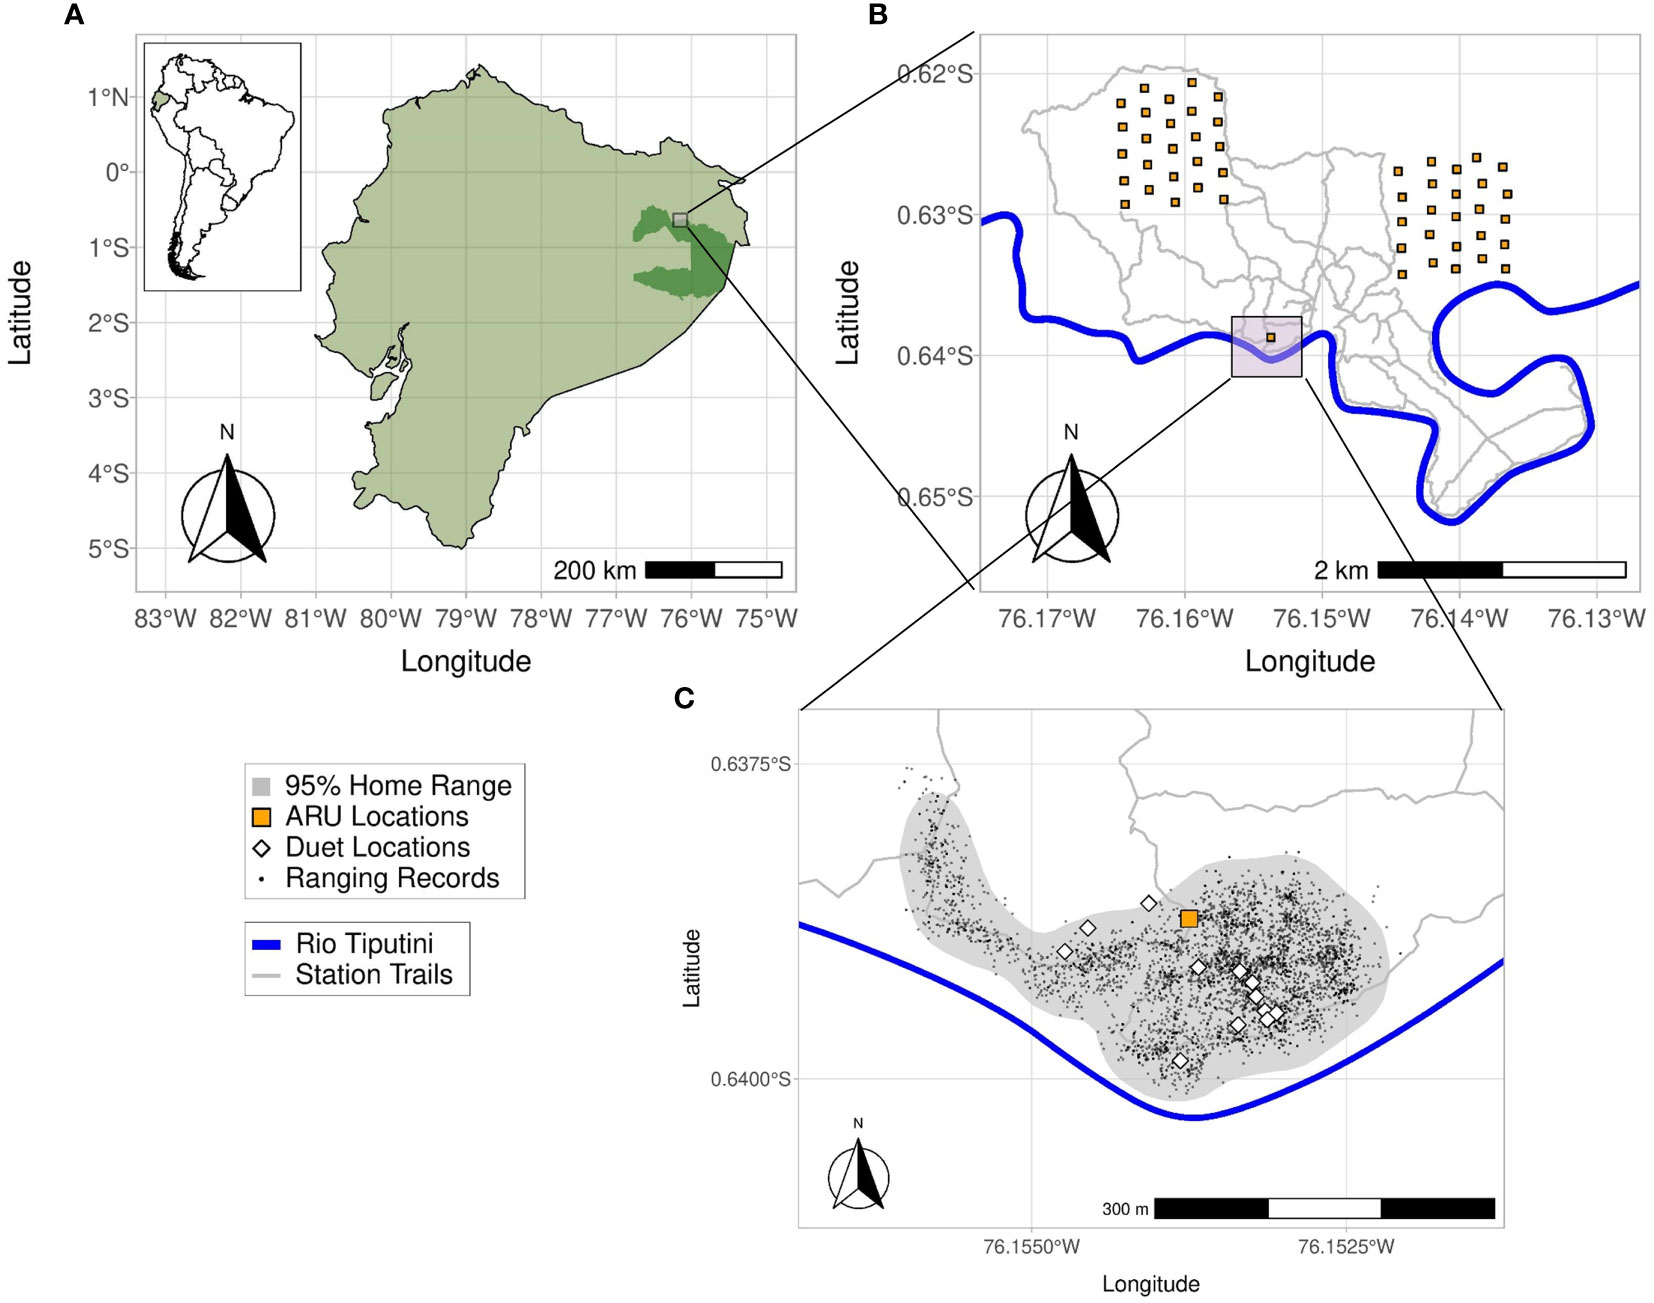
Figure 1 (A, B) The study site at the Tiputini Biodiversity Station is located adjacent to Yasuní National Park (dark green inset), Ecuador, on the left bank of the Rio Tiputini. Recorders for the transect dataset were located in two 1x1 km plots located within or along the trail system of the station. (C) The gray area marks the 95% kernel density home range for titi group L and the white diamonds are the locations of 12 duets recorded during behavioral follows of group L that were also recorded by the SM2 ARU (orange square). The small black dots are GPS ranging locations collected at 20-minute intervals while observers followed group L during field seasons from Oct to Jan 2015.
2.2 Study species
Three pairs of red titi monkeys and their offspring (groups K, L, and B) were habituated and have been studied regularly at TBS since 2003 as part of a long-term comparative study of sympatric pair-living primates (Van Belle et al., 2021). Our data on home range use and vocal behavior (used to determine duet source levels, to examine the detection probability of calls, and to measure decrease of SNR with distance) were collected in the range of group L in June and July of 2016. This group consisted of a male/female pair that shared this range from at least March 2009 through the period of this study. The pair had two offspring at the time recordings were collected: a sub-adult male born in January/February of 2014 and a juvenile female born in December of 2014. During the time group L was studied, in June/July of 2016, the subadult male was seen chorusing with his parents and singing solo calls. The juvenile female did not participate in any duets or produce any loud calls on her own.
2.3 Audio data collection
2.3.1 Home range dataset
Our first dataset, the “home range dataset”, was collected with the aim of estimating the source level of titi monkey duets, characterizing duet propagation loss over distance, and determining the detection radius of duets (the radius around the Song Meter SM2 ARUs in which duets are recorded). We placed two Song Meter SM2 ARUs (Wildlife Acoustics, Inc., Maynard, MA, USA) equipped with two SMX-II omnidirectional microphones each (frequency response 20–20,000 Hz) within group L’s home range at a height of 12 m for 34 days from mid-June to late July of 2016. Gain settings of the devices were left at the default 48 dB. As the recorders had to be placed in the canopy with the use of a slingshot and ropes, a combination of logistics and home range knowledge determined the deployment location of the recorders: we needed enough open space to use the slingshot, yet this had to be a location in which group L frequently spent time. Once a suitable location was found (Figures 1B, C), we recorded the location of the SM2 ARUs using a Garmin 76Cx GPS. The ARUs were attached perpendicular to one another to a metal frame so that the four microphones on the two ARUs were all spaced apart equally. The ARUs were set to record 24 hours per day at 16-bit resolution with a 44 kHz sampling rate. Audio files were saved every 60 minutes in high-quality uncompressed (lossless) waveform format (WAV). Batteries and SD cards were exchanged roughly every 5 days.
2.3.2 Playback dataset
With our second dataset, the “playback dataset”, we aimed to examine the detection radius, detection probability, and propagation loss of duets in a more standardized way and at larger distances than our home range dataset allowed for. We played a 3-second clip of a duet previously recorded of group K at different specified distances from a stationary recorder along two trails in July of 2016. We attached a single SM2 ARU at a height of 12 m to a permanent canopy tower that was built around an emergent kapok tree (Ceiba pentandra). The ARU was configured to record at 16-bit resolution using a 44 kHz sampling rate. With the use of a Garmin 76Cx GPS, we then created one trail with GPS-mapped locations at 10, 25, 50, 75, 100, and 125 m from the base of the tower and a second trail with GPS mapped locations at the same distances plus additional locations at 150, 175 and 200 m from the tower. The length of these trails was limited to 125 m and 200 m due to geographical changes in the terrain.
At each of the locations along the trail SvK played the group K duet using a Sony ICD-UX533 digital voice recorder connected to a Pignose Legendary 7-100 portable amplifier at a height of ~2 m. Because the source level of titi monkey duets was unknown at the onset of this part of the study, we repeated these recordings at 80, 90 and 100 dB re 20 μPa at 1m (A-weighted) along both trails so we could analyze, post hoc, the data from the amplitude that is the closest match to the estimated source level of titi duets. We calibrated the three amplitude levels at 1 m from the Pignose amplifier with an American Recorder Technologies sound level meter. We repeated our playback recordings of all three amplitude levels twice at each distance and did so on two consecutive mornings: one morning with clear sunny weather and one overcast yet dry morning.
2.3.3 Transect dataset
Our last audio dataset, the “transect dataset”, is mainly used to evaluate the efficacy of a supervised template-based detection algorithm (binary point matching) for automated detection of titi duets in audio recordings. In addition, we use these data to examine how distance influences the detection of duets using multiple ARUs spaced at regular intervals along transects. The transect dataset comprises simultaneous recordings collected by one of us (JB) between late January and early March of 2013–2017 and originally intended for use in ornithological studies (Blake, 2021). For this third dataset, JB collected simultaneous recordings using a set of five Song Meter SM2+ ARUs placed at 200 m intervals along 10 different N–S transects within the TBS study area. Overall, these recorders were placed at a total of 50 locations, 25 in each of two approximately 100-ha research plots (Figure 1B), i.e., they were spread over an area of roughly 2 km2 and covered a range of microhabitats and topographies. These plots were established in 2001 and contain trails every ~100 m from east to west and every ~200 m from north to south. The grid is marked and GPS mapped every 50 m. For each day of recording, JB deployed five devices along one of the north–south grid lines in the plots at the intersections with the east–west transects, leading to a total distance of 800 m between recorders at opposite ends of the transect. The ARUs were positioned at 1.5 to 2 m off the ground and configured to record 10-min audio files with 16-bit resolution and using a 16 kHz sampling rate. The resultant 3600 second audio files were saved in high-quality uncompressed (lossless) waveform format (WAV).
The ARUs were programmed to start recording at 05:45 am and stop recording at 08:10 am, as the vocal activity of birds typically declines rapidly in the 2 hours following sunrise (Blake, 1992). Each 10-minute recording was separated by a 5-minute break, leading to a collection of ten recordings per device for each morning of deployment. Although the intermittent recording schedule and restricted time frame of sampling did not allow us to capture all titi monkey loud calls emitted in range of the recorders on any given morning, our data show that this time frame is appropriate for this study as 67.7% of all duets are heard before 07:30 (Figure 2). The devices were left in their locations until they had collected two full mornings of recordings without rainy weather and were then moved to a new N–S transect within the plot until all 25 locations per plot (5 N–S transects × 5 ARUs per transect) had been sampled. Batteries and SD cards were replaced as needed.
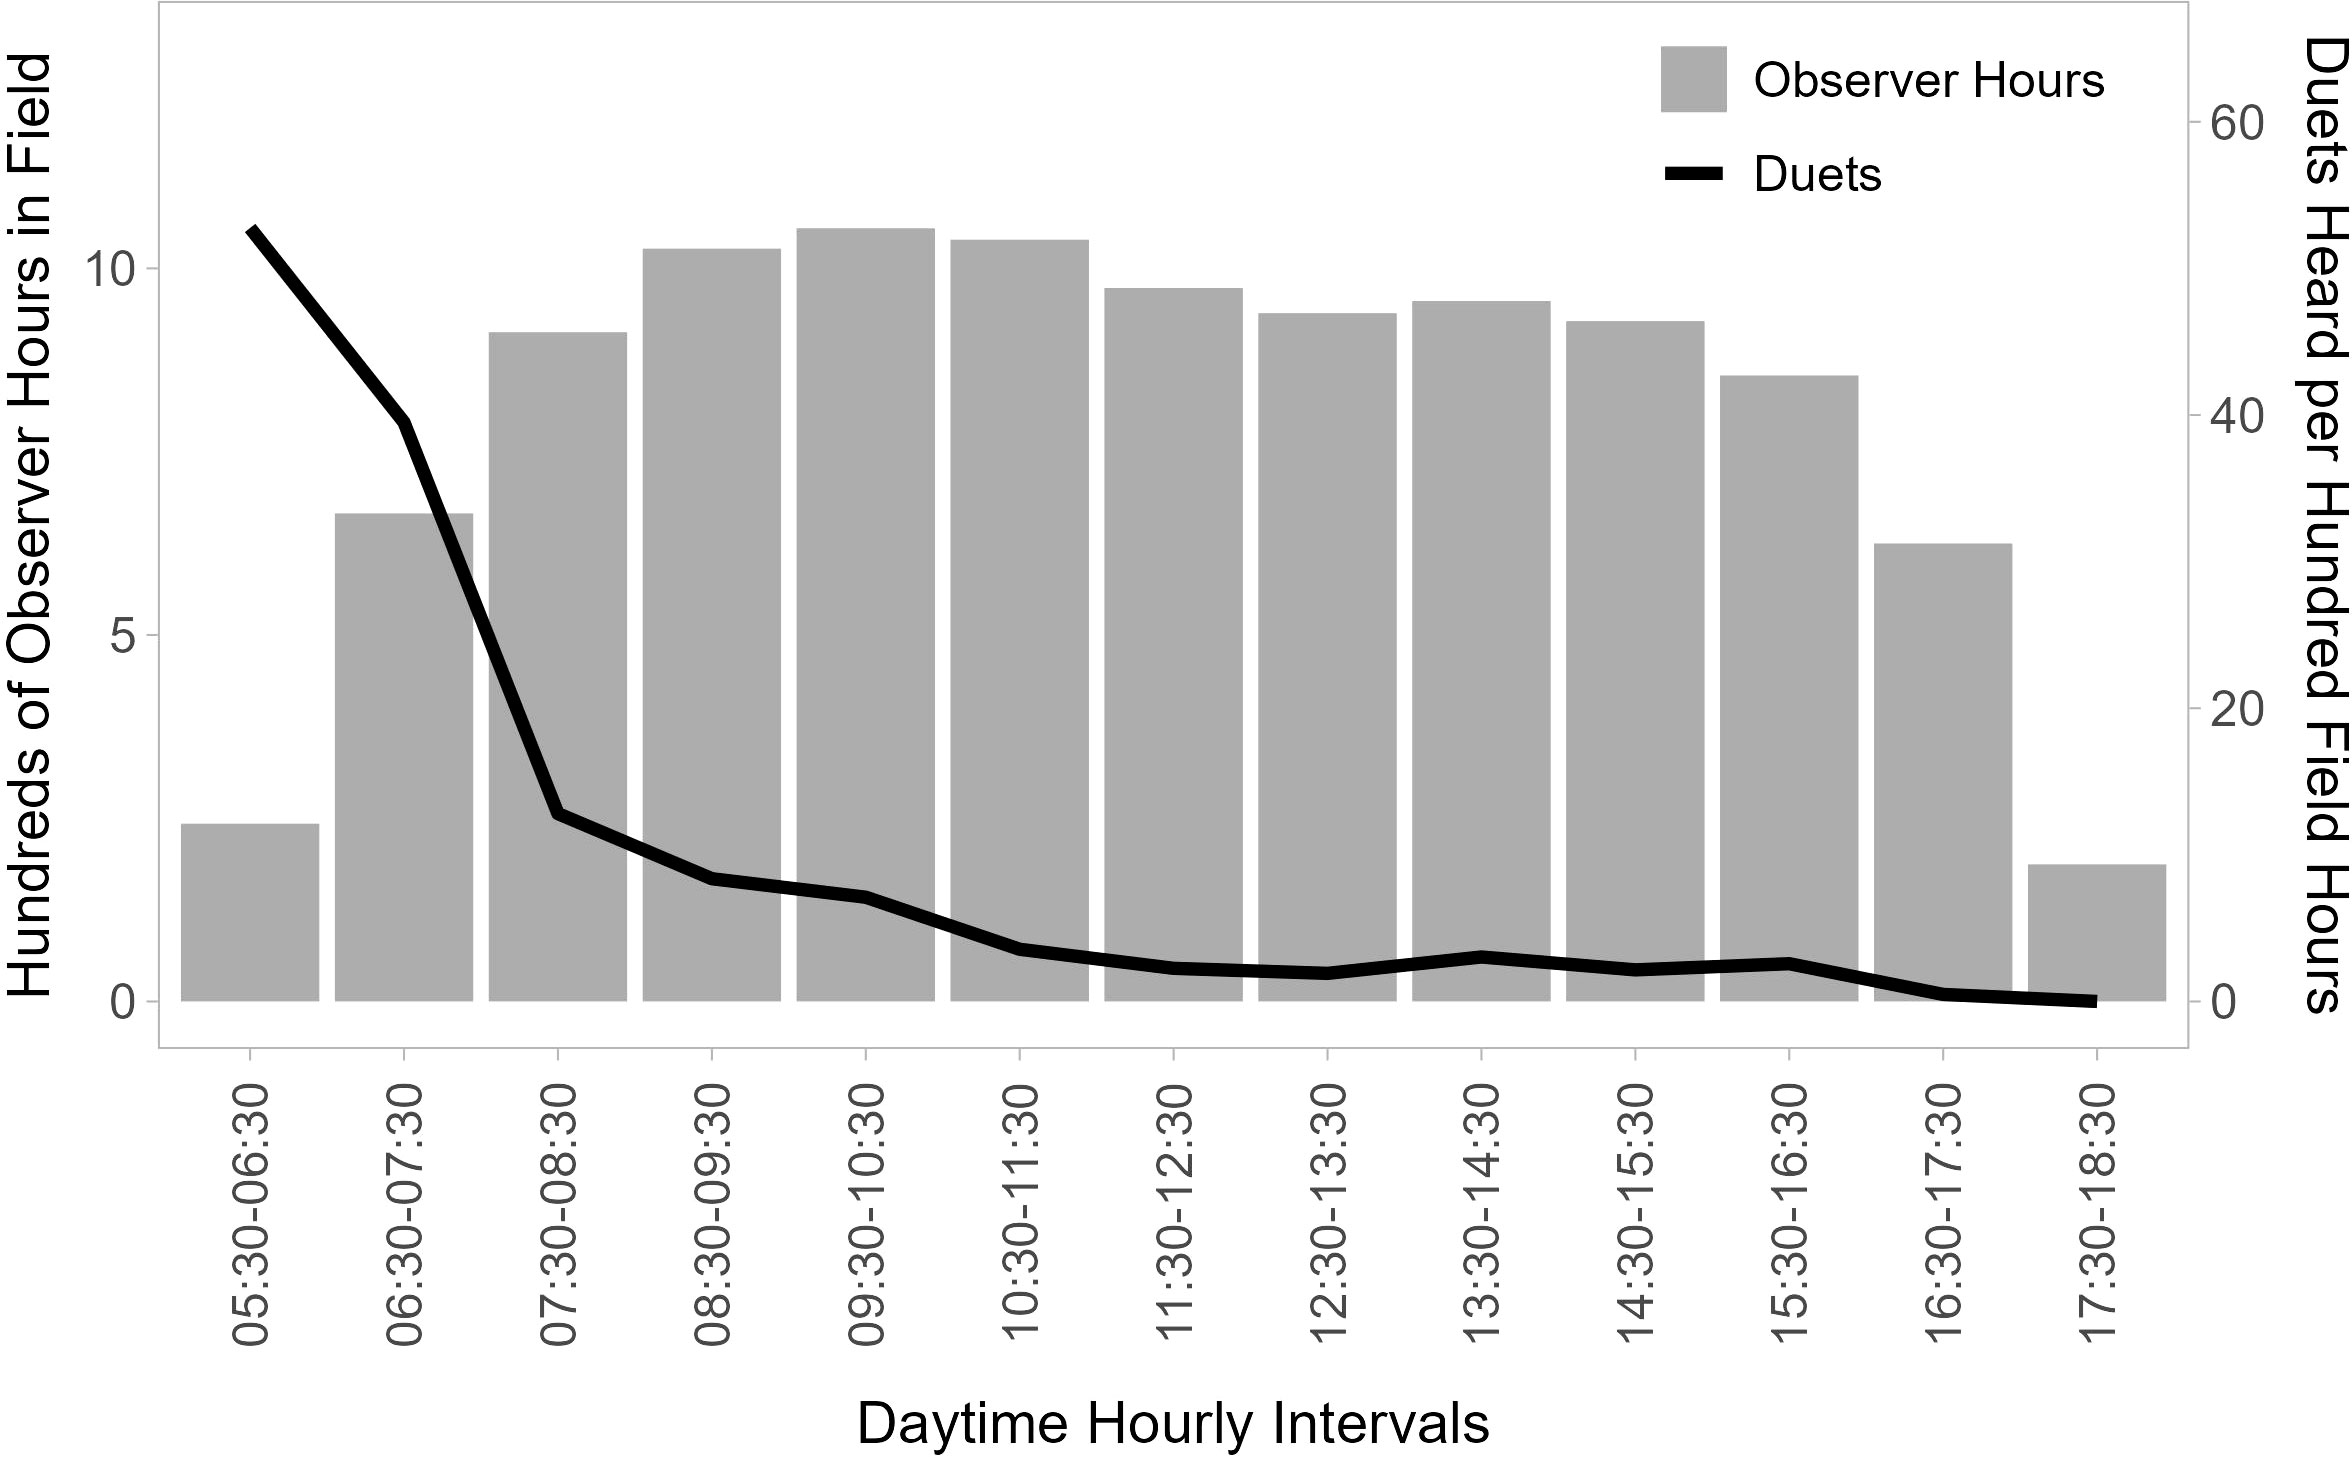
Figure 2 Temporal distribution of duet calls. Gray bars show the distribution of total observer field time (hundreds of observation hours between 2007 and 2015 for six observers focused on following titi monkeys) per hour of the day between 05:30 and 18:30, and the black line shows the number of duets recorded per 100 observer hours in field in each hourly block. Duetting is concentrated in the window from shortly before sunrise to the first few hours after sunrise (05:30 to 08:30).
2.4 How loud are titi monkey duets and what is their detection probability?
To evaluate when titi monkeys were most likely to sing duets, we analyzed data collected by six observers that followed titi monkeys between 2007 and 2016. From our long-term behavioral database we determined the total number of hours these observers spent in the field and the total number of duets they heard (either from monkeys they were following or from other groups) during this time. From these data, we calculated the duetting rate (number of duets heard per 100 observer field hours) for each hour of the day from 05:30 to 18:30, or from just before sunrise to just after sunset. Most duets occur during the early morning (Figure 2). During the 2016 field season, we regularly followed group L from 05:30 to ~11:00, after which time duetting is infrequent. On mornings with heavy rain, we would follow the group as soon as rain let up, usually locating them still in their sleep tree. During follows, we used the same model GPS to record the group’s travel path. As the monkeys generally do not travel when duetting, we also recorded the locations of all duet vocalizations emitted during the follow. We also recorded data on the timing and duration of duet sequences as well as any vocal responses of nearby groups.
To determine the detection probability of duets on the SM2 ARU in our home range dataset, we generated spectrograms of the audio files from both ARUs from the same days and hour as each duet in Raven Pro 1.6 (K. Lisa Yang Center for Conservation Bioacoustics, Cornell Lab of Ornithology, Cornell University, Ithaca, New York, USA) by applying a fast Fourier transform with a 1024-point Hann window (3 dB filter bandwidth = 61.9 Hz), 50% overlap, and a 1024-point DFT, with time and frequency measurement precision of 32 ms and 15.6 Hz. We then reviewed the sections of the recording where we expected, based on follow data, to find a duet. We matched the timing and duration of the duet sequences to ensure we could distinguish between group L’s duets and other duets. We calculated the SNR for the duet on all four spectrograms (one for each microphone) and used only the recording from the microphone with the highest SNR value as that presumably represents the microphone oriented most directly towards the monkeys.
From the home range dataset, we also estimated the source level of the titi duets using the R package ‘PAMGuide’ (Merchant et al., 2015). The absolute received level of the duet was measured from a 5-second segment at the start of the duet. PAMGuide allows for calculating the absolute received level of the signal when relevant hardware specifications are known. In our case, we provided PAMGuide with information on transducer sensitivity (−36 dB re 1 V/μPa at 1 kHz), gain settings (+48 dB), and the voltage of the analogue-to-digital converter (1.414 V). Then, using the resulting calibrated amplitude measurements for the duets as recorded on the ARU and the distance between the recorder and the vocalizing monkeys (calculated using the GPS coordinates of both points), we applied the inverse square law to estimate the source level of the duets at 1 m from the monkeys. Importantly, the average source level resulting from this calculation fails to account for the effect of excess attenuation and how this covaries with distance between the source and a recorder. We therefore calculated the average source level for the two duets closest to the recorder and used this value as a minimum estimate of the actual source level, from which we inferred the theoretical decay in SPL with distance assuming spherical spreading only. We then compared theoretical to observed SPL values at different distances between source and recorder to estimate the effect of excess attenuation on titi duets.
2.5 What is the detection radius of titi duets using our ARU setup?
We used both the home range and playback datasets to determine the detection radius of duets on our ARU setup. Because the duets in our home range dataset were limited in their distance from the recorder, the playback dataset allows us to expand upon the home range dataset results by increasing the tested distances. Spectrograms for the playback dataset audio files were created using identical specifications as discussed in Section 2.4 for the home range dataset. We only created spectrograms from the microphone most directly pointed towards the playback locations. The spectrograms were inspected by two observers who had no field experience with titi monkeys, but who were trained in annotating duets in audio recordings in Raven Pro. The observers were naive with respect to the timing of the duets. The observer-generated data was used to determine the proportion of playback stimuli at each playback distance that was manually recognized and annotated.
2.6 How does distance influence detection of titi monkey duets?
To determine at what distance from an ARU duets can still be detected in audio recordings, either by human observers or machine learning algorithms, we examined the relationship between the signal-to-noise ratio (SNR) of duets extracted from recordings and distance between the caller and the recorder in all three audio datasets (see Section 2.3).
For our transect dataset, we initially reviewed only data from one randomly chosen ARU from each series of five to avoid pseudo-replication by having the same duet reflected in the dataset more than once. This left us with a total of 230 hours of acoustic data. To locate duets within the audio files, SvK and one other observer generated spectrograms of the recordings in Raven Pro 1.6 using the same settings described in Section 2.4. The resulting spectrograms were again manually inspected by paging through 75 second windows at a time and playing back portions of the files to identify duets that were hard to see in the spectrogram yet still audible. Each detected duet was then assigned a subjective “quality score” ranging from 1 through 4, based on the listener’s qualitative perception of the recording (Figure 3). We scored duets as quality 1 when the monkeys were calling close enough to the recorder that they could be heard moving through the vegetation or giving quiet contact vocalizations. Duets were assigned quality score 2 when the titis could no longer be heard moving, but the image of the call in the spectrogram showed evidence of multiple harmonics. Quality score 3 was assigned to duets that were audible to the listener and had clearly visible fundamental frequencies but showed far fewer harmonics than calls of quality score 1 or 2. Quality score 4 was assigned to duets that were barely audible and had only faint fundamental frequencies visible in spectrograms.
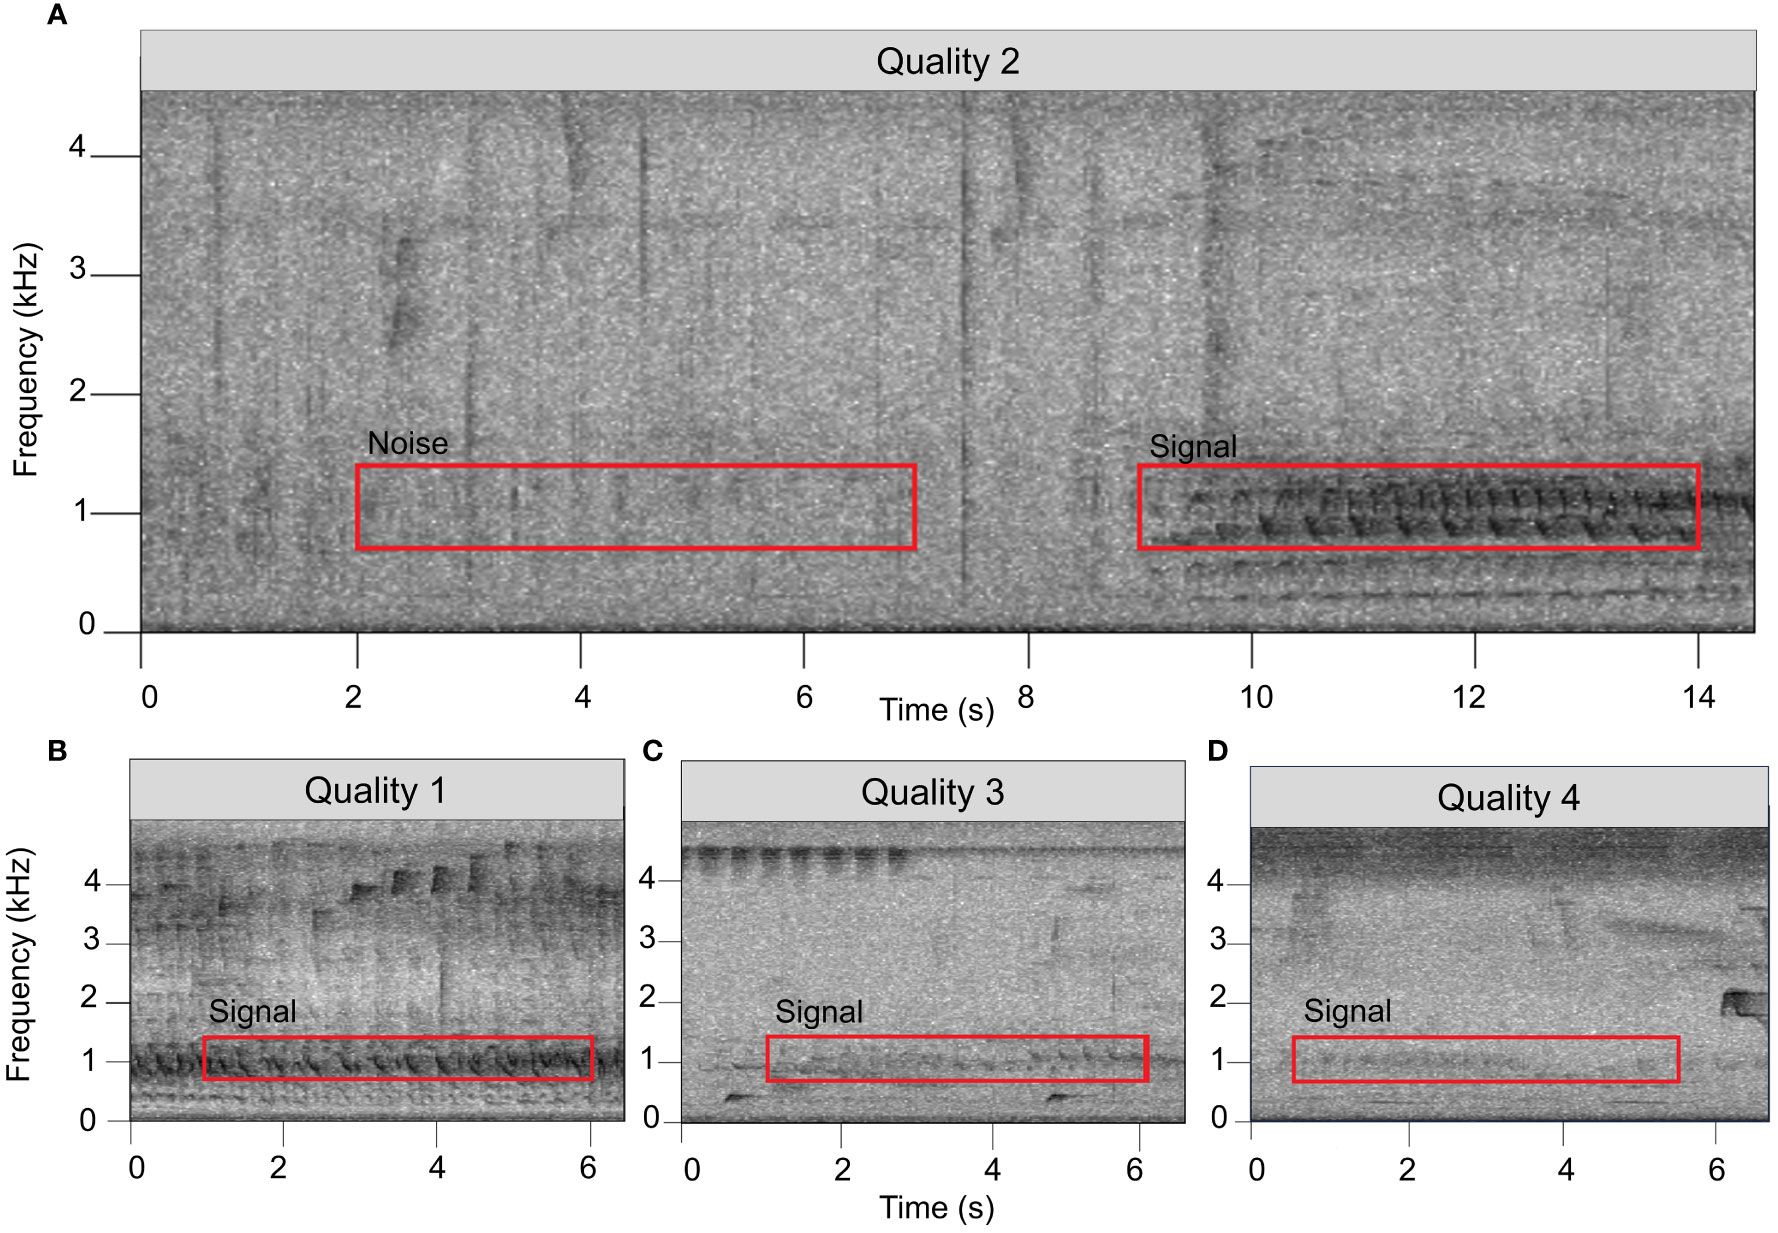
Figure 3 The SNR of a signal was determined by comparing the root mean square amplitude of a 5-sec, 700–1400 Hz window at the onset of a signal of interest (red box labeled “Signal”) to a comparably-sized window with the same frequency range in a low-noise area of the recording (red box labeled “Noise”). The onset of a duet was determined by locating the first loud note (the “bellow”) after the fainter introductory notes. (A–D) show examples of duets assigned by listeners to four subjective “quality” scores.
For a subset of the duets detected through the manual procedure described above, we then investigated whether the same duet could be heard on any of the other four devices that were recording at the same time. For this subset, we investigated all duets for which we had assigned qualitative quality scores of 1 through 3 (N=17 duets) plus an additional 16 duets assigned a quality score of 4. We then calculated the SNR of the calls appearing simultaneously on each of the recorders to determine which of the five recorders the group was closest to. SNRs were calculated using Raven Pro by drawing a 5-second selection box with a frequency range of 700–1400 Hz around the start of a duet. In case of interference of other organisms’ vocalizations at the start of a duet, we used the first 5-second section thereafter without interrupting calls of other animals. A second selection box with an identical duration and frequency range was drawn around a section of ambient noise shortly before the duet or, in case of interfering noise, directly after the end of the duet (e.g., Figure 3A). The 700–1400 Hz frequency range was chosen as it encompasses the peak frequencies (i.e., the loudest spectral components) of a duet (which are most likely to propagate furthest through the environment). The duration was chosen such that it is fairly easy to find a suitable area of ambient noise in the recording without other loud vocalizations or other interfering noises.
For the 5-second selection boxes around the duets and ambient noise, we used Raven to calculate the “Inband Power (dB)”. We converted the inband power measurements for these two selections from dB to linear units using the formula y = 10x/10, where x is the inband power in dB and y is the inband power in linear units. We then calculated the SNR in linear units using the formula SNRlinear = (y Signal − y Noise)/y Noise, where y Signal and y Noise are the inband power in linear units for the duet and ambient noise selections, respectively. Last, we turned the SNR from linear units back into decibel units by using SNRdecibels = 10 × log10 (SNRlinear) (K. Lisa Yang Center for Conservation Bioacoustics, 2022). Because the distance between titi monkeys and ARUS in the transect dataset is unknown, we used the SNRs of the different datasets to determine at what distance from the ARU the SNR is too low for a duet to reliably be detected by the algorithm.
2.7 How well do automated detection algorithms perform?
We examined the efficacy of automated detection of duet calls in audio files from our transect dataset using the binary point matching (BPM) template matching algorithm implemented in the monitoR package (Katz et al., 2016) for the R statistical programming environment (version 4.1.2; R Core Team, 2022). Because titi monkey duets are diverse and change in pattern throughout the duration of the song, we chose a random selection of duets to create templates from in order to capture the full variation of these complex vocalizations. To increase the odds of detecting duets at short and long distances from the recorder, we also chose high-quality duets at a range of distances to build templates from. We created seven different templates that we used to screen each audio file: one duet was taken from a short-distance recording made with a Marantz PMD 660 digital recorder and Sennheiser ME67 shotgun microphone with K6 power module, and 6 duets with various assigned quality scores extracted from the transect dataset. BPM templates are created from these reference calls by specifying a frequency range, time range, and amplitude cutoff as multidimensional parameters. We chose a −25 dB amplitude cutoff and 10-second time frame for all templates because this created the clearest distinction in similarity scores between test files containing duets and test files that did not contain duets. In addition, the frequency range was specific to each template, to accommodate differences in SNR of the duets and surrounding ambient noise. The minimum frequency ranged from 200 to 300 Hz and the maximum frequency ranged from 1400 Hz (duets with lower SNR) to 1800 Hz (duets with higher SNR) depending on the number of visible harmonics.
Duet templates were initially tested against a validation dataset. This was a sample from the transect dataset that included 8 days of data (i.e., 80 10-minute audio files), and included the presence of two known titi duets, one titi burst gobble (a loud call of shorter duration but similar frequency range to the duet, similar to Caselli et al.’s (2014) “type 1 call” and Robinson’s (1979) “short sequence”), five howler monkey (Alouatta seniculus) roars, and a multitude of other common loud vocalizations such as bird calls in a similar frequency to titi duets that could potentially cause false-positive detections. We then tested multiple similarity cut-off scores as the detection threshold for a titi monkey, identifying a cut-off score of 4.0 as one that led to a low number of false negatives and a low number of false positives in our test data.
We then applied this detection pipeline to a large test dataset of 1099 additional 10-minute audio files from the transect dataset (and excluding the eight days used for training the data) and compared the results of that detection process to manual annotation of the same 1099 files. For each audio file inspected, we calculated an average maximum similarity score for the set of seven titi templates (and always excluding scores for when a particular template was applied to the file it was extracted from). The automated detection algorithm’s performance can be visualized using a confusion matrix, which classifies true positives (TP), true negatives (TN), false positives (FP), and false negatives (FN) (Novaković et al., 2017; Flach, 2019). That is, a true positive is when the algorithm correctly detected a titi duet in an audio file, whereas a false positive is when a different vocalization or ambient noise was mistaken for a titi duet. True negatives are files that the algorithm correctly classified as not containing a titi duet and false negatives are files containing a titi duet that the algorithm failed to detect.
The initial analysis with this set of templates (Pipeline 1) used only a mean similarity score cut-off of 4.0. Given that a low SNR value for a signal of interest in recordings is known to lead to decreased algorithm performance (Spillman et al., 2017), to evaluate the role of SNR on algorithm performance for titi duets, we modified our dataset to exclude quality score 4 duets. Pipeline 2 then used the mean similarity score of 4.0 on this modified dataset. Because large numbers of howler monkey roars were erroneously classified as titi duets (i.e., false-positive detections), we created an additional three templates specific to howler monkeys and screened recordings with these templates as well. Pipeline 3 used our original test dataset and scored a detection when two conditions were met: (1) the titi template score was higher than 4.0 and (2) when the titi template score exceeded the howler template score for the audio file. Last, Pipeline 4 used the detection rule including the howler monkey templates and the modified dataset that excluded quality score 4 duets. More detailed description of algorithm performance and the four pipelines can be found in the Supplementary Material (Data Sheet 1).
We used common metrics to evaluate the success of the four pipelines: precision, recall, balanced accuracy, and the F1 score. Precision is the portion of all positive detections that are correct detections. Recall (also called sensitivity) is the proportion of all duets in the manually scored dataset that are correctly detected. Recall suggests how well the algorithm detects duets, whereas precision stipulates the reliability of the algorithm. Accuracy is the proportion of all predictions that were correct, whether those are detections or nondetections. Because this number would be skewed by a large number of true negatives, we use balanced accuracy instead, which is calculated as the average of recall and specificity (i.e., the proportion of true negatives divided by all negatives). The F1 score is the harmonic mean of precision and recall. One major point of criticism of automated detection procedures such as those implemented in monitoR is that there is often a high number of false-positive detections (Barclay, 1999; Swiston and Mennill, 2009). As red titis at our study site duet infrequently, false negatives are of larger concern as this would reduce the already small number of duets that naturally occur in any dataset. However, we attempted to find a balance that keeps both the number of false negatives as well as false positives reasonable. Last, as the detection probability of a duet strongly depends on its SNR, we calculated the SNR of all duets to investigate how SNR influences detection probability of the duets.
3 Results
3.1 How loud are titi monkey duets and what is their detection probability?
Five observers recorded 820 duets in 10,439 hours in the field between 2007 and 2016. Only 28 (3.3%) of these duets were recorded before 06:00 am, yet between 05:30 and 06:30 we recorded the highest number of duets per 100 hours at 55.6. We recorded 41.5 duets per 100 hours between 06:30 and 07:30, after which the number of duets per 100 hours strongly declines (Figure 2).
A total of 13 duets were recorded in the home range dataset for group L during behavioral follows on nine of the 34 days that the ARU was active, meaning they sang roughly once every 3 to 4 days. Of the 13 duets, two were spontaneous calls (i.e., either the first calls of the day detected by the observer or the first ones visible in the audio recordings) that often elicited responses from neighboring groups. The other 11 duets were responses to nearby groups’ duets as we heard calls of other groups shortly before the onset of group L’s duet. The earliest duet from group L was recorded at 06:18 and the latest duet occurred at 09:35. The duration of duets varied from 33 seconds to 6 minutes and 53 seconds, with an average length of 3 minutes and 20 seconds.
We were able to locate 12 of these 13 duets in the ARU recordings (Figure 1C). Post-hoc inspection of the data revealed that the missing (not recorded) duet resulted from technological difficulties with the recorder. The calculated distance between the GPS points of the ARU and duetting locations ranged from 38 to 125 m. Mean source level of the 12 duets as estimated based on spherical spreading only was 84.6 dB re 20 µPa at 1 m ± SD 4.9 dB. The mean amplitude estimated on the basis of the two closest duets only was 91.9 dB re 20 µPa at 1 m (see also Table S1, Supplementary Material). This increase in estimated source level in comparison to the overall average demonstrates that duets are affected by excess attenuation in addition to spherical spreading. Figure 4A demonstrates the difference in the theoretical decay in SPL with only spherical spreading (red line) as compared to the observed decay in our dataset (blue line), assuming an SPL at 1m of 91.9 dB re 20 µPa as estimated above. Figure 4B shows the estimated excess attenuation in relation to distance by plotting the difference in SPL between the theoretical and observed curves of Figure 4A. Additionally, using our playback dataset, it was possible to estimate the amount of excess attenuation that duets experience at different distances from a speaker by comparing theoretical versus observed received levels for a given source level (100 dB re 20 μPa at 1 m, Figures 4C, D). We estimated that the two closest calls recorded in our home range dataset would have an average excess attenuation ~12.9 dB (Figure 4D), suggesting that the source level for these calls would actually be ~105 dB re 20 μPa at 1 m (91.9 + 12.9 = 104.8) (Table S1, Supplementary Material). Moreover, using our playback dataset, we found that excess attenuation averaged 2 dB per doubling of distance, in addition to the 6 dB attenuation due to spherical spreading. This leads to an estimated total attenuation rate of 8 dB per doubling of distance for titi duets at TBS.
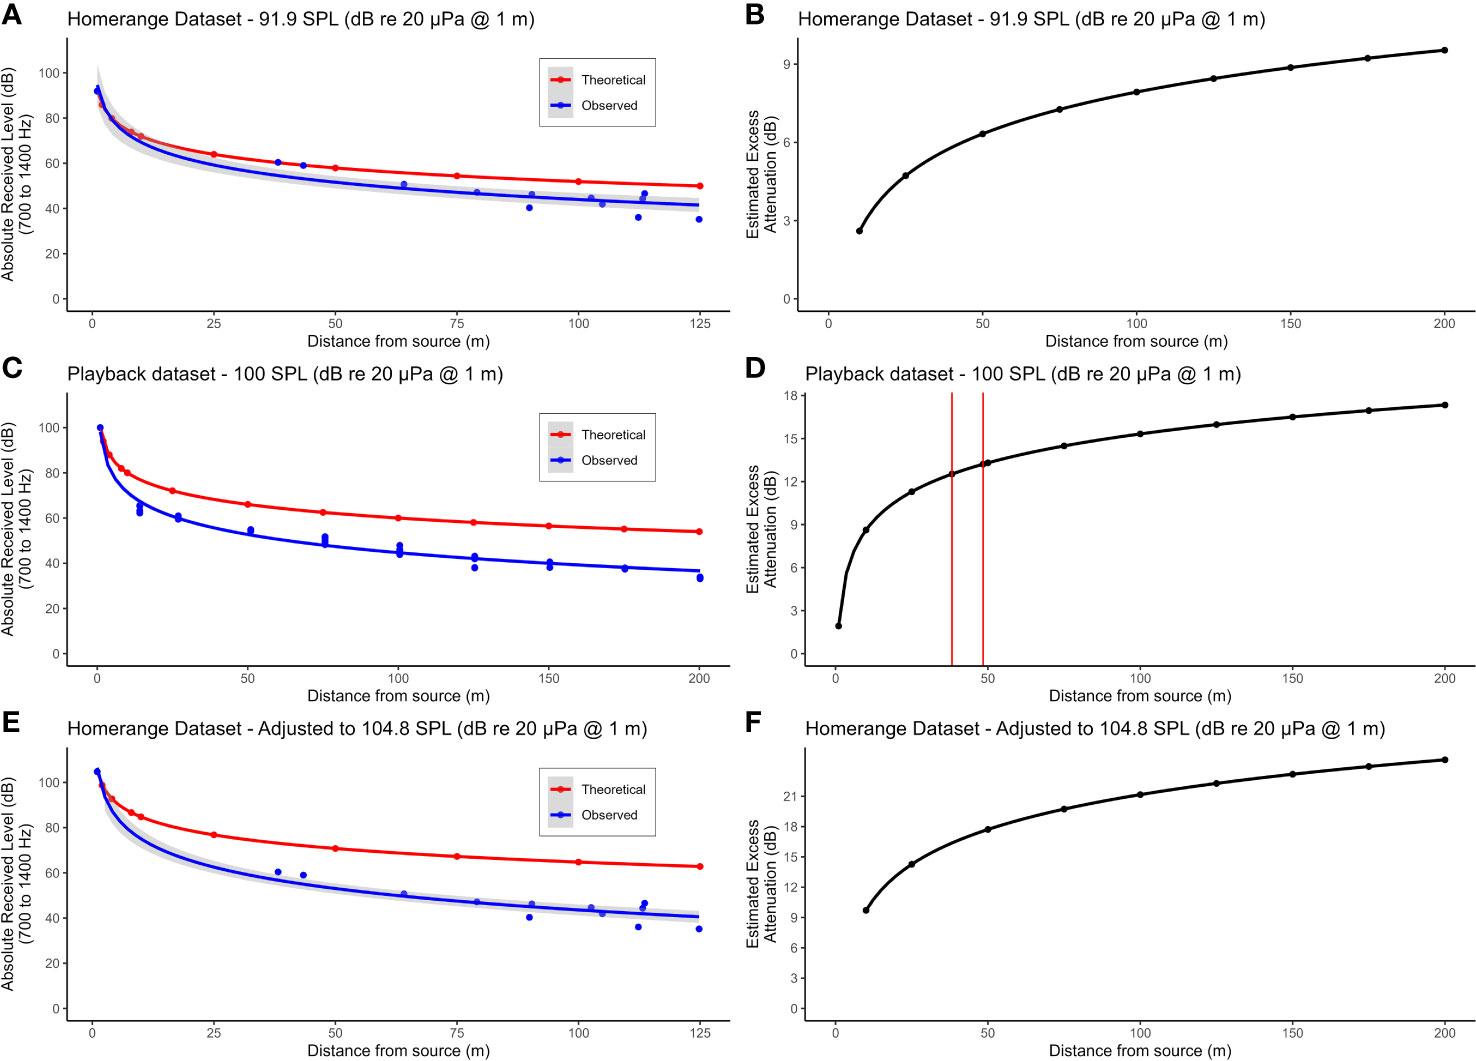
Figure 4 (A) uses the average source level of the two duets recorded closest to the ARU to calculate the theoretical decay in SPL over distance assuming spherical spreading only (red dots). The blue dots show the observed SPL of the recorded duets. Both sets of data points are fitted to a line of best fit of exponential decay (red and blue lines). (B) shows the estimated effect of excess attenuation on the titi duets by calculating the difference in SPL of the theoretical and observed values at 25 m intervals between 0 and 200 m. (C, D) show the decay in SPL and estimated effect of excess attenuation, respectively, for our standardized playback experiments. The vertical red lines in (D) reflect the distances of the two duets recorded closest to the ARU (38.2 and 48.4 m). The excess attenuation values for those two duets were then used to adjust our home range dataset values for excess attenuation, reflected in (E, F). For the home range and playback datasets, ARUs were positioned 12 m above ground.
3.2 What is the detection radius of titi duets using our ARU setup?
In the home range dataset for group L, the furthest duet from the ARU location, at 125 m, was easily visually detected in the spectrogram, suggesting that SM2 recorders have a minimum detection radius of 125 m. Our playback experiment allows us to expand on these findings. We focused our analysis on the playbacks conducted at 100 dB re 20 μPa at 1 m because this most closely matches our average estimated source level for titi monkey duets. The visibility of duets in spectrograms was comparable to duets with a quality score of 1 through 3 in our transect dataset. Duets were clearly detectable by visual inspection of the spectrograms, showing little loss of harmonic structure for the closest duets and some loss of the highest harmonics for more distant duets. That is, we never had to listen to audio files to confirm the presence of a duet, even at our furthest tested distance of 200 m. These results suggest we can increase our estimated detection radius from 125 to at least 200 m.
3.3 What is the detection probability of a duet within the detection radius?
For our home range dataset, all the 12 duets recorded during behavioral follows were also captured on the ARU audio files (one additional duet recorded during behavioral follows took place during a time when the Song Meter malfunctioned). Based on this limited sample, titi monkey duets have a detection probability of 100% when given within a 125-meter radius around the Song Meter ARU.
In manual review of audio files generated in our playback experiments, naïve observers annotated all playback duets at all distances up to our maximum distance of 200 m. Again, this result suggests that playback recordings conducted at 100 dB have a detection probability of 100% up to at least 200 m.
3.4 How does distance influence detection of titi monkey duets?
For our transect dataset, duets were never detected on all five recorders simultaneously. Five duets (15.2%) were only heard on one recorder; 18 duets (54.5%) were heard on at least one recorder 200 m away from the ARU where the call was recorded with the highest SNR; 10 duets (30.3%) were heard on at least one ARU 400 m away; and no duets were heard on ARUs 600 or 800 m away from the one where the highest SNR was found. The highest SNR values seen in any set of five simultaneous recordings (i.e., at the recorder that the monkeys were presumed to be closest to) ranged from 1.2 to 32.5 dB. In Figure 5A, we plot the relationship between SNR and distance from the recorder with the highest SNR value, splitting these data into three different sets of boxplots based on the listeners’ assignment of a quality score to the recording on the ARU with the highest SNR. Though we cannot relate SNR to precise distances between the recorder and primates, our data nonetheless clearly show how SNR decreases with distance. Notably, for all quality-score categories assigned to the call on the recorder where the SNR was highest, the SNR of that same call on the next closest recorder (200 m away) is dramatically lower, and calls were virtually never detected 400 m away.
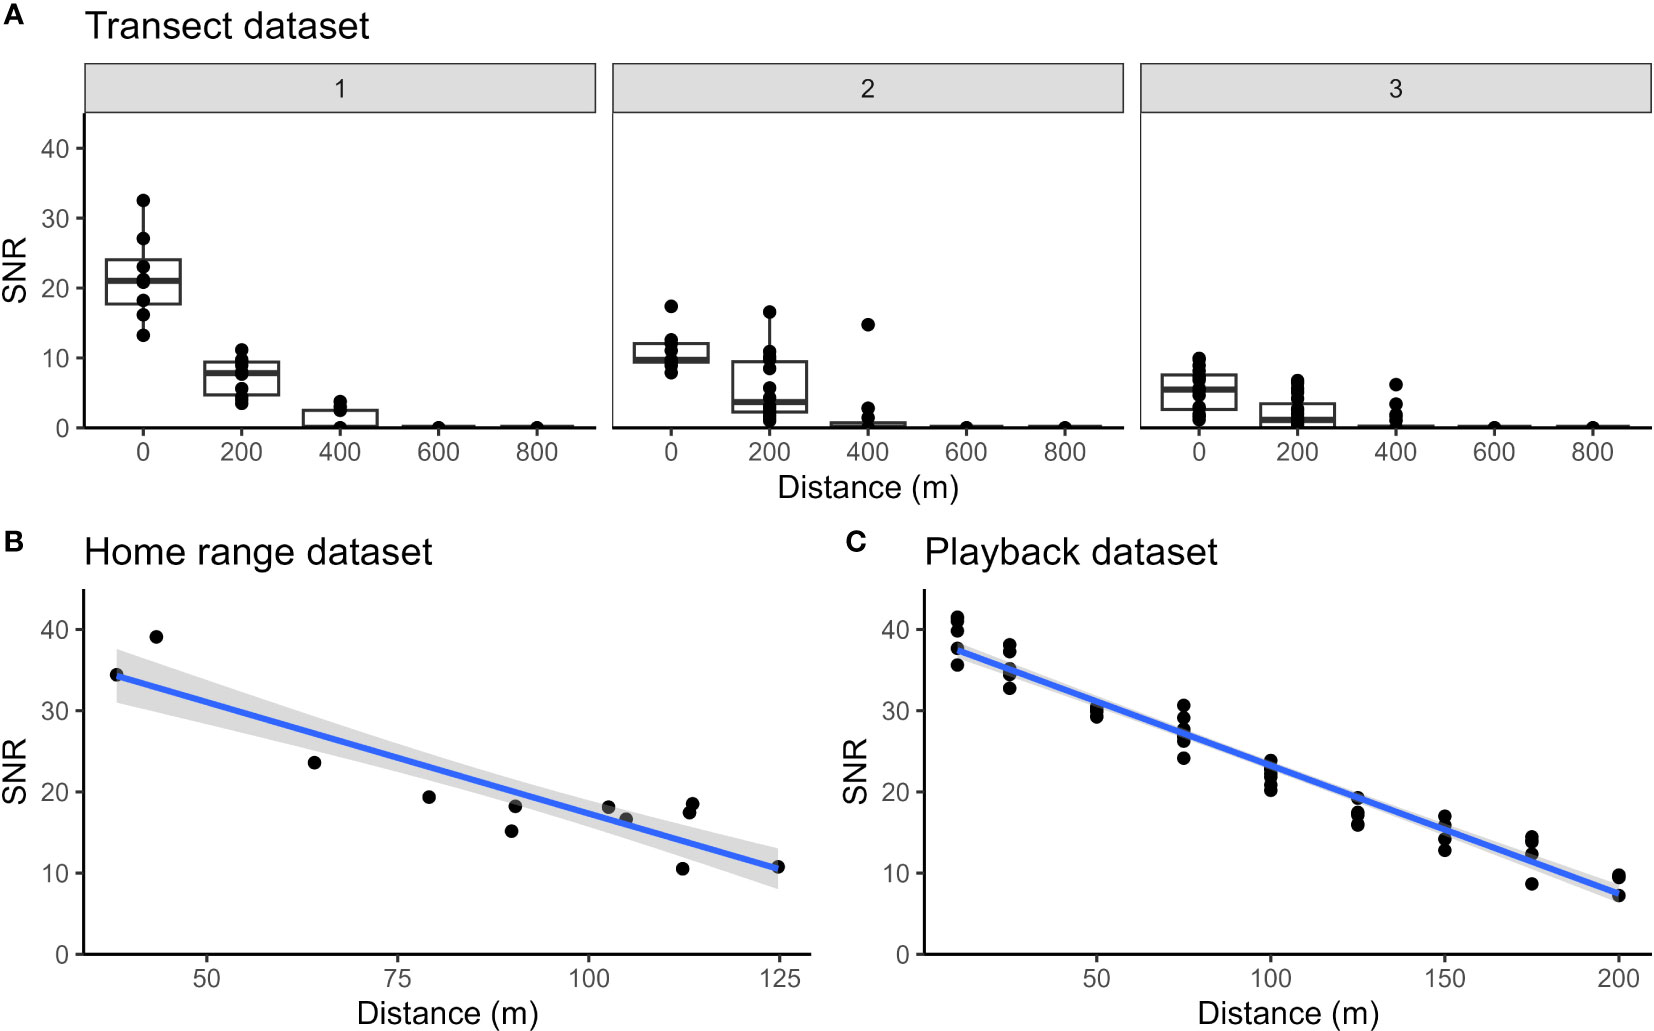
Figure 5 Changes in SNR with distance from the ARU, plotted for (A) transect dataset, (B) home range dataset, and (C) playback dataset. For the transect dataset, the data points represent each detected duet on each recorder. Data from the recorder with the highest SNR for each duet is plotted as distance 0, and points for distances at 200 m, 400 m, etc. represent the same duets detected on increasingly distant recorders. The first panel of boxplots contains duets with a maximum quality score of 1 or 2 at distance 0, the second panel contains duets with a maximum distance score or 3, and the third panel contains boxplots with a maximum quality score of 4. The boxplot’s upper and lower boundary represent the first and third quartiles of the SNR and the bold line within the box represents the median SNR of the data points for that recorder. For the home range and playback datasets, the data points represent each duet we found in the audio data. The gray area around the blue regression line demonstrates the 95% confidence interval. For the transect dataset, ARUs were positioned 1.5 to 2 m above ground whereas for the home range and playback datasets the ARUs were located 12 m above ground. Lower SNR values measured at close distance from the source in (A), panel 1 may be explained by the height of the ARUs which were positioned closer to the ground as compared with (B, C).
The home range dataset (Figure 5B) also documents a similarly rapid decline in SNR with distance. The closest two calls at 38 and 43 m from the ARU have a SNR of 34.4 and 39 dB, respectively. The furthest duet was recorded at 125 m and has a SNR of 10.8 dB. The playback dataset (Figure 5C) shows a similar trend, though the SNR does not decrease as rapidly as in our home range dataset.
3.5 How well do automated detection algorithms perform?
Our observers manually annotated 93 titi monkey loud calls in the transect dataset and classified 83 as duets, nine as burst gobbles, and one solo call. Because duets, solo calls, and burst gobbles likely have different functions (Robinson, 1979; Caselli et al., 2015) and possibly different detection radii, we only use duets in this study. Of the 83 duets we manually annotated in the transect dataset, two were used in training the algorithm, leaving 81 duets in the test dataset for the algorithm to detect. Of these duets, zero were assigned a qualitative quality score of 1, three were scored as quality 2, 14 were scored as quality 3, and 64 were scored as quality 4. Both howler monkey roars and titi duets that occasionally overlapped with each other were found in 19 audio files. Of the 1016 files that did not contain titi duets, 231 contained howler monkey roars.
We set the similarity cut-off score at 4.0 as the detection threshold for a titi monkey duet. Using this threshold, we ran four different detection pipelines using different combinations of the test dataset and binary matching templates. Pipeline 1 utilized the full test dataset (N = 81 duets) with titi duet templates and registered a “positive” detection when the mean titi template score was greater than 4.0. Duets categorized as quality 4 ranged in SNR from 0.1 to 11.2 dB with a mean and SD of 3.8 ± 2.9 dB. Quality 2 and 3 duets ranged in SNR from 5.9 to 27.1 dB with a mean of 12.9 ± 5.6 dB. Of all the true-positive detections, the SNR ranged from 8.5 to 27.1 dB with a mean of 13.2 ± 5.4 dB. The duets that were not detected ranged in SNR from 0.1 to 9.9 dB with a mean of 3.7 ± 2.7 dB. Duets with a SNR > 10 dB were detected correctly 100% (10 out of 10) of the time, whereas only 12.6% of duets with a SNR < 10 dB were detected (9 out of 71). For Pipeline 2, we used a modified dataset that excluded the 64 quality score 4 duets (Figure 3D) as manual detections. This improved the balanced accuracy, recall and F1-score of the algorithm (Table S3, Supplementary Material). In Pipeline 3, we used the full test dataset of 81 duets and additionally included the howler monkey templates in the detection rule such that a positive detection was recorded when the mean titi template score was greater than 4.0 and the mean titi template score exceeded mean howler template score. Pipeline 3 had a much higher precision rate than the first two pipelines, but slightly reduced accuracy and recall. Pipeline 4 used the modified test dataset that excluded quality 4 calls as well as the howler monkey templates. Here, the algorithm detected 12 of 17 duets (70.6%) and recorded 5 false negatives (Table S3, Supplementary Material). The algorithm also successfully distinguished other titi loud calls from duets; the one solo call and nine burst gobbles in our testing data were now correctly identified as negative duet detections. The false positives remained identical to Pipeline 3. Pipeline 4 had a precision of 0.75, a recall of 0.71, and an F1-score of 0.72. More detailed descriptions of the results of all four Pipelines, including confusion matrix results, are available in the Supplementary Material.
4 Discussion
4.1 Study limitations
In this study, we show that PAM in combination with automated detection of duets can be a useful method of data collection for duetting primates provided that appropriate attention is paid to understanding particulars of the system under investigation, e.g., about source level and attenuation with distance and about how other animals’ vocalizations might interfere with successful detection. We determined that the source level of titi duets is ~105 dB re 20 μPa at 1m with an attenuation rate of 8 dB per doubling of distance. The detection radius for manual annotation of duets in audio recordings using our ARU setup is at least 200m but is much lower for the automated detection algorithm. This result is explained by the poor detectability of duets with a low SNR. Algorithm recall for duets with an SNR > 10 dB was 100%, corresponding to a detection radius of ~125m. The SNR of most duets drops below 10 dB for distances beyond 125 m and leads to poor recall. These results highlight important considerations to be made in PAM research design when choosing to analyze data using manual annotation versus automated detection of calls of interest.
Our study has three main limitations, however. First, we used ARUs, Wildlife Acoustics’ Song Meter SM2 and SM2+, which are no longer commercially available. Though this is a problem that is likely to occur with many recorders over time as technological advancements are made, it does make replicability of studies and generalization of results more difficult due to differences in recorder and microphone specifications. Second, some of our datasets are rather small. For example, our observational data on home range use and vocal activity consists of data from only one focal pair of titi monkeys. We detected 13 duets on nine of 34 observation days, which puts the singing rate of this group at once every 3 to 4 days. The small dataset in combination with the infrequent nature of duets in this species means that our results cannot be extrapolated with confidence to other populations or groups of Plecturocebus discolor, because it does not consider intergroup variation or potential changes in singing rate throughout the year (Dolotovskaya and Heymann, 2022). On the other hand, our transect dataset were collected across a much larger geographic area (roughly 2 km2), and with titi home range size estimates from the TBS region ranging from 4.1 ha or 0.041 km2 (Van Belle et al., 2021) to 6.1 ha or 0.061km2 (Dacier et al., 2011), this area should contain an estimated 33 to 49 titi monkey pairs. Undoubtedly, a similar study with an extended temporal or spatial scale could lead to more robust results, especially considering the infrequent nature of duet calls in this region. Third, the trails along which we conducted our playback experiments were not long enough to document when the detection probability of duets decreased as calls were always detectable even at the largest playback distance of 200 m. Therefore, the full extent to which distance affects the detectability of duets in recordings relying either on manual annotation or automated detection remains an empirical question, though our results suggest a minimum detection radius of 125 to 200 m.
4.2 Passive acoustic monitoring
Using 12 naturally occurring duets recorded within the home range that were picked up by two ARUs, we estimated that the source level of the titi duets is ~92 dB re 20 μPa at 1 m when assuming only spherical spreading and ~105 dB re 20 μPa at 1 m when we correct for excess attenuation. The source level of titi monkey duets is similar to the estimated source levels of other primate loud calls such as howler monkey roars and gibbon great calls (Sekulic, 1983; Whitehead, 1995; Terleph et al., 2016). However, detailed comparisons are complicated by inconsistencies in the reporting of excess attenuation levels (Table S1, Supplementary Material). For example, sound pressure levels for howler monkeys have been reported as 90 dB at 5 m (Whitehead, 1995) and 70 dB at 50 m (Sekulic, 1983). Using the inverse square law, both estimates would result in a source level of 104 dB at 1 m, but this does not account for excess attenuation. This means that when the attenuation rate (the combination of both spherical spreading and excess attenuation) of a call of interest in a specific environment is unknown, source levels are likely to be underestimated. This can lead to incorrect assumptions on a call’s detection radius and detection probability. However, it bears noting that excess attenuation does not always lead to an increased decay in SPL. In some cases, reflection of sound waves can cause constructive interference, leading to less attenuation than predicted even through spherical spreading alone (Hedwig et al., 2018). Here, the attenuation rate of duets was estimated to be 8 dB per doubling of distance in a primary tropical rainforest: 6 dB due to spherical spreading plus an additional 2 dB of excess attenuation per doubling of distance. These results are supported by similar findings for comparable habitats. Ellinger and Hödl (2003) estimated excess attenuation to be 10 dB at 50 m in lowland rainforest in Venezuela and Waser and Brown (1986) estimated excess attenuation at evergreen rainforests in Kenya and Uganda to be ~7 dB at 50 m, both slightly lower than our estimate of 13 dB at 50 m (Figure 4). Excess attenuation levels vary depending on variables such as call frequency, height above the ground, and time of day (Waser and Brown, 1986; Ellinger and Hödl, 2003; Sugiura et al., 2006).
The duet furthest from the ARU in our home range dataset was 125 m away. This limits any conclusions for an estimated detection radius and probability to this distance. When analyzed manually by observers, all duets were easily visible in spectrograms and no duets were missed, placing the detection radius at 125 m with a detection probability of 1. In our playback dataset, duets were also consistently detected by human observers at all tested distances up to the maximum of 200 m with a detection probability of 1, suggesting the actual detection radius for the Song Meter SM2 ARUs when relying on manual annotation by human observers is greater than 200 m. We did not conduct our playbacks at distances beyond 200 m because of strong changes in the slope of the terrain that we suspected would have significantly altered the habitat acoustics such that data beyond 200 m would have been unreliable. However, a recent study shows that slope does not affect the ability of ARUs to detect signals of interest (Shaw et al., 2022). Instead, the orientation of microphones and vocalizing primates plays a more important role in ARU detection radius (Shaw et al., 2022). Indeed, our playback dataset may slightly overestimate the detection radius because we always oriented the speaker directly towards the ARU when conducting playbacks, while this would not necessarily be the case for naturally occurring duets, thereby influencing the likelihood of an ARU picking up the calls. This becomes apparent when we compare confidence intervals around the regression lines in Figures 5B, C; the range of variation in SNR of naturally occurring titi duets in the home range dataset leads to a larger confidence interval around the relationship between SNR and distance, whereas playback dataset show less variation in SNR data due to the consistent orientation of the speaker, leading to a much narrower confidence interval around the inferred relationship. Combining our different datasets and taking into account their limitations, the detection radius within which the detection probability is close to 1 when audio data are verified by human observers is ~200 m.
4.3 Automated detection
Overall, our automated detection protocol frequently missed duets with a SNR below 10 dB, but performed relatively well at identifying calls with a higher SNR, which is perhaps not surprising. Difficulties with detecting low SNR signals is a common limitation of automated detection (Spillmann et al., 2017), particularly in complex environments like rainforests. This outcome is to be expected as the power variations that the algorithm looks for may be barely distinguishable from ambient noise. To increase the odds that a call has a SNR sufficiently high to be detected, several approaches could be taken. When using an array of recorders, narrowing the distance between recorders increases the odds that a singing group of primates is closer to a recorder. However, this can significantly increase the cost of a project as well as amount of data collected that needs to be analyzed, and it can be logistically challenging to manage large numbers of recorders. Instead (though not explored in this paper) noise reduction techniques such as noise spectral subtraction method (Bayestehtashk et al., 2014) or adaptive level equalization (Towsey, 2013) might increase the SNR of calls. Though noise reduction techniques can enhance the signal of interest, they can also result in a loss of detail in the signal (Towsey et al., 2014).
In our initial run of the binary point matching algorithm on 1099 test data files, we identified 29 false positives, yielding low precision and recall values. High rates of false positives are common when the focus of the detection algorithm is on minimizing false negatives, in noisy environments, and when aiming to detect complex vocalizations (Marques et al., 2009; Swiston and Mennill, 2009; Heinicke et al., 2015; Bobay et al., 2018). The number of false positives seen in any given dataset is also determined by the relative abundance of the species contributing to false positive detections, which can change across seasons. The rate of false positives can partially be mitigated by adjusting the detection threshold, but this comes at the cost of increasing the number of false negatives. In our dataset, most false positives seen in initial runs of our algorithm were caused by howler monkey roars. Howler roars and titi duets overlap significantly in frequency range, and the complexity of the duets and noisiness of the howler roars makes it difficult for the detection algorithm to differentiate between the two. However, we were able to mitigate this problem by creating an additional set of howler monkey templates that we applied to each file and then using a detection rule that considers the similarity score of both titi and howler templates when deciding whether or not a titi duet is detected. This change in the detection rule successfully allowed us to remove as positive detections all howler monkey roars, but also resulted in the loss of a few titi detections. This typically happened when both species vocalized within the same 10-minute audio file. Whether this is problematic or not heavily depends on the study design and research question. Our human observers misclassified five burst gobbles as duets, demonstrating that false positives are not unique to automated detection algorithms. However, the rate of false positives is generally much lower for manual annotation than automated detection (Swiston and Mennill, 2009). Depending on the nature of the study, if the rate of false positives is less of a concern than the rate of false negatives, the choice could be made to manually validate all detections of an algorithm (Knight et al., 2020). In monitoR this can be done with the function ‘showPeaks’.
By creating templates for non-titi vocalizations that were found, in initial runs, to cause large numbers of false-positive detections and then including scores on those “off-target” templates as part of a more complex detection rule, we greatly decreased the number of false positives and thereby increased the precision rates of the algorithm. In addition, recall (the true positive rate) was largely influenced by the quality of the calls in the data. Large numbers of distant calls with a low SNR are difficult to detect by algorithms as they do not stand out as clearly against background noise. When the expectation is that these calls should be detected by the algorithm, the outcomes are rather poor (e.g., algorithm iterations 1 and 3). However, when we focus only on calls within a smaller detection radius around the recorder (algorithm iterations 2 and 4), the algorithm performs considerably better. This result suggests that automated detection algorithms can and should be tailored to each specific species and research question. Among others, differences in call structures, habitat structure, number of other vocally active animals in the habitat, algorithm type, and study goals determine the required specifications of the algorithm, and thus its outcomes.
The need for detection algorithm parameters and decision rules to be tailored to specific sites and call types also creates challenges for comparing results between studies. The fourth iteration of our algorithm had a precision of 0.67. When we compare this to other studies that have used various automated detection procedures to locate primate vocalizations within audio files, we find that our precision score is lower than found in studies of Guianan red howler monkeys (Alouatta macconnelli), black-fronted titi monkeys (Callicebus nigrifrons), Hainan gibbons (Nomascus hainanus), and northern grey gibbons (Hylobates funereus) (Versteegh et al., 2016; Do Nascimento et al., 2021; Clink et al., 2023; Ravaglia et al., 2023), but higher than found for several African primates (Heinicke et al., 2015). Our recall of 0.71 is similar to that found for northern grey gibbons (Clink et al., 2023), higher than that of Guianan red howler monkeys and African primates (Heinicke et al., 2015; Do Nascimento et al., 2021), and lower than recall values for black-fronted titi monkeys, Hainan gibbons, and indris (Versteegh et al., 2016; Dufourq et al., 2021; Ravaglia et al., 2023), though some of these more recent studies with high recall used a deep learning approach. However, it is difficult to compare the performance of the algorithms using these metrics as some differences cannot easily be quantified (e.g., vocalization and habitat structure, the number of vocally active animals in an environment that can trigger false positives). In addition, other important details are often unknown. For example, if the calls in the test dataset are predominantly calls with a high SNR, algorithm performance will be high, but when calls with lower SNRs are also included, performance of the algorithm may drop significantly. Clearly, understanding the quality of the calls in the test dataset is important, as it allows us to modify the design of future studies.
4.4 Recommendations for studying duetting with PAM
In this study, we demonstrate that passive acoustic monitoring together with an automated detection algorithm can be an effective method to study duetting behavior in titi monkeys and potentially other duetting animals. However, due to the complex temporal and spectral structures of duets, a series of steps need to be taken to ensure a study design that fits the desired outcome. Here, we describe such a workflow.
First, as recorder specifications and both structure and source level of duets greatly affect the detection radius, empirical determination of the detection radius and detection probability for the combination of the chosen recorder type and vocalizations of interest is a critical first step. Because habitat characteristics also play a role in the detection radius of duets, detection radius should be determined for each site at which the methodology is implemented. In this study, we used two ways of determining the detection radius of an ARU model for a vocalization of interest. If the source level of the primate’s loud call is known or can be determined, playback studies can be used to determine the detection radius and detection probabilities. If the source level cannot be determined, using one or multiple ARUs in primate home ranges can be used in combination with location data on loud calls from behavioral follows of habituated groups. However, this alternative is less time efficient than playback experiments.
Second, a trade-off must be made between choosing whether to manually annotate the collected audio data with the use of spectrograms, or to use an automated detection algorithm to locate the duets in the audio data. This will also influence evaluation of the detection radius of the recorder, as we demonstrated that duets can typically be annotated at larger distances by human observers than by the detection algorithm. When ARUs are used on a small scale, manual annotation of duets is feasible. The potential for significant numbers of false positive and false negative detections means that automated detection algorithms come with their own set of errors and biases, but with the benefit that these biases are measurable and more consistent than observer errors and biases.
Third, if the amount of audio data collected for the purposes of the study is too large to allow manual annotation within a reasonable time frame, a mix of both techniques can be used if high accuracy is desired. If a detection algorithm is designed to reduce the number of false negatives, the resulting large number of positive detections – which will be a combination of true positives and false positives – can still be manually verified and corrected. It should be kept in mind that when the animal of interest duets only infrequently, the number of false positives will likely increase at a much higher rate than the number true positives. However, although a high false positive rate means that more putative detections need to be verified, it does not negatively affect the performance of the algorithm on detecting true positives. When the animals under study vocalize infrequently, a deep learning approach might yield benefits over template matching as it allows for data augmentation (i.e., artificially increasing the training data by creating modified duets from existing ones) when training the algorithm (for example studies, see Table S2, Supplementary Material). Deep learning commonly requires more expert knowledge to implement, though alternatives geared towards increasing accessibility for less experienced scientists are in development (Arthur et al., 2021).
Data availability statement
The raw data supporting the conclusions of this article will be made available by the authors, without undue reservation. Annotated code used in the manuscript is available on https://github.com/SoundScience/Automated-detection-and-detection-range-of-titi-monkey-duets.
Ethics statement
Approval for JB’s research was obtained from the Institutional Animal Care and Use Committee (IACUC), University of Florida Non-Regulatory Animal Research Committee (#201710065). Approval for research by SvK and AD was obtained from the IACUC, The University of Texas at Austin Animal Research Committee (AUP-2017-00260). Work at the Tiputini Biodiversity Station was conducted in accordance with research permit number 025-2019-IC-PNY-DPAO and earlier ones (JB) and MAE-DNB-CM-2015-0009-M-0001 (AD), Ministerio del Ambiente, Puerto Francisco de Orellana.
Author contributions
SvK designed the research with guidance from AD. JB and SvK collected data, SO and SvK created templates and tested the algorithms. SvK and SO conducted the analyses with guidance and statistical programming support from AD and DC. SvK and AD led the writing of the manuscript, and all authors contributed to the article and approved the submitted version.
Funding
This research was supported by the University of Florida and The University of Texas at Austin.
Acknowledgments
We extend our sincere gratitude to Patrice Adret for his insightful feedback and conversations. His continued support and encouragement were pivotal in the development of this paper. We would like to thank Ministerio del Ambiente de Ecuador (MAE), the Universidad San Francisco de Quito, and the Tiputini Biodiversity Station and its staff, especially Consuelo Barriga de Romo and Tomi Sugahara, for their assistance with planning, logistics and permits. We thank Anna Kurtin and Kaleb Judd for helping with manual annotation of the duets for the playback and transect datasets. We are also grateful to Shawn McCracken for providing the Song Meter SM2 recorders for the summer of 2016. Finally, we would also like to thank editor Ulrich H. Reichard and two reviewers for their valuable feedback that helped improve this manuscript.
Conflict of interest
The authors declare that the research was conducted in the absence of any commercial or financial relationships that could be construed as a potential conflict of interest.
Publisher’s note
All claims expressed in this article are solely those of the authors and do not necessarily represent those of their affiliated organizations, or those of the publisher, the editors and the reviewers. Any product that may be evaluated in this article, or claim that may be made by its manufacturer, is not guaranteed or endorsed by the publisher.
Supplementary material
The Supplementary Material for this article can be found online at: https://www.frontiersin.org/articles/10.3389/fevo.2023.1173722/full#supplementary-material
References
Adret P., Dingess K. A., Caselli C. B., Vermeer J., Martínez J., Luna Amancio J. C., et al. (2018). Duetting patterns of titi monkeys (Primates, Pitheciidae: Callicebinae) and relationships with phylogeny. Animals 8, 178. doi: 10.3390/ani8100178
Aldrich B. C. (2006). A song-based survey of the Andean titi monkey (Callicebus oenanthe) at Tarangue, with notes on its vocalisations (Oxford: Oxford Brookes University). MSc thesis.
Arthur B. J., Ding Y., Sosale M., Khalif F., Kim E., Waddell P., et al. (2021). SongExplorer: A deep learning workflow for discovery and segmentation of animal acoustic communication signals. bioRxiv. doi: 10.1101/2021.03.26.437280
Barclay R. M. (1999). Bats are not birds—a cautionary note on using echolocation calls to identify bats: a comment. J. Mammal. 80, 290–296. doi: 10.2307/1383229
Bayestehtashk A., Shafran I., Coleman K., Robertson N. (2014). “Detecting vocalizations of individual monkeys in social groups,” in 2014 36th Annual International Conference of the IEEE Engineering in Medicine and Biology Society, Chicago, IL. 4775–4779 (IEEE).
Blake J. G. (1992). Temporal variation in point counts of birds in a lowland wet forest in Costa Rica. Condor 94, 265.275. doi: 10.2307/1368816
Blake J. G. (2021). Acoustic monitors and direct observations provide similar but distinct perspectives on bird assemblages in a lowland forest of eastern Ecuador. PeerJ 9, e10565. doi: 10.7717/peerj.10565
Bobay L. R., Taillie P. J., Moorman C. E. (2018). Use of autonomous recording units increased detection of a secretive marsh bird. J. Field Ornithol. 89, 384–392. doi: 10.1111/jofo.12274
Bradbury J. W., Vehrencamp S. L. (1998). Principles of animal communication (Sunderland, MA: Sinauer Associates Inc).
Brown C. H., Waser P. M. (2017). “Primate habitat acoustics,” in Primate hearing and communication. Eds. Quam R. M., Ramsier M. A., Fay R. R., Popper A. N. (Cham, Switzerland: Springer International Publishing), 79–107. doi: 10.1007/978-3-319-59478-1_4
Caselli C. B., Mennill D. J., Bicca-Marques J. C., Setz E. Z. (2014). Vocal behavior of black-fronted titi monkeys (Callicebus nigrifrons): Acoustic properties and behavioral contexts of loud calls. Am. J. Primatol. 76, 788–800. doi: 10.1002/ajp.22270
Caselli C. B., Mennill D. J., Gestich C. C., Setz E. Z., Bicca-Marques J. C. (2015). Playback responses of socially monogamous black-fronted titi monkeys to simulated solitary and paired intruders. Am. J. Primatol. 77, 1135–1142. doi: 10.1002/ajp.22447
Clink D. J., Ahmad A. H., Klinck H. (2020). Brevity is not a universal in animal communication: evidence for compression depends on the unit of analysis in small ape vocalizations. R. Soc. Open Sci. 7, 200151. doi: 10.1098/rsos.200151
Clink D. J., Comella I., Ahmad A. H., Klinck H. (2023). A workflow for the automated detection and classification of female gibbon calls from long-term acoustic recordings. Front. Ecol. Evol. 11. doi: 10.3389/fevo.2023.1071640
Dacier A., de Luna A. G., Fernandez-Duque E., Di Fiore A. (2011). Estimating population density of Amazonian titi monkeys (Callicebus discolor) via playback point counts. Biotropica 43, 135–140. doi: 10.1111/j.1744-7429.2010.00749.x
Darras K. F., Deppe F., Fabian Y., Kartono A. P., Angulo A., Kolbrek B., et al. (2020). High microphone signal-to-noise ratio enhances acoustic sampling of wildlife. PeerJ 8, e9955. doi: 10.7717/peerj.9955
Darras K., Pütz P., Rembold K., Tscharntke T. (2016). Measuring sound detection spaces for acoustic animal sampling and monitoring. Biol. Conserv. 201, 29–37. doi: 10.1016/j.biocon.2016.06.021
Deichmann J. L., Acevedo-Charry O., Barclay L., Burivalova Z., Campos-Cerqueira M., d’Horta F., et al. (2018). It’s time to listen: there is much to be learned from the sounds of tropical ecosystems. Biotropica 50, 713–718. doi: 10.1111/btp.12593
De Luna A. G., Sanmiguel R., Di Fiore A., Fernandez-Duque E. (2010). Predation and predation attempts on red titi monkeys (Callicebus discolor) and equatorial sakis (Pithecia aequatorialis) in Amazonian Ecuador. Folia Primatol. 81, 86–95. doi: 10.1159/000314948
Digby A., Towsey M., Bell B. D., Teal P. D. (2013). A practical comparison of manual and autonomous methods for acoustic monitoring. Methods Ecol. Evol. 4, 675–683. doi: 10.1111/2041-210X.12060
Dolotovskaya S., Heymann E. W. (2022). Coordinated singing in coppery titi monkeys (Plecturocebus cupreus): Resource or Mate Defense? Front. Ecol. Evol. 457. doi: 10.3389/fevo.2022.898509
Do Nascimento L. A., Pérez-Granados C., Beard K. H. (2021). Passive acoustic monitoring and automatic detection of diel patterns and acoustic structure of howler monkey roars. Diversity 13, 566. doi: 10.3390/d13110566
Dufourq E., Durbach I., Hansford J. P., Hoepfner A., Ma H., Bryant J. V., et al. (2021). Automated detection of Hainan gibbon calls for passive acoustic monitoring. Remote Sens. Ecol. Conserv. 7, 475–487. doi: 10.1002/rse2.201
Eddy S. R. (2004). What is a hidden Markov model? Nat. Biotechnol. 22, 1315–1316. doi: 10.1038/nbt1004-1315
Ellinger N., Hödl W. (2003). Habitat acoustics of a neotropical lowland rainforest. Bioacoustics 13, 297–321. doi: 10.1080/09524622.2003.9753503
Fan P. F., Xiao W. E. N., Huo S., Jiang X. L. (2009). Singing behavior and singing functions of black-crested gibbons (Nomascus concolor jingdongensis) at Mt. Wuliang, Central Yunnan, China. Am. J. Primatol. 71, 539–547. doi: 10.1002/ajp.20686
Flach P. (2019). “Performance evaluation in machine learning: the good, the bad, the ugly, and the way forward,” in Proceedings of the AAAI conference on artificial intelligence, Honolulu, Hawaii. 9808–9814.
Geissmann T. (1999). Duet songs of the siamang, Hylobates syndactylus: II. Testing the pair-bonding hypothesis during a partner exchange. Behaviour 136, 1005–1039. doi: 10.1163/156853999501694
Geissmann T. (2002). Duet-splitting and the evolution of gibbon songs. Biol. Rev. 77, 57–76. doi: 10.1017/s1464793101005826
Gibb R., Browning E., Glover-Kapfer P., Jones K. E. (2019). Emerging opportunities and challenges for passive acoustics in ecological assessment and monitoring. Methods Ecol. Evol. 10 (2), 169–185. doi: 10.1111/2041-210X.13101
Groves C., Shekelle M. (2010). The genera and species of Tarsiidae. Int. J. Primatol. 31, 1071–1082. doi: 10.1007/s10764-010-9443-1
Hall M. L. (2009). A review of vocal duetting in birds. Adv. Study Behav. 40, 67–121. doi: 10.1016/S0065-3454(09)40003-2
Hedwig D., DeBellis M., Wrege P. H. (2018). Not so far: attenuation of low-frequency vocalizations in a rainforest environment suggests limited acoustic mediation of social interaction in African forest elephants. Behav. Ecol. sociobiol. 72, 1–11. doi: 10.1007/s00265-018-2451-4
Heinicke S., Kalan A. K., Wagner O. J., Mundry R., Lukashevich H., Kühl H. S. (2015). Assessing the performance of a semi-automated acoustic monitoring system for primates. Methods Ecol. Evol. 6, 753–763. doi: 10.1111/2041-210X.12384
Janvier M., Horaud R., Girin L., Berthommier F., Boë L. J., Kemp C., et al. (2013). “Supervised classification of baboon vocalizations,” in Neural Information Processing Scaled for Bioacoustics: NIPS4B, Lake Tahoe: NV.
Katz J., Hafner S. D., Donovan T. (2016). Tools for automated acoustic monitoring within the R package monitoR. Bioacoustics 25, 197–210. doi: 10.1080/09524622.2016.1138415
Kinzey W. G., Becker M. (1983). Activity pattern of the masked titi monkey, Callicebus personatus. Primates 24, 337–343. doi: 10.1007/BF02381979
K. Lisa Yang Center for Conservation Bioacoustics. (2022). Signal-to-noise (SNR)–User protocol. Available at: https://ravensoundsoftware.com/knowledge-base/signal-to-noise-ratio-snr (Accessed May 23, 2023).
Knight E. C., Sòlymos P., Scott C., Bayne E. M. (2020). Validation prediction: a flexible protocol to increase efficiency of automated acoustic processing for wildlife research. Ecol. Appl. 30, e02140. doi: 10.1002/eap.2140
Koloff J., Mennill D. J. (2013). The responses of duetting antbirds to stereo duet playback provide support for the joint territory defence hypothesis. Ethology 119, 462–471. doi: 10.1111/eth.12084
Krogh A. (2008). What are artificial neural networks? Nat. Biotechnol. 26, 195–197. doi: 10.1038/nbt1386
Lawson J., Rizos G., Jasinghe D., Whitworth A., Schuller B., Banks-Leite C. (2023). Automated acoustic detection of Geoffroy’s spider monkey highlights tipping points of human disturbance. Proc. R. Soc. B 290, 20222473. doi: 10.1098/rspb.2022.2473
Marques T. A., Thomas L., Ward J., DiMarzio N., Tyack P. L. (2009). Estimating cetacean population density using fixed passive acoustic sensors: An example with Blainville’s beaked whales. J. Acoustical Soc. America 125, 1982–1994. doi: 10.1121/1.3089590
Méndez-Cárdenas M. G., Zimmermann E. (2009). Duetting—A mechanism to strengthen pair bonds in a dispersed pair-living primate (Lepilemur edwardsi)? Am. J. Phys. Anthropol. 139, 523–532. doi: 10.1002/ajpa.21017
Merchant N. D., Fristrup K. M., Johnson M. P., Tyack P. L., Witt M. J., Blondel P., et al. (2015). Measuring acoustic habitats. Methods Ecol. Evol. 6, 257–265. doi: 10.1111/2041-210X.12330
Mitani J. C., Stuht J. (1998). The evolution of nonhuman primate loud calls: acoustic adaptation for long-distance transmission. Primates 39, 171–182. doi: 10.1007/BF02557729
Müller A. E., Anzenberger G. (2002). Duetting in the titi monkey Callicebus cupreus: Structure, pair specificity and development of duets. Folia Primatol. 73, 104–115. doi: 10.1159/000064788
Nemeth E., Dabelsteen T., Pedersen S. B., Winkler H. (2006). Rainforests as concert halls for birds: are reverberations improving sound transmission of long song elements? J. Acoustical Soc. America 119, 620–626. doi: 10.1121/1.2139072
Noble W. S. (2006). What is a support vector machine? Nat. Biotechnol. 24, 1565–1567. doi: 10.1038/nbt1206-1565
Novaković J. D., Veljović A., Ilić S. S., Papić Ž., Tomović M. (2017). Evaluation of classification models in machine learning. Theory Appl. Math. Comput. Sci. 7, 39.
Padgham M. (2004). Reverberation and frequency attenuation in forests—implications for acoustic communication in animals. J. Acoustical Soc. America 115, 402–410. doi: 10.1121/1.1629304
Pérez-Granados C., Bota G., Giralt D., Albarracín J., Traba J. (2019). Cost-effectiveness assessment of five audio recording systems for wildlife monitoring: differences between recording distances and singing direction. Ardeola 66, 311–325. doi: 10.13157/arla.66.2.2019.ra4
Pinto L. P., Barnett A. A., Bezerra B. M., Boubli J. P., Bowler M., Cardoso N. D. A., et al. (2013). “Why we know so little: the challenges of fieldwork on the Pitheciids,” in Evolutionary biology and conservation of titis, sakis and uacaris. Eds. Vega L. M., Barnett A. A., Ferrari S. F., Norconk M. A. (Cambridge: Cambridge University Pres), 145–150. doi: 10.1017/CBO9781139034210.019
Pollock J. I. (1986). The song of the indris (Indri indri; Primates: Lemuroidea): Natural history, form, and function. Int. J. Primatol. 7, 225–264. doi: 10.1007/BF02736391
Porcaro L. (2015). ). Modeling Lemur vocalizations from a signal processing perspective (Torino: University of Torino). MSc thesis.
Pozzi L., Gamba M., Giacoma C. (2012). “Artificial neural networks: A new tool for studying lemur vocal communication,” in Leaping Ahead. Eds. Masters M., Gamba M., Génin F. (New York, NY: Springer), 305–313. doi: 10.1007/978-1-4614-4511-1_34
Ravaglia D., Ferrario V., De Gregorio C., Carugati F., Raimondi T., Cristiano W., et al. (2023). There you are! Automated detection of indris’ songs on features extracted from passive acoustic recordings. Animals 13, 241. doi: 10.3390/ani13020241
R Core Team (2022) R: A Language and Environment for Statistical Computing (Vienna, Austria: R Foundation for Statistical Computing). Available at: https://www.R-project.org (Accessed May 24, 2023).
Rempel R. S., Francis C. M., Robinson J. N., Campbell M. (2013). Comparison of audio recording system performance for detecting and monitoring songbirds. J. Field Ornithol. 84, 86–97. doi: 10.1111/jofo.12008
Robinson J. G. (1979). An analysis of the organization of vocal communication in the titi monkey Callicebus moloch. Z. für Tierpsychol. 49, 381–405. doi: 10.1111/j.1439-0310.1979.tb00300.x
Robinson J. G. (1981). Vocal regulation of inter-and intragroup spacing during boundary encounters in the titi monkey, Callicebus moloch. Primates 22, 161–172. doi: 10.1007/BF02382607
Sangchantr S. (2004). Social organization and ecology of Mentawai leaf monkeys (Presbytis potenziani) (PhD dissertation. New York: Columbia University).
Schroeder K. M., McRae S. B. (2020). Automated auditory detection of a rare, secretive marsh bird with infrequent and acoustically indistinct vocalizations. Ibis 162, 1033–1046. doi: 10.1111/ibi.12805
Sekulic R. (1983). The effect of female call on male howling in red howler monkeys (Alouatta seniculus). Int. J. Primatol. 4, 291–305. doi: 10.1007/BF02735551
Shaw T., Müller S., Scherer-Lorenzen M. (2022). Slope does not affect autonomous recorder detection shape: Considerations for acoustic monitoring in forested landscapes. Bioacoustics 31, 261–282. doi: 10.1080/09524622.2021.1925590
Slater P. J., Mann N. I. (2004). Why do the females of many bird species sing in the tropics? J. Avian Biol. 35, 289–294. doi: 10.1111/j.0908-8857.2004.03392.x
Souza-Alves J. P., Ferrari S. F. (2010). Responses of wild titi monkeys, Callicebus coimbrai (Primates: Platyrrhini: Pitheciidae), to the habituation process. Zool. (Curitiba) 27, 861–866. doi: 10.1590/S1984-46702010000600004
Spillmann B., van Schaik C. P., Setia T. M., Sadjadi S. O. (2017). Who shall I say is calling? Validation of a caller recognition procedure in Bornean flanged male orangutan (Pongo pygmaeus wurmbii) long calls. Bioacoustics 26, 109–120. doi: 10.1080/09524622.2016.1216802
Stowell D. (2022). Computational bioacoustics with deep learning: a review and roadmap. PeerJ 10, e13152. doi: 10.7717/peerj.13152
Sugai L. S. M., Silva T. S. F., Ribeiro J. W. Jr., Llusia D. (2019). Terrestrial passive acoustic monitoring: review and perspectives. BioScience 69, 15–25. doi: 10.1093/biosci/biy147
Sugiura H., Tanaka T., Masataka N. (2006). Sound transmission in the habitats of Japanese macaques and its possible effect on population differences in coo calls. Behaviour 143, 993–1012. doi: 10.1163/156853906778623617
Swiston K. A., Mennill D. J. (2009). Comparison of manual and automated methods for identifying target sounds in audio recordings of Pileated, Pale-billed, and putative Ivory-billed woodpeckers. J. Field Ornithol. 80, 42–50. doi: 10.1111/j.1557-9263.2009.00204.x
Szymański P., Olszowiak K., Wheeldon A., Budka M., Osiejuk T. S. (2021). Passive acoustic monitoring gives new insight into year-round duetting behaviour of a tropical songbird. Ecol. Indic. 122, 107271. doi: 10.1016/j.ecolind.2020.107271
Taunk K., De S., Verma S., Swetapadma A. (2019). “A brief review of nearest neighbor algorithm for learning and classification,” in International Conference on Intelligent Computing and Control Systems, Seconderabad, India. 1255–1260, ICCS.
Terleph T. A., Malaivijitnond S., Reichard U. H. (2016). Age related decline in female lar gibbon great call performance suggests that call features correlate with physical condition. BMC Evolution. Biol. 16, 1–13. doi: 10.1186/s12862-015-0578-8
Tilson R. L., Tenaza R. R. (1976). Monogamy and duetting in an Old World monkey. Nature 263, 320–321. doi: 10.1038/263320a0
Towsey M. W. (2013). Noise removal from wave-forms and spectrograms derived from natural recordings of the environment (Brisbane: Queensland University of Technology).
Towsey M., Zhang L., Cottman-Fields M., Wimmer J., Zhang J., Roe P. (2014). Visualization of long-duration acoustic recordings of the environment. Proc. Comput. Sci. 29, 703–712. doi: 10.1016/j.procs.2014.05.063
Van Belle S., Porter A., Fernandez-Duque E., Di Fiore A. (2018). Ranging behavior and potential for territoriality in equatorial sakis (Pithecia aequatorialis) in Amazonian Ecuador. Am. J. Phys. Anthropol. 167, 701–712. doi: 10.1002/ajpa.23645
Van Belle S., Porter A. M., Fernandez-Duque E., Di Fiore A. (2021). Ranging behavior and the potential for territoriality in pair-living titi monkeys (Plecturocebus discolor). Am. J. Primatol. 83, e23225. doi: 10.1002/ajp.23225
Van Kuijk S. (2013). Living on the edge: Critically endangered San Martin titi monkeys (Callicebus oenanthe) show preference for forest edges in C.C. Ojos de Agua, Peru. MSc thesis: Oxford Brookes University.
Vermeer J., Tello-Alvarado J. C. (2015). The distribution and taxonomy of titi monkeys (Callicebus) in central and southern Peru, with the description of a new species. Primate Conserv. 29, 1–21. doi: 10.1896/052.029.0102
Versteegh M., Kuhn J., Synnaeve G., Ravaux L., Chemla E., Cäsar C., et al. (2016). Classification and automatic transcription of primate calls. J. Acoustical Soc. America 140, EL26–EL30. doi: 10.1121/1.4954887
Waser P. M., Brown C. H. (1984). Is there a “sound window” for primate communication? Behav. Ecol. Sociobiol. 15, 73–76. doi: 10.1007/BF00310219
Waser P. M., Brown C. H. (1986). Habitat acoustics and primate communication. Am. J. Primatol. 10, 135–154. doi: 10.1002/ajp.1350100205
Waser P. M., Waser M. S. (1977). Experimental studies of primate vocalization: Specializations for long-distance propagation. Z. für Tierpsychol. 43, 239–263. doi: 10.1111/j.1439-0310.1977.tb00073.x
Whitehead J. M. (1995). Vox Alouattinae: a preliminary survey of the acoustic characteristics of long-distance calls of howling monkeys. Int. J. Primatol. 16, 121–144. doi: 10.1007/BF02700156
Keywords: automated detection, autonomous recorders, duetting, attenuation, passive acoustic monitoring, Plecturocebus, primate vocalizations
Citation: van Kuijk SM, O’Brien S, Clink DJ, Blake J G and Di Fiore A (2023) Automated detection and detection range of primate duets: a case study of the red titi monkey (Plecturocebus discolor) using passive acoustic monitoring. Front. Ecol. Evol. 11:1173722. doi: 10.3389/fevo.2023.1173722
Received: 25 February 2023; Accepted: 31 July 2023;
Published: 25 August 2023.
Edited by:
Ulrich H. Reichard, Southern Illinois University Carbondale, United StatesReviewed by:
Emmanuel Dufourq, Stellenbosch University, South AfricaCristian Pérez-Granados, University of Alicante, Spain
Copyright © 2023 van Kuijk, O’Brien, Clink, Blake and Di Fiore. This is an open-access article distributed under the terms of the Creative Commons Attribution License (CC BY). The use, distribution or reproduction in other forums is permitted, provided the original author(s) and the copyright owner(s) are credited and that the original publication in this journal is cited, in accordance with accepted academic practice. No use, distribution or reproduction is permitted which does not comply with these terms.
*Correspondence: Silvy M. van Kuijk, c2lsdnl2YW5rdWlqa0B1dGV4YXMuZWR1