 Caiguang Wang1
 Liang Zhu1
 Liangliang Huang1*Hao Xu2Peng Xu3Xiongbo He4
 Yunrong Yan4Xi Yang5
 Asfandyar Shahab1
 Bin Kang6
- 1College of Environmental Science and Engineering, Guilin University of Technology, Guilin, China
- 2Guangxi Collaborative Innovation Center for Water Pollution Control and Water Safety in Karst Areas, Guilin, China
- 3Guangxi Key Laboratory of Beibu Gulf Marine Biodiversity Conservation, Beibu Gulf University, Qinzhou, China
- 4College of Fisheries, Guangdong Ocean University, Zhanjiang, Guangdong, China
- 5Guangxi Key Laboratory of Environmental Pollution Control Theory and Technology for Science, Guilin, China
- 6College of Fisheries, Ocean University of China, Qingdao, Shandong, China
In this study we explore the inter- and intraspecific variations in the ecological stoichiometry of three dominant fish species [Saurida tumbil (n = 33), Pennahia macrocephalus (n = 34), and Upeneus sulphureus (n = 32)] from the Beibu Gulf, the contents of carbon (C), nitrogen (N), phosphorus (P), calcium (Ca), δ13C, and δ15N in fishes were analyzed. Results illustrated that the ranges of elemental variations (C, N, P, and Ca) in the three fishes were 36.73∼49.24%, 8.79∼13.99%, 1.11∼2.78%, and 1.16∼4.58%, respectively while P content varied the most, resulting in variations in C:P and N:P in fishes. Correlation analysis determined the association among various parameters and illustrated that Ca content was significantly positively correlated with P content, which indicated that P content variation was attributed to the formation of fish bones and scales. The C, N, and P contents and their ratios were significantly correlated with body length and δ13C in the three fishes, indicating that the changes in C:N:P concentrations are due to individual development and food sources. Significant inter- and intraspecific differences in the body stoichiometry of the three fishes were found in this study, mainly due to differences in body size and diet. The aquatic organisms underwent individual development fluctuations in morphology and diet, which consequently altered their stoichiometric features.
Introduction
Ecological stoichiometry studies the elemental composition of organisms, emphasizing the relationships between the major elements of living organisms, such as carbon (C), nitrogen (N), phosphorous (P) and other elements. It is also the science that studies the energy as well as multiple chemical elemental balances of biological systems (Sterner and Elser, 2002; Sardans et al., 2021), which relates the ecological functions of organisms to their elemental compositions and biochemical stoichiometric ratios (Sardans et al., 2021). C, N, and P have received great attention in stoichiometric studies as they are the basis for the chemical composition of life in all kinds on Earth. C is the basic component of each organic material and has the highest proportion (approximately 50%) of the organisms’ dry matter. N is important for protein production and some structural materials, such as chitin, and is an important component of organism mass. P is the major component of bones and nucleic acids, which constitute 9.5% of the nucleic acid composition (Zhang et al., 2022). Previous research showed that N and P can limit the primary productivity of marine and freshwater ecosystems (Dodds, 2007; Moore et al., 2013; Lourenço-Amorim et al., 2014; Bristow et al., 2017). In addition, ecologists are beginning to apply ecological stoichiometry to many elements other than macronutrients (C, N, and P), and all living organisms are composed of about 25 elements that have important effects on the structure and function of organisms and ecosystems alike (Kaspari and Powers, 2016; Kaspari, 2021; Filipiak and Filipiak, 2022).
The current applications of ecological stoichiometry are mainly focused on environmental assessment (Nie et al., 2012; Wang et al., 2022), forest succession and recession (Wardle et al., 2004; Liu et al., 2022), consumer-driven nutrient cycles (Elser and Urabe, 1999), population dynamics (Andersen et al., 2004), nutrient dynamics (Sterner and Hessen, 1994; Czamanski et al., 2011), nutrient supply and demand balance (Schade et al., 2005), nutrient limitation and carbon cycling (Nessel et al., 2021; Fernández-Martínez, 2022; Filipiak and Filipiak, 2022), food webs (Glibert et al., 2011; Pacioglu et al., 2021), biogeochemical niches (González et al., 2017; Peñuelas et al., 2019; Sardans et al., 2021), biological invasions (González et al., 2010), and biological evolution (Sardans et al., 2012; Jeyasingh et al., 2014). Ecological stoichiometry theory has become an effective tool and provided new ideas for studying consumer stoichiometry, nutrient cycles, and biogeochemical cycles. Studies using the ecological stoichiometry research framework have also included fishes. For example, Allgeier et al. (2020, 2021), Le Mézo et al. (2022), and Mäkelin and Villnäs (2022) conducted a series of studies on the ecological stoichiometry of fishes and invertebrates in different marine ecosystems (Mäkelin and Villnäs, 2022), and proposed to construct the global marine fish and invertebrate ecological stoichiometric database, initiatively.
Fish is an important component of aquatic ecosystems that can actively migrate and is occupying all layers of space in the water column. They are also at various consumer levels and ecological niches in the aquatic ecosystem (Hendrixson et al., 2007). Consumers (such as fishes) are crucial for the material cycling in the ecosystem, and their own C, N and P content reflect the proportion of their demand for different elements, which would also affect the efficiency of the transfer and use of C, P and N (Sterner and Elser, 2002). The imbalance nutrient supply and demand between producers and consumers in an ecosystem affects the metabolism, growth, reproduction and even the ecological processes of the whole population of an organism (Regnier et al., 2013).
Homeostasis and growth rate hypothesis (GRH) are two important basic theories of ecological stoichiometry (Sterner and Elser, 2002). Homeostasis theory suggests that organisms can maintain a relatively constant level of nutrients in the face of a variable environment (Sterner and Elser, 2002), with levels of elements in excess of the organism’s requirements being excreted while scarce and thus limiting elements are conserved (Sterner, 1997). The GRH suggests that changes of C:N:P in environments (including bait) can affect the organism’s growth rate and thus its population distribution characteristics. Conversely, organisms adjust their C:N:P ratios to adjust to changes in growth rates (Elser et al., 2003). In fish, many biological features are associated with body size, growth, and development. Also, the nutrient concentrations may vary in an allometric growth pattern (Tanner et al., 2000; El-Sabaawi et al., 2012). However, the ecological stoichiometry ratios are inconsistent in different fish species which will be addressed in this study. For instance, in Lepomis macrochirus (Rafinesque), the N:P decrease with body size (Davis and Boyd, 1978), while it increased in Cyprinid minnows (Sterner and George, 2000). Individual and taxon-specific changes in fish’s elemental composition during ontogeny can vary greatly in their timing, magnitude, and direction (González et al., 2011; Boros et al., 2015). Furthermore, the body stoichiometry of fish varies with environmental conditions such as food quality, trophic state, habitat, resources, stress, and predation pressure (Hall et al., 2005; Benstead et al., 2014; Sullam et al., 2015). Thus, different populations may have significant differences in their elemental composition, both inter- and intraspecifically. The effect of intraspecific variation in organismal stoichiometry has been inferred from related studies (El-Sabaawi et al., 2014), where differences in interspecific elemental composition can lead to differences in elemental requirements of the species, with corresponding effects on the present and cycling rates of important nutrients (Vanni et al., 1997; Boros et al., 2012). Therefore, understanding the magnitude of intraspecific variation in elemental composition and linking it with its causes and consequences may be an important step toward understanding the variation and evolution of ecosystem effects (Leal et al., 2017).
Beibu Gulf (105°40′∼110°10′ E, 17°00′∼21°45′ N) is a semi-enclosed bay in the northwest of South China Sea. It has a high yield and rich fishery resources due to its unique geomorphology and climate (Qiao and Li, 2007). In recent years, the dominant fish species such as Saurida tumbil (S. tumbil), Pennahia macrocephalus (P. macrocephalus), and Upeneus sulphureus (U. sulphureus) have experienced a decline because of global climate change, overfishing, and environmental pollution (Niu et al., 2018; Wang et al., 2019; Deng et al., 2021). To investigate the inter- and intraspecific variations in the body stoichiometry of fish and its influencing factors, the elemental contents of C, N, P, Ca, δ13C, and δ15N in three dominant species from the Beibu Gulf were analyzed in this study. We tested the hypothesis that the inter- and intraspecific differences in the body stoichiometry of these three fishes are related to their own individual development and changes in feeding habits and habitat during growth. The information on fish body stoichiometry provided in this study is crucial for understanding the nutrient cycling in Beibu Gulf, and can help to provide better management and conservation efforts in the region.
Materials and methods
Sampling
Fish samples [S. tumbil (n = 33), P. macrocephalus (n = 34) and U. sulphureus (n = 32)] were collected by bottom trawl using a trawler with a 441 kW main engine from the Beibu Gulf in April 2022 (Figure 1). The size of the fishing net used for trawling was 20 m (length) × 8 m (width) × 3 m (height), with minimum and maximum mesh size was 1 and 5 cm, respectively. Fish samples were classified and identified on-site and then transported in ice to the laboratory for subsequent processing. Surface water quality samples at about 0.5 m were collected and physical indicators including electrical conductivity (EC), water temperature (T), dissolved oxygen (DO) and pH were measured on-site by a multimeter analyzer (YSI Professional Plus). Turbidity was measured using a turbidity tester (HACH 2100Q). Chl-a in the water was determined using a portable algae detector (ALGAE-Wader). The collected water samples were brought back to the laboratory to separate TN, TP, NO3–-N, NO2–-N, PO43–-P and NH4+-N, TOC and CODMn. The potassium permanganate oxidation method was used to determine CODMn of the samples. A continuous flow analyzer (SKALAR SAN++) was used to test nutrients using colorimetric methods (Liu et al., 2019).
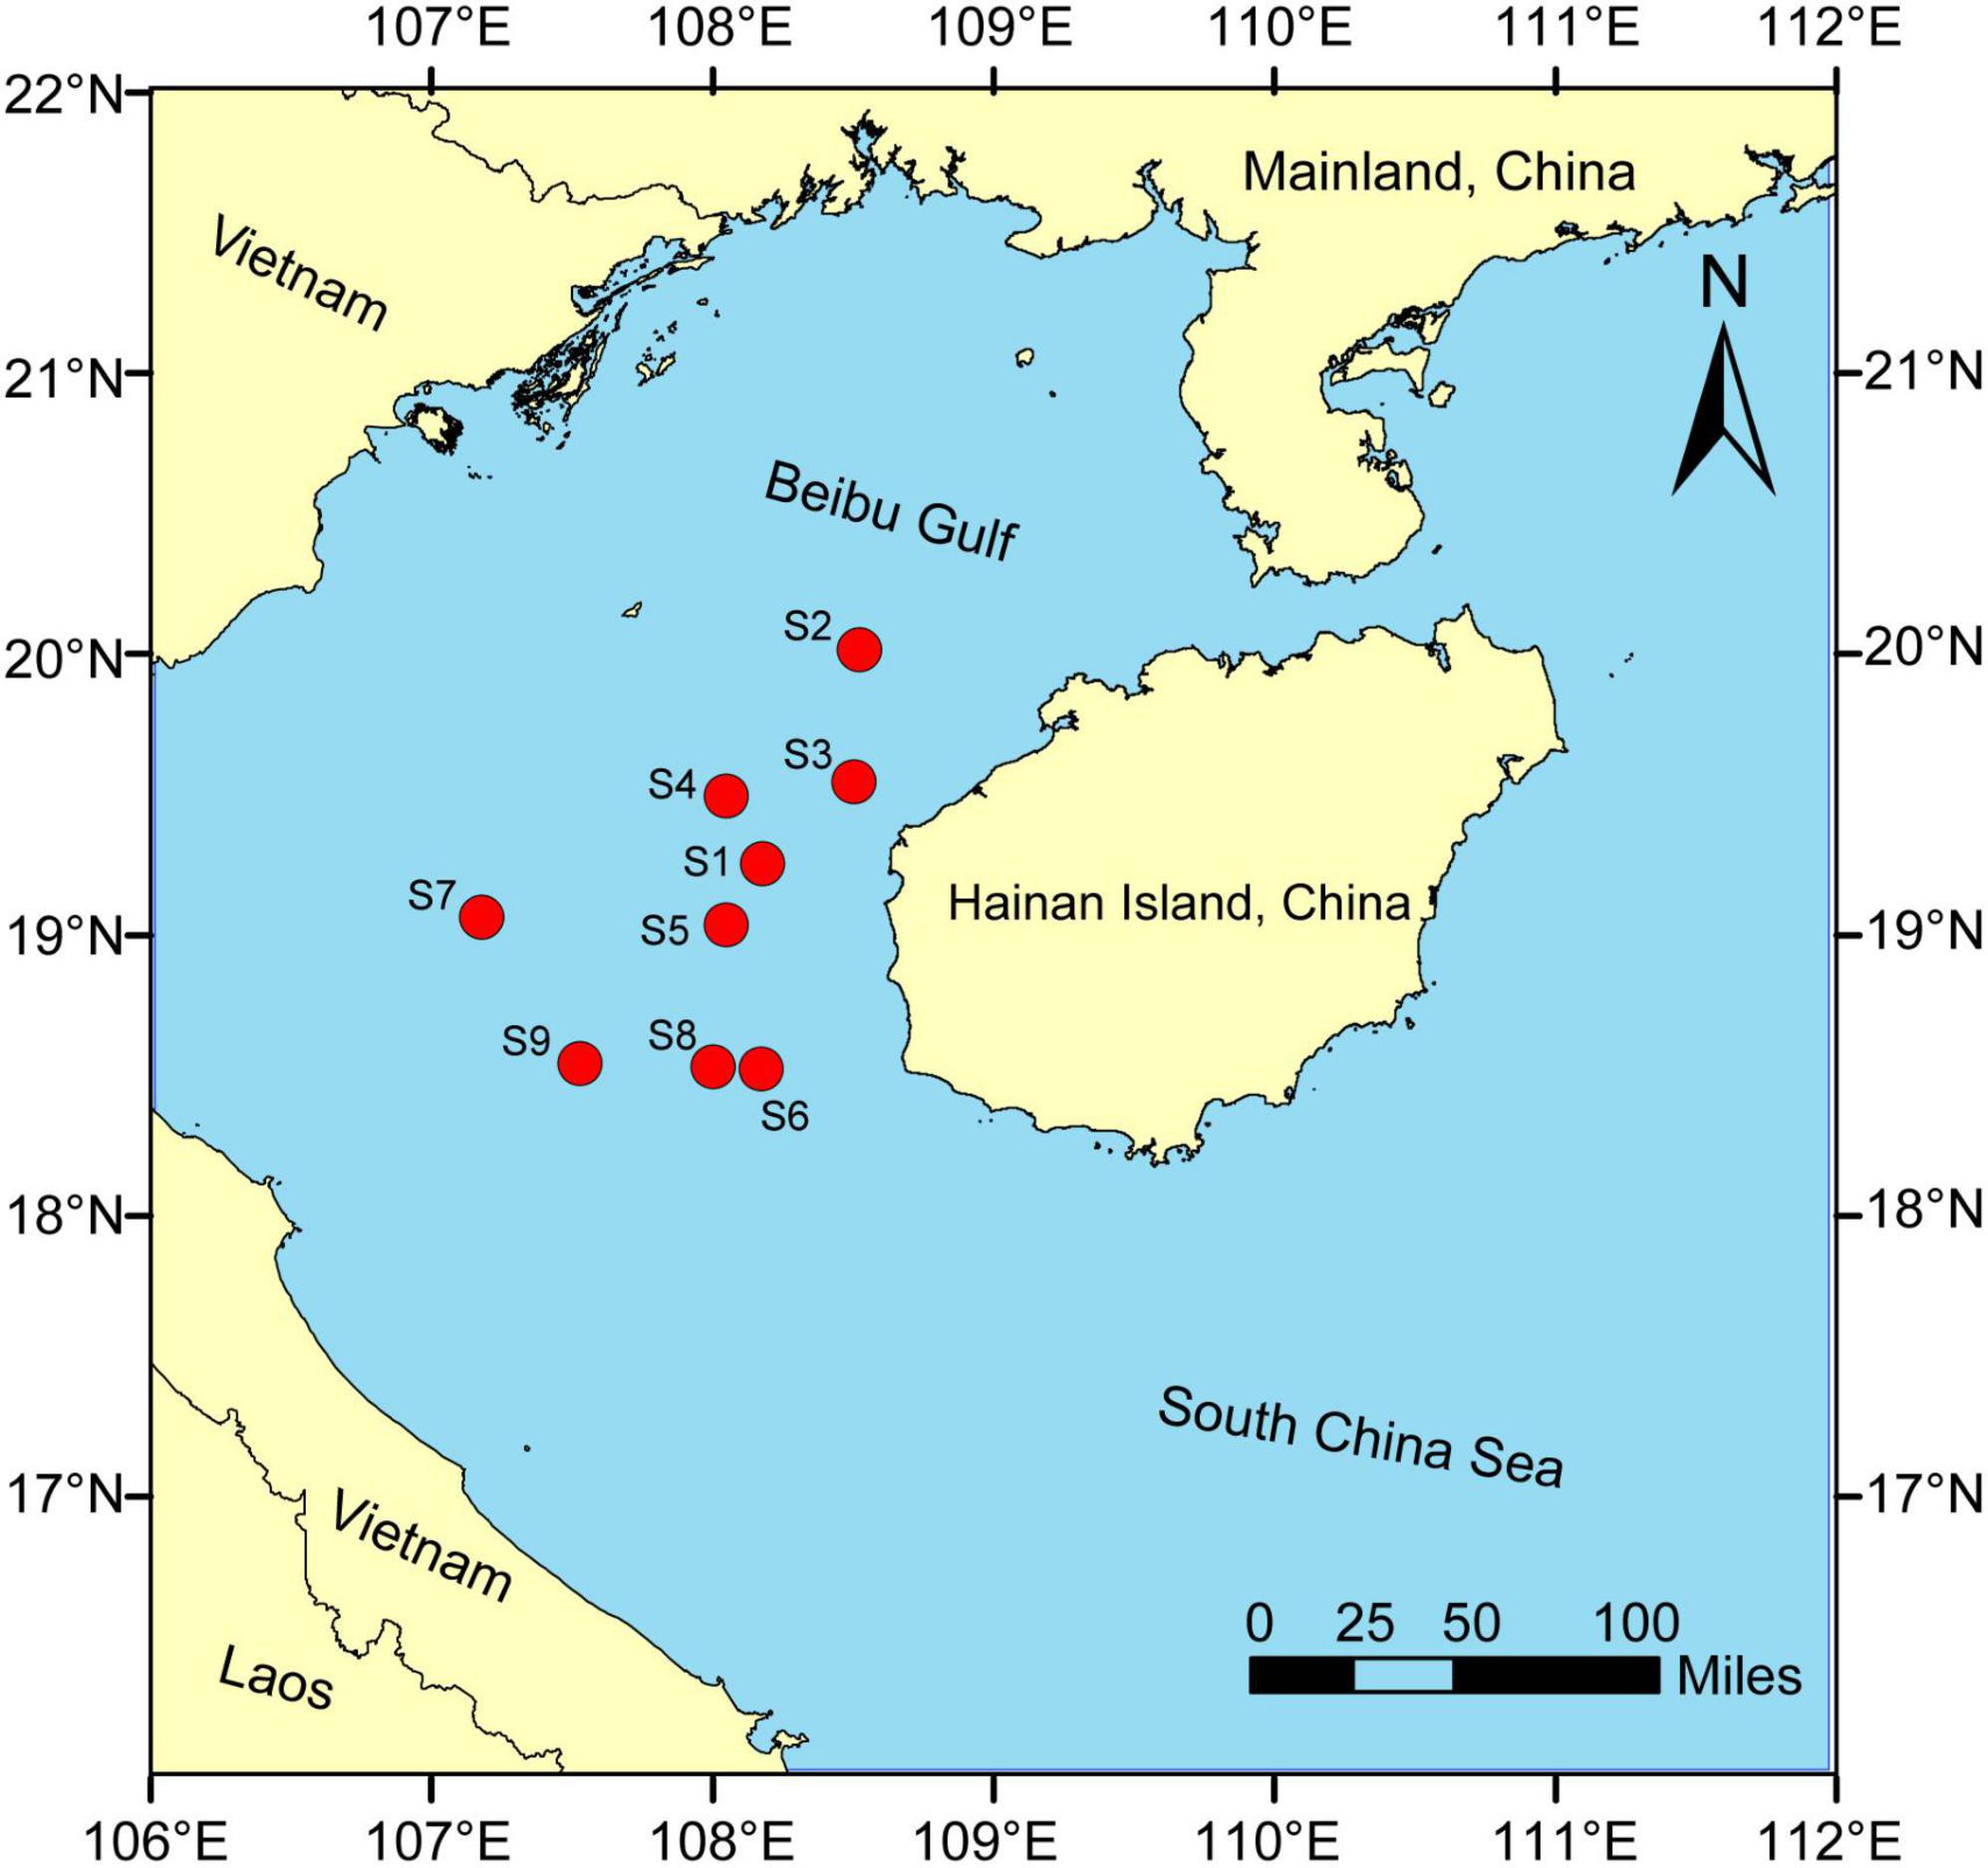
Figure 1. Distribution of sampling sites in the Beibu Gulf.
Sample processing and elemental determination
All fish individuals were thawed and washed with deionized water, and body weight (±0.1 g), body length and total length (±1 mm) were measured before dissection. The fish samples were pounded with a grinder after removing guts, then ground and mixed through a sieve (60 mesh) after freeze-drying. After weighing 0.4∼0.45 mg of the dried sample and wrapping it with tinfoil, C, N, δ13C, and δ15N were measured using an elemental analyzer (EA Isolink CNHO) coupled with an isotope mass spectrometer (DELTA V Advantage) (EA-IRMS). ICP-OES (Optima 7000DV) was used for Ca and P determination (Sun et al., 2014). Before sampling, weighing 0.2∼0.5 g of dried sample was used for microwave digestion with 7 ml of mixed acid (HNO3:H2O2 = 5:2). After digestion, samples were heated on a heating plate (100°C) for 30 min to evaporate excess acid and filled to 50 ml with ultrapure water, and then the samples were analyzed (n = 99) on the ICP-OES. The recoveries of Ca and P were 92.53 ± 6.46% and 93.82 ± 7.37%, respectively. The results for C, N, P, and Ca content are presented in percent dry mass (%), while the C:N, C:P, and N:P ratios are the molar ratios of the elements.
Statistical analyses
The C, N, and P contents and their ratios of all fish were firstly evaluated by basic statistical analyses, and the normal distribution test was performed by Kolmogorov-Smirnov test and normal histogram to observe the trend of normal distribution. The C, N, P, δ13C, and δ15N contents of different species and body length groups were compared by one-way ANOVA. Pearson correlation analysis and linear regression were used to examine the correlations among elemental contents, ratios and the amount of explanation for their data variation. Partial correlation analysis was used to analyze the relationship between elemental contents, ratios and δ13C and δ15N, with individual size as a covariate. Pearson correlation was used to clarify the relationship between elemental contents in fishes and the water quality index. Data were preprocessed using Excel 2016 and SPSS 23.0 for statistical analysis, and the graphs were prepared using OriginPro 2021 and R (Version 4.0.3).
Results
Elemental composition of the three fishes
The elemental composition of the three fishes were determined and presented in Figure 2. Result illustrated that the total length of S. tumbil (n = 32) determined in the range of 112.7∼278.9 mm, body length range of 92.9∼238.5 mm and body weight (wet weight) range of 6.58∼149.13 g. The variation of C, N and P contents ranged from 38.6 to 49.24, 10.57 to 13.31, and 1.11 to 2.14%, respectively (Figure 2). The coefficients of variation (CV) for the three element contents were ranked from high to low as P > C > N, with 5.31, 4.95, and 14.22%, respectively, while P content varied the most, resulting in variations in C:P and N:P (CV was 17.23 and 14.79%). In contrast, the variation of C:N was smaller (CV was 7.84%).
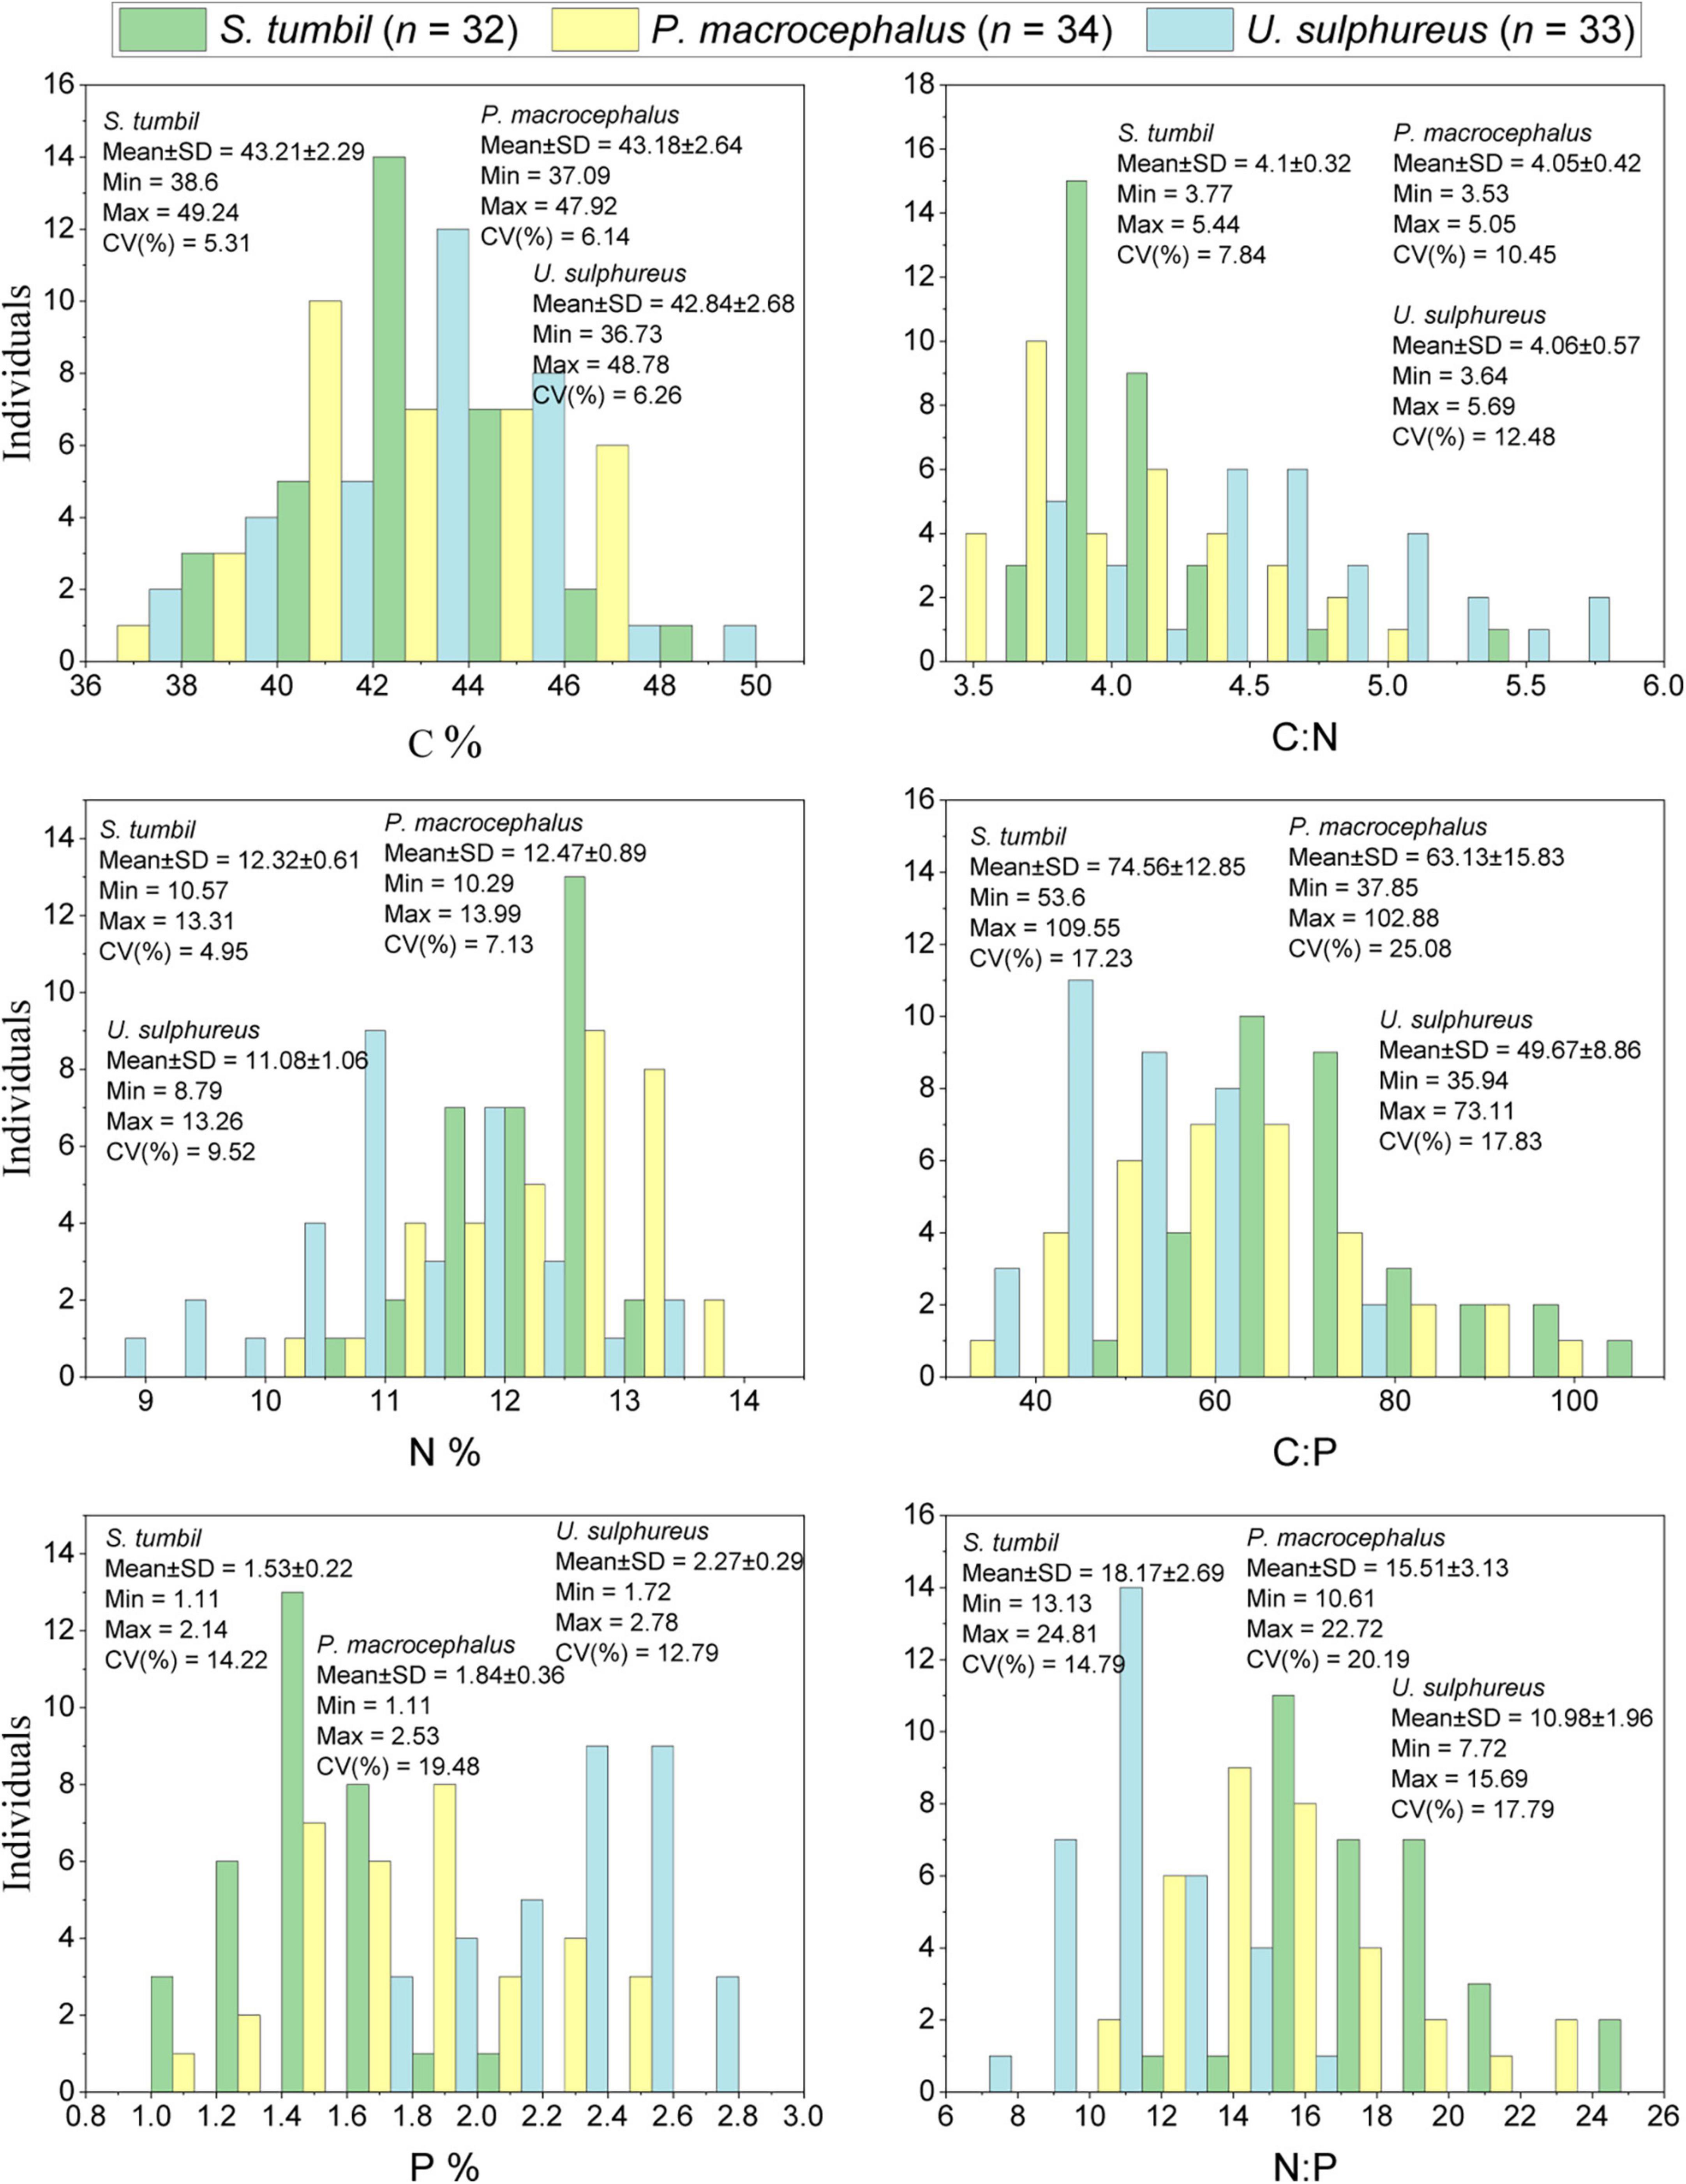
Figure 2. Frequency histograms of carbon (C), nitrogen (N), phosphorus (P), C:N, C:P, and N:P in the three fishes from the Beibu Gulf (n = 99).
In 34 P. macrocephalus samples, the total length ranged from 64.8 to 229.1 mm, body length ranged as 48.2∼192.3 mm, with the body weight (wet weight) range of 2.05∼171.86 g. The ranges of C, N, and P contents were 37.09∼47.92, 10.29∼13.99, and 1.11∼2.53%, respectively (Figure 2). The CV of the three element contents was ranked from high to low as P > N > C, with 6.14, 7.13, and 19.48%, respectively. The larger variation in P content also led to a greater variation in C:P and N:P (CV was 25.08 and 20.19%). In contrast, a smaller variation was observed for C:N with CV of 10.45%.
U. sulphureus (n = 33) had a total length in the range of 113.2∼194.9 mm, body length range of 86.1∼157.0 mm, and body weight (wet weight) in the range of 18.00∼117.13 g. The ranges of variation of C, N, and P contents were 36.73∼48.78, 8.79∼13.26, and 1.72∼2.78%, respectively (Figure 2). The CV of the three element contents were ranked from high to low as P > N > C, with 6.26, 9.52, and 12.79%, respectively. The large variation in P content also led to a greater variation in C:P and N:P (CV was 17.83 and 17.79%). On the contrary, the variability of C:N was smaller (CV was 12.48%).
Correlation of body stoichiometry characteristics of the three fishes
The correlation analysis in Figure 3 expressed that the C:N and N content of the three fishes were negatively correlated (r = −0.676, r = −0.805, r = −0.874, P < 0.01). The C:P and P contents, N:P and P contents were also negatively correlated (r = −0.914, r = −0.954, r = −0.939, P < 0.01; r = 0.920, r = 0.906, r = 0.824, P < 0.01). Whereas, C:N and C content, C:P and C content all showed positive correlations (r = 0.726, r = 0.699, r = 0.671, P < 0.01; r = 0.565, r = 767, r = 0.728, P < 0.01). The strongest correlation was found between C:P and P content, N:P and P content, indicating that changes in C:P and N:P of the three fishes from the Beibu Gulf were mainly determined by the changes in P content.
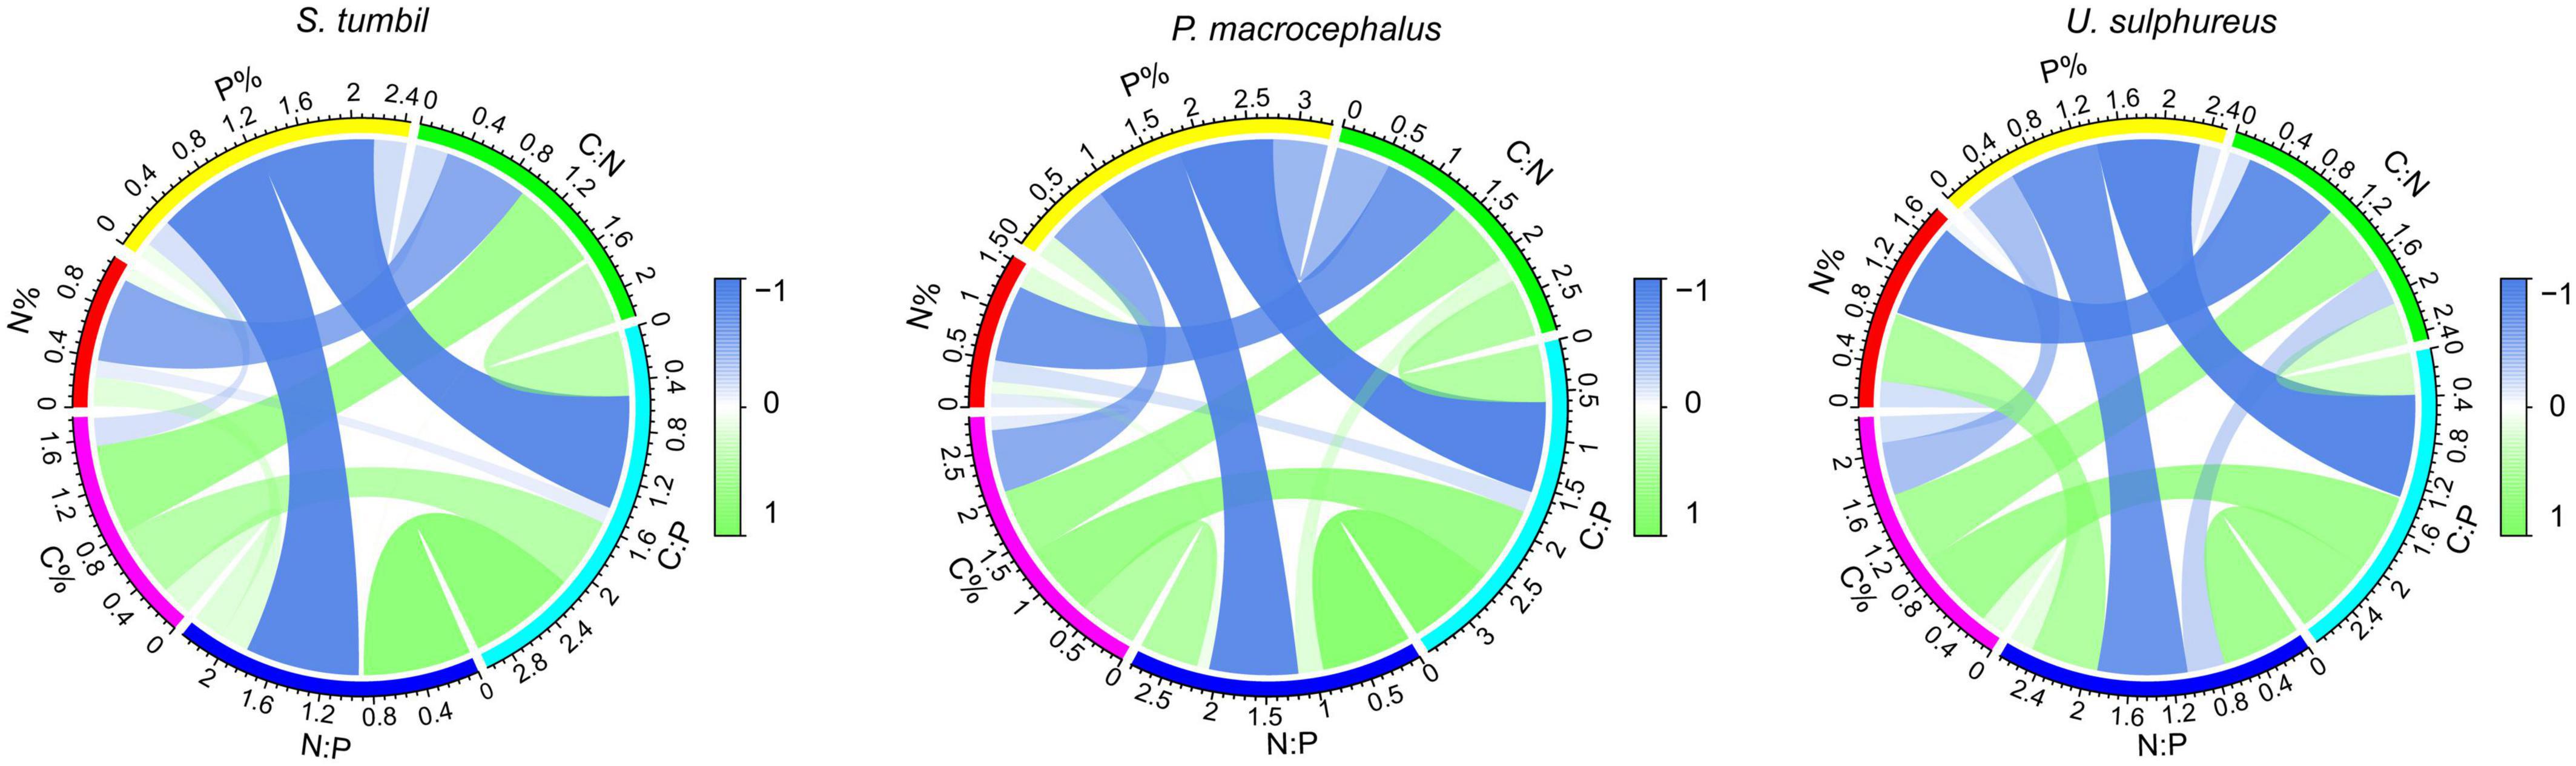
Figure 3. Correlation analysis among C, N, P contents and their ratios of the three fishes from the Beibu Gulf.
The Ca values of the three fishes from the Beibu Gulf ranged from 1.16 to 4.58%. Correlation analysis revealed that the Ca and P contents in all the three fishes showed significant positive correlation (R2 = 0.694, R2 = 0.961, R2 = 0.883, P < 0.01), and P content increased with the increase in Ca content (Figure 4).
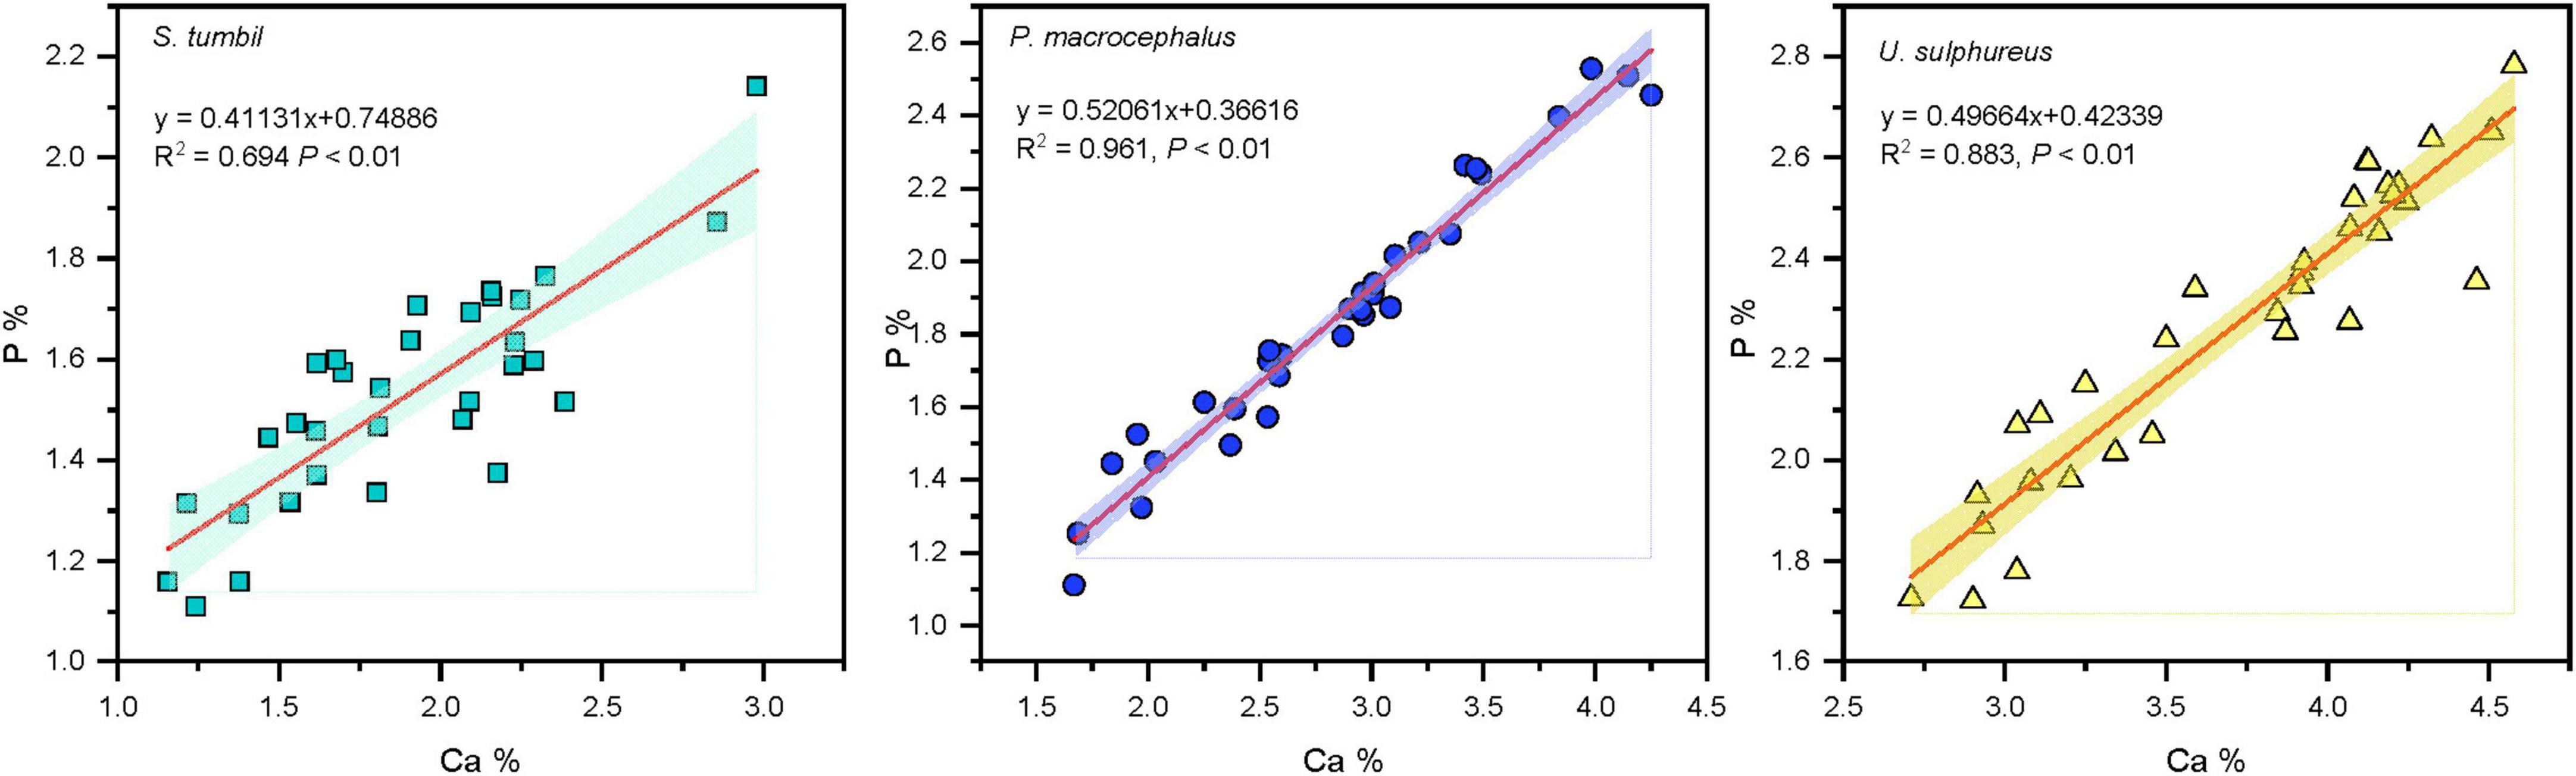
Figure 4. Correlation analysis results between calcium (Ca) and phosphorus (P) in the three fishes from the Beibu Gulf.
Interspecific differences in the body stoichiometry of the three fishes
The N and P content, C:N, C:P, and N:P of the three fishes vary significantly (P < 0.01) as shown in Figure 5. N content was significantly higher in S. tumbil and P. macrocephalus than in U. sulphureus; The P content of S. tumbil was the lowest, followed by P. macrocephalus and highest in U. sulphureus. S. tumbil and P. macrocephalus had significantly lower C:N than U. sulphureus; The highest C:P and N:P were found in the S. tumbil, followed by the P. macrocephalus, and the lowest in the U. sulphureus.
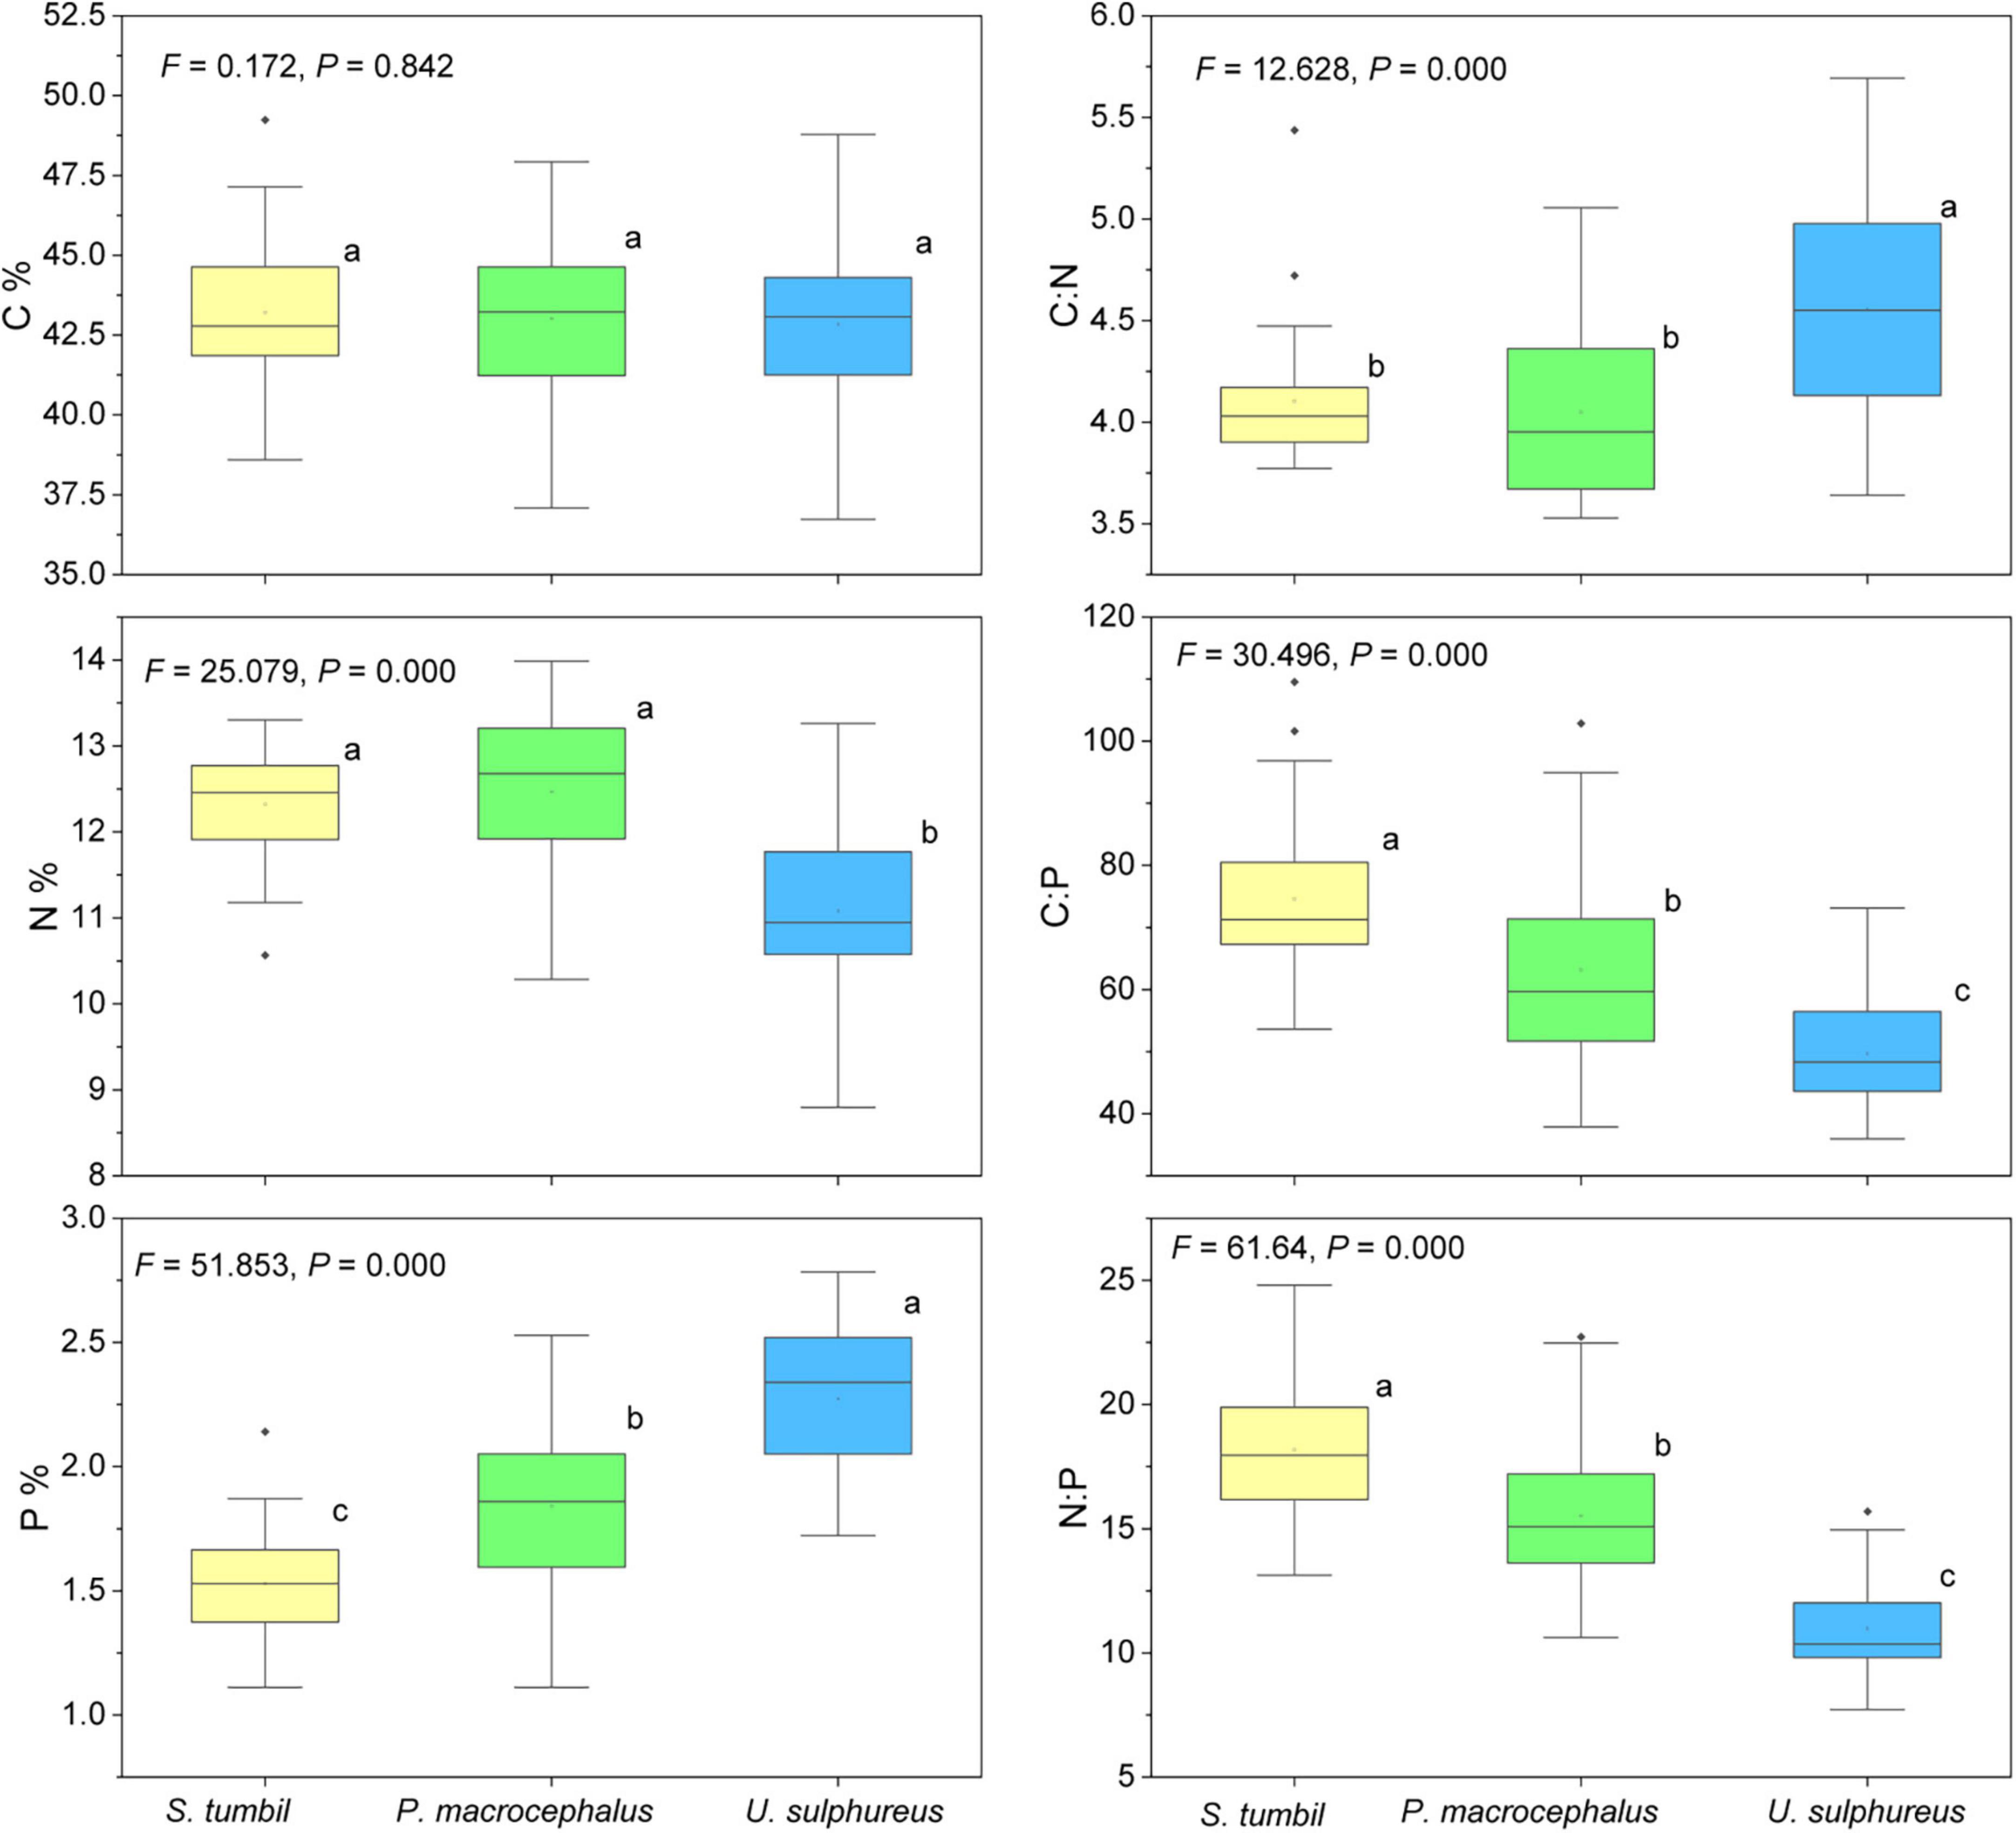
Figure 5. Box diagram of the contents and ratios of C, N, and P in the three fishes from the Beibu Gulf. Different lower-case letters (P < 0.05) indicate significant differences.
Ontogenetic variation in C:N:P stoichiometry in the three fishes
The S. tumbil samples (n = 32), P. macrocephalus samples (n = 34) and U. sulphureus samples (n = 33) were divided into five body length groups as the data at a group spacing of 30 mm for the former two species and 15 mm for the later species conformed to a normal distribution (Table 1). The C content and C:N of S. tumbil in different body length groups differ significantly (P < 0.05) (Figure 6). C content and C:N of ≥ 210 mm groups were the highest, followed by other groups, and < 120 mm group was the lowest. The C content and C:N of S. tumbil increased with the increase in body length, while N content, P content, C:P and N:P did not differ in body length groups (P > 0.05). Similarly, different body length groups of P. macrocephalus had significantly different C, N, P contents and their ratios (P < 0.05). With the increasing body length, C content, C:N, C:P, and N:P of P. macrocephalus also increased, while P content decreased. However, the C, N, and P contents and their ratios of U. sulphureus in different body length groups didn’t vary significantly (P > 0.05), while the mean values of C content and C:N of U. sulphureus increased with the increase of body length (Figure 6).

Table 1. Length grouping information of the three fishes from the Beibu Gulf.
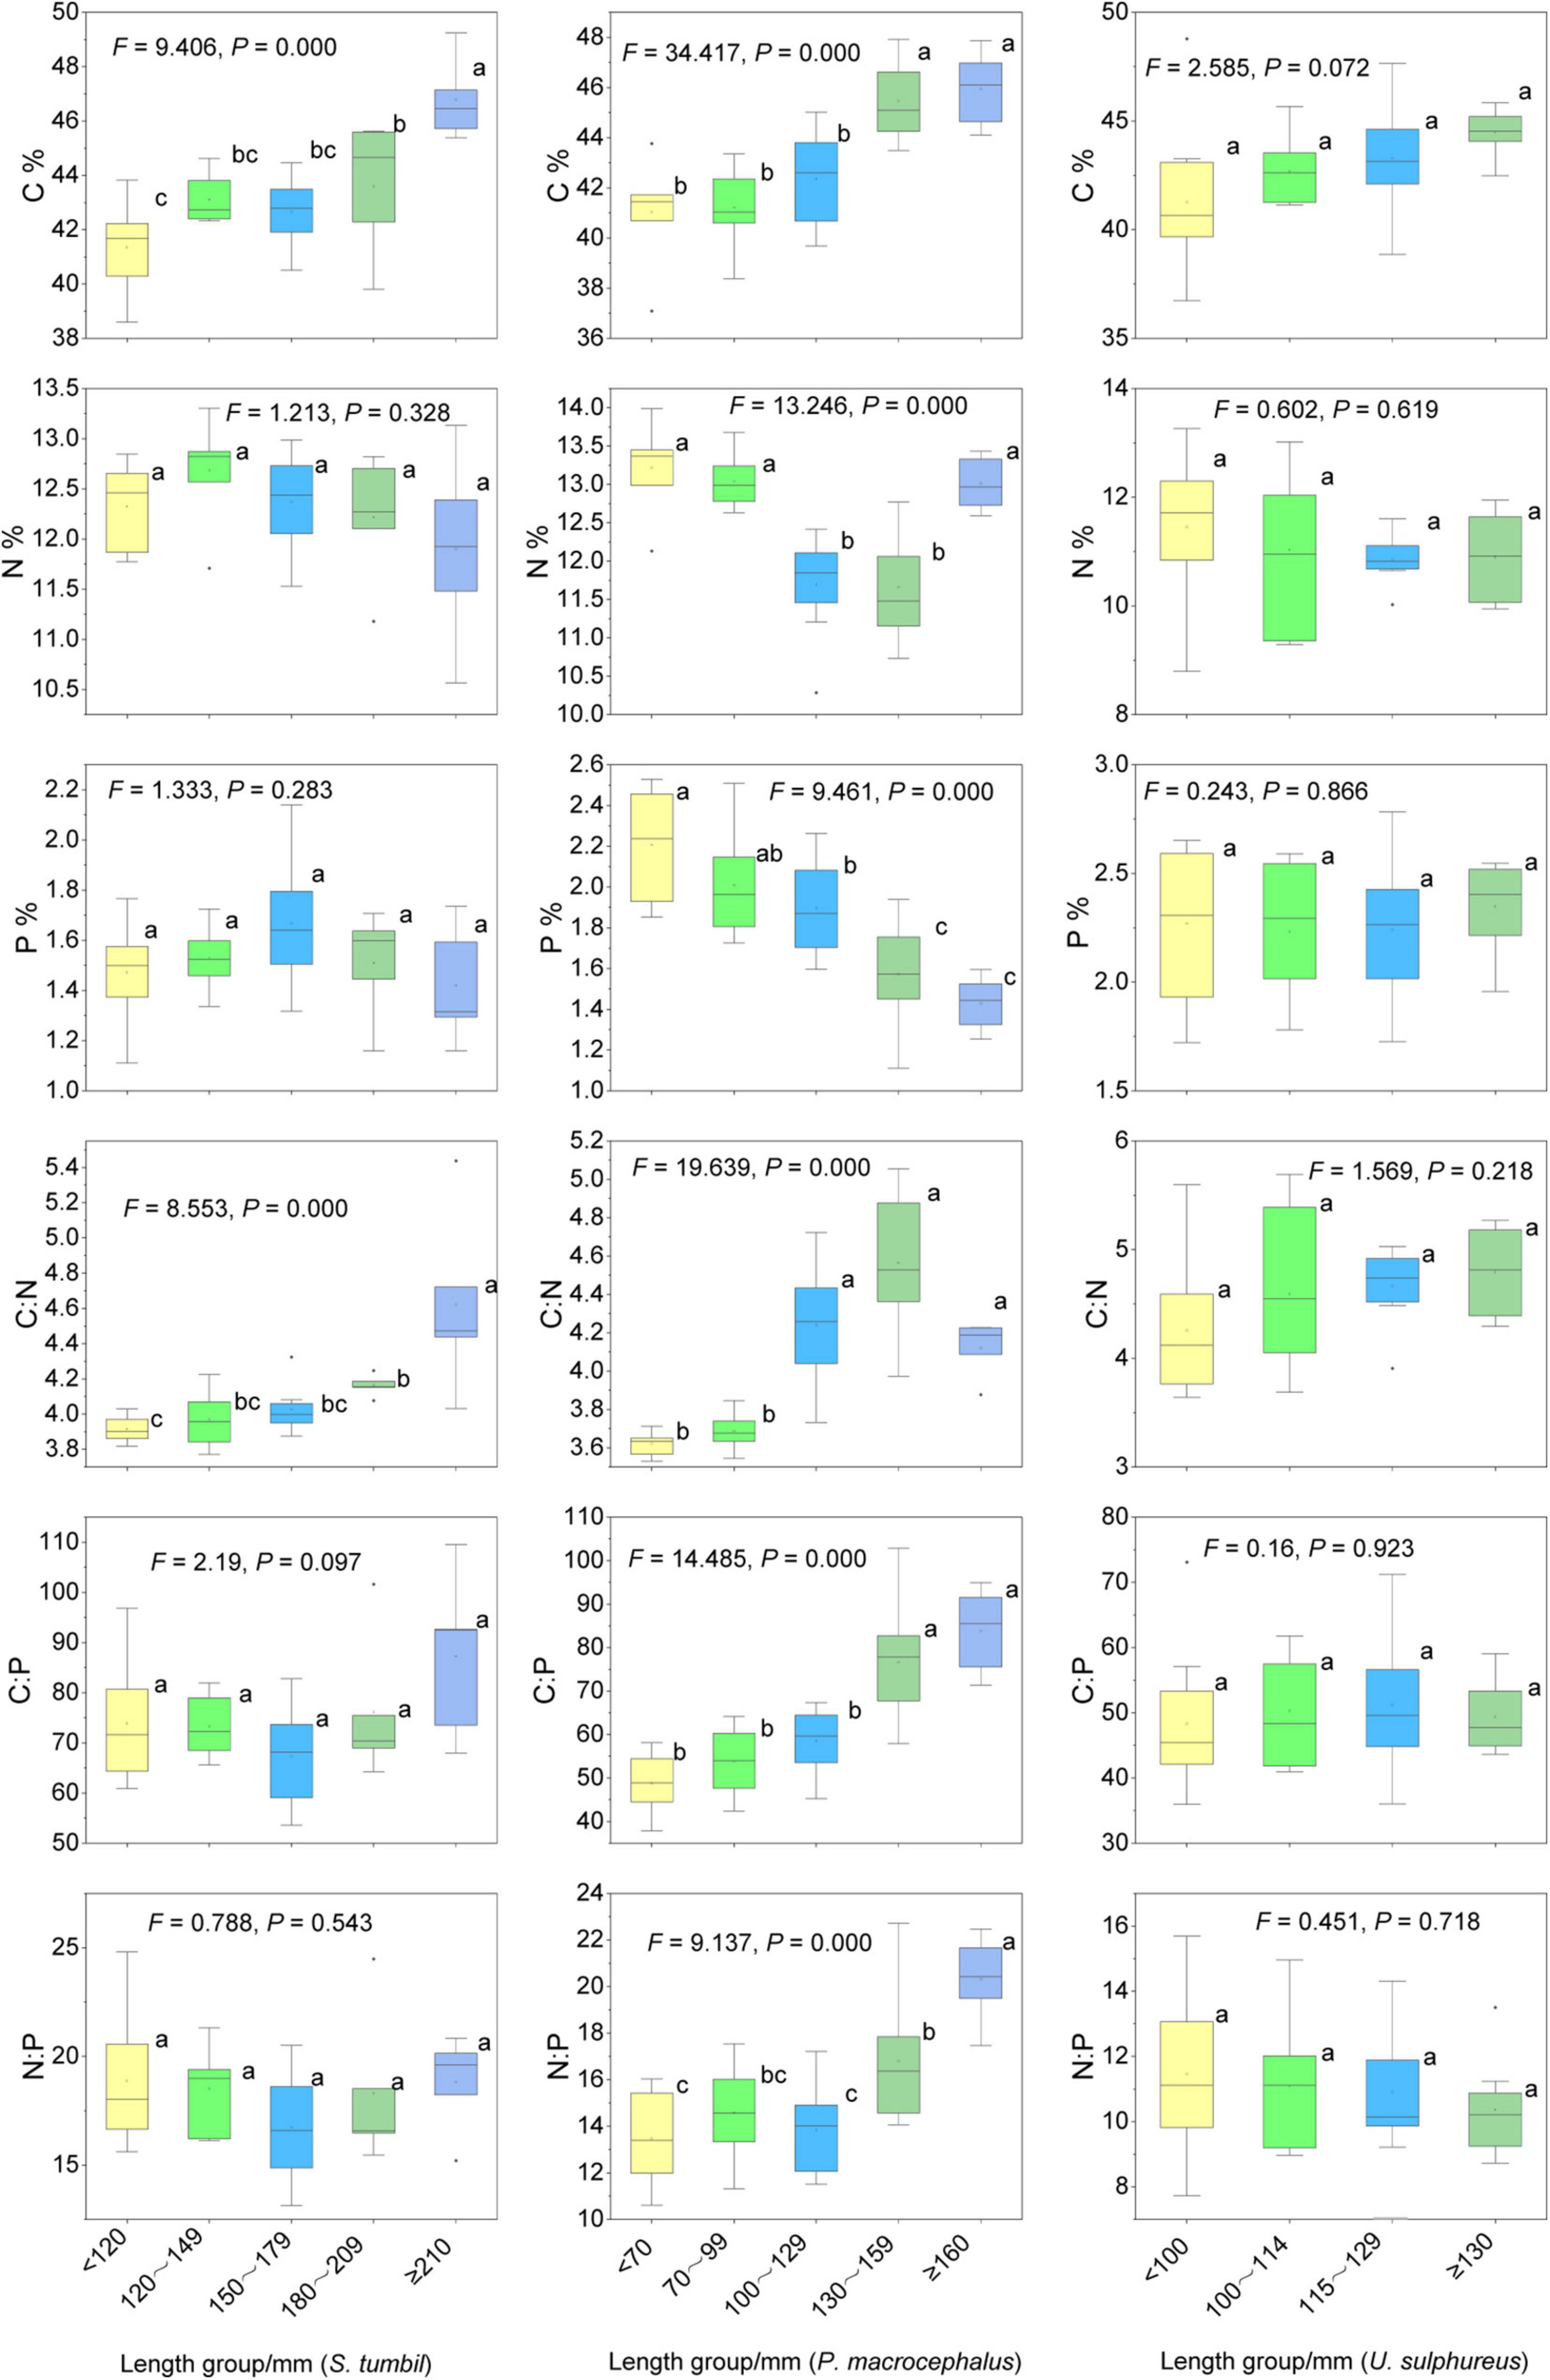
Figure 6. Contents and ratios of C, N, and P in different sizes of the three fishes from the Beibu Gulf. Different lower-case letters (P < 0.05) indicate significant differences.
Correlation of δ13C and δ15N with body stoichiometry in three fishes
The δ15N values of S. tumbil ranged from 11.45 to 15.52‰, and the δ13C values ranged from −19.32 to −16.87‰. The δ15N values of P. macrocephalus ranged from 10.56 to 13.32‰, and the δ13C values ranged from −19.47 to −17.93‰. The δ15N values of U. sulphureus ranged from 11.91 to 14.02‰, and the δ13C values ranged from −20.68 to −17.58. Our results showed significant differences in δ15N and δ13C among the three fishes (Figure 7). S. tumbil and U. sulphureus had significantly higher δ15N than P. macrocephalus. S. tumbil had the highest δ13C, followed by P. macrocephalus, and lowest in the U. sulphureus. The δ13C and δ15N of S. tumbil and P. macrocephalus were also significantly different, while the δ13C and δ15N of U. sulphureus did not vary significantly in different body length groups (Figure 7).
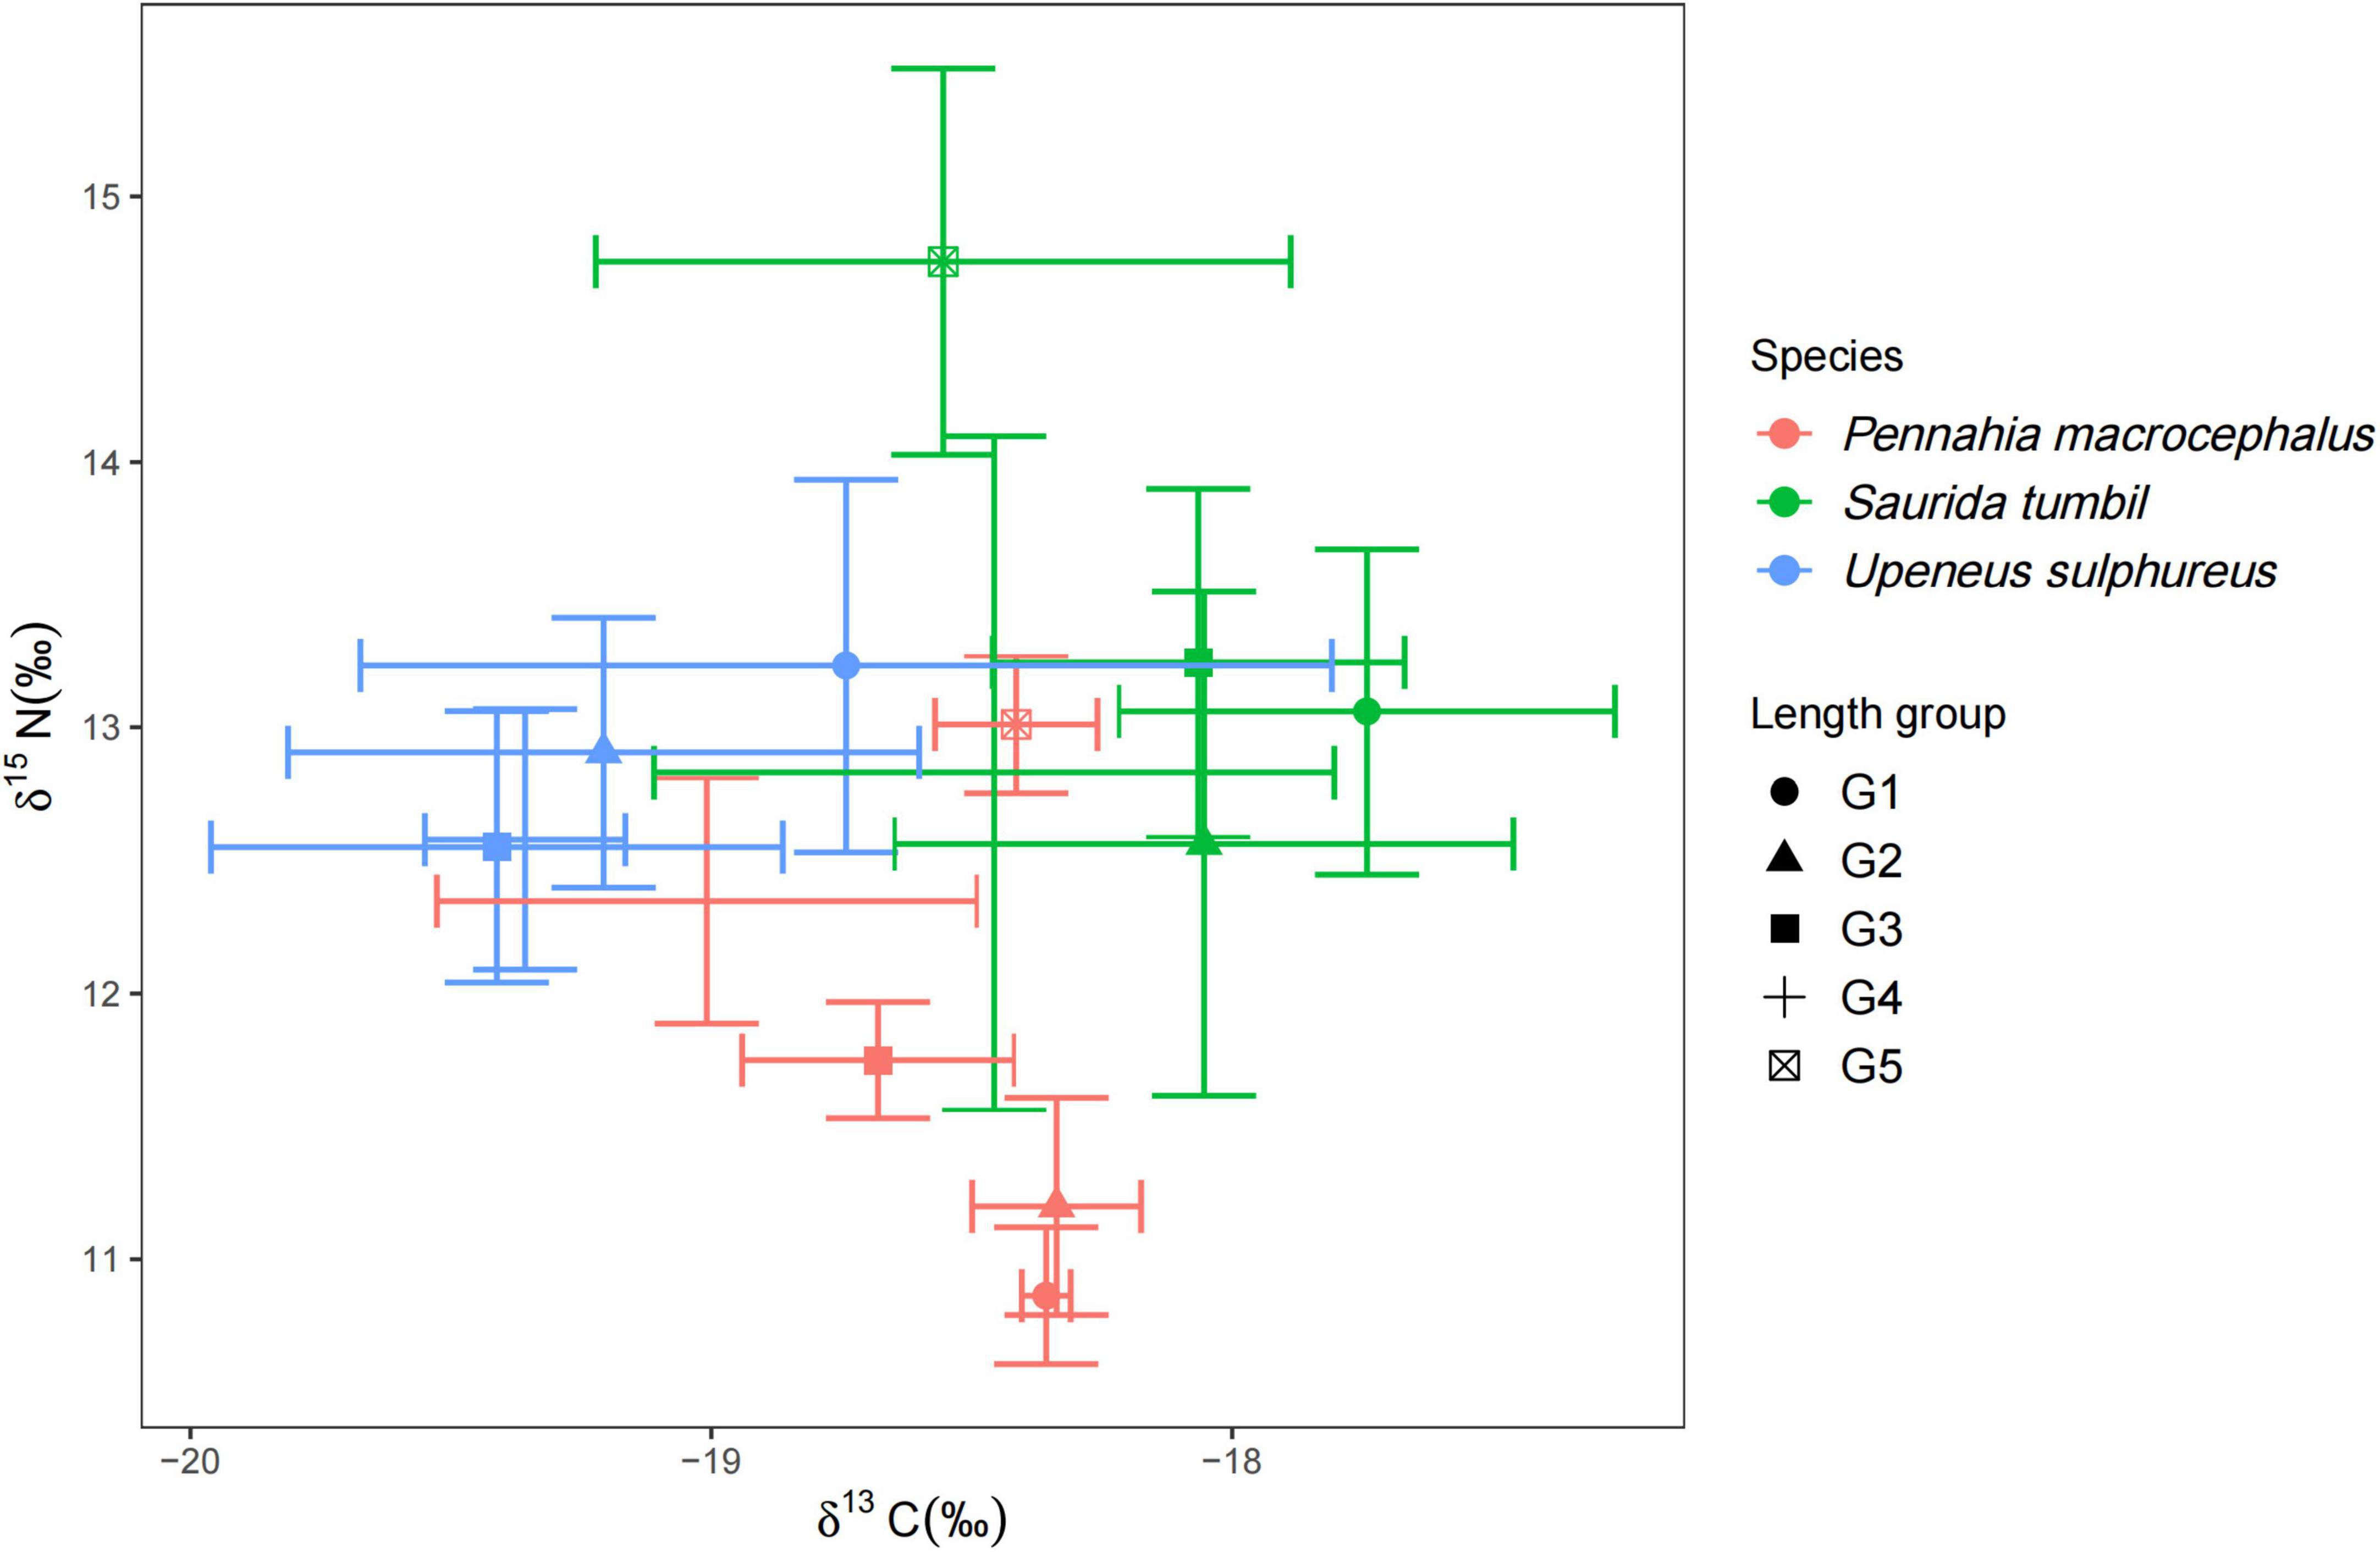
Figure 7. Biplots of mean ± S.D. δ13C and δ15N of the three fishes [Abbreviation: G1∼G5 indicated the different body length groups of the three fishes (Table 1)].
Partial correlation analysis in Table 2 revealed that the C, N, P content and the ratios of S. tumbil and P. macrocephalus were not correlated with δ15N, and only the N content of U. sulphureus showed a significant positive correlation with δ15N (r = 0.346, P < 0.05). N content and δ13C were significantly correlated in S. tumbil, P. macrocephalus, and U. sulphureus (r = 0.419, r = 0.698, r = 0.346, P < 0.05). C:N and δ13C were significantly correlated in S. tumbil, P. macrocephalus and U. sulphureus (r = −0.388, r = −0.754, r = −0.562, P < 0.05). However, in U. sulphureus, the relationship between C content, C:P and δ13C was significantly negative, while the relationship between P content and δ13C was significantly positive (r = −0.745, r = −0.634, r = 0.442, P < 0.05).
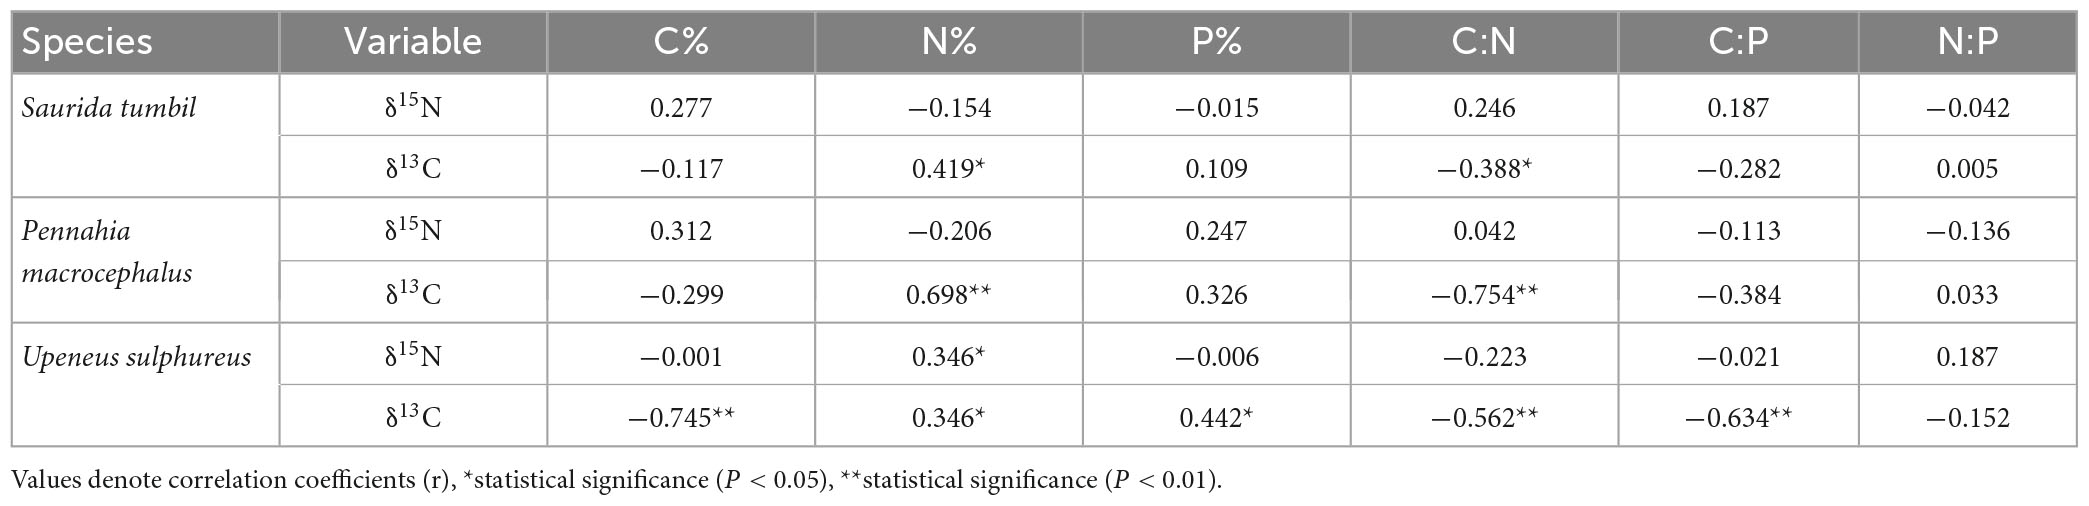
Table 2. Correlation analysis results of C, N, and P contents and their ratios with δ15N and δ13C of the three fishes from the Beibu Gulf.
Relationship between elements composition and water quality
Correlation analysis revealed that most elements in the three fishes did not correlate with water column nutrient indicators (Table 3). Only S. tumbil showed positive correlations between C content, C:N and DO (r = 0.856, P < 0.05; r = 0.930, P < 0.01) as well as C:P and Chl-a (r = 0.835, P < 0.05); TOC and N content of U. sulphureus correlated positively, while C:N correlated negatively (r = 0.986, P < 0.01; r = −0.906, P < 0.05).
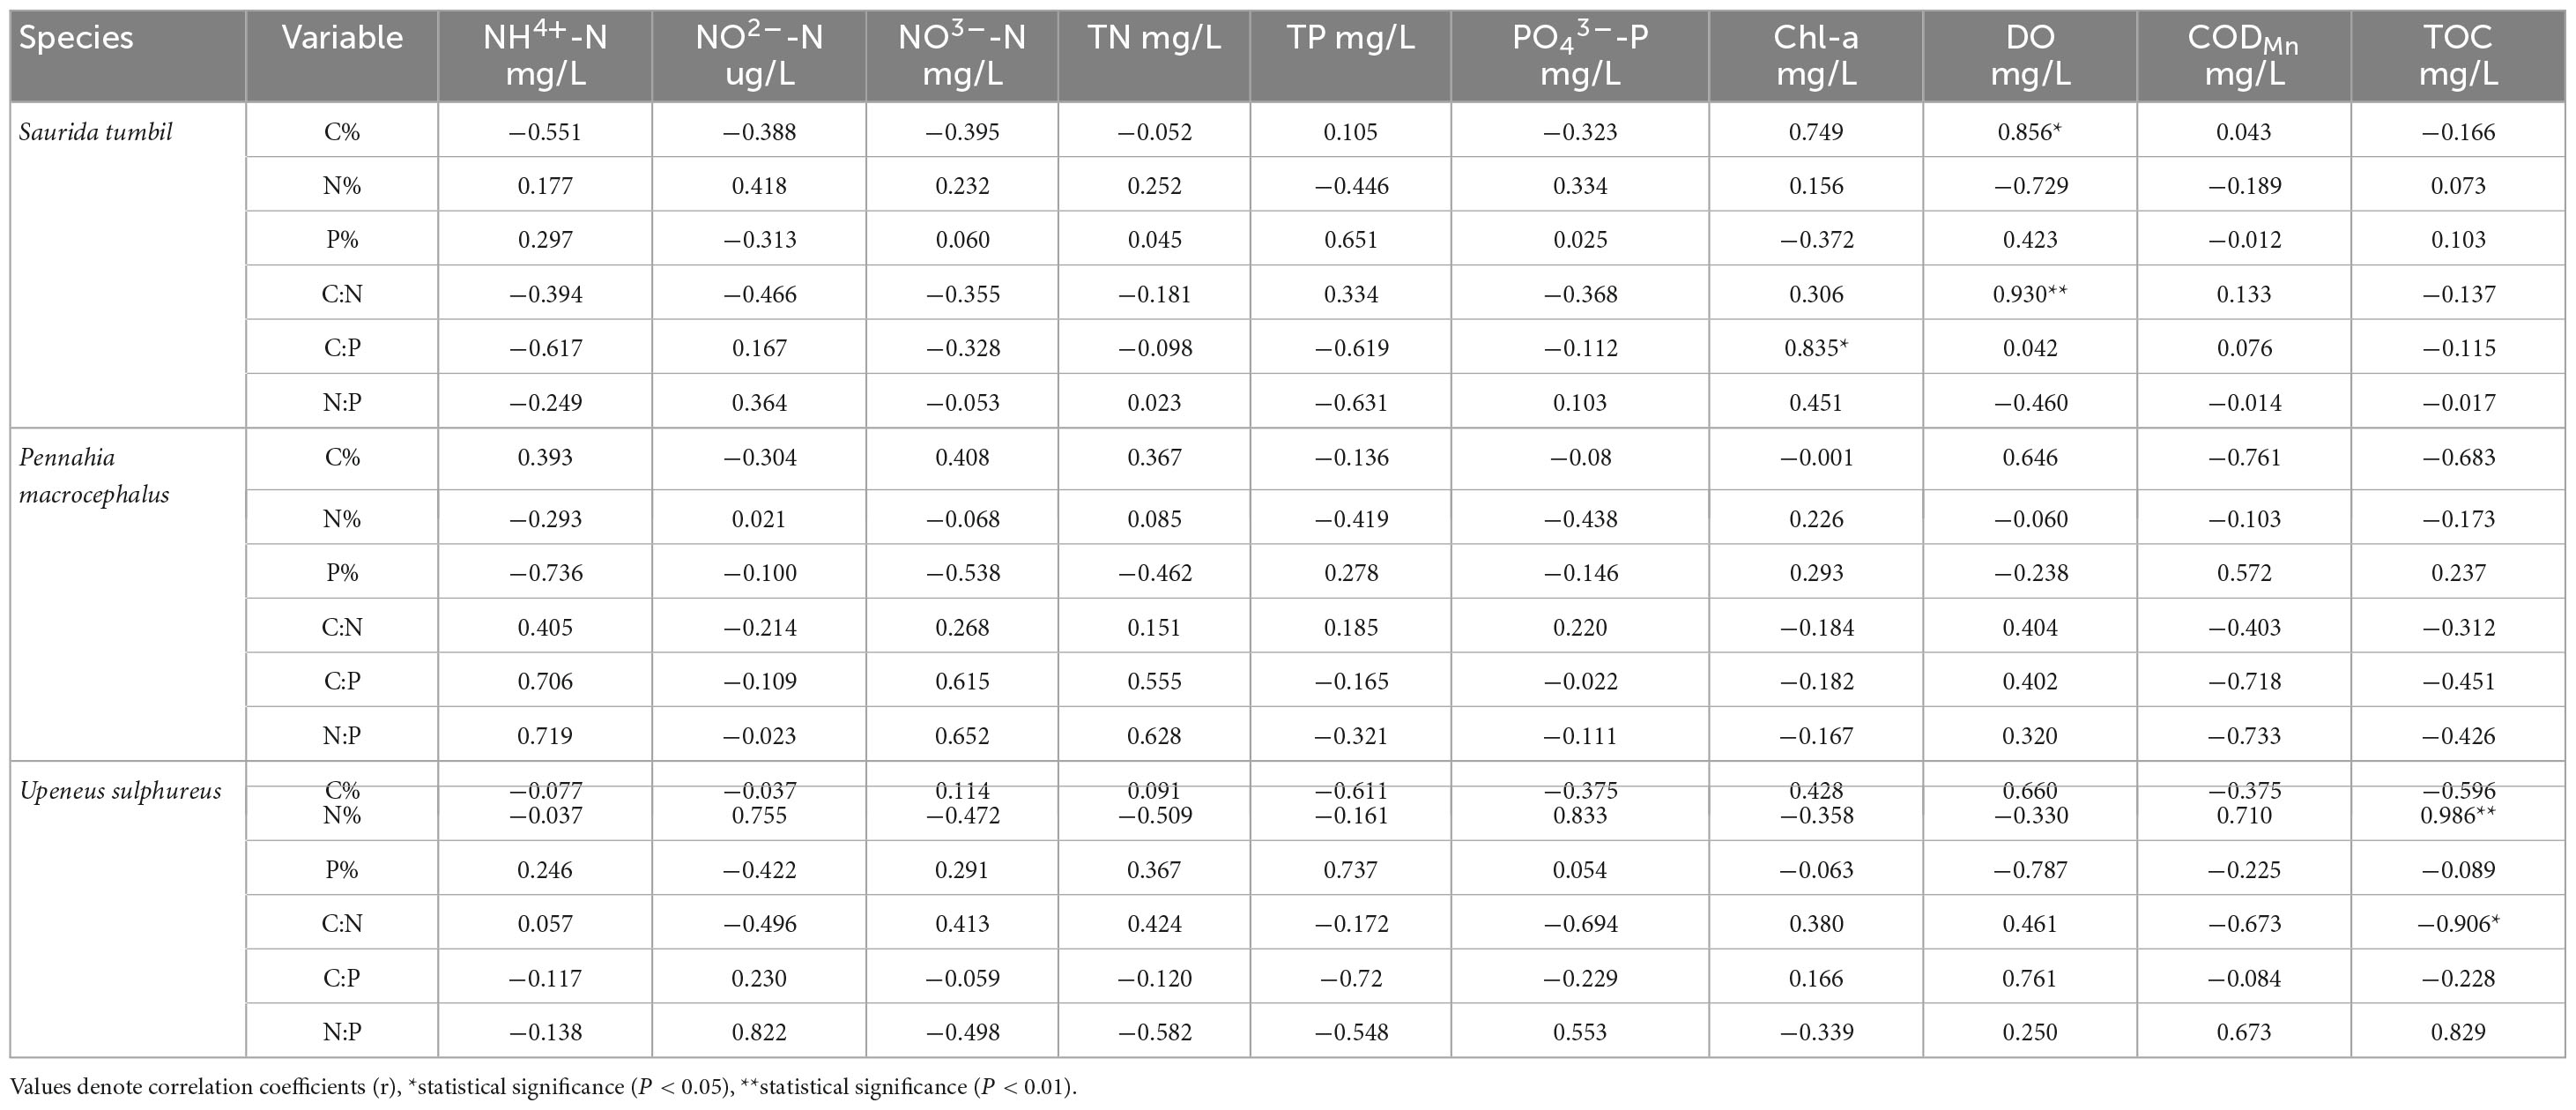
Table 3. Results of correlation analysis between ecological stoichiometry of the three fishes from the Beibu Gulf and water quality indicators.
Discussion
Element characteristics and interspecific differences of the three fishes
The elemental contents of C, N, and P of the three fishes from the Beibu Gulf varied greatly (Figure 2), and higher variation was found in the P content than in the C and N contents. This is in agreement with the results in previous studies (Vanni et al., 2002; Sun et al., 2014; Cai et al., 2016). It is generally recognized that the species-level stoichiometry varies greatly in fishes, especially for P levels (McIntyre and Flecker, 2010). Hendrixson proposed a strong link between P content and the phylogeny of fish (Hendrixson et al., 2007), that P content is an important interspecies trait and an important factor in the diversification of the fish’s elemental composition, which cause extensive interspecific variation (Villar-Argaiz et al., 2020). This study found significant interspecies differences in elemental content and ratios of the three fishes (Figure 5). Scale type and body morphology can partly explain interspecific variations in fish such as Salmonidae and Cyprinidae that are low in P and tend to be elongated, with cycloid scales and soft-rayed fins, whereas high P fish such as Amblycipitidae, prone to be spiny-rayed and laterally compressed (Hendrixson et al., 2007; McIntyre and Flecker, 2010). In the present study, S. tumbil was covered with cycloid scales, P. macrocephalus was covered with spiny-rayed and cycloid scales, and U. sulphureus was covered with spiny-rayed, which is supported by the results of Hendrixson et al. (2007) and McIntyre and Flecker (2010). Thus, differences in bones and scales can lead to significant changes in P concentrations in fish. In addition, δ13C, C:P and N:P are all S. tumbil > P. macrocephalus > U. sulphureus, and the content of P is S. tumbil < P. macrocephalus < U. sulphureus, the same trends of δ13C and P content, C:P and N:P co-variation in S. tumbil, P. macrocephalus and U. sulphureus (Figures 5, 7). Different aquatic organisms have various δ13C values, indicating different food sources (Liu et al., 2018). Thus, it is speculated that the interspecific differences in P content, C:P, and N:P are related to the food source of fish. Furthermore, muscles, lipid stores and body size may affect composition (Mozsár et al., 2018; Evangelista et al., 2020). N-rich proteins and C-rich lipids in muscle contain little P, so gaining muscle dilutes the proportion of total body P. Vrede et al. (2011) found a P content of 3.06% in whole fish and 0.94% in muscle, which was more than three times higher in whole fish compared to in muscle. Therefore, the different percentages of muscle, bone, scale, and other tissues in fish can lead to inter- and intraspecific differences in the body stoichiometry characteristics of fish.
The current study also found that the C:P and P contents, N:P, and P contents of the three fishes were significantly negatively correlated (Figure 3). In benthic animals, C:P and P content correlated negatively, as did N:P and P content (Cai et al., 2016); The C:P, P content, N:P, and P content of fish muscle in the Xiaojiang tributary of the Three Gorges Reservoir were significantly negatively correlated (Zhu et al., 2022). Our results are similar, which indicates that the changes in C:P and N:P of the three fishes were mainly determined by the changes in P content. Additionally, C:N shows a positive correlation with C content and a negative correlation with N content in all three fishes indicating that C:N was caused by the covariation trend of C and N content. The major mineral elements (Ca, P) in vertebrate bones play a key role in their nutritional physiology, and their requirements for mineral elements also affect the nutrient cycling of ecosystems. This study showed a significant positive correlation between P content and Ca content in the three fishes from the Beibu Gulf (Figure 4). It shows that the changes in P content may be associated with the formation of fish bones and scales. In fishes, the Ca content in the skeleton accounts for 79–95% of the total Ca content in the fish (Pilati and Vanni, 2007), and the skeleton of fish is mainly composed of hydroxyapatite, with the molar ratio of Ca to P at 2.16:1 (Boros et al., 2015). Therefore, we can assume that most of the Ca in the fish body comes from the skeleton, and the Ca content is highly correlated with the P content, so the development of the skeletal system mainly causes the change of the P content in fish.
Intraspecific variation of the three fishes and its influencing factors
Significant intraspecific differences in the elemental composition may exist among individuals of different populations. However, ontogeny also can play a role in explaining intraspecific differences in the elemental composition of fish (Boros et al., 2015; Villéger et al., 2017). Individuals within a species often undergo extensive changes in size and morphology throughout ontogeny, resulting in bodies with varying elemental content. This study found that the C content and C:N in three fishes from the Beibu Gulf increased with the increasing body length. With the increase in body length, only the P content of P. macrocephalus decreased, while, both C:P and N:P increased with the increase (Figure 6). For fish, C and N are generally stored in organs and muscles as lipids and proteins, respectively, with nearly half of the P retained in bones and scales (Mozsár et al., 2018; Allgeier et al., 2021). Accordingly, C, N, P content and its ratio indicate fat, protein, and bone composition in fish (Czamanski et al., 2011). Changes in C content are related to abiotic factors such as water temperature and biotic factors like food quality and growth (Pilati and Vanni, 2007). Higher water temperatures increase the metabolic rate of fish, which may reduce lipid stores. Growth causes changes in C content, and high growth rates may result in less C partitioning into lipids, with larger individuals storing more lipids. Research proved that the C:N value can more accurately reflect the fat content of the sample, and higher C:N value corresponds to higher fat content (Zhang et al., 2017). S. tumbil, P. macrocephalus and U. sulphureus showed an increase in C content with length, suggesting that they may become more fat-rich with the increase in length. In addition, spring is the spawning season for most fish. During the spawning migration of fish, C content and fat content rise with length (Zhang et al., 2004). In this study, as the body length increased, the C content of P. macrocephalus also increased, and the P content decreased, which may be due to the faster lipid synthesis than bone tissue growth during development. Furthermore, the reduction in P content with rising body size was attributed to the slower growth of bigger organisms. The GRH (Elser et al., 2003) predicted that quick-growing organisms require higher production of P-rich rRNA to meet the high protein synthesis necessary for their swift growth. In addition, body weight could alter the composition through skeletal allometry, because the proportion of bone to body weight increases with individual size (Casadevall et al., 1990; Sterner and Elser, 2002). Therefore, from the early stage of fish life to a certain period, the P content will decrease with the transcription of rRNA, and the P content in the later period may increase with the proportion of bone to body weight. However, due to the overfishing in the Beibu Gulf, the collected species tend to be miniaturized. This makes it difficult to judge the growth rate hypothesis trend of P content changes throughout the life stages of organisms based on their body size. Furthermore, the P content, N:P, and C:P of S. tumbil and U. sulphureus, did not differ significantly with body length. Consequently, individuals from different populations may have significant intraspecific differences in elemental composition, and fish stoichiometry may be species-specific. For instance, the N:P ratio of Pimephales promelas and Cyprinodon variegatus decreased with the rise of body length (Boros et al., 2015), whereas the N:P ratio of Ameiurus melas increased with the rise of body length (Hendrixson et al., 2007). Our results showed that the fish body’s elemental composition changed greatly during ontogeny. Each ontogenetic stage had its own stoichiometric signature, but the timing, magnitude and direction of ontogenetic changes can vary substantially between taxa.
In addition, an individual’s ecological niche often changes during ontogeny (Moran, 1994), which may have an important implications for elemental composition. Many species undergo discrete ontogenetic shifts in habitat use and diet that may help developing individuals to meet their changing elemental needs. All species have their optimal stoichiometry, as they utilize different food sources to meet these energy and nutrient requirements (Sterner and Elser, 2002). δ13C and δ15N are effective tools to study the material cycle and energy flow in ecosystems. In aquatic organisms, δ13C is used to trace the food source of animals while δ15N is used to estimate the trophic level of animals. Variations in δ13C values indicate different food sources among aquatic organisms (Liu et al., 2018). In marine ecosystems, fish have multiple food sources that vary widely in their food stoichiometry. The same organisms may also differ in their food sources during individual development, and hence, the intraspecific variation in fish body stoichiometry may be attributed to differences in food sources (Cross et al., 2003). Among the three fishes analyzed, N content correlated positively with δ13C (Table 2). This indicates that differences in dietary carbon sources mainly caused the intraspecific differences in the N content of the three fishes. The C content and C:P of U. sulphureus were significantly negatively correlated with δ13C, P content was significantly positively correlated with δ13C (Table 2), and had no significant correlation with body length (Figure 6), indicating that the intraspecific variation in C and P content of U. sulphureus was mainly caused by the differences in dietary carbon sources. In this study, only the N content of U. sulphureus was found to be positively correlated with δ15N (Table 2), indicating that the N content of U. sulphureus was significantly related to the trophic level of the fish, while S. tumbil, and P. macrocephalus had no significant relationship with trophic level. Ontogenetic dietary changes may also be influenced by factors unrelated to dietary element content, such as predation risk, competition and food availability (Miller and Rudolf, 2011), and these factors may also alter an individual’s elemental needs. For example, theoretical models of foraging-predation risk trade-offs suggest that predation risk can increase muscle and decrease the fat content in animals (Higginson et al., 2012), patterns which may occur in individuals whose diet shifts are driven by trade-offs between foraging and predation risk.
The nutritional status of the water would affect the composition of basic resources and bait, and then directly or indirectly affect the elemental content of consumers. Studies have shown that changes in the quality of basic resources limit the content of elements at higher trophic levels, and the changes not only affect primary consumers but also impact multiple trophic levels (Small and Pringle, 2010). For instance, water eutrophication can affect the stoichiometric characteristics of omnivorous fish (Mäkelin and Villnäs, 2022). However, this study found that most of the elements in the three fishes did not correlate with the nutrient indicators of the water, and the elemental contents of the three fishes weren’t significantly different between different sites (Table 3). Nutrient status parameters in the water reflect the food elemental composition to a certain extent. Studies have shown that N:P in the water positively correlates with N:P of phytoplankton and attached algae (Stelzer and Lamberti, 2002; Hall et al., 2005). Therefore, the nutrient salt parameters in this study also reflect the potential food quality of different sites in the Beibu Gulf to a certain extent, and also indicate that the correlation between nutrient salt parameters and fish elemental composition is weak. On the one hand, the measured nutrient salt parameters only represent a certain period and do not reflect the food quality of the three fishes from the Beibu Gulf throughout their growth stages; On the other hand, the nutritional parameters do not fully represent the growth status and distribution characteristics of producers, as the growth of phytoplankton and attached algae may be limited by other factors together (e.g., temperature, or trace elements). Furthermore, the three fishes are carnivorous with a wide variety of food and have a large range of activities in the sea (Zhu et al., 2022). Also, since they often inhabit seawater’s bottom or lower middle layer, they are less affected by the surface water quality parameters.
We generally classify consumers into two categories according to their adaptation strategies: the first category is regulators, in which organisms maintain their own elemental homeostasis through various metabolic activities. The other category is conformers, in which organisms’ elemental composition varies with their environment (non-homeostasis). However, adaptation also has a certain range, and no organism can reach an arbitrary non-homeostasis and survive, although organisms with the latter strategy are more likely to survive in a diverse environment (Cai et al., 2015). In addition, every organism changes during the development and formation of its own body, these changes are not inconsistent with homeostasis. Every organism changes during the juvenile phase in order to build the adult body in an optimal way. In this study, for the analysis of the relationship between elemental contents, ratios and δ13C, partial correlation analysis was used, with individual size as a covariate, and the influence of individual size was excluded. Our results indicated that the three fishes were not in strict homeostasis, and their elemental composition varied dynamically to a certain extent with different food sources and habitat. During ontogeny, these aquatic consumers undergo morphological and dietary changes that alter their stoichiometry. Although each fish species may adjust its own stoichiometry in a homeostatic manner; however, not all fish have the same elemental composition. Contrarily, fish nutrient composition analysis has revealed significant inter- and intraspecific variation in the content of various elements across species, particularly P (McIntyre and Flecker, 2010).
Conclusion
Our results concludes that the three fishes (S. tumbil, P. macrocephalus, and U. sulphureus) from the Beibu Gulf were not in strict homeostasis, and their elemental composition varied dynamically to a certain extent with different food sources and habitats. Significant intra- and inter-specific differences existed in the body stoichiometry of the three fishes, and their elemental composition changed considerably during ontogeny. Each ontogenetic stage has its own stoichiometric signature, but the timing, magnitude and direction of ontogenetic changes can vary substantially between taxa. Our results provide evidence for species specificity in fish body stoichiometry, which is largely determined by feeding habits, ontogeny, and morphological traits. In this type of research, fish are excellent vertebrate models, but there is still a need to learn more about animals’ ontogeny. We, therefore, urge further study of intra- and interspecific differences in bioecological stoichiometry, comprising all ontogenetic stages across a wider range of terrestrial and aquatic taxa.
Data availability statement
The original contributions presented in this study are included in the article/supplementary material, further inquiries can be directed to the corresponding author.
Ethics statement
This animal study was reviewed and approved by the Guilin University of Technology.
Author contributions
CW: conceptualization, sampling, sample analysis, and writing. LH: conceptualization, sampling, sample analysis, and revising the manuscript. LZ: sampling, sample analysis, and draft preparation. HX and AS: data management and editing. PX, XH, YY, XY, and BK: conceptualization. All authors contributed to the article and approved the submitted version.
Funding
This study was financially supported by the National Natural Science Foundation of China (U20A2087) and the Key Research and Development Program of Guangxi (Guike AB22035050).
Acknowledgments
We thank the Guangxi Key Laboratory of Beibu Gulf Marine Biodiversity Conservation, Beibu Gulf University (2022KA01) and the two reviewers for the revision of the manuscript.
Conflict of interest
The authors declare that the research was conducted in the absence of any commercial or financial relationships that could be construed as a potential conflict of interest.
Publisher’s note
All claims expressed in this article are solely those of the authors and do not necessarily represent those of their affiliated organizations, or those of the publisher, the editors and the reviewers. Any product that may be evaluated in this article, or claim that may be made by its manufacturer, is not guaranteed or endorsed by the publisher.
References
Allgeier, J. E. (2021). Nutrient stoichiometry of fishes and invertebrates in coastal marine Caribbean ecosystems. Ecology 102:e03533. doi: 10.1002/ecy.3533
Allgeier, J. E., Weeks, B. C., Munsterman, K. S., Wale, N., Wenger, S. J., Parravicini, V., et al. (2021). Phylogenetic conservatism drives nutrient dynamics of coral reef fishes. Nat. Commun. 12:5432. doi: 10.1038/s41467-021-25528-0
Allgeier, J. E., Wenger, S., and Layman, C. A. (2020). Taxonomic identity best explains variation in body nutrient stoichiometry in a diverse marine animal community. Sci. Rep. 10:13718. doi: 10.1038/s41598-020-67881-y
Andersen, T., Elser, J. J., and Hessen, D. O. (2004). Stoichiometry and population dynamics. Ecol. Lett. 7, 884–900. doi: 10.1111/j.1461-0248.2004.00646.x
Benstead, J. P., Hood, J. M., Whelan, N. V., Kendrick, M. R., Nelson, D., Hanninen, A. F., et al. (2014). Coupling of dietary phosphorus and growth across diverse fish taxa: A meta-analysis of experimental aquaculture studies. Ecology 95, 2768–2777. doi: 10.1890/13-1859.1
Boros, G., Jyväsjärvi, J., Takács, P., Mozsár, A., Tátrai, I., Søndergaard, M., et al. (2012). Between-lake variation in the elemental composition of roach (Rutilus rutilus L.). Aquatic Ecol. 46, 385–394. doi: 10.1007/s10452-012-9402-3
Boros, G., Sály, P., and Vanni, M. J. (2015). Ontogenetic variation in the body stoichiometry of two fish species. Oecologia 179, 329–341. doi: 10.1007/s00442-015-3349-8
Bristow, L. A., Mohr, W., Ahmerkamp, S., and Kuypers, M. M. M. (2017). Nutrients that limit growth in the ocean. Curr. Biol. 27, R474–R478. doi: 10.1016/j.cub.2017.03.030
Cai, Y., Xue, Q., Lu, Y., and Gong, Z. (2015). C:N:Pstoichiometry of five common macrozoobenthic taxa in shallow lakes along the Yangtze river. J. Lake Sci. 27, 76–85. doi: 10.18307/2015.0110
Cai, Y., Xue, Q., Xu, J., Zhang, L., Gong, Z., and Acharya, K. (2016). Widespread natural intraspecific variation in tissue stoichiometry of two freshwater molluscs: Effect of nutrient enrichment. Ecol. Indicat. 66, 583–591. doi: 10.1016/j.ecolind.2016.02.022
Casadevall, M., Casinos, A., Viladiu, C., and Ontanon, M. (1990). Scaling of skeletal mass and mineral content in teleosts. Zool. Anzeiger 225, 144–150.
Cross, W. F., Benstead, J. P., Rosemond, A. D., and Wallace, J. B. (2003). Consumer-resource stoichiometry in detritus-based streams. Ecol. Lett. 6, 721–732. doi: 10.1046/j.1461-0248.2003.00481.x
Czamanski, M., Nugraha, A., Pondaven, P., Lasbleiz, M., Masson, A., Caroff, N., et al. (2011). Carbon, nitrogen and phosphorus elemental stoichiometry in aquacultured and wild-caught fish and consequences for pelagic nutrient dynamics. Mar. Biol. 158, 2847–2862. doi: 10.1007/s00227-011-1783-7
Davis, J. A., and Boyd, C. E. (1978). Concentrations of selected elements and ash in bluegill (Lepomis macrochirus) and certain other freshwater fish. Trans. Am. Fish. Soc. 107, 862–867. doi: 10.1577/1548-86591978107<862:COSEAA<2.0.CO;2
Deng, Y. J., Yi, M. Y., Li, B., Liu, S. B., Qiu, K. W., Shen, C. H., et al. (2021). Biological characteristics and inter-annual changes of saurida tumbil in spring in the Beibu Gulf, South China Sea. Prog. Fishery Sci. 40, 61–68. doi: 10.16441/j.cnki.hdxb.2010.06.009
Dodds, W. K. (2007). Trophic state, eutrophication and nutrient criteria in streams. Trends Ecol. Evol. 22, 669–676. doi: 10.1016/j.tree.2007.07.010
El-Sabaawi, R. W., Travis, J., Zandonà, E., McIntyre, P. B., Reznick, D. N., and Flecker, A. (2014). Intraspecific variability modulates interspecific variability in animal organismal stoichiometry. Ecol. Evol. 4, 1505–1515. doi: 10.1002/ece3.981
El-Sabaawi, R. W., Zandonà, E., Kohler, T. J., Marshall, M. C., Moslemi, J. M., Travis, J., et al. (2012). Widespread intraspecific organismal stoichiometry among populations of the Trinidadian guppy. Func. Ecol. 26, 666–676. doi: 10.1111/j.1365-2435.2012.01974.x
Elser, J. J., Acharya, K., Kyle, M., Cotner, J., Makino, W., Markow, T., et al. (2003). Growth rate-stoichiometry couplings in diverse biota. Ecol. Lett. 6, 936–943. doi: 10.1046/j.1461-0248.2003.00518.x
Elser, J. J., and Urabe, J. (1999). The stoichiometry of consumer-driven nutrient recycling: Theory, observations, and consequences. Ecology 80, 735–751.
Evangelista, C., Diaz Pauli, B., Vøllestad, L. A., and Edeline, E. (2020). Stoichiometric consequences of size-selective mortality: An experimental test using the Japanese medaka (Oryzias latipes). Sci. Total Environ. 724:138193. doi: 10.1016/j.scitotenv.2020.138193
Fernández-Martínez, M. (2022). From atoms to ecosystems: Elementome diversity meets ecosystem functioning. New Phytol. 234, 35–42. doi: 10.1111/nph.17864
Filipiak, M., and Filipiak, Z. M. (2022). Application of ionomics and ecological stoichiometry in conservation biology: Nutrient demand and supply in a changing environment. Biol. Conserv. 272:109622. doi: 10.1016/j.biocon.2022.109622
Glibert, P. M., Fullerton, D., Burkholder, J. M., Cornwell, J. C., and Kana, T. M. (2011). Ecological stoichiometry, biogeochemical cycling, invasive species, and aquatic food webs: San Francisco estuary and comparative systems. Rev. Fish. Sci. 19, 358–417. doi: 10.1080/10641262.2011.611916
González, A. L., Dézerald, O., Marquet, P. A., Romero, G. Q., and Srivastava, D. S. (2017). The multidimensional stoichiometric niche. Front. Ecol. Evol. 5:110. doi: 10.3389/fevo.2017.00110
González, A. L., Farina, J. M., Kay, A. D., Pinto, R., and Marquet, P. A. (2011). Exploring patterns and mechanisms of interspecific and intraspecific variation in body elemental composition of desert consumers. Oikos 120, 1247–1255. doi: 10.1111/j.1600-0706.2010.19151.x
González, A. L., Kominoski, J. S., Danger, M., Ishida, S., Iwai, N., and Rubach, A. (2010). Can ecological stoichiometry help explain patterns of biological invasions? Oikos 119, 779–790. doi: 10.1111/j.1600-0706.2009.18549.x
Hall, S. R., Smith, V. H., Lytle, D. A., and Leibold, M. A. (2005). Constraints on primary producer N:P stoichiometry along N:P supply ratio gradients. Ecology 86, 1894–1904. doi: 10.1890/04-1045
Hendrixson, H. A., Sterner, R. W., and Kay, A. D. (2007). Elemental stoichiometry of freshwater fishes in relation to phylogeny, allometry and ecology. J. Fish Biol. 70, 121–140. doi: 10.1111/j.1095-8649.2006.01280.x
Higginson, A. D., McNamara, J. M., and Houston, A. I. (2012). The starvation-predation trade-off predicts trends in body size, muscularity, and adiposity between and within taxa. Am. Nat. 179, 338–350. doi: 10.1086/664457
Jeyasingh, P. D., Cothran, R. D., and Tobler, M. (2014). Testing the ecological consequences of evolutionary change using elements. Ecol. Evol. 4, 528–538. doi: 10.1002/ece3.950
Kaspari, M. (2021). The invisible hand of the periodic table: How micronutrients shape ecology. Annu. Rev. Ecol. Evol. Syst. 52, 199–219. doi: 10.1146/annurev-ecolsys-012021-090118
Kaspari, M., and Powers, J. S. (2016). Biogeochemistry and geographical ecology: Embracing all twenty-five elements required to build organisms. Am. Nat. 188, S62–S73. doi: 10.1086/687576
Le Mézo, P., Guiet, J., Scherrer, K., Bianchi, D., and Galbraith, E. (2022). Global nutrient cycling by commercially targeted marine fish. Biogeosciences 19, 2537–2555. doi: 10.5194/bg-19-2537-2022
Leal, M. C., Seehausen, O., and Matthews, B. (2017). The ecology and evolution of stoichiometric phenotypes. Trends Ecol. Evol. 32, 108–117. doi: 10.1016/j.tree.2016.11.006
Liu, L., Hu, J., Chen, X., Xu, X., Yang, Y., and Ni, J. (2022). Adaptation strategy of karst forests: Evidence from the community-weighted mean of plant functional traits. Ecol. Evol. 12:e8680. doi: 10.1002/ece3.8680
Liu, X. H., Liu, D. Y., Wang, Y. J., Shi, Y. J., Wang, Y. X., and Sun, X. Y. (2019). Temporal and spatial variations and impact factors of nutrients in Bohai Bay, China. Mar. Poll. Bull. 140, 549–562. doi: 10.1016/j.marpolbul.2019.02.011
Liu, Y., Liu, G., Yuan, Z., Liu, H., and Lam, P. K. S. (2018). Heavy metals (As, Hg and V) and stable isotope ratios (δ13C and δ15N) in fish from Yellow River Estuary, China. Sci. Total Environ. 61, 462–471. doi: 10.1016/j.scitotenv.2017.09.088
Lourenço-Amorim, C., Neres-Lima, V., Moulton, T. P., Sasada-Sato, C. Y., Oliveira-Cunha, P., and Zandonà, E. (2014). Control of periphyton standing crop in an Atlantic Forest stream: The relative roles of nutrients, grazers and predators. Freshw. Biol. 59, 2365–2373. doi: 10.1111/fwb.12441
Mäkelin, S., and Villnäs, A. (2022). Food sources drive temporal variation in elemental stoichiometry of benthic consumers. Limnol. Oceanogr. 67, 784–799. doi: 10.1002/lno.12034
McIntyre, P. B., and Flecker, A. S. (2010). Ecological stoichiometry as an integrative framework in stream fish ecology. Am. Fish. Soc. Symp. 73, 539–558.
Miller, T. E. X., and Rudolf, V. H. W. (2011). Thinking inside the box: Community-level consequences of stage-structured populations. Trends Ecol. Evol. 26, 457–466. doi: 10.1016/j.tree.2011.05.005
Moore, C. M., Mills, M. M., Arrigo, K. R., Berman-Frank, I., Bopp, L., Boyd, P. W., et al. (2013). Processes and patterns of oceanic nutrient limitation. Nat. Geosci. 6, 701–710. doi: 10.1038/ngeo1765
Moran, N. A. (1994). Adaptation and constraint in the complex life cycles of animals. Annu. Rev. Ecol. Syst. 25, 573–600. doi: 10.1146/ANNUREV.ES.25.110194.003041
Mozsár, A., Sály, P., Antal, L., Nagy, S. A., and Boros, G. (2018). Organismal stoichiometry at the temporal scale: Seasonal variability shapes interspecific differences in fish. Freshw. Biol. 64, 244–254. doi: 10.1111/fwb.13213
Nessel, M. P., Konnovitch, T., Romero, G. Q., and González, A. L. (2021). Nitrogen and phosphorus enrichment cause declines in invertebrate populations: A global meta-analysis. Biol. Rev. Cambridge Philos. Soc. 96, 2617–2637. doi: 10.1111/brv.12771
Nie, Z., Liang, X., Xing, B., Ye, Y., Qian, Y., Yu, Y., et al. (2012). The current water trophic status in Tiaoxi River of Taihu Lake watershed and corresponding coping strategy based on N/P ratio analysis. Acta Ecol. Sin. 32, 48–55. doi: 10.5846/stxb201011171637
Niu, Z. Y., Xu, Y. H., Wang, P. L., Liao, Y. Y., Wu, H. P., Huang, G., et al. (2018). Survey of fisheries resources and biodiversity in China-Vietnam collective fishery zone in autumn by a bottom trawl. Fish. Sci. 37, 640–646. doi: 10.16378/j.cnki.1003-1111.2018.05.010
Pacioglu, O., Amãrioarei, A., Duţu, L. T., Plãvan, G., Iţcuş, C., Plãvan, O., et al. (2021). The structure and functionality of communities and food webs in streams along the epigean–hypogean continuum: Unifying ecological stoichiometry and metabolic theory of ecology. Aquatic Sci. 83:63. doi: 10.1007/s00027-021-00815-6
Peñuelas, J., Fernández-Martínez, M., Ciais, P., Jou, D., Piao, S., and Obersteiner, M. (2019). The bioelements, the elementome, and the biogeochemical niche. Ecology 100:e02652. doi: 10.1002/ecy.2652
Pilati, A., and Vanni, M. J. (2007). Ontogeny, diet shifts, and nutrient stoichiometry in fish. Oikos 116, 1663–1674. doi: 10.1111/j.2007.0030-1299.15970.x
Qiao, Y., and Li, Z. (2007). The relationship between the main features of land form, the distritubton of bottom sediment and fishery distribution. Trans. Oceanol. Limnol. S1, 232–238. doi: 10.13984/j.cnki.cn37-1141.2007.s1.030
Regnier, P., Friedlingstein, P., Ciais, P., Mackenzie, F. T., Gruber, N., Janssens, I. A., et al. (2013). Anthropogenic perturbation of the carbon fluxes from land to ocean. Nat. Geosci. 6, 597–607. doi: 10.1038/ngeo1830
Sardans, J., Janssens, I. A., Ciais, P., Obersteiner, M., and Peñuelas, J. (2021). Recent advances and future research in ecological stoichiometry. Perspect. Plant Ecol. Evol. Syst. 50:125611. doi: 10.1016/j.ppees.2021.125611
Sardans, J., Rivas-Ubach, A., and Peñuelas, J. (2012). The elemental stoichiometry of aquatic and terrestrial ecosystems and its relationships with organismic lifestyle and ecosystem structure and function: A review and perspectives. Biogeochemistry 111, 1–39. doi: 10.1007/s10533-011-9640-9
Schade, J. D., Espeleta, J. F., Klausmeier, C. A., McGroddy, M. E., Thomas, S. A., and Zhang, L. (2005). A conceptual framework for ecosystem stoichiometry: Balancing resource supply and demand. Oikos 109, 40–51. doi: 10.1111/j.0030-1299.2005.14050.x
Small, G. E., and Pringle, C. M. (2010). Deviation from strict homeostasis across multiple trophic levels in an invertebrate consumer assemblage exposed to high chronic phosphorus enrichment in a Neotropical stream. Oecologia 162, 581–590. doi: 10.1007/s00442-009-1489-4
Stelzer, R. S., and Lamberti, G. A. (2002). Ecological stoichiometry in running waters: Periphyton chemical composition and snail growth. Ecology 83, 1039–1051.
Sterner, R. W. (1997). Modelling interactions of food quality and quantity in homeostatic consumers. Freshw. Biol. 38, 473–481. doi: 10.1046/j.1365-2427.1997.00234.x
Sterner, R. W., and Elser, J. J. (2002). Ecological stoichiometry: The biology of elements from molecules to the biosphere. Princeton, NJ: Princeton Univ: Press.
Sterner, R. W., and George, N. B. (2000). Carbon, nitrogen, and phosphorus stoichiometry of cyprinid fishes. Ecology 81, 127–140. doi: 10.2307/177139
Sterner, R. W., and Hessen, D. O. (1994). Algal nutrient limitation and the nutrition of aquatic herbivores. Annu. Rev. Ecol. Syst. 25, 1–29. doi: 10.1146/annurev.es.25.110194.000245
Sullam, K. E., Dalton, C. M., Russell, J. A., Kilham, S. S., El-Sabaawi, R., German, D. P., et al. (2015). Changes in digestive traits and body nutritional composition accommodate a trophic niche shift in Trinidadian guppies. Oecologia 177, 245–257. doi: 10.1007/s00442-014-3158-5
Sun, P., Li, X., Gong, X., Liu, Y., Zhang, X., and Wang, L. (2014). Carbon, nitrogen and phosphorus ecological stoichiometry of Lateolabrax macultus and Acanthogobius ommaturus in the Estuary of Yangtze River, China. Acta Ecol. Sin. 34, 196–203. doi: 10.1016/j.chnaes.2013.06.009
Tanner, D. K., Brazner, J. C., and Brady, V. J. (2000). Factors influencing carbon, nitrogen, and phosphorus content of fish from a Lake Superior coastal wetland. Can. J. Fish. Aquatic Sci. 57, 1243–1251. doi: 10.1139/cjfas-57-6-1243
Vanni, M. J., Flecker, A. S., Hood, J. M., and Headworth, J. L. (2002). Stoichiometry of nutrient recycling by vertebrates in a tropical stream: Linking species identity and ecosystem processes. Ecol. Lett. 5, 285–293. doi: 10.1046/j.1461-0248.2002.00314.x
Vanni, M. J., Layne, C. D., and Arnott, S. E. (1997). “Top–down” trophic interactions in lakes: Effects of fish on nutrient dynamics. Ecology 78, 1–20. doi: 10.1890/0012-96581997078[0001:TDTIIL]2.0.CO;2
Villar-Argaiz, M., López-Rodríguez, M. J., and Tierno de Figueroa, J. M. (2020). Body P content increases over ontogeny in hemimetabolous macroinvertebrates in a Mediterranean high mountain stream. Aquatic Ecol. 54, 1185–1200. doi: 10.1007/s10452-020-09802-9
Villéger, S., Brosse, S., Mouchet, M., Mouillot, D., and Vanni, M. J. (2017). Functional ecology of fish: Current approaches and future challenges. Aqu. Sci. 79, 783–801. doi: 10.1007/s00027-017-0546-z
Vrede, T., Drakare, S., Eklöv, P., Hein, A., Liess, A., Olsson, J., et al. (2011). Ecological stoichiometry of Eurasian perch – intraspecific variation due to size, habitat and diet. Oikos 120, 886–896. doi: 10.1111/j.1600-0706.2010.18939.x
Wang, X., Qiu, Y., Du, F., Liu, W. D., Sun, D. R., Chen, X., et al. (2019). Roles of fishing and climate change in long-term fish species succession and population dynamics in the outer Beibu Gulf, South China Sea. Acta Oceanol. Sin. 38, 1–8. doi: 10.1007/s13131-019-1484-5
Wang, Z., Cébron, A., Baillard, V., and Danger, M. (2022). Nitrogen to phosphorus ratio shapes the bacterial communities involved in cellulose decomposition and copper contamination alters their stoichiometric demands. FEMS Microbiol. Ecol. 98:fiac107. doi: 10.1093/femsec/fiac107
Wardle, D. A., Walker, L. R., and Bardgett, R. D. (2004). Ecosystem properties and forest decline in contrasting long-term chronosequences. Science 305, 509–513. doi: 10.1126/science.1098778
Zhang, H., Zhang, B., Jin, X., and Zhao, X. (2004). Seasonal variations in energy content of anchovy (Engraulis japonicus) in the Yellow Sea. Mar. Fish. Res. 25, 7–12. doi: 10.1007/s13131-012-0229-5
Zhang, K., Chang, L., Li, G., and Li, Y. (2022). Advances and future research in ecological stoichiometry under saline-alkali stress. Environ. Sci. Poll. Res. 30, 5475–5486. doi: 10.1007/s11356-022-24293-x
Zhang, Y., Li, C., Yang, G., Wang, Y., Tao, Z., Zhang, Y., et al. (2017). Ontogenetic diet shift in Antarctic krill (Euphausia superba) in the Prydz Bay: A stable isotope analysis. Acta Oceanol. Sin. 36, 67–78. doi: 10.1007/s13131-017-1049-4
Keywords: ecological stoichiometry, marine fish, ontogenetic variation, stable isotope, Beibu Gulf
Citation: Wang C, Zhu L, Huang L, Xu H, Xu P, He X, Yan Y, Yang X, Shahab A and Kang B (2023) Ecological stoichiometric characteristics of three dominant fish species from the Beibu Gulf: inter- and intraspecific variations. Front. Ecol. Evol. 11:1176052. doi: 10.3389/fevo.2023.1176052
Received: 28 February 2023; Accepted: 22 May 2023;
Published: 07 June 2023.
Edited by:
Carla Mucignat, University of Padua, ItalyReviewed by:
Michał Filipiak, Jagiellonian University, PolandPriscila Oliveira- Cunha, Rio de Janeiro State University, Brazil
Copyright © 2023 Wang, Zhu, Huang, Xu, Xu, He, Yan, Yang, Shahab and Kang. This is an open-access article distributed under the terms of the Creative Commons Attribution License (CC BY). The use, distribution or reproduction in other forums is permitted, provided the original author(s) and the copyright owner(s) are credited and that the original publication in this journal is cited, in accordance with accepted academic practice. No use, distribution or reproduction is permitted which does not comply with these terms.
*Correspondence: Liangliang Huang, bGxodWFuZ0BnbHV0LmVkdS5jbg==