Abstract
Lamina dry mass (LDM) per unit area is an important plant functional trait. However, it is time-consuming to dry leaves in practice. Previous studies have demonstrated that lamina fresh mass (LFM) is approximately proportional to LDM for some broad-leaved plants. However, those studies largely overlooked the influence of leaf age on the proportional relationship, and leaves were sampled without distinguishing age. In the present study, we used eight leaf-age groups of Photinia serratifolia to test whether LDM is proportional to LFM. And we also compared the two linear equations (y = a + bx, and y = a + x, where x = ln LFM, y = ln LDM, a and b are constants to be estimated) to test whether the introduction of parameter b is worthwhile based on the percent error of the goodness-of-fit between the two equations. There were four of eight leaf-age groups whose 95% confidence intervals (CIs) for b included unity, and for the other four leaf-age groups the difference between the lower limit of the 95% CI and unity was smaller than 0.03, supporting the validity of the LDM vs. LFM proportional relationship. Additionally, the percent errors between the two equations for the eight leaf-age groups were all smaller than 5%, which further supports the hypothesis of a proportional relationship at the individual leaf-age group level. However, the LDM/LFM ratio exhibited a non-linear (quadratic) function of time, which indicates that the intercept, a, depends upon leaf age.
Introduction
Leaves are the primary organs of photosynthesis in plants and play a critical role in carbon assimilation and nutrient cycling in terrestrial ecosystems. The physiological and ecological functions of leaves are closely related to their structure and chemical composition. Lamina dry mass per unit area, which is the quotient of lamina dry mass (LDM) and lamina area, and its reciprocal, specific leaf area, both can be used to quantify the leaf-level cost of light interception (Gutschick and Wiegel, 1988; Poorter et al., 2009). The two measures have been widely applied to plant ecology as one of the plant functional traits (Pérez-Harguindeguy et al., 2013). Lamina area of broad-leaved plants can be rapidly estimated using smartphone-based application software or measured values of lamina length and width (Schrader et al., 2017, 2021). However, it is inconvenient and time-consuming to collect many leaf samples in the field and take them back to the laboratory to dry them using a ventilated oven. In contrast, it is relatively easy to measure lamina fresh mass (LFM) outdoors, because small-sized electronic balances are available and portable. Utilizing a proportional (or an approximately proportional) relationship between LDM and LFM for many broad-leaved plants (Huang et al., 2019a,b; Liu et al., 2020; Guo et al., 2021), LFM can be directly used to represent or approximately estimate LDM. However, these above-cited prior studies did not consider the influence of leaf age on the scaling relationship between LDM and LFM. There is a wide variation in leaf lifespan for evergreen broad-leaved plants in tropical and sub-tropical forests (Lusk, 2019). Leaf age can significantly affect the ratio of lamina dry mass to fresh mass, and lamina dry mass per unit area (Jiao et al., 2022), but these prior studies used mixed leaf samples without distinguishing leaf age, thereby largely overlooking the influence of leaf age on the relationship between LDM and LFM.
In this context, we selected an evergreen Rosaceae species, Photinia serratifolia, and studied the temporal variation in the ratio of LDM to LFM and their relationship across different months. Our goal was to explore the influence of leaf age on the scaling relationship between LDM and LFM. We continuously sampled the leaves from April to November, which allowed us to test the influence of leaf age on the relationship between LDM and LFM among different leaf-age groups. Our study not only provides new insights into the functional traits of leaves but also has important implications for the management and conservation of plant species and ecosystems. In addition, we evaluated the validity of a simple linear equation with slope = 1 in describing the LDM vs. LFM relationship on a log-log scale. Our findings have practical applications for estimating LDM from LFM using small-sized electronic balances in the field. Finally, we discussed the potential use of our results in the context of human health, as the leaves of P. serratifolia contain abundant ursolic acid, a compound that has been shown to have anti-inflammatory and anti-tumor properties (Guo et al., 1998; Chen et al., 2020). In the present study, we mainly aimed to test whether LDM is proportional to LFM. If the proportional relationship holds true, it is helpful to fast quantify leaf biomass using LFM in a simple manner.
Materials and methods
Three individual trees of P. serratifolia growing in Nanjing Forestry University campus (118°48′35″ E, 32°4′67″ N) were selected. The trees are all over 30 years old, and are 4.3, 8.4, and 9.1 m high, respectively. Because these trees are growing next to teaching buildings, less than 150 m away from each other the environments are approximately homogeneous. The branches of the newly emerging leaves on the three trees were fastened by small paper drop tags in late February to early March 2021, and then we randomly sampled 320–350 leaves from the trees in the middle of each month (see Zheng et al., 2022 for details). The sampled leaves were wrapped by wet paper, which was moistened with water, and taken back to the lab within half an hour. Within <48 h we removed the petioles, absorbed any surface water with toilet paper, and used an electronic balance (Type: ML 204; Mettler Toledo Company, Greifensee, Switzerland; measurement accuracy 0.0001 g) to measure LFM in grams. We then dried the fresh leaves in an oven [Type: XMTD-8222; Jinghong Experimental Equipment Co., Ltd., Shanghai, China; ± (0.5% F.S. + 1 digit)] at 80°C for 48 h to obtain constant LDM.
Analysis of variance (ANOVA) with a 0.05 significance level was used to test whether leaf age significantly affected the ratio of lamina dry mass to lamina fresh mass (i.e., LDM/LFM). If a significant effect of leaf age on the LDM/LFM ratio was found, we used Tukey’s honestly significance difference test with a significance level of 0.05 (Hsu, 1996) to test the significance of the difference between any two leaf-age groups in the LDM/LFM ratio. To test whether leaf age has a curvilinear effect on the LDM/LFM ratio, we used a parabolic equation to fit the data of LDM/LFM ratio vs. month, and tested whether the quadratic term was statistically significant:
where α0, α1, and α2 are parameters to be estimated, and “Month” is the numeric predictor variable. We used the “lm” function based on the statistical software R (version 4.2.0; R Core Team, 2022) to carry out the data fitting, and evaluated the goodness of fit using the coefficient of determination, i.e., r2.
To test whether LDM is proportional to LFM, we used reduced major axis protocols (i.e., Model II regression) to estimate the intercept and slope of the following linear equation (Quinn and Keough, 2002; Niklas et al., 2007):
where y = ln LDM, x = ln LFM, a and b are constants to be estimated. The log-transformation for leaf biomass is to stabilize its variance. The estimated slope of LDM vs. LFM on a log-log scale using Model II regression is symmetric to that of LFM vs. LDM on a log-log scale, i.e., the former equals the reciprocal of the latter. However, Model I regression based on least-squares protocols cannot ensure such a symmetry, and the slope of LDM vs. LFM is not equal to the reciprocal of the slope of LFM vs. LDM (Quinn and Keough, 2002). If LDM is proportional to LFM, LFM should be also proportional to LDM, which requires the symmetry of the two slopes. Thus, there is a need to use Model II regression rather than Model I regression.
If LDM is proportional to LFM, b should be equal to 1. Thus, we also used the following linear equation to fit the LDM vs. LFM data on a log-log scale:
where the slope b is fixed to equal 1. The bootstrap percentile method was used to calculate the 95% confidence interval (CI) of the slope in equation 2 for each of different leaf-age groups (Efron and Tibshirani, 1993; Sandhu et al., 2011). If the 95% CI of the slope included unity, the proportional relationship between LDM and LFM was verified; if it did not includes unity, the proportional relationship hypothesis was rejected. Nevertheless, in practice, if the difference between the lower or upper limit of the 95% CI of the slope and unity did not exceed 0.05, the two variables were considered to have an approximately proportional relationship. To further examine whether to fix the slope to 1 is better, which signifies a proportional relationship between LDM and LFM, we calculated the percent error (PE) of the total error areas (TEAs) in the Model II regression between the two linear equations 1 and 2:
where the subscripts 1 and 2 represent TEA of equation 2 and that of equation 3, respectively. Here, the TEA was calculated by the following formula:
where the subscript i represents the i-th observation and n represents the number of data points; and are the estimated values of the intercept and slope by the reduced major axis protocols, respectively. Model II regression estimates the two parameters by minimizing TEA, which represents the summed area of the triangles formed by the regression line with each observation in the plane (Quinn and Keough, 2002). Because the slope of equation 2 is a parameter to be estimated which renders equation 2 to be more flexible than equation 3 fixing the slope to 1 in data fitting, the TEA of equation 3 should be larger than or equal to that of equation 2, i.e., equation 2 should have a better (or at least the same) goodness of fit than equation 3. Thus, there is no need to add an absolute value sign in equation 4 given TEA2–TEA1 ≥ 0. As a rule of thumb, for any two equations with a similar model structure, the equation with fewer parameters is considered to be better if the PE of the goodness of fit between the two equations is smaller than 5%, whereas it is considered worthwhile to use the equation with more parameters if PE is greater than 5%. If PE >5%, an allometric relationship between LDM and LFM was considered to hold true. In other words, the comparison of equations 2 and 3 was used to test whether an allometric or proportional relationship between the two leaf mass measures holds true.
The statistical software R (version 4.2.0; R Core Team, 2022) was used to carry out all calculations and tests.
Results
There were significant differences in the LDM/LFM ratio among different leaf-age groups, and leaf age had a significant quadratic effect on the LDM/LFM ratio (p < 0.05; Figure 1). There was a significant linear relationship between LDM and LFM for each of the eight leaf-age groups (r2 > 0.94; Figure 2). Four out of the eight leaf-age groups had 95% confidence intervals (CIs) that included unity, and for the remaining four leaf-age groups the difference between the lower limit of the 95% CI and unity was smaller than 0.03 (Figure 2). The percent errors (PE) of the total error areas between the two linear equations (i.e., equations 2 and 3) was smaller than 5% for each leaf-age group. This means that equation 3 (i.e., the simple linear equation with slope = 1) is better than equation 2 in describing the relationship between LDM and LFM on a log-log scale based on the tradeoff between goodness of fit and model structure complexity. In other words, it is better to describe a proportional relationship between LDM and LFM than an allometric relationship between the two leaf biomass measures.
FIGURE 1
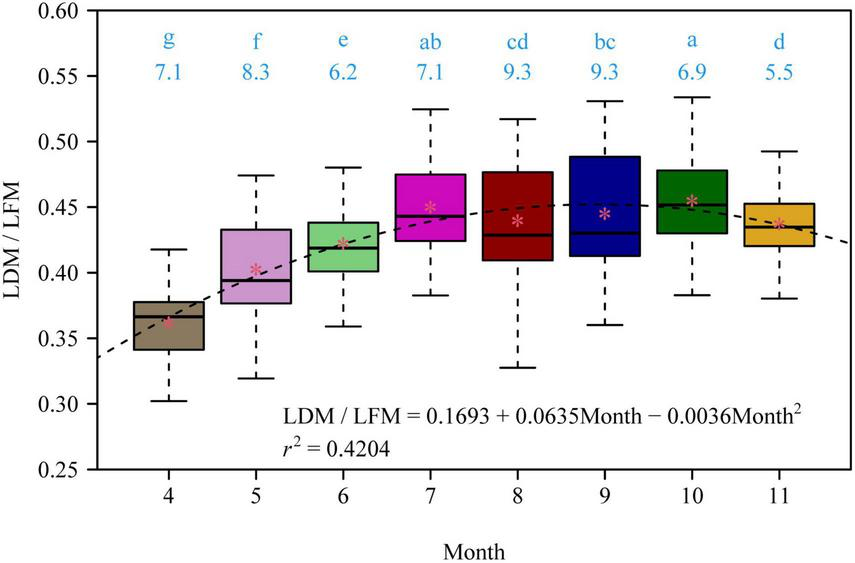
The variation of the ratio of lamina dry mass to lamina fresh mass (LDM/LFM) of Photinia serratifolia across different months. The lowercase letters show the significance of the difference between any two of the eight leaf-age groups; the numbers below the lowercase letters are the coefficients of variation in LDM/LFM. There was a significant difference (p < 0.05) between any two leaf-age groups that did not share the same letter, and there was no significant difference (p > 0.05) between any two leaf-age groups that shared the same letter based on Tukey’s HSD test with the 0.05 significance level. The asterisks represent the mean LDM/LFM for each leaf-age group; the dashed line is the regression curve of the parabolic equation of LDM/LFM vs. Month; r2 is the coefficient of determination of the multiple linear regression (assuming Month2 as another predictor); all coefficients in the parabolic equation are statistically significant (p < 0.05).
FIGURE 2
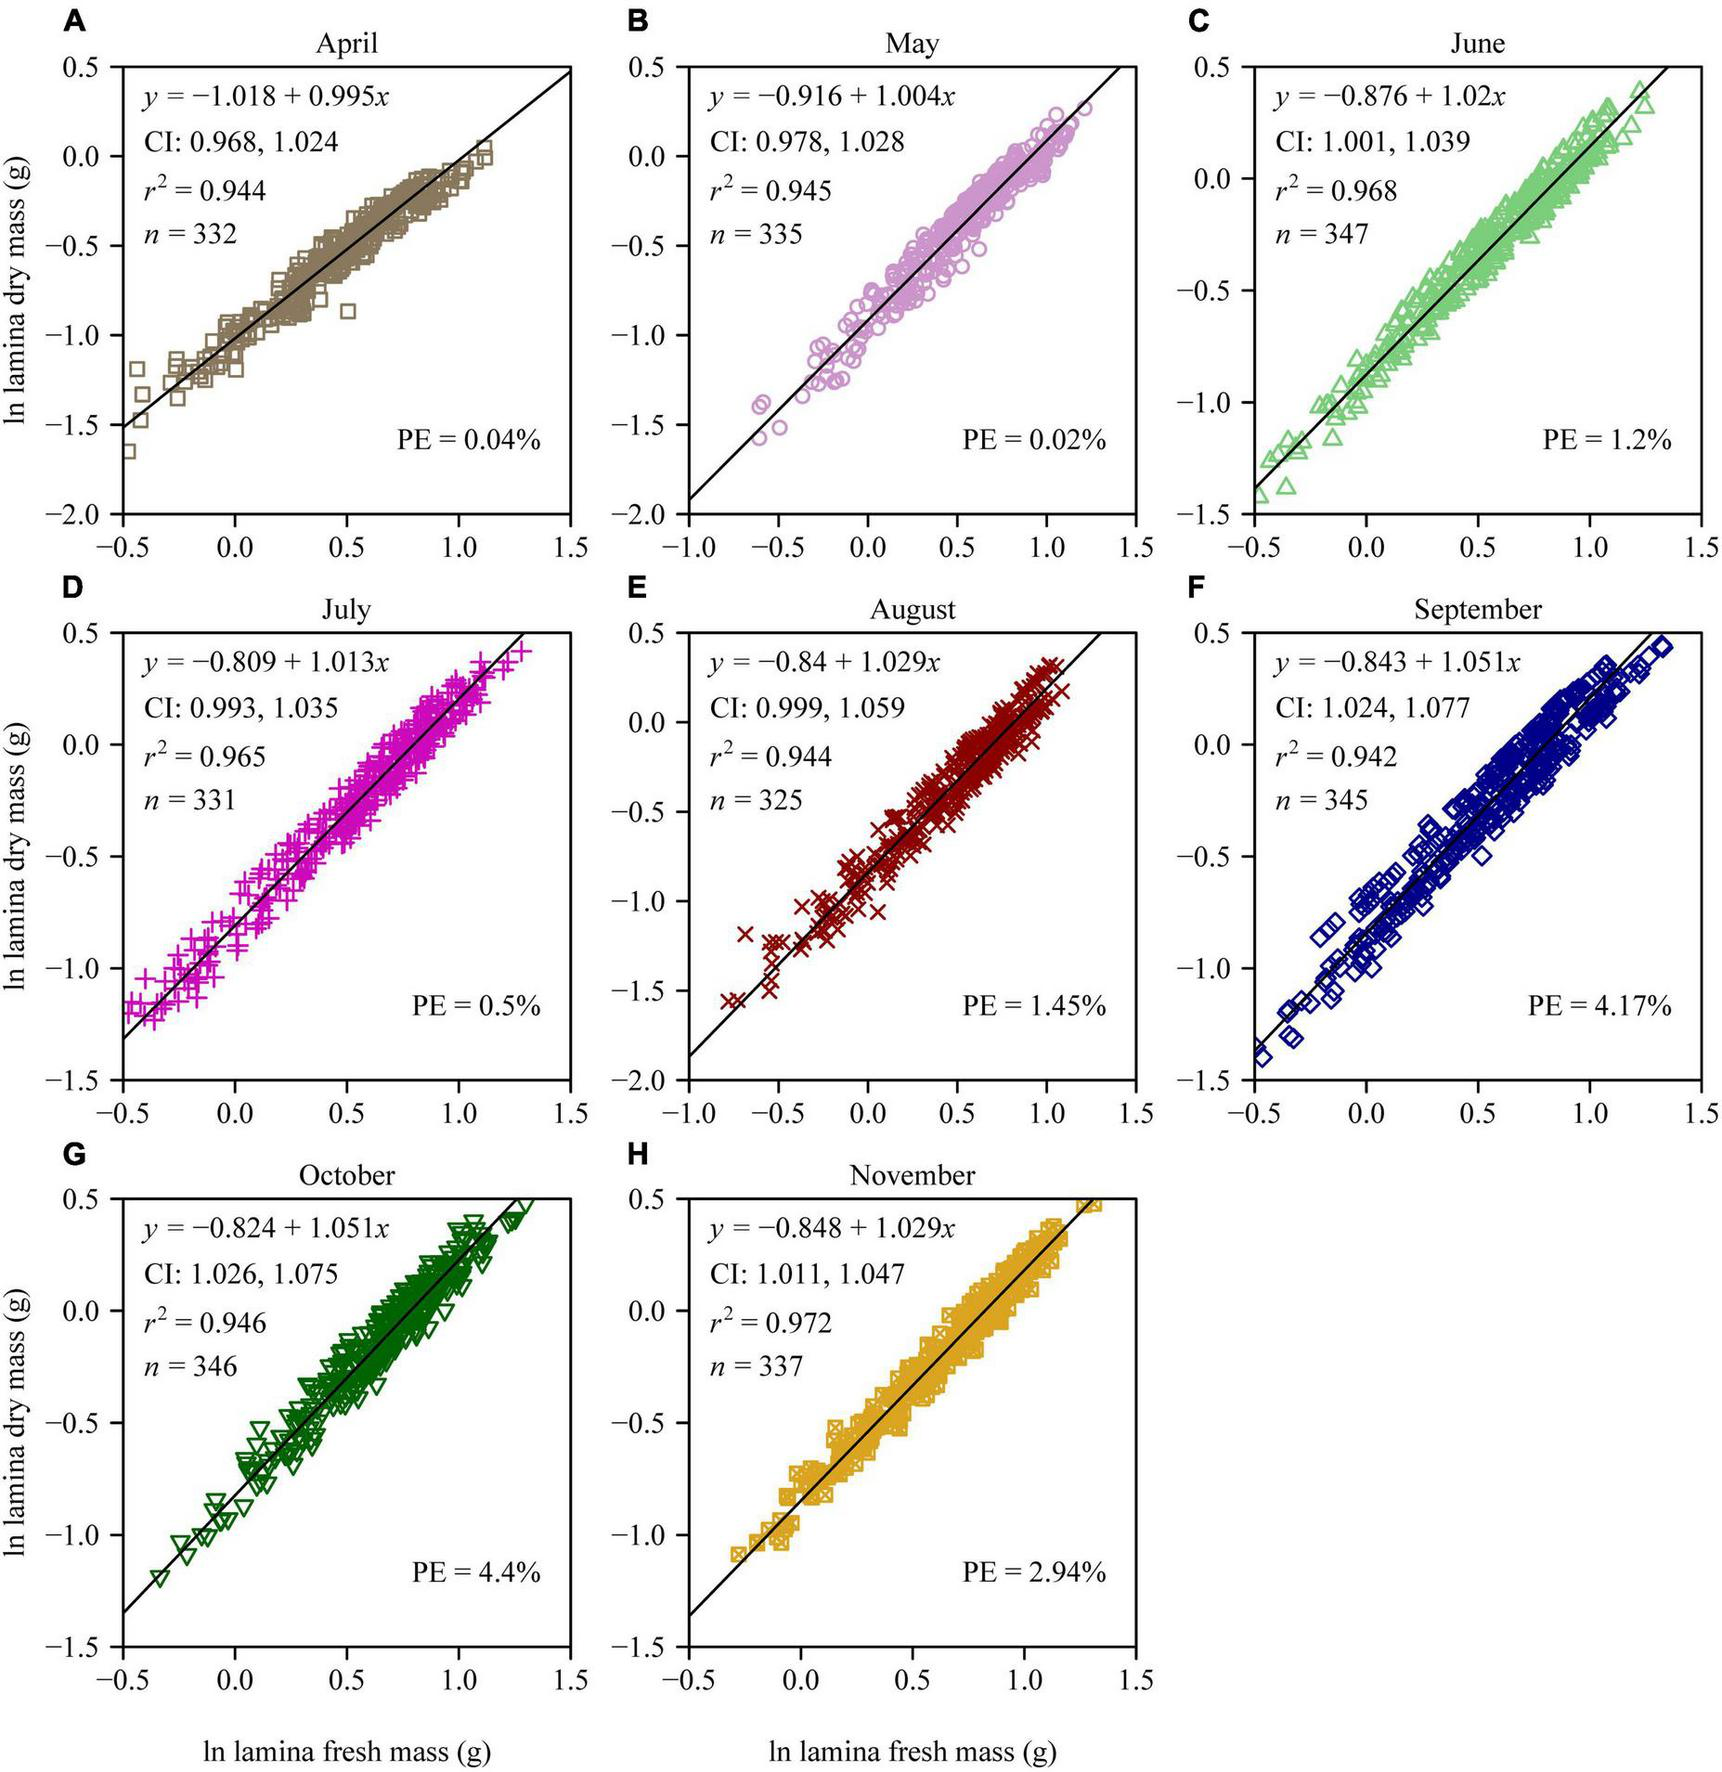
Log-log bivariate plots and linear fits to the lamina dry mass vs. lamina fresh mass for each of the eight leaf-age groups (A–H) of P. serratifolia. The small symbols represent log-transformed values of lamina dry mass vs. lamina fresh mass; the straight lines represent the regression lines; CI represents the 95% confidence interval of the slope; r2 is the coefficient of determination; n is the sample size; different colors represent different leaf-age groups; and PE is the percent error of the total error areas (TEAs) in the Model II regression between the two linear equations (i.e., equations 2 and 3).
Discussion
In our recent study (Jiao et al., 2022), we reported that the LDM/LFM ratio of P. × fraseri “Red Robin”, the hybrid of P. glabra and P. serratifolia, approximately exhibited a sigmoid increasing pattern with increasing leaf age. However, in that study, the sampling time was limited to July, not up to the autumn and early winter, so that the curvilinear effect of leaf age on the LDM/LFM ratio for that hybrid was not evident. In the present study, up to July, the LDM/LFM ratio also exhibits a monotonically increasing trend with increasing leaf age. This means that the results of the present study for P. serratifolia do not conflict with those of Jiao et al. (2022) for P. × fraseri. It is easy to account for this parabolic change in the LDM/LFM ratio across the 8 months. Newly emerging leaves require the increase in lamina dry mass to approximately keep pace with the increase in lamina area to reduce the support cost of lamina area expansion to perform photosynthesis, which can be reflected by a low scaling exponent of lamina dry mass vs. lamina area approaching 1 (Niinemets et al., 2006; Liu et al., 2020). However, with lamina area further increasing, the support cost of leaves correspondingly increases, which can be reflected by an asynchronous increase between lamina dry mass and lamina area (Niklas et al., 2007). Prior studies have shown that the scaling exponent of lamina fresh mass vs. lamina area is usually smaller than the scaling exponent of lamina dry mass vs. lamina area (Huang et al., 2019a,b; Liu et al., 2020). This means that the increase of lamina fresh mass is more likely to keep pace with that of lamina area relative to lamina dry mass. Thus, the LDM/LFM ratio exhibited an increasing trend before leaf maturation. However, in autumn and early winter, the air is relatively drier at the experimental site than in the spring and summer when more precipitation occurs in summer (Jiao et al., 2022). The evergreen plants have to increase lamina water content in autumn and early winter, which is reflected by a slightly decreased LDM/LFM ratio, to ensure sufficient water content in leaves to replenish lamina water loss (Kelliher et al., 1997). In addition, there is a need to mention that leaf dry matter content is considered to be much less variable than specific leaf area and then serves as a better predictor of location on an axis of resource capture, usage and availability that overall reflects plant strategy schemes (Weaver and Mogensen, 1919; Wilson et al., 1999). However, the influences of leaf age and seasonal factors on the leaf dry matter content have been largely overlooked. The present study suggests that the leaf dry matter content is also variable across different sampling months, and consequently care must be taken when using leaf dry matter content to quantify or predict plant strategies, especially for those evergreen plants.
Studying the growth and development of plants especially leaf growth and development across different harvesting times can provide better guidance for the harvesting and preparation of medicinal plants in herbal medicine. In addition, by understanding the growth and development of plants, we can better understand the components and mechanisms of herbal medicine, and thus develop more effective and safe drugs. The present results provide a practical guidance in measuring the expansion of leaf size in a convenient fashion, which can be gauged by LFM. In summary, these research findings provide some potential opportunities and directions for medical applications, but further research and exploration are needed.
Statements
Data availability statement
The original contributions presented in this study are included in the article/supplementary material, further inquiries can be directed to the corresponding authors.
Author contributions
DY and PS designed this work, analyzed the data, and wrote the initial draft. YJ carried out the experiment. All authors read and agreed with this manuscript.
Acknowledgments
We are deeply thankful to two reviewers for their invaluable comments that have largely improved the quality of this manuscript. We thank David A. Ratkowsky, Karl J. Niklas, Xuchen Guo, Lin Wang, Kexin Yu, and Xiao Zheng for their valuable help in the preparation of this work.
Conflict of interest
The authors declare that the research was conducted in the absence of any commercial or financial relationships that could be construed as a potential conflict of interest.
Publisher’s note
All claims expressed in this article are solely those of the authors and do not necessarily represent those of their affiliated organizations, or those of the publisher, the editors and the reviewers. Any product that may be evaluated in this article, or claim that may be made by its manufacturer, is not guaranteed or endorsed by the publisher.
References
1
ChenZ.LiuQ.ZhuZ.XiangF.ZhangM.WuR.et al (2020). Ursolic acid protects against proliferation and inflammatory response in LPS-treated gastric tumour model and cells by inhibiting NLRP3 inflammasome activation.Cancer Manag. Res.128413–8424. 10.2147/cmar.s264070
2
EfronB.TibshiraniR. J. (1993). An introduction to the bootstrap.New York, NY: Chapman and Hall/CRC. 10.1007/978-1-4899-4541-9
3
GuoL.WangY.ZhuangW. (1998). Determination of ursolic acid in leaves of Photinia serratifolia.Chin. Trad. Herb. Drugs29314–315.
4
GuoX.ShiP.NiinemetsÜHölscherD.WangR.LiuM.et al (2021). “Diminishing returns” for leaves of five age-groups of Phyllostachys edulis culms.Am. J. Bot.1081662–1672. 10.1002/ajb2.1738
5
GutschickV. P.WiegelF. W. (1988). Optimizing the canopy photosynthetic rate by patterns of investment in specific leaf mass.Am. Nat.13267–86. 10.1086/284838
6
HsuP. (1996). Multiple comparisons: theory and methods.New York, NY: Chapman and Hall/CRC. 10.1201/b15074
7
HuangW.RatkowskyD. A.HuiC.WangP.SuJ.ShiP. (2019a). Leaf fresh weight versus dry weight: which is better for describing the scaling relationship between leaf biomass and leaf area for broad-leaved plants?Forests10:256. 10.3390/f10030256
8
HuangW.SuX.RatkowskyD. A.NiklasK. J.GielisJ.ShiP. (2019b). The scaling relationships of leaf biomass vs. leaf surface area of 12 bamboo species.Glob. Ecol. Conserv.20:e00793. 10.1016/j.gecco.2019.e00793
9
JiaoY.NiklasK. J.WangL.YuK.LiY.ShiP. (2022). Influence of leaf age on the scaling relationships of lamina mass vs. area.Front. Plant Sci.13:860206. 10.3389/fpls.2022.860206
10
KelliherF. M.HollingerD. Y.SchulzeE.-D.VygodskayaN. N.ByersJ. N.HuntJ. E.et al (1997). Evaporation from an eastern Siberian larch forest.Agric. Forest Meteorol.85135–147. 10.1016/s0168-1923(96)02424-0
11
LiuM.NiklasK. J.NiinemetsÜHölscherD.ChenL.ShiP. (2020). Comparison of the scaling relationships of leaf biomass versus leaf surface area between spring and summer for two deciduous tree species.Forests11:1010. 10.3390/f11091010
12
LuskC. H. (2019). Leaf functional trait variation in a humid temperate forest, and relationships with juvenile tree light requirements.Peer J.7:e6855. 10.7717/peerj.6855
13
NiinemetsÜPortsmuthA.TobiasM. (2006). Leaf size modifies support biomass distribution among stems, petioles and mid-ribs in temperate plants.New Phytol.17191–104. 10.1111/j.1469-8137.2006.01741.x
14
NiklasK. J.CobbE. D.NiinemetsÜReichP. B.SellinA.ShipleyB. (2007). Diminishing returns” in the scaling of functional leaf traits across and within species groups.Proc. Natl. Acad. Sci. U.S.A.1048891–8896. 10.1073/pnas.0701135104
15
Pérez-HarguindeguyN.DíazS.GarnierE.LavorelS.PoorterH.JaureguiberryP.et al (2013). New handbook for standardised measurement of plant functional traits worldwide.Aust. J. Bot.61167–234. 10.1071/BT12225
16
PoorterH.NiinemetsÜPoorterL.WrightI. J.VillarR. (2009). Causes and consequences of variation in leaf mass per area (LMA): a meta-analysis.New Phytol182565–588. 10.1111/j.1469-8137.2009.02830.x
17
QuinnG. P.KeoughM. J. (2002). Experimental design and data analysis for biologists.Cambridge: Cambridge University Press.
18
R Core Team (2022). R: a language and environment for statistical computing.Vienna: R Foundation for statistical computing.
19
SandhuH. S.ShiP.KuangX.XueF.GeF. (2011). Applications of the bootstrap to insect physiology.Fla. Entomol.941036–1041. 10.1653/024.094.0442
20
SchraderJ.PillarG.KreftH. (2017). Leaf-IT: an android application for measuring leaf area.Ecol. Evol.79731–9738. 10.1002/ece3.3485
21
SchraderJ.ShiP.RoyerD. L.PeppeD. J.GallagherR. V.LiY.et al (2021). Leaf size estimation based on leaf length, width and shape.Ann. Bot.128395–406. 10.1093/aob/mcab078
22
WeaverJ. E.MogensenA. (1919). Relative transpiration of coniferous and broad-leaved trees in autumn and winter.Bot. Gaz.68393–424.
23
WilsonP. J.ThompsonK.HodgsonJ. G. (1999). Specific leaf area and leaf dry matter content as alternative predictors of plant strategies.New Phytol.143155–162. 10.1046/j.1469-8137.1999.00427.x
24
ZhengX.NiklasK. J.RatkowskyD. A.JiaoY.DingH.ShiP. (2022). Comparison of leaf shape between a Photinia hybrid and one of its parents.Plants11:2370. 10.3390/plants11182370
Summary
Keywords
antineoplastic plant, confidence interval, percent error, proportional relationship, reduced major axis protocols
Citation
Yan D, Jiao Y and Shi P (2023) Can lamina fresh mass be used to represent lamina dry mass? Evidence from Photinia serratifolia. Front. Ecol. Evol. 11:1208039. doi: 10.3389/fevo.2023.1208039
Received
18 April 2023
Accepted
05 May 2023
Published
18 May 2023
Volume
11 - 2023
Edited by
Jie Gao, Peking University, China
Reviewed by
Jing Wang, Zhengzhou University, China; Wenchen Song, Minzu University of China, China
Updates
Copyright
© 2023 Yan, Jiao and Shi.
This is an open-access article distributed under the terms of the Creative Commons Attribution License (CC BY). The use, distribution or reproduction in other forums is permitted, provided the original author(s) and the copyright owner(s) are credited and that the original publication in this journal is cited, in accordance with accepted academic practice. No use, distribution or reproduction is permitted which does not comply with these terms.
*Correspondence: Dan Yan, sharon@njmu.edu.cnPeijian Shi, pjshi@njfu.edu.cn
Disclaimer
All claims expressed in this article are solely those of the authors and do not necessarily represent those of their affiliated organizations, or those of the publisher, the editors and the reviewers. Any product that may be evaluated in this article or claim that may be made by its manufacturer is not guaranteed or endorsed by the publisher.