- 1College of Pratacultural Science, Gansu Agricultural University, Lanzhou, China
- 2School of Management, Gansu Agricultural University, Lanzhou, China
Research on the impact of land use change on regional habitat quality, in various future scenarios, can effectively aid planning and decision-making for sustainable development at a regional level. The study conducted its research in the Gansu-Qinghai Yellow River section and used ArcGIS and a land use transfer matrix to analyze the spatiotemporal pattern of land use and land cover changes. The study assessed the changes in habitat quality in the Gansu-Qinghai Yellow River region between 1990 and 2020, using the Integrated Valuation of Ecosystem Services and Trade-offs (InVEST) model, by evaluating the gains and losses. Simultaneously, 15 elements of the natural economy were chosen and examined for their temporal and spatial impact on habitat quality using the random forest model and spatially weighted regression model. To forecast land use changes in the Gansu-Qinghai Yellow River section for 2030, the Future Land Use Simulation Model (FLUS) model was utilized and a series of four scenarios (cultivated land protection scenario, ecological protection scenario, natural development scenario, and rapid development scenario) were employed. The research results indicate that over 70% of the Gansu-Qinghai Yellow River is occupied by grasslands, and only a small portion of the area, about 0.22%, is developed for construction purposes. The quality of the habitat in the Gansu-Qinghai Yellow River had a minor drop between 1990 and 2020, followed by an improvement. Habitat quality changes are primarily attributed to improvements, with variations across different areas, i.e., enhanced in the east and reduced in the central and western parts. The habitat quality of the Gansu-Qinghai Yellow River has improved in all four scenarios compared to 2020, as evidenced by the decrease in low-value habitats and increase in high-value areas. The ecological protection scenario has the highest average habitat quality value. These research results can be used to support policy development and ecological restoration initiatives in the Gansu-Qinghai Yellow River.
1 Introduction
Human survival and development are guaranteed by biodiversity, which also serves as a major engine for ecosystem services (Zhang et al., 2022). The quality of habitat represents the ecosystem’s ability to provide suitable conditions for the survival of individuals and populations. Land use change is a major threat to habitat quality, and biodiversity is declining at an alarming rate, according to Bongaarts, (2019).Such as rapid urbanization and large-scale agricultural development activities, have exacerbated species extinction, habitat fragmentation, and habitat degradation, as biodiversity has been destroyed to varying degrees, thereby changing the habitat distribution pattern of habitats. The connectivity of habitat patches is increasingly reduced and fragmented, altering the habitats’ structure and composition will ultimately have an impact on how energy and materials move between various ecological fragments (Liu et al., 2014; Wilson et al., 2016). Thoroughly researching the impacts of changes in land use on habitats is crucial for developing effective policies that protect biodiversity and promote coordinated development between humans and ecology, according to Yohannes et al. (2021).
The Maxent model (Wu et al., 2016), Artificial intelligence for ecosystem services (ARIES) model (Vigerstol and Aukema, 2011), Social values for ecosystem services (SoLVES) model (Wang et al., 2016), Habitat suitability index (HSI) model (Liu et al., 2017), and InVEST model are just a few of the current methods for evaluating ecosystem services. The InVEST model is frequently used in habitat quality assessments because of its ease of use, minimal data requirements, and potent spatial expression capabilities (Karimi et al., 2018). Yohannes et al. (2021) explored the habitat quality of Beresa Basin in Ethiopia.Gomes et al. (2021) investigated Lithuania’s habitat quality using the InVEST model and examined the effects of various scenarios on land use change.
Based on simulating various scenarios during a certain historical period, land use and regional habitat quality evaluation can obtain the evolution laws of habitat quality over a long time. The evaluation of future habitat quality can better propose ecological environment protection strategies and has extremely important significance for the construction of ecological civilization. Because land use changes are affected by human activities, which are crucial when evaluating habitat quality. The most widely used simulation models, including the Cellular Automata (CA) model, are previously employed to imitate or replicate spatial layout both domestically and internationally (Tang et al., 2022), Markov Model (Liang et al., 2021), Artificial Neural Network (ANN) model, Multi-Agent-System (MAS) model (Gao et al., 2022), system simulation (System Dynamics, SD) model, and effects of changing land use Model (CLUE-S: Conversion of Land Use and its Effects at Small Region Extent) (Bai et al., 2019), but there are certain deficiencies in many of these models. Among them, the system simulation (SD) model does not reflect the spatial elements. Emphasis on the impact of economic benefits and the selection of network structure of the neural network model is different. the influence of various macro factors of the cellular automaton (CA) model on the simulation results is insufficient. The multi-scenario model overemphasizes the impact of actions carried out by humans on the simulation results and ignores the influence of natural elements, although there is still a significant dissimilarity between the outcomes obtained through simulation and those obtained in reality (Yu et al., 2014; Bai et al., 2019).
The FLUS model uses a combination of the CA model and ANN algorithm to demonstrate the spatial paths of different land use categories in different situations while considering both natural environmental and human-related impacts. It incorporates adaptive inertia and competition mechanisms and performs better in model simulations. Future land use patterns have been simulated in several studies using the FLUS model.
The Gansu-Qinghai Yellow River region is unique. It is located in the middle and upper sections of the Yellow River Basin. It is dominated by mountains and has large terrain fluctuations. The Qinghai-Tibet and Loess Plateaus meet in the Gansu-Qinghai Yellow River region. It is also one of the areas that are relatively vulnerable to climate change on a global scale. The special geographical location makes it a key area for ecological restoration (Yang et al., 2020). There are ecological and environmental issues in this region, such as soil erosion, biodiversity loss, a reduction in the area of wetlands, and degradation of grasslands, due to the interplay between elements of nature and actions taken by humans. Huge pressure is put on quality. To analyze the spatiotemporal pattern of land use change in the watershed. Exploring the spatiotemporal changes of habitat quality in the region and predicting future trends can provide important references for regional sustainable development and habitat protection.
This study used the InVEST (Integrated Valuation of Ecosystem Services and Trade-offs) model to evaluate the habitat quality of the Gansu-Qinghai Yellow River basin from 1990 to 2020. The impact of each factor on habitat quality was analyzed using both random forest models, taking into account temporal and spatial changes. A total of 15 factors were selected for analysis, such as the natural economy; and used the FLUS model, four set scenarios of cultivated land protection scenario, natural development scenario, rapid development scenario, and predicted the habitat quality of the above four scenarios.
2 Materials and methods
2.1 The study area
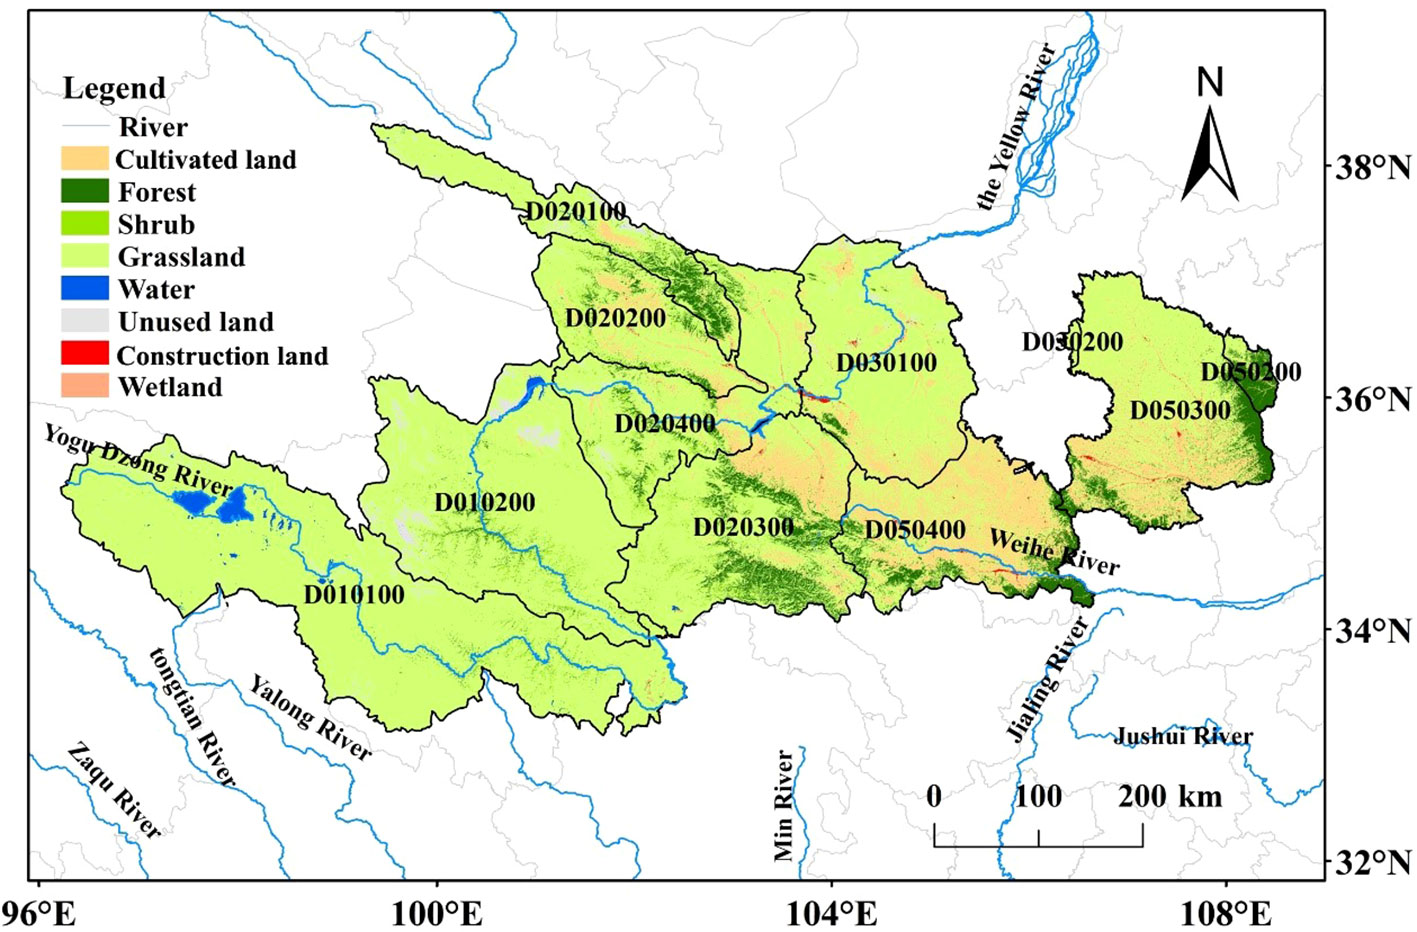
The Gansu-Qinghai Yellow River section can be found in the upper reaches of the Yellow River Basin (Figure 1), with a total area of 29.31 × 10⁴ km2, accounting for 39.0% of the total area of the Yellow River Basin. The total area of the Gansu section is 14.30 × 10⁴ km2 and includes Lanzhou City, Wuwei City, Baiyin City, Dingxi City, Linxia Prefecture, Longnan City, Gannan Prefecture, Qingyang City, Tianshui City, Pingliang City and other 10 cities (prefectures). While the total area of the Qinghai section is 15.01 × 10⁴ km2, including Xining City, Haibei, Haidong area, Huangnan, Guoluo, Hainan, Yushu, Haixi Mongolian and 5 Tibetan autonomous prefectures, and Tibetan Autonomous Prefecture and other 8 cities (prefectures). The altitude of the Gansu-Qinghai Yellow River section is 3 000~5 000m, the terrain is high in the west and low in the east across the Qinghai-Tibet Plateau and Loess Plateau, belonging to the continental climate area.
D010100: Heyuan to Maqu D010200: Maqu to Longyangxia D020100: Above the Xiangtang of Datong River D020200: Huangshui D020300: Daxia River and Taohe River D020400: Main stream section of Longyangxia to Lanzhou D030100: Lanzhou to the Xiaheyan D030200: Qingshui River and Kushui River D050200: Above the Zhuangtou of Beiluo River D050300: Above the Zhangjiashan of Jinghe River D050400: Above the Baoji Gorge of Weihe River.
2.2 Data sources
The first annual China Land Cover Dataset (CLCD) from Landsat (Yang and Huang, 2021), created by Professors Yang and Huang of Wuhan University on the GEE platform, was used to obtain the land use data for the years 1990 to 2020. It covered 30 continuous years. The 30 m × 30 m represented the spatial resolution.
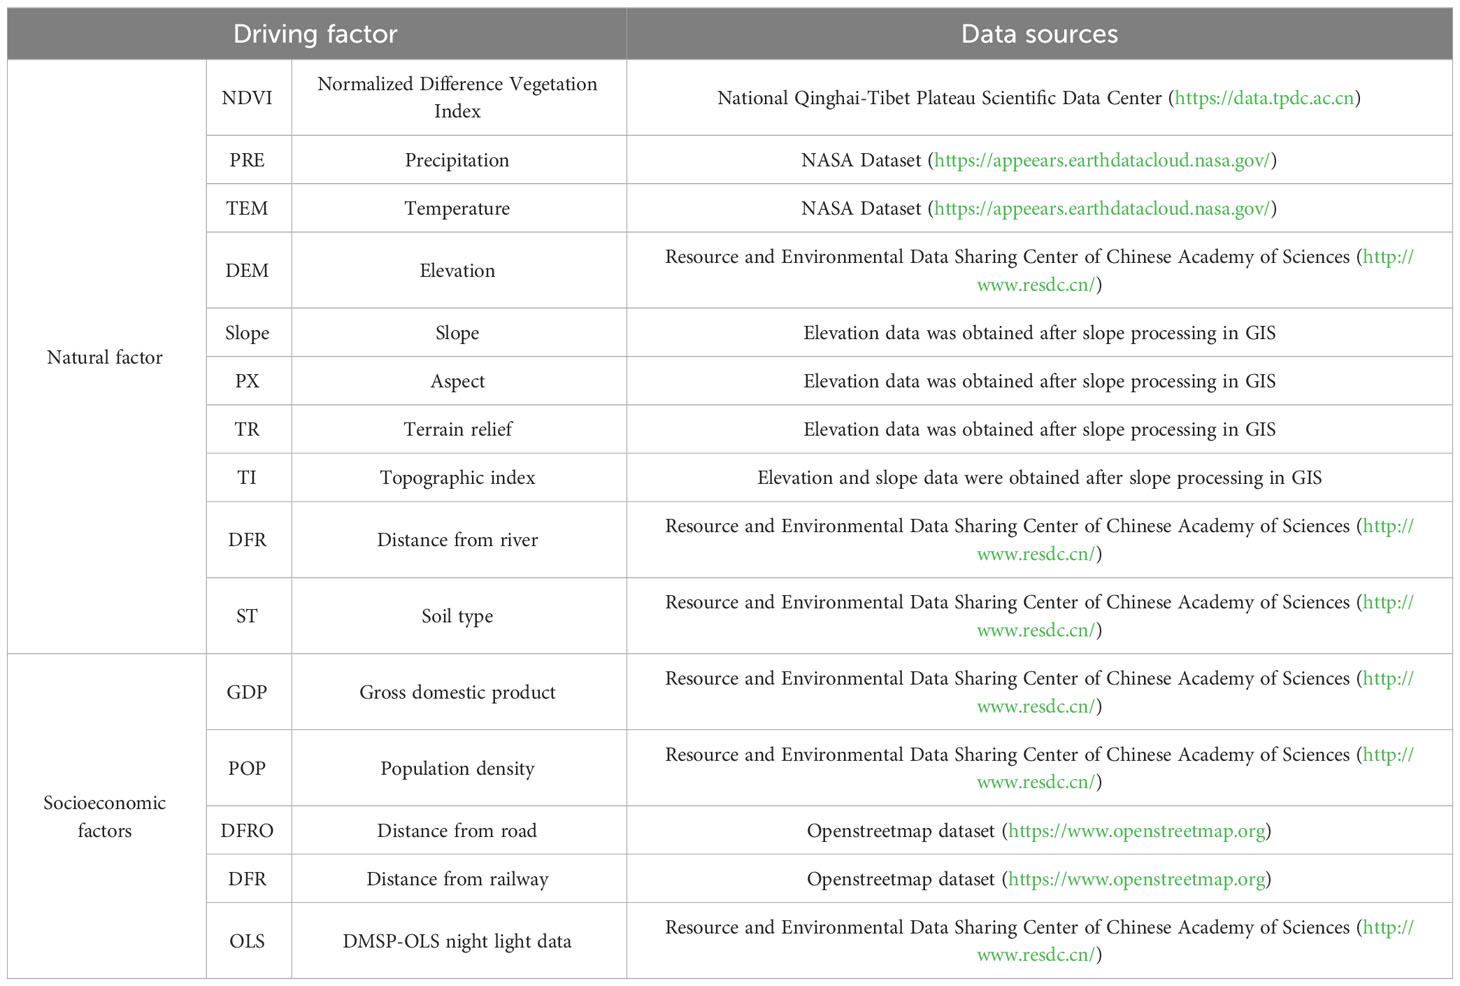
Selected normalized different indices were, vegetation, precipitation, temperature, elevation, slope, aspect, terrain relief, topographic position index, distance from the river, soil type, gross domestic product, population density, distance from railway, and road. The distance from the government residence and the nighttime light index included 10 natural factors and 6 socioeconomic factors as the driving factors of habitat quality and the factor data of the model simulation. For the data sources of specific factors, refer to Table 1. The data on China’s nature reserves came from the Environment Data Sharing Center of the Chinese Academy of Sciences (http://www.resdc.cn/) and Resource.
2.3 Methods
2.3.1 Habitat quality analysis
This study assessed the habitat quality index using the InVEST model’s Habitat Quality module. This module is a map that was created by combining different land use types with threats to biodiversity in the habitat with the degree of habitat degradation and habitat quality in a given area. According to this model, habitat quality is a continuous variable that can be anywhere between low and high (Hall et al., 1997). In general, habitat quality is influenced by how close it is to human land use, whereas habitat degradation is influenced by how intense nearby land use is (Nellemann, 2001). The more severe the danger to the natural environment posed by the threat factor and the greater the degree of habitat degradation, the higher the score. Calculated as follows:
In the formula, D xj, R, w x, Y r and ry represent the habitat degradation degree, (degradation risk index), the number of stress factors, the weight of stress factor r, and the weight of stress factor and the number of grids and the value of the stress factor on the grid, respectively; the distance between the habitat and the source of danger, as well as the effect of the danger on the environment, are represented by the variable “i rxy”. Meanwhile, the mitigating effect of protective measures on the impact of the threat on the habitat is indicated by the factor “β x” (that is, legal degree of protection, the range is 0–1, 1 is complete accessibility); the measure of how much a particular stress factor r affects the habitat type j is indicated by Sjr.
The equation involves the measurement of dxy, which represents the straight-line distance between the x and y coordinates on the grid. Additionally, the maximum distance of potential danger from the threat source r is referred to as drmax.
Therefore, the habitat quality in grid cell x in land use type j is:
The equation uses various parameters. Qxj represents the quality of the habitat in a specific location and land use, while Hj is the suitability of the habitat type, ranging from 0 to 1. The half-saturation constant, denoted as k, is typically equal to half of the highest possible habitat value. Another parameter, z, is a normalization constant and is usually set to 2.5.
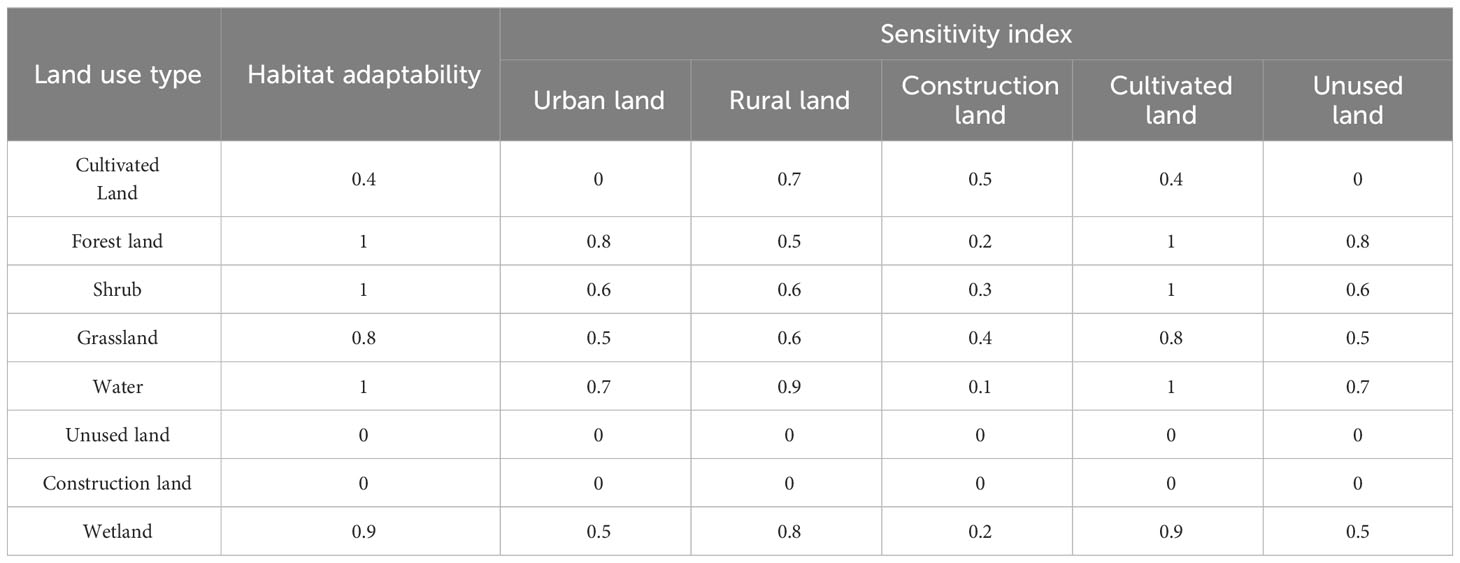
In this paper, the parameters of the model are set by referring to the InVEST model User Guide manual (Sharp et al., 2015) and existing literature (Zhang et al., 2020; Zhang et al., 2020), including land use type map and threat source factors (based on the actual land cover situation in the study area, construction land is the most disturbed type by human activities, and cultivated land is the type with more concentrated human activities.
The unused land is basically uncovered by vegetation and has a bad ecological environment. Therefore, the three categories are defined as threat sources and threat factor weights (Table 2) and sensitivity index (Table 3).
2.3.2 Scenario simulation of land use pattern
In 2017, the FLUS model was introduced by Liu et al. (2017). This model is founded on the Geo-SOS theory and utilizes data on land use and its determinants to forecast the future spatial arrangement of land utilization, taking into account both natural and human factors. This approach has been further explored by Liang et al. (2018) and by Liu et al. (2017). The driving factors selected in this paper include normalized difference vegetation index, precipitation, temperature, elevation, slope, aspect, terrain relief, distance from river, soil type, GDP, population density, distance from road, and railway. There are 15 natural economic factors in total, including distance, distance from the government residence, and night light index. The simulation process primarily entails scenario setting, adaptive inertia coefficient calculation, model testing, neighborhood factor setting, comprehensive probability calculation, and suitability probability calculation as follows.
2.3.2.1 Suitability probability calculation
Neural networks are the foundation for suitability probability calculations. The probability of a k-type land use type occurring on a particular grid p at time t is calculated using an artificial neural network (ANN) with multiple input and output neurons as p(p,k,t) (Liu et al., 2017):
The suitability probability of land use type k on grid p at time t is given by the formula: p(p,k,t). The adaptive weight between the output layer and hidden layer is given by the formula: w j,k. The signal that neuron j receives from all of the input neurons on grid cell p at time t in the hidden layer is given by the formula: net j(p,t).
The neural network-based probability-of-occurrence calculation module was used to determine the driving force behind land use change. Using this module, the probability of each type of land use in every pixel of the study area was calculated through the neural network algorithm (ANN). The suitability probability calculation module was selected based on the neural network by the startup model. This study used a uniform sampling strategy as its sampling method. The multi-layer feedforward neural network algorithm’s hidden layer count was set to 12, and the sampling parameter’s value was 20. Then import the variables that may affect changes, like the terrain and the location of traffic, and determine the likelihood of various events occurring in each pixel of the Gansu-Qinghai Yellow River region. and the root mean square error (RMSE) of this model training is 0.153201.
Different colors were selected to represent the probability of occurrence. When the color of suitability probability is closer to blue, it means that the probability of occurrence is higher. Consequently, cultivated land is suitable for distribution in low-slope areas, forest land is suitable for distribution in high-lying mountainous areas, shrub land is suitable for distribution in middle-level terrain and interspersed with grassland, grassland is suitable for distribution in flat areas, and construction land is suitable for distribution in flat terrain and close to the river zone, water areas are suitable for distribution in low-lying areas, unused land is suitable for distribution in soil desertification desert areas, and wetlands are suitable for distribution near water sources. From the adaptive probability distribution, it can be seen that it is consistent with the natural conditions of the Gansu-Qinghai Yellow River, and the result is more reasonable.
The change of land use type is easily affected by many aspects such as nature, society and economy. Generally speaking, the factors affected by the outside world can be classified into three types, namely, natural factors, socioeconomic factors and accessibility factors. Natural factors represent the impact of the natural environment on land use types; socioeconomic factors represent the impact of social and economic development on land use type changes; and accessibility factors refer to the impact of traffic location factors on land use type changes. For urban form and its development, this paper selects 15 driving factors, as shown in Figure 2.
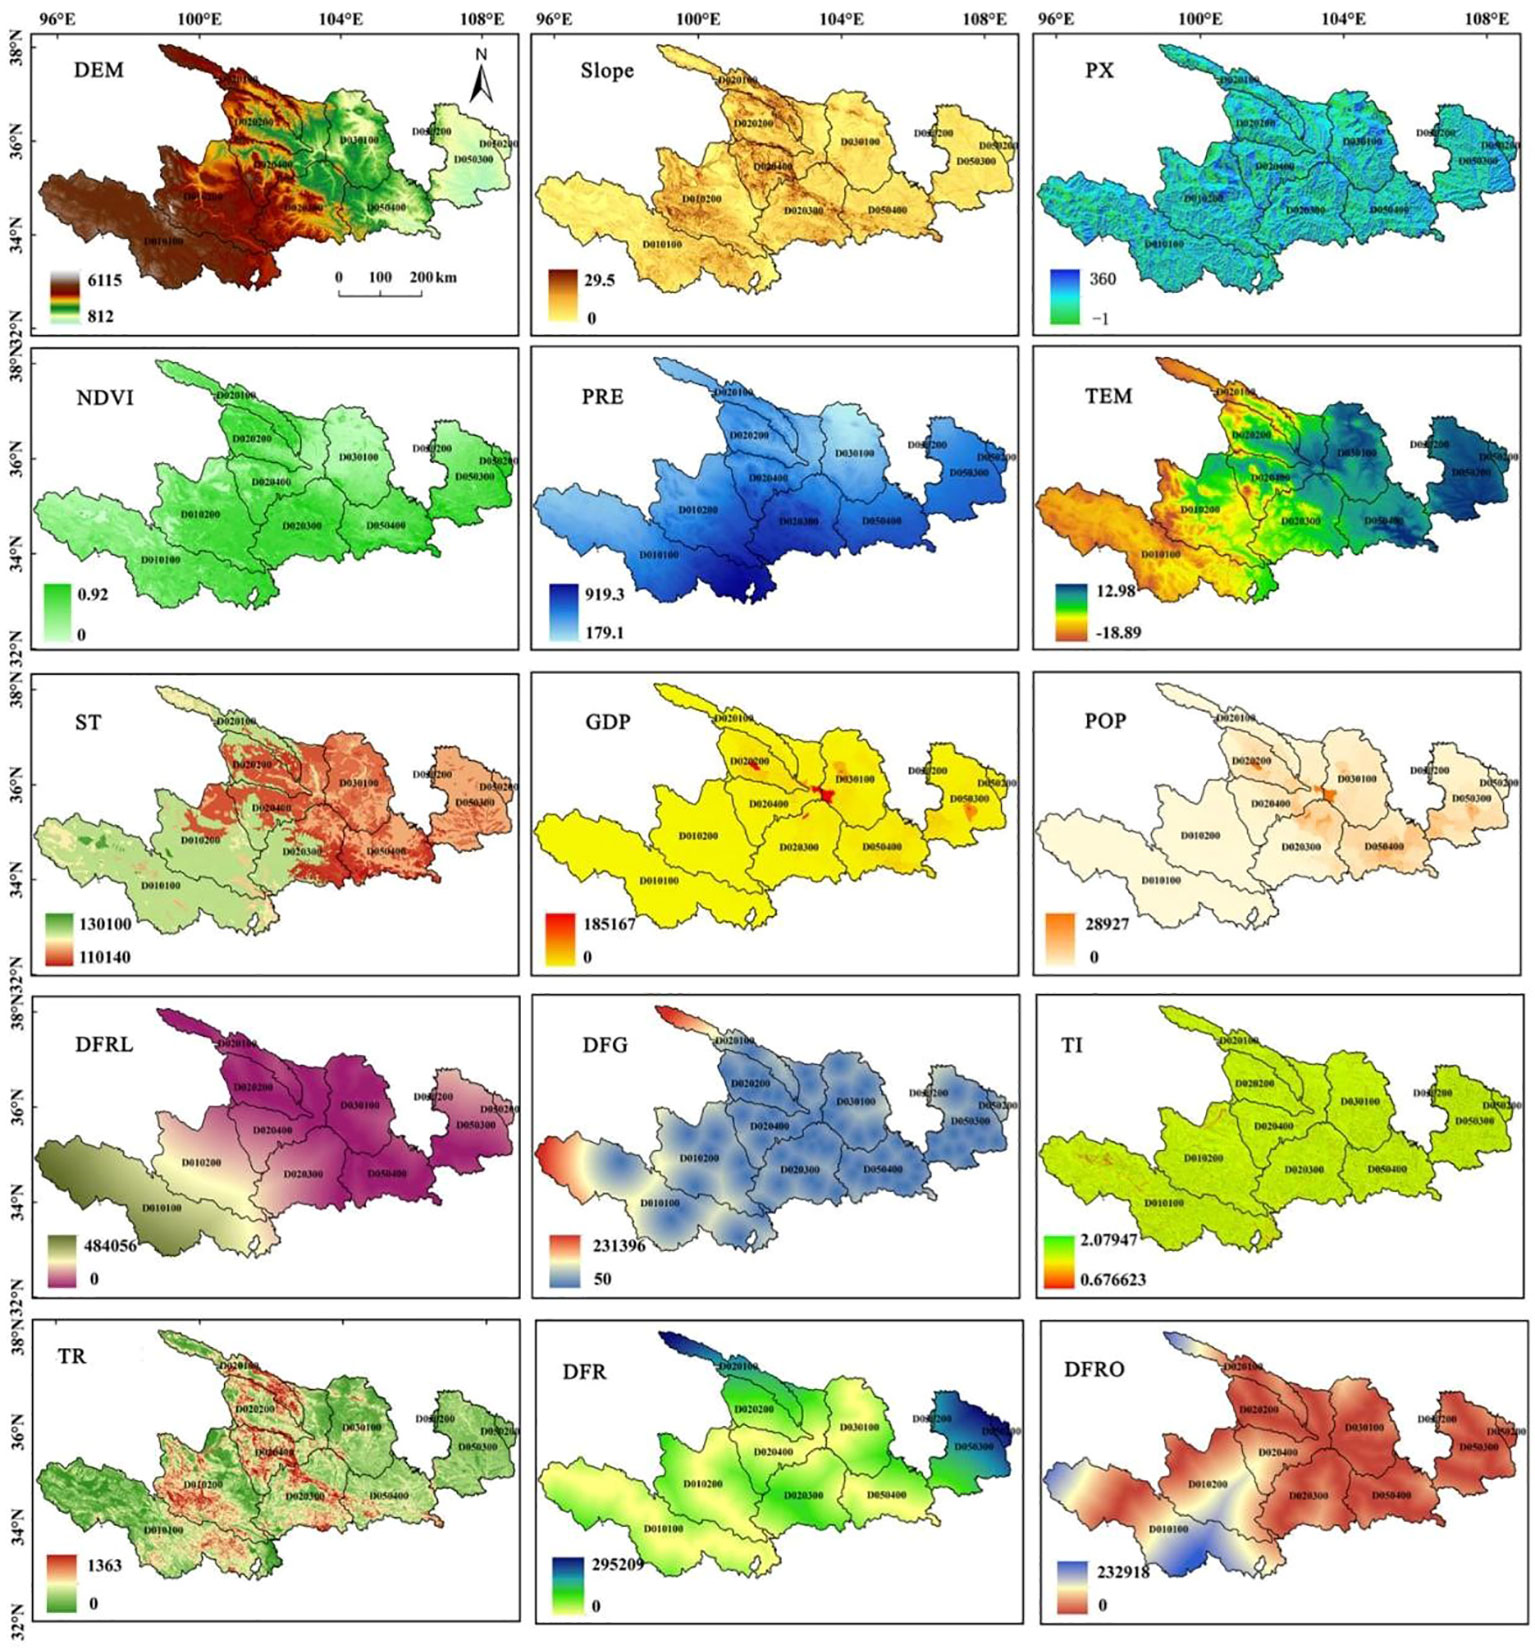
Figure 2 Driving factors of land use types in the Gansu-Qinghai section of the Yellow River Basin in 2010.
2.3.2.2 Neighborhood factor setting and model testing
The simulation accuracy is evaluated by the kappa coefficient. Closer to 1 signifies higher consistency. The predictions are regarded as credible when the kappa coefficient exceeds 0.75. The neighborhood factor’s parameters range from 0 to 1, and a value that is closer to 1 indicates that the land type has a greater capacity for expansion. According to the findings of previous studies, water area, forest land, shrubs, grassland, and cultivated land had the greatest potential for expansion. The unused land, construction land, and wetland neighborhood factors are set at 0.7, 0.7, 0.6, 0.4, 0.6, 0.5, 0.8, and 0.7. The outcomes of the simulation regarding the utilization of land in 2020 using the neighborhood factor simulation had a Kappa coefficient of 84.88%.
2.3.2.3 Calculation of adaptive inertia coefficient
The inertia coefficient, which is capable of adapting to changes, modifies itself throughout the iterative process. Its purpose is to minimize the difference between the actual supply and expected demand for each type of land use. Consequently, it increases the quantity of land use towards the target value and facilitates the simulation of spatial changes in land use. The equation reads as follows:
In the formula: is the inertia coefficient t of type k land during iteration; at iteration t−1, denotes the discrepancy between the requested land quantity for a specific type of land (k) and the actual amount of that land available.
2.3.2.4 Scenario setting
The Gansu-Qinghai Yellow River section has diverse natural conditions, as well as economic and social development, which has led to different control modes for various development and utilization. To simulate the future land under various scenarios based on the traits of each scenario model, we use the scenario analysis method using the present state of social progress as a reference point.
Changes in utilization: Four scenarios were created for land use change simulation in this research based on various development objectives and potential disturbance scenarios in the watershed. These scenarios include rapid development, cultivated land protection, ecological protection, and natural development. Additionally, this setup was created to give managers a guide for determining the equilibrium of sensible utilization of land in these situations. Here are the 4 possible scenarios for changing land use:
Natural development scenario (NADS): The Markov model is utilized to simulate the land demand, and all land types are convertible to each other, under the assumption that the future land change rate is consistent with the change from 2000 to 2015 and that the natural conditions and economic development conditions of the study area remain unaltered.
Cultivated land protection scenario (COPS): Focusing on the protection of basic farmland, it is strictly forbidden to transfer out cultivated land, except for construction land, which can be used as agricultural land.
Ecological protection scenario (ECPS): sort according to the ecological benefits of various types of land; water area, forest land, wetland, shrub land, cultivated land, construction land, grassland, and unused land.
Rapid development scenario (RADS): Sorted according to development needs; water area, construction, shrub, cultivated, forest land, grassland, wetland, unused land, the conversion principle is not to allow the change of land categories with a high ranking to low ranking.
2.3.2.5 Comprehensive probability calculation
The overall conversion probability of units occupied by the specified land type is estimated using the aforementioned factors, including suitability probability, neighborhood influence factor, suitability matrix, and inertia coefficient, and the formula is as follows:
In the formula: represents the comprehensive probability that element p changes from initial land use type to land use type k at time t; represents the suitability probability of converting pixel p to land type k at time t; The conversion of cell p to land type k is affected by the neighborhood factor. The inertia coefficient of type k at time t is denoted by I. The conversion cost from land type c to land type k is represented by SCc→k. The land use data for different scenarios is obtained by calculating the probability of each iteration, and the accuracy is verified to finalize the results.
2.3.3 Random forest model
Multiple decision trees are used in the Random Forest (RF) classifier, and the majority of the individual output categories determine the output category (Liu et al., 2020). To classify or regress through repeated binary data in the 1980s, Breiman and others used the classification tree algorithm, which significantly decreased the amount of calculation. According to Mansoor et al. (2013), Breiman combined the classification tree into a random forest in 2001. The technique entails creating multiple classification trees randomly from data rows and variables columns, followed by summarizing the outcomes.
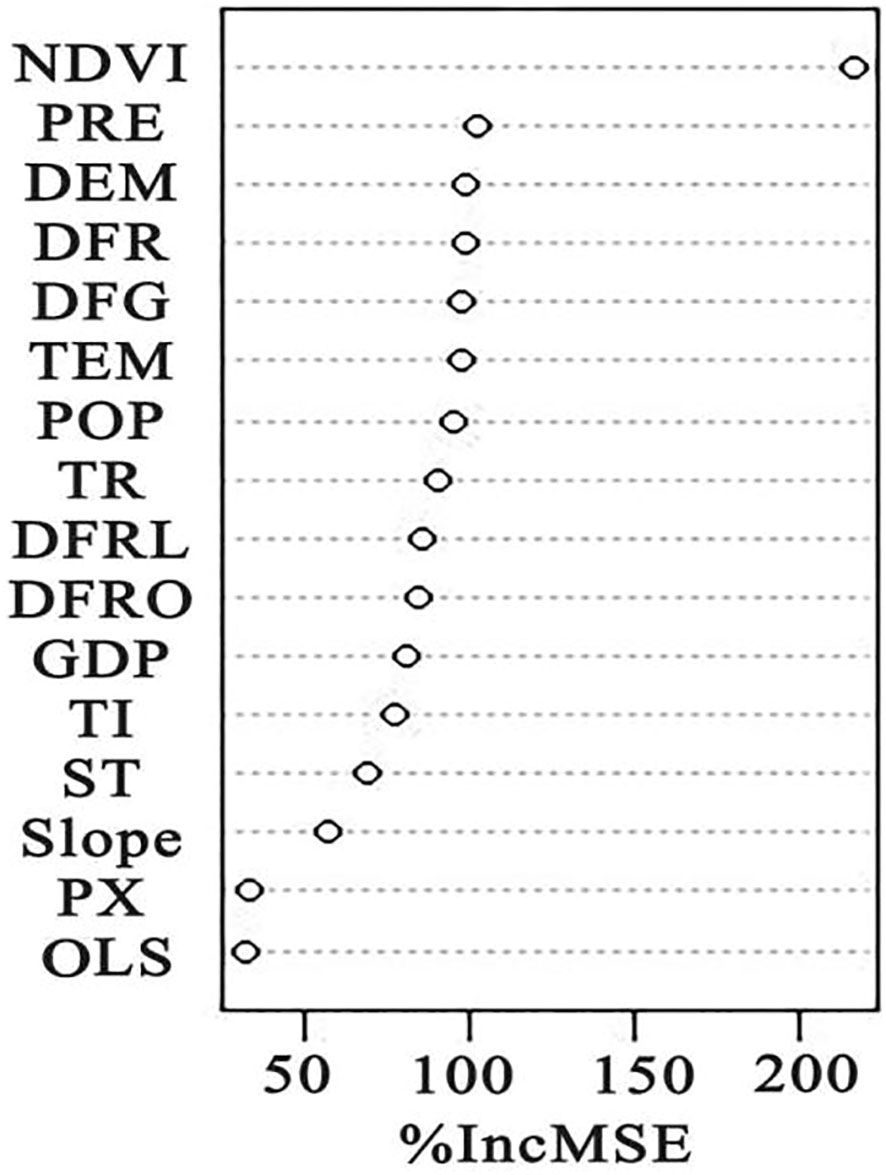
Typically, a random forest creates hundreds to thousands of classification trees at random before choosing the tree with the highest level of repetition as the outcome. The random forest algorithm evaluates the impact of each variable on the dependent variable by measuring the increase in the mean square error as a percentage at every level (% Inc MSE). Consequently, greater value implies greater importance of the variable. First, construct the ntree decision tree model and estimate the OBB mean square error of random replacement (ntree out-of-bag data composed of unsampled samples), and construct the following matrix:
Then calculate the importance score using the following formula:
The formula involves two variables, namely m which represents the number of variables, and n which represents the number of original data samples.
3 Results and analysis
3.1 Spatiotemporal changes of land use from 1990 to 2020
Grassland dominates the land use in the Gansu-Qinghai Yellow River region, making up more than 70% of the total area. Figure 3 shows that during the 30 years (1990–2020), the variation trend of different regions in the Ganqing section of the Yellow River Basin is shown in Figure 3. The cultivated land increases first and then decreases. In 2000, the cultivated land area is the largest, 434.35 × 10⁴ km2, and in 2017, the area is the least, 358.44 × 10⁴ km2. The area of forest land increased steadily in the past 30 years, with a total increase of 40.03 × 10⁴ km2. The overall shrub land showed a trend of fluctuation decline, the largest in 1990, and the least in 2016 was 29.97 × 10⁴ km2. The area of grassland fluctuated and then decreased significantly. In 2017, the area of grassland was the largest (2281.58 × 104 km2), and in 2000, the area of grassland was the smallest (2233.12 × 104 km2). During the past 30 years, the water area has shown a fluctuating upward trend. In 2020, the area was the largest at 25.01 × 10⁴ km2, and in 1997 the area was the smallest at 20.13 × 10⁴ km2. Unused land showed a fluctuating upward trend. The amount of unutilized land was the greatest in the year 2020, measuring 56.71 × 10⁴ km2, and the area was the lowest in 1992 at 39.43 × 10⁴ km2. The area of water has increased by 17.27 × 10⁴ km2 in 30 years. From 1990 to 2020, construction land increased year by year. In 2020, the largest area was 6.43 × 10⁴ km2, and the lowest area was 2.74 × 10⁴ km2 in 1990, for 30 years, there was a net growth of 3.68 × 10⁴ km2. The area of wetlands fluctuated first and then increased. In 1993, the area of wetlands was the largest at 1.98 × 10⁴ km2. In 2015, the area of wetlands was the smallest at 0.22 × 10⁴ km2. In 2000, the area of wetlands decreased the most at 0.63 × 10⁴ km2.
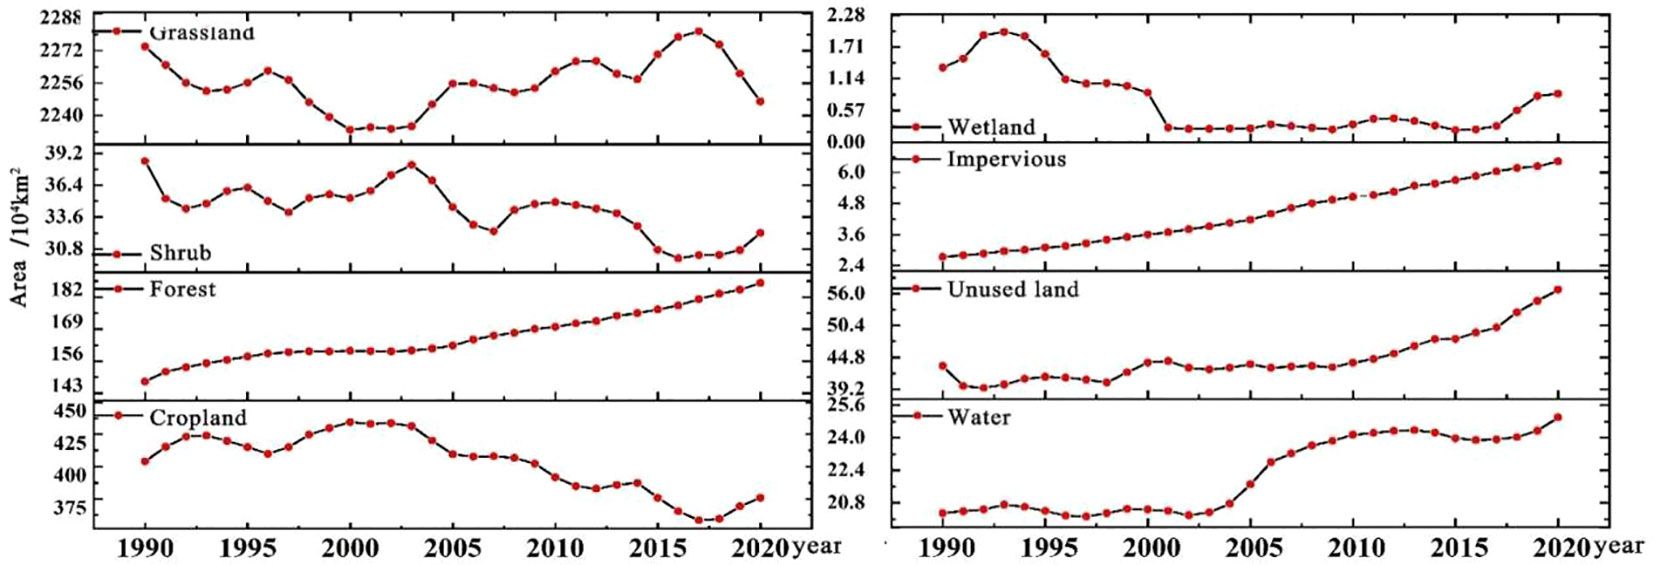
Figure 3 Area of land use types in the Gansu-Qinghai section of the Yellow River Basin from 1990 to 2020.
As shown in Figure 4, the main transfer direction and types of land use categories between years are depicted in the Sangki diagram. The area of land use types moved outward by a total of 2.45 × 10⁴ km2 between 1990 and 2000 (Figure 4A), making up 8.36% of the total area. With a total transfer area of 9.19 × 10³ km2, the conversion of grassland into agricultural land was the most significant in terms of size. The conversion of farmland to a grassy area came after that, with a total transfer area of 6.08 × 10³ km2. The transfer from wetland to forest land had the smallest total transfer area, at 0.08 km2. From 2000 to 2010 (Figure 4B), a total of 1.89 × 10⁴ km2 of various types of land were transferred outward, accounting for 6.46% of the total area, and the largest transferred area was still uncultivated land transferred to grassland, with a total transfer of 8.73 × 10³ km2, and the transfer area from water to wetland was the smallest, with a total transfer of 0.04 km2. From 2010 to 2020 (Figure 4C), a total of 2.22 × 10⁴ km2 was transferred outward, accounting for 7.57% of the total area. This showed that grassland area transferred from cultivated land was the largest, with a total transfer of 8.18 × 10³ km2, then the process of transforming a grassy terrain into an area suitable for agriculture, with a total transfer of 6.88 × 10³ km2, and the conversion of land from construction to forest was the least significant, with a total transfer of 0.04 km2.
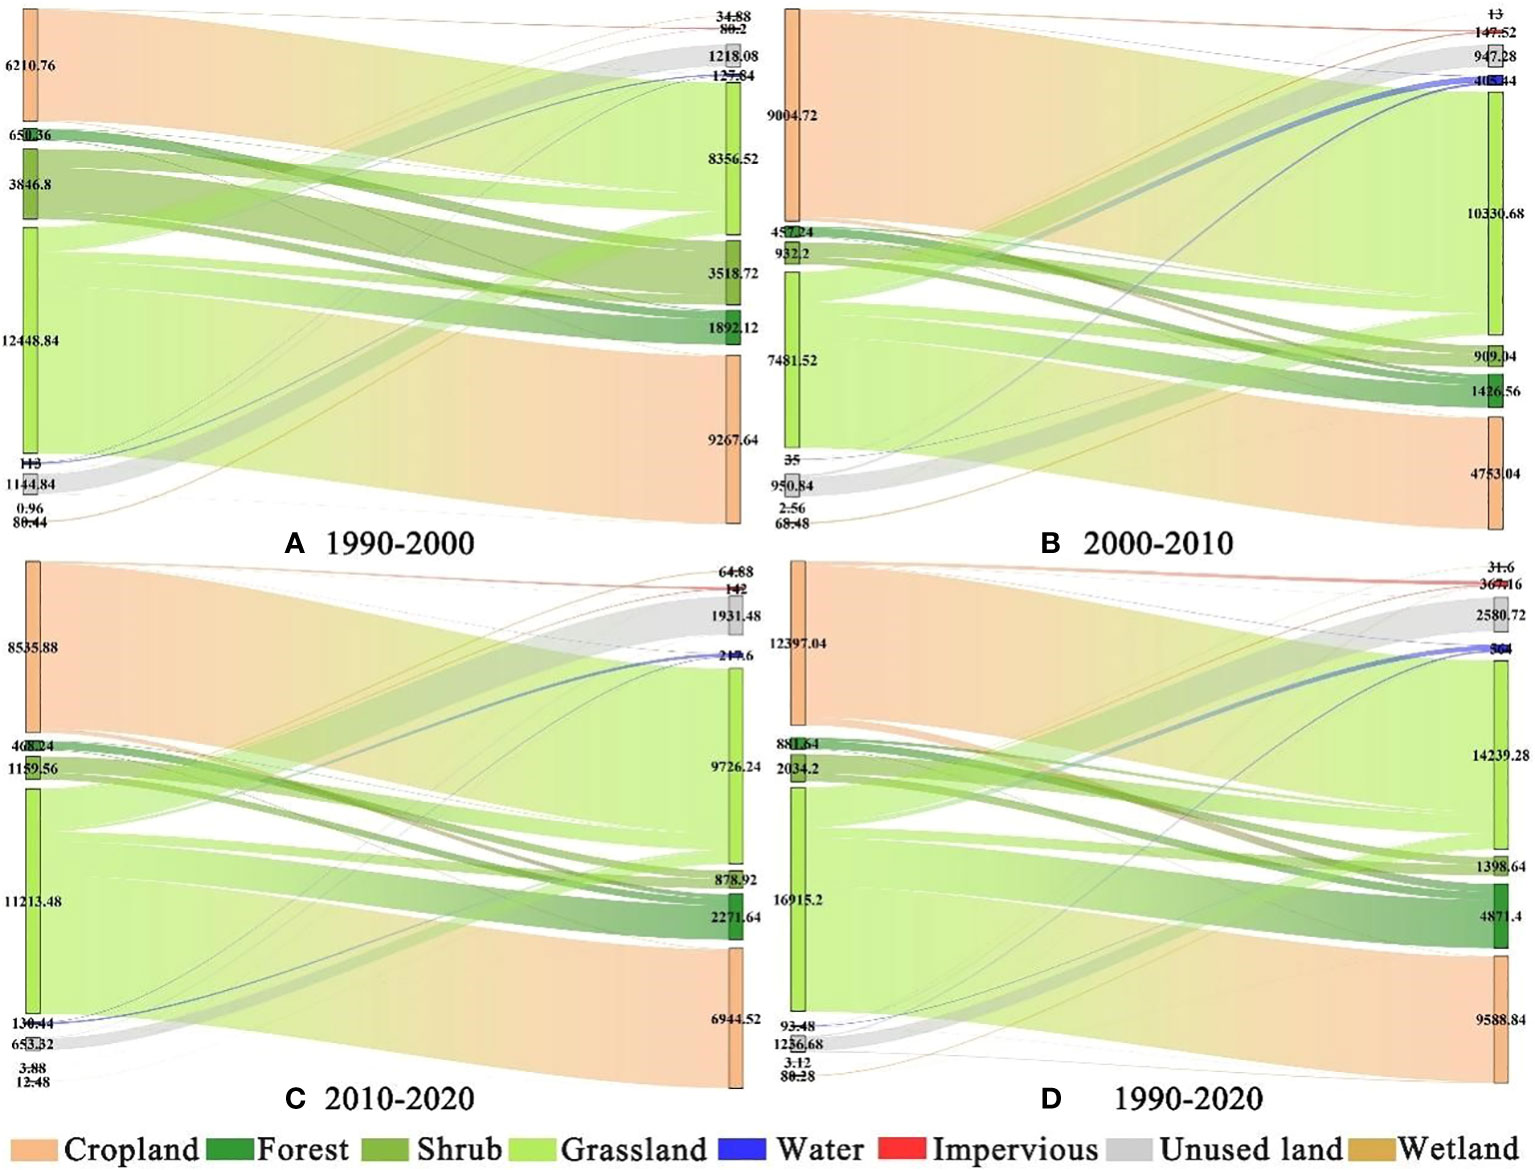
Figure 4 Sangki map of land use transfer in the Gansu-Qinghai section of the Yellow River Basin from 1990 to 2020 (A. land use transfer of 1990–2000; B. land use transfer of 2000–2010; C. land use transfer of 2010–2020; D. land use transfer of 1990–2020).
Between 1990 and 2020 (Figure 4D), there was a transfer of different types of land use amounting to 3.36 × 10⁴ km2, which is equivalent to 11.48% of the total area. The largest area that was transferred was cultivated land, measuring 1.14 × 10⁴ km2, while the smallest area was undeveloped land converted to construction land, which was only 0.04 km2.
According to Figure 5, the Gan-Qing section of the Yellow River Basin is divided by the Qinghai-Tibet Plateau and the Loess Plateau excess zone. The main land use type in the west is forest and grass land, and the main land use type in the east is cultivated land and construction land. From 1990 to 2020, the construction land exhibited a point-line expansion trend, mainly concentrated in in Lanzhou and Xining, the provincial capitals of Gansu and Qinghai provinces The cultivated land is mainly distributed in the Loess Plateau area of Gansu Province. It is concentrated in the Above the Baoji Gorge of Weihe River basin and Above the Zhangjiashan of Jinghe River and the east area of Daxia River and Taohe River. In the past 30 years, the cultivated land showed a decreasing trend, this was because urban construction land was rapidly expanding, causing a substantial amount of cultivated land to be occupied, and significant changes in land use patterns. The main land use type in the Ganqing section of the Yellow River Basin is grassland. It is widely distributed in Heyuan to Maqu basin, Maqu to Longyangxia basin, Above the Xiangtang of Datong River basin, Huangshui River basin, Daxia River and Taohe River basin The River basin. The forest land is distributed in the form of sheet or line. It is mainly located in the Above the Xiangtang of Datong River basin, Huangshui River basin, Daxia River and Taohe River basin, and the Main stream section of the transitional zone between the Qinghai-Tibet Plateau and the Loess Plateau Longyangxia to Lanzhou and Above the Zhuangtou of Beiluo River basin, mainly distributed in Heyuan to Maqu Basin and Maqu to Longyangxia Basin, Qinghai Province. It mainly includes Qinghai Lake, Zhaling Lake, Eling Lake, Longyangxia Reservoir and Liujiaxia Reservoir. The unused land is mainly distributed in the Maqu to Longyangxia basin.
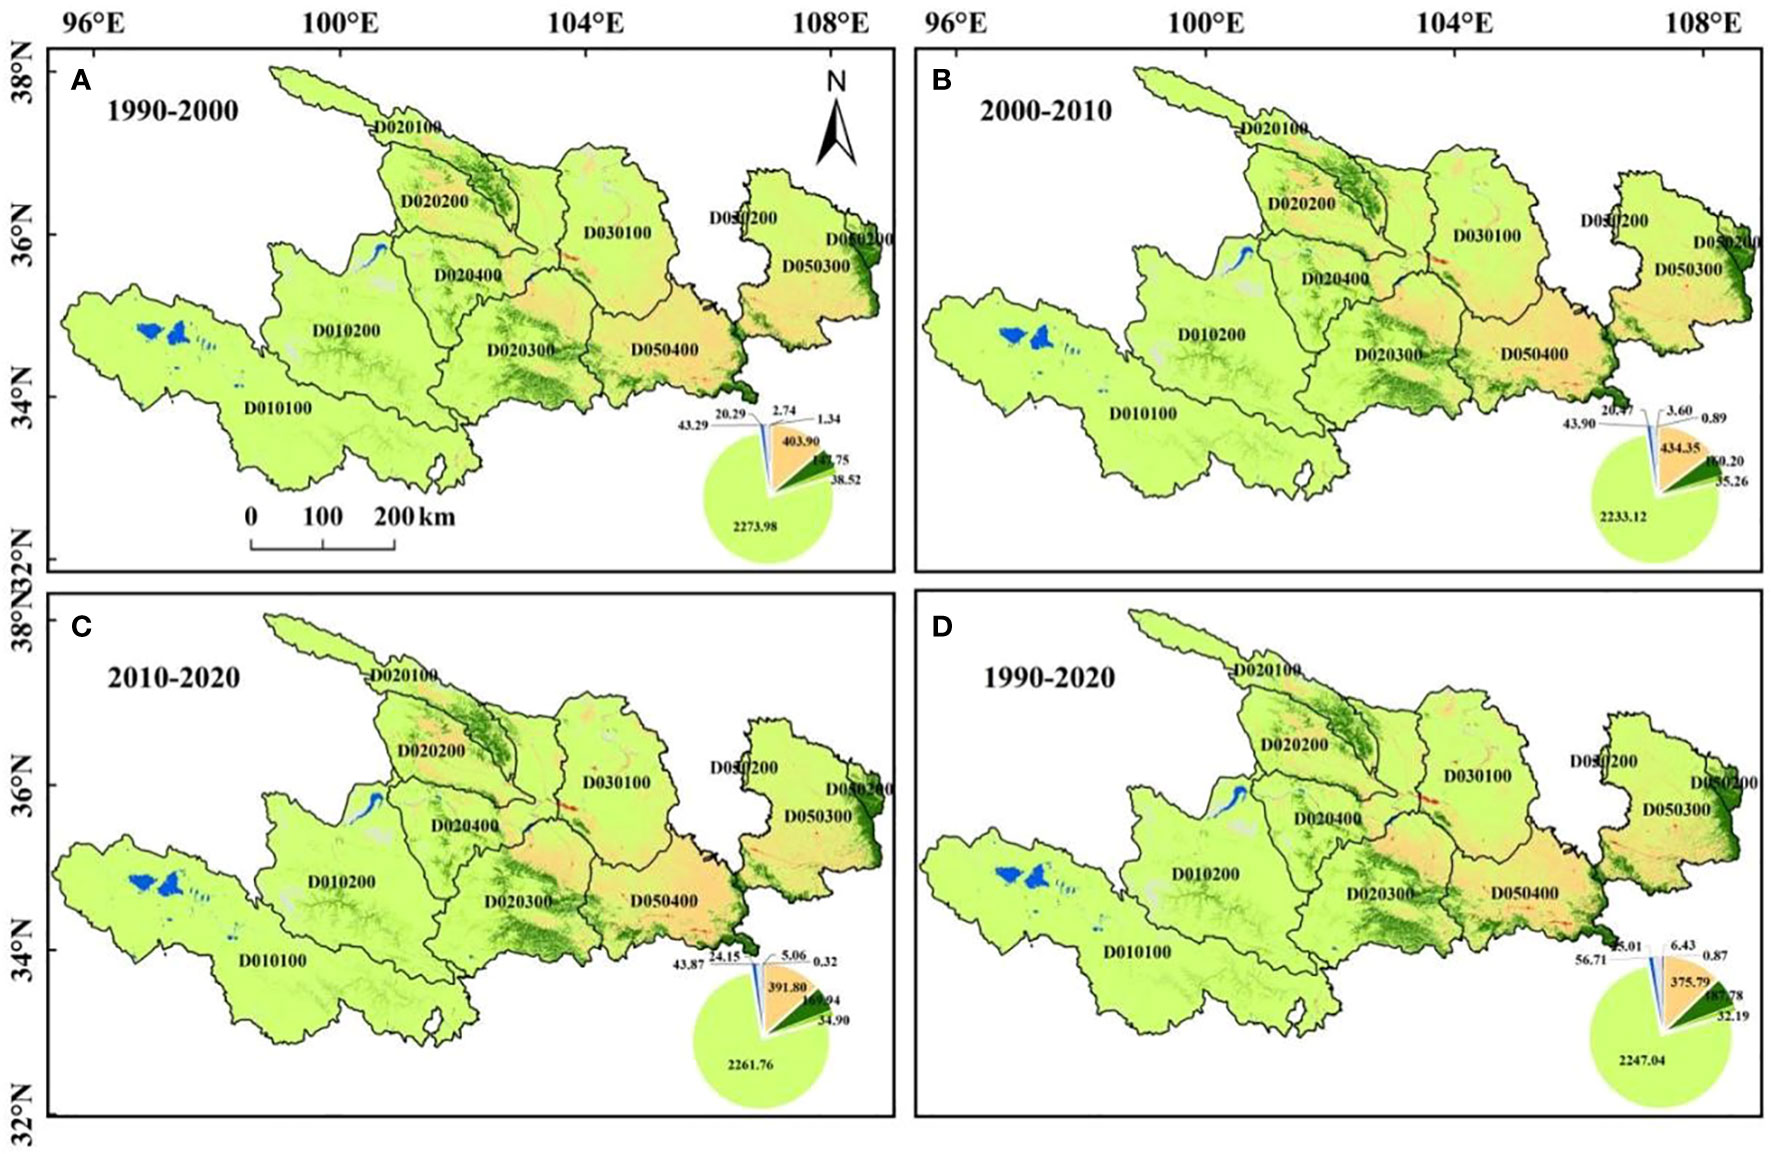
Figure 5 Land use types in the Gansu-Qinghai section of the Yellow River Basin from 1990 to 2020.(A. land use type of 1990–2000; B. land use of type of 2000–2010; C. land use type of 2010–2020; D. land use type of 1990–2020).
3.2 Temporal and spatial changes of habitat quality in the Ganqing section of the Yellow River Basin from 1990 to 2020
The average values of habitat quality from 1990 to 2020 were obtained by using the weighted average, which was 0.745, 0.744, 0.741, 0.743, 0.747, 0.748, and 0.747 (Table 4). This result showed that the overall habitat quality in the Gansu-Qinghai Yellow River is constantly increasing, and the changing trend is initially decreasing, then increasing, and subsequently decreasing. According to research, the habitat quality in various years is categorized into five grades based on the InVEST model: higher (0.8–1), high (0.6–0.8), medium (0.4–0.6), low (0.2–0.4), and lower (0–0.2). The overall habitat quality in the Ganqing section of the Yellow River Basin was in a higher grade (> 0.7). From 1990 to 2020, the ratios of lower, low, and high-grade habitat quality in the Gansu-Qinghai Yellow River have been increasing, with an increase of 0.579%, 2.615%, and 2.105%, respectively, in the past 30 years. The ratios of medium and high grades of habitat quality decreased continuously, by 3.568% and 1.740%, respectively. Among them, the areas with low habitat quality continue to increase, indicating that with the intensification of urbanization, the habitat quality in some areas continues to deteriorate. In addition, the continuous increase of higher-level areas shows that China’s conversion of farmland to forests and grassland projects and other ecological restoration projects have achieved significant results.

Table 4 Ratio of Habitat quality Grade in Gansu-Qinghai Reach of the Yellow River Basin from 1990 to 2020 (%).
In terms of time (Figure 6), the general habitat quality of the Gansu-Qinghai Yellow River showed a fluctuating upward movement from 1990 to 2020, with the lowest habitat quality in 2000 at 0.741 and the highest in 2017 at 0.751. Within the tertiary river systems of the Yellow River Basin (as depicted in Figures 6B–D), the watershed with the highest habitat quality is above the Beiluo River Zhuangtou, with a habitat quality of around 0.9, whereas the watershed with the lowest habitat quality is the watershed above the Baoji Gorge of the Weihe River, with habitat quality around 0.6. The watersheds of Qingshui River and Kushui River had obvious habitat quality modifications that occurred 30 years ago, and the transformation pattern was fluctuating initially and then increased with an obvious rising trend. The habitat quality of the watershed from Lanzhou to Xiaheyan and the watershed above Zhangjiashan of the Jinghe River showed a fluctuating upward trend, while the habitat quality of the other sub-basins did not change much in the past 30 years.
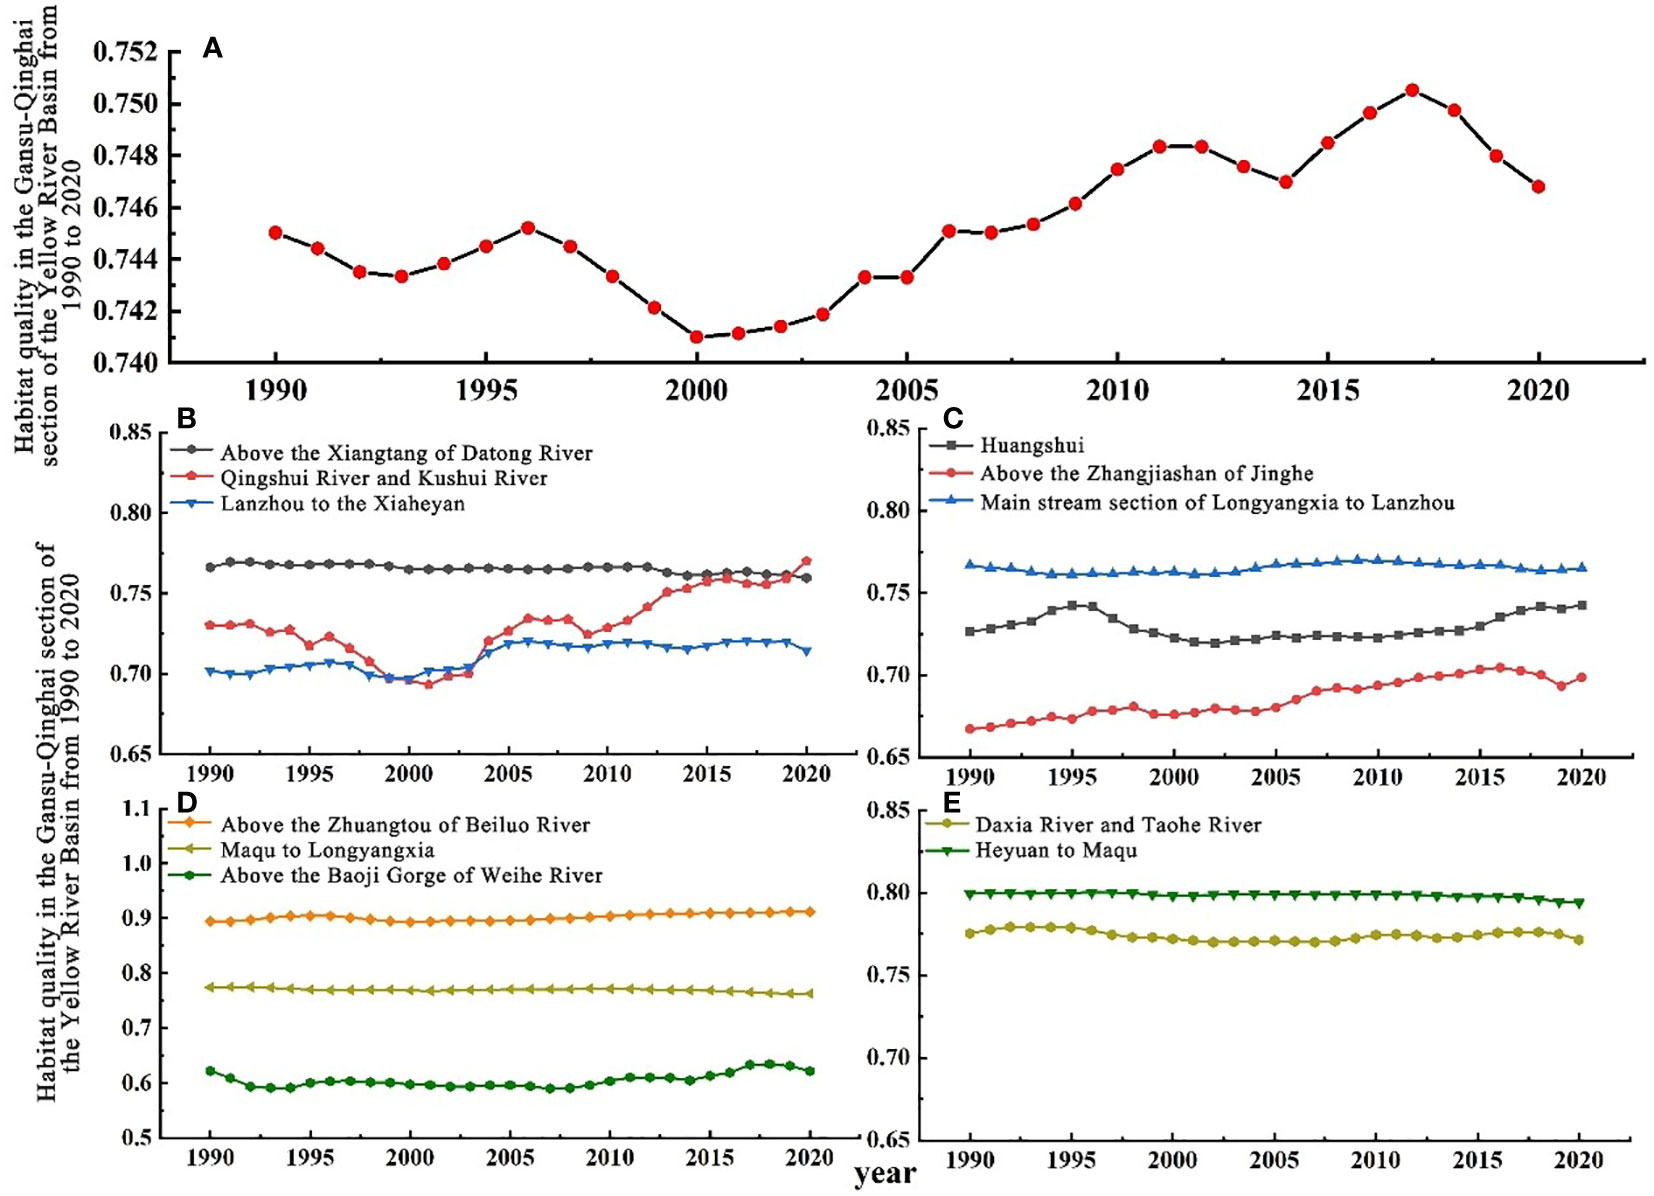
Figure 6 Habitat quality in the Gansu-Qinghai section of the Yellow River Basin from 1990 to 2020 (A) and habitat quality changes in different sub-basins (B–E).
In terms of space, the overall habitat quality of the study area presents a spatial feature of high in the west and low in the east, with the transitional zone between the Qinghai-Tibet Plateau and the Loess Plateau as the dividing line. The overall habitat quality of the east region is lower, while that of the west region is higher (Figure 7), which is basically consistent with the spatial characteristics of land use type. The low grade habitat quality areas were concentrated in Lanzhou City of Gansu Province and Xining City of Qinghai Province. This region is the capital city of Gansu Province and Qinghai Province, with high population and economic density, frequent human activities, large construction land area, and poor habitat quality. The lower grade and medium grade habitat quality areas were concentrated in the northeast of the study area. Including the Above the Zhangjiashan of Jinghe basin, the Above the Baoji Gorge of Weihe River basin and the area east of the Daxia River and Taohe River, The overall level of economic development in this region is relatively high, the main land type is cultivated land, and human activities have a great disturbance to the habitat. The regions with high habitat quality are mainly distributed in the Heyuan to Maqu and Maqu to Longyangxi basins in the upper reaches of the Yellow River Basin, and the distribution is relatively concentrated. In the Maqu to Longyangxia Basin, there are scattered areas with lower grade habitat quality. The ecological fragility in this region makes the habitat quality easily disturbed and destroyed, especially the distribution of unused land in this region, which is the main reason for the low habitat quality. In this region, the quality of habitat changed from higher grade to high grade and from lower grade to middle and high grade.
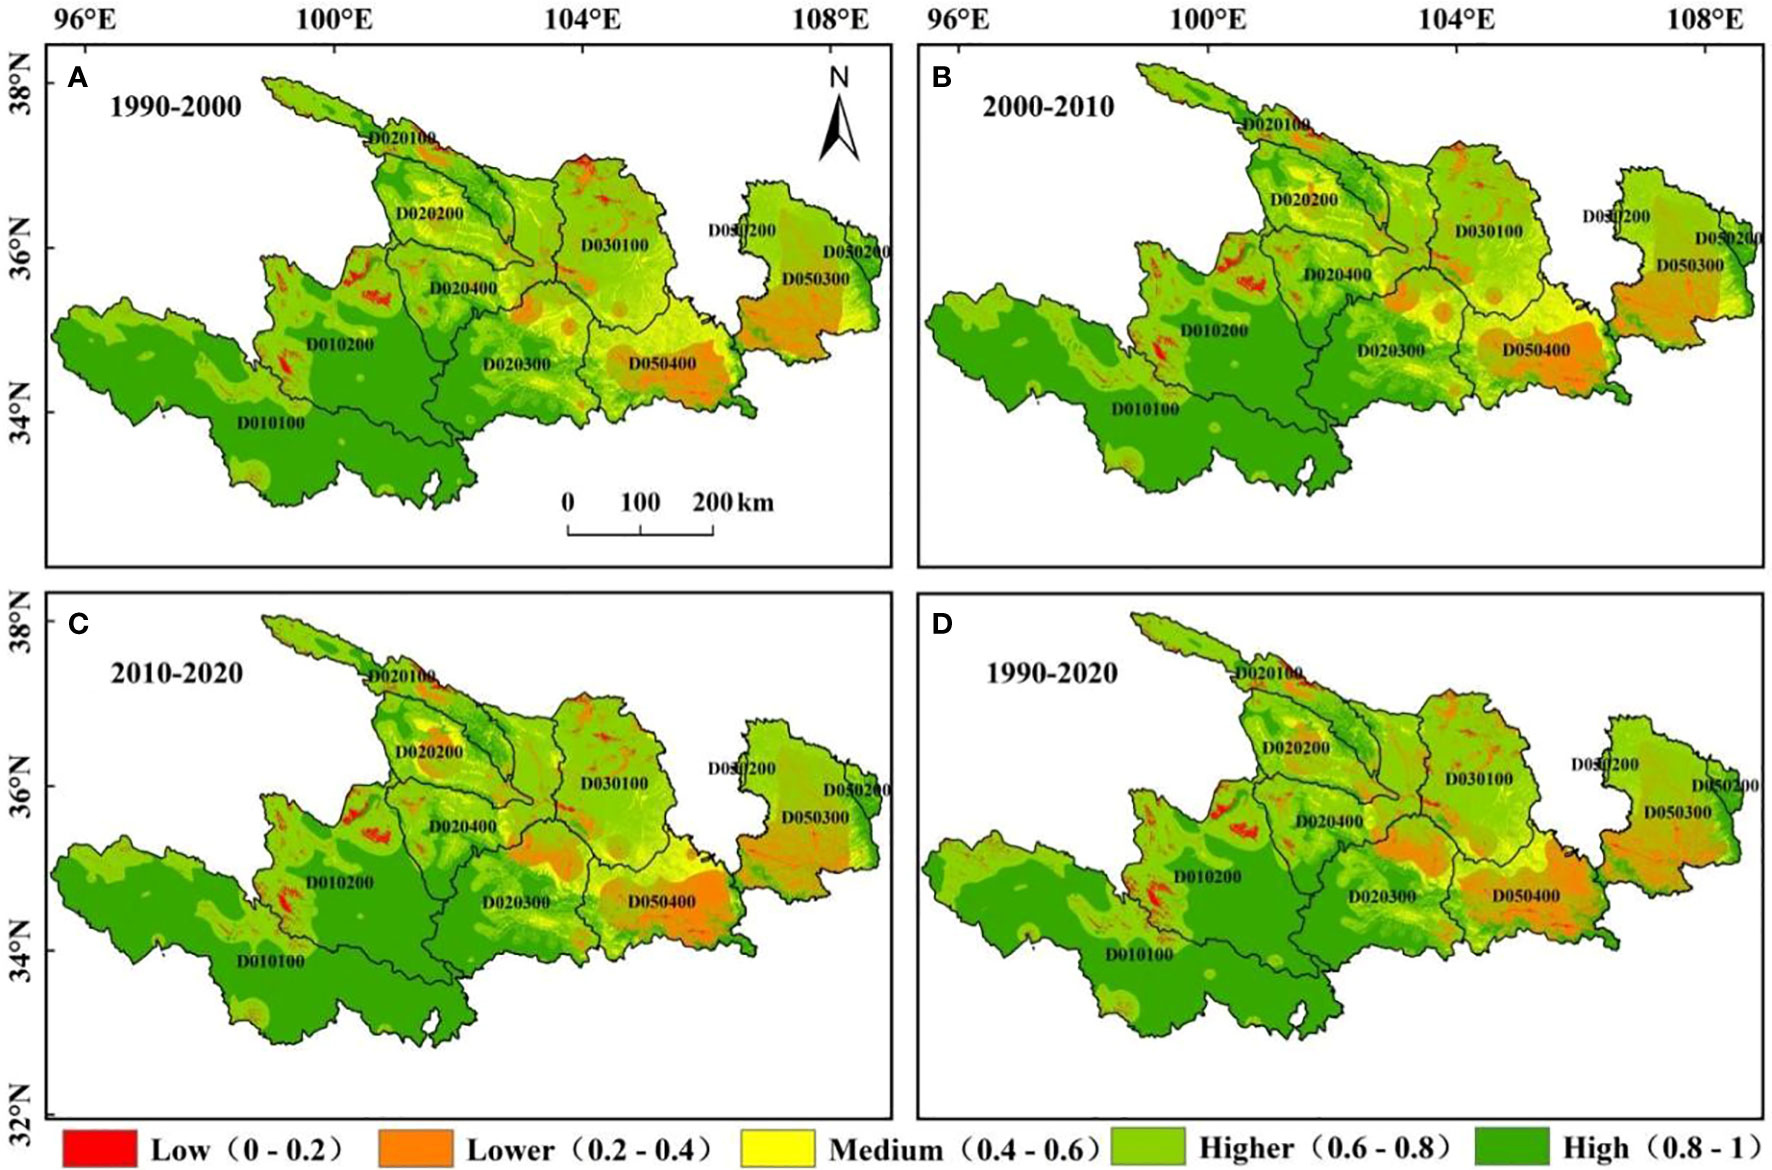
Figure 7 Spatial distribution of habitat quality in Gansu-Qinghai section of theYellow River Basin from 1990 to 2020 (A. spatial distribution of habitat quality 1990–2000; B. spatial distribution of habitat quality 2000–2010; C. spatial distribution of habitat quality 2010–2020; D. spatial distribution of habitat quality 1990–2020)
From 1990 to 2020, habitat quality change in the Gansu-Qinghai Yellow River section showed that the gain area was slightly smaller than the loss area. The gain area was 12.55 × 10⁴ km2 and the loss area was 16.76 × 10⁴ km2. There is a lot of spatial heterogeneity as evidenced by the alteration in the quality of the living environment. While the quality of habitat in the central and western regions is declining, it has improved significantly in the east (Figure 8D). the areas with significant loss of habitat quality were mainly distributed in the Daxia River and Taohe River basins and Above the Baoji Gorge of Weihe River basins, which were the areas with faster urbanization. Loss predominated the alteration in the quality of the living environment between 1990 and 2000 (Figure 8A), with the loss area reaching 20.27 × 10⁴ km2 or 75.31% of the total area. It was concentrated in Gansu Province in space, including the southern part of the Lanzhou to the Xiaheyan Basin, the eastern part of the Daxia River and Taohe River basin, and most of the Above the Baoji Gorge of Weihe River basin. The gain area is scattered., with a total area of 9.04 × 10⁴ km2. Habitat quality increased significantly between 2000 and 2010 (Figure 8B), with a gain area of 20.38 × 10⁴ km2 compared to a loss area of 8.93 × 10⁴ km2. It is distributed in the upper reaches of the Yellow River basin, Huangshui Basin, Above the Baoji Gorge of Weihe River basin and other river basins. From 2010 to 2020 (Figure 8C), the habitat quality declined significantly, with the gain area reaching 10.41 × 10⁴ km2 and the loss area reaching 18.90 × 10⁴ km2. From a spatial point of view, the western portion of the study region’s overall habitat quality is declining, but the degree of loss is not high, as the loss in the central area is relatively high and mainly concentrated in the surrounding cities of Lanzhou City, Gansu Province. Areas with obvious gains include Tianshui City and the eastern part of Qinghai Province.
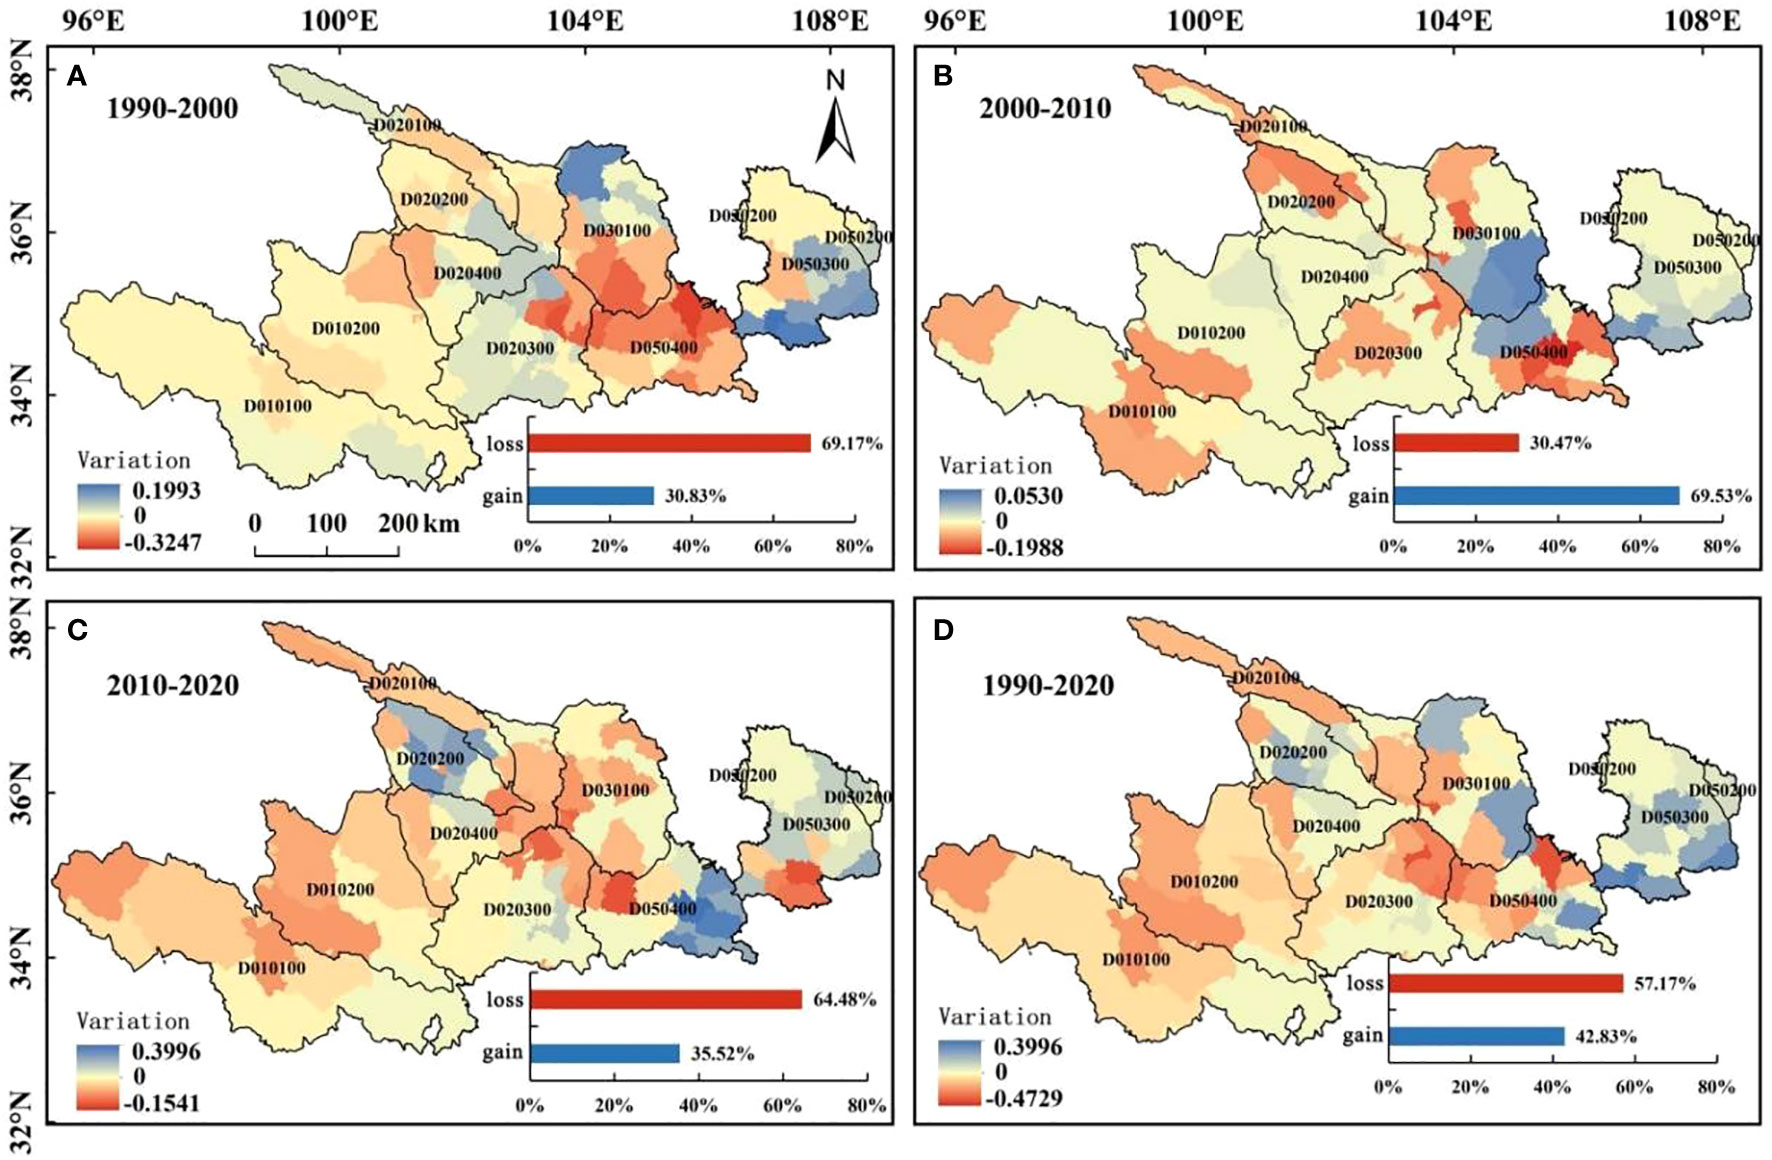
Figure 8 Spatial distribution of habitat quality changes in the Gansu-Qinghai section of the Yellow River Basin from 1990 to 2020. (A. habitat quality change of 1990–2000; B. habitat quality change of 2000–2010; C. habitat quality change of 2010–2020; D. habitat quality change of 1990–2020).
3.3 Simulation of land use change in the Gansu-Qinghai section of the Yellow River Basin under multiple scenarios
The simulation effect of land use change in the Gansu-Qinghai Yellow River section in 2020 was enhanced. As a result, the spatial distribution pattern of land use in Gansu-Qinghai Yellow River in 2030 was simulated using the land use types in the Gansu-Qinghai Yellow River in 2020.
Therefore, construct natural development scenarios (NADS), cultivated land protection scenarios (COPS), ecological protection scenarios (ECPS), and rapid development scenarios (RADS), respectively set up different transition matrices, and combine the land use type files of the Gansu-Qinghai Yellow River in 2020 to conduct cellular automaton analysis, and then predict 2030 Spatial pattern of land use in the Gansu-Qinghai Yellow River.
Based on the settings of the above four development scenarios, the land use distribution in the Gansu-Qinghai Yellow River in 2030 was simulated, and the land use structure in 2030 and the difference between the land use area in 2020 and the land use area in 2020 under the four scenarios were obtained through the spatial module of ArcGIS. It can be seen from Table 5 that under the natural development scenario, the area of simulated grassland, shrubland, and unused land in 2030 decreased by 1321.72 km2, 254.62 km2, and 256.23 km2 compared to 2020; the area of construction land decreased by 99.72 km2, and the wetland area decreased by 1.08 km2. The areas of water area, forest land, and cultivated land increased by 1171.30 km2, and 82.81 km2, 679.26 km2, respectively, and the condition of the ecosystem in the river basin appeared to have been enhanced.
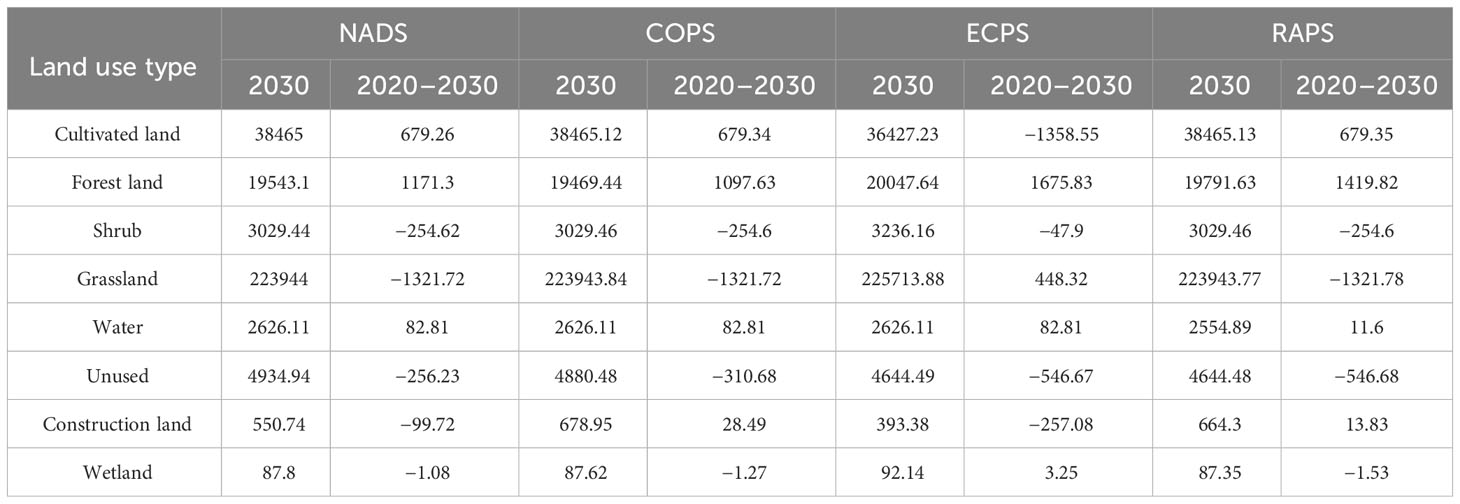
Table 5 Land use area under four scenarios in the Gansu-Qinghai section of the Yellow River Basin in 2030 and the difference between land use area in 1990 and 2020/km 2.
According to the scenario of protecting cultivated land, the area of cultivated land increased by 679.34 km2, with a corresponding increase in its proportion by 1.80%. Moreover, there were increases in the areas of forest and water by 82.81 km2 and 1097.63 km2 respectively. However, the area of construction land only slightly increased by 28.49 km2. Grassland, water area, wetland, and shrubland all saw decreases in the area of 822.88 km2, 1321.72 km2, 310.68 km2, and 1.27 km2, respectively.
In the scenario of ecological protection, the protection of ecological land (that is, forest land, water area, grassland, and wetland) is the most important goal, thus the simulated forest land area in 2030 increased by 1675.83 km2, and grassland, water area, and wetland increased by 448.32 km2, 82.81 km 2, and 3.25 km2, and in total, there was a reduction of 257.08 km2 in the amount of land designated for construction. The primary reason for the expansion of ecological land was the transfer of farmland and undeveloped land, which decreased by 1358.55 km2 and 546.67 km2, respectively.
Under the scenario of rapid development, the extension of construction land is the basic symbol of rapid economic development. Construction land now covers a larger area of 13.83 km2. The arable land area increased by 679.35 km2, while the shrub land area shrank by 254.60 km2. Wetland area and undeveloped land area both fell by 546.68 km2 and 1.53 km2, respectively.
The Gansu-Qinghai Yellow River’s land use simulation results for 2030 under each of the four scenarios revealed an increase in the area of ecologically beneficial land, such as water area, forest land, and wetland, while a decrease in the area of economically beneficial land, such as cultivated land and unused land. The river basin’s ecological environment is steadily improving into a healthy state.
3.4 Characteristics of habitat quality changes in the Gansu-Qinghai section of the Yellow River Basin under multiple scenarios
With regards to the process of growth that occurs without human intervention, the mean values of habitat quality in 1990, 2020, and 2030 are 0.745, 0.747, and 0.748, showing a rising trend. Compared with 2020 (Table 6), the ratios of lower, low, and high grades of habitat quality in the Gansu-Qinghai Yellow River section have been decreasing and then increased by 0.27%, 0.10%, and 2.00% respectively in the past 10 years. The ratios of medium and high grades increased continuously, increasing by 0.49% and 2.56% respectively. The area with low habitat quality has increased, suggesting that the natural environment in the majority of the watershed’s locations tends to be better as time goes by, indicating that various ecological restoration projects in China will achieve significant results in the study area. Compared with 1990, the ratios of low, lower, higher, and high grades are all increasing by 0.31%, 2.52%, 0.10%, and 0.82%, respectively. The proportion of the middle class is decreasing, by 3.08% in 40 years.

Table 6 Ratio of habitat quality levels (%) in Gansu-Qinghai section of the Yellow River Basin under four scenarios.
The average habitat quality values for the three scenarios—cultivated land protection, ecological protection, and rapid development—were, in that order, 0.748, 0.753, and 0.748. On average, the ecological protection scenario had the best quality of habitat, whereas the rapid development and cultivated land protection scenarios had the lower average quality of habitat. The mean value of habitat quality under the protection of cultivated land scenario and the rapid development scenario is not significantly different because, under the rapid development scenario, the demand for cultivated land is second only to that of construction land, and the area of construction land in the study area is small. According to the ecological protection scenario, only 9.01% of the watershed’s total area is made up of low and lower grades in the study area, while 39.53% of the watershed’s total area is made up of high grades. Under the ecological protection scenario, the watershed has a high level of habitat quality.
Under the four scenarios from 2020 to 2030, habitat quality changes in the Gansu-Qinghai Yellow River section showed that the gain area is greater than the loss area. In the NADS (Figure 9A), the gain area occupies 57.23% of the entire watershed area, totaling 16.77 × 10⁴ km2, while the loss area accounts for 42.77% of the watershed area, amounting to 12.54 × 10⁴ km2. Significant spatial heterogeneity in habitat quality was evident. While it decreased in the western and central regions, habitat quality in the northeast was noticeably improved. The habitat quality of Above the Baoji Gorge of Weihe River basin, Daxia River and Taohe River basin have significant loss. This area is a densely populated area in Gansu and Qinghai provinces, and the increase of construction land is relatively obvious, which reduces the quality of habitat. In the COPS (Figure 9B), the change in habitat quality was dominated by gain, and the gain area accounts for 53.49% of the total area. The change in habitat quality under the ECPS (Figure 9C) was a result of all gains. In terms of space, the areas with a higher degree of gain is the Loess Plateau region. Including Lanzhou to the Xiaheyan Basin, Above the Baoji Gorge of Weihe River basin, Above the Zhangjiashan of Jinghe basin, Huangshui basin. During the fast development period depicted in Figure 9D, 80.27% of the entire watershed area experienced an improvement in habitat quality, while the remaining 19.73% suffered a decline in habitat quality. From a spatial point of view, although most regions within the examined territory are experiencing growth, the degree of gaining is not high. The areas with the most obvious gains is in the northern part of Lanzhou to the Xiaheyan Basin.
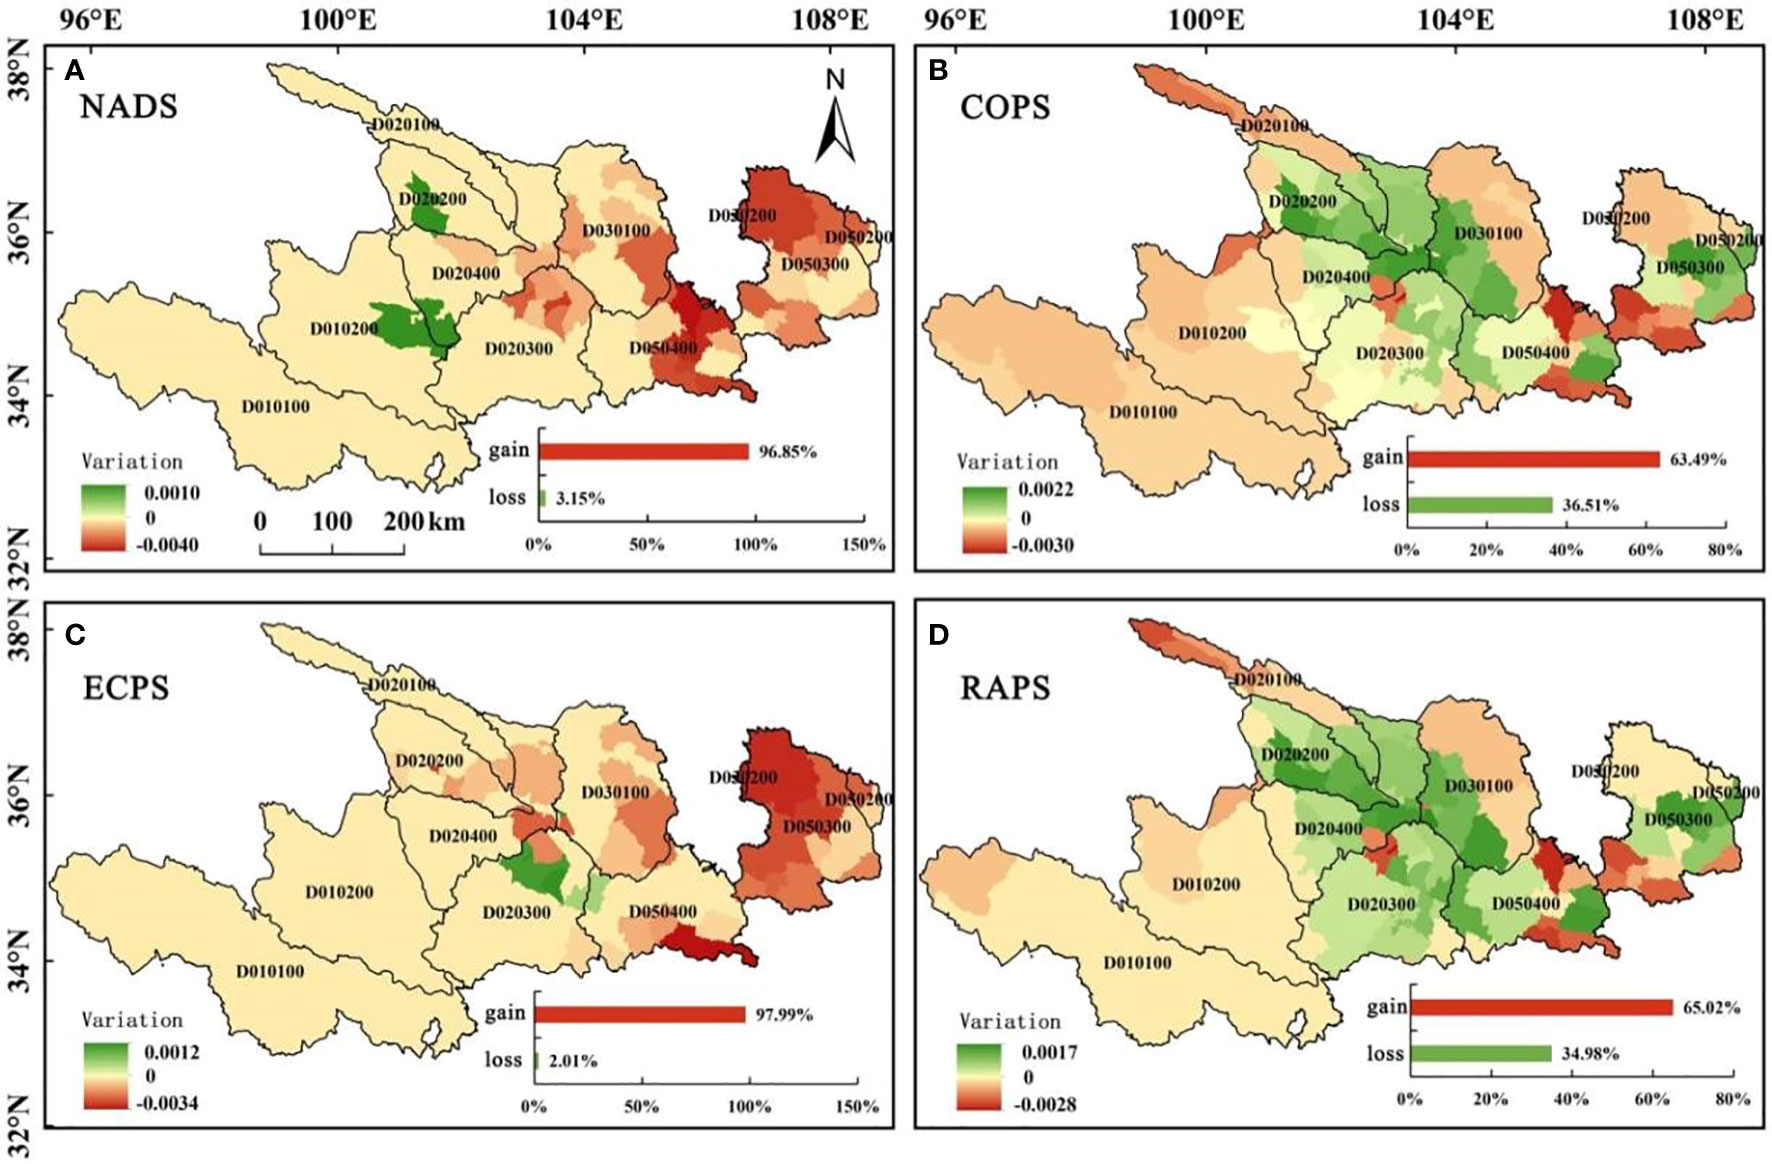
Figure 9 Changes in habitat quality in Gansu-Qinghai section of the Yellow River Basin from 2020 to 2030. (A. habitat quality of Natural development scenario; B. habitat quality of Ecological protection scenario; C. habitat quality of Ecological protection scenario; D. habitat quality of Rapid development scenario).
4 Discussion
4.1 Analysis of influencing factors of habitat quality
In this paper, 10 natural factors and 6 socioeconomic factors were selected, and the influence degree of 16 factors on habitat quality was explored through a random forest model, and the spatial resolution of each factor and habitat quality was unified as 100 m × 100 m. According to Figure 10, the Gansu-Qinghai Yellow River region is more affected by natural factors than socioeconomic ones when it comes to habitat quality. The most significant factor that affects habitat quality is NDVI, and its impact is significantly greater than other factors. In addition to NDVI, the higher degree of impact on habitat quality was as follows: PRE, DEM, DFG, TEM, POP, TR, DFRL, DFRO, GDP, TI, ST, Slope, and the degree of influence was not much different. Factors with low impact on habitat quality are slope, PX and OLS.
4.2 Comparative analysis of the results of related studies
To solve the ecological problems of the Gansu-Qinghai Yellow River section, China has introduced many policies and renovation projects. For example, in 2005, the State Council approved the implementation of the “Overall Plan for Ecological Protection and Construction of the Sanjiangyuan Nature Reserve in Qinghai” to rectify the ecological problems in the Sanjiangyuan area. The implementation of the “Three North Project” on the Loess Plateau (LP) has improved the natural environment of the LP area, increased forest coverage, and solved ecological problems such as soil erosion on the LP. It is precise because of the implementation of these renovation projects and the continuous strengthening of human protection of the ecological environment that the habitat quality of the Gansu-Qinghai Yellow River section has been significantly improved, which is the lowest inflection point of habitat quality in 2000 in this study. This is consistent with the improved results and also reflects the significant achievements China has made in the governance of the region. The findings are comparable to the study conducted by Zhang et al. (2021) that examined the changes in the ecological conditions within the Yellow River Basin.
According to the results of this investigation, it was observed that there was a noteworthy reduction in the standard of living in the research zone during 2017 and that the change in habitat quality from 1990 to 2020 generally showed that the area of the degraded area was greater than that of the gaining area, and the area of the habitat degraded area was higher than that of the optimized area. This research result is similar to the result that Ren et al. (2022) pointed out that the habitat quality will decline from 2015 to 2020 in the study of ecosystem services in the Yellow River Basin’s middle reaches. The reason for this phenomenon may be that although projects such as returning farmland to grasslands and forests have played a crucial part in enhancing the ecological environment’s quality in the early stage, as time goes by, some disadvantages will also occur. Excessive vegetation restoration may not bring continuous optimization of the ecological environment but will cause unfavorable competition among various vegetation types, resulting in the death of a large number of understory vegetation and the reduction of habitat quality according to Lin et al. (2020). This study also confirmed that ecological environmental problems may occur in the long-term project of converting farmland to grass (forest). As a result, it’s crucial to develop a sensible plan for land use that is founded on the utilization of land, to enhance the quality of the Gansu-Qinghai Yellow River’s habitat, reduce the damage to natural landscapes such as grassland, forest land, and lake wetlands, increase investment in wetland restoration, and form a scientific effective ecological protection mechanism, but at the same time, it is necessary to eliminate the negative effects caused by over-protection.
The habitat quality level in 2030 under the four scenarios of the Gansu-Qinghai Yellow River section will be ECPS > NADS > RADS > COPS. The variation in land use within the study area could be responsible for the slightly higher average habitat quality in the fast-paced development scenario compared to the scenario where land is protected for cultivation. Conversely, 0.22% of the Yellow River Basin’s total area is made up of construction land in the Gansu-Qinghai section, while 10% of the basin’s total area is made up of cultivated land. Thus, the expansion of the RADS is not strong. Judging from the coupling results of habitat quality and land use change in various simulated scenarios, the ECPS has the best coupling and coordination improvement effect. The RADS can be selected for the development model of the stage, but the conversion of different land uses must be strictly implemented according to the conversion principle matrix established in the simulation scenario; if the future policy guidance of the basin focuses on ecological benefits, the ECPS can be selected.
4.3 The limitations of this research
This study has shortcomings. First of all, it is the first attempt to estimate the habitat quality based on the annual China Land Cover Dataset (CLCD) produced by two professors Yang and Huang of Wuhan University on the GEE platform. The determination of the sensitivity coefficient of the threat source is obtained by referring to several works of literature, and it is not a specific coefficient obtained for this research area. Additionally, the intricate procedure of altering the purpose of the land is impacted by various natural and socio-economic factors that propel it forward. Even though a variety of land use types are affected significantly by these factors, in this study, a total of 15 natural socio-economic factors were chosen as the driving factors for simulating the future land use pattern. The final simulation result is highly accurate and the land use type has a good fitting effect, but it ignores the influence of policy factors like the ecological protection red line, the permanent basic farmland boundary, and the urban development boundary on land use change.
5 Conclusions
This study investigates the characteristics of land use change and spatial and temporal patterns of habitat quality in ecologically fragile areas on a long-term scale. At the same time, 15 factors such as natural society are selected to influence the habitat quality, and finally explore the features of future land use and habitat quality changes in the study area from four perspectives: cultivated land protection scenario, natural development scenario, rapid development scenario, and ecological protection scenario. The main conclusions obtained were:
(1) Grassland is the main land use type in the Ganqing section of the Yellow River Basin, accounting for over 70% of the total area. Cultivated land and forest land respectively account for about 13% and 6% of the basin. From 1990 to 2020, the area of construction land and forest land showed an increasing trend year by year, while the area of unused land and water area showed a fluctuating increasing trend. The overall area of cultivated land, wetlands, grasslands, and shrublands showed a fluctuating decreasing trend. The Ganqing section of the Yellow River Basin is roughly divided by the transitional zone between the Qinghai Tibet Plateau and the Loess Plateau in space. The main land use types to the west are forests and grasslands, and to the east are farmland and construction land.
(2) The habitat quality of forests, grasslands, and water bodies in the Ganqing section of the Yellow River Basin is high, while the habitat quality of cultivated land and construction land is low. From 1990 to 2020, the habitat quality of the Ganqing section of the Yellow River Basin decreased slightly and then increased. Over the past 30 years, the change in habitat quality showed that the gain area was slightly smaller than the loss area, and the overall habitat quality improved, showing spatial heterogeneity of “enhanced in the east and weakened in the central and western regions”.
(3) Compared to 2020, under the four scenarios, the area of arable land, forest land, and water area significantly increased in 2030, while the area of grassland and unused land decreased. Among them, the increase in construction land was significant under the scenarios of arable land protection and rapid development. Under the four scenarios, the habitat quality of the Ganqing section of the Yellow River Basin continues to improve, manifested as a decrease in the area of low value areas and a significant increase in the area of high value areas. Among them, the average habitat quality is the highest under the ECPS, while it is relatively low under the COPS and the RAPS.
Data availability statement
The original contributions presented in the study are included in the article/supplementary material. Further inquiries can be directed to the corresponding author.
Author contributions
JY: conceptualization, methodology, software, and writing—original draft preparation. BX: reviewing and editing. DZ: visualization and supervision. EM-M: Language proofreading. TP: Funding acquisition, Writing—review and editing. All authors contributed to the article and approved the submitted version.
Funding
This research was funded by the Gansu Agricultural University publicly introduced doctoral research start-up fund (GAU-KYQD-2017-35).
Conflict of interest
The authors declare that the research was conducted in the absence of any commercial or financial relationships that could be construed as a potential conflict of interest.
Publisher’s note
All claims expressed in this article are solely those of the authors and do not necessarily represent those of their affiliated organizations, or those of the publisher, the editors and the reviewers. Any product that may be evaluated in this article, or claim that may be made by its manufacturer, is not guaranteed or endorsed by the publisher.
References
Bai L., Xiu C., Feng X., Liu D. (2019). Influence of urbanization on regional habitat quality:a case study of Changchun City. Habitat Int 93, 102042. doi: 10.1016/j.habitatint.2019.102042
Bongaarts J. (2019). Summary for policymakers of the global assessment report on biodiversity and ecosystem services of the Intergovernmental SciencePolicy Platform on Biodiversity and Ecosystem Services. Popul. Dev. Rev. 45, 680–681. doi: 10.1111/padr.12283
Gao L., Tao F., Liu R., Wang Z., Leng H., Zhou T. (2022). Multi-scenario simulation and ecological risk analysis of land use based on the PLUS model: a case study of Nanjing, Sustain. Cities Soc 85, 104055. doi: 10.1016/j.scs.2022.104055
Gomes E., Inácio M., Bogdzevi K., Kalinauskas M., Karnauskaitë D., Pereira P. (2021). Future land use changes and its impacts on terrestrial ecosystem services: a review. Sci. Total Environ. 781, 147716. doi: 10.1016/j.scitotenv.2021.146716
Hall L., Krausman P., Morrison M. (1997). The habitat concept and a plea for standard technology. Wildlife Soc. Bull. 25 (1), 173–182. doi: 10.2307/3783301
Karimi H., Jafarnezhad J., Khaledi J., Ahmadi A. (2018). Monitoring and prediction of land use/land cover changes using CA-Markov model: a case study of Ravansar County in Iran. Arab. J. Geosci. 11 (19), 592. doi:10.1007/s12517-018-3940-5
Liang X., Guan Q., Clarke K., Liu S., Wang B., Yao Y. (2021). Understanding the drivers of sustainable land expansion using a patch-generating land use simulation (PLUS) model: a case study in Wuhan, China, Environ. Urban Syst. 85, 101569. doi: 10.1016/j.compenvurbsys.2020.101569
Liang X., Liu X., Li X., Chen Y., Tian H., Yao Y. (2018). Delineating multi-scenario urban growth boundaries with a CA-based FLUS model and morphological method. Landsc. Urban Plan. 177, 47–63. doi: 10.1016/j.landurbplan.2018.04.016
Lin Y., Li Y., Yu W., Bu T., Huang R. (2020). Quantitative assessment of the impact of the vegetation restoration project on water-energy balance in 12 typical basins of the middle Yellow River. Geographical Res. 39 (11), 2593–2606. doi: 10.11821/dlyj020190744
Liu Y., Huang X., Yang H., Zhong T. (2014). Environmental effects of land-use/cover change caused by urbanization and policies in Southwest China Karst area-A case study of Guiyang. Habitat Int. 44, 339–348. doi: 10.1016/j.habitatint.2014.07.009
Liu X., Liang X., Li X., Xu X., Ou J., Chen Y., et al. (2017). A future land use simulation model (FLUS) for simulating multiple land use scenarios by coupling human and natural effects. Land. Urban Plann. 168, 94–116. doi: 10.1016/j.landurbplan.2017.09.019
Liu M., Zhang Z., Sun. J., Li Y., Liu. Yu, Ming X., et al. (2020). Restoration efficiency of short-term grazing exclusion is the highest at the stage shifting from light to moderate degradation at Zoige, Tibetan Plateau. Ecol. Indic. 114, 106323. doi: 10.1016/j.ecolind.2020.106323
Mansoor D. K., Leh, Marty D., Eric C., Nalley L. L. (2013). Quantifying and mapping multiple ecosystem services change in West Africa. Agriculture Ecosyst. Environ. 165, 6–18. doi: 10.1016/j.agee.2012.12.001
Nellemann C. (2001). Global methodology for mapping human impacts on the biosphere. UNEP/GRID-Arendal, United Nations Environment Programme.
Ren J., Zhao X., Xu X., Ma P., Du Y. (2022). Spatial-temporal evolution, tradeoffs and synergies of ecosystem services in the middle Yellow River. J. Earth Environ. 13 (4), 477–490. doi: 10.7515/JEE222019
Sharp R., Tallis H. T., Ricketts T., Guerry A. D., Wood S. A., Chapin-Kramer R., et al. (2015). InVEST 3.2.0 user’s guide. The natural capital project, stanford university, university of minnesota, the nature conservanvy, and world wildlife fund. Available at: http://www.naturalcapitalproject.org.
Tang F., Wang L., Guo Y., Fu M., Huang N., Duan W., et al. (2022). Spatio-temporal variation and coupling coordination relationship between urbanisation and habitat quality in the Grand Canal, China. Land Use Pol. 117, 106119. doi: 10.1016/j.landusepol.2022.106119
Vigerstol K. L., Aukema J. E. (2011). A comparison of tools for modeling freshwater ecosystem services. J. Environ. Manage. 92 (10), 2403–2409. doi: 10.1016/j.jenvman.2011.06.040
Wang Y., Fu B., Luy Y., Yang K., Che Y. (2016). Aessment of the social values of ecosystem services based on SolVES model: a case study of Wusong PaoTaiwan Wetland Forest Park, Shanghai, China. Chin. J. Appl. Ecol. 27, 1767–1774. doi: 10.13287/j.1001-9332.201606.011
Wilson M. C., Chen X., Corlett R. T., Didham R. K., Ding P., Holt R. D., et al. (2016). Habitat fragmentation and biodiversity conservation: key findings and future challenges. Landscape Ecol. 31, 219–227. doi: 10.16251/j.cnki.1009-2307.2016.09.013
Wu Q., Wang L., Zhu Y., Jin H. Y., Zhou H. F. (2016). Nesting habitat suitability analysis of red-crowned crane in Zhalong Nature Reserve based on MAXENT modeling. Acta Ecologica Sin. 36 (12), 3758–3764. doi: 10.5846/stxb201410101997
Yang J., Huang X. (2021). The 30 m annual land cover dataset and its dynamics in China from 1990 to 2019. Earth Syst. Sci. Data 13, 3907–3925. doi: 10.5194/essd-13-3907-2021,2021
Yang Z., Zhang F., Wang H. (2020). Analysis on the differences and its green development ways of ecologically fragile areas in China. Ecol. Environ. Sci. 29 (6), 1071–1077. doi: 10.16258/j.cnki.1674-5906.2020.06.001
Yohannes H., Soromessa T., Argaw M., Dewan A. (2021). Spatio-temporal changes in habitat quality and linkage with landscape characteristics in the Beressa watershed, Blue Nile basin of Ethiopian highland. J. Environ. Manage. 281, 111885. doi: 10.1016/j.jenvman.2020.111885
Yu J., Dong H., Li Y., Wu H., Guan B., Gao Y., et al. (2014). Spatiotemporal distribution characteristics of soil organic carbon in newborn coastal wetlands of the Yellow River delta estuary: spatiotemporal distribution characteristics of soil organic carbon. Clean: Soil Air Water 42, 311–318. doi: 10.1002/clen.201100511
Zhang J., Chen K., Zhang C., Guo P. (2021). The change characteristics of eco-environment in the Yellow River Basin based on entropy weights. China Environ. Sci. 41 (8), 3767–3774. doi: 10.19674/j.cnki.issn1000-6923.20210331.013
Zhang X. R., Zhou J., Li G. N., Chen C., Li M. M., Luo J. M. (2020). Spatial pattern reconstruction of regional habitat quality based on the simulation of land use changes from 1975 to 2010. J. Geographical Sci. 30 (12), 601–620. doi: 10.1007/s11442-020-1745-4
Keywords: Gansu-Qinghai section of the Yellow River Basin, habitat quality, land use change, multi-scenario, FLUS-InVEST model
Citation: Yang J, Xie B, Zhang D, Mak-Mensah E and Pei T (2023) Habitat quality assessment and multi-scenario prediction of the Gansu-Qinghai section of the Yellow River Basin based on the FLUS-InVEST model. Front. Ecol. Evol. 11:1228558. doi: 10.3389/fevo.2023.1228558
Received: 25 May 2023; Accepted: 05 September 2023;
Published: 21 September 2023.
Edited by:
Pavan Kumar, Rani Lakshmi Bai Central Agricultural University, IndiaReviewed by:
Houlang Duan, Chinese Academy of Sciences (CAS), ChinaTian Xie, Beijing Normal University, China
Copyright © 2023 Yang, Xie, Zhang, Mak-Mensah and Pei. This is an open-access article distributed under the terms of the Creative Commons Attribution License (CC BY). The use, distribution or reproduction in other forums is permitted, provided the original author(s) and the copyright owner(s) are credited and that the original publication in this journal is cited, in accordance with accepted academic practice. No use, distribution or reproduction is permitted which does not comply with these terms.
*Correspondence: Jie Yang, eWFuZ19qaWVAZ3NhdS5lZHUuY24=
 Jie Yang
 Baopeng Xie2