- 1School of Civil Engineering, Yantai University, Yantai, China
- 2Norwegian Geotechnical Institute, Oslo, Norway
- 3School of Civil Engineering, Chongqing University, Chongqing, China
- 4School of Geosciences and Info-Physics, Central South University, Changsha, China
External causes like changes in reservoir level and intense rainfall can cause reservoir landslides. Exploring the factors that govern landslide deformation and analyzing its stability evolution is essential in mitigating the associated risks. The Sanzhouxi landslide, which has experienced ongoing movements and has been implemented a professional monitoring system, is chosen for analysis in this paper. A combination of geological survey and analysis of monitoring data is utilized to explore landslide deformation characteristics. A data mining method, grey relation analysis (GRA), is subsequently performed to determine the causes of landslide deformation. Furthermore, the stability of the Sanzhouxi landslide in response to reservoir level fluctuation and rainfall for each day over an entire year is assessed using the Morgenstern-Price (MP) approach in 2D GeoStudio software. Such a process illustrates clearly how the landslide stability alters with external triggers changing. The findings reveal that the landslide deforms variably in spatial and temporal. The reservoir level rising contributes to landslide deformation primarily, while rainfall has a secondary impact. The factor of safety (FS) of the Sanzhouxi landslide drops from 1.17 to 1.07 during high reservoir water level periods and remain the same or increase in other periods except for some transitory moments while decreasing only by about 2% under the effect of rainfall. The daily FS results validate the dominant influence of reservoir level fluctuation on the stability of the landslide. The comprehensive understanding of landslide movement based on deformation characteristics, triggering factor identification, and daily stability validation, contributes to realizing nearly real-time prediction and evaluating the risk due to slope movements in similar geological settings worldwide.
1 Introduction
Landslides are a recurring geological disaster, occurring in various regions across the world and thereby entailing significant catastrophic consequences (AGU, 2017; Mirus et al., 2020; Huang et al., 2021; Dahim et al., 2023; Yan et al., 2023). Several regions of China, particularly the Three Gorges Reservoir area (TGRA), have exhibited a predisposition to landslides (Cojean and Caï, 2011; Zhou et al., 2018; Zhang et al., 2023a). Landslides alongside reservoir banks could threaten ongoing reservoir operations as well as the security of the dam, watercourses, and inhabitants (Chae et al, 2017; Yang et al., 2022). Survey findings have revealed the identification of over 5,000 landslides within the TGRA after the dam was impounded in 2003 (Huang et al., 2020; Luo and Huang, 2020). One notable event was the Qianjiangping landslide, occurring on July 14, 2003, in Zigui County, Hubei Province, induing by the initial impoundment reaching 135 m above sea level. This event led to the unfortunate loss of 24 lives, the destruction of 129 residential structures, and 6.5 million EURO direct economic losses (Wang et al., 2004). Additional instances comprise the Shuping landslide (Wang et al., 2008), the Shanshucao landslide (Xu et al., 2015), and the Jinle landslide (Wu et al., 2017), among numerous other cases.
In-situ monitoring data, including surface displacement, deep displacement, groundwater level, and other relevant parameters, offers valuable insights into hazard assessment and risk control of landslides. Among these in-site data, the surface displacement obtained from the Global positioning system (GPS) is extensively adopted to track the movements of landslides in the TGRA (Wu et al., 2019). The displacement-time curves serve as the foundation for analyzing deformation characteristics, determining failure modes, and forecasting the movement of landslides (Zhang et al., 2023b). A typical displacement-time curve exhibits distinct phases, including primary creep, secondary creep, and tertiary creep (Figure 1) (Saito, 1965; Hu et al., 2021). In practice, it is common for landslides’ displacement-time curves to deviate from the typical three creep phases. These monitored curves in the TGRA can be summarized into six types: steady-type, exponential-type, convergent-type, fallback-type, stepwise-type, and oscillation-type (Figure 2). Numerous landslides undergo stepwise deformation in the TGRA (Wang et al., 2019; Zhang et al., 2021).
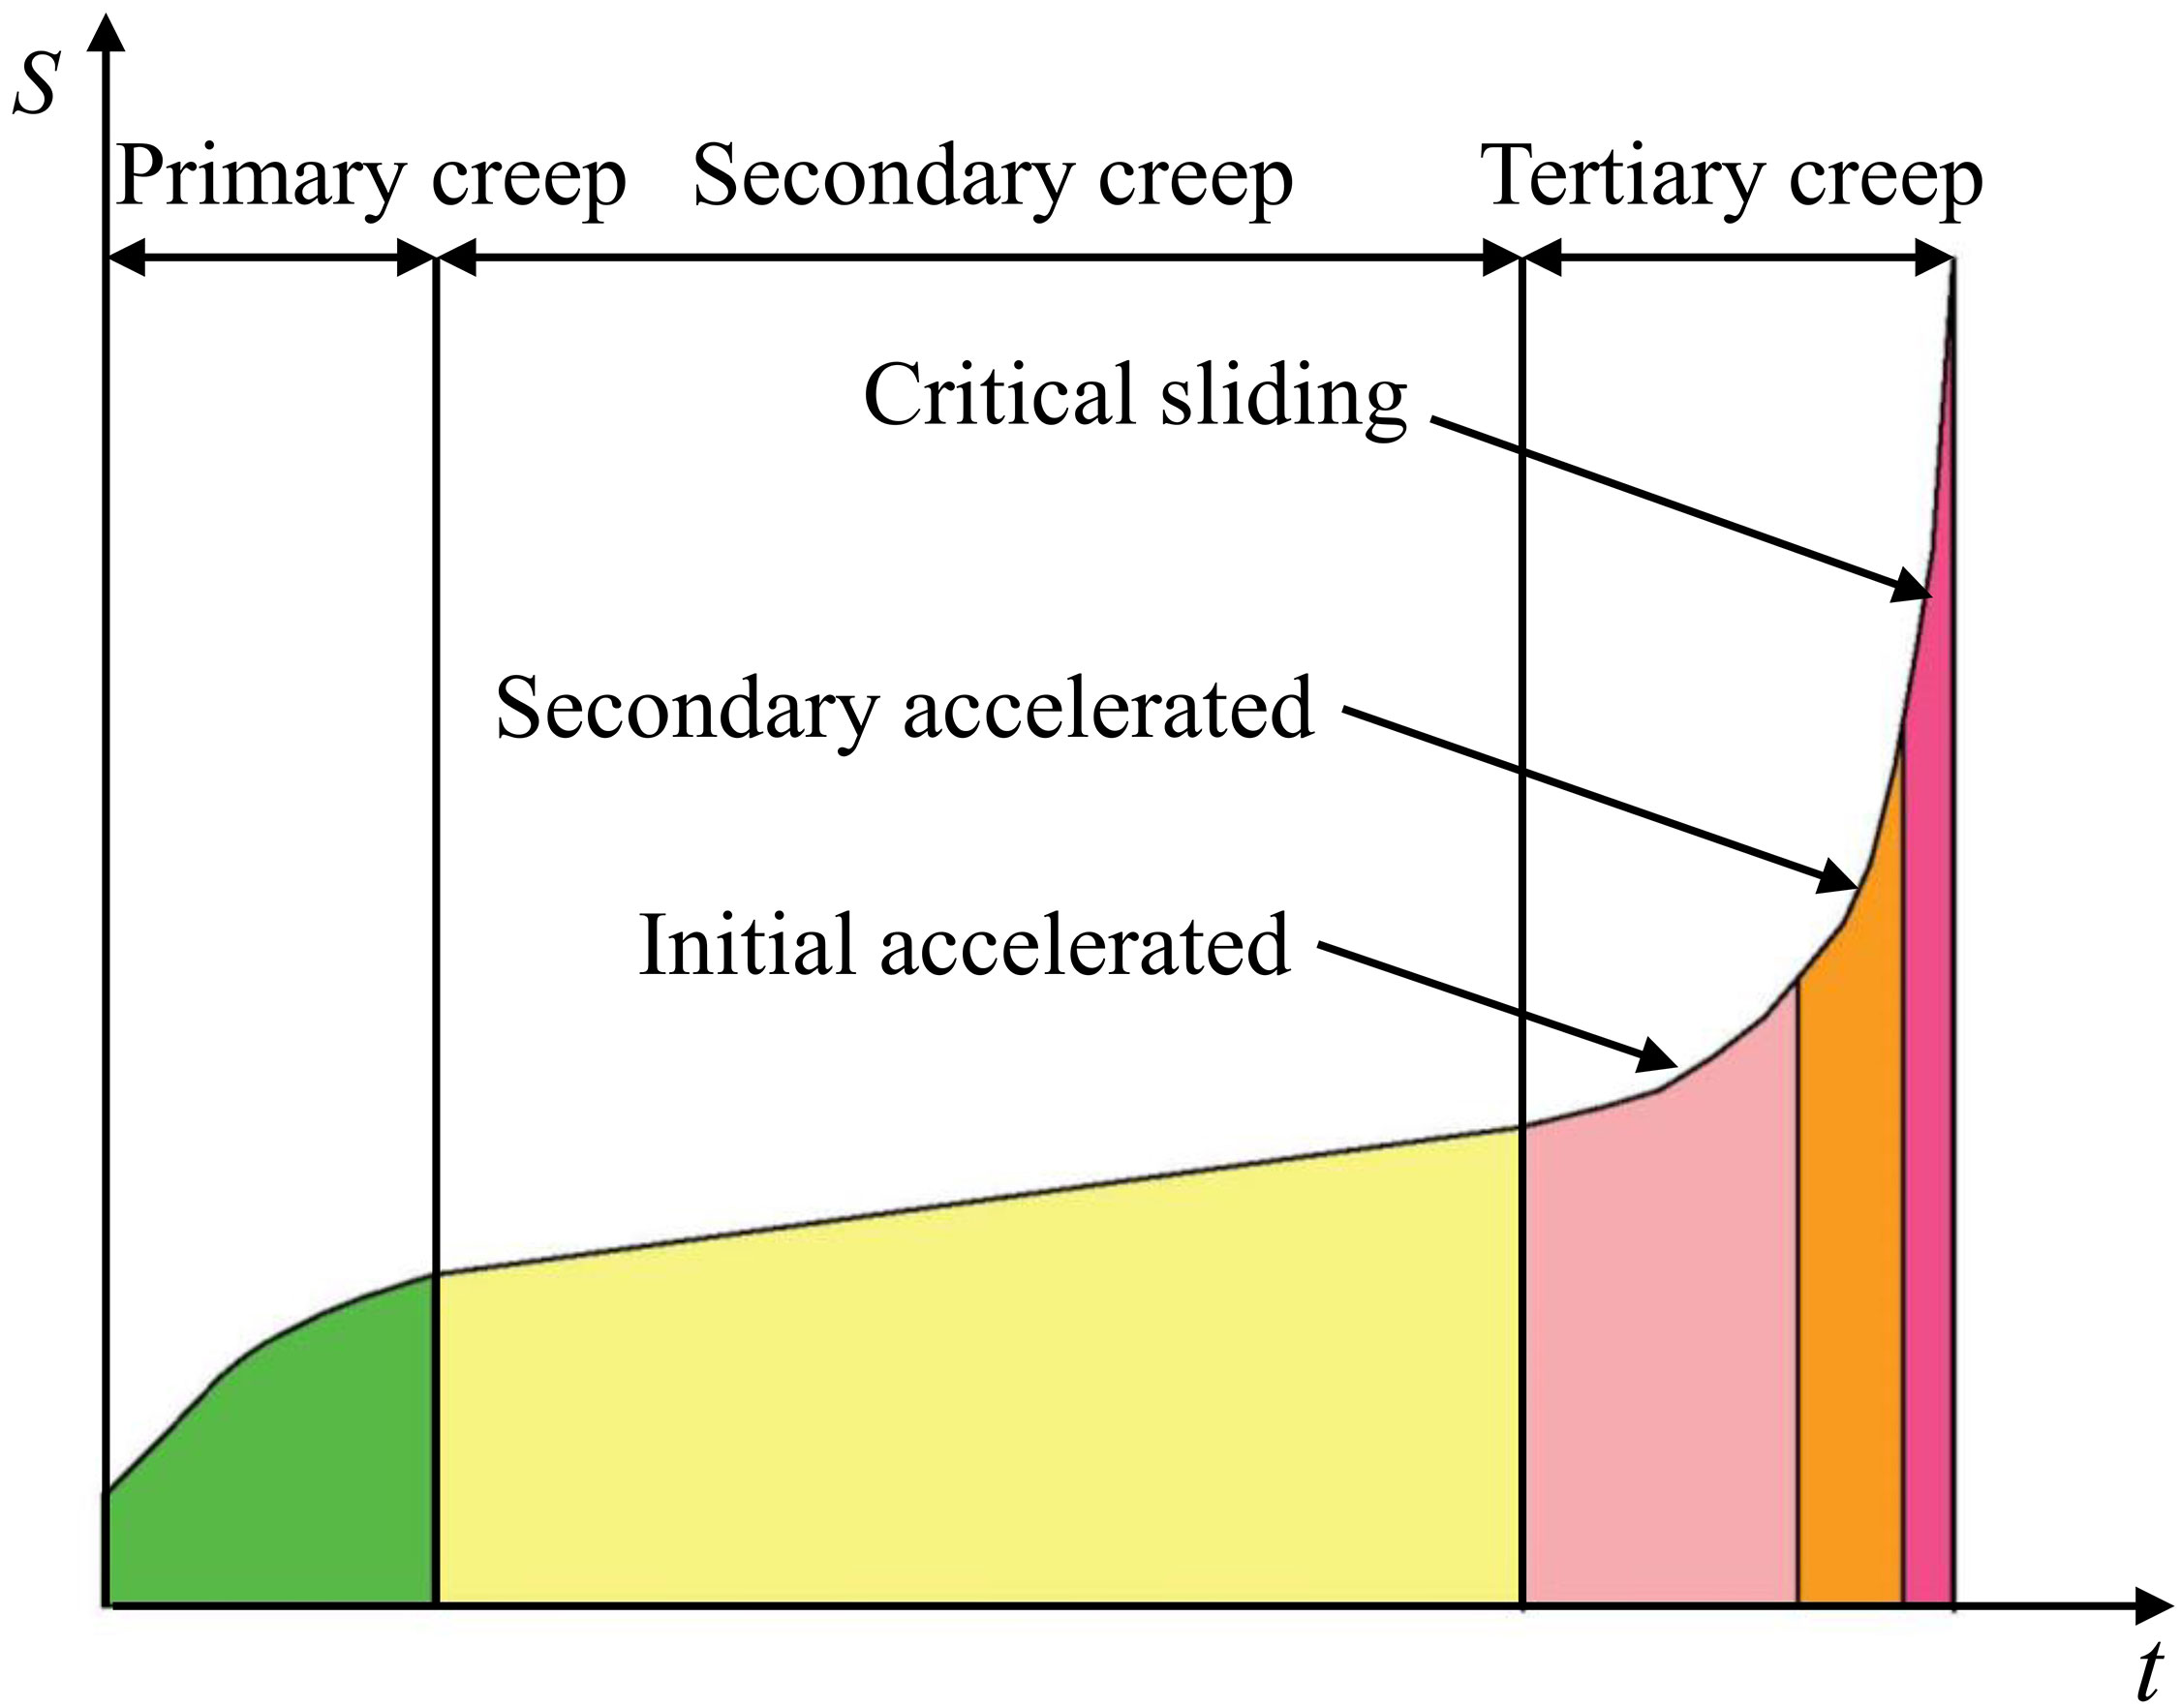
Figure 1 Three stages of slope deformation (modified from Hu et al., 2021).
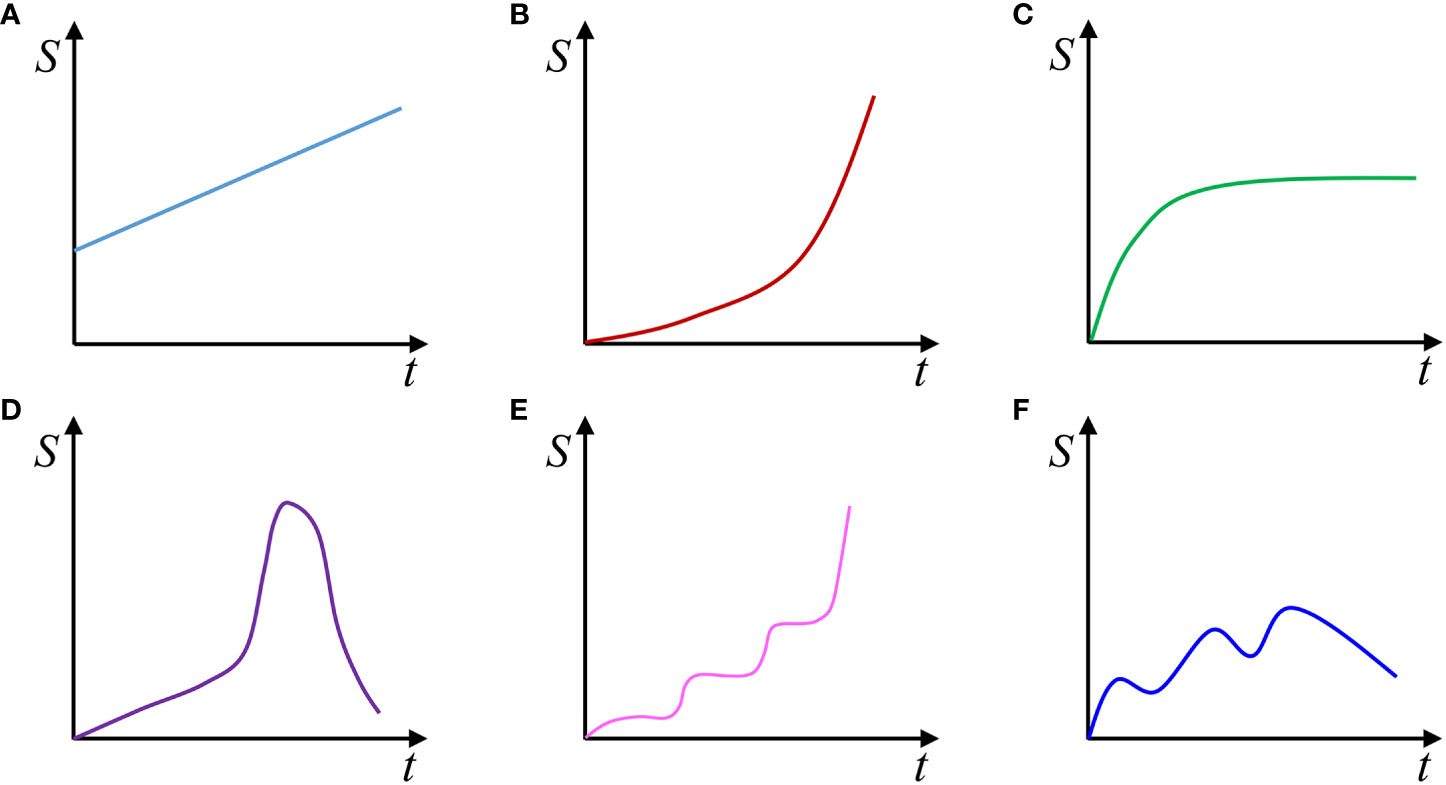
Figure 2 Types of landslide displacement-time curves in the TGRA: (A) Linear-type; (B) Exponential-type; (C) Convergent-type; (D) Fallback-type; (E) Stepwise-type; (F) Oscillation type.
Stepwise-type landslides exhibit the behavior of deforming distinctly over a period and uniformly in the rest time of a year. Determining the predominant triggers behind the rapid deformations of landslides is typically a challenging endeavor (Crosta et al., 2016; Strauhal et al., 2016). The presence of excessive or incorrect candidates can have detrimental effects such as reduced calculation efficiency and potentially inaccurate results (Yao et al., 2019). Data mining techniques, such as grey relational analysis (GRA), two-step cluster analysis, and Apriori algorithm analysis, have been employed to investigate external triggers inducing landslide deformation quantitatively (Ma et al., 2018; Naemitabar and Zanganehm, 2021; Yang et al., 2023). Wu et al. (2019) utilized the GRA method to determine the controlling triggers accountable for landslide deformation, while Yao et al. (2019) employed neighborhood rough set theory for the same purpose. Based on data obtained from a dedicated monitoring system established in 2006, Huang et al. (2020) discovered that the reservoir level changing serves as the primary driving factor behind the deformation of the Muyubao landslide. Miao et al. (2021) adopted a data mining approach to determine triggering factors and corresponding thresholds for landslide deformation.
The evaluation methods employed for assessing landslide stability have evolved from qualitative approaches to quantitative ones, having undergone a number of improvements (Cojean and Caï, 2011; Cho, 2017). The quantitative approaches mainly include limit equilibrium methods (e.g., Swedish, Janbu, Bishop, Morgenstern-Price, and Sarma) and numerical simulation methods (e.g., finite element method) (Yang et al., 2017; Kumar et al., 2018). Therein, the Morgenstern-Price (MP) method (Morgenstern and Price, 1965) was proven to be an effective analysis method. It has been used extensively for decades. For these reasons, the MP method was selected for the analyses in this paper.
The Sanzhouxi landslide exhibits stepwise deformation, which is a prevalent deformation pattern observed in landslides within TGRA. In addition to abundant records, a professional monitoring system has been implemented on the landslide including measurements of groundwater level, surface displacement, deep displacement, crack width, etc. A complete monitoring dataset for the Sanzhouxi landslide over several years is available, which is not the case for all the other landslides at the sites. Such information involving the several complex components of the landslide helps analyze the movement of stepwise landslides synthetically and comprehensively. The Sanzhouxi landslide is therefore chosen as an example for this paper.
Utilizing geological surveys and data obtained from the monitoring system, movement characteristics of the Sanzhouxi landslide were analyzed. A data mining method, GRA, was adopted to determine the primary triggers that caused the landslide to deform across various monitoring periods. The change in the factor of safety over one year in the presence of fluctuating reservoir levels and varying rainfall was evaluated with the GeoStudio software. The objective of this paper is to understand landslide development by using several different methods including geotechnical analysis, data mining techniques, and numerical simulations based on abundant information from various aspects influencing the landslide. One novelty of the study on the Sanzhouxi landslide resides in identifying different periods of hydrological factors inducing deformation quantitatively. Furthermore, the study discusses the opportunity of the strategy developed herein for real-time or nearly real-time prediction for stepwise landslides.
2 Main external factors triggering landslide development in the TGRA
2.1 External factors inducing landslide deformation
Reservoir level changes and rainfall are two critical triggers inducing landslide deformation (Gutiérrez et al., 2010; Segoni et al., 2018; Jaboyedoff et al., 2020; Miao et al., 2022). Rainfall significantly diminishes landslide stability and predominantly results in movement through two key mechanisms: 1) Rainfall infiltration causes an increase in pore pressure within the soil, consequently reducing the effective stress of the soil to a critical threshold (Marjanovi´c et al., 2018); 2) The ingress of rainfall increases landslide mass, thereby augmenting the sliding force acting upon it (Yang et al., 2023). Rising and falling reservoir levels induce landslide deformation through distinct mechanisms. Firstly, during reservoir water level drawdown, some landslides experience a lack of rapid dissipation of groundwater. This inadequate dissipation leads to an increase in dynamic pressure, resulting in decreased landslide stability (Zhou et al., 2022). Secondly, as the reservoir water level increases, it exerts buoyancy on some landslides, reducing the effective weight acting on the anti-sliding section in front of landslides (Huang et al., 2020). Additionally, the infiltration of reservoir water into the landslide can cause a reduction in soil strength. In analyzing and predicting landslide deformation, some candidate controlling factors, such as average reservoir level, monthly reservoir level change, and monthly rainfall, have often been considered (Yang et al., 2019; Liu et al., 2020).
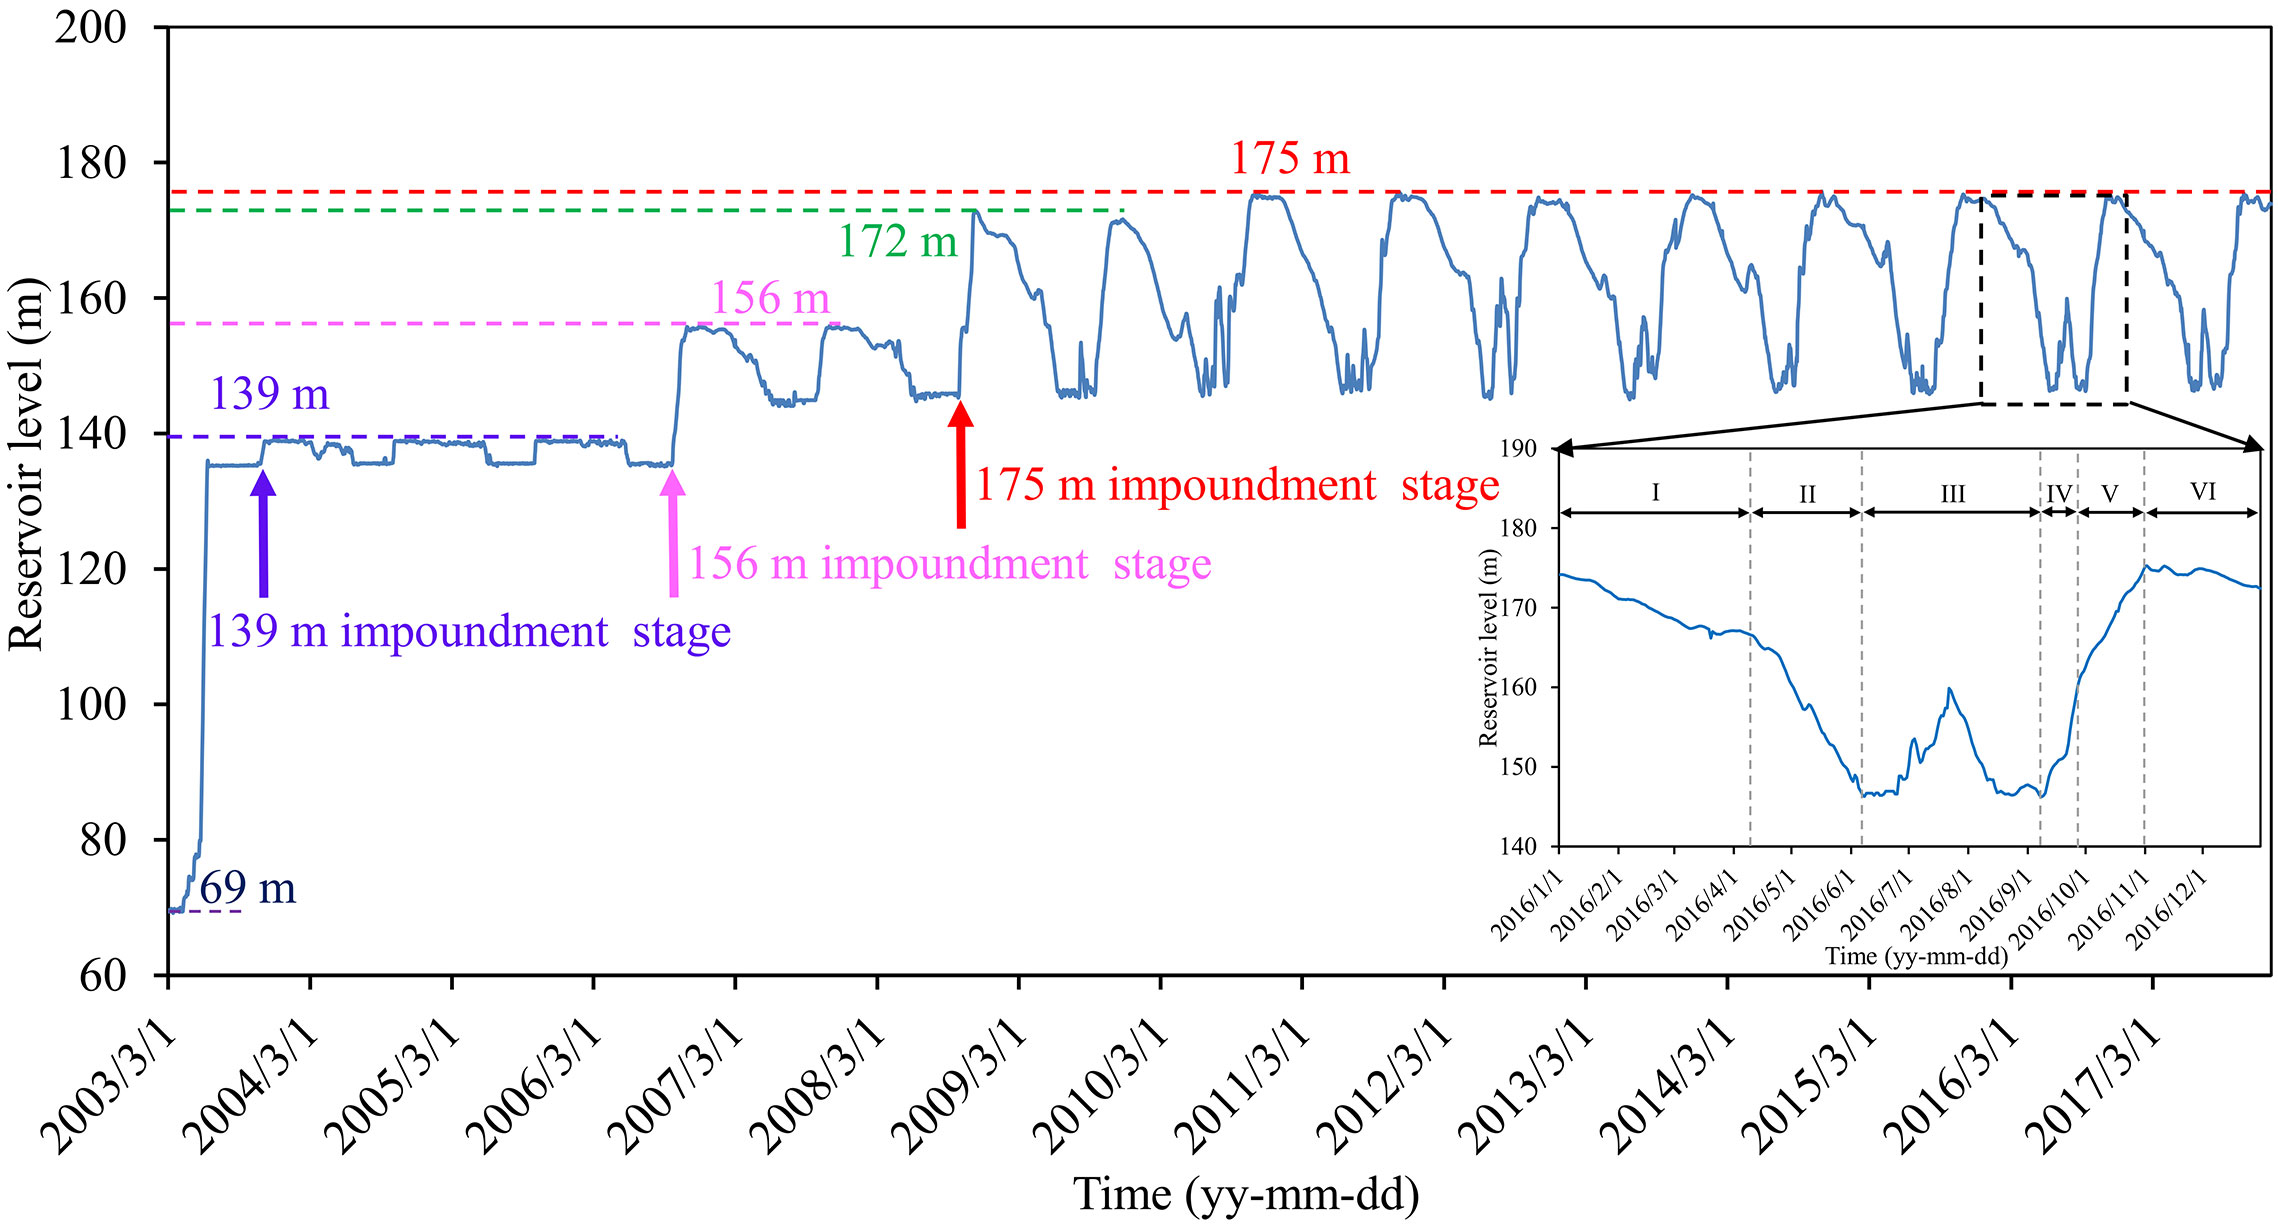
The Three Gorges Reservoir impoundment and operation progressed through three phases, as shown in Figure 3. In the initial phase, spanning between April 2003 and September 2006, the water level underwent a significant increase from 69 m to 139 m, followed by relatively minor fluctuations. Moving into the second phase, which extended from September 2006 to September 2008, the reservoir level experienced a rapid increase from 139 m to 156 m within a month and subsequently fluctuated annually between 145 m and 156 m. During the third phase, beginning in 2008, the reservoir level increased to 172 m and thereafter fluctuated between 145 m and 172 m from 2008 to 2010. Since then, the reservoir level fluctuated periodically between 145 m and 175 m. During the annual reservoir level schedule in 2016, one can distinguish six successive periods: slow drawdown (Stage I), rapid drawdown (Stage II), low reservoir conditions (Stage III), rapid rise (Stage IV), slower rise (Stage V) and high reservoir conditions (Stage VI).
At times of fluctuating water levels, varying rainfall also occurs. The Wanzhou District has the second-highest annual rainfall in the TGRA. Between 1960 and 2015, the largest monthly rainfall in the Wanzhou District is 683.2 mm, the largest daily rainfall is 243.3 mm, and the longest string is 16 continuous rainfall days (Yang et al., 2017).
2.2 Identification of triggering factors using GRA
GRA was first proposed by Deng (1989) and had been applied to identifying quantitatively the key factors influencing landslide deformation (Wu et al., 2019; Yang et al., 2019; Guo et al., 2020; Wang et al., 2023). The GRA method, a commonly utilized model within grey system theory, categorizes situations with no information as black and those with perfect information as white. However, in practical real-world problems, these ideal situations rarely exist. Instead, situations with partial information, lying between these extremes, are referred to as grey, hazy, or fuzzy.
The GRA method is adopted in this work to quantitatively pinpoint the primary causes of the Sanzhouxi landslide’s movement. The correlation between each variable is assessed using the grey relational grade (GRG). The process of triggers identification inducing landslide deformation includes the following four steps.
(1) Based on the available monitoring data, which comprises measurements of rainfall, reservoir water level, and surface displacement, an incidence matrix (X) is constructed. Monthly displacement is assigned as the primary sequence (Xdisplacement), while the two causal factors, monthly reservoir level change (Xreservoir level) and monthly rainfall (Xrainfall), are selected as sub-sequences. The matrix X is denoted as X = {Xdisplacement, Xreservoir level, Xrainfall}.
(2) Normalization of the data in matrix X is achieved from:
where ;; n and m are the number of data points and influencing factors, respectively.
(3) The grey relational coefficient can be computed from:
where is the resolution coefficient for adjusting the range of comparison environments, typically assigned a value of 0.5 (Lian et al, 2014; Yang et al., 2019; Guo et al., 2020).
(4) The GRG is obtained from:
The GRG is a measure that ranges from 0 to 1, with a GRG-value of 0.6 or higher indicating a strong correlation. As the value of GRG approaches 1, it signifies a stronger association between the two series under consideration. Within this study, the correlation between landslide displacement and reservoir level fluctuation is represented by r(xdisplacement, xreservoir level), while the correlation between landslide displacement and rainfall is denoted by r(xdisplacement, xrainfall). If r(xdisplacement, xreservoir level) > r(xdisplacement, xrainfall), it suggests that the primary factor contributing to landslide deformation is the fluctuation of the reservoir water level. Conversely, if r(xdisplacement, xreservoir level)< r(xdisplacement, xrainfall), it indicates that rainfall serves as the dominant trigger. By comparing the GRG values, the relative influence of each factor on landslide deformation can be determined.
3 Deformation characteristics and triggers identification of the Sanzhouxi landslide
3.1 Geological setting of the Sanzhouxi landslide
The Sanzhouxi landslide located in the Wanzhou District of Chongqing, China, is situated on the eastern side of the Yangtze River (30°45′08.27″N, 108°25′32.08″E) (Figure 4). The landslide is fan-shaped from a bird’s eye view and exhibits a sliding direction oriented at approximately 245°. The rear portion of the landslide displays a steeper inclination compared to the middle and front sections. The landslide surface is inclined at an angle of 10° to 30°. The frontal section of the landslide stretches towards the Yangtze River bed, with the elevation varying between 160 m and 175 m. The upper landslide boundary is marked by a bedrock cliff at the elevation of 230 m, while the left and right boundaries coincide with the interface between the bedrock and the soil (Figure 5A). The landslide measures 320 m in length and 360 m in width. The thickness of the sliding mass ranges from 5 m to 22 m, covering an area of 13.4 × 10⁴ m2 and having an estimated volume of 135.6 × 10⁴ m3.
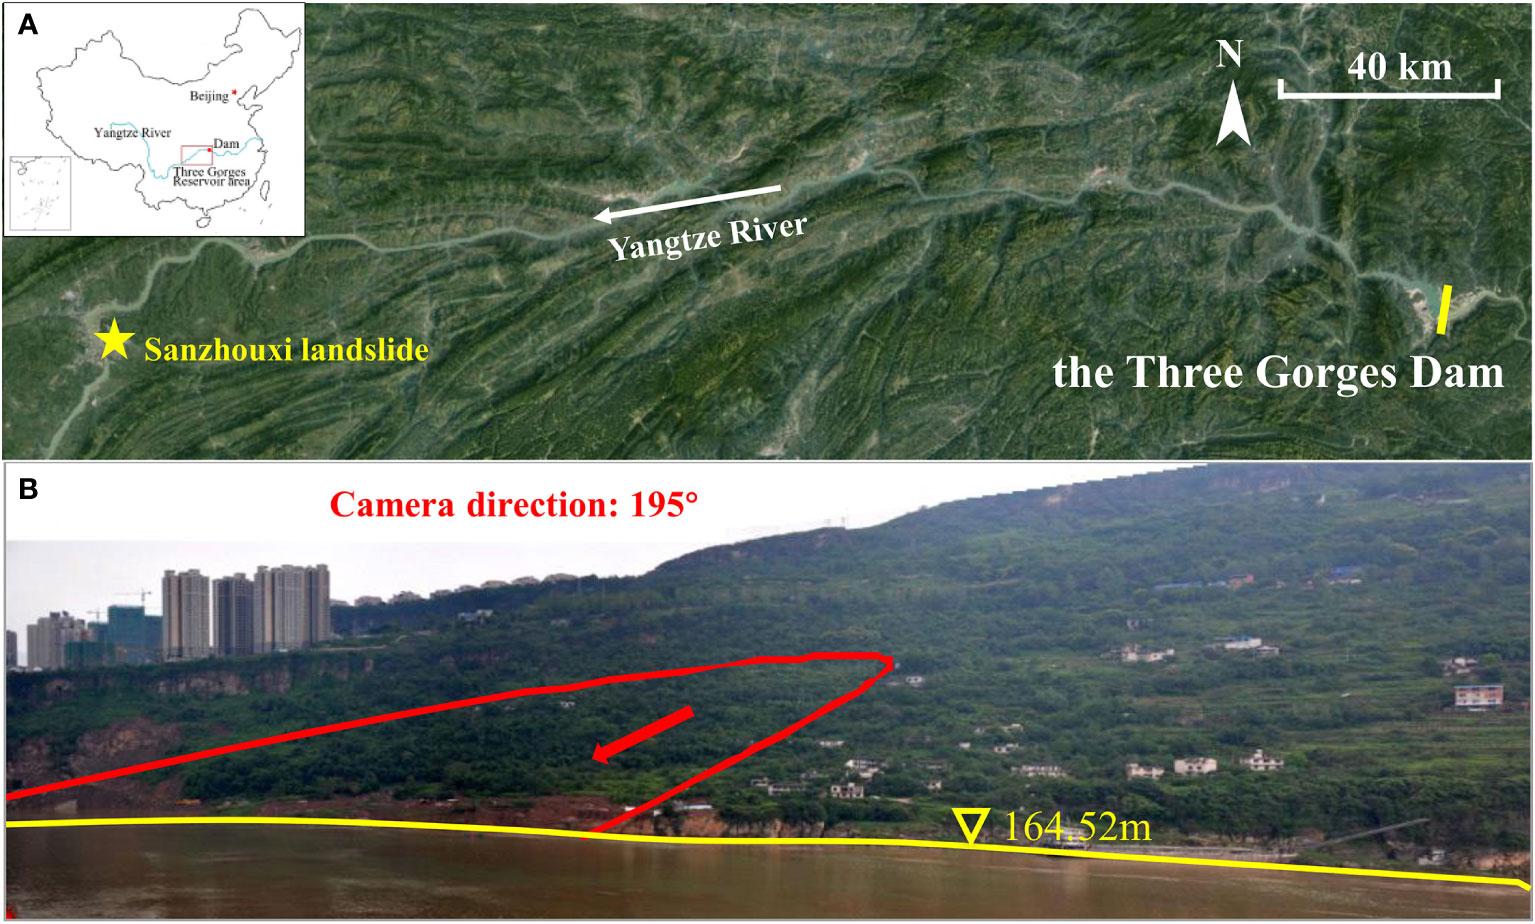
Figure 4 (A) Location of the Sanzhouxi landslide; (B) Panoramic photograph of the Sanzhouxi landslide (red contour delimits the boundary of the landslide with the reservoir water level at 164.52 m).
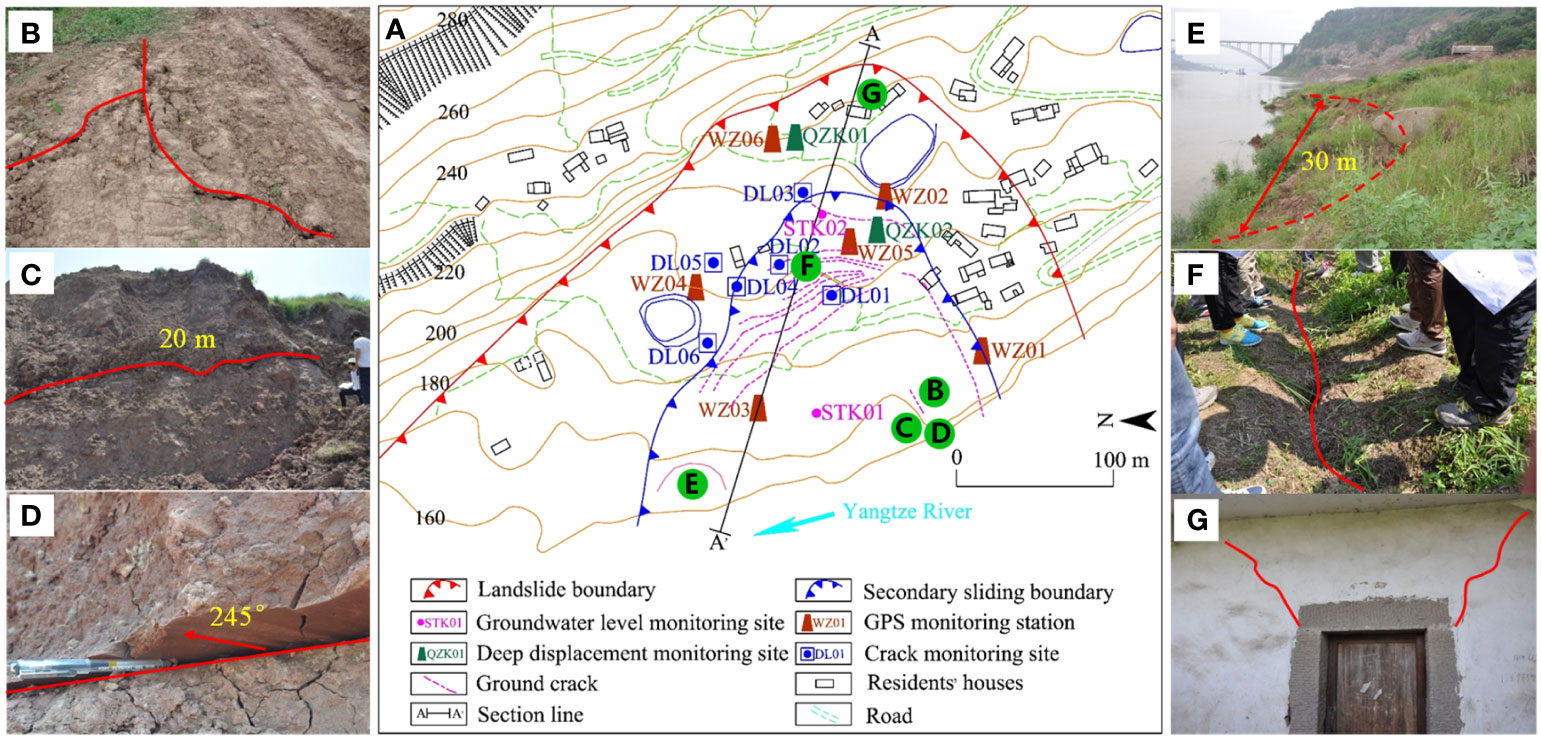
Figure 5 (A) Engineering geological map; (B) Transverse cracks in the front right part; (C) A second sliding induced by excavation within the region below 180 m; (D) Scratch traces on the sliding surface with the direction of 245°; (E) Failure of the river bank extending 30 m; (F) Transverse cracks in the front part; (G) Wall cracks on the back part of the landslide.
The sliding masses consisted mainly of quaternary deposits, including silty clay and fragmented rubble. The relative proportions of these two material types were between 8:2 and 7:3. The sliding zone occurs at the interface between bedrock and soil, and primarily consists of silty clay and fragmented sandstone rubble, with the presence of some montmorillonite. The subjacent bedrocks are sandstone and siltstone (Figure 6).
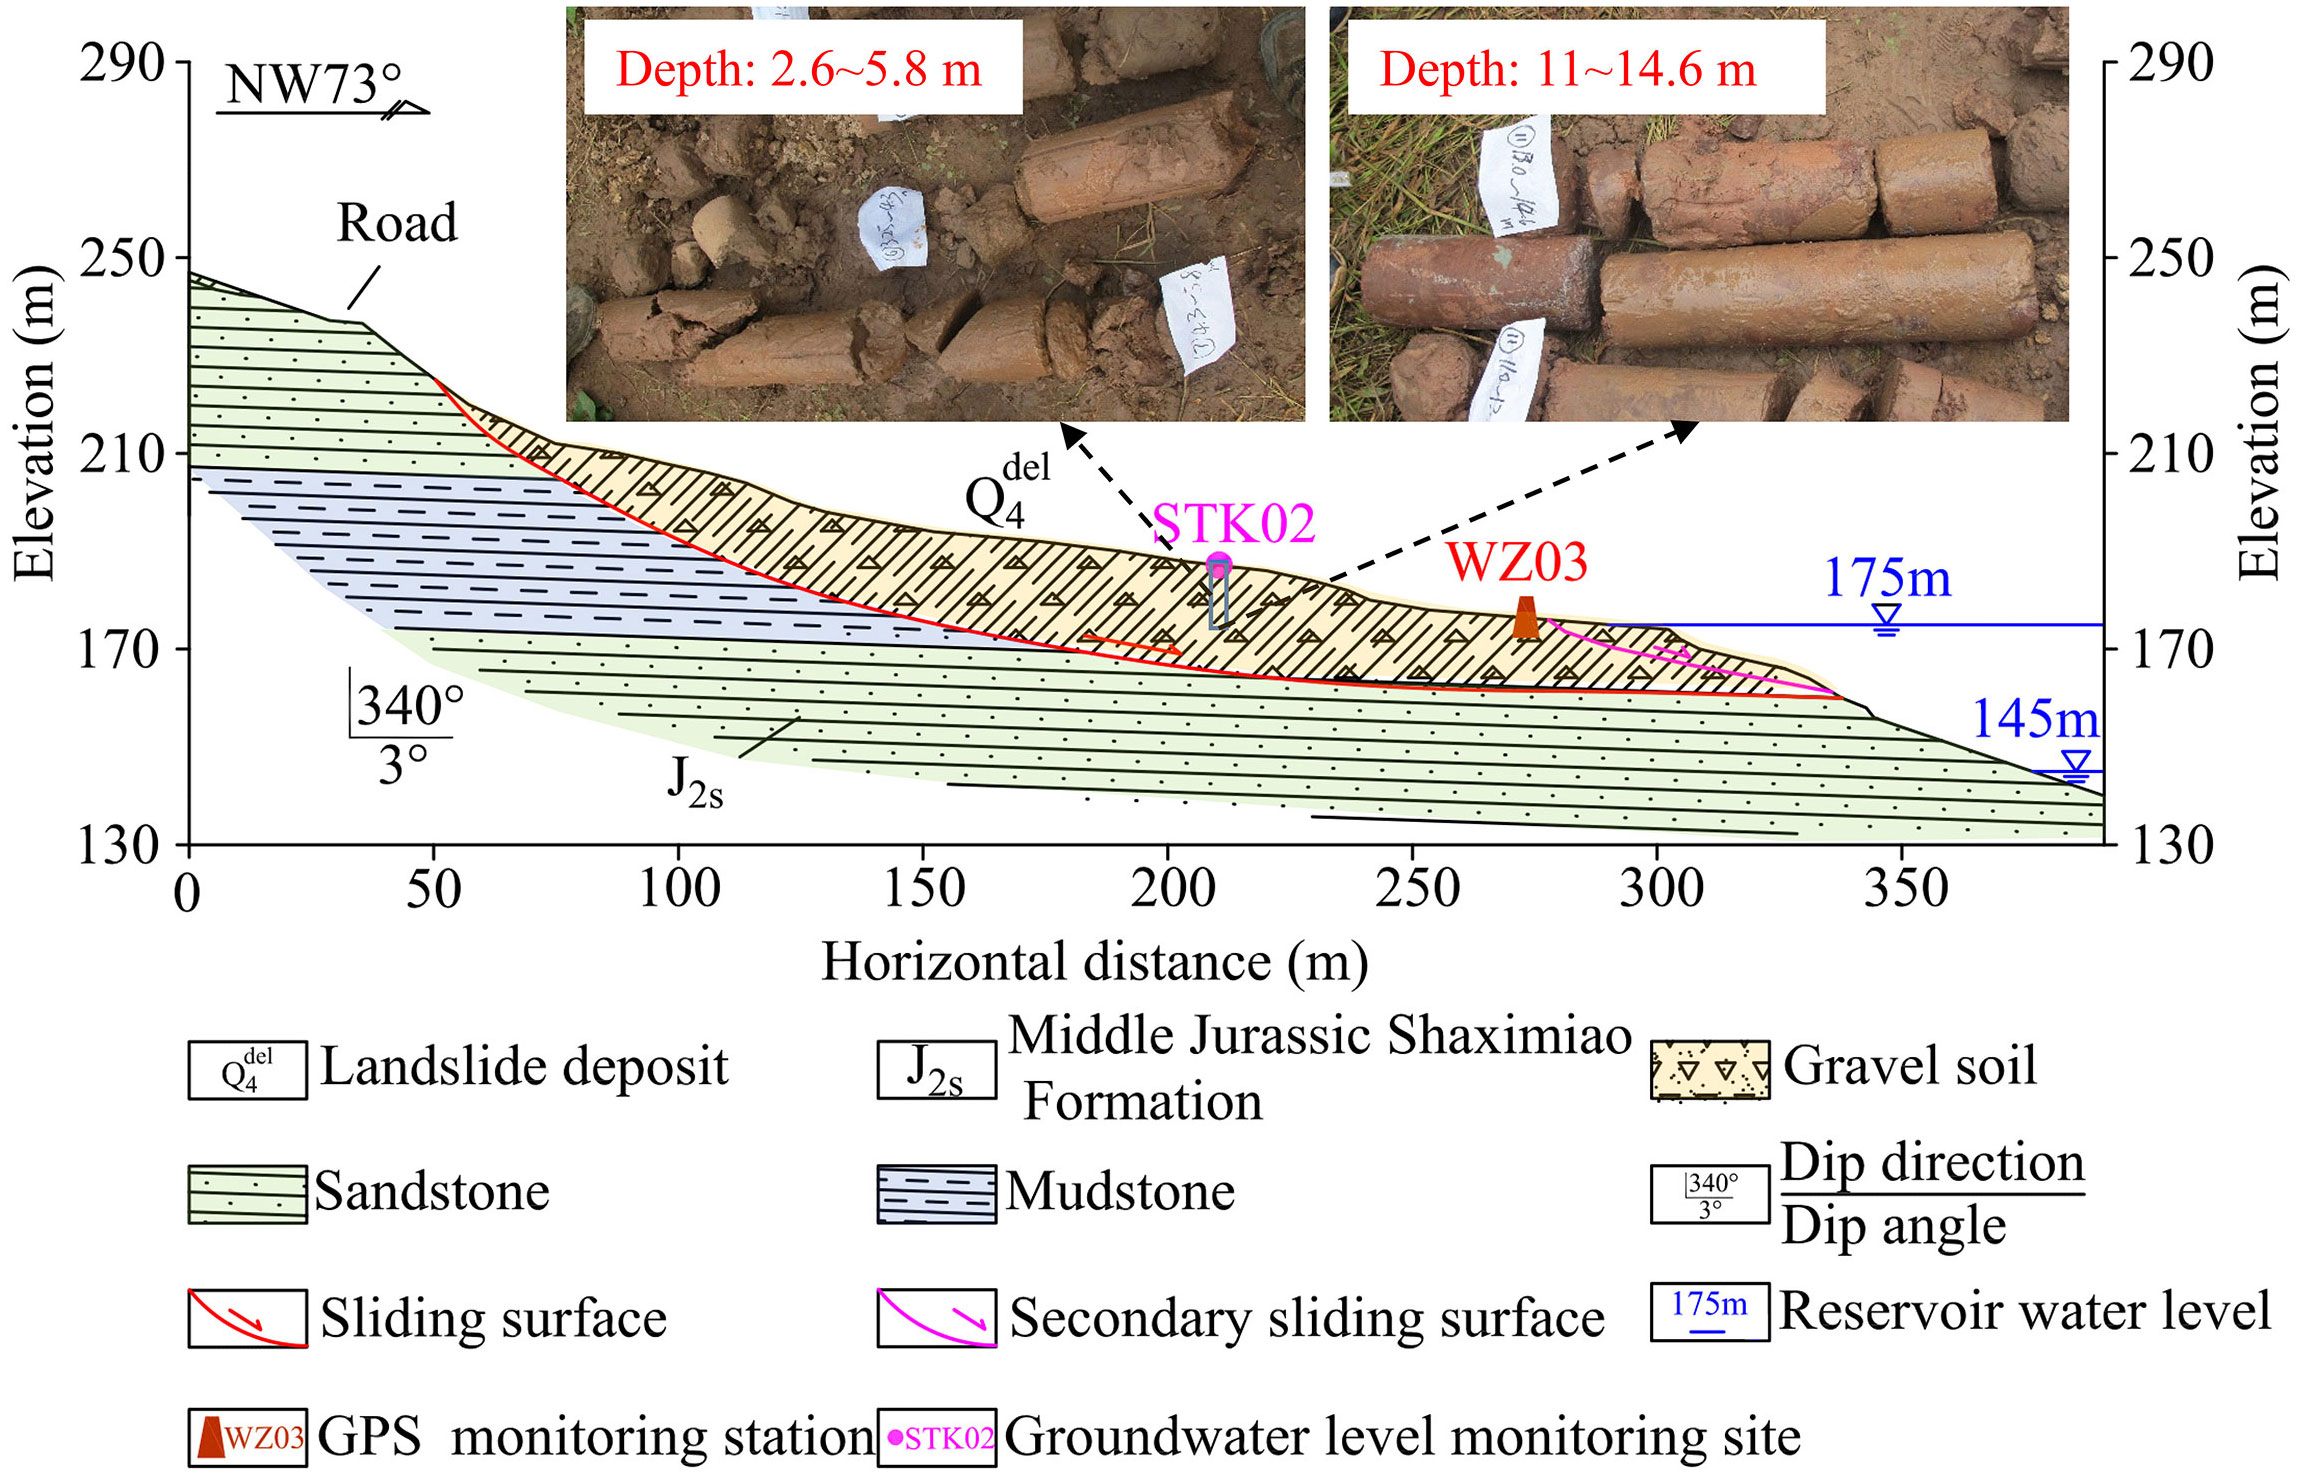
Figure 6 Geological cross section (A–A′ in Figure 5) of the Sanzhouxi landslide.
The Sanzhouxi area, with the potential for landslides, posed a serious threat to both public and property, including residents, dwellings, roads and infrastructure, and agricultural fields. According to historical records, the residents living on the landslide in 2005, 2009, and 2010 were 123, 217, and 135, respectively. With the development of deformations, some residents were relocated, and only 13 residents lived there in the area of the Sanzhouxi landslide in 2013.
3.2 Deformation history and field observations
The Sanzhouxi landslide began to deform in 1990. Near the trailing edge of the landslide, an observed ground crack measures approximately 100 m in length, 2 cm to 10 cm in width, and has a depth of 10 cm. Intense rainfall occurred in May with a rainfall of 247.4 mm seeming to be mainly responsible for the beginning of the landslide deformation in 1990. In the following years, landslide deformations intensified, and the crack extended from the trailing edge of the landslide into the middle and front parts regions. In June 2003, the landslide deformation caused some resident houses to crack.
In 2007, numerous tension cracks along a road across the landslide were observed. The largest crack had about 4 cm to 6 cm in width and a depth of 60 cm. The road in the landslide area experienced vertical displacement. The majority of the resident houses on or close to the landslide began to deform. In June 2010, multiple tension cracks were observed on the frontal section, in which the subsidence and width of the largest crack were up to 33 cm and 26 cm, respectively.
In 2012, nine cracks on the ground were observed in the landslide area by field investigations. The majority of the cracks were concentrated in the frontal area of the landslide. The largest width of the crack was 12 cm, and the largest depth was 27 cm. Among these nine cracks, six cracks that had developed perpendicular to the sliding direction were monitored continuously since then (Figure 5A).
In 2014, deformations were observed across the entire landslide area, while the front part deformed more than the other parts of the landslide. Transverse cracks were observed in the front right section of the landslide (Figure 5B). A second sliding was induced due to excavation within the part below 180 m of the landslide (Figure 5C). Scratch traces were found on the sliding surface with a direction of 245° (Figure 5D). In addition, a failure on the riverbank extending 30 m occurred along the landslide ‘s toe (Figure 5E). During this time frame, the deformations in the front part were mainly transverse surface cracks, while on the back part of the landslide mainly cracks were observed (Figures 5F, G).
3.3 Multi-source monitoring data
Six GPS monitoring stations (numbered WZ01 to WZ06) and two deep displacement monitoring points (QZK01 and QZK02) were installed on the Sanzhouxi landslide in 2007. Significant deformations developed in the following years. Six ground cracks monitoring points (DL01 to DL06) were installed in 2012, and two groundwater monitoring boreholes (STK01 and STK02) were installed in 2013 (Figure 5A). The monitoring data for groundwater level was collected from January 27th, 2013, to July 26th, 2014. GPS displacement was monitored continuously from March 2007 to July 2014, with measurements recorded on a monthly basis. The crack width was monitored between September 19th, 2012 and July 17th, 2014.
3.3.1 Groundwater level monitoring
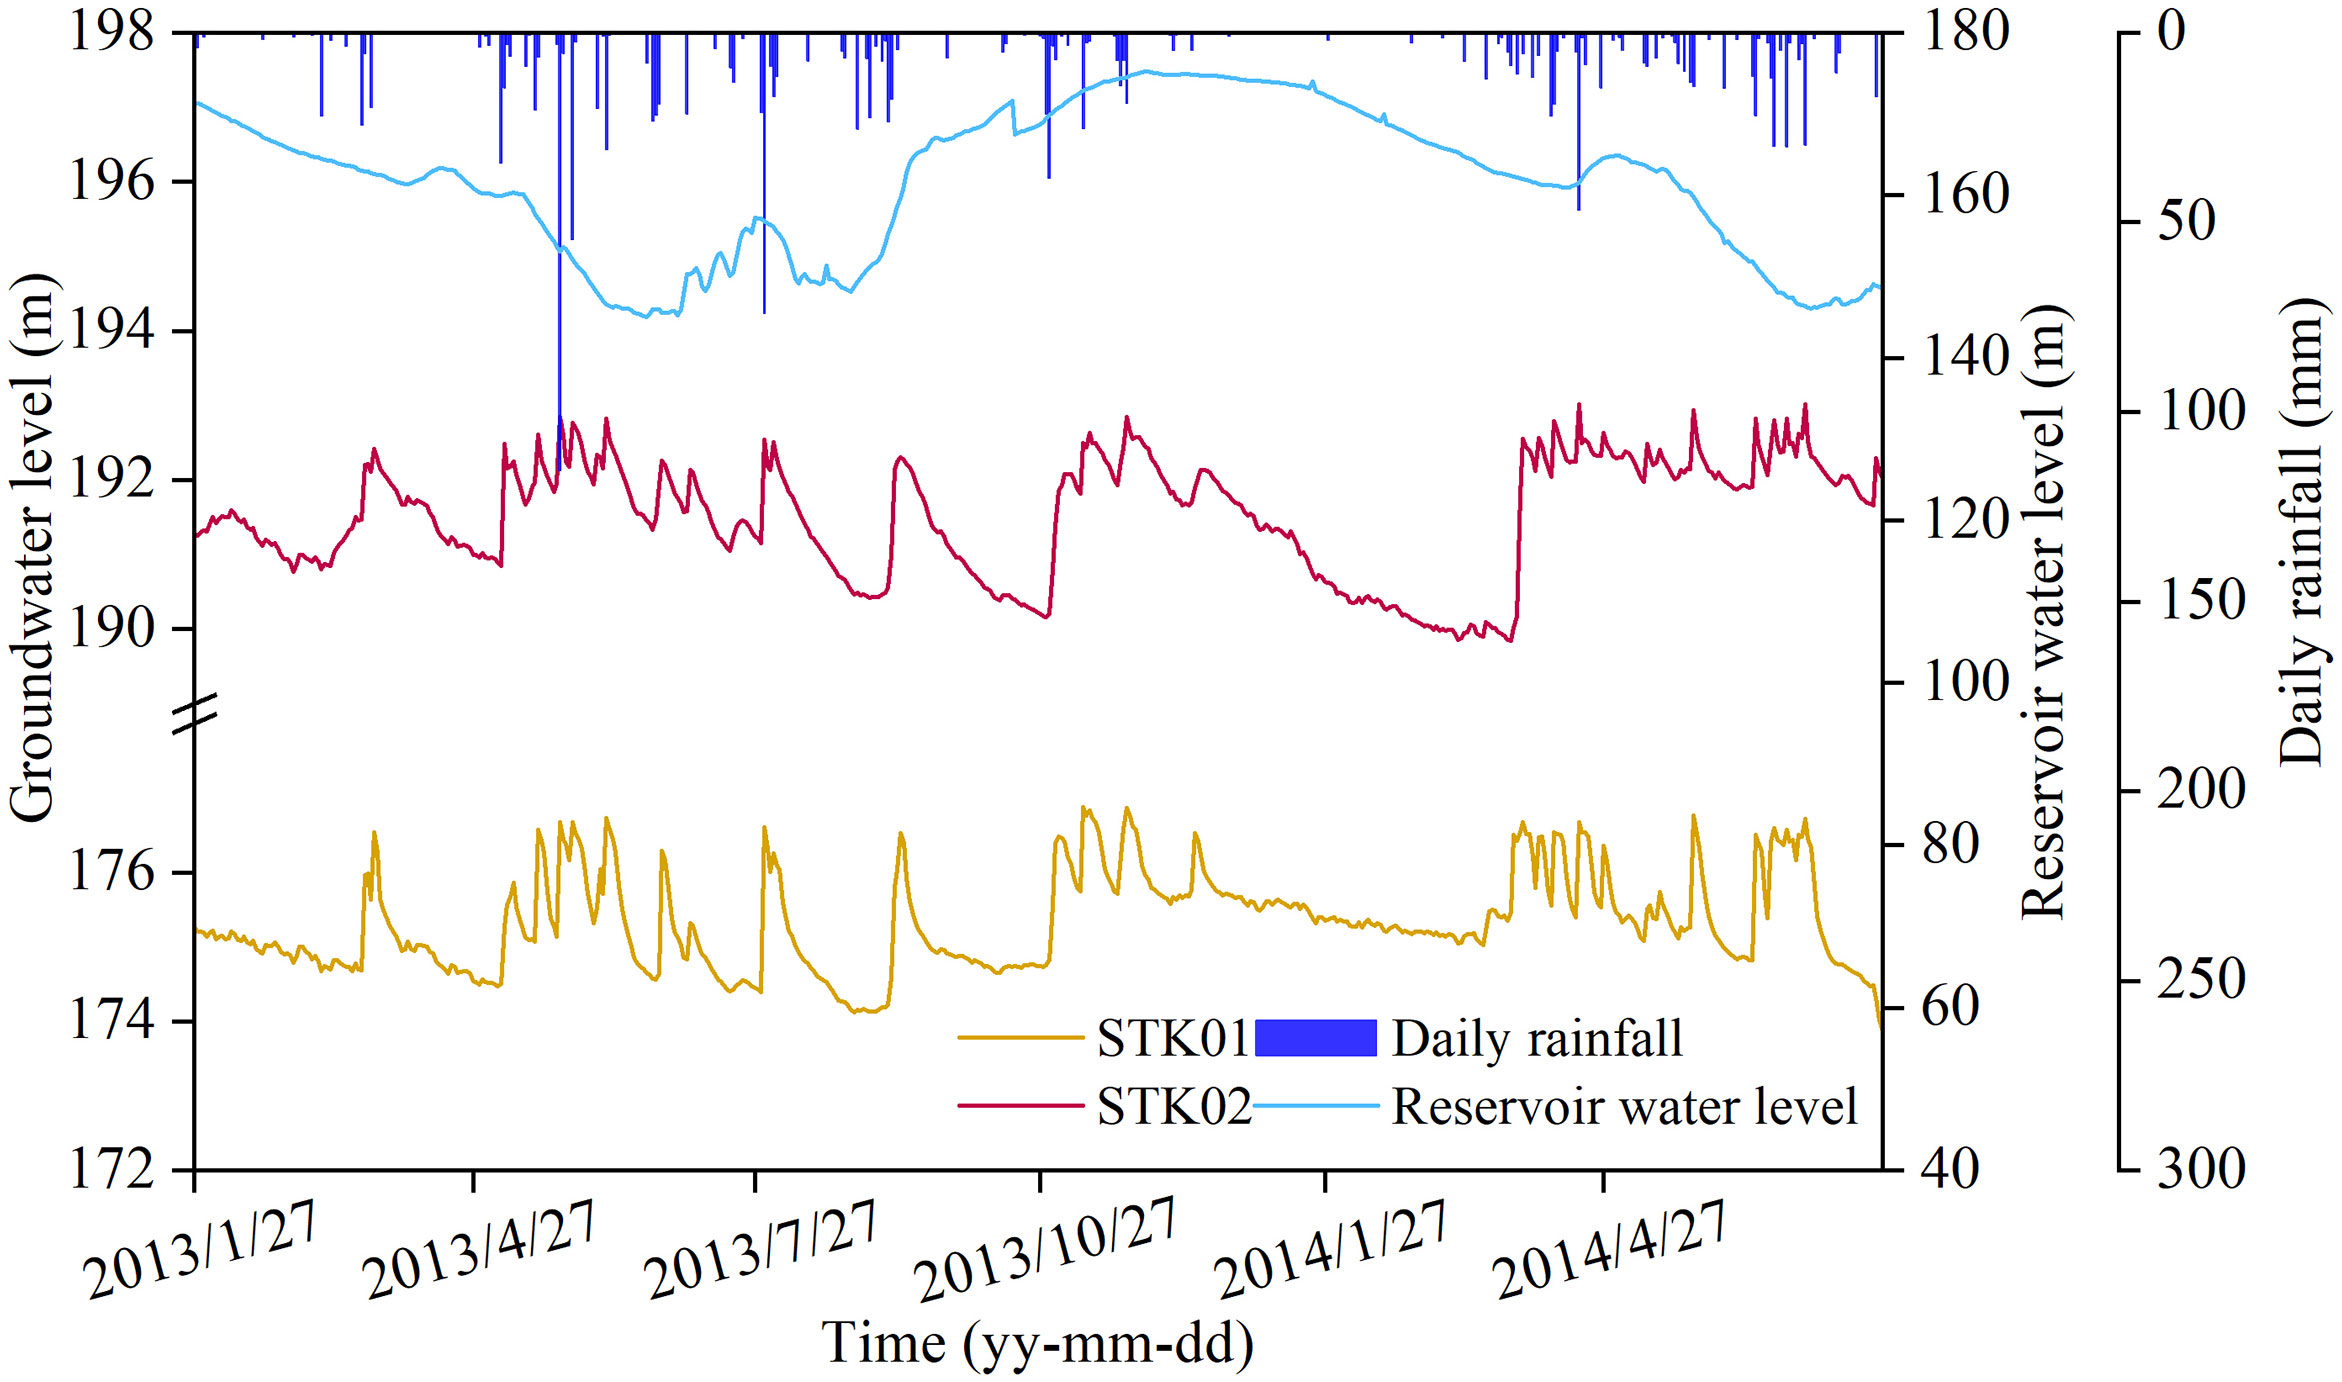
The groundwater level monitoring stations named STK01 and STK02 are located at elevations of 177 m and 194 m, respectively. Groundwater level monitoring data are available from January 27th, 2013 to July 26th, 2014 (Figure 7). The groundwater level of STK01 ranges between 173.9 m and 176.9 m, and that of STK02 ranges between 189.8 m and 193 m.
The monitoring data from January 27th to March 8th, 2013, was specifically chosen because of the remarkably low total rainfall of only 10.2 mm recorded during this period. This selection allowed the study to focus on a specific timeframe characterized by minimal rainfall, enabling a more direct investigation into the influence of reservoir level fluctuation on groundwater levels without significant interference from rainfall events. During this period, the groundwater level of STK01 declined at the rate of 0.012 m/d, which was much slower than the reservoir level change (0.17 m/d) (Figure 8A). The groundwater level change rate of STK02 was 0.009 m/d, slower than STK01 with the rate of 0.012 m/d, indicating that groundwater level response to reservoir level change decreased with increasing distance from the reservoir (Figure 8B).
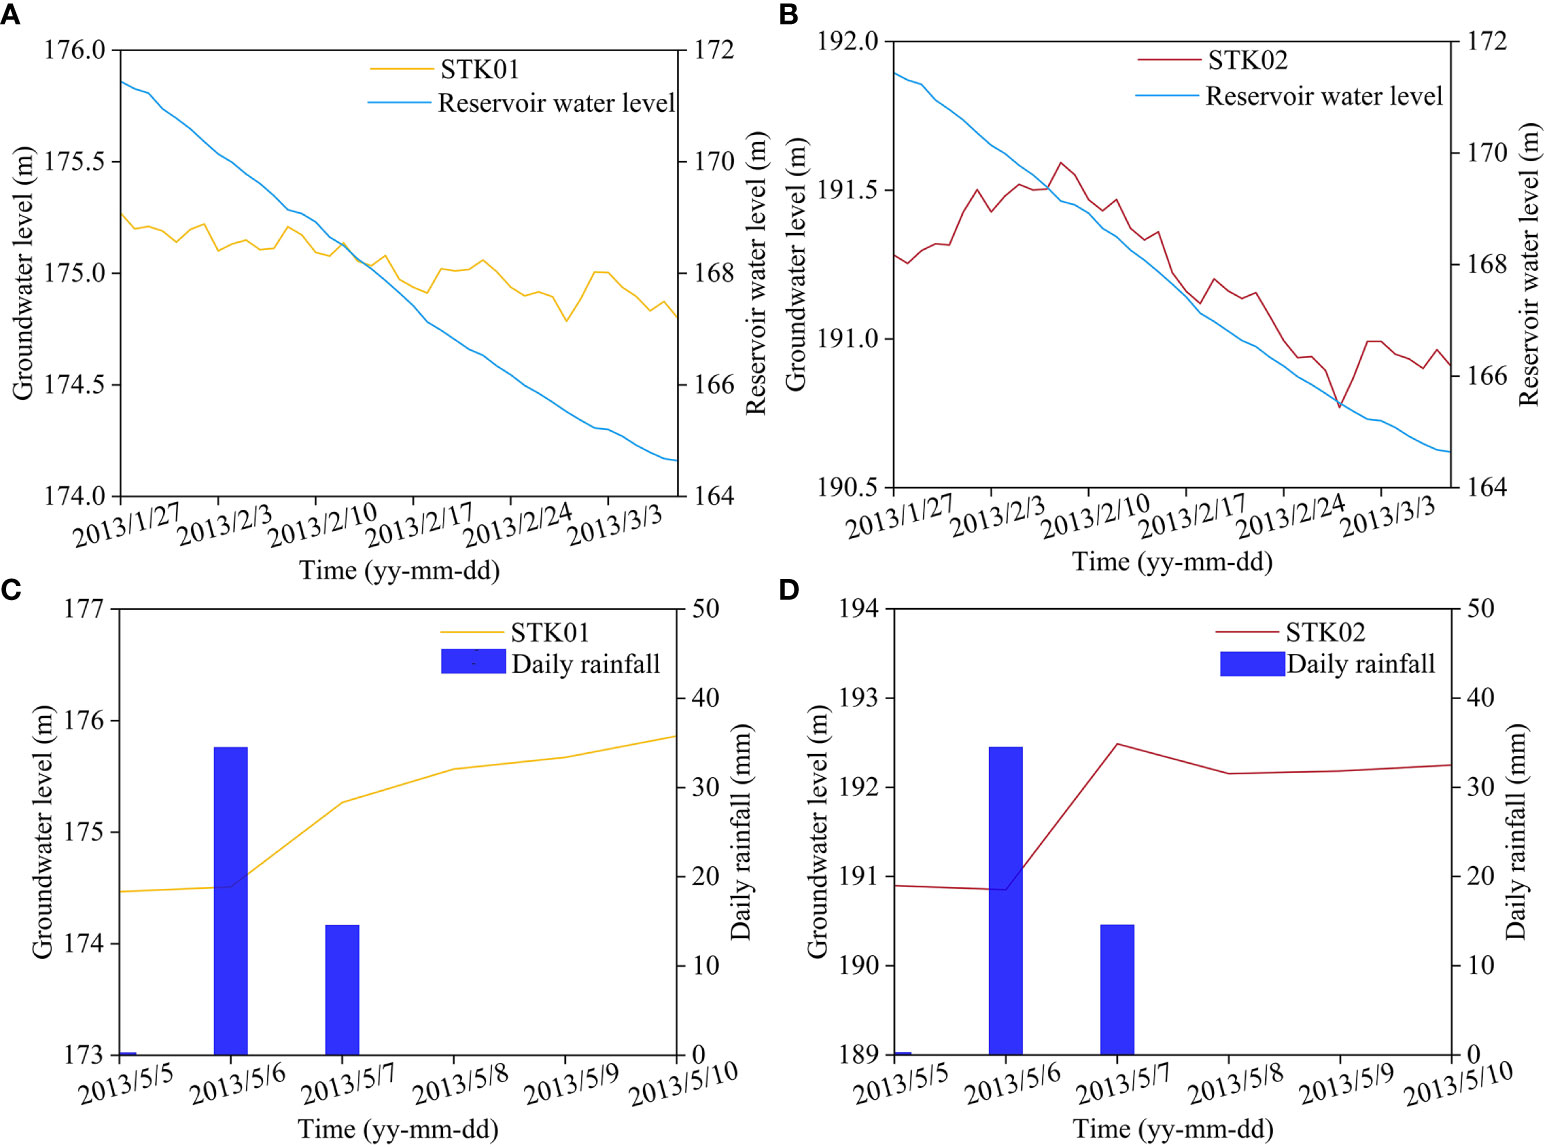
Figure 8 (A, B) Relationship between reservoir water level and groundwater level of STK01 and STK02; (C, D) Relationship between rainfall and groundwater level of STK01 and STK02.
From May 5th to May 14th, 2013, the reservoir level remained unchanged, and the selected monitoring data during this period was utilized to investigate the relationship between groundwater level and rainfall. Figure 8C indicated that the groundwater level of STK01 was influenced by rain and that precipitation of 20 mm led to a rise in groundwater level. The substantial fluctuation of the groundwater level in this site can primarily be attributed to the impact of rainfall, which was the main contributing factor. The total rainfall from May 6th to May 7th, 2013 was 49.1 mm, while the groundwater level reached a peak (175.3 m) on May 10th, 2013, lagging by about three days. However, the increase in the groundwater level of STK01 caused by rainfall was temporary, and it could recede at a faster rate initially and a slower pace later after the rain stops. Upon the occurrence of subsequent precipitation events, a temporary rise in the groundwater level was observed once again. The groundwater level of STK02 increased 1.4 m after rainfall, more than STK01 (1.35 m), suggesting that the response of STK02 was more sensitive to rainfall action than STK01 (Figure 8D). The peak of the groundwater level occurred on May 7th, 2013 without a time lag. The differences in groundwater response to rainfall between the STK01 and STK02 boreholes are believed to be related to material composition (Asch et al., 1999; Tartaglia et al., 2023).
3.3.2 GPS monitoring
The GPS stations offer deformation data for various locations within the landslide. Stations WZ01 and WZ03 are at the forefront of the landslide; WZ02, WZ04, and WZ05 are within the central, whereas WZ06 is in the back part. Displacement data are available from March 2007 to July 2014 for these sites (Figure 9). The cumulative displacements at the GPS station locations decrease as follows: WZ03 (1880.4 mm)> WZ04 (356.9 mm) > WZ06 (280.9 mm) >WZ05 (239.7 mm) > WZ01 (47 mm) >WZ02 (43.5 mm).
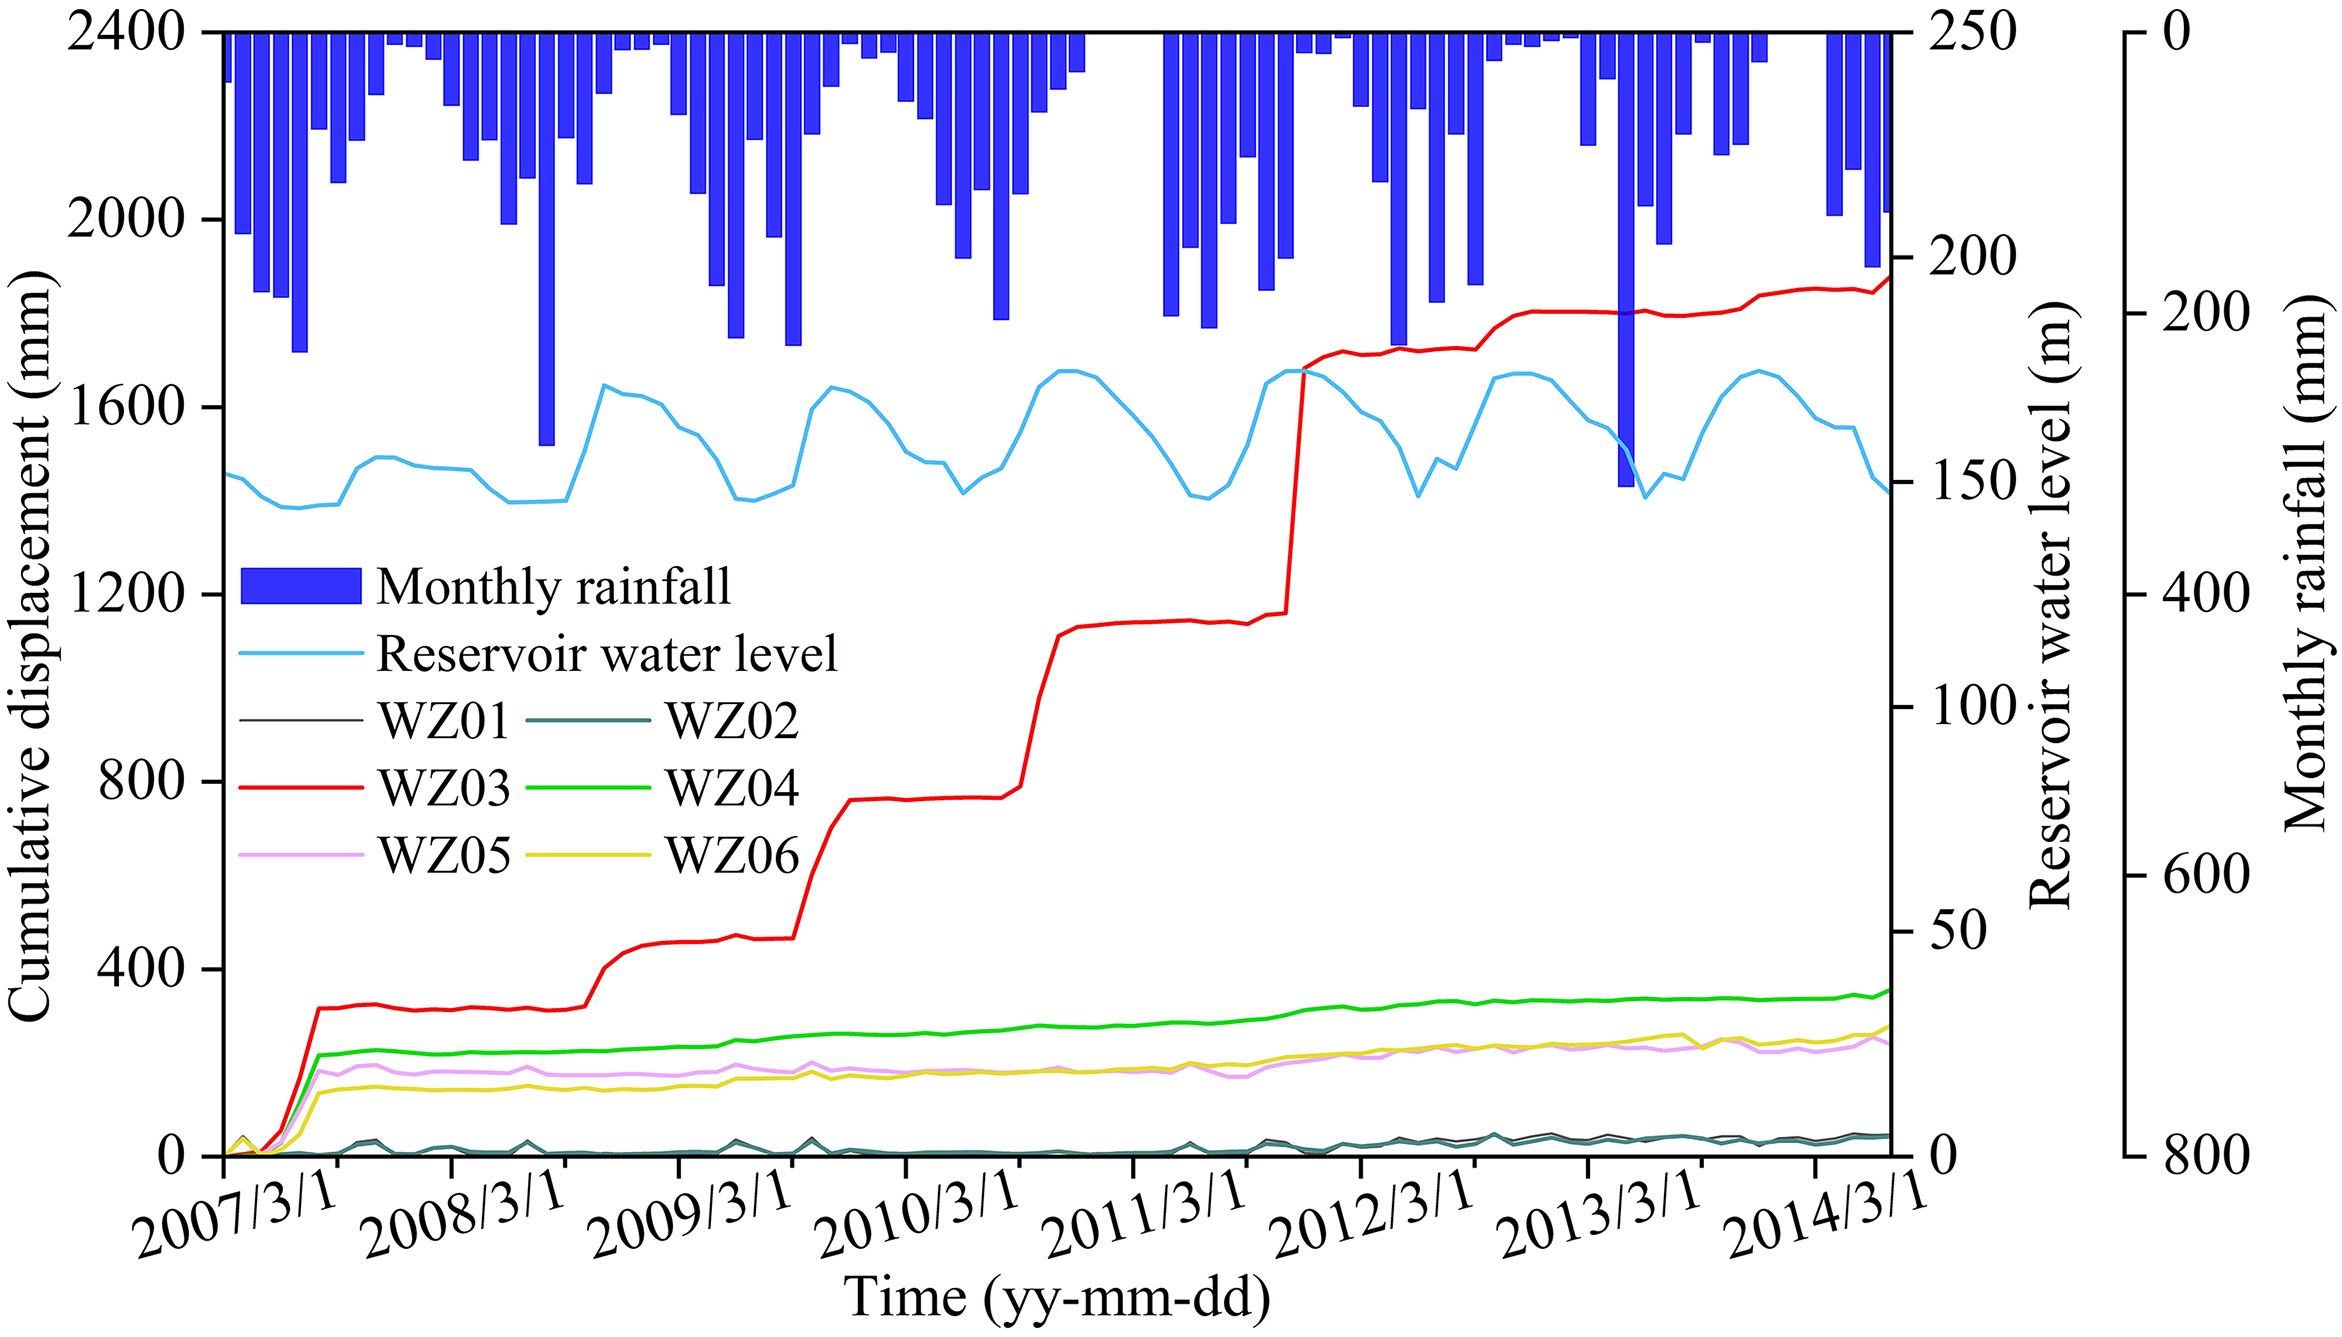
Figure 9 Cumulative displacement, monthly rainfall, and reservoir level at GPS Stations of the Sanzhouxi landslide.
The displacement-time curves shown in Figure 9 differ in different parts of the Sanzhouxi landslide. Station WZ03 shows a step-like type (Figure 2E), while Stations WZ04, WZ05, and WZ06 show a convergent type (displacement curves are illustrated in Figure 2C). For Stations WZ01 and WZ02, the displacements keep growing slowly and uniformly. Station WZ03 with more significant deformation is selected as an example to analyze the relationship between reservoir level, rainfall, and monitored displacement.
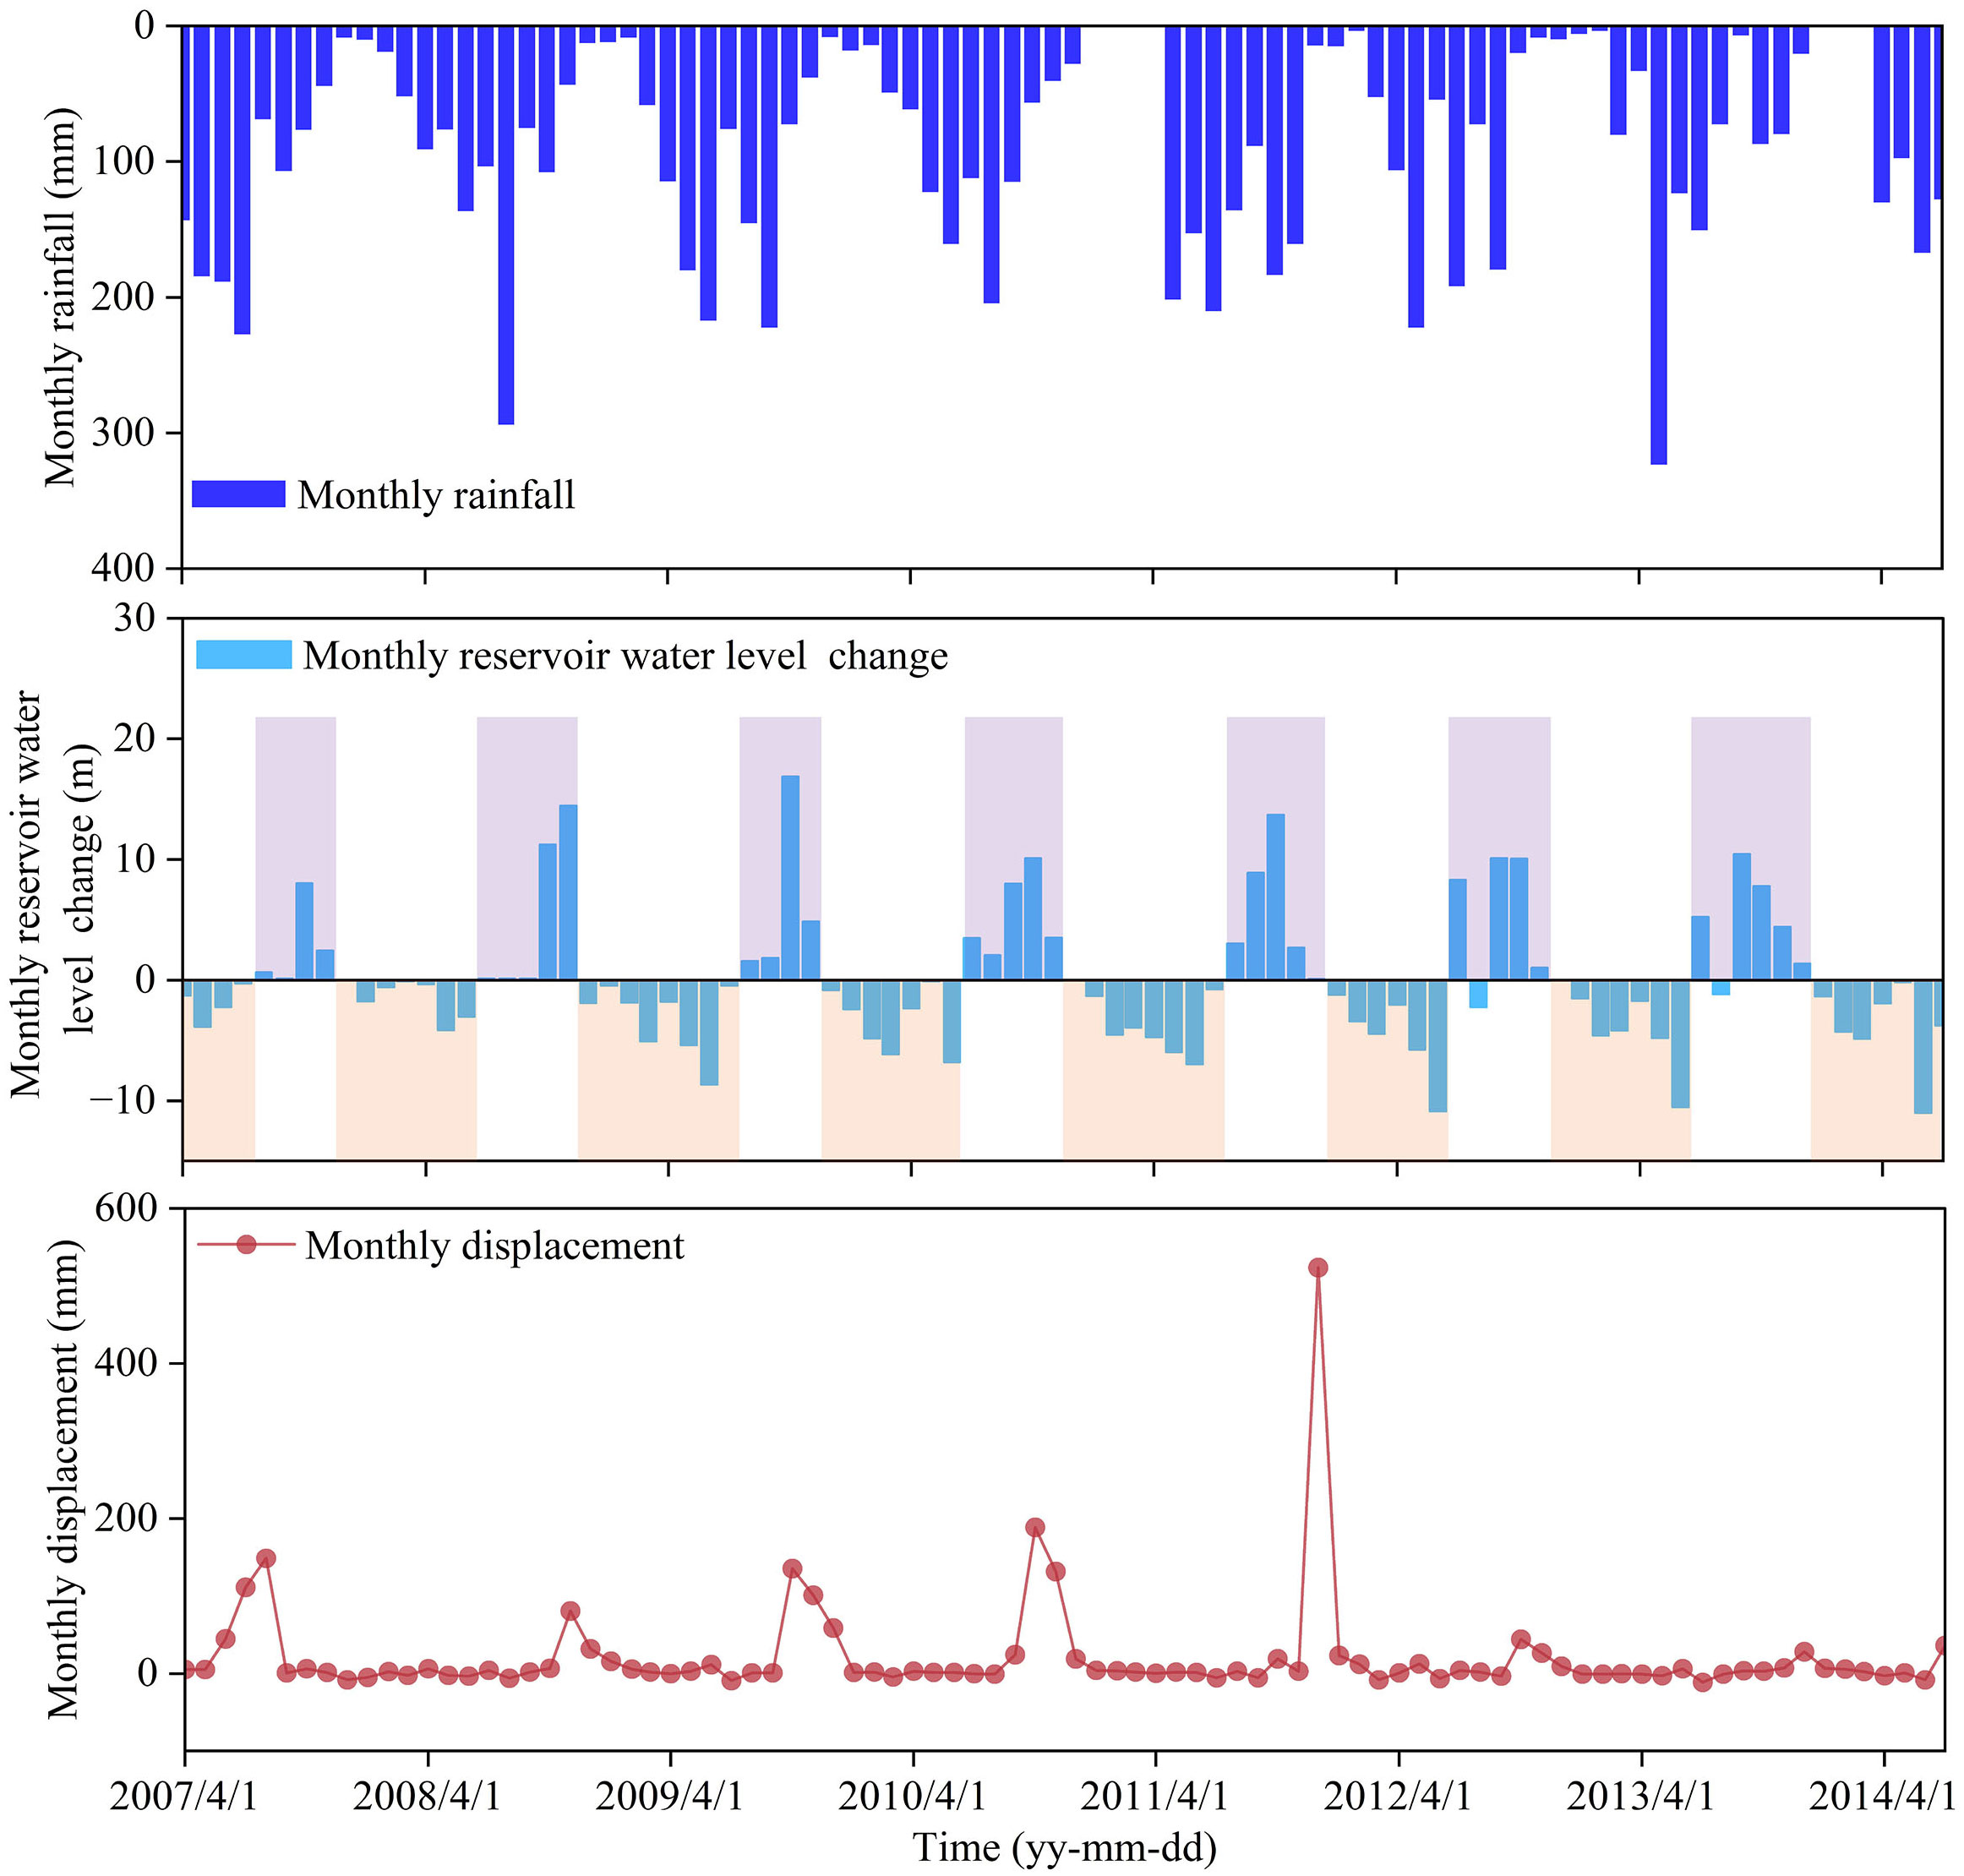
Station WZ03 is positioned within the front part of the Sanzhouxi landslide, and its elevation is 177 m. Figure 10 shows the monthly displacement of WZ03, monthly rainfall, and reservoir level change. During the period from March 2007 to July 2007, the water level in the reservoir fluctuated between 145 m and 156 m. An excavation conducted at the leading edge of the Sanzhouxi landslide revealed that the landslide’s toe was positioned between the elevations of 160 m and 175 m (Figure 5D). This excavation finding clearly indicated that the landslide was not submerged in the reservoir water during the aforementioned period and the observed deformation could be attributed to the significant rainfall.
In 2008, the reservoir level was raised from 145.5 m to 171.5 m for the first time, which resulted in a significant alteration in the hydrogeological conditions of the TGRA, inducing a maximum monthly displacement of 88 m. Subsequently, in 2009, the reservoir water level surged to 175 m, implying an expansion of the submerged area of the landslide. The maximum monthly displacement increased year after year and reached a peak in 2011. Specifically, it rose from 135 mm in 2009 to 188.9 mm in 2010, ultimately reaching 543.9 mm in 2011. The annual rainfall and maximum monthly rainfall during the years 2009 to 2011 remained consistently around 1100 mm and 220 mm, respectively. The primary factor contributing to the progressive increase in displacement over the years and culminating in a peak in 2011, can be attributed to the following reasons: 1) With the rise in water level due to impoundment, a larger portion of the landslide becomes submerged, leading to increased buoyancy at the front of the landslide. Simultaneously, the infiltration of water into the slope weakens the soil strength within the sliding zone. 2) The successive increments in reservoir water level from 2009 to 2011, measuring 25.1 m, 27.3 m, and 28.4 m, respectively. A larger water level change can exacerbate the deformation of the landslide (Song et al., 2018). 3) Human engineering activities, such as excavation and construction in the front of the landslide, have been demonstrated to intensify the deformation of the landslide (Zhou et al., 2016).
After 2012, the sliding became more uniform with a maximum monthly displacement of 44.6 mm in 2012 and 28.2 mm in 2013. Additionally, in the years from 2008 to 2013, the maximum monthly displacement was recorded in November (2008), October (2009), October (2010), December (2011), October (2012), and December (2013), respectively. This observation suggests that significant deformation of the landslide occurred during reservoir impoundment.
3.3.3 Crack width monitoring
When the six ground crack monitoring was installed in September 2012, the DL01 to DL06 had widths of 5383.5 mm, 2807.3 mm, 3174.5 mm, 1348.4 mm, 2051 mm, and 2825.4 mm, respectively. It should be noted that the values refer to the distance between two fixed stations across the crack rather than the real width of the cracks. Daily data for crack width from September 19th, 2012 to July 17th, 2014 were recorded. Daily reservoir water level was available for the entire period. However, daily rainfall data was incomplete and data between January 1st, 2013, and July 17th, 2014 were collected for analysis. The monitored ground cracks experienced different extensions during the monitoring period. The extensions of DL01 (30 mm) and DL02 (25 mm) were larger than that of the other four cracks (about 10 mm). The relationships between crack width, daily rainfall, and daily reservoir were analyzed according to the monitored data presented in Figure 11.
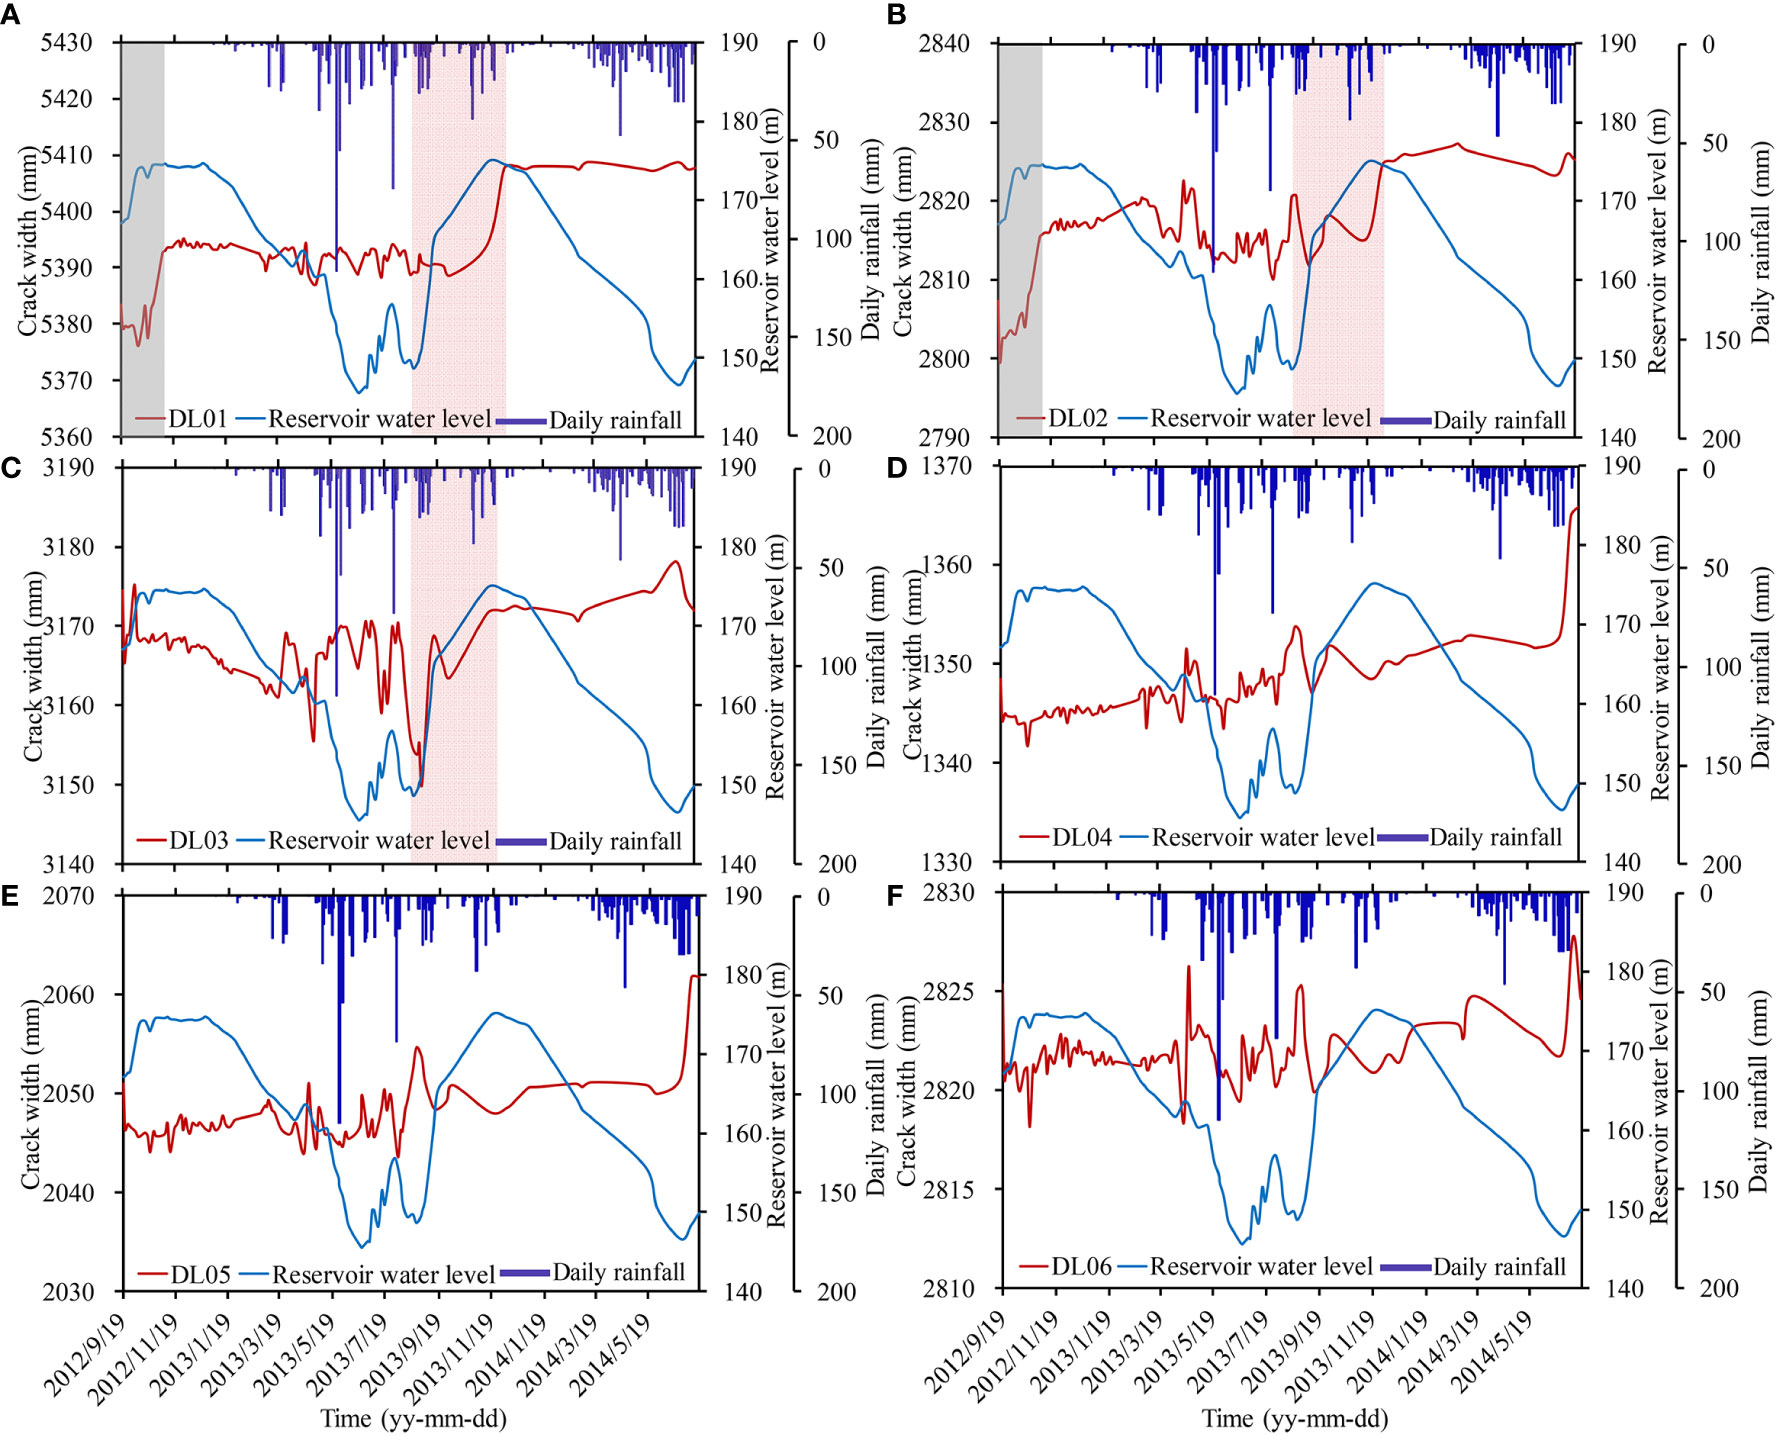
Figure 11 (A–F) Relationships between reservoir water level, daily rainfall, and cracks width monitored at DL01 to DL06.
Monitoring points of DL01 and DL02 were in the central area of the landslide’s front section, at elevations 188 m and 194 m, respectively. The displacement trends of these two points were similar and showed sharp increases in crack extension. During the period from September 19th to October 14th, 2012, as the reservoir level increased from 167.1 m to 174.2 m, significant movement appeared with the crack extending by 16 mm. The movement lagged the reservoir raise by about 23 days (grey rectangles in Figures 11A, B). Subsequently, from December 21st, 2012, to June 22nd, 2013, the reservoir level gradually dropped from 175 m to 145 m. It remained at 145 m until August 24th, 2013. The cracks did not expand dramatically and only had frequent small waves in these three periods. During the period from August 25th to November 18th, 2013, the reservoir level experienced an increase from 148.2 m to 175 m. For DL01 and DL02, their movements coincided with the water level rising and increasing by 20 mm and 10 mm, respectively. The appearance of crack extension for the two monitoring points lagged the reservoir level rising for about 43 days and 33 days, respectively (red rectangles in Figures 11A, B). During the period from November 19th, 2013 to June 26th, 2014, the deformation showed a small increase with the reservoir level gradually decreasing. The analysis above revealed that the dam reservoir level rise contributed to the deformation observed at the landslide’s frontal section.
DL03 was located near DL02, and its elevation was 198 m. During the period from August 25th to November 18th, 2013, the crack width of DL03 increased by 18 mm as the reservoir level rose from 148.2 m to 175 m without time lag (red rectangle in Figure 11C). This phenomenon revealed that the site of DL03 exhibited a higher sensitivity to the reservoir level increasing compared to DL01 and DL02. DL04, DL05, and DL06 were located on the landslide’s right edge. Before June 26th, 2014, the variation of crack width at each monitoring point was relatively small, while a significant surge in the crack occurred in the summer of 2014. The monitored curves did not show an apparent relationship between the crack movements and reservoir water level fluctuation (Figures 11D–F).
The relationship between crack width and daily rainfall was examined based on the combined data presented in Figure 11. Although some notable rainfall events occurred, such as 115.6 mm on May 5th, 2013, and 74.1 mm on July 30th, 2013, no significant correlation was observed between these rainfall events and the observed deformation in terms of crack width at the monitoring stations.
3.3.4 Deep displacement
The lateral displacement versus depth from inclinometers QZK01 and QZK02, depicted in Figures 12A, B, respectively, provided insights into the behavior of the Sanzhouxi landslide. In particular, the inclinometer QZK02, positioned at the rear of the landslide, captured the development of a sliding zone at a depth of approximately 8.1 m (Figure 12B). Notably, this sliding zone did not extend to inclinometer QZK01. The displacement of the sliding zone increased by about 100 mm in seven years (between July 2007 and July 2014) (Figure 12C). The monthly displacement of the sliding zone fluctuated with positive (outwards the slope body) and negative (inwards the slope body), while it did not show an apparent relationship with rainfall and reservoir level fluctuation (Figures 12D, E).
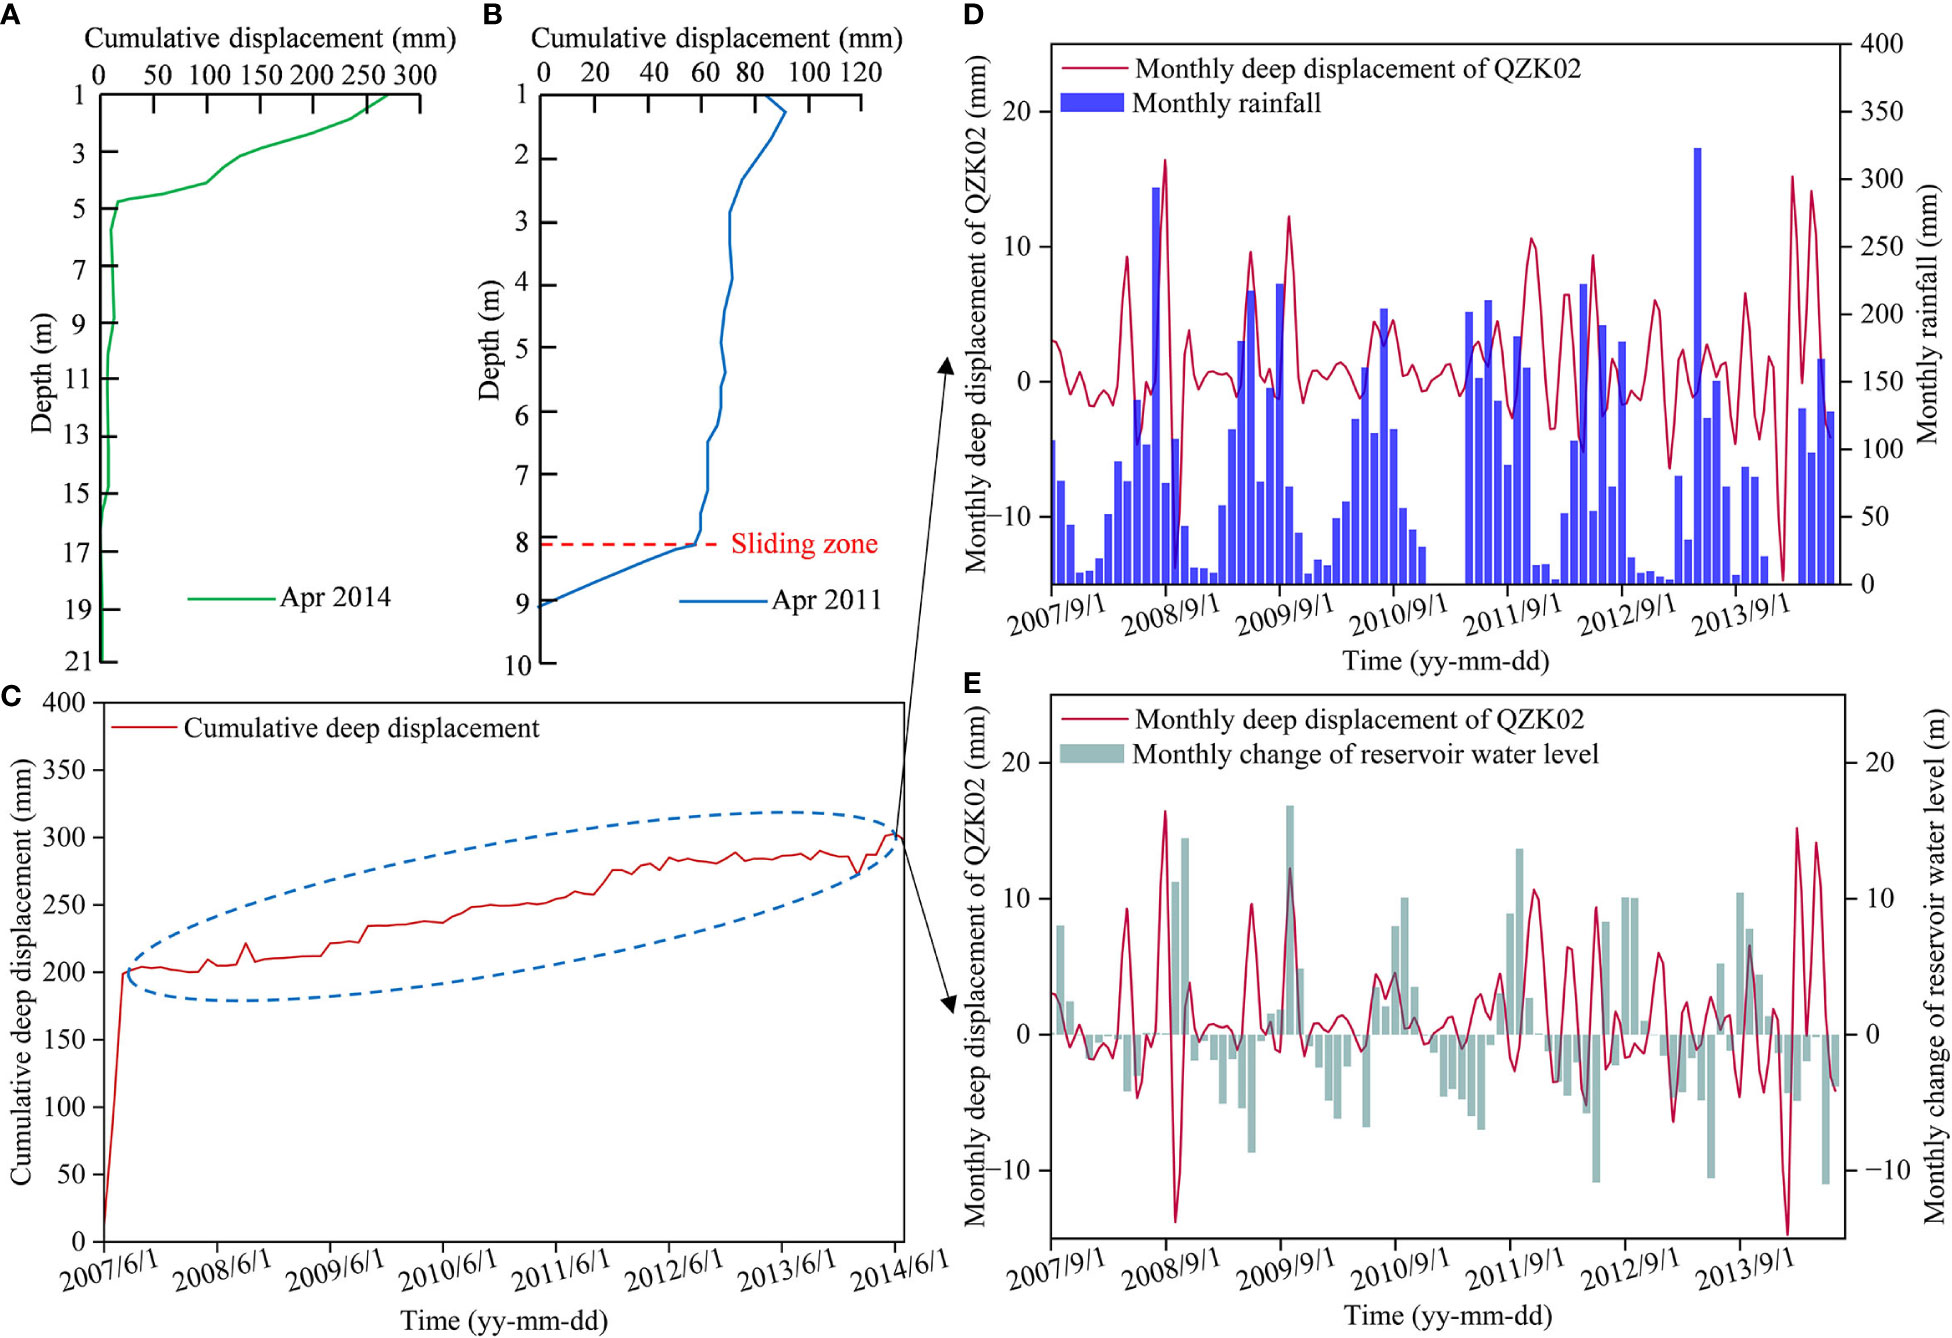
Figure 12 Deep displacement monitoring: (A) Lateral displacement versus depth of QZK01; (B) Lateral displacement versus depth of QZK02; (C) Deep cumulative displacement versus time at the location of QZK02; (D) Monthly displacement of the sliding zone and monthly rainfall at QZK02; (E) Monthly displacement of the sliding zone and monthly change of reservoir level.
3.4 Identification of triggering factors of the Sanzhouxi landslide
Qualitative analysis of monitoring data in the preceding sections has been conducted to examine the relationship between landslide deformation and hydrological factors, namely rainfall and reservoir level rise. A quantitative analysis using grey relational analysis (GRA) is performed here to identify the predominant triggers for inducing landslide deformation during various evolutionary periods. We will use WZ03, which shows the largest displacement among the six GPS monitoring stations, as an example. The calculation process of the GRA method can be found in the section “2.2 Identification of triggering factors using GRA”.
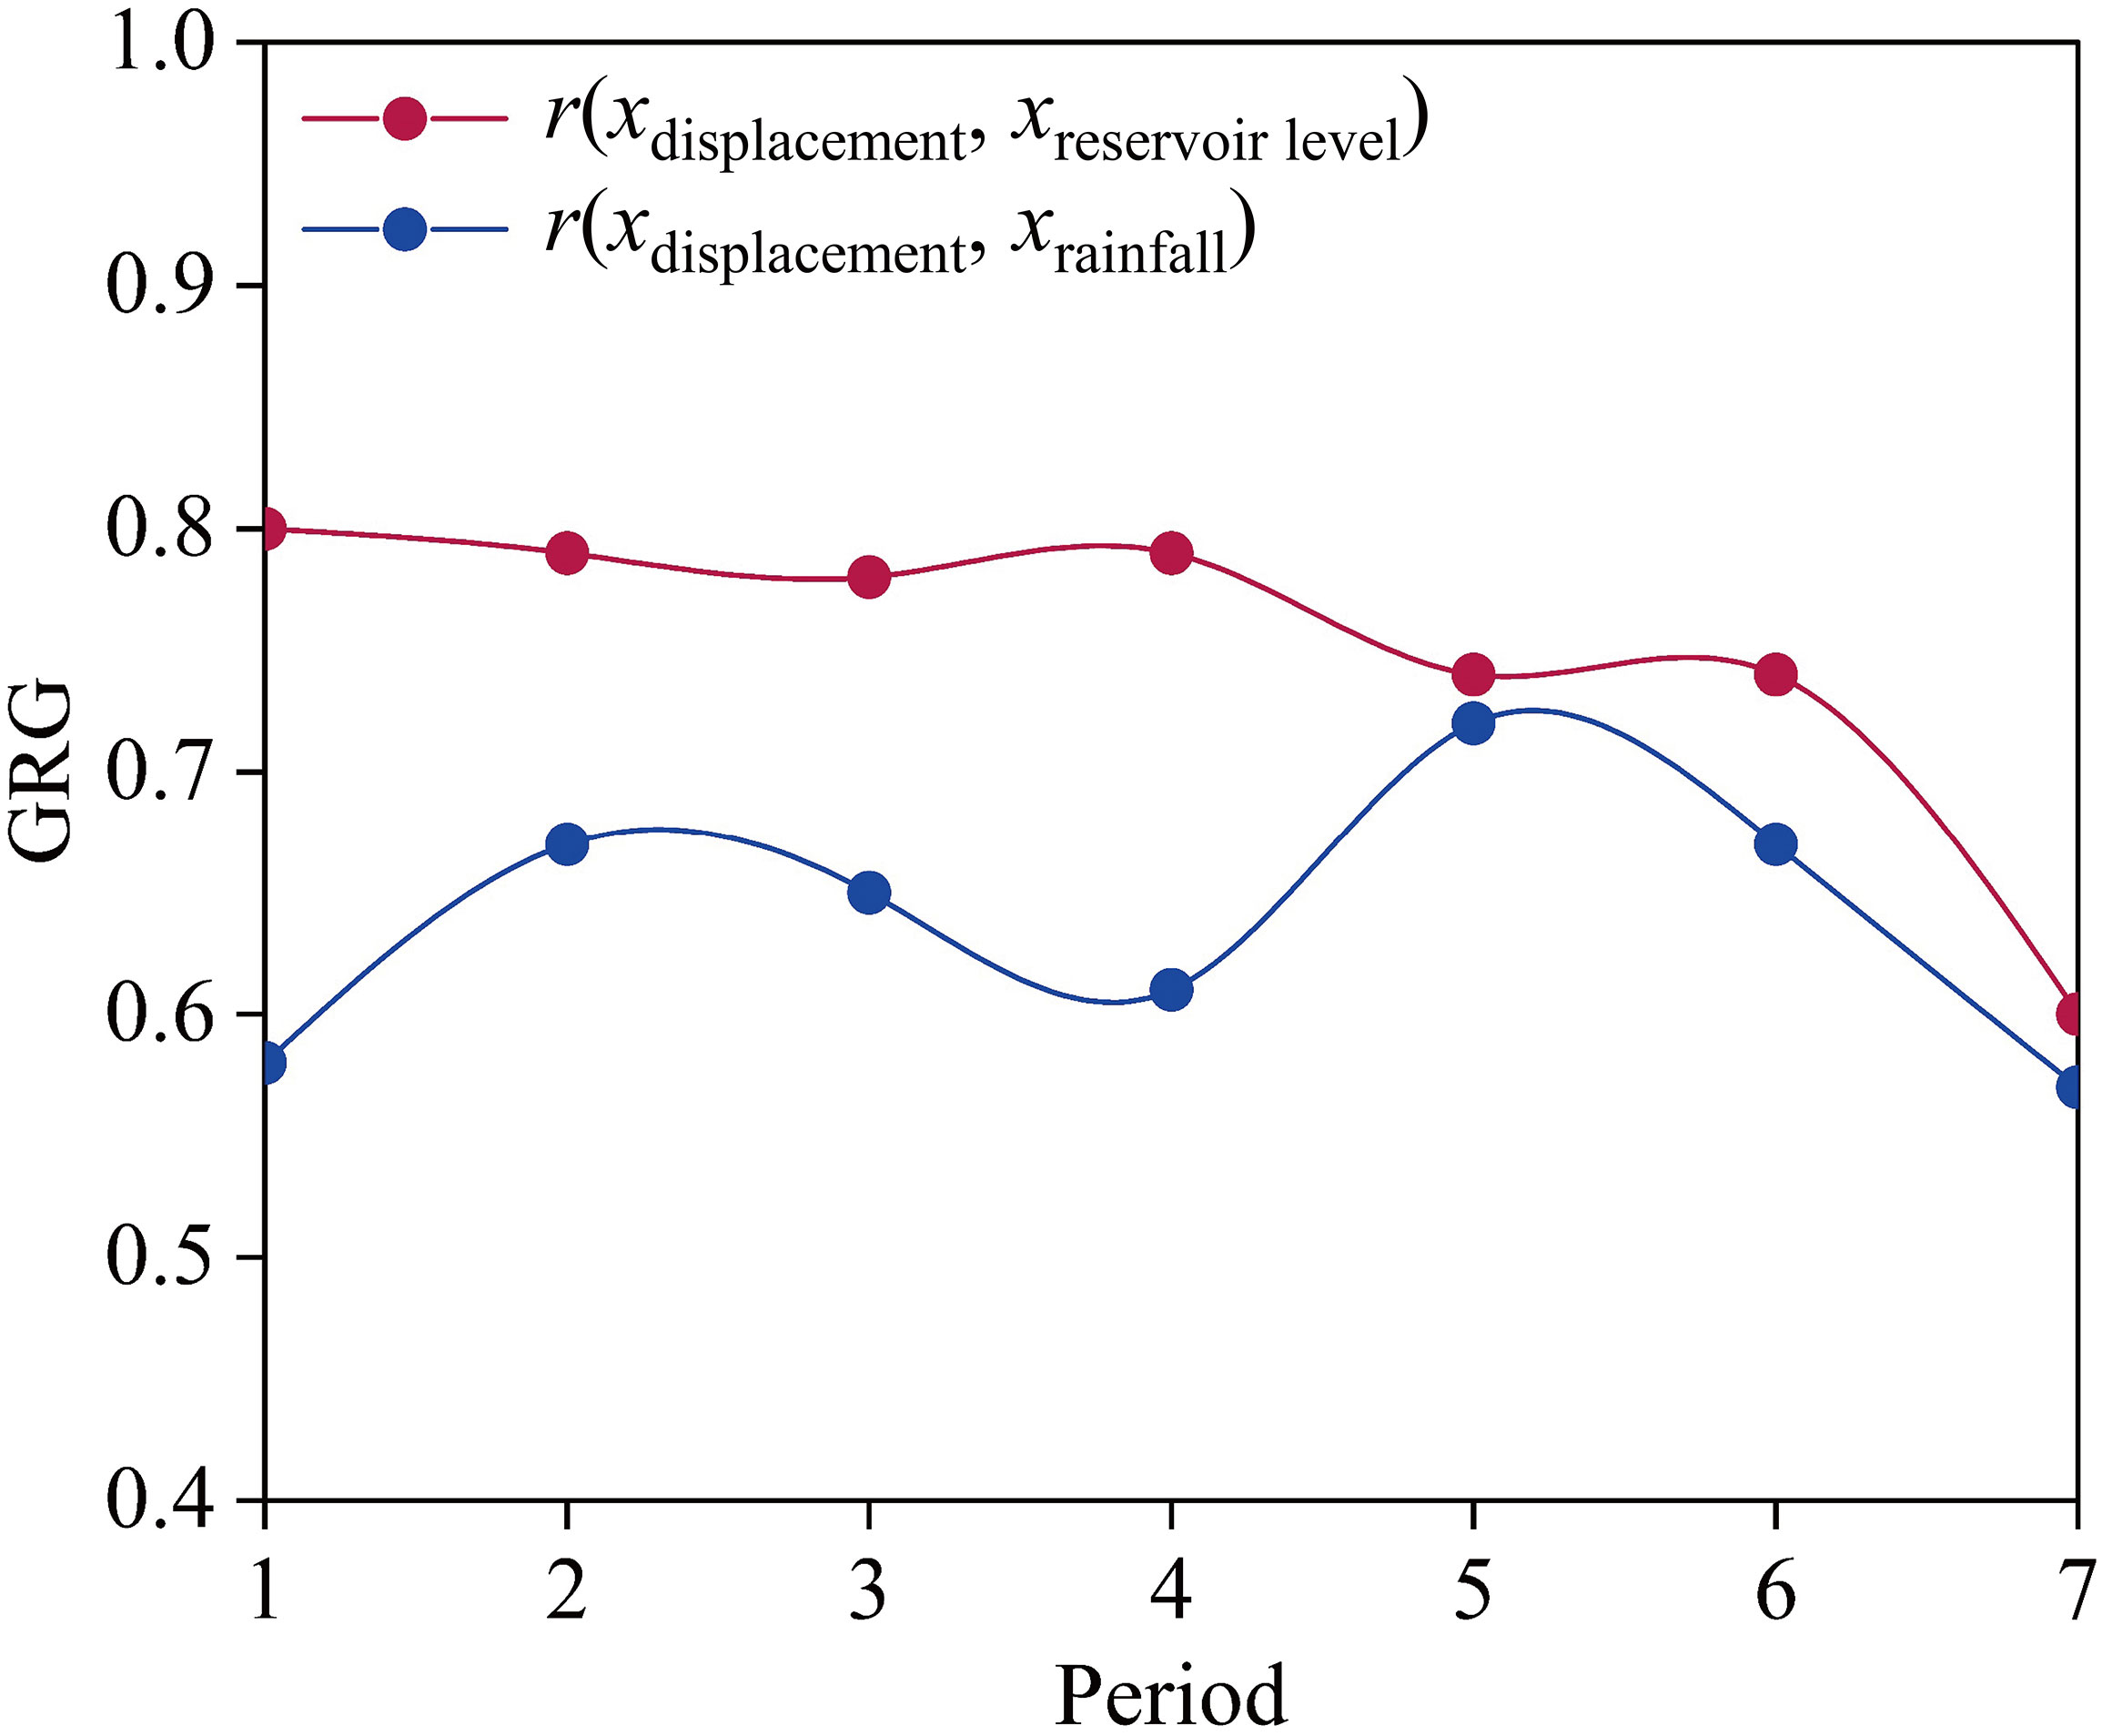
Seven periods of reservoir impoundment were present between 2007 and 2014 (Figure 10). The correlation between monthly displacement and reservoir level rise was quantified as r(xdisplacement, xreservoir level), while the correlation between monthly displacement and rainfall was indicated as r(xdisplacement, xrainfall). GRG of the seven periods was displayed in Figure 13. For all the reservoir raise periods, the calculated GRG was higher for the reservoir level fluctuations, i.e., r(xdisplacement, xreservoir level)>r(xdisplacement, xrainfall), meaning that the movement was primarily induced by reservoir level rising, while rainfall played a subordinate role. This finding aligns with the qualitative analysis obtained in the previous sections.
Moreover, the GRG value of r(xdisplacement, xreservoir level) remained at approximately 0.8 in the preceding years but exhibited a decreasing trend starting from 2013, indicating a reduced impact of the reservoir level rising on landslide movement. This conclusion agreed with the research of Zhang et al. (2020) and Yang et al. (2023). Their findings suggest that reservoir-induced landslides generally display more pronounced responses to reservoir water during the initial phase of reservoir impoundment. However, over time, this impact gradually diminishes, eventually leading to a self-adjusted stable state.
4 Stability evolution of the Sanzhouxi landslide
The fluctuations of the reservoir level during 2016 were divided into six successive reservoir level periods, as illustrated in Figure 3. The geotechnical software Geo-Studio (Geo-slope International Ltd, 2019) was adopted to simulate the seepage (SEEP/W program) and calculate the factor of safety (FS) (SLOPE/W program) for the Sanzhouxi landslide. It is essential to acknowledge that the accuracy and reliability of the numerical modeling results obtained from the Geostudio software are significantly controlled by parameter accuracy, boundary setting, and so on. The previous researches contribute to providing references for the establishment of Geo-Studio models designed for analyzing landslides in the TGRA (Miao et al., 2017; Yang et al., 2017).
The FS on each day of an entire year was computed by the MP method. The cross-section (A–A′ in Figure 5), which was consistent with the main sliding direction, was chosen as a typical cross-section for the analysis. The model, shown in Figure 14A, was divided into 866 elements and 987 nodes. The monitored daily rainfall as well as daily reservoir water level were set as boundary conditions. Thereinto, the slope surface above an elevation of 175 m was defined with daily rainfall as the infiltration boundary, while the slope surface below 175 m had the reservoir water level as the variable water head boundary. The interface between soil and bedrock serves as the boundary for water partitioning.
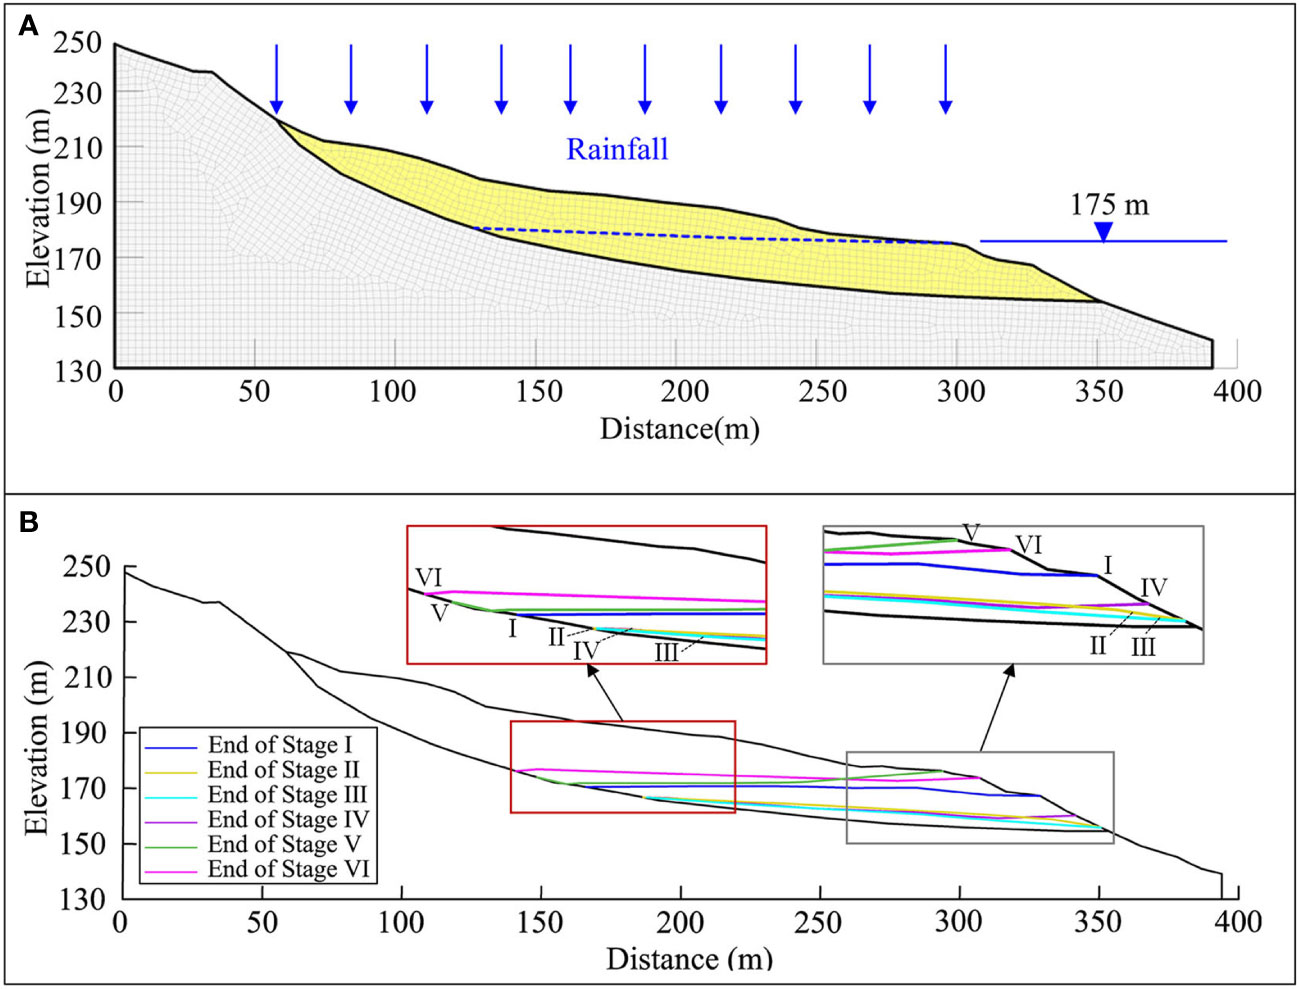
Figure 14 (A) Calculation model of the Sanzhouxi landslide; (B) Saturation line at the end of each reservoir stage for the Sanzhouxi landslide.
The permeability coefficient was obtained from field infiltration tests and set as 5.01 m/d. The saturated water content of the clay in the slope was taken as 40%. The unit weight, elasticity modulus, and Poisson’s ratio for the sliding body were set to 22 kN/m3, 3×10⁴ kPa, and 0.3 (for drained conditions). The unit weight, elasticity modulus, and Poisson’s ratio for bedrock were 25.3 kN/m3, 1.1×10⁶ kPa, and 0.25. The cohesion and internal friction angle of the sliding material were measured to be 22 kPa and 11°, respectively.
4.1 Seepage simulation
The saturation line at each end of the reservoir stage for the Sanzhouxi landslide was shown in Figure 14B. The groundwater was discharged from the landslide without time lag when the reservoir level decreases (stages I and II). In the following low reservoir stage (stage III), the reservoir level frequently fluctuated at a small range due to the realimentation by the rainfall. The frequent change of reservoir level resulted in the infiltration line of the front part of the landslide being slightly convex, while the infiltration line of the remaining sections was kept the same. As the reservoir level increased (stages IV and V), the infiltration line of the front part rises higher than the middle and rear parts, resulting in the infiltration line within the slope being concave. After a high reservoir level has been kept for about 10 days (stage VI), the infiltration line at the middle part of the landslide gradually rises to the same level as the front edge.
4.2 Variation of the factor of safety of the Sanzhouxi landslide over one year
Figure 15 displayed the factor of safety (FS), daily rainfall, and reservoir level. When rainfall and reservoir level changes were coupled, the two-dimensional (2D) FS computed by Slope/W ranged from 1.07 to 1.17 over one year. The computed FS suggested that the slope was stable, although an FS of 1.07 was not very robust, given that there were many uncertainties in the soil parameters and 2D LEM model. During stage I, the FS kept decreasing for 25 days and subsequently increased. In stage II, the FS was constant at about 1.10 for 20 days and then increased with the reservoir level rising rapidly. In stage III, the FS continued to rise, but the rate of increase slowed down. The reservoir level increased from 146.4 m to 161.1 m in stage IV, resulting in an FS of 1.15 without significant variation. The main reason was that the leading edge of the landslide covered within a range of 160 m to 175 m, and thus only a tiny part of the leading edge can be submerged in the reservoir water during this stage. The computed FS showed a slight increase during stage V and decreased from 1.15 to 1.11 during stage VI. In stage V, the rise of the reservoir water level led to an increase in hydrostatic pressure acting on the landslide, consequently augmenting the FS of the slope. After entering stage VI, the infiltration of reservoir water into the landslide caused a reduction in soil strength, which was evident in a pronounced downward trend of the FS of the landslide.
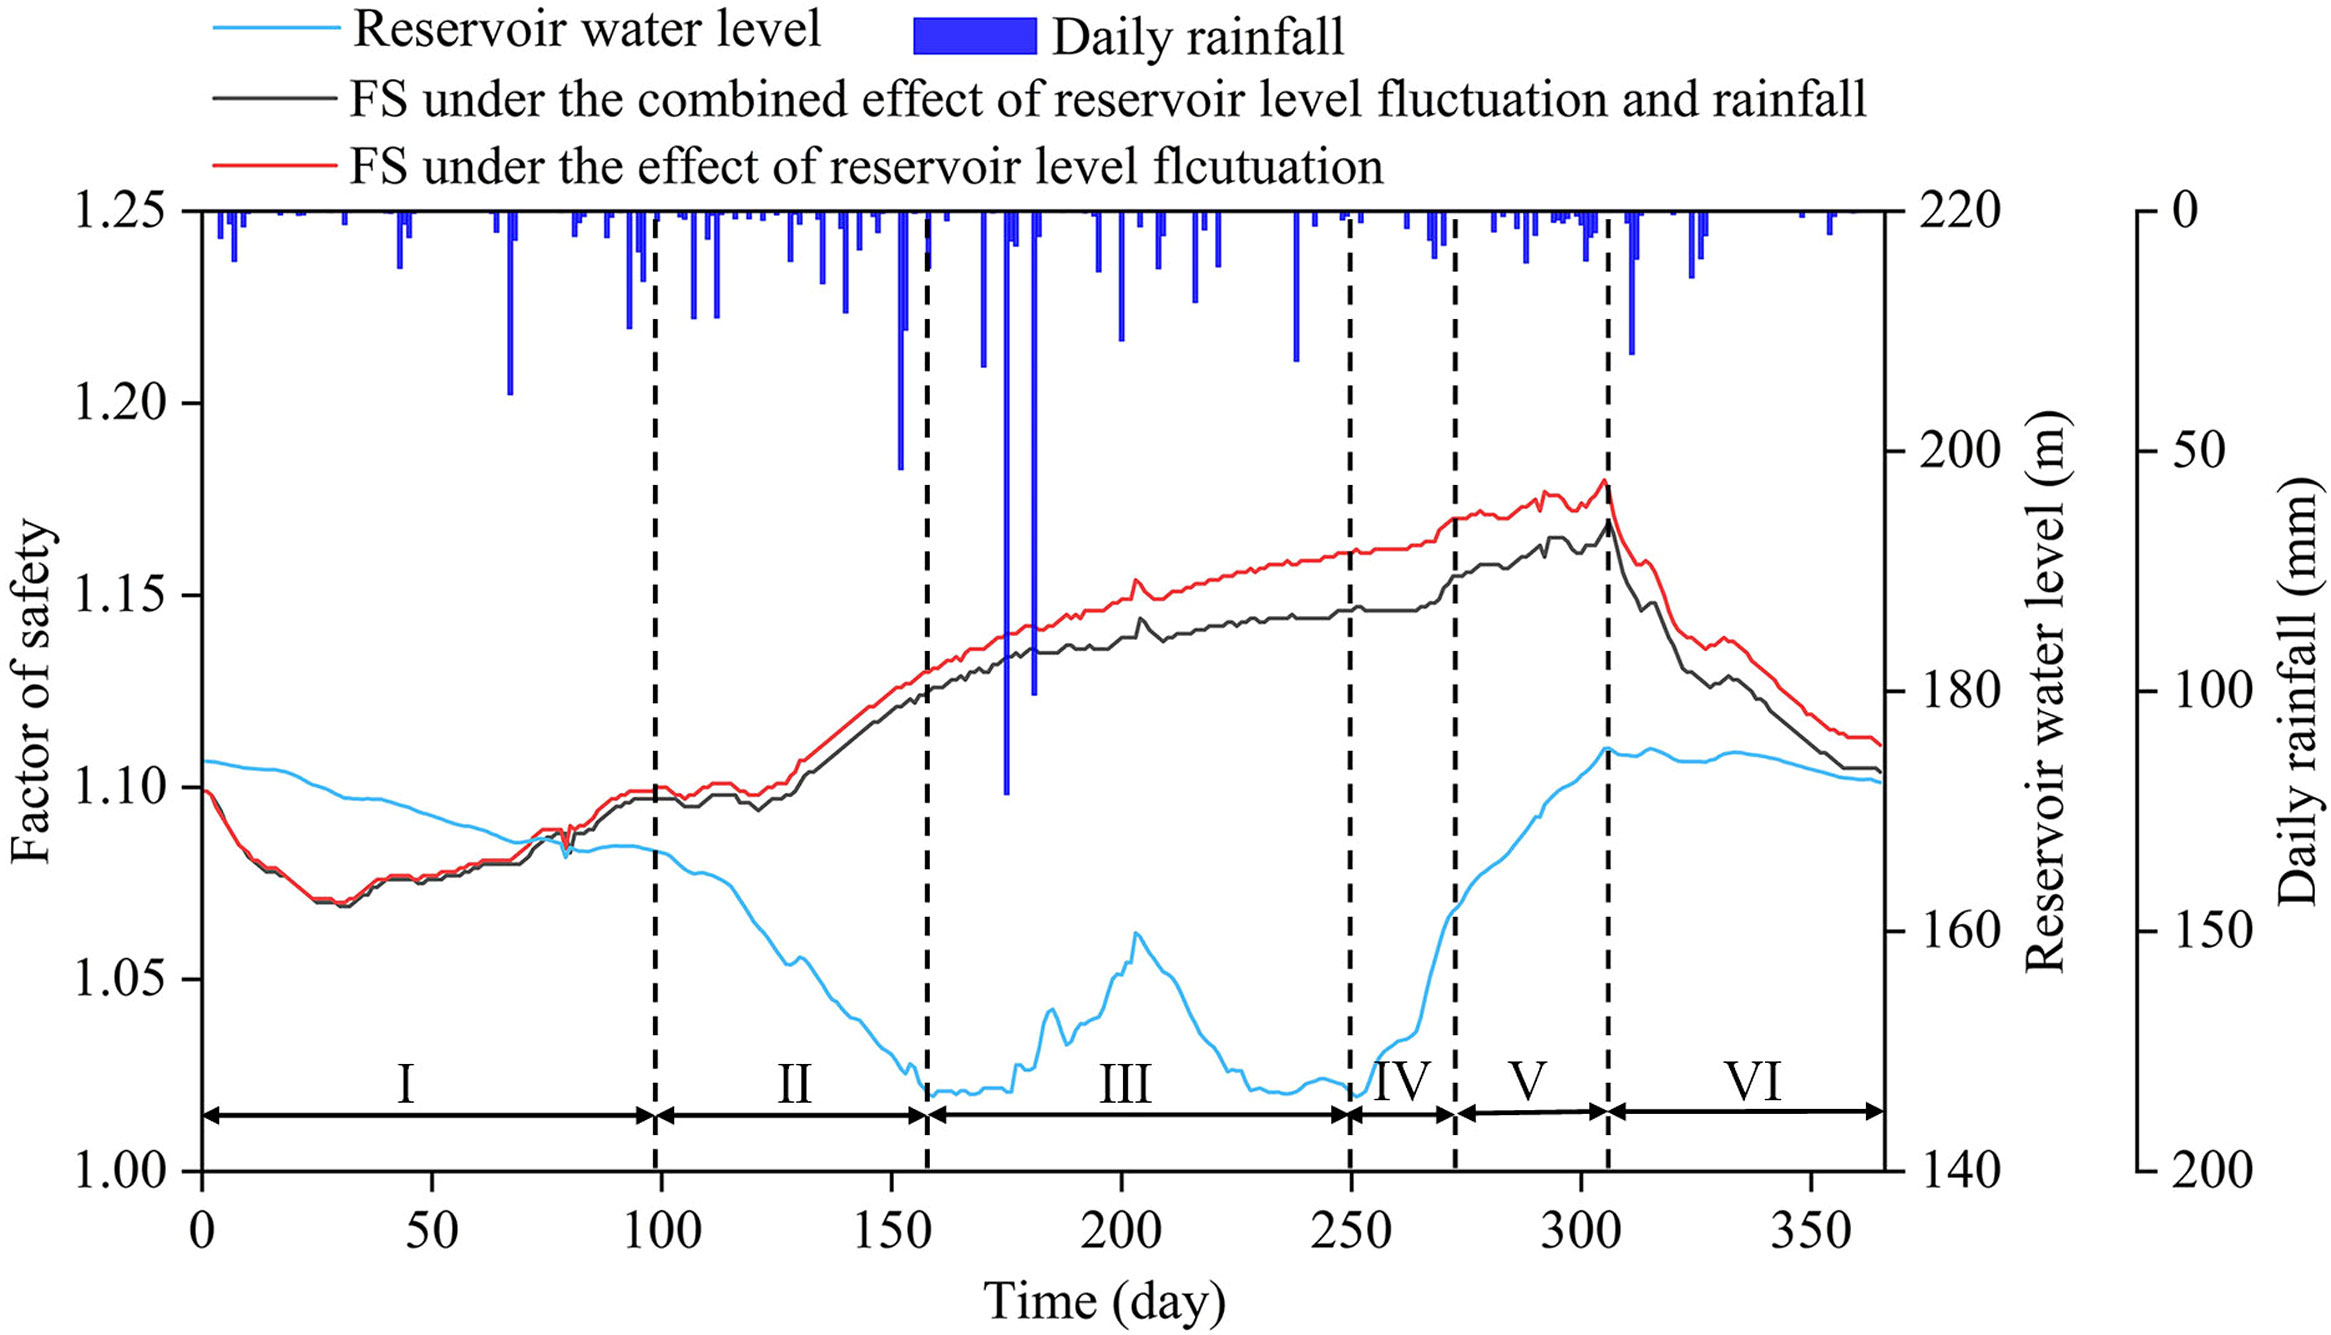
Figure 15 Variation of factor of safety (FS) for one year, with daily rainfall and reservoir water level on each day.
The FS under the sole influence of reservoir level changing was also calculated for comparison. The FS was slightly higher than the FS with the coupled effect of reservoir level fluctuations and rainfall. Among stages, I to IV, the smallest difference in the FS for the two conditions occurred in stage I, while the largest difference in the FS appeared in stage IV, although the differences in the FS were not significant.
5 Deformation mechanism of the Sanzhouxi landslide
The Sanzhouxi landslide’s toe is situated within the elevation range of 160 m to 175 m. Prior to September 2008, the reservoir level remained below 156 m, indicating that it was not submerged by water. The deformation of the landslide during this period can primarily be attributed to rainfall. The high permeability of the landslide was attributed to the loose materials present on the slope. Moreover, the gentle gradient of the leading part of the landslide promoted significant infiltration of rainfall into the slope. As the underlying bedrock was impermeable, the infiltrated water accumulated in the zone between the sliding mass and the bedrock. Scanning-electron-microscope images of the sliding zone materials revealed the presence of montmorillonite, which exhibited a softening effect upon contact with water (Zhou et al., 2016). Furthermore, the sliding zone materials exhibited numerous microfissures and microporosity, resulting in their swelling with the absorption of water and shrinkage with the loss of water. These factors can contribute to the reduction in the strength of the landslide (Iqbal et al., 2018).
From October 2008 onwards, the reservoir level displayed periodic fluctuations ranging from 145 m to 175 m, leading to partial submergence of the landslide area in water. The landslide deformed severely in the periods of reservoir impoundment and became more uniform with reservoir lowering according to monitored data. The presence of reservoir water can exert a positive pressure on the slope, which can contribute to landslide stability. However, the groundwater level in the frontal area of the landslide exhibited an increase in response to the rising water level in the reservoir. This groundwater influx had two significant effects on the landslide behavior. Firstly, the buoyancy effect of the groundwater resulted in a reduction in the sliding resistance force of the slope. Secondly, the infiltration of reservoir water into the sliding zone materials can induce its strength. These factors can collectively contribute to the severe deformation observed in the landslide during reservoir impoundment (Luo et al., 2022; Zhou et al., 2022).
6 Discussion and conclusions
A professional monitoring system including measurements of groundwater level, surface and deep displacements, and cracks width, was implemented on the Sanzhouxi landslide. The monitoring data and abundant field observations were used for analyzing in detail the deformation characteristics of the landslide. Triggering factors controlling the Sanzhouxi landslide were identified by using a data mining method-GRA. Subsequently, the 2D GeoStudio software was employed to calculate the variation in slope stability, represented by the factor of safety, in response to the combined effects of fluctuating reservoir water levels and rainfall over a complete annual cycle. The primary findings of this research can be summarized as follows:
Varied parts of the Sanzhouxi landslide exhibit distinct deformation characteristics, with the most significant movement observed in the frontal region. According to deformation types classified by displacement versus time curves, the front part of the landslide showed a stepwise deformation pattern, while other parts displayed a convergent pattern. In addition to the variability of deformation in the longitudinal direction, the variability of deformation also existed in the horizontal. This landslide was shown to have strong and diverse characteristics of spatiotemporal variability.
The front part of the Sanzhouxi landslide was found to be primarily influenced by the reservoir water level rising, as indicated by the results of the GRA analysis. However, it was observed that this effect gradually diminished as the landslide adapted to the increasing water level in the reservoir. The identification of the dominant triggering factor provides useful information to take into consideration when targeting disaster prevention and mitigation measures.
The FS under the combined effect of dam reservoir changing and rainfall, computed for each day during one entire year, was quite low (FS = 1.07). This phenomenon of FS decreasing occurred mainly during high water level periods. With the effect of rainfall alone, the annual maximum reduction of FS for the Sanzhouxi landslide was only about 2%, which verified the identification of reservoir level as a triggering factor by GRA. The method of examining the factor of safety on each day over one year illustrates clearly how slope stability evolves in response to changes in external factors.
The interpretation of the landslide considered abundant information and adopted multiple approaches. The process involves deformation characteristics, triggering factor identification, and annual slope stability. The process adopted herein can be implemented for real-time or nearly real-time prediction for stepwise landslides and can form a promising basis for further risk evaluations. This research has potential applications for the risk assessment of landslides in similar geological settings, with large monitoring datasets available over several years.
Data availability statement
The original contributions presented in the study are included in the article/Supplementary Material. Further inquiries can be directed to the corresponding author.
Author contributions
BY and LW: conceptualization. LW and TX: data curation. BY and SL: formal analysis and methodology. BY: funding acquisition. BY and TX: Investigation. BY, ZL, and LW: writing – original draft preparation. BY, ZL, and SL: writing – review & editing. All authors have read and agreed to the published version of the manuscript.
Funding
This research was supported by The Natural Science Foundation of Shandong Province (No. ZR2021QD032).
Acknowledgments
The first author wishes to thank the China Scholarship Council (CSC) and the Norwegian Geotechnical Institute (NGI) for funding her research period at NGI.
Conflict of interest
The authors declare that the research was conducted in the absence of any commercial or financial relationships that could be construed as a potential conflict of interest.
Publisher’s note
All claims expressed in this article are solely those of the authors and do not necessarily represent those of their affiliated organizations, or those of the publisher, the editors and the reviewers. Any product that may be evaluated in this article, or claim that may be made by its manufacturer, is not guaranteed or endorsed by the publisher.
References
AGU. (2017) The human cost of landslide in 2016, the Landslide Blog American Geophysical Union (AGU). Available at: http://blogs.agu.org/landslideblog/.
Asch T., Buma J., Beek L. (1999). A view on some hydrological triggering systems in landslides. Geomorphology 30 (1-2), 25–32. doi: 10.1016/S0169-555X(99)00042-2
Chae B. G., Park H. J., Catani F., Simoni A., Berti M. (2017). Landslide prediction, monitoring and early warning: a concise review of state-of-the-art. Geosci J. 21, 1033–1070. doi: 10.1007/s12303-017-0034-4
Cho S. E. (2017). Prediction of shallow landslide by surficial stability analysis considering rainfall infiltration. Eng. Geol 231 (14), 126–138. doi: 10.1016/j.enggeo.2017.10.018
Cojean R., Caï Y. J. (2011). Analysis and modeling of slope stability in the Three-Gorges Dam reservoir (China) -The case of Huangtupo landslide. J. Mt. Sci. 8, 166–175. doi: 10.1007/s11629-011-2100-0
Crosta G. B., Imposimato S., Roddeman D. (2016). Landslide spreading, impulse water waves and modelling of the Vajont rockslide. Rock Mech. Rock Eng. 49, 2413–2436. doi: 10.1007/s00603-015-0769-z
Dahim M., Alqadhi S., Mallick J. (2023). Enhancing landslide management with hyper-tuned machine learning and deep learning models: Predicting susceptibility and analyzing sensitivity and uncertainty. Front. Ecol. Evol. 11. doi: 10.3389/fevo.2023.1108924
Guo Z. Z., Chen L. X., Gui L., Du J., Yin K. L., Do H. M. (2020). Landslide displacement prediction based on variational mode de-composition and WA-GWO-BP model. Landslides 17, 567–583. doi: 10.1007/s10346-019-01314-4
Gutiérrez F., Lucha P., Galve J. (2010). Reconstructing the geochronological evolution of large landslides by means of the trenching technique in the Yesa Reservoir (Spanish Pyrenees). Geomorphology 124, 124–136. doi: 10.1016/j.geomorph.2010.04.015
Hu X. L., Wu S. S., Zhang G. C., Zheng W. B., Liu C., He C. C., et al. (2021). Landslide displacement prediction using kinematics-based random forests method: A case study in Jinping Reservoir Area, China. Eng. Geol 283, 105975. doi: 10.1016/j.enggeo.2020.105975
Huang X. H., Guo F., Deng M. L., Yi W., Huang H. F. (2020). Understanding the deformation mechanism and threshold reservoir level of the floating weight-reducing landslide in the Three Gorges Reservoir Area, China. Landslides 17 (12), 2879–2894. doi: 10.1007/s10346-020-01435-1
Huang F. M., Tao S. Y., Chang Z. L., Huang J. S., Fan X. M., Jiang S. H., et al. (2021). Efficient and automatic extraction of slope units based on multi-scale segmentation method for landslide assessments. Landslides 18, 3715–3731. doi: 10.1007/s10346-021-01756-9
Iqbal J., Dai F., Hong M., Tu X. B., Xie Q. Z. (2018). Failure mechanism and stability analysis of an active landslide in the Xiangjiaba Reservoir Area, Southwest China. J. Earth Sci. 29, 646–661. doi: 10.1007/s12583-017-0753-5
Jaboyedoff M., Carrea D., Derron M.-H., Oppikofer T., Penna I. M., Rudaz B. (2020). A review of methods used to estimate initial landslide failure surface depths and volumes. Eng. Geol. 267, 105478. doi: 10.1016/j.enggeo.2020.105478
Kumar N., Verma A. K., Sardana S., Singh T. N. (2018). Comparative analysis of limit equilibrium and numerical methods for prediction of a landslide. Bull. Eng. Geol Environ. 77, 595–608. doi: 10.1007/s10064-017-1183-4
Lian C., Zeng Z., Tang H. M. (2014). Ensemble of extreme learning machine for landslide displacement prediction based on time series analysis. Neural Comput. Applic 24, 99–107. doi: 10.1007/s00521-013-1446-3
Liu Z. Q., Guo D., Lacasse S., Li J., Yang B. B., Choi J. (2020). Algorithms for intelligent prediction of landslide displacements. J. Zhejiang Univ Sci. A 21, 412–429. doi: 10.1631/jzus.A2000005
Luo S. L., Huang D. (2020). Deformation characteristics and reactivation mechanisms of the Outang ancient landslide in the Three Gorges Reservoir, China. Bull. Eng. Geol Environ. 79, 3943–3958. doi: 10.1007/s10064-020-01838-3
Luo S. L., Huang D., Peng J. B., Tomas R. (2022). Influence of permeability on the stability of dual-structure landslide with different deposit-bedding interface morphology: The case of the three Gorges Reservoir area, China. Eng. Geol 296, 106480. doi: 10.1016/j.enggeo.2021.106480
Ma J. W., Tang H. M., Liu X., Wen T., Zhang J. R., Tan Q. W., et al. (2018). Probabilistic forecasting of landslide displacement accounting for epistemic uncertainty: a case study in the three Gorges Reservoir area, China. Landslides 15 (6), 1145–1153. doi: 10.1007/s10346-017-0941-5
Marjanovi´c M., Krautblatter M., Abolmasov B., Đuri´c U., Sandi´c C., Nikoli´c V. (2018). The rainfall-induced landsliding in Western Serbia: a temporal prediction approach using decision tree technique. Eng. Geol. 232, 147–159. doi: 10.1016/j.enggeo.2017.11.021
Miao F. S., Wu Y. P., Li L. W., Liao K., Xue Y. (2021). Triggering factors and threshold analysis of baishuihe landslide based on the data mining methods. Nat. hazards 105 (3), 2677–2696. doi: 10.1007/s11069-020-04419-5
Miao F. S., Wu Y. P., Xie Y. H., Yu F., Peng L. J. (2017). Research on progressive failure process of Baishuihe landslide based on Monte Carlo model. Stoch Environ. Res. Risk Assess. 31, 1683–1696. doi: 10.1007/s00477-016-1224-8
Miao F. S., Zhao F. C., Wu Y. P., Li L. W., Xue Y., Meng J. J. (2022). A novel seepage device and ring-shear test on slip zone soils of landslide in the Three Gorges Reservoir Area. Eng. Geol 307, 106779. doi: 10.1016/j.enggeo.2022.106779
Mirus B., Jones E., Baum R. L., Godt J. W., Slaughter S., Crawford M. M., et al. (2020). Landslides across the USA: occurrence, susceptibility, and data limitations. Landslides 17 (10), 2271–2285. doi: 10.1007/s10346-020-01424-4
Morgenstern N., Price V. E. (1965). The analysis of the stability of general slip surfaces. Geotechnique 15 (1), 79–93. doi: 10.1680/geot.1965.15.1.79
Naemitabar M., Zanganehm A. M. (2021). Landslide zonation and assessment of Farizi watershed in northeastern Iran using data mining techniques. Nat. Hazards 108, 2423–2453. doi: 10.1007/s11069-021-04805-7
Saito M. (1965). “Forecasting the time of occurrence of a slope failure,” in Proceedings of the 6th International Mechanics and Foundation Engineering. Pergamon Press, Oxford, Montreal, Quebec 537–541.
Segoni S., Piciullo L., Gariano S. L. (2018). A review of the recent literature on rainfall thresholds for landslide occurrence. Landslides 15, 1483–1501. doi: 10.1007/s10346-018-0966-4
Song K., Wang F. W., Yi Q. L., Lu S. Q. (2018). Landslide deformation behavior influenced by water level fluctuations of the Three Gorges Reservoir (China). Eng. Geol 247, 58–68. doi: 10.1016/j.enggeo.2018.10.020
Strauhal T., Loew S., Holzmann M., Zangerl C. (2016). Detailed hydrogeological analysis of a deep-seated rockslide at the Gepatsch reservoir (Klasgarten, Austria). Hydrogeol. J. 24 (2), 349–371. doi: 10.1007/s10040-015-1341-3
Tartaglia M., Pirone M., Urciuoli G. (2023). A data-driven approach to assess the role of the groundwater conditions in triggering shallow landslides initiating with frictional failure. Landslides 20, 1497–1517. doi: 10.1007/s10346-023-02049-z
Wang H. B., Sun Y. H., Tan Y. Z., Sui T., Sun G. H. (2019). Deformation characteristics and stability evolution behavior of Woshaxi landslide during the initial impoundment period of the Three Gorges reservoir. Environ. Earth Sci. 78 (20), 1–14. doi: 10.1007/s12665-019-8592-6
Wang L. Q., Xiao T., Liu S. L., Zhang W. G., Yang B. B., Chen L. C. (2023). Quantification of model uncertainty and variability for landslide displacement prediction based on Monte Carlo simulation. Gondwana Res. doi: 10.1016/j.gr.2023.03.006
Wang F. W., Zhang Y. M., Huo Z. T., Matsumoto T., Huang B. L. (2004). The July 14, 2003 Qianjiangping landslide, Three Gorges Reservoir, China. Landslides 1, 157–162. doi: 10.1007/s10346-004-0020-6
Wang F. W., Zhang Y. M., Huo Z. T., Peng X. M., Araiba K., Wang G. H. (2008). Movement of the Shuping landslide in the first four years after the initial impoundment of the Three Gorges Dam Reservoir, China. Landslides 5, 321–329. doi: 10.1007/s10346-008-0128-1
Wu J. J., Li C. D., Liu Q. T., Fan F. S. (2017). Optimal isosceles trapezoid cross section of laterally loaded piles based on friction soil arching. KSCE J. Civ Eng. 21, 2655–2664. doi: 10.1007/s12205-017-1311-5
Wu Q., Tang H. M., Ma X. H., Wu Y. P., Hu X. L., Wang L. Q., et al. (2019). Identification of movement characteristics and causal factors of the Shuping landslide based on monitored displacements. Bull. Eng. Geol Environ. 78, 2093–2106. doi: 10.1007/s10064-018-1237-2
Xu G., Li W., Yu Z., Ma X. H., Yu Z. Z. (2015). The 2 September 2014 Shanshucao landslide, Three Gorges Reservoir, China. Landslides 12, 1169–1178. doi: 10.1007/s10346-015-0652-8
Yan Y., Tang H., Hu K. H., Turowski J. M., Wei F. Q. (2023). Deriving debris-flow dynamics from real-time impact-force measurements. J. Geophysical Research: Earth Surface 128 (3), e2022JF006715.e. doi: 10.1029/2022JF006715
Yang H. Q., Song K. L., Chen L. C., Qu L. L. (2023). Hysteresis effect and seasonal step-like creep deformation of the Jiuxianping landslide in the Three Gorges Reservoir region. Eng. Geol. 317, 107089. doi: 10.1016/j.enggeo.2023.107089
Yang B. B., Xiao T., Wang L. Q., Huang W. (2022). Using complementary ensemble empirical mode decomposition and gated recurrent unit to predict landslide displacements in dam reservoir. Sensors 22, 1320. doi: 10.3390/s22041320
Yang B. B., Yin K. L., Lacasse S., Liu Z. Q. (2019). Time series analysis and long short-term memory neural network to predict landslide displacement. Landslides. 16 (4), 677–694. doi: 10.1007/s10346-018-01127-x
Yang B. B., Yin K. L., Xiao T., Chen L. X., Du J. (2017). Annual variation of landslide stability under the effect of water level fluctuation and rainfall in the Three Gorges Reservoir, China. Environ. Earth Sci. 76, 564–580. doi: 10.1007/s12665-017-6898-9
Yao W. M., Li C. D., Zuo Q. J., Zhan H. B., Criss R. E. (2019). Spatiotemporal deformation characteristics and triggering factors of Baijiabao landslide in Three Gorges Reservoir region, China. Geomorphology 343, 34–47. doi: 10.1016/j.geomorph.2019.06.024
Zhang L., Zhu H., Han H., Shi B. (2023a). Fiber optic monitoring of an anti-slide pile in a retrogressive landslide. J. Rock Mechanics Geotechnical Eng 20, 1583–1597. doi: 10.1016/j.jrmge.2023.02.011
Zhang L., Cui Y., Zhu H., Wu H., Han H., Yan Y., et al. (2023b). Shear deformation calculation of landslide using distributed strain sensing technology considering the coupling effect. Landslides. doi: 10.1007/s10346-023-02051-5
Zhang C. Y., Yin Y. P., Yan H., Li H. X., Dai Z. W., Zhang N. (2021). Reactivation characteristics and hydrological inducing factors of a massive ancient landslide in the three Gorges Reservoir, China. Eng. Geol 292, 106273. doi: 10.1016/j.enggeo.2021.106273
Zhang Y. G., Zhang Z., Xue S., Wang R. J., Xiao M. (2020). Stability analysis of a typical landslide mass in the three Gorges Reservoir under varying reservoir water levels. Environ. Earth Sci. 79 (1), 42. doi: 10.1007/s12665-019-8779-x
Zhou C., Cao Y., Yin K. L., Emanuele I., Catani F., Wu L. X. (2022). Characteristic comparison of seepage-driven and buoyancy-driven landslides in Three Gorges Reservoir area, China. Eng. Geol 301, 106590. doi: 10.1016/j.enggeo.2022.106590
Zhou C., Yin K. L., Cao Y., Ahmed B., Li Y. Y., Catani F., et al. (2018). Landslide susceptibility modeling applying machine learning methods: A case study from Longju in the Three Gorges Reservoir area, China. Comput. Geosci 112, 23–37. doi: 10.1016/j.cageo.2017.11.019
Keywords: landslide deformation, triggers identification, stability evolution, grey relation analysis, monitoring data
Citation: Yang B, Liu Z, Lacasse S, Wang L and Xiao T (2023) Deformation triggers and stability evolution of landslide from multiple observations. Front. Ecol. Evol. 11:1242093. doi: 10.3389/fevo.2023.1242093
Received: 18 June 2023; Accepted: 31 July 2023;
Published: 15 August 2023.
Edited by:
Faming Huang, Nanchang University, ChinaReviewed by:
Lei Zhang, China University of Geosciences, ChinaZhilu Chang, Nanchang University, China
Weiwei Zhan, The University of Texas at Austin, United States
Copyright © 2023 Yang, Liu, Lacasse, Wang and Xiao. This is an open-access article distributed under the terms of the Creative Commons Attribution License (CC BY). The use, distribution or reproduction in other forums is permitted, provided the original author(s) and the copyright owner(s) are credited and that the original publication in this journal is cited, in accordance with accepted academic practice. No use, distribution or reproduction is permitted which does not comply with these terms.
*Correspondence: Luqi Wang, d2xxOTNAY3F1LmVkdS5jbg==
 Beibei Yang
 Zhongqiang Liu
 Suzanne Lacasse2
 Luqi Wang