Abstract
Introduction:
Euchelicerata is a diverse group encompassing Xiphosura, Chasmataspidida, Eurypterida, and Arachnida. Xiphosura represents an extant group with a rich fossil record dating back to the Ordovician period. Xiphosurans are often referred to as “living fossils” due to their seemingly unchanged morphology over millions of years. Numerous studies have contributed to the understanding of xiphosuran development, revealing changes in the timing and rate of their growth. These changes have been mainly associated with the freshwater invasion of early xiphosuran forms. However, limited research has been conducted to compare the developmental patterns of xiphosurans with other euchelicerates inhabiting aquatic environments.
Methods:
This study compares the developmental patterns of xiphosurans with that of the fossil clades of eurypterids and chasmataspidids. By incorporating environmental and phylogenetic information within ancestral state reconstruction analyses, and then testing different evolutionary scenarios, the influence of the environment on the evolution of developmental patterns of euchelicerates is examined.
Results:
The results confirm that the developmental changes in Xiphosura throughout their evolutionary history are correlated with the exploitation of different environments. However, the inclusion of eurypterids and chasmataspidids indicates that the entirety of changes seen for Xiphosura represent only a small portion of the total variability recovered for euchelicerates.
Discussion:
Our results emphasize the importance of considering phylogenetic relationships and outgroup comparisons to understand the evolutionary dynamics of Xiphosura.
Introduction
Euchelicerata is a successful clade of arthropods including Xiphosura, Chasmataspidida, Eurypterida, and Arachnida. Xiphosura is a group with extant representatives, which has an extensive fossil record dating back to the Ordovician (Rudkin et al., 2008; van Roy et al., 2015; Lamsdell et al., 2023). The earliest described xiphosuran fossil remains come from the Williams member of the Stone Mountain formation of Manitoba, Canada which dates to the latest Ordovician at c. 443Ma (Rudkin et al., 2008), but recent fossil discoveries suggest they first evolved in the early Ordovician (van Roy et al., 2015). Molecular clock estimates suggest a late Cambrian origin for the group (Lozano-Fernandez et al., 2020). Representatives of Xiphosura have long been referred to as “living fossils” (Stoermer, 1952) with major morphological traits seemingly unaltered by the ravages of time over hundreds of millions of years. Even recently, they have been cited as an example of extreme morphological conservatism (Bicknell and Pates, 2020). The term “living fossils” is somewhat problematic as the subtext of the term implies a lack of evolution taking place in the group, whereas it is well established that broad-scale evolutionary stasis results from gradual evolutionary changes around a relatively static morphological average position through time (Simpson, 1944; Eldredge et al., 2005; Tëmkin and Eldredge, 2015) (Figure 1). While a certain degree of morphological conservatism is recognized in Xiphosura (Bennett et al., 2018), especially in late Mesozoic and Cenozoic forms (Avise et al., 1994; Rudkin and Young, 2009; Kin and Błażejowski, 2014; Lamsdell and McKenzie, 2015; Bicknell et al., 2019b), most late Paleozoic and early Mesozoic forms are considered to go through a much more pronounced evolutionary exploration of morphological space (Lamsdell, 2016; Bicknell, 2019; Bicknell et al., 2019a; Bicknell et al., 2020; Lamsdell, 2021a; Lamsdell, 2021b; Lustri et al., 2021; Bicknell et al., 2022). Freshwater colonization during the late Paleozoic resulted in xiphosurans adapting to many new habitats, possibly on multiple occasions, and is associated with the first record of remarkable radiation of the group in the fossil record (Lamsdell, 2016; Lamsdell, 2021a; Bicknell et al., 2022).
Figure 1
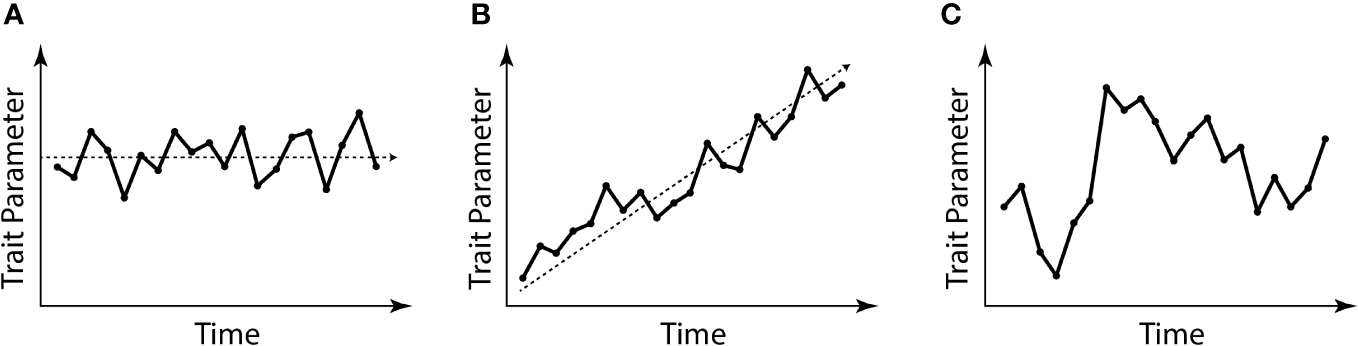
Graphical explanation of the evolutionary stasis often attributed to Xiphosurida. (A) Example of stationary morphological evolution around a middle trait parameter; (B) example of morphological evolution with a trait parameter diverging through time; (C) example of a “random walk”. Edited from Tëmkin and Eldredge (2015).
Heterochrony has been proposed as the main pattern to described the freshwater invasion of early xiphosuran forms (Lamsdell, 2021a; Lamsdell, 2021b). To understand these developmental patterns the following Paleozoic taxa are key: Alanops magnifica (Racheboeuf et al., 2002) and the Euproops complex, including the species nicknamed “Piesproops” (more formally Andersoniella sp.) (Lamsdell, 2020), Euproops danae and Euproops rotundatus (Haug et al., 2012; Haug and Rötzer, 2018b; Tashman et al., 2019; Haug and Haug, 2020). Insights provided by these taxa, alongside studies of the development of extant species (Scholl, 1977; Jegla and Costlow, 1982; Sekiguchi et al., 1988; Shuster and Sekiguchi, 2003; Haug and Rötzer, 2018a), has allowed the recognition of peramorphic and paedomorphic patterns in two of the four main clades of Xiphosura, Austrolimulidae and Belinuridae (Bicknell, 2019; Lamsdell, 2021a; Bicknell et al., 2021b; Lustri et al., 2021). Those studies critically enhanced our understanding of evolution and development, but less has been done to compare the developmental patterns of xiphosurans with other euchelicerates inhabiting the same aquatic realm.
Arthropods are generally characterized by an extreme specialization of their different life stages (Minelli et al., 2016). However, this is usually not the case for euchelicerates including xiphosurans (Haug and Rötzer, 2018a; Kaiser and Schoppe, 2018). Euchelicerates are characterized by a gradual, direct and usually epimorphic development, where there is no addition of segments after hatching (Sekiguchi et al., 1988; Braddy, 2001; Lamsdell and Selden, 2013; Haug, 2019; Lamsdell et al., 2019; Fusco and Minelli, 2021).
In order to provide a phylogenetic context to the study of xiphosuran development, it is essential to compare them with other euchelicerate groups. Modeling of evolutionary scenarios needs to account for the phylogenetic relationships between organisms as this is the only independent way to estimate rates of evolution (Garamszegi, 2014). “Stasis is generally defined as little or no net accrued species-wide morphological change during a species-lineage’s existence up to millions of years” (Eldredge et al., 2005, p. 133), yet, it is important to define what exactly “little or no” means (Eldredge et al., 2005). The only way to do so is to compare xiphosurans with other, related groups inhabiting the same environment. It is certainly very clear that the time scale matters here as what may appear to be static over millions of years may disguise a great deal of change around a mean when viewed at higher temporal resolution. Conversely, stasis at high temporal resolution may miss larger and gradual temporal trends only observable when a longer view is taken. To understand the evolutionary dynamics of any lineage, a diversity of temporal views must be taken and then contrasted to related lineages.
The inclusion of other euchelicerate groups such as eurypterids and chasmataspidids in the analyses helps to refine not only the estimation of developmental parameters at the root of Xiphosura but also the possible correlations of different evolutionary scenarios with the paleoenvironment independently from the phylogeny. Eurypterids and chasmataspidids shared similar environments with the horseshoe crabs during the Paleozoic (Dunlop, 2010; Howard et al., 2020). The development of xiphosurans has been recently explored by meta-analyses (Lamsdell, 2016; Lamsdell, 2021a; Bicknell et al., 2022), but the development of eurypterids and chasmataspidids has never been incorporated in such analyses. Data for eurypterids and chasmataspidids are also available, and research has focused on fine detailed analyses of the development of single species such as Hoplitaspis hiawathai (Lamsdell et al., 2019) and Eurypterus lacustris (Ruebenstahl et al., 2021).
In this work, a meta-analysis is presented of morphometric developmental data from eight species of Xiphosura, combined with data from one species of Eurypterida and one species of Chasmataspidida. These data have been utilized alongside environmental and phylogenetic information to perform an ancestral state reconstruction analysis for the allometric growth patterns and environment of Xiphosura. The influence of different environments on the evolution of development are then tested within a phylogenetic framework.
Materials and methods
Studied specimens
The specimens used in this study belong to eight different species of Xiphosura, including two extant and six extinct taxa, together with two outgroups consisting of one species of Eurypterida and one species of Chasmataspidida (Figure 2). Morphometric developmental data, summarized by the slope of the linear regression for the prosomal shield (carapace) width and length through their ontogeny, has been collected for each taxon (Figure 3). The raw measurement of 171 specimens of Eurypterus lacustris (Eurypterida), hosted at Yale Peabody Museum of Natural History, New Haven, USA (YPM IP) were taken from Ruebenstahl et al. (2021). The raw measurement for the prosomal shield of 18 specimens of Hoplitaspis hiawathai (Chasmataspidida), hosted at University of Wisconsin Geology Museum, Wisconsin, USA (UWGM) were taken from Lamsdell et al. (2019). Four specimens of Hoplitaspis hiawathai have been excluded as they are preserved in lateral view, leaving 14 specimens to include in the analyses. The raw measurements of 10 specimens of Paleolimulus kunguricus, curated at the Paleontological Museum of the Perm State University, Perm, Russia (PSU) and the Geological Institute of the Russian Academy of Sciences, Moscow, Russia (GIN), were personally communicated to the authors by R.D.C. Bicknell. The 18 specimens used for Prolimulus woodwardi are all figured in Lustri et al. (2021). For Euproops sp., raw measurements were collected from photographs taken by C. Haug from 15 specimens curated at Yale Peabody Museum of Natural History, New Haven, USA (YPM IP). None of the fossil specimens measured showed or has been reported to show evidence of deformation. Data for Limulus polyphemus were collected from a single ontogenetic series of 15 stages from hatch to the 14th moult (Lamsdell, 2021a) (Figures 3C, D). Fossil measurements were collected from photographs of the specimens using ImageJ and the program tpsDig2 2.31. Raw data are available in Table 1.
Figure 2
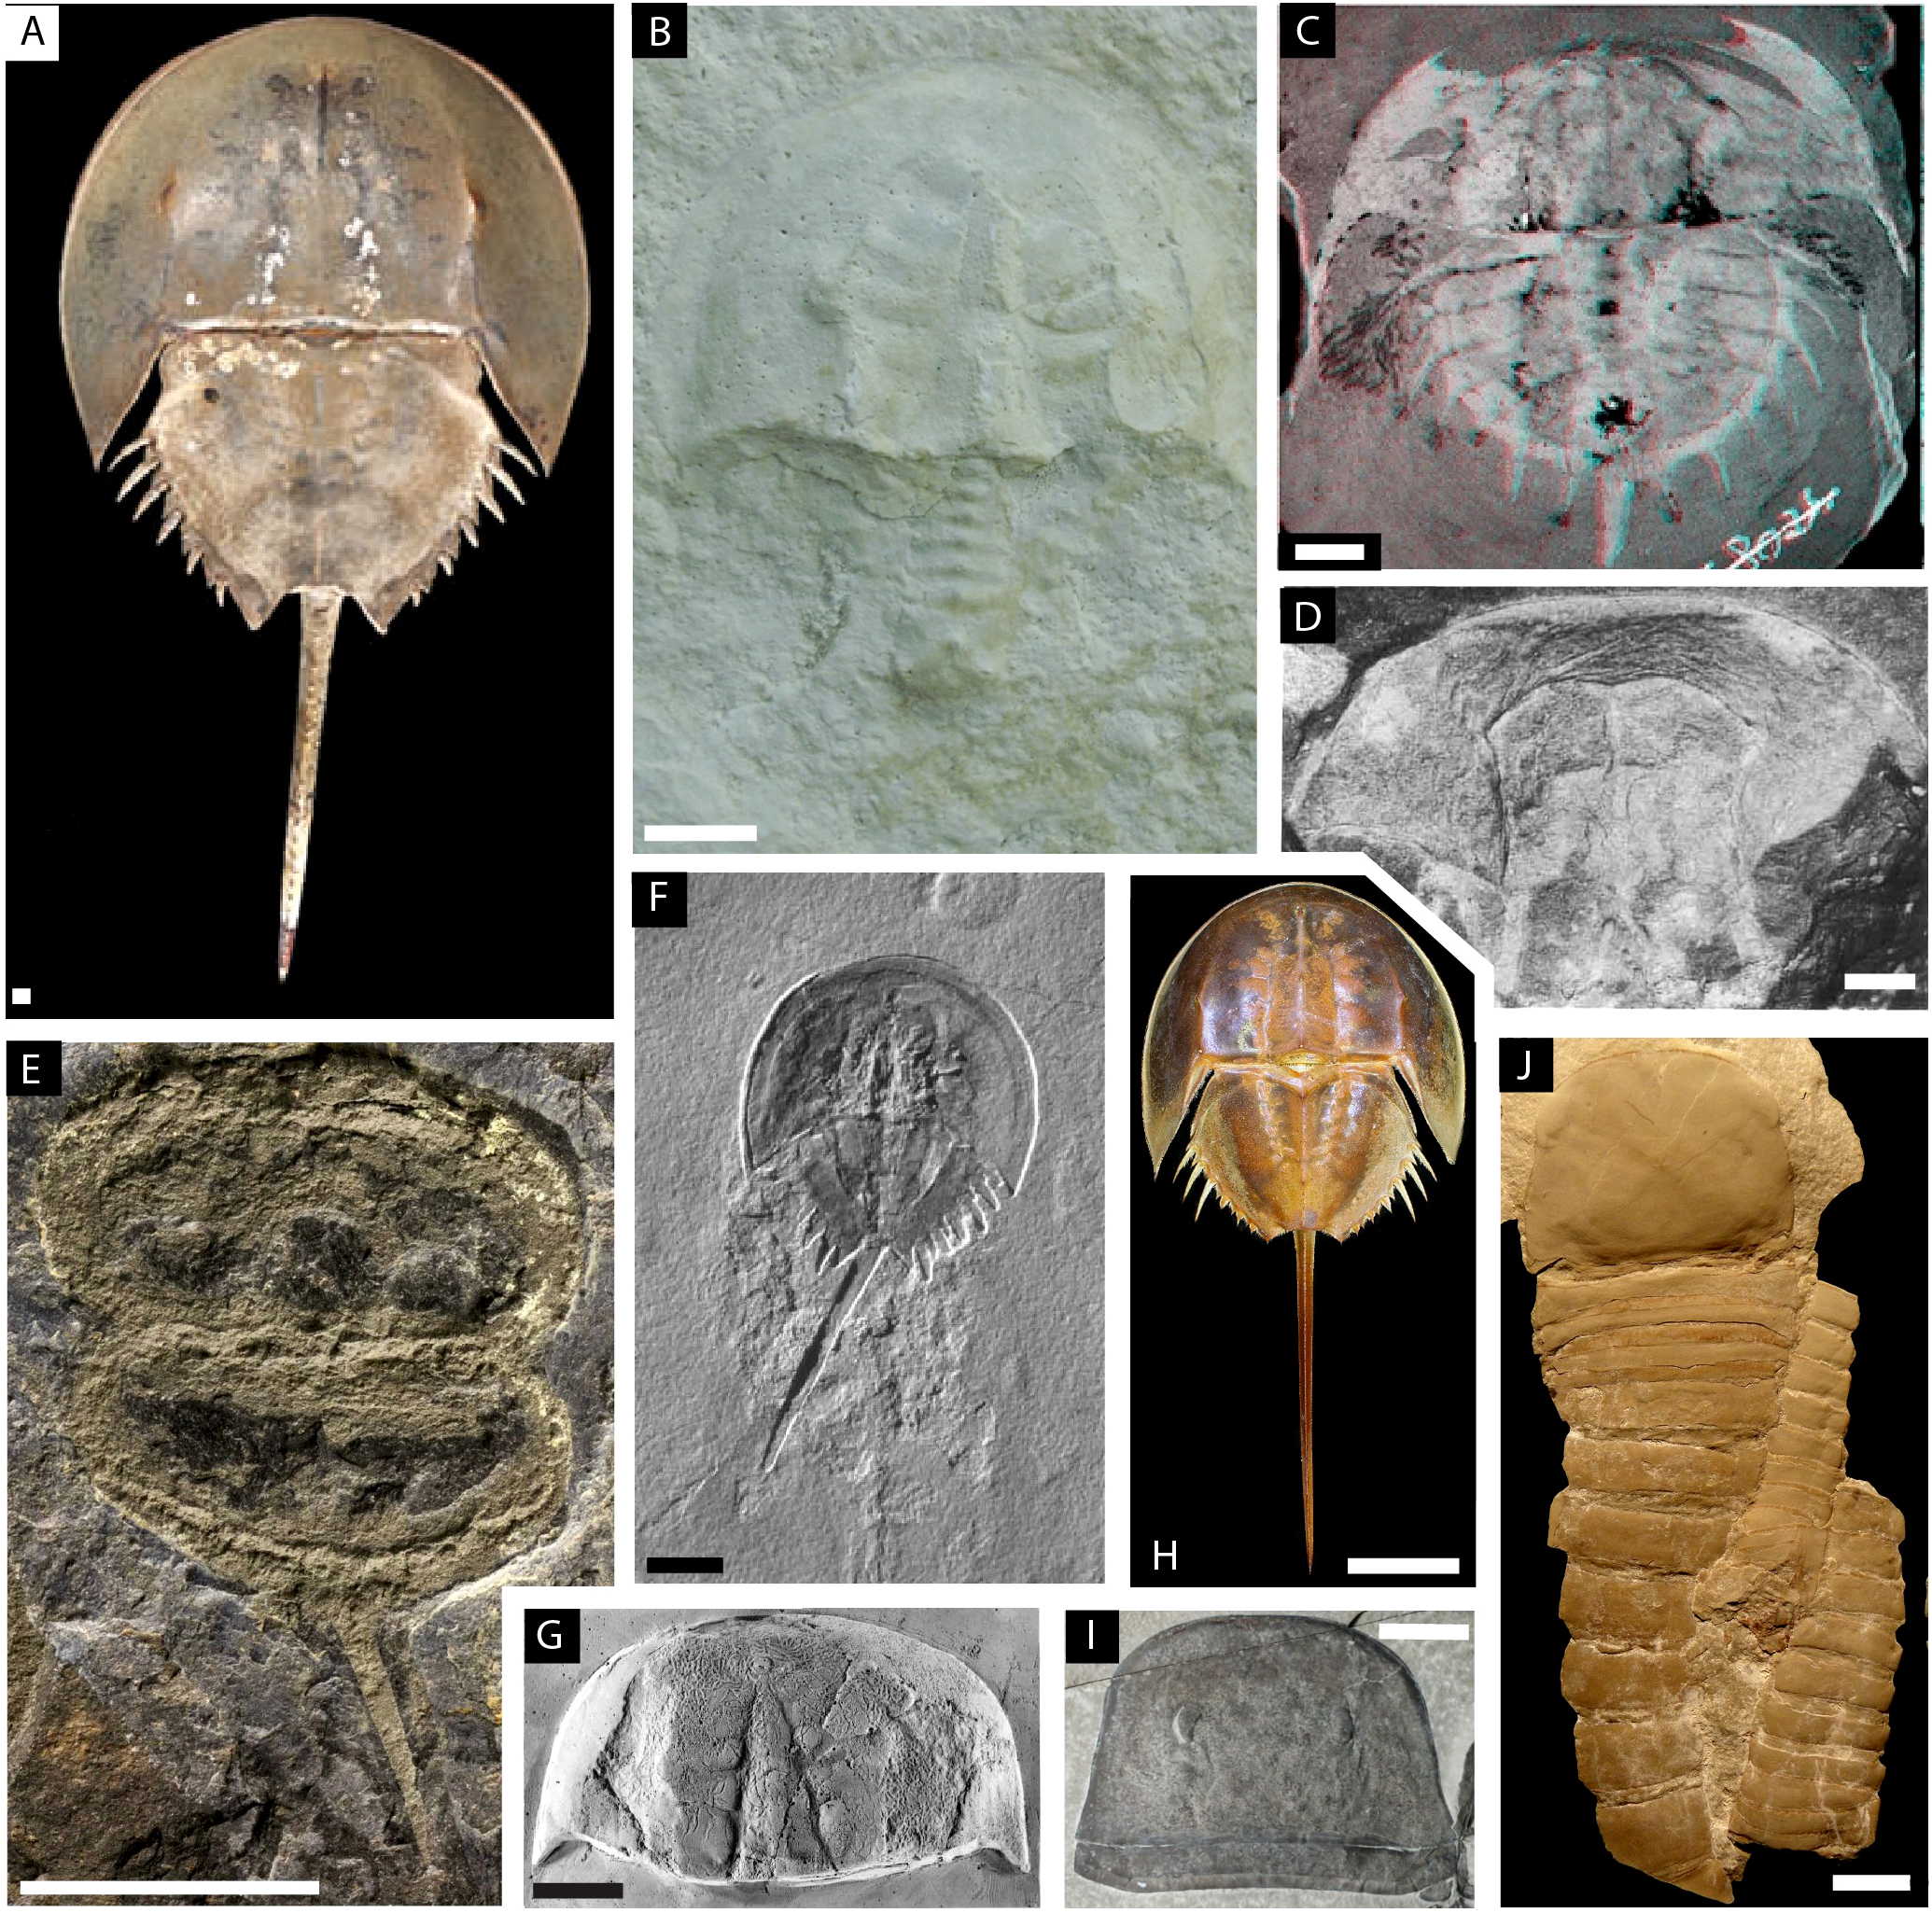
Illustration plate of the euchelicerates species used in the study with focus on showing the prosomal shield (carapace). (A–H) Xiphosurans. (A)Limulus polyphemus modified from Lamsdell (2021a). (B)Paleolimulus kunguricus modified from Naugolnykh and Bicknell (2022). (C)Euproops danae, stereo image, modified from Haug and Rötzer (2018b). (D)Euproops sp modified from Schultka (2000). (E)Prolimulus woodwardi modified from Lustri et al. (2021). (F)Mesolimulus walchi modified from Briggs et al. (2005). (G)Paleolimulus signatus modified from Babcock et al. (2000). (H)Tachypleus tridentatus modified from Bicknell et al. (2021a). (I) The eurypterid Eurypterus lacustris modified from Ruebenstahl et al. (2021). (J) The chasmataspidid Hoplitaspis hiawathai modified from Lamsdell et al. (2019). Scale bars represent 1 mm in (A); 5 mm in (C); 10 mm in (B, D, E, G, J); 20 mm in (F, I); and 40 mm in (H).
Figure 3
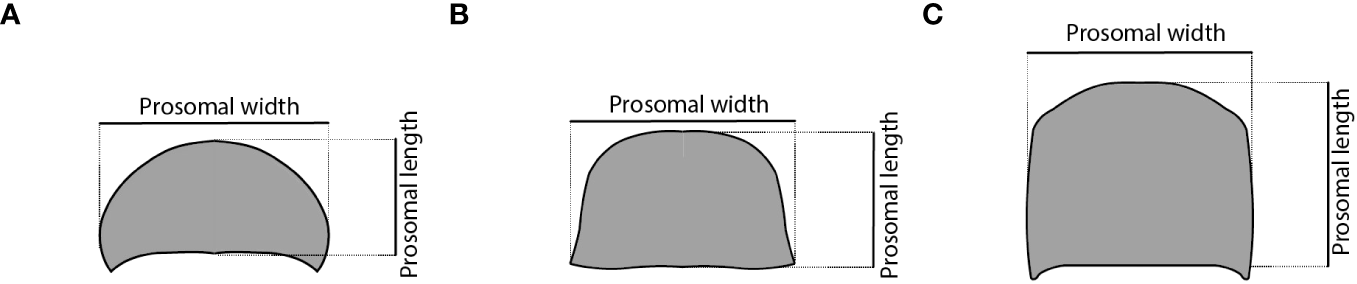
Schemes of different euchelicerate prosomal shield (carapace) shapes showing how the measurements were made. (A) xiphosurid, (B) eurypterid, and (C) chasmataspidid.
Table 1
| Hoplitaspis hiawathai | ||
|---|---|---|
| Measurement credits James Lamsdell | ||
| Specimen no. | Prosomal shield length | Prosomal shield width |
| UWGM_1840B | 13 | 15 |
| UWGM _1863 | 14 | 10 |
| UWGM_1873A | 29 | 37 |
| UWGM_1875 | 23 | 32 |
| UWGM_1877 | 23 | 26 |
| UWGM_1880 | 11 | 12 |
| UWGM_2041 | 15 | 17 |
| UWGM_2044A | 11 | 12 |
| UWGM_2044B | 12 | 13 |
| UWGM_2069B | 18 | 18 |
| UWGM_2268 | 25 | 33 |
| UWGM_2273A | 11 | 17 |
| UWGM_2273D | 13 | 5 |
| UWGM_2279A | 15 | 9 |
| UWGM_2279B | 15 | 18 |
| UWGM_2279C | 15 | 16 |
| UWGM_2700 | 21 | 24 |
| Limulus polyphemus | ||
| Photo credits James Lamsdell | ||
| Stage | Prosomal shield length | Prosomal shield width |
| Hatch | 2 | 4.4 |
| 1th | 2.2 | 4.8 |
| 2nd | 2.2 | 4.1 |
| 3rd | 2.8 | 4.1 |
| 4th | 3 | 5.2 |
| 5th | 3.3 | 5.9 |
| 6th | 3.9 | 7.8 |
| 7th | 4.4 | 7.8 |
| 8th | 5.1 | 8.6 |
| 9th | 4.4 | 8.8 |
| 10th | 5.1 | 10.1 |
| 11th | 7 | 10.7 |
| 12th | 8.2 | 14.2 |
| 13th | 8.1 | 16.3 |
| 14th | 31 | 52.4 |
| Paleolimulus kunguricus | ||
| Photo credits Russell Bicknell | ||
| Specimen no. | Prosomal shield length | Prosomal shield width |
| PSU | 36.8 | 65.3 |
| GIN PH_9 | 69 | 106 |
| GIN PH_11 | - | - |
| GIN PH_12 | - | - |
| GIN PH_18 | 27.2 | 44.68 |
| GIN PH_19 | - | - |
| GIN PH_22 | 60.5 | 88.9 |
| GIN PH_31 | 3.27 | 4.36 |
| GIN PH_32 | 9.14 | 10.8 |
| GIN PH_37 | 71.4 | 95 |
| Prolimulus woodwardi | ||
| Photo credits Russell Bicknell | ||
| Specimen no. | Prosomal shield length | Prosomal shield width |
| NMM1031 | 11.9 | 20 |
| NMMe146 | 8.5 | 11.5 |
| NMMe39 | 7.5 | 10.5 |
| NMMe142 | 6.8 | 12.6 |
| NMMe145 | 8 | 13.3 |
| NMM1038 | 10.8 | 19 |
| NMM1045 | 7.5 | 11.6 |
| NMMe141 | 11 | 19.4 |
| NMMe109 | 5.9 | 10.3 |
| NMMe139 | 15 | 20 |
| NMMe143 | 6.7 | 10 |
| NMMe140 | 9 | 15.3 |
| NMMe144 | 6.5 | 8.8 |
| NMMe138 | 6.9 | 10.4 |
| NHMUKPIIn18588 | 7 | 14 |
| NHMUKPII3395 | 10 | 15.1 |
| MCZ109537 | 8 | 10.8 |
| MBA1989 | 9.9 | 13.9 |
| Euproops sp. (Andersoniella) | ||
| Photo credits Carolin Haug | ||
| Specimen no. | Prosomal shield length | Prosomal shield width |
| YPM_IP_000125 | - | 46.8 |
| YPM_IP_16910 | 17.8 | 43.9 |
| YPM_IP_25590 | 10.4 | 21.4 |
| Euproops sp. (Andersoniella) | ||
| Photo credits Carolin Haug | ||
| Specimen no. | Prosomal shield length | Prosomal shield width |
| YPM_IP_28514 | 16.1 | 39.2 |
| YPM_IP_035153 | - | 44.4 |
| YPM_IP_50519 | 19.9 | 43.2 |
| YPM_IP_50570 | 14.2 | 33.6 |
| YPM_IP_50574 | 9.8 | 22.9 |
| YPM_IP_050644 | 18.1 | 42.5 |
| YPM_IP_50689 | 3.3 | 7.3 |
| YPM_IP_050733 | 6.7 | 15.9 |
| YPM_IP_050735 | - | - |
| YPM_IP_050754 | 16.9 | 38.5 |
| YPM_IP_050835 | - | 25.5 |
| YPM_IP_050935 | 6.7 | 15.7 |
| YPM_IP_168026 | 15.4 | 35.5 |
| YPM_IP_168040 | 7.4 | 15.4 |
| YPM_IP_016909 | 17.6 | 42.9 |
| YPM_IP_50472 | 12 | 21.6 |
| YPM_IP_50502 | - | 36.1 |
| YPM_IP_50687 | - | 17.6 |
| Eurypterus lacustris | ||
| Measurement credits James Lamsdell | ||
| Specimen no. | Prosomal shield length | Prosomal shield width |
| 186707 | 38 | 57 |
| YPM_IP_207952 | 43 | 64 |
| YPM_IP_208085 | 38.5 | 55 |
| YPM_IP_209979 | 35 | 54 |
| YPM_IP_209981 | 24 | 34 |
| YPM_IP_212841 | 23.5 | 34.5 |
| YPM_IP_212842 | 24.5 | 34 |
| YPM_IP_212846 | 36.5 | 56 |
| YPM_IP_212857 | 25.5 | 43 |
| YPM_IP_212860 | 27 | 41.5 |
| YPM_IP_212861 | 32 | 48.5 |
| YPM_IP_212862 | 28 | 37.5 |
| YPM_IP_212863 | 42 | 64.5 |
| YPM_IP_212864 | 18 | 26 |
| YPM_IP_212867 | 26 | 40 |
| YPM_IP_212869 | 35 | 52 |
| Eurypterus lacustris | ||
| Measurement credits James Lamsdell | ||
| Specimen no. | Prosomal shield length | Prosomal shield width |
| YPM_IP_212871 | 27 | 40 |
| YPM_IP_212872 | 26 | 40.5 |
| YPM_IP_212881 | 24 | 34 |
| YPM_IP_212886 | 32.5 | 59 |
| YPM_IP_212893 | 37 | 54.5 |
| YPM_IP_212896 | 23 | 34 |
| YPM_IP_212996 | 38 | 53 |
| YPM_IP_213007 | 38.5 | 42 |
| YPM_IP_213053 | 24 | 38 |
| YPM_IP_213067 | 19.5 | 31 |
| YPM_IP_213204 | 32 | 47 |
| YPM_IP_213539 | 39.2 | 75 |
| YPM_IP_214132 | 27.5 | 40 |
| YPM_IP_216514 | 23.5 | 36 |
| YPM_IP_216518 | 30 | 44.5 |
| YPM_IP_216519 | 24 | 38 |
| YPM_IP_216526 | 22 | 30 |
| YPM_IP_216528 | 37.5 | 51 |
| YPM_IP_216531 | 41 | 61.5 |
| YPM_IP_216534 | 38 | 55 |
| YPM_IP_216537 | 40 | 62.5 |
| YPM_IP_216541 | 29.5 | 41 |
| YPM_IP_216544 | 26 | 40 |
| YPM_IP_216554 | 36.5 | 54 |
| YPM_IP_216555 | 26 | 39.5 |
| YPM_IP_216557 | 35 | 52 |
| YPM_IP_216558 | 34 | 55 |
| YPM_IP_216560 | 37 | 54 |
| YPM_IP_216561 | 36 | 53 |
| YPM_IP_216565 | 27.5 | 40.5 |
| YPM_IP_216566 | 37.5 | 54 |
| YPM_IP_216568 | 33 | 47 |
| YPM_IP_216573 | 37 | 55 |
| YPM_IP_216578 | 20 | 30 |
| YPM_IP_216584 | 37 | 53 |
| YPM_IP_216585 | 29 | 43 |
| YPM_IP_216586 | 29 | 44 |
| Eurypterus lacustris | ||
| Measurement credits James Lamsdell | ||
| Specimen no. | Prosomal shield length | Prosomal shield width |
| YPM_IP_216588 | 22.5 | 35.5 |
| YPM_IP_216595 | 8 | 11.5 |
| YPM_IP_216596 | 7 | 9 |
| YPM_IP_216604 | 31 | 55 |
| YPM_IP_216609 | 30 | 46 |
| YPM_IP_216610 | 24.5 | 38 |
| YPM_IP_216614 | 33.5 | |
| YPM_IP_216624 | 32.5 | 50 |
| YPM_IP_216636 | 32 | 53.5 |
| YPM_IP_216644 | 26 | 40 |
| YPM_IP_216647 | 34 | 51 |
| YPM_IP_216652 | 30 | 44.5 |
| YPM_IP_216660 | 27 | 40.5 |
| YPM_IP_216661 | 28.5 | 41.5 |
| YPM_IP_216662 | 29 | 44 |
| YPM_IP_216666 | 19 | 30 |
| YPM_IP_216670 | 31 | 44 |
| YPM_IP_216679 | 30 | 44 |
| YPM_IP_216682 | 42 | 62.5 |
| YPM_IP_216683 | 32.5 | 49 |
| YPM_IP_216687 | 25 | 35 |
| YPM_IP_216695 | 20 | 29.5 |
| YPM_IP_216699 | 20 | 30 |
| YPM_IP_216703 | 19.5 | 26.5 |
| YPM_IP_216704 | 31 | 49 |
| YPM_IP_216707 | 24 | 39 |
| YPM_IP_216713 | 39.5 | 55 |
| YPM_IP_216715 | 43 | 67 |
| YPM_IP_216716 | 21 | 32 |
| YPM_IP_216717 | 23 | 33 |
| YPM_IP_216718 | 34 | 47 |
| YPM_IP_216723 | 41 | 59 |
| YPM_IP_216724 | 34 | 55 |
| YPM_IP_216725 | 13 | 17.5 |
| YPM_IP_216727 | 30 | 53 |
| YPM_IP_216728 | 35 | 52 |
| YPM_IP_216729 | 36 | 56 |
| Eurypterus lacustris | ||
| Measurement credits James Lamsdell | ||
| Specimen no. | Prosomal shield length | Prosomal shield width |
| YPM_IP_216730 | 26 | 44 |
| YPM_IP_216733 | 40 | 58.5 |
| YPM_IP_216734 | 49 | 70 |
| YPM_IP_217694 | 24 | 35 |
| YPM_IP_217696 | 11 | 16 |
| YPM_IP_217700 | 36 | 55 |
| YPM_IP_217712 | 24 | 37.5 |
| YPM_IP_217713 | 31 | 47 |
| YPM_IP_217714 | 32 | 51 |
| YPM_IP_217715 | 25.5 | 39 |
| YPM_IP_217722 | 44 | 66 |
| YPM_IP_217723 | 33 | 49 |
| YPM_IP_217724 | 32 | 47 |
| YPM_IP_217725 | 43 | 64 |
| YPM_IP_217726 | 29.5 | 46 |
| YPM_IP_217727 | 36.5 | 56 |
| YPM_IP_217729 | 31 | 47 |
| YPM_IP_217730 | 32 | 48.5 |
| YPM_IP_217732 | 8 | 10 |
| YPM_IP_217736 | 25.5 | 37 |
| YPM_IP_217739 | 27 | 40.5 |
| YPM_IP_217743 | 40 | 65 |
| YPM_IP_217750 | 38 | 61 |
| YPM_IP_217751 | 25.5 | 38.5 |
| YPM_IP_217755 | 27 | 42 |
| YPM_IP_217756 | 56 | 84.5 |
| YPM_IP_217761 | 24.5 | 38 |
| YPM_IP_217762 | 22.5 | 34 |
| YPM_IP_217763 | 33 | 54.5 |
| YPM_IP_217764 | 41 | 63.5 |
| YPM_IP_217766 | 23 | 34.5 |
| YPM_IP_217770 | 19 | 26 |
| YPM_IP_217775 | 19.5 | 32 |
| YPM_IP_217777 | 23.5 | 36 |
| YPM_IP_217780 | 27 | 39.5 |
| YPM_IP_217790 | 21 | 32.5 |
| YPM_IP_223420 | 25 | 36.5 |
| Eurypterus lacustris | ||
| Measurement credits James Lamsdell | ||
| Specimen no. | Prosomal shield length | Prosomal shield width |
| YPM_IP_223423 | 33 | 50 |
| YPM_IP_288014 | 21.5 | 37.5 |
| YPM_IP_288044 | 45 | 63 |
| YPM_IP_388026 | 21.5 | 37 |
| YPM_IP_403855 | 35 | 54 |
| YPM_IP_403865 | 23 | 36 |
| YPM_IP_403867 | 24.5 | 34 |
| YPM_IP_403882 | 24 | 36 |
| YPM_IP_403885 | 39 | 61 |
| YPM_IP_403889 | 58 | 83 |
| YPM_IP_403890 | 31 | 54 |
| YPM_IP_403891 | 19 | 29 |
| YPM_IP_403892 | 36.5 | 55.5 |
| YPM_IP_426065 | 33.5 | 50 |
| YPM_IP_426066 | 35 | 51.5 |
| YPM_IP_426067 | 44.5 | 70 |
| YPM_IP_426068 | 29 | 40 |
| YPM_IP_426076 | 23 | 34 |
| YPM_IP_426078 | 40 | 61 |
| YPM_IP_426090 | 34 | 50 |
| YPM_IP_426096 | 11.5 | 17 |
| YPM_IP_426100 | 30 | 48 |
| YPM_IP_426101 | 19.5 | 32 |
| YPM_IP_426140 | 39 | 58 |
| YPM_IP_426141 | 24 | 39 |
| YPM_IP_426142 | 26 | 40 |
| YPM_IP_426143 | 27 | 40 |
| YPM_IP_426151 | 38.5 | 61 |
| YPM_IP_426164 | 40 | 58 |
| YPM_IP_426200 | 24 | 35.5 |
| YPM_IP_426282 | 36.5 | 56 |
| YPM_IP_426283 | 26.5 | 40 |
| YPM_IP_426285 | 45 | 65 |
| YPM_IP_426286 | 37.5 | 53 |
| YPM_IP_426297 | 23 | 39 |
| YPM_IP_426298 | 25 | 38 |
| YPM_IP_426299 | 7.5 | 12 |
| Eurypterus lacustris | ||
| Measurement credits James Lamsdell | ||
| Specimen no. | Prosomal shield length | Prosomal shield width |
| YPM_IP_426300 | 23 | 35 |
| YPM_IP_426313 | 20.5 | 31 |
| YPM_IP_426314 | 9 | 12.5 |
| YPM_IP_426393 | 28.5 | 44 |
| YPM_IP_426394 | 26 | 37.5 |
| YPM_IP_427341 | 26 | 38.5 |
| YPM_IP_545059 | 16 | 26 |
List of the measurements for Hoplitaspis hiawathai, Limulus polyphemus, Paleolimulus kunguricus, Prolimulus woodwardi, Euproops sp. (Andersoniella) and Eurypterus lacustris used for the morphometric analyses.
All measurements are in mm.
Regressions of morphometric measurements during ontogeny
When the slope of the linear regression for the prosomal shield (carapace) width and length was not directly available in the literature, it was calculated. Prior to performing the linear regression, the natural log of all datasets was taken to reduce the skewness. Linear regression analyses were then conducted for prosomal shield lengths vs. prosomal shield widths for the following species: Eurypterus lacustris, Hoplitaspis hiawathai, Prolimulus woodwardi, Euproops sp., Paleolimulus kunguricus and Limulus polyphemus. The regression slopes for Paleolimulus signatus, Euproops danae, Mesolimulus walchi, and Tachypleus tridentatus were taken from Bicknell et al. (2022). Therefore, at least one representative of three of the four taxa of Xiphosura (Paleolimulidae, Bellinurina, and Limulidae) were considered, alongside two non-xiphosuran euchelicerates. Linear regressions of the measurements of Eurypterus lacustris, Hoplitaspis hiawathai, Prolimulus woodwardi, Euproops sp., Paleolimulus kunguricus and Limulus polyphemus were performed with the function “lm” in RStudio 2021.09.0 + 351 “Ghost Orchid”. The plots of the linear regressions were made using the function “plot” in RStudio 2021.09.0 + 351 “Ghost Orchid” and subsequently edited with Adobe Illustrator (R script in Supplementary Datasheet S1). All the linear regression slopes are reported in Table 2.
Table 2
| Species | Prosomal shield slope | Host museum | Reference slope |
|---|---|---|---|
| Hoplitaspis hiawathai | 0.719 | UWGM | Present work |
| Limulus polyphemus | 0.965 | YPM IP | Present work |
| Paleolimulus kunguricus | 0.92 | GIN, PSU | Present work |
| Euproops danae | 0.888 | YPM IP | Present work |
| Prolimulus woodwardi | 0.959 | NM, NHMUK PI, MCZ, MBA | Present work |
| Euproops sp. | 1.02 | MAS Pal. | Bicknell et al., 2022; Haug et al., 2012 |
| Mesolimulus walchi | 0.978 | CM, JME SOS, MCZ, MNHN, NM, SMNS, SNSB-BSPG, USNM, YPM IP | Bicknell et al., 2022 |
| Eurypterus lacustris | 0.936 | YPM IP | Present work |
| Paleolimulus signatus | 1.02 | KUMIP, USNM, YMP IP | Bicknell et al., 2022 |
| Tachypleus tridentatus | 0.99 | N/A | Bicknell et al., 2022; Kaiser and Schoppe, 2018 |
Linear regression slopes of all the taxa examined in the study.
Phylogenetic analyses
Bayesian phylogenetic analyses were performed using the matrix from Lamsdell (2020), with the addition of Hoplitaspis hiawathai and Prolimulus woodwardi. The character coding for Hoplitaspis hiawathai was based on Lamsdell et al. (2019), and character coding for Prolimulus woodwardi was based on Lustri et al. (2021). Eurypterus lacustris was not present in this matrix and has not been coded. Instead, Eurypterus tetragonophthalmus was used as a proxy representing the relative phylogenetic position of Eurypterus lacustris as the utilized matrix is expected to be coded identically for them both (in Figure 4, Eurypterus lacustris would have appeared as a sister species to Eurypterus tetragonophthalmus highlighted in red). The methods are the same as in the original work from Lamsdell (2020), using MrBayes ver. 3.2.7a (Huelsenbeck and Ronquist, 2001). The final data matrix includes 162 taxa and 259 discrete characters. The analyses consisted of four independent runs of 10,000,000 generations and four chains each, under the maximum likelihood model with gamma-distributed rate variation among sites (Mkv + Γ:) (Lewis, 2001). Characters were unordered and given equal weighting (Congreve and Lamsdell, 2016). Trees were sampled every 100 generations. The resulting trees per run is 1,000,000 and the first 25,000 sampled trees of each run were discarded as burn-in. Extended majority rule tree obtained was used for the subsequent analyses (Figure 4). The matrix used for the phylogenetic analyses and the mrBayes code are available in Supplementary Datasheet S2.
Figure 4
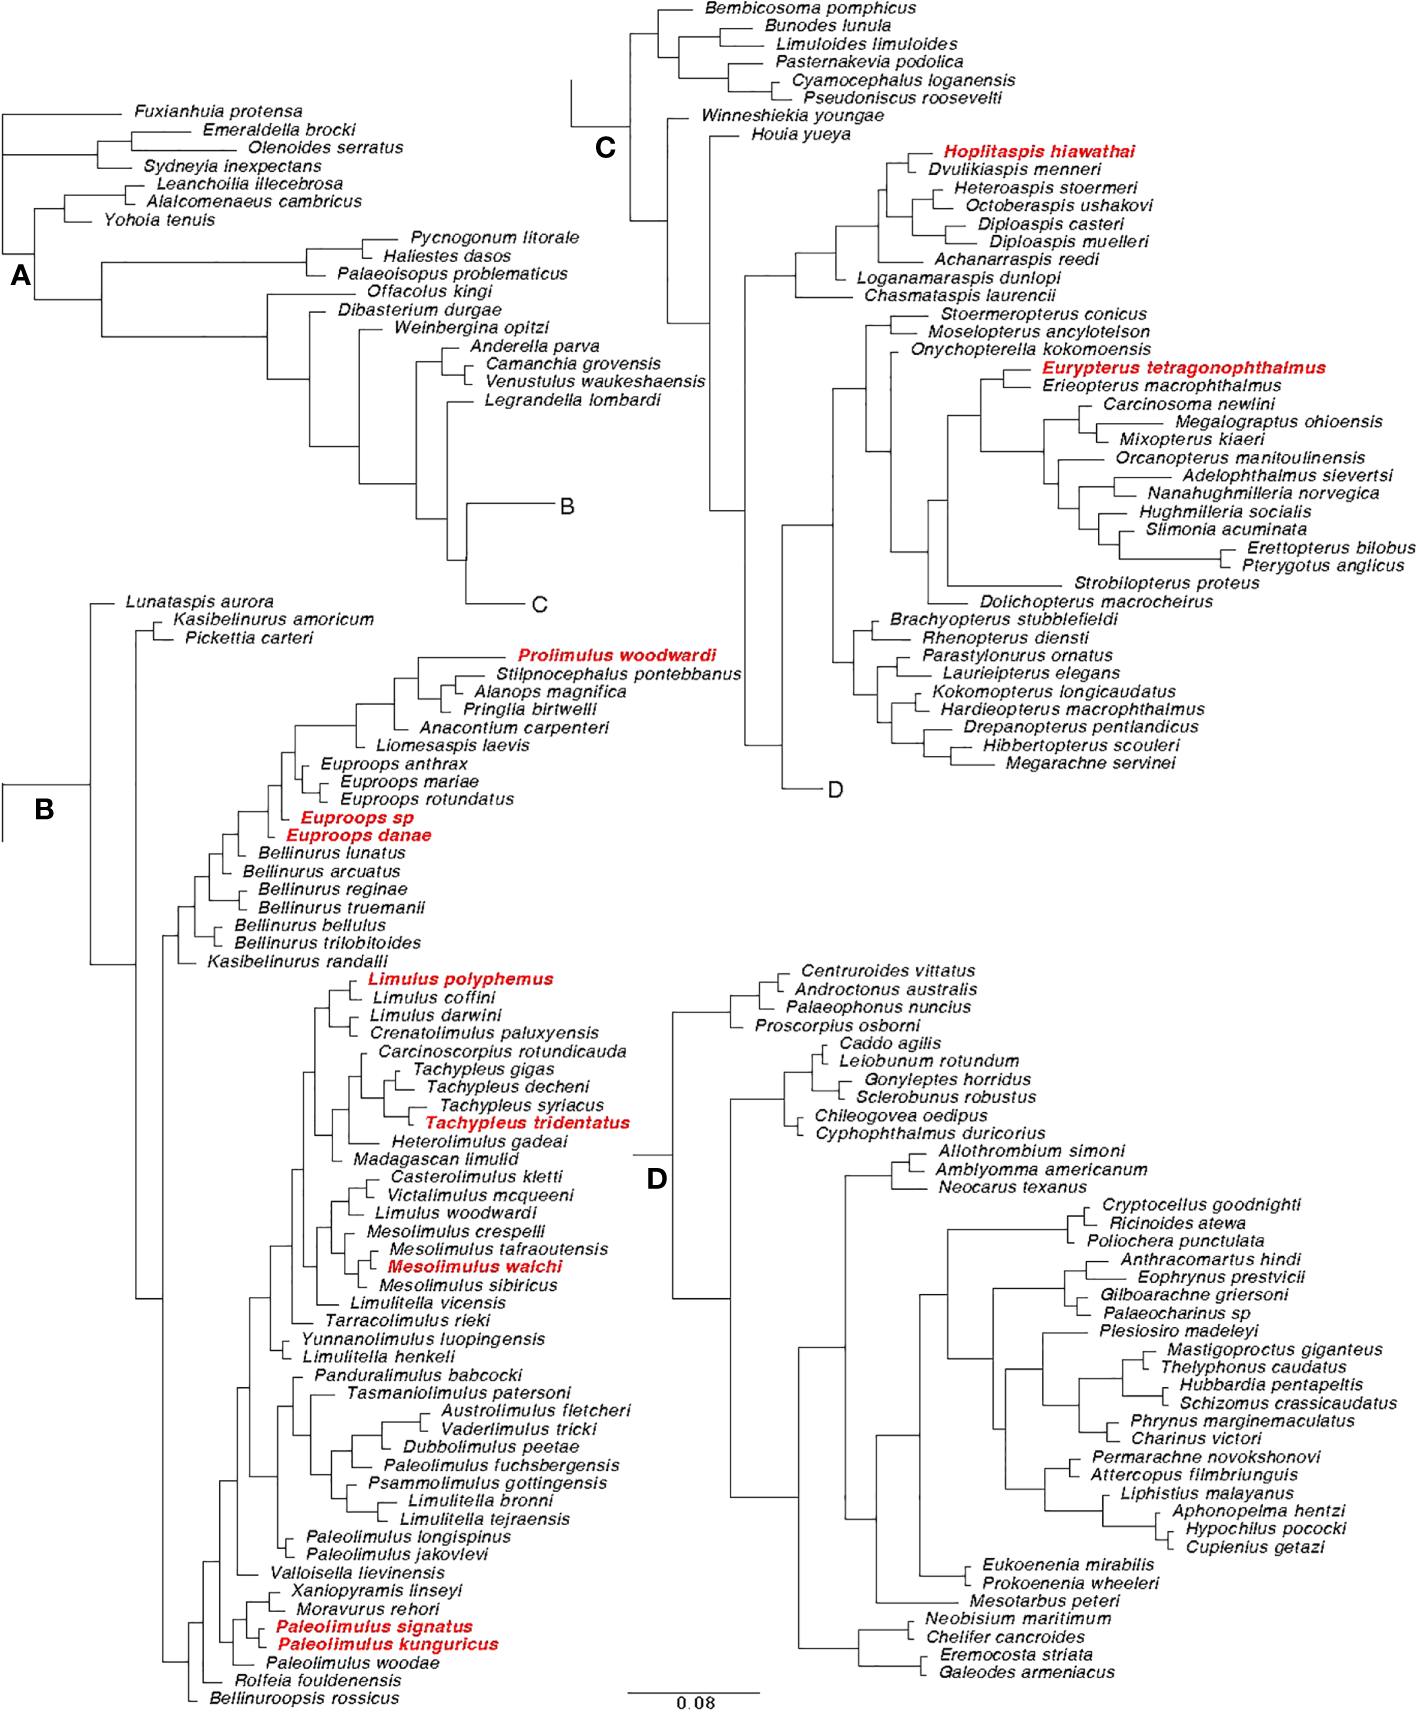
Extended majority rule tree of the Bayesian analysis performed on the matrix modified from Lamsdell (2020). (A) Root section of the tree; (B) Xiphosura section of the tree; (C) Eurypterida and Chasmataspidida section of the tree. (D) Arachnida section of the tree. The species used in the analyses of this paper are highlighted in red. The tree is based on a matrix composed of 162 taxa and 259 characters.
Ancestral state reconstruction and the estimation of evolutionary rates
The phylogenetic tree obtained with the Bayesian phylogenetic analyses was pruned with the “ape” (Paradis and Schliep, 2019) function “drop.tip” in RStudio 2021.09.0 + 351 “Ghost Orchid”. Two different pruned trees were obtained. The first tree retained the branch length and node positions for xiphosurans species with known growth-pattern data (prosomal shield length and width ratio along the growth), resulting in a tree with 8 tips and 7 internal nodes. The second tree retained the branch length and the node positions for all euchelicerate species with known growth-pattern data (prosomal shield length and width ratio along the growth), resulting in a tree of 10 tips and 9 internal nodes. The branch lengths of the trees are based on morphological character distance. Using the packages “mvMORPH” (Clavel et al., 2015), “ape” (Paradis and Schliep, 2019) and “phytools” (Revell, 2012), ancestral state analyses have been performed on both trees, incorporating the discrete environmental data of Lamsdell (2021), here divided between marginal (not fully marine) and marine settings following Bicknell et al. (2022). The ML function was used for a maximum likelihood estimation of the ancestral state under Brownian motion models. Subsequently, two evolutionary models were tested on the ancestral states recovered from both pruned phylogenetic trees: a Multivariate Brownian motion process (BM), and a Multi-rate Brownian motion process (BMM). The BM is a model in which a single path of evolution is simulated under Brownian motion processes while the BMM is a model in which multiple paths of evolution are simulated under Brownian motion processes. The models were used to test the null hypothesis where an absence of correlation between environmental (in our case two variables marginal and marine) and development would result in the BM model (allowing only one evolutionary path) outperforming the BMM model (allowing two different evolutionary paths). The evolutionary rates of marginal and marine species were calculated under both models using the “mvBM” command to investigate the possible correlation between the environment and the evolution of ontogenetic characters over time. The ontogenetic variation investigated is the change in shape of the prosomal shield (carapace) during ontogeny. The fit of these different evolutionary models was assessed by calculating the Akaike weight with the command “aicw”. All the aforementioned analyses were made using RStudio 2021.09.0 + 351 “Ghost Orchid” (R script in Supplementary Datasheet S3).
Results
The slopes of the prosomal shield length and width of Eurypterus lacustris, Hoplitaspis hiawathai, Prolimulus woodwardi, Euproops sp., Paleolimulus kunguricus and Limulus polyphemus are available together with the slopes gathered from the literature of Paleolimulus signatus, Euproops danae, Mesolimulus walchi, Tachypleus tridentatus in Table 2. Gradient values greater than 1 represent a preferential growth of length over width, with higher numbers representing a more extreme allometry. A gradient of exactly 1 represents ontogenetic isometry (inflationary growth), while a gradient of less than 1 represents width increasing quicker than length during ontogeny with lower numbers representing more extreme allometry. The prosomal shield slopes range from 0.719 in Hoplitaspis hiawathai to 1.02 in Euproops sp and Paleolimulus signatus. Between these extremes, Eurypterus lacustris, Euproops danae, Prolimulus woodwardi, Paleolimulus kunguricus, Limulus polyphemus, Mesolimulus walchi and Tachypleus tridentatus range from 0.888 in Euproops danae to 0.99 in Tachypleus tridentatus. All performed regressions are shown in Figure 5.
Figure 5
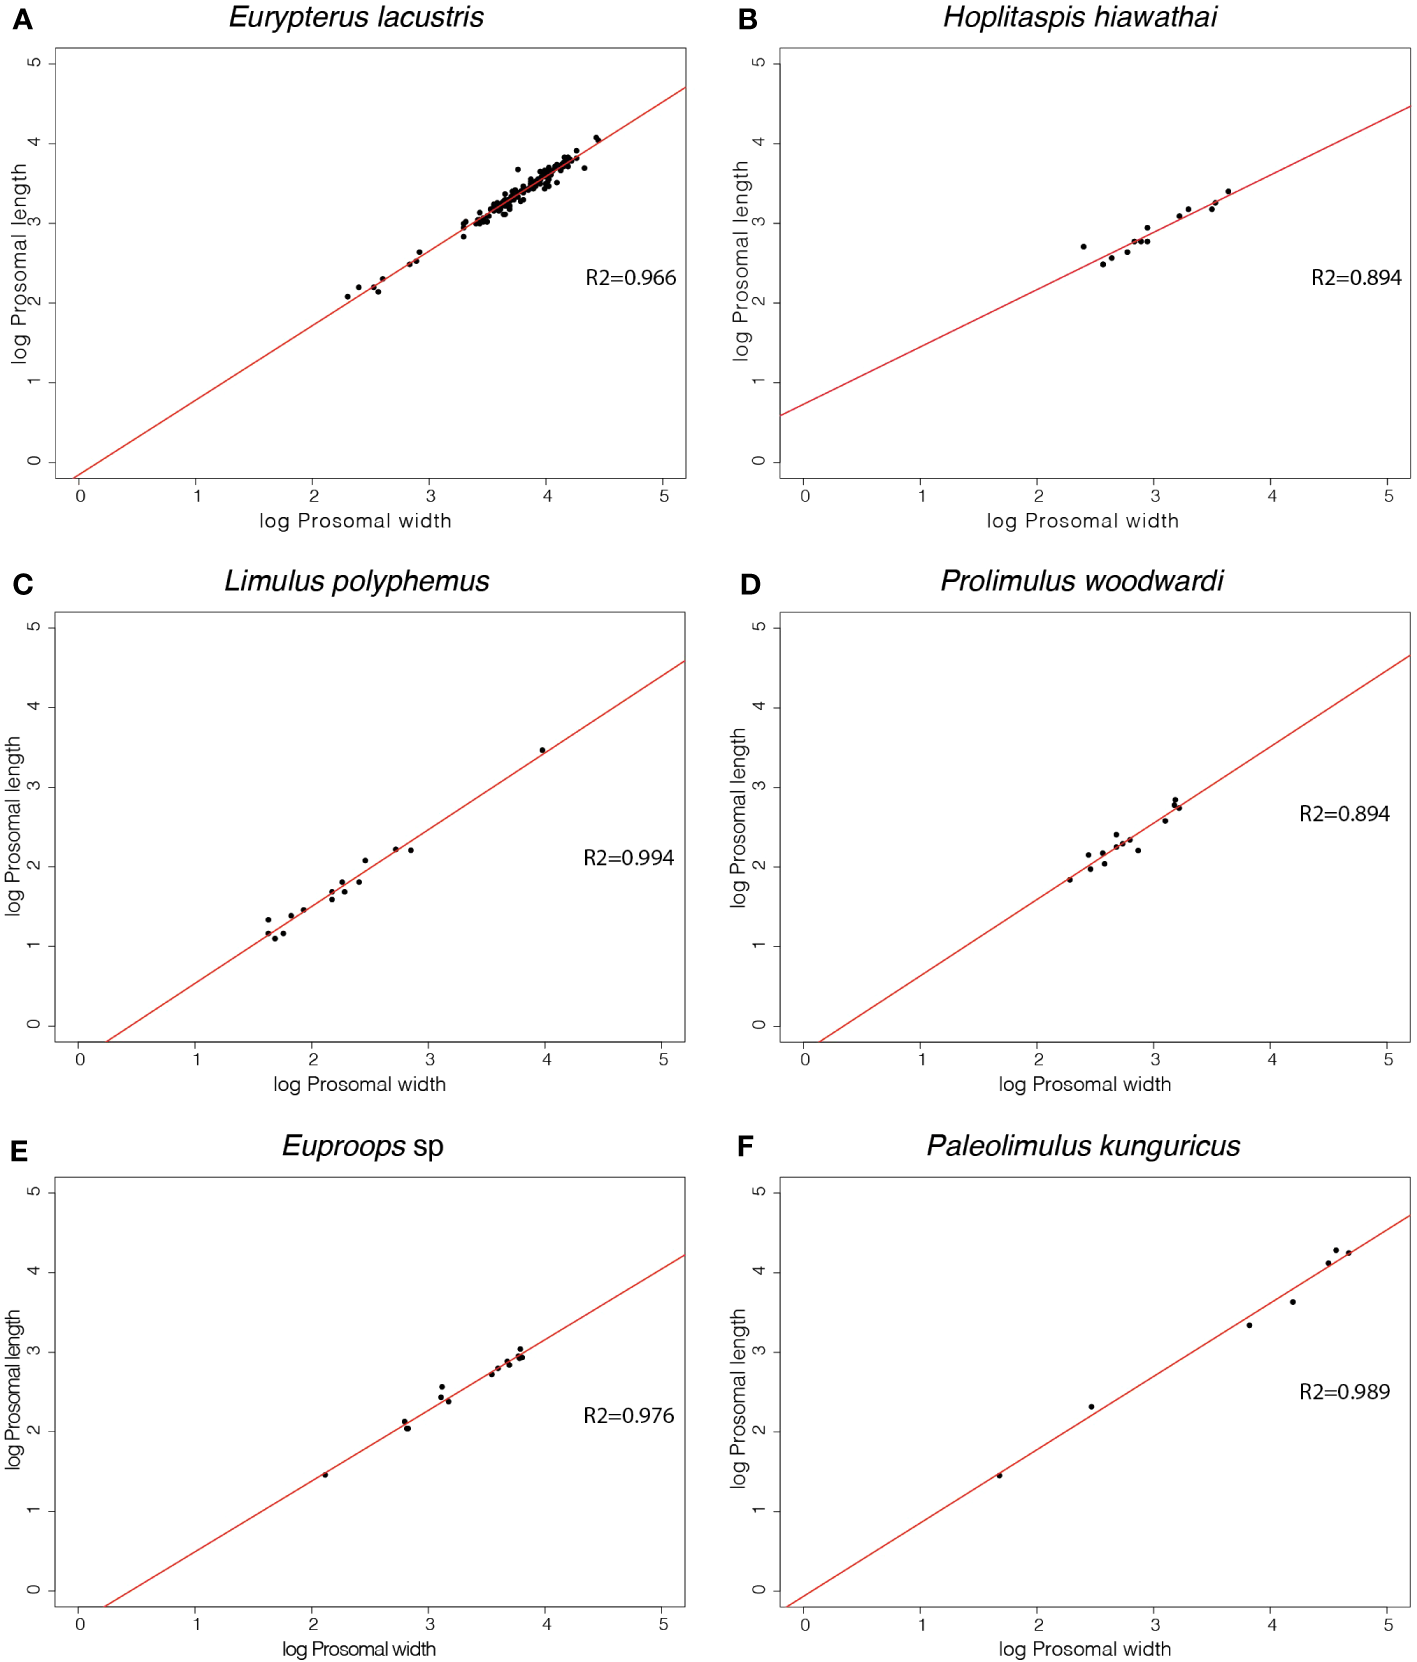
Linear regressions of morphometric measurements of the prosomal shield length and width of 6 different euchelicerate species. Slope values resulting from the regressions are available in Table 2 alongside slopes taken from the literature.
The results for the reconstructed ancestral state of the allometric growth of the prosomal shield, partitioned by environment, are summarized in the phylogenetic trees shown in Figures 6 and 7. Figure 6 represents the tree that includes only Xiphosura, while Figure 7 includes both Xiphosura and additional euchelicerate species (Eurypterus lacustris and Hoplitaspis hiawathai). In both trees, the lowest values of the slope (indicating width increasing quicker than length) are found in species associated with marginal environments, such as Hoplitaspis hiawathai and Euproops danae, while values closer to 1 are more commonly associated with marine settings.
Figure 6

Ancestral state reconstruction of the prosomal shield allometric growth and environments of Xiphosura. Numbers at the nodes are the reconstructed ancestral state for the prosomal shield slope. Pie charts express the probability of a marginal or marine environment at the node. 0.888 is the lowest slope value and 1.02 is the highest slope value. Results of the evolutionary models (BM and BMM) tested on the tree are available in Table 3.
Figure 7
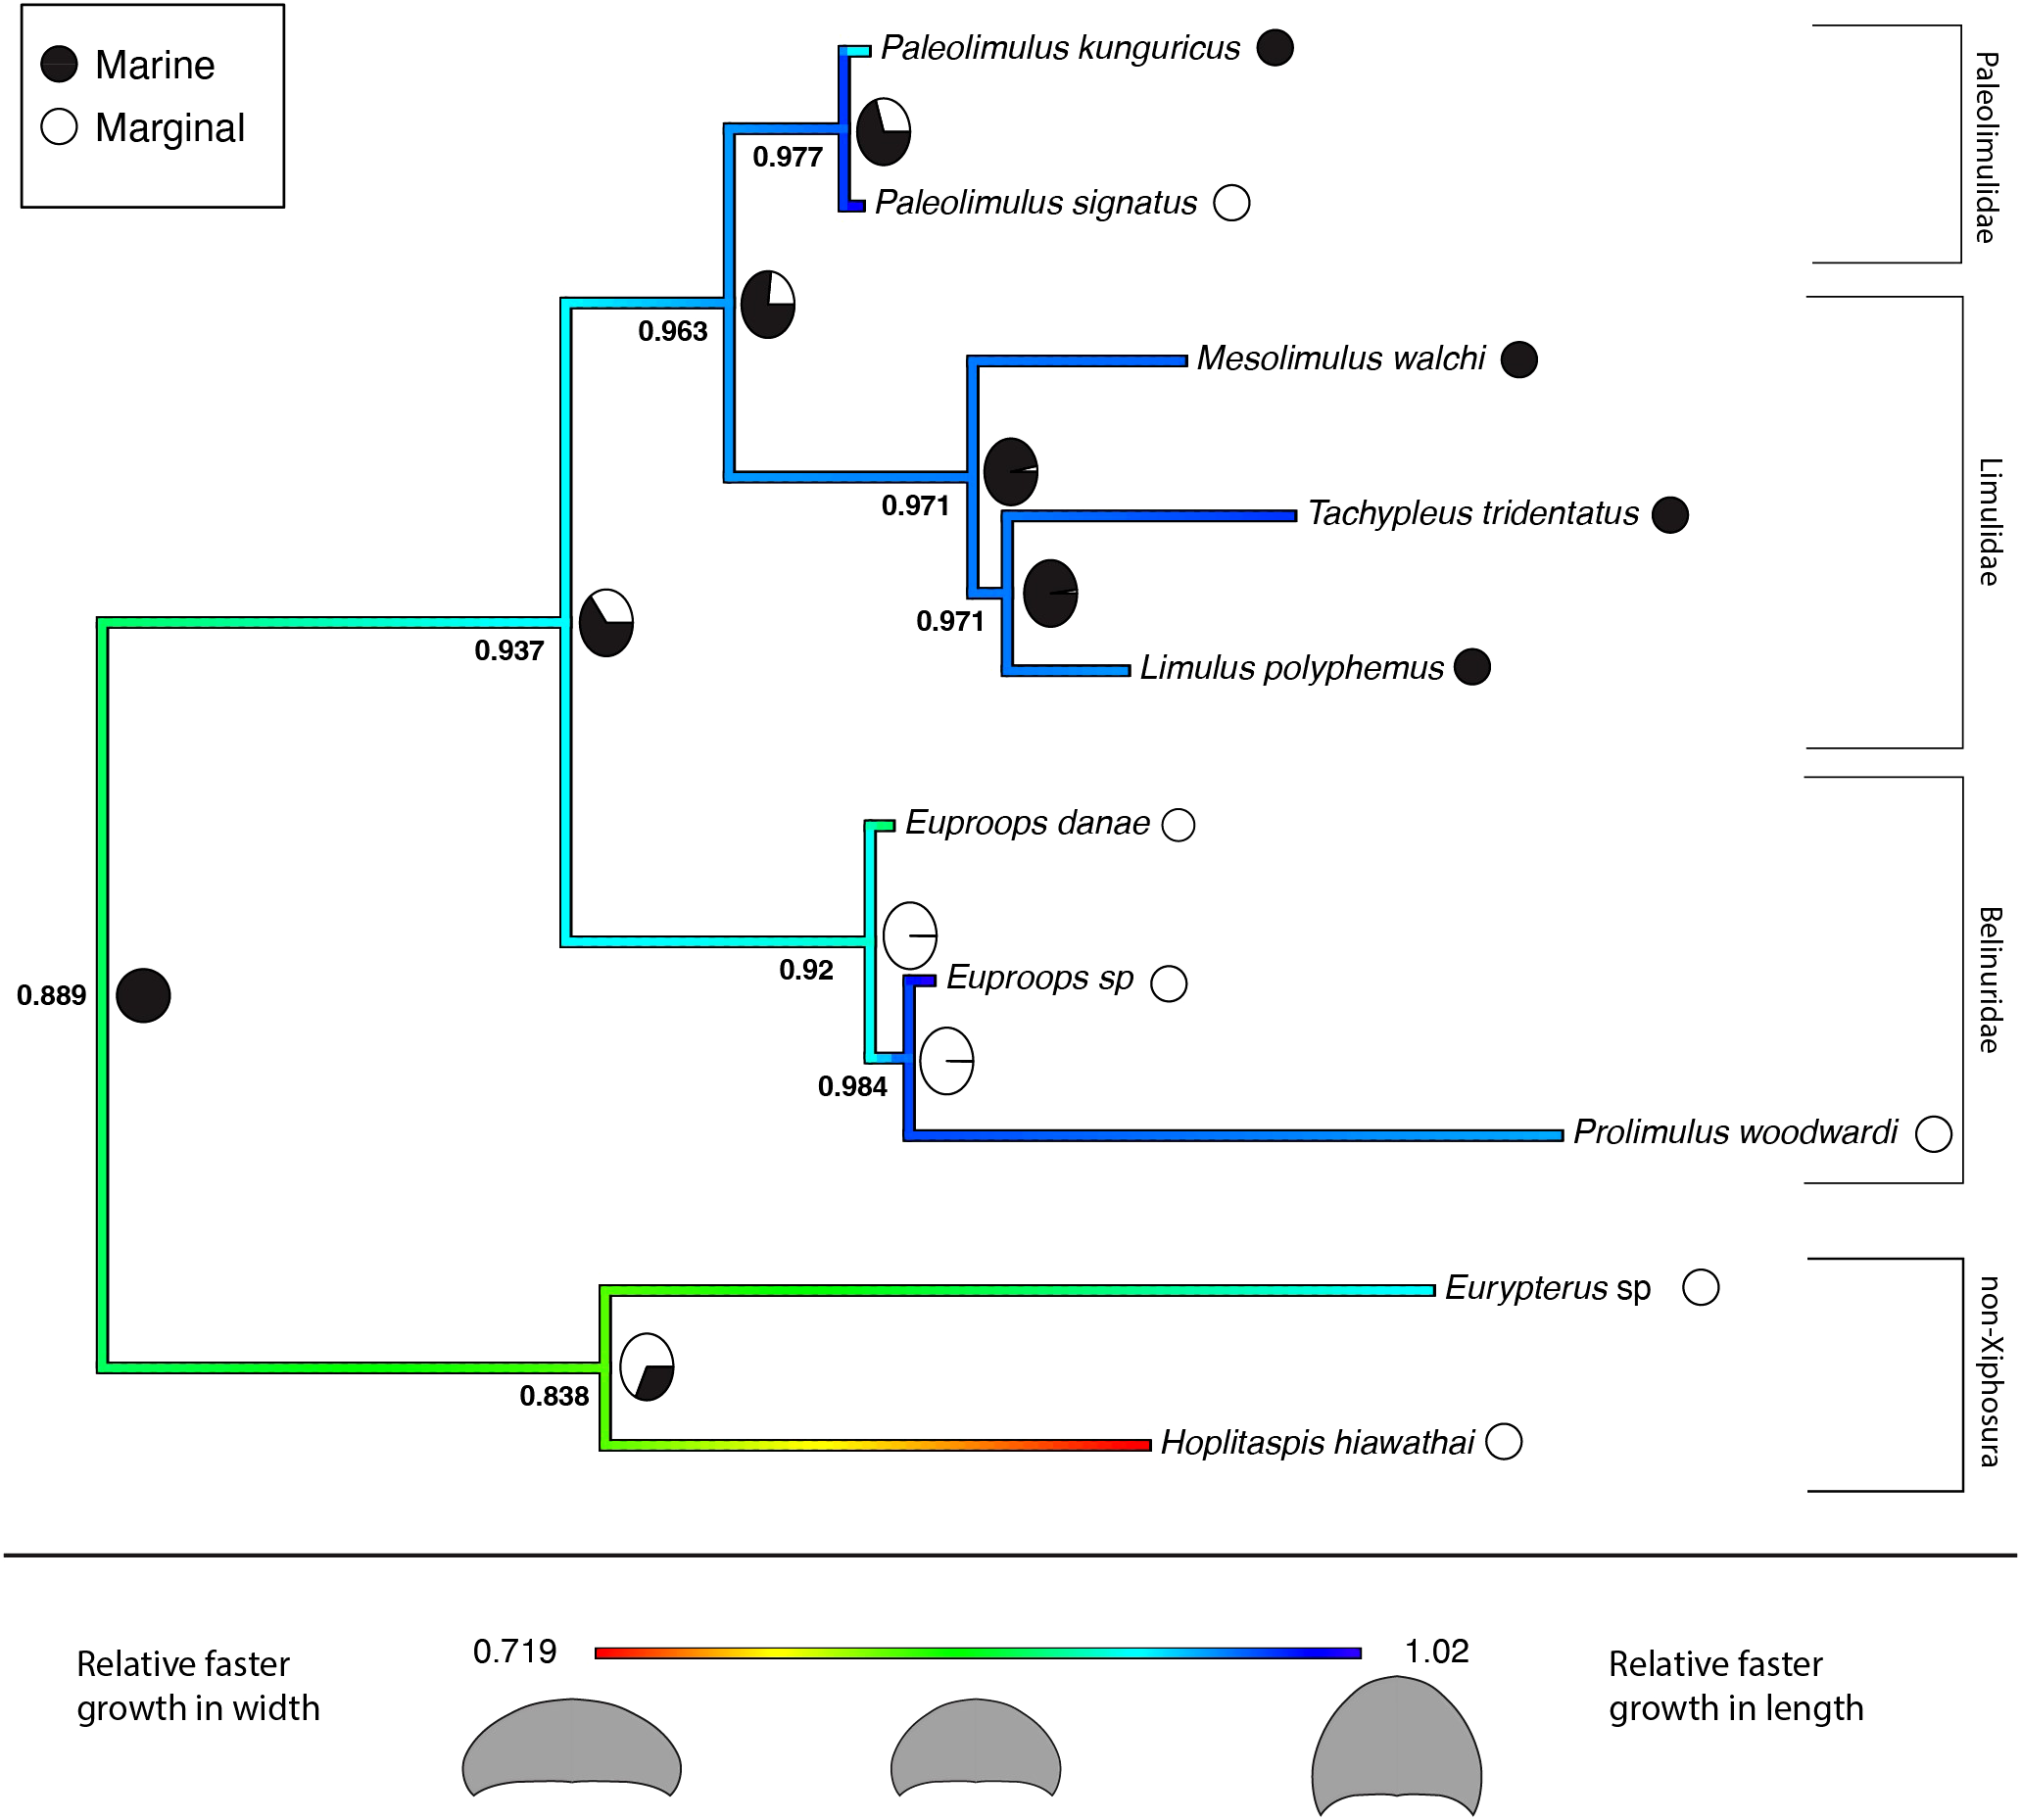
Ancestral state reconstruction of the prosomal shield allometric growth and environments of Xiphosura, Eurypterida and Chasmataspidida. Numbers at the nodes are the reconstructed ancestral state for the prosomal shield slope. Pie charts express the probability of a marginal or marine environment at the node. 0.478 is the lowest slope value and 1.02 is the highest slope value. Results of the evolutionary models (BM and BMM) tested on the tree available are in Table 4.
The two evolutionary models tested on the two different phylogenetic trees (xiphosurans-only and euchelicerate trees) with the reconstructed character history show differences in fitting the data and different statistical support. For the xiphosurans-only tree the BM model, which does not account for environmental differences, outperforms the BMM model, which considers environmental effects (BM AICw = 0.676; and BMM AICw = 0.324, see also Table 3). The Log-likelihood Ratio Test for this model yields a p-value of 0.89. For the euchelicerates tree, the BMM model, which accounts for environmental differences, outperforms the BM model (BM AICw = 0.027; and BMM AICw = 0.973, see also Table 4). The Log-likelihood Ratio Test for this model shows a p-value of 0.00246. When accounting for environmental affinities, the evolutionary rate recovered for marginal species is higher than in marine species for both xiphosurans-only and all-euchelicerates analyses. However, this pattern is much more evident in the all-euchelicerates tree. Full data regarding the comparison of the two models alongside evolutionary rates recovered in marine and marginal environments are presented in Tables 3, 4.
Table 3
| Model including only Xiphosurida | ||
|---|---|---|
| Multivariate Brownian motion process (BM) | ||
| LogLikelihood: | 5.490783 | |
| AIC: | −6.981566 | |
| AICc: | −4.581566 | |
| Estimated rate of evolution | ||
| pL/pW slop | 0.3174505 | |
| Multi-rate Brownian motion process (BMM) | ||
| LogLikelihood: | 5.500164 | |
| AIC: | −5.000327 | |
| AICc: | 0.9996729 | |
| Estimated rate of evolution marginal environment | ||
| pL/pW slop | 0.3390649 | |
| Estimated rate of evolution marine environment | ||
| pL/pW slop | 0.2859732 | |
| Akaike weights for the two models | ||
| BMM versus BM | ||
| AIC diff | AICw | |
| BM | −6.98 | 0.676 |
| BMM | −5.51 | 0.324 |
| Log-likelihood Ratio Test for the two models | ||
| LRT statistic: 0.0187614 p-value: 0.8910527 | ||
AIC supports and estimated rate of evolution for the BM and BMM models that include only the xiphosurans.
Table 4
| Model including Xiphosurida, Eurypterids and Chasmataspidida | ||
|---|---|---|
| Multivariate Brownian motion process (BM) | ||
| LogLikelihood: | 2.430013 | |
| AIC: | −0.8600268 | |
| AICc: | 0.8542589 | |
| Estimated rate of evolution | ||
| pL/pW slop | 0.4916194 | |
| Multi-rate Brownian motion process (BMM) | ||
| LogLikelihood: | 7.013268 | |
| AIC: | −8.026537 | |
| AICc: | −4.026537 | |
| Estimated rate of evolution marginal environment | ||
| pL/pW slop | 0.5915447 | |
| Estimated rate of evolution marine environment | ||
| pL/pW slop | 0.002031127 | |
| Akaike weights for the two models | ||
| BMM versus BM | ||
| AIC diff | AICw | |
| BM | −0.86 | 0.027 |
| BMM | −8.03 | 0.973 |
| Log-likelihood Ratio Test for the two models | ||
| LRT statistic: 9.16651 p-value: 0.00246 | ||
AIC supports and estimated rate of evolution for the BM and BMM models that include Xiphosurida, Eurypterida and Chasmataspidida.
Discussion
Several patterns are present in the reconstructed ancestral state for the growth pattern of the prosomal shield (carapace) compared across different environments and systematic levels (Figures 6 and 7). The obtained regression slopes represent how much the carapace length increases in comparison to its width. A lower slope value indicates a smaller growth of the carapace length in comparison to its width. In the reconstruction of ancestral states performed on the xiphosurans-only dataset and tree, higher slope values are found on average in limulid species from marine environments. Isolated species of Paleolimulidae and Bellinuridae from marginal environments also exhibit high slope values (specifically Paleolimulus signatus and Euproops sp.) (Figure 6). On the other hand, lower slope values are found in the marginal environment with Euproops danae. This may reflect a certain degree of morphological plasticity associated with species inhabiting the marginal environment, as supported by previous research (Lamsdell, 2016; Lamsdell 2021a; Bicknell et al., 2022). It is further supported by a higher estimated evolutionary rate for the marginal environment (Table 3). However, when comparing the BMM, which includes the environmental variable as a potential correlate to evolutionary rates, with the BM that does not account for this, there is no significant support for the BMM over the BM (Table 3). Instead, a single Brownian motion model for all the xiphosurans included in the analyses fits the data better than two different Brownian models associated with the marginal and marine environments. This analysis yields a high p-value (Table 3), weakening the assumption that the evolution of xiphosuran development can be inferred solely considering the internal relationships of the group. While these results may be due to the absence of correlation between evolutionary rates and environments for the Xiphosura, other hypotheses can also explain this outcome. The sample size used for the analyses may have been too small, reflecting a lack of available fossil data. Another factor that may have contributed to the results of this analysis is the difficulty in discriminating between coastal, estuarian or freshwater environments for fossil specimens. This becomes clearer when examining the results obtained from the same analyses performed on a tree and dataset that includes the non-xiphosuran euchelicerates: Eurypterus lacustris and Hoplitaspis hiawathai. The inclusion of other euchelicerates increases the variability in carapace allometric growth, and provides a new perspective on the intra-xiphosurans differences recovered from the previous analyses (Figure 7). At this systematic scale, the differences among xiphosurans appear more subtle (Figure 7). This conclusion is also supported by a higher estimated evolutionary rate for the marginal environment in the second analysis compared to the previous one (Table 4). However, it is important to note some limitations of this second approach as well. In the second analyses, Hoplitaspis hiawathai represents a significant portion of the total variability. This may not reflect the average status in Chasmataspidida. Another important factor limiting our study is a possible error in environmental assignment introduced by the ethological aspect of several of the examined taxa. It is well known that aquatic euchelicerates possessed gregarious behaviors, often associated with group molting events (Daley and Drage, 2016; Bicknell et al., 2019b; Lamsdell et al., 2019; Lustri et al., 2021) that took place in shallow waters. This may have affected our environmental classification for species such as Hoplitaspis hiawathai (Lamsdell et al., 2019), Eurypterus lacustris (Ruebenstahl et al., 2021) and Prolimulus woodwardi (Lustri et al., 2021) for which gregarious behaviors are reported and specimens were moults, meaning we cannot exclude this to be the case for other taxa involved in the study.
In the all-euchelicerates analysis, stronger support for the BMM over the BM is demonstrated, suggesting the presence of two different evolutionary rates for the two different environments. This signal was not recoverable when using the dataset that relies on only xiphosurans. The all-euchelicerates analysis reinforces the results of the xiphosurans-only analysis and gives a phylogenetic perspective to the evolutionary patterns of xiphosurans. Both analyses show an increase in morphological plasticity, independent of phylogeny but associated with the colonization of new environments. Furthermore, the second analysis shows that while these changes happened and are likely related to different environments within Xiphosura, they are much less pronounced than in the absence of outgroups. Body proportions in adulthood are generally stereotypical for any given species, and ontogenetic development is the process leading to their establishment. This implies that growth and form are related, but not by a simple relationship of cause and effect, because the starting point of body proportions at hatching/birth plays an important role too. Nevertheless, in light of the highest evolutionary rates of allometric growth recovered from our analyses associated with the freshwater environment, is still important to note extreme proportions of the prosomal shield even when they occur in species known from only one or few specimens where developmental data are lacking. Extremes in the proportions of the prosomal shield are often recovered in Mesozoic freshwater taxa, several of which have been excluded by our analyses owing to the lack of data about the development. This is the case for the radiation of Austrolimulidae. Austrolimulidae such as Austrolimulus fletcher (Riek, 1955) and Dubbolimulus peetae (Pickett, 1984) for example, shows an exploration of extreme prosomal shield proportions at least at a single point in their development (Bicknell et al., 2022). Other examples are present among the grade belinurines of Belinuridae. Belinurus bellulus (König, 1825), Parabelinurus lunatus (Lamsdell, 2020) and Macrobelinurus arcuatus (Lamsdell, 2020), to name a few are all freshwater species with a prosomal shield with a relative width greater than the length resulting in a crescentic moon shape of the carapace. Even if information about the evolution of development is not available for these species, their wide prosomal shield proportion provides support for the hypothesis of freshwater environments being positively correlated with higher evolutionary rates in xiphosurans. The exploration of different prosomal shield proportions took place during an anatomical radiation as the group invaded freshwater environments (Lamsdell, 2016; Lamsdell 2021a).
The evolutionary scenario for the development of xiphosurans, depicted by the analyses accounting only for the intra-xiphosuran variability, shows a similar pattern to a random walk scenario of evolution (Figure 1C) or even a trend (Figure 1B) towards isometric growth. This is especially true in the case of Limulidae (Figure 6). However, this is not the case for Belinuridae, which appear to have had explored a wide range of allometric patterns, neither is it the case for Paleolimulidae, which, even if at a lower degree, did experience different developmental patterns (Figure 6). On the other hand, in the case of Limulidae, a broader phylogenetic perspective finds a general accordance with stasis (Figure 7), showing gradual evolutionary change around a relatively static average morphological position through time (Figure 1A). A broader phylogenetic perspective also reduces the perceived variability in the families Belinuridae and Paleolimulidae. This second analysis provides the appropriate systematic level for the study of developmental evolution in xiphosurans and their related aquatic euchelicerates. In other words, changes in the allometric growth of xiphosuran species are associated with different environments, but they are relatively minor compared to the different allometric patterns found in their closest relatives (Figure 7).
Uniting knowledge of non-Xiphosura euchelicerates with knowledge of Xiphosura development has improved the understanding of the evolution of Xiphosura allometric growth patterns. While this study supports the idea that the colonization of new environments has led to increased evolutionary rates for allometric growth in xiphosurans, the wider phylogenetic framework of our analyses suggest that the entirety of those changes were still somewhat limited when compared to changes seen more broadly in euchelicerates, as it represents a small portion of the total variability observed for euchelicerates. It appears clear that the evolution of xiphosurans cannot be pigeonholed into simplistic terminology such as “living fossils”. Less impactful but more concrete definitions such as “gradual morphological evolution around a middle trait parameter” may better explain the observed pattern, at least regarding allometric growth. Furthermore, this research compares phylogeny-based evolutionary modelling without and with outgroups, emphasizing the importance of the latter to contextualize and to properly interpret the evolution for the target group.
Conclusion
The results show that the evolutionary rates of development of Xiphosura undergoes significant changes throughout the evolutionary history of the group, in concert with the adaptive radiation of the group as they exploit different environments through evolutionary time, and independently from their phylogenetic position. They also highlight the importance of considering outgroups when attributing evolutionary trends to a specific group. The magnitude of allometric growth among Xiphosurais was lower than in other euchelicerates with similar environmental affinities, which flattens what might otherwise appear as an explosion in diversity based solely on the observation of Xiphosura.
Statements
Data availability statement
The original contributions presented in the study are included in the article/Supplementary Material. Further inquiries can be directed to the corresponding authors.
Author contributions
LLu: Conceptualization, Data curation, Formal Analysis, Investigation, Methodology, Writing – original draft, Writing – review & editing. JA: Methodology, Supervision, Writing – review & editing. FS: Writing – review & editing. CH: Conceptualization, Data curation, Supervision, Writing – review & editing. LLa: Conceptualization, Methodology, Writing – review & editing. RG: Conceptualization, Methodology, Writing – review & editing. JH: Supervision, Writing – review & editing, Conceptualization, Data curation. AD: Funding acquisition, Resources, Supervision, Writing – review & editing, Conceptualization.
Funding
LLu and this research were funded by the Swiss National Science Foundation, grant number 205321_179084 entitled “Arthropod Evolution during the Ordovician Radiation: Insights from the Fezouata Biota” awarded to AD and the additional Swiss National Science Foundation Mobility Grant awarded to LLu and AD. FS’s work is funded by an SNF Ambizione Grant (no. PZ00P2_209102). LLa’s research was financed by the Czech Science Foundation (project no. 20-23550Y) and was conducted with institutional support RVO 67985831 of the Institute of Geology of the Czech Academy of Sciences. RG was supported by NERC standard grant NE/T000813/1.
Acknowledgments
We thank Julien Clavel and his course at “Transmitting Science” for instruction and help with the R package mvMORPH, Claudia Baumgartner for revising this manuscript in an early stage as part of Lorenzo Lustri’s PhD thesis, and Russell Bicknell for kindly providing data. Finally, we thank Paul Antony Selden and James Lamsdell for their insightful and informative reviews, which helped direct and improve the text.
Conflict of interest
The authors declare that the research was conducted in the absence of any commercial or financial relationships that could be construed as a potential conflict of interest.
The authors declared that they were an editorial board member of Frontiers, at the time of submission. This had no impact on the peer review process and the final decision.
Publisher’s note
All claims expressed in this article are solely those of the authors and do not necessarily represent those of their affiliated organizations, or those of the publisher, the editors and the reviewers. Any product that may be evaluated in this article, or claim that may be made by its manufacturer, is not guaranteed or endorsed by the publisher.
Supplementary material
The Supplementary Material for this article can be found online at: https://www.frontiersin.org/articles/10.3389/fevo.2023.1270429/full#supplementary-material
References
1
AviseJ. C.NelsonW. S.SugitaH. (1994). A speciational history of “living fossils”: molecular evolutionary patterns in horseshoe crabs. Evolution48, 1986–2001. doi: 10.1111/j.1558-5646.1994.tb02228.x
2
BabcockL. E.MerriamD. F.WestR. R. (2000). Paleolimulus, an early limuline (Xiphosurida), from Pennsylvanian-Permian Lagerst tten of Kansas and taphonomic comparison with modern Limulus. Lethaia33, 129–141. doi: 10.1080/00241160025100017
3
BennettD. J.SuttonM. D.TurveyS. T. (2018). Quantifying the living fossil concept. Palaeontologia Electronica21 (1), 14A. doi: 10.26879/750
4
BicknellR. D. (2019). Xiphosurid from the Upper Permian of Tasmania confirms Palaeozoic origin of Austrolimulidae. Palaeontologia Electronica22, 1–13. doi: 10.26879/1005
5
BicknellR. D.AmatiL.Ortega-HernándezJ. (2019a). New insights into the evolution of lateral compound eyes in Palaeozoic horseshoe crabs. Zoological J. Linn. Soc.187, 1061–1077. doi: 10.1093/zoolinnean/zlz065
6
BicknellR. D.BłażejowskiB.WingsO.HitijT.BottonM. L. (2021a). Critical re-evaluation of Limulidae uncovers limited Limulus diversity. Papers Palaeontology7, 1525–1556. doi: 10.1002/spp2.1352
7
BicknellR. D.HeckerA.HeyngA. M. (2021b). New horseshoe crab fossil from Germany demonstrates post-Triassic extinction of Austrolimulidae. Geological Magazine158, 1461–1471. doi: 10.1017/S0016756820001478
8
BicknellR. D.KimmigJ.BuddG. E.LeggD. A.BaderK. S.HaugC.et al. (2022). Habitat and developmental constraints drove 330 million years of horseshoe crab evolution. Biol. J. Linn. Soc.136, 155–172. doi: 10.1093/biolinnean/blab173
9
BicknellR. D.NaugolnykhS. V.BroughamT. (2020). A reappraisal of Paleozoic horseshoe crabs from Russia and Ukraine. Sci. Nat.107, 1–17. doi: 10.1007/s00114-020-01701-1
10
BicknellR. D.PatesS. (2020). Pictorial atlas of fossil and extant horseshoe crabs, with focus on Xiphosurida. Front. Earth Sci.8, 98. doi: 10.3389/feart.2020.00098
11
BicknellR. D.PatesS.BottonM. L. (2019ba). Euproops danae (Belinuridae) cluster confirms deep origin of gregarious behaviour in xiphosurids. Arthropoda Selecta. Русский артроподологический журнал28 (4), 549–555. doi: 10.15298/arthsel.28.4.07
12
BicknellR. D.ŽaloharJ.MiklavcP.CelarcB.KrižnarM.HitijT. (2019b). A new limulid genus from the Strelovec Formation (Middle Triassic, Anisian) of northern Slovenia. Geological Magazine156, 2017–2030. doi: 10.1017/S0016756819000323
13
BraddyS. J. (2001). Eurypterid palaeoecology: palaeobiological, ichnological and comparative evidence for a “mass–moult–mate” hypothesis. Palaeogeography Palaeoclimatology Palaeoecol.172, 115–132. doi: 10.1016/S0031-0182(01)00274-7
14
BriggsD. E.MooreR. A.ShultzJ. W.SchweigertG. (2005). Mineralization of soft-part anatomy and invading microbes in the horseshoe crab Mesolimulus from the Upper Jurassic Lagerstätte of Nusplingen, Germany. Proc. R. Soc. B: Biol. Sci.272, 627–632. doi: 10.1098/rspb.2004.3006
15
ClavelJ.EscarguelG.MerceronG. (2015). mvMORPH: an R package for fitting multivariate evolutionary models to morphometric data. Methods Ecol. Evol.6(11), 1311–1319.
16
CongreveC. R.LamsdellJ. C. (2016). Implied weighting and its utility in palaeontological datasets: a study using modelled phylogenetic matrices. Palaeontology59, 447–462. doi: 10.1111/pala.12236
17
DaleyA. C.DrageH. B. (2016). The fossil record of ecdysis, and trends in the moulting behaviour of trilobites. Arthropod structure Dev.45 (2), 71–96. doi: 10.1016/j.asd.2015.09.004
18
DunlopJ. A. (2010). Geological history and phylogeny of Chelicerata. Arthropod structure Dev.39, 124–142. doi: 10.1016/j.asd.2010.01.003
19
EldredgeN.ThompsonJ. N.BrakefieldP. M.GavriletsS.JablonskiD.JacksonJ. B.et al. (2005). The dynamics of evolutionary stasis. Paleobiology31, 133–145. doi: 10.1666/0094-8373(2005)031[0133:TDOES]2.0.CO;2
20
FuscoG.MinelliA. (2021). The development of arthropod segmentation across the embryonic/post-embryonic divide–an evolutionary perspective. Front. Ecol. Evol.9, 622482. doi: 10.3389/fevo.2021.622482
21
GaramszegiL. Z. (2014). Modern phylogenetic comparative methods and their application in evolutionary biology: concepts and practice (Berlin Heidelberg: Springer-Verlag).
22
HaugJ. T. (2019). Categories of developmental biology: Examples of ambiguities and how to deal with them. In: FuscoG. (ed), Perspectives on Evolutionary and Developmental Biology. Essays for Alessandro Minelli. Festschrift 2. (Padova: Padova University Press), 93–102.
23
HaugC.HaugJ. T. (2020). Untangling the Gordian knot—further resolving the super-species complex of 300-million-year-old xiphosurids by reconstructing their ontogeny. Dev. Genes Evol.230, 13–26. doi: 10.1007/s00427-020-00648-7
24
HaugC.RötzerM. A. (2018a). The ontogeny of Limulus polyphemus (Xiphosura s. str., Euchelicerata) revised: looking “under the skin”. Dev. Genes Evol.228, 49–61. doi: 10.1007/s00427-018-0603-1
25
HaugC.RötzerM. A. (2018b). The ontogeny of the 300 million year old xiphosuran Euproops danae (Euchelicerata) and implications for resolving the Euproops species complex. Dev. Genes Evol.228, 63–74. doi: 10.1007/s00427-018-0604-0
26
HaugC.van RoyP.LeipnerA.FunchP.RudkinD. M.SchöllmannL.et al. (2012). A holomorph approach to xiphosuran evolution—a case study on the ontogeny of Euproops. Dev. Genes Evol.222, 253–268. doi: 10.1007/s00427-012-0407-7
27
HowardR. J.PuttickM. N.EdgecombeG. D.Lozano-FernandezJ. (2020). Arachnid monophyly: Morphological, palaeontological and molecular support for a single terrestrialization within Chelicerata. Arthropod Structure Dev.59, 100997. doi: 10.1016/j.asd.2020.100997
28
HuelsenbeckJ. P.RonquistF. (2001). MRBAYES: Bayesian inference of phylogenetic trees. Bioinformatics17, 754–755. doi: 10.1093/bioinformatics/17.8.754
29
JeglaT. C.CostlowJ. D. (1982). Temperature and salinity effects on developmental and early posthatch Limulus. In: BonaventuraJ.BonaventuraC.TeshS. (eds), Physiology and Biology of Horseshoe Crabs. Alan R. Liss, New York. pp 103–113.
30
KaiserD.SchoppeS. (2018). Postembryonic development of the Tri-spine Horseshoe Crab Tachypleus tridentatus (Merostomata: Xiphosura) in a nursery habitat in the Philippines. J. Threatened Taxa10, 12916–12932. doi: 10.11609/jott.4125.10.15.12916-12932
31
KinA.BłażejowskiB. (2014). The horseshoe crab of the genus Limulus: living fossil or stabilomorph? PLoS One9, e108036. doi: 10.1371/journal.pone.0108036
32
KönigC. D. E. (1825). Icones fossilium sectiles. Ed. SowerbyG. B. (London). 19 pp.
33
LamsdellJ. C. (2016). Horseshoe crab phylogeny and independent colonizations of fresh water: ecological invasion as a driver for morphological innovation. Palaeontology59, 181–194. doi: 10.1111/pala.12220
34
LamsdellJ. C. (2021a). A new method for quantifying heterochrony in evolutionary lineages. Paleobiology47, 1–22. doi: 10.7934/P2606
35
LamsdellJ. C. (2020). The phylogeny and systematics of Xiphosura. PeerJ8, e10431. doi: 10.7717/peerj.10431
36
LamsdellJ. C. (2021b). The conquest of spaces: exploring drivers of morphological shifts through phylogenetic palaeoecology. Palaeogeography Palaeoclimatology Palaeoecol.583, 110672. doi: 10.1016/j.palaeo.2021.110672
37
LamsdellJ. C.GundersonG. O.MeyerR. C. (2019). A common arthropod from the Late Ordovician Big Hill Lagerstätte (Michigan) reveals an unexpected ecological diversity within Chasmataspidida. BMC Evolutionary Biol.19, 1–24. doi: 10.1186/s12862-018-1329-4
38
LamsdellJ. C.IsotaloP. A.RudkinD. M.MartinM. J. (2023). A new species of the Ordovician horseshoe crab Lunataspis. Geological Magazine160 (1), 167–171. doi: 10.1017/S0016756822000875
39
LamsdellJ. C.McKenzieS. C. (2015). Tachypleus Syriacus (Woodward)—a sexually dimorphic Cretaceous crown limulid reveals underestimated horseshoe crab divergence times. Organisms Diversity Evol.15, 681–693. doi: 10.1007/s13127-015-0229-3
40
LamsdellJ. C.SeldenP. A. (2013). Babes in the wood–a unique window into sea scorpion ontogeny. BMC Evolutionary Biol.13, 1–46. doi: 10.1186/1471-2148-13-98
41
LewisP. O. (2001). A likelihood approach to estimating phylogeny from discrete morphological character data. Systematic Biol.50, 913–925. doi: 10.1080/106351501753462876
42
Lozano-FernandezJ.TannerA. R.PuttickM. N.VintherJ.EdgecombeG. D.PisaniD. (2020). A Cambrian–Ordovician terrestrialization of arachnids. Front. Genet.182. doi: 10.3389/fgene.2020.00182
43
LustriL.LaiblL.BicknellR. D. (2021). A revision of Prolimulus woodwardi Fritsch 1899 with comparison to other highly paedomorphic belinurids. PeerJ9, e10980. doi: 10.7717/peerj.10980
44
MinelliA.BoxshallG.FuscoG. (2016). Arthropod biology and evolution (Berlin Heidelberg: Springer-Verlag).
45
NaugolnykhS. V.BicknellR. D. (2022). Ecology, morphology and ontogeny of Paleolimulus kunguricus—a horseshoe crab from the Kungurian (Cisuralian) of the Cis-Urals, Russia. LETHAIA55, 1–13. doi: 10.1111/let.12451
46
ParadisE.SchliepK. (2019). ape 5.0: an environment for modern phylogenetics and evolutionary analyses in R. Bioinformatics35(3), 526–528.
47
PickettJ. W. (1984). A new freshwater Limuloid from the Middle Triassic of the New South Wales. Palaeontology27 (3), 609–621.
48
RacheboeufP. R.VannierJ.AndersonL. I. (2002). A new three-dimensionally preserved xiphosuran chelicerate from the Montceau-Les-Mines Lagerstätte (Carboniferous, France). Palaeontology45, 125–147. doi: 10.1111/1475-4983.00230
49
RevellL. J. (2012). phytools: an R package for phylogenetic comparative biology (and other things). Methods Ecol. Evol. (2), 217–223.
50
RiekE. F. (1955). A new xiphosuran from the Triassic sediments at Brookvale. New South Wales. Records Aust. Museum23 (5), 281–282. doi: 10.3853/j.0067-1975.23.1955.637
51
RudkinD.YoungG. (2009). “Horseshoe crabs–an ancient ancestry revealed,” in Biology and conservation of horseshoe crabs, vol. 25-44. (New York: Springer), Custom 7.
52
RudkinD. M.YoungG. A.NowlanG. S. (2008). The oldest horseshoe crab: a new xiphosurid from Late Ordovician Konservat-Lagerstätten deposits, Manitoba, Canada. Palaeontology51, 1–9. doi: 10.1111/j.1475-4983.2007.00746.x
53
RuebenstahlA.CiurcaJ. S.J.BriggsD. E. (2021). A giant Eurypterus from the silurian (Pridoli) bertie group of North America. Bull. Peabody Museum Natural History62, 3–13.
54
SchollG. (1977). Beiträge zur Embryonalentwicklung von Limulus polyphemus L.(Chelicerata, Xiphosura). Zoomorphologie86, 99–154. doi: 10.1007/BF00995521
55
SchultkaS. (2000). Zur Palökologie der Euproopiden im Nordwestdeutschen Oberkarbon. Fossil Rec.3, 87–98. doi: 10.5194/fr-3-87-2000
56
SekiguchiK.SeshimoH.SugitaH. (1988). Post-embryonic development of the horseshoe crab. Biol. Bull.174, 337–345. doi: 10.2307/1541959
57
ShusterJ. C. N.SekiguchiK. (2003). Growing up takes about ten years and eighteen stages. In: ShusterC. N.JrBarlowR. B.BrockmannH. J., eds. The American Horseshoe Crab, Harvard University Press, Cambridge, pp. 103–132.
58
SimpsonG. G. (1944). Tempo and mode in evolution (New York: Columbia University Press).
59
StoermerL. (1952). Phylogeny and taxonomy of fossil horseshoe crabs. J. Paleontology26, 630–640.
60
TashmanJ. N.FeldmannR. M.SchweitzerC. E. (2019). Morphological variation in the Pennsylvanian horseshoe crab Euproops danae (Meek & Worthen 1865)(Xiphosurida, Euproopidae) from the lower Mercer Shale, Windber, Pennsylvania, USA. J. Crustacean Biol.39, 396–406. doi: 10.1093/jcbiol/ruz030
61
TëmkinI.EldredgeN. (2015). “Networks and hierarchies: Approaching complexity in evolutionary theory,” in Macroevolution, vol. 183-226. (Switzerland: Springer International Publishing), Custom 7.
62
van RoyP.BriggsD. E.GainesR. R. (2015). The Fezouata fossils of Morocco; an extraordinary record of marine life in the Early Ordovician. J. Geological Soc.172, 541–549. doi: 10.1144/jgs2015-017
Summary
Keywords
Euchelicerata, Xiphosura, stasis, ontogeny, evolutionary rate, ancestral state
Citation
Lustri L, Antcliffe JB, Saleh F, Haug C, Laibl L, Garwood RJ, Haug JT and Daley AC (2023) New perspectives on the evolutionary history of xiphosuran development through comparison with other fossil euchelicerates. Front. Ecol. Evol. 11:1270429. doi: 10.3389/fevo.2023.1270429
Received
31 July 2023
Accepted
30 August 2023
Published
03 October 2023
Volume
11 - 2023
Edited by
Sylvain Charbonnier, Muséum National d’Histoire Naturelle, France
Reviewed by
Paul Antony Selden, University of Kansas, United States; James Lamsdell, West Virginia University, United States
Updates
Copyright
© 2023 Lustri, Antcliffe, Saleh, Haug, Laibl, Garwood, Haug and Daley.
This is an open-access article distributed under the terms of the Creative Commons Attribution License (CC BY). The use, distribution or reproduction in other forums is permitted, provided the original author(s) and the copyright owner(s) are credited and that the original publication in this journal is cited, in accordance with accepted academic practice. No use, distribution or reproduction is permitted which does not comply with these terms.
*Correspondence: Lorenzo Lustri, lorenzo.lustri90@gmail.com; Allison C. Daley, allison.daley@unil.ch
Disclaimer
All claims expressed in this article are solely those of the authors and do not necessarily represent those of their affiliated organizations, or those of the publisher, the editors and the reviewers. Any product that may be evaluated in this article or claim that may be made by its manufacturer is not guaranteed or endorsed by the publisher.