 Marion Chatelain
 Johannes Rüdisser
 Michael Traugott1
- 1Department of Zoology, University of Innsbruck, Innsbruck, Austria
- 2Department of Ecology, University of Innsbruck, Innsbruck, Austria
Habitat loss and fragmentation caused by land-use changes in urbanised landscapes are main drivers of biodiversity loss and changes in species assemblages. While the effects of urbanisation on arthropods has received increasing attention in the last decade, most of the studies were taxon-specific, limited in time and/or covering only part of the habitats along the rural-urban gradient. To comprehensively assess the effects of urbanisation on arthropod communities, here, we sampled arthropods at 180 sites within an urban mosaic in the city of Innsbruck (Austria) using a systematic grid. At each site, arthropods were collected in three micro-habitats: the canopy, the bush layer and tree bark. They were identified to the family, infra-order or order level, depending on the taxonomic group. Urbanisation level was estimated by five different proxies extracted from land use/land cover data (e.g., impervious surface cover), all of them calculated in a 100, 500, and 1,000 m radius around the sampling points, and three indexes based on distance to settlements. We tested for the effects of different levels of urbanisation on (i) overall arthropod abundance, richness and diversity and (ii) community composition using redundancy analyses. In the canopy and the bush layer, arthropod richness and diversity decreased with increasing urbanisation level, suggesting that urbanisation acts as a filter on taxonomic groups. Our data on arthropod abundance further support this hypothesis and suggest that urbanisation disfavours wingless groups, particularly so on trees. Indeed, urbanisation was correlated to lower abundances of spiders and springtails, but higher abundances of aphids, barklice and flies. Arthropod community composition was better explained by a set of urbanisation proxies, especially impervious surface cover measured in a 100, 500, and 1,000 m radius. Arthropods are key elements of food webs and their availability in urban environments is expected to have bottom-up effects, thus shaping foraging behaviour, distribution, and/or success of species at higher trophic levels. Studying ecological networks in urban ecosystems is the next step that will allow to understand how urbanisation alters biodiversity.
1. Introduction
Across Europe today, urban areas cover 17% of land surface and are home to 75% of the human population (Eurostat, OECD). Urbanisation is one of the major drivers of environmental changes (Grimm et al., 2008), and so understanding urban ecosystems is of great importance to scientists, citizens, and urban planners. Therefore, numerous studies already aimed at measuring the effects of urbanisation on wildlife, including terrestrial insects (Fenoglio et al., 2020). Yet, previous studies found contradicting effects of urbanisation on arthropod richness and abundance (Bang and Faeth, 2011; Faeth et al., 2011; Lowe et al., 2016; Fenoglio et al., 2020; Piano et al., 2020). Importantly, the effects of urbanisation are taxon-specific, and the taxa identified as responding more strongly to urbanisation vary between studies (Bang and Faeth, 2011; Faeth et al., 2011; Fenoglio et al., 2020; Piano et al., 2020).
Four main reasons explain such disparities; first, previous studies focussed on different taxonomic groups: a recent meta-analysis revealed that 83% of the publications focussed on insects, especially Hymenoptera and Coleoptera, while other arthropod groups were underrepresented (Fenoglio et al., 2020). Yet, only by measuring the variations in arthropod community composition along the rural-urban continuum will we be able to identify the taxonomic groups that respond (positively or negatively) to urbanisation, and understand the environmental filters that shape arthropod communities. For instance, habitats in urban cores are often characterised by low vegetation cover, elevated temperatures, high levels of chemical and light pollution and poor water quality; they are disconnected from each other, and are dominated by non-native plant species (Grimm et al., 2008). As a consequence, environmental conditions in highly urbanised areas are expected to favour generalist species with broad diets, good dispersal capacities and high tolerance for heat and diverse pollutants (Burkman and Gardiner, 2014; Fenoglio et al., 2021; Langellotto and Hall, 2021).
Second, depending on the study, arthropods were sampled in different micro-habitats (e.g., ground, air, branches of shrubs or trees) and using different sampling designs and methods: in their review, Faeth and co-authors highlighted that urbanisation has varying definitions among researchers, meaning that “urbanisation” as the explanatory variable differs among studies (Faeth et al., 2011). The fact that urbanisation is defined and measured in different ways is a major problem in urban ecology (Rivkin et al., 2019; Santangelo et al., 2020; Szulkin et al., 2020). More specifically, while urban landscapes are heterogeneous and fragmented three-dimensional mosaics of a variety of habitat types (e.g., urban parks, forest remnants, dense residential areas with multi-storey houses, green residential areas with single-family homes, etc.) (McDonnell and Pickett, 1990), most studies focussing on wildlife ecology in the urban space have used a simplified urban ecology framework that often fails to account for the multiple and contrasted urban habitat types contributing to the urban mosaic (Szulkin et al., 2020). This prevents us from establishing conclusions about the effects of urbanization on wildlife per se, and drawing general conclusions about the impact of urbanisation on the biology of wild organisms at global scale.
Third, studies that looked at the variation in arthropod community composition in response to a continuous level of urbanisation used different metrics to compute an urbanisation level index (e.g., the percentage of impervious surface cover, the distance to the city centre, etc.). Besides the fact that the use of different metrics makes it difficult to compare results between studies, the relevance of these different metrics was never compared.
Fourth, most studies of urbanisation effects on arthropod communities were relatively short-term and covered one season only (Fenoglio et al., 2020). Yet, the effects of urbanisation on arthropods are likely to be season-specific. For instance, the urban heat island phenomenon is responsible for the advancement of spring blooming and for the earlier emergence of some pollinators in towns compared to adjacent rural areas (Mimet et al., 2009; Miles et al., 2019). This may result in an increase in arthropod abundance and richness along the rural-urban gradient in spring. However, the same phenomenon may have the reverse effect in summer, when temperatures may exceed the thermal tolerance of some arthropods (Biella et al., 2022). Season-specific effects may also arise from artificial light at night (ALAN) overriding the seasonal changes in day length. For instance, ALAN was shown to delay or event prevent diapause in the flesh fly, and extend butterfly flight season in Finnish cities (Merckx et al., 2021; Mukai et al., 2021).
All in all, measuring arthropod community variations within the urban mosaic, over the seasons, and in different micro-habitats is needed to obtain an overall picture of the effects of urbanisation on arthropods, their occurrence, dynamics and phenology. Because arthropods are preyed upon by many animals such as insectivorous birds, this information is also crucial for studying bottom-up effects and their implications for predator diversity and abundance (Dresner and Moldenke, 2017; Planillo et al., 2020).
This study is part of a larger project aiming at understanding the effects of urbanisation on food availability, diet and movements of great tits (Parus major) and blue tits (Cyanistes caeruleus). Therefore, we measured arthropod overall abundance, richness and diversity, as well as taxonomic composition, in the main foraging grounds of these two species, namely the canopy, the bush layer and on tree bark. Arthropod communities were examined at 180 different locations, altogether covering the entire urban gradient of Innsbruck (Austria), and during several time points across one full year. Importantly, each site was characterised by a total of 18 indexes of urbanisation level calculated from fine-scale and high-resolution remote sensing data. These indexes were computed from different land use/land cover classes measured at three different spatial scales (in a 100, 500, and 1,000 m radius area). This study addresses two questions:
(1) How does arthropod community composition in bushes and trees vary within the urban mosaic over the seasons?
(2) How well do different urbanisation indices explain variations in arthropod community composition, abundance and richness?
2. Materials and methods
2.1. Study sites
The study was carried out within a 56.5 km2 area including the populated area of Innsbruck (Austria) and its surroundings (approximately 47°13N, 11°19E–47°17N, 11°26E; elevation ranged from 574 to 1,024 m; Figure 1). Innsbruck has a continental climate with cold and dry winters (average min −11°C, average max 4°C, average total precipitations/month 88 mm as rain and snow), warm and wet summers (average min 3°C, average max 21°C, average total precipitations/month 192 mm) (World Weather Online, 2022). With its 104.9 km2 and 131,500 habitants, Innsbruck is a small to medium size city, as the majority of cities in Europe (Nabielek et al., 2016). The city is a mosaic of buildings and concrete areas (i.e., commercial, residential and industrial areas), urban parks (e.g., Innsbruck Hofgarten, Rapoldi Park) and urban corridors (e.g., along the Inn river that crosses the city). Its woody vegetation is diverse and includes maples, beeches, birches, spruces, pines, plane trees, oaks, walnut trees, horse chestnuts, poplars, dogwoods, apple trees, sherry trees, plum trees, thuyas, etc. Innsbruck is surrounded by villages (e.g., Axams, Natters, Aldrans), coniferous and mixed-forests (dominated by beech, oaks, firs, larches and pines), agricultural land and natural areas, including the 727 km2 Karwendel Natural Park. There characteristics result in a pronounced gradient from urban to natural or near-natural landscapes. Such a patchy landscape offers an ideal research site to understand urban ecosystems. The 56.5 km2 grid was divided into 320 cells of 500 m × 500 m. Each cell centroid was considered as a potential sampling site. Out of these 320 potential sites, 180 were finally selected in a way to (i) cover the urbanisation gradient range and (ii) assure sampling feasibility (sites located on the airport ground, in large agricultural or concrete areas without trees were excluded).
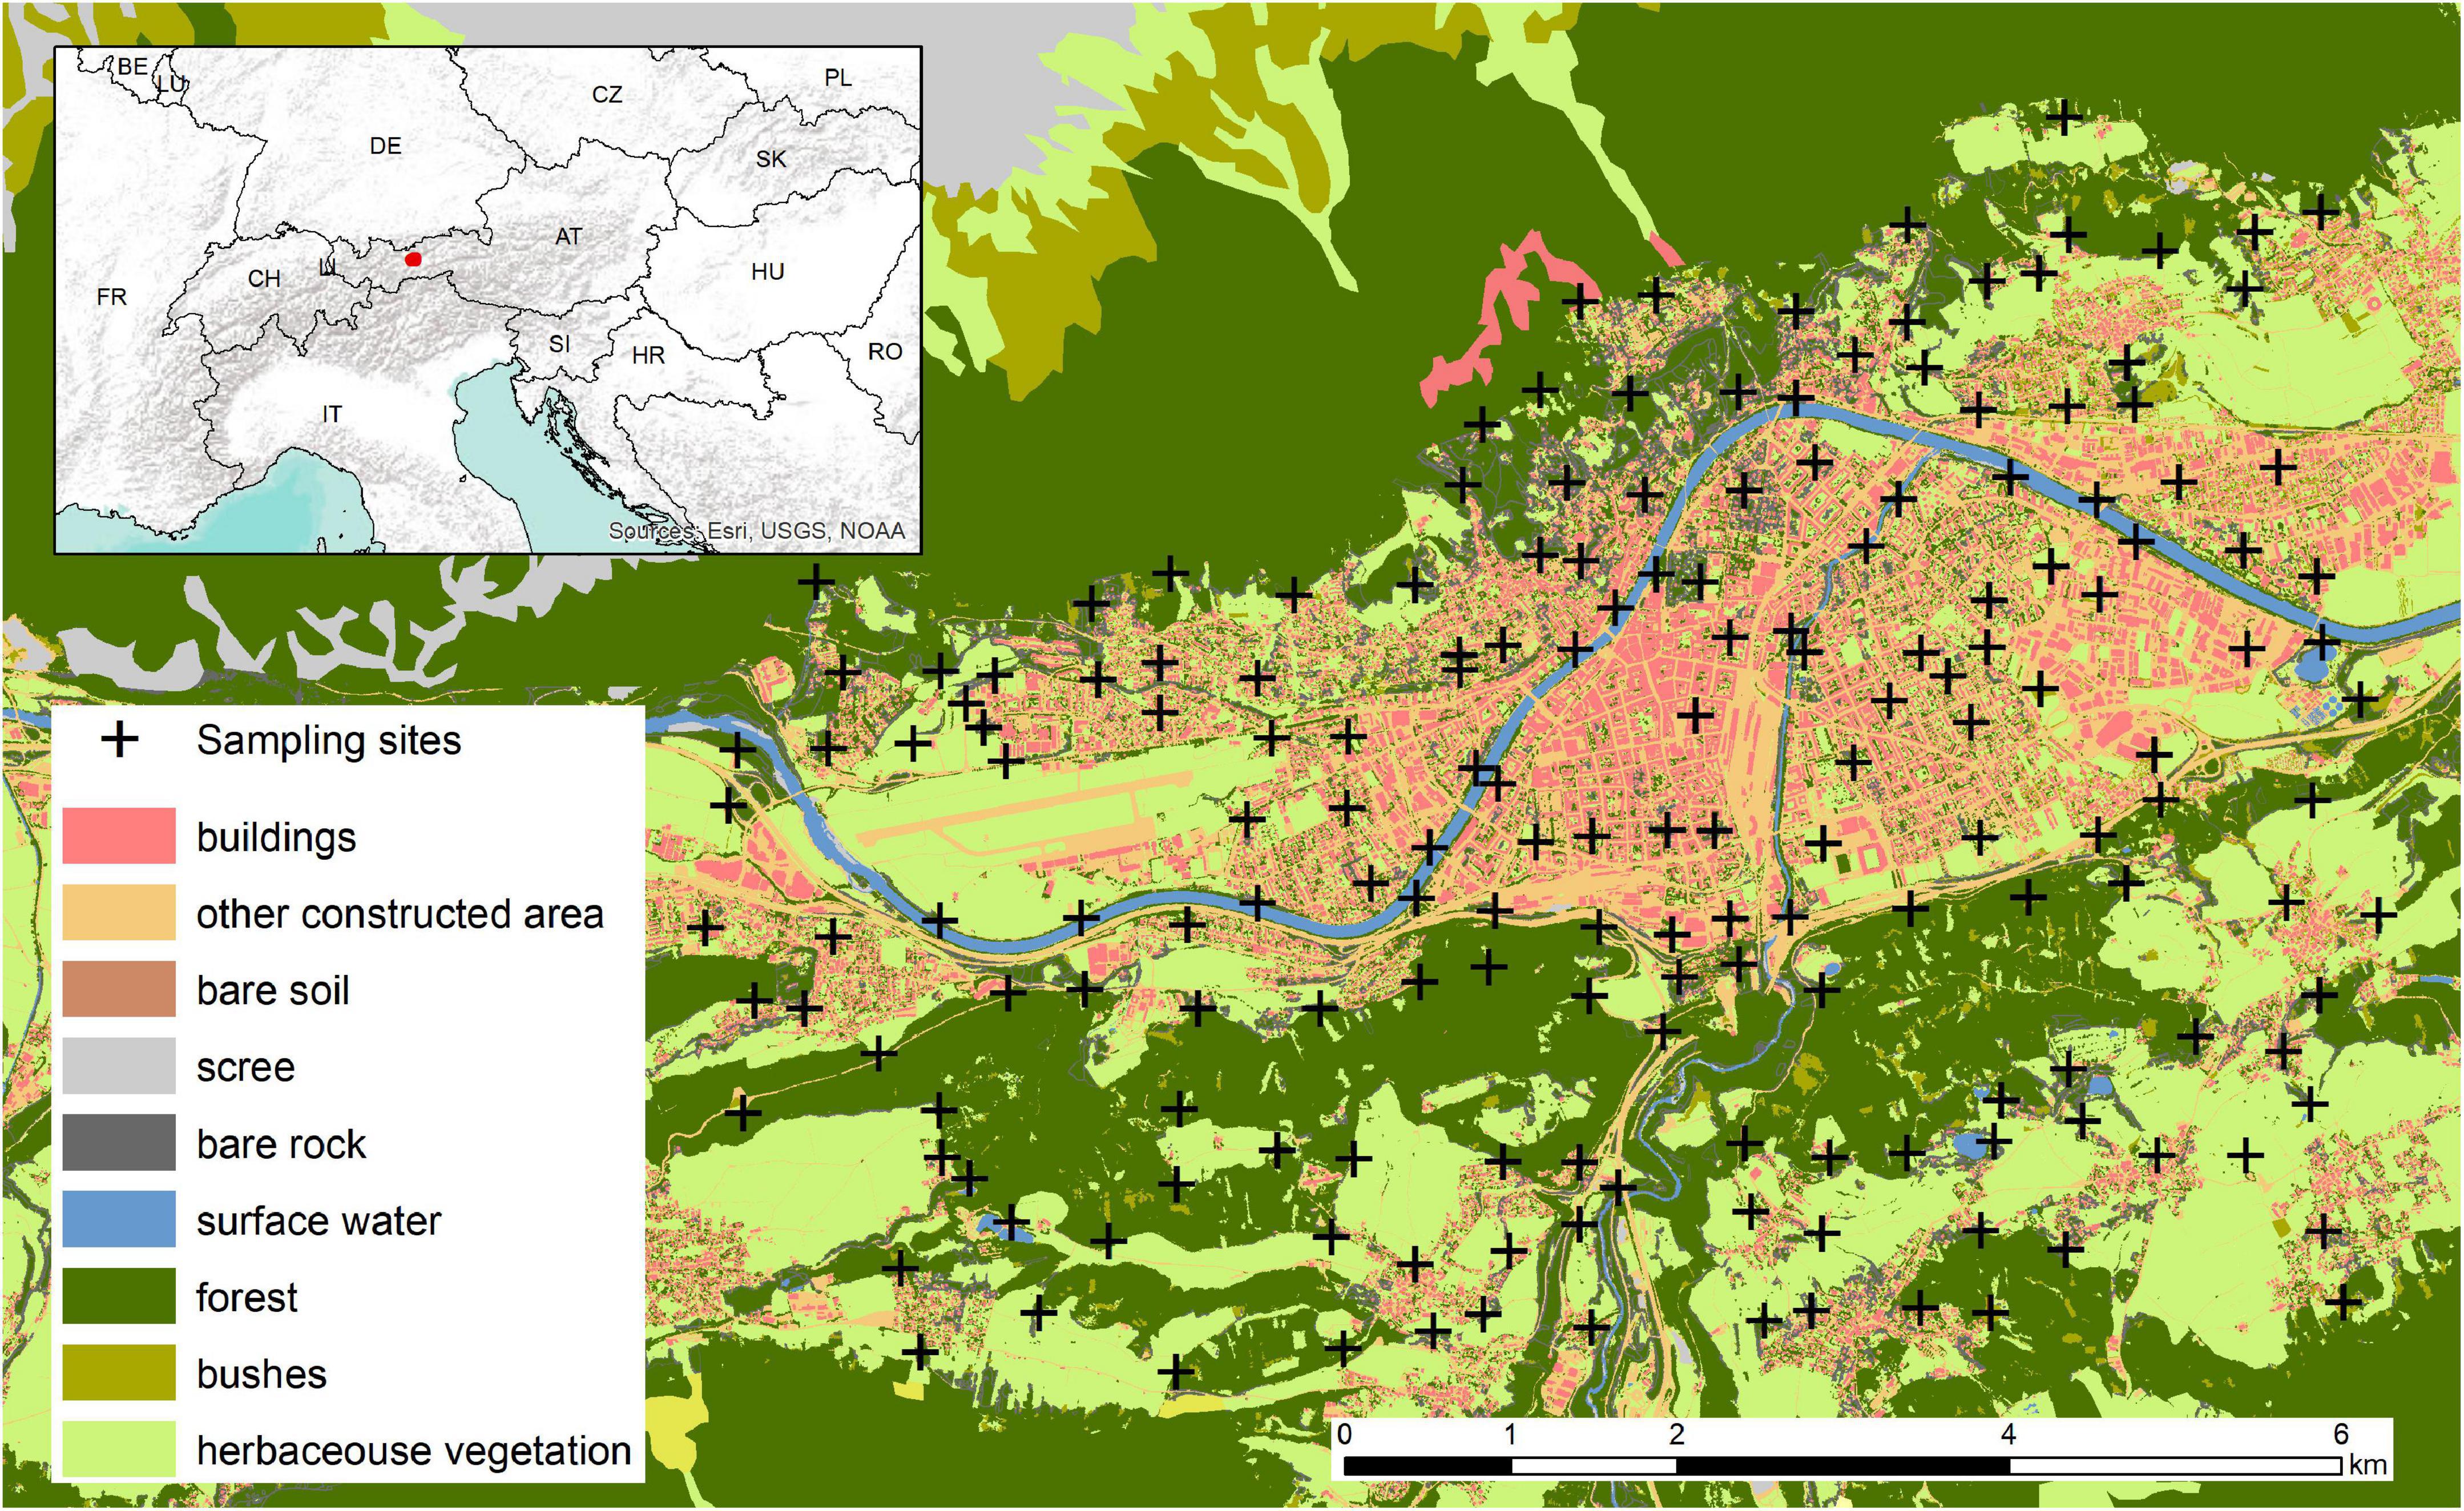
Figure 1. Location of Innsbruck within Europe and overview of the 180 sites in Innsbruck and its surroundings where arthropods were sampled from October 2020 to August 2021. The map highlights the land cover in the sampling area extracted from the Land Information System Austria.
2.2. Urbanisation level quantification
We estimated the percent area of distinct land use/land cover (LULC) classes as well as the average value of the composite landscape index “distance to nature” (D2N), within 100, 500, and 1,000 m radii around each sampling site. LULC data was derived from the Land Information System Austria (LISA) which provides a detailed vector-based dataset for the study area with 13 LC classes (Banko et al., 2014). From these data, we computed four indexes of urbanisation levels: percent of impervious surface cover, vegetation cover (i.e., the percentage of land covered with trees, shrubs, or herbs), high vegetation cover (i.e., the percentage of land covered with trees) and mid-high vegetation cover (i.e., the percentage of land covered with trees or shrubs). In addition, we calculated D2N to quantify the anthropogenic influence on a given site by considering the degree of naturalness of a location as well as the distance to the next natural habitat patch (Rüdisser et al., 2012). Finally, we calculated the distance between each sampling site and (i) Innsbruck city centre (47°16′2″N, 11°23′34″E), (ii) the closest neighbourhood (defined as a group of a minimum of five residential buildings), and (iii) the closest house (or other residential building) using Google maps. This means that each 180 site has been characterised by 18 different indexes of urbanisation level (Figure 2). In addition, we categorised the high vegetation cover of each site as either mainly deciduous, mainly coniferous (when 70% of the high vegetation cover was composed of broadleaf trees or coniferous trees, respectively) or mixed.
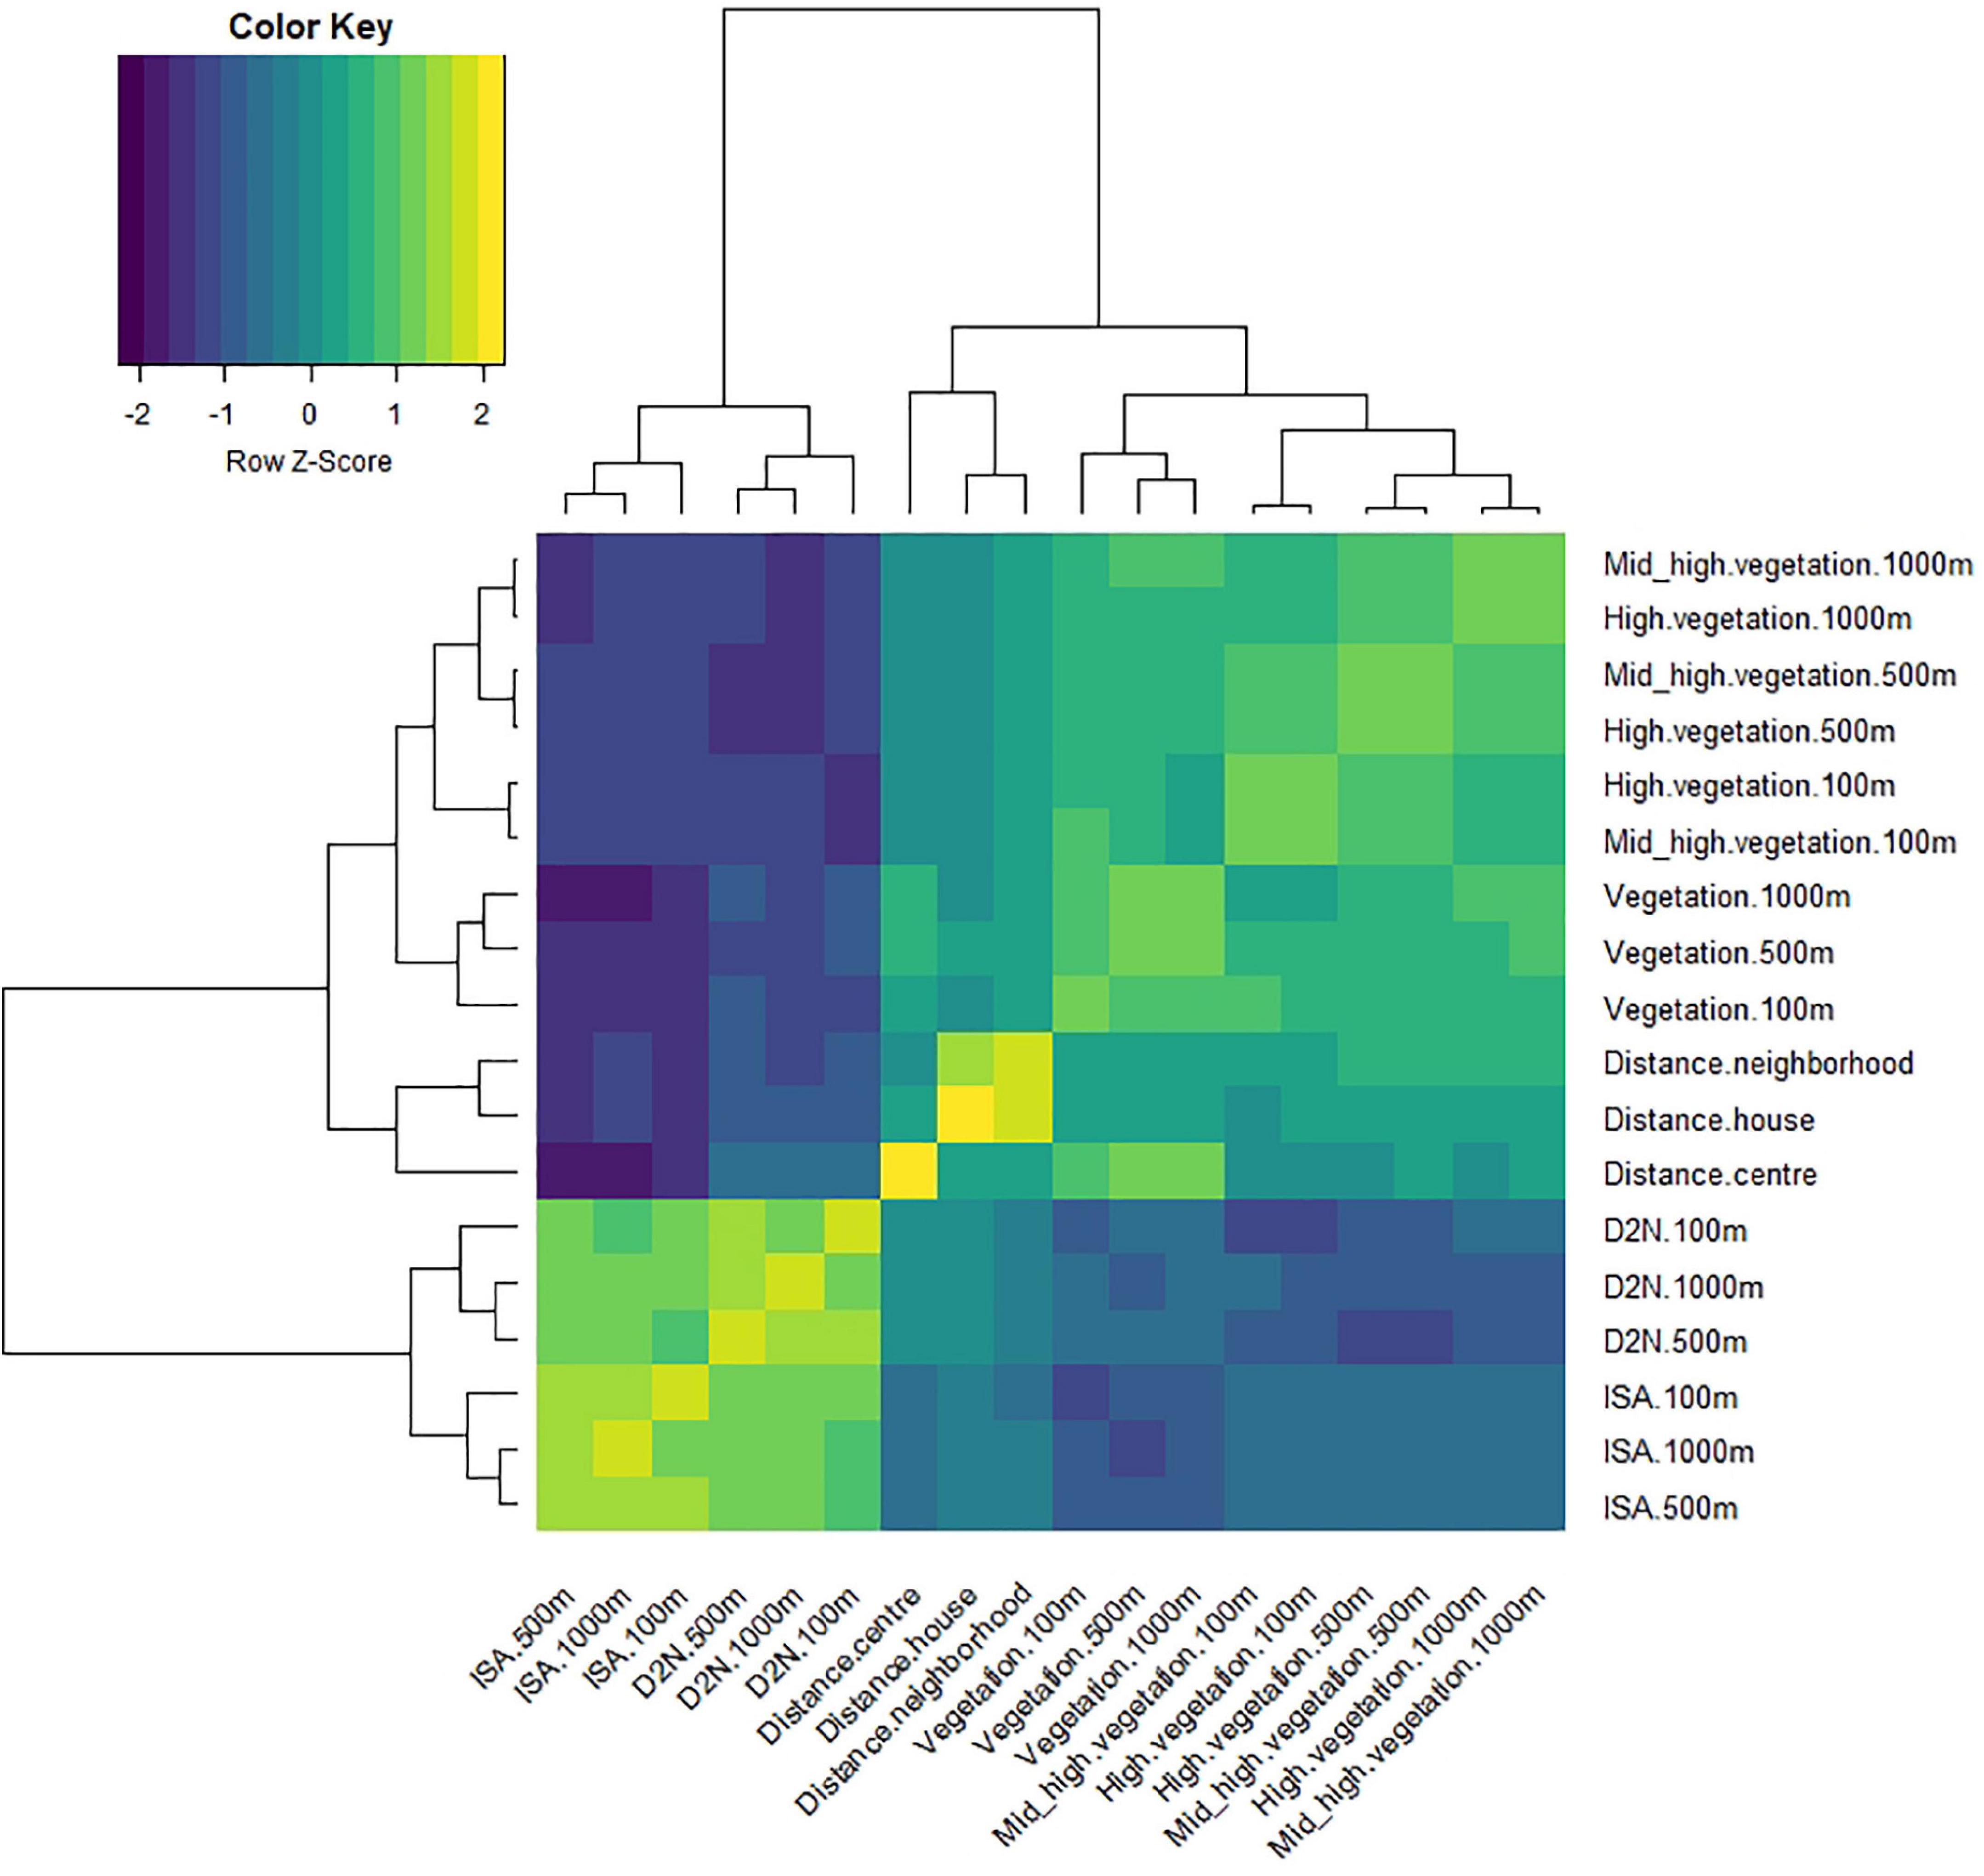
Figure 2. Heatmap of the correlations between each pair of environmental variables. Positive and negative correlations are in yellow and blue, respectively. The strength of the correlations is reflected by the intensity of the yellow or blue colouration. The dendrogram shows how the variables are clustered. The heatmap was created with the “heatmap.2” function from “gplots” in R software (version 4.1.2) (Warnes et al., 2022).
2.3. Arthropod sampling and identification
Arthropods were sampled every other month during one year from October 2020 to August 2021. Temperatures during the time of the study were normal, but average rainfall was particularly high in December 2020 (176.3 mm, mostly as snow) compared to previous years (World Weather Online, 2022). There was snowfall from early-December 2020 to mid-April 2021. Each of the six sampling sessions lasted 10 days and arthropods were sampled at three new sites per day, from 8 am to 2 pm. In total, 180 sites (30 sites per sampling session) were visited once during the study. The 30 sites within each session were selected in a way to representatively cover the sampling grid and the urbanisation gradient. At each sampling site, five trees and five bushes were selected. Arthropods in the canopy and the bush layer were sampled using the branch beating method (two branches per tree and bush were beaten five times above an entomologist umbrella). In addition, arthropods on tree bark (from the ground to 1.5 m high) were sampled using a vacuum. Arthropods were stored in 80% ethanol until identification. All the individuals were identified to the family level, except the following taxonomic groups, that were identified to the lowest taxonomic level as possible. The order of Diptera was sorted into the two suborders Nematocera and Brachycera. Hymenoptera was sorted into the paraphyletic infraorder Parasitica, the suborder Symphyta and the family Formicidae. The subclass of Acari and the order of Collembola were sorted to order level. All the Araneae were identified to the family level, except for Thomisidae and Philodromidae that were pooled together and classified as crab spiders. The number of individuals per taxonomic group was counted. Because of the high number of springtails (Collembola), the abundance was estimated by measuring the volume of the tube filled with individuals. While such method may be biased in case springtail size differs along the rural-urban gradient, the fact that our analyses on springtail occurrence and abundance provide similar results (see section 3.4 and Supplementary Appendix E) suggests that such a bias is unlikely to change our conclusions.
2.4. Statistical analyses
Statistical analyses were performed using R software (version 4.1.2). Arthropod abundance (the total number of individuals), richness (the number of different taxonomic groups) and diversity (the Shannon diversity index) were compared using linear models with abundance (after log-transformation), richness or diversity as the response variable, and urbanisation level (computed as either impervious surface cover, vegetation cover, high vegetation cover, mid-high vegetation cover at a 100, 500, or 1,000 m radius around the sampling point) as the explanatory variable. Because we expected urbanisation to have different effects on arthropod communities in different seasons and micro-habitats, the month (i.e., October, December, February, April, June, and August), the micro-habitat (i.e., the canopy, the bush layer, and tree bark), their interaction as well as their interactions with the urbanisation level were added as explanatory variables. For each model, we performed a backward stepwise selection using the AIC (Sakamoto et al., 1986). A Type III Wald Chi-square test Anova was used to determine the significance of retained variables in the final models. When “month,” “micro-habitat” or their interaction were retained in the models, contrasts among groups were tested using the Tukey’s method for pairwise comparisons of estimated marginal means (“emmeans” function of the “emmeans” package) (Lenth, 2022). When interactions between “urbanisation level” and “month” and/or “micro-habitat” were retained in the models, the association between the response variable and “urbanisation level” was tested for each group using the “emtrends” function of the “emmeans” package (“emtrends” performs t-test adjusted for multiple comparisons for testing that slopes for each level of the factor are not equal to zero). However, because different taxonomic groups were identified to different taxonomic levels (e.g., family, order) and because the taxonomic composition differed between the three micro-habitats (see section 3.4.), comparing arthropod richness and diversity between micro-habitats was not relevant in our study.
Differences in the taxonomic composition of arthropod communities were tested using partial linear constrained ordination methods based on Hellinger distances (pRDA) on log-transformed abundance data and presence-absence data using the “rda” function of the “vegan” package (Oksanen et al., 2020). The global models included the 18 indexes of urbanisation level as well as “month” and “micro-habitat” as constraining variables. Because urbanisation level was associated with the type of high vegetation (i.e., less urbanised sites were more often coniferous forests), the latest was added as conditional variable. First, the significance of the global test was tested. Second, the environmental variables that were the most important to explain the compositional changes were identified by forward selection using the “ordistep” function from “vegan.” The variance explained by the constrained ordination and by each of the components was tested by Monte Carlo permutation test (“anova” function in the package “vegan”). Variation partitioning was calculated using the “rdacca.hp” function of the package of the same name (Lai et al., 2022). The contribution of each selected constraining variable to the components of the ordination was fitted by linear contribution scores using the “envfit” function. The ordination diagrams were created with the “ordiplot” function from “vegan,” which coordinates were extracted for use in “ggplot2” (Wickham, 2016). Because urbanisation indexes shared contribution to the components of the ordination with “month” and “micro-habitat” (see Table 2), the ordination analysis on the full dataset did not allow to clearly measure the effects of urbanisation on the variation in taxonomic composition between sites. For this reason, ordinations were performed (i) per month while adding the micro-habitat as conditional variable and (ii) per micro-habitat while adding the month as conditional variable.
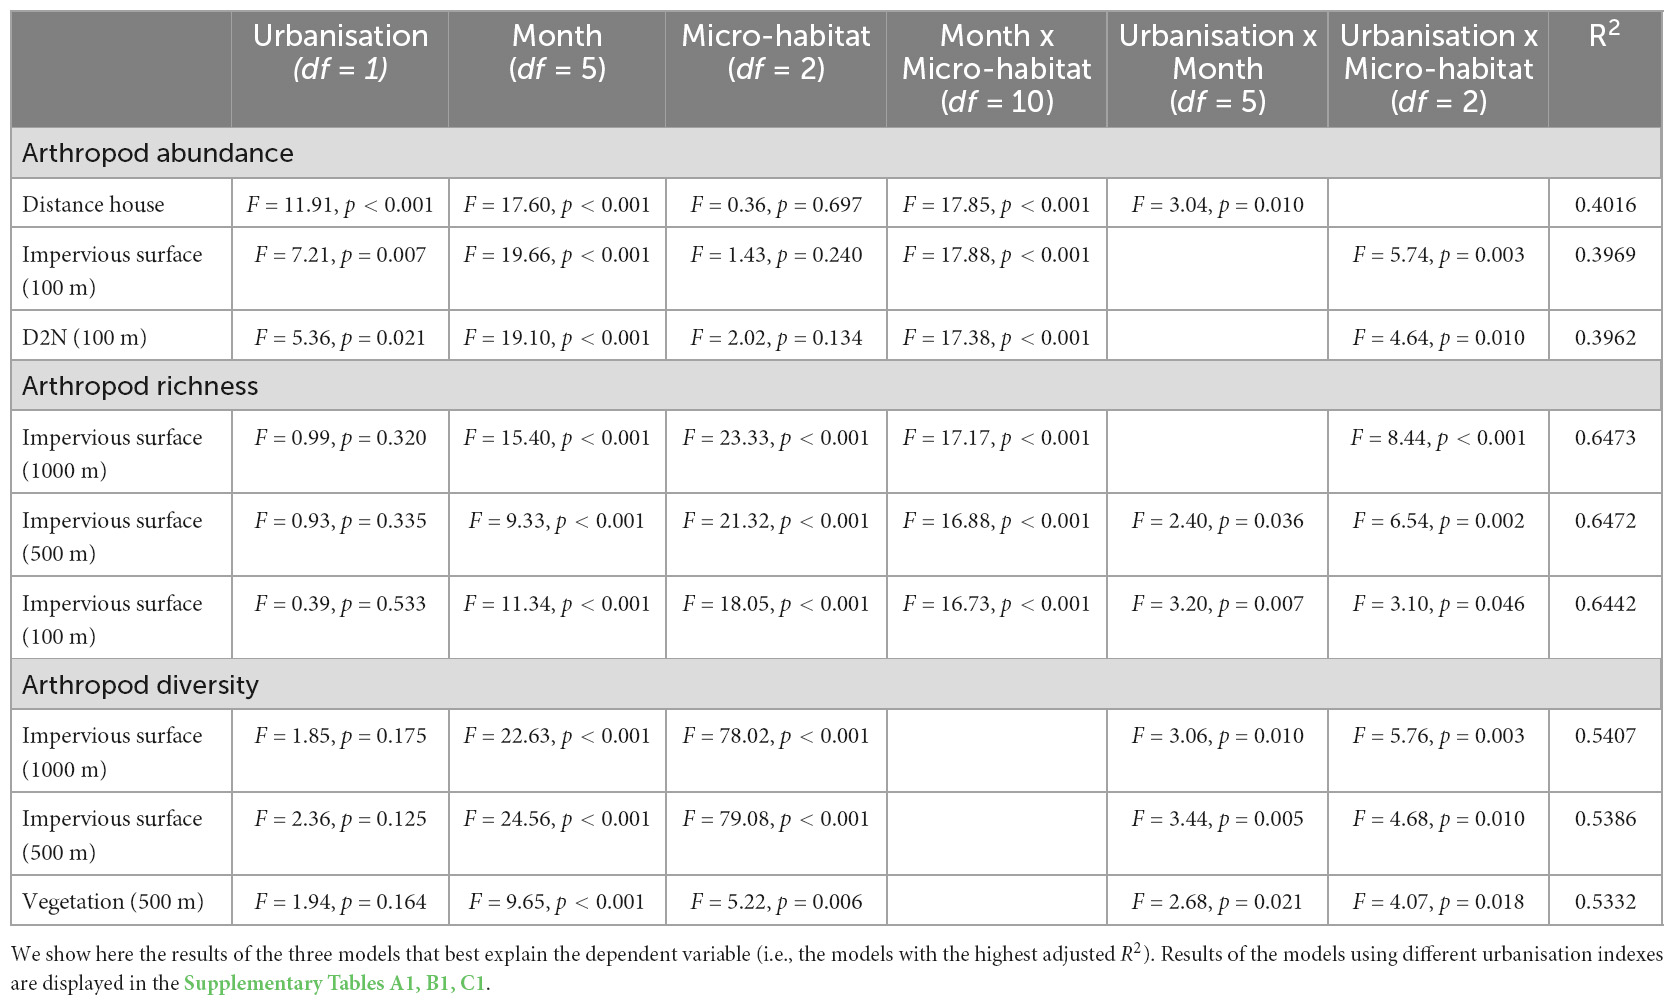
Table 1A. Results of the final models explaining arthropod abundance, richness and diversity (Shannon diversity index) as a response to urbanisation level, the month (i.e., October, December, February, April, June and August), and the micro-habitat (i.e., canopy, bush layer and tree bark).
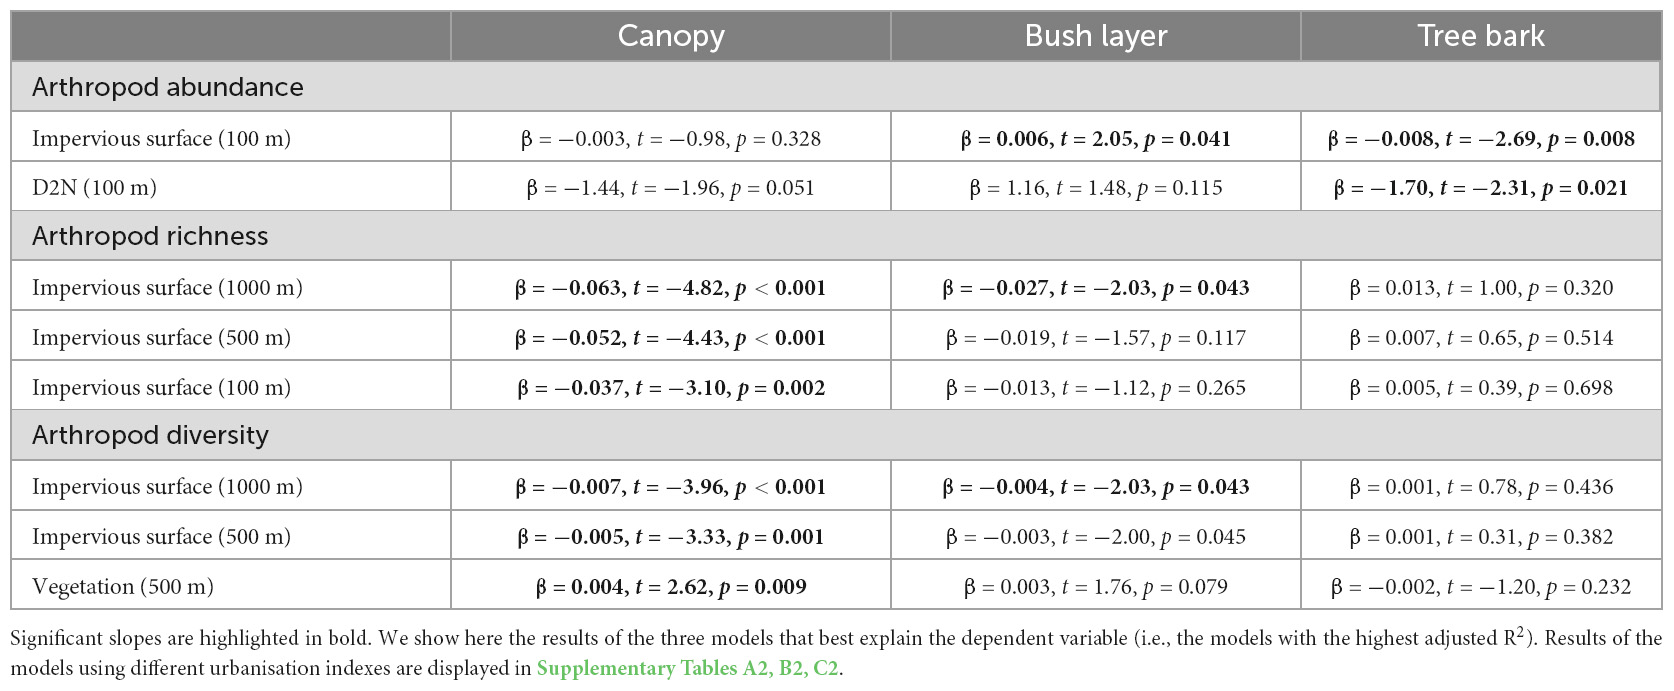
Table 1B. Association between arthropod abundance (log-transformed), richness, or diversity (Shannon diversity index), and the level of urbanisation per micro-habitat (i.e., canopy, bush layer and tree bark).
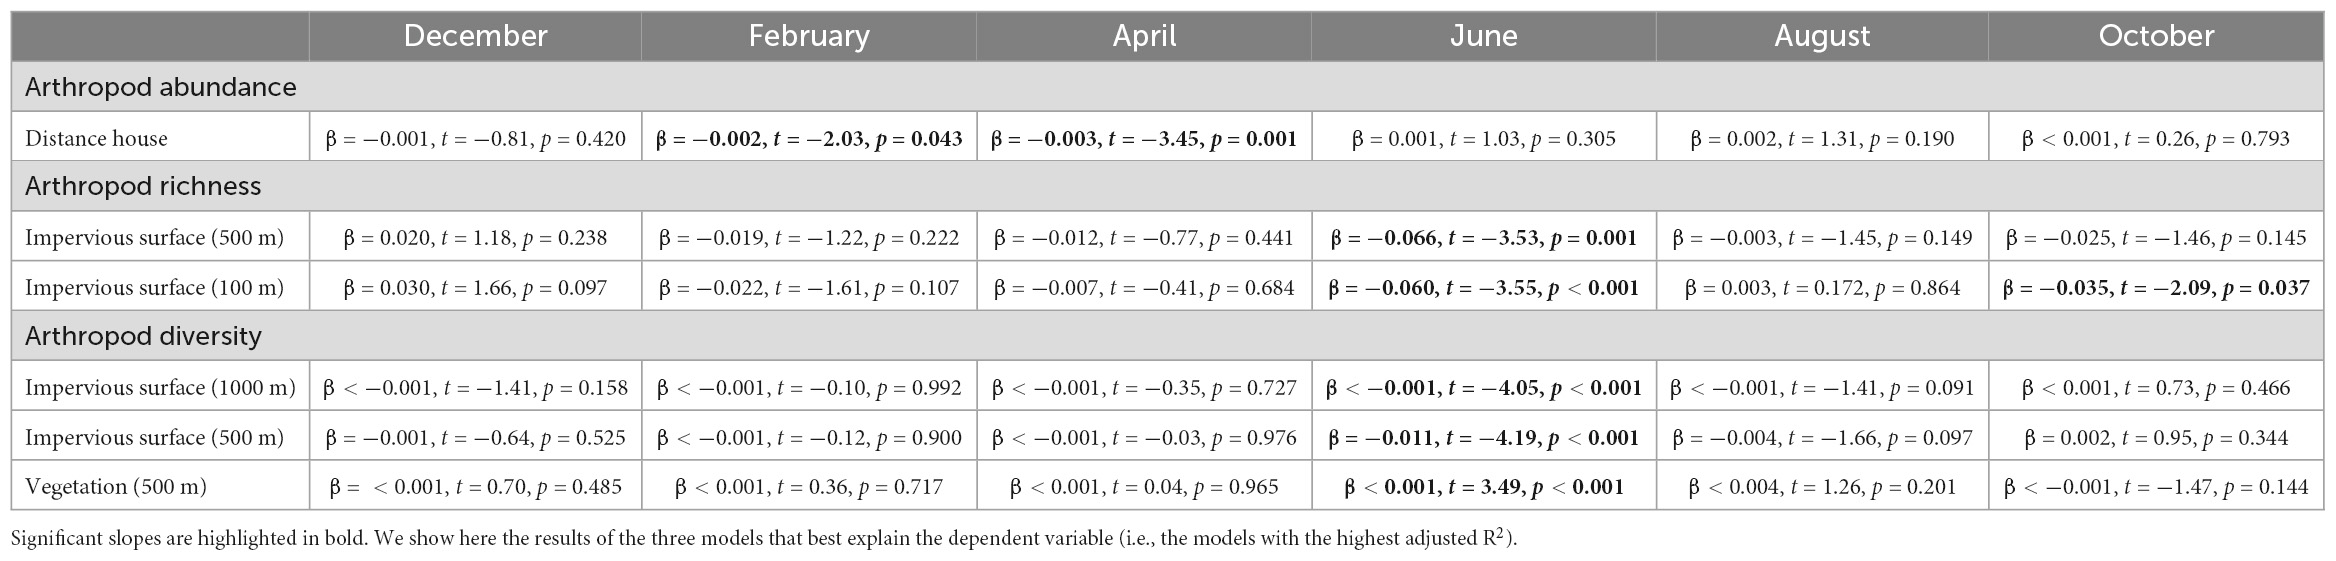
Table 1C. Association between arthropod abundance, richness or diversity (Shannon diversity index), and the level of urbanisation per month (i.e., December, February, April, June, August, and October).
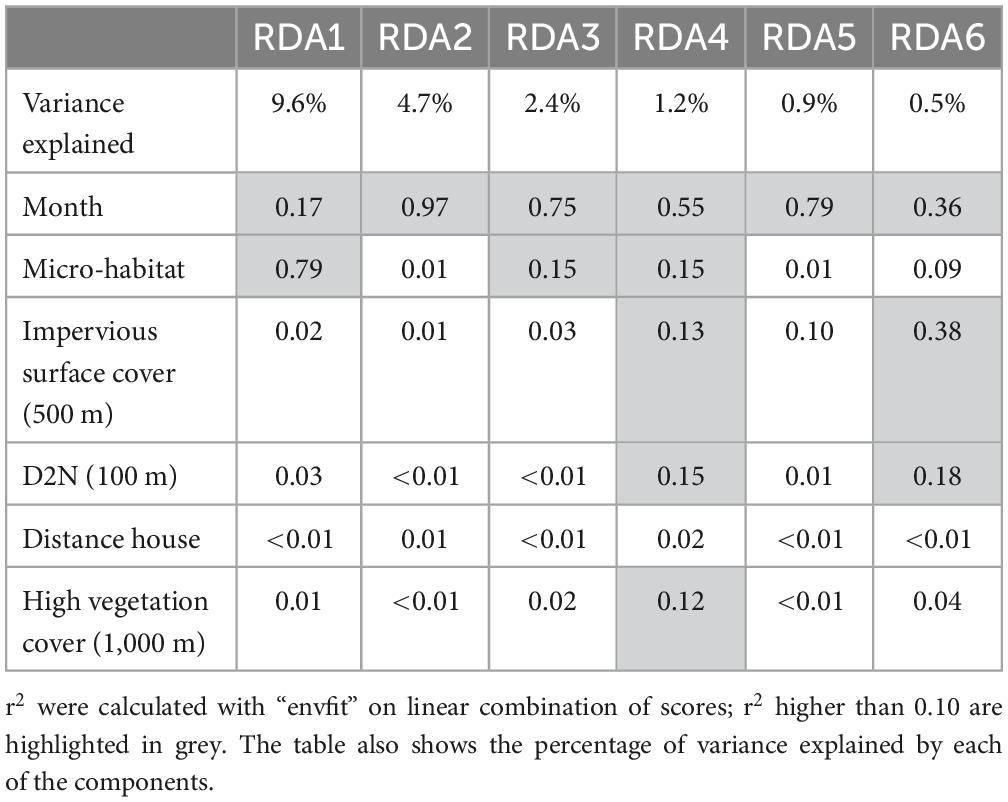
Table 2. Correlation between RDA components and selected explanatory variables.
3. Results
3.1. Arthropod abundance
In 10 out of the 18 models, arthropod abundance was influenced by the interaction between urbanisation level and the micro-habitat (Table 1A): arthropod abundance in the bush layer increased with increased urbanisation level (with increasing impervious surface cover or D2N, or with decreasing high or mid-high vegetation cover) (Table 1B). For instance, as the impervious surface cover in a 100 m radius increased by 10%, arthropod abundance in the bush layer increased by a bit more than six individuals (Figure 3). Indeed, an average of 67 individuals were collected at highly urbanised sites (i.e., at sites for which impervious surface covered more than 45% of the land in a 100 m radius—the 3rd quartile), while only 45 were collected at less urbanised sites (i.e., at sites for which impervious surface covered less than 9% of the land in a 100 m radius—the 1st quartile). On the contrary, the abundance of arthropods on tree bark decreased with increasing urbanisation level, while arthropod abundance in the canopy did not significantly change along the rural-urban gradient (Table 1B). For example, as the impervious surface cover in a 100 m radius increased by 10%, arthropod abundance on tree bark decreased by a bit more than eight individuals (Figure 3). Indeed, an average of 95 individuals were collected at less urbanised sites (i.e., at sites for which impervious surface covered less than 9% of the land in a 100 m radius), while 87 individuals were collected at highly urbanised sites (i.e., at sites for which impervious surface covered more than 45% of the land in a 100 m radius). Moreover, arthropod abundance was influenced by the interaction between distance to the closest house and month (Table 1A): in February and April, arthropod abundance decreased with increasing distance to the closest house (Table 1C). Finally, arthropod abundance varied in response to the month and the micro-habitat (Table 1A); variations in arthropod abundance between months are detailed in Supplementary Appendix A.
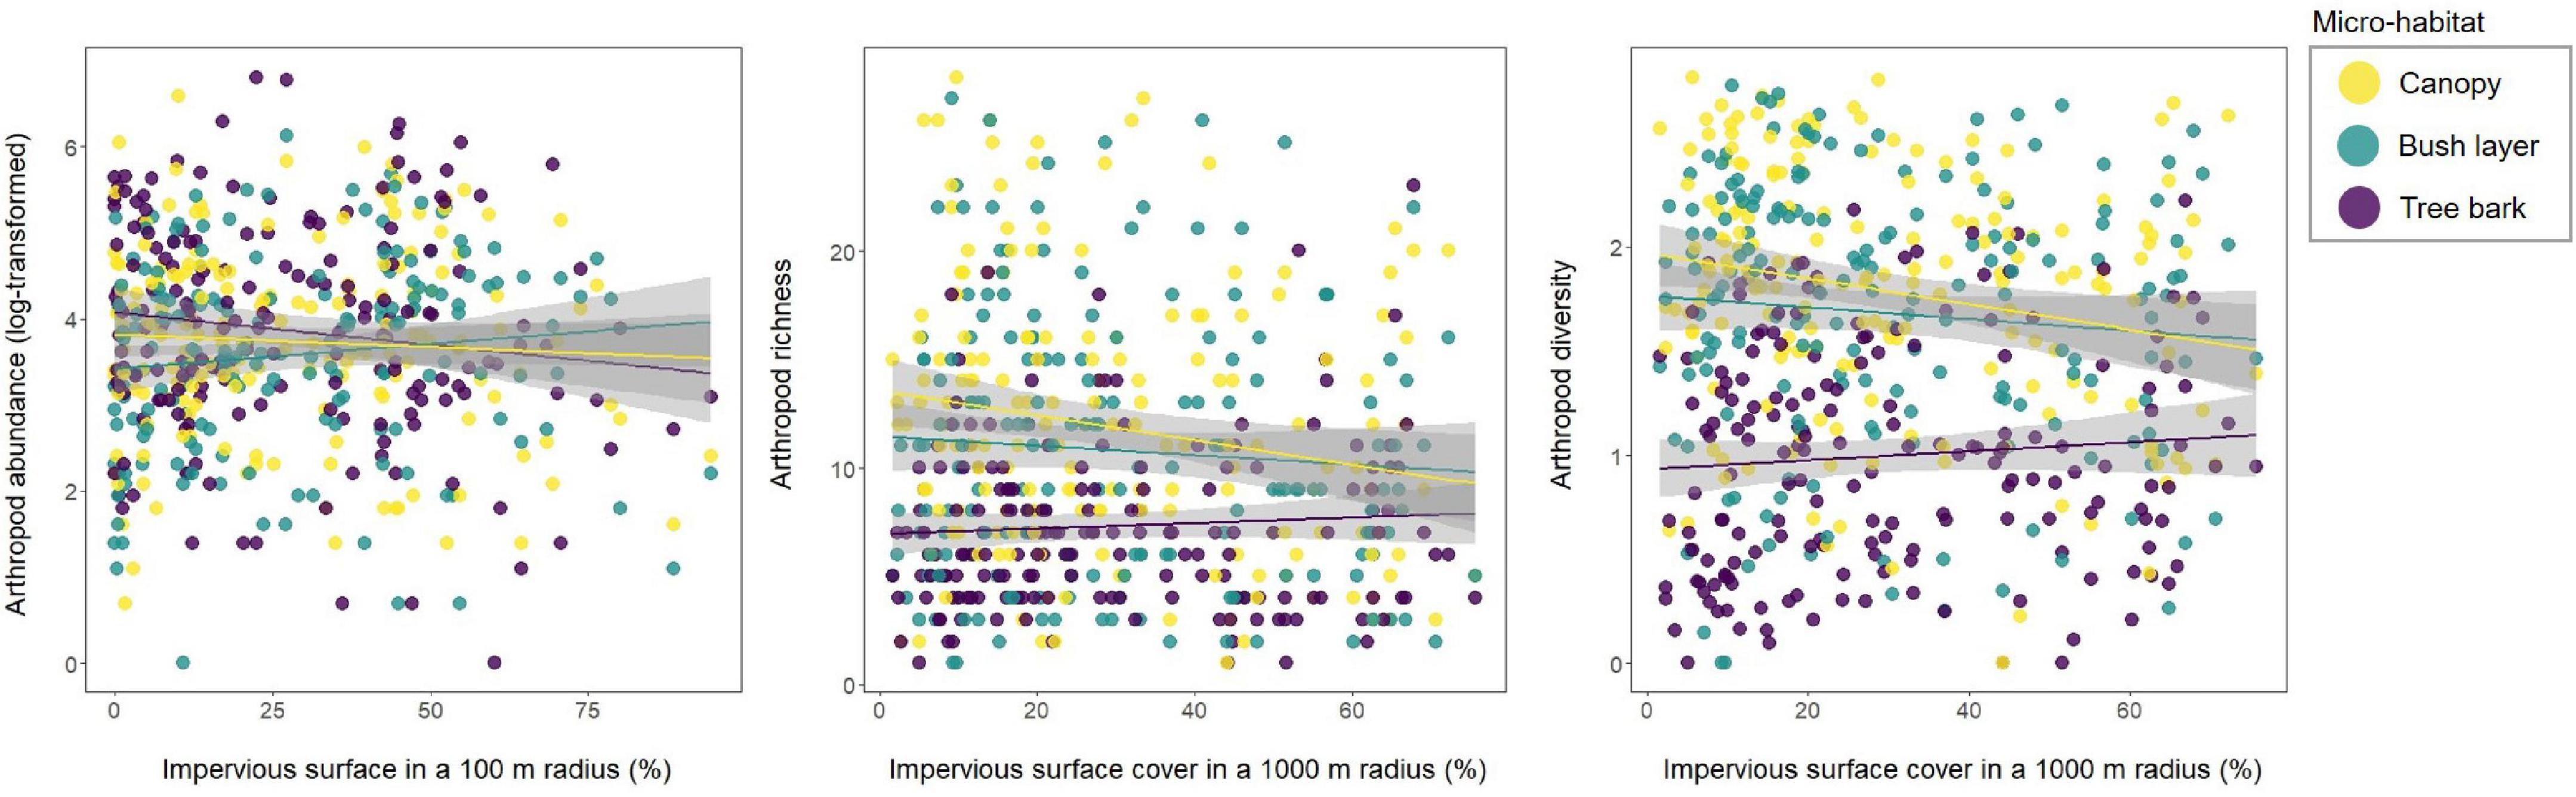
Figure 3. Relationship between arthropod abundance (log-transformed), richness or diversity (Shannon diversity index), and impervious surface cover in a 100 m or 1000 m radius according to the micro-habitat (whatever the sampling month).
3.2. Arthropod richness
In 13 out of the 18 models, arthropod richness is influenced by the interaction between urbanisation level and micro-habitat (Table 1A): in the canopy, richness decreased with increasing urbanisation level which was also true for the bush layer when considering impervious surface cover in a 1,000 m radius, or vegetation cover in a 500 and 1,000 m radius as index of urbanisation (Table 1B). For instance, as the impervious surface cover in a 1,000 m radius increased by 10%, arthropod richness in the canopy decreased by 0.63 (Figure 3): an average of 13 taxonomic groups were collected at less urbanised sites (i.e., sites for which impervious surface covered up to 13% of the land in a 1,000 m radius—the 1st quartile), while only 10 were collected at highly urbanised ones (i.e., sites for which impervious surface covered more than 45% of the land in a 1,000 m radius—the 3rd quartile). In the bush layer, as the impervious surface cover in a 1,000 m radius increased by 10%, arthropod richness increased by 0.27 (Figure 3): an average of 10 and 9 taxonomic groups were collected at less and highly urbanised sites, respectively. Arthropod richness also increased with increasing distance to the city centre or with decreasing D2N, whatever the micro-habitat (Table 1A). In two models only (when considering impervious surface in a 100 m and 500 m radius), richness is also influenced by the interaction between urbanisation level and month (Table 1A): in June and October, it decreased with increasing urbanisation level; the direction of the relationship was the same in April and February, although the correlation was not significant (Table 1C). Finally, arthropod richness is affected by the interaction between micro-habitat and month (Table 1A); variations in arthropod richness between months are detailed in Supplementary Appendix B.
3.3. Arthropod diversity
In 13 out of the 18 models, arthropod diversity was influenced by the interaction between urbanisation level and micro-habitat (Table 1A): in the canopy and the bush layer, diversity decreased with increasing urbanisation level (Table 1B). For instance, the Shannon diversity index in the canopy was 1.93 (out of a maximum of 2.55) at less urbanised sites (i.e., sites for which impervious surface covered up to 13% of the land in a 1,000 m radius—the 1st quartile), while it was 1.58 (out of a maximum of 2.30) at highly urbanised ones (i.e., sites for which impervious surface covered more than 45% of the land in a 1000 m radius—the 3rd quartile) (Figure 3). In the bush layer, it was 1.66 (out of a maximum of 2.31) and 1.59 (out of a maximum of 2.28) at less and highly urbanised sites, respectively (Figure 3). In only three models, arthropod diversity was influenced by the interaction between urbanisation level and month (Table 1A): diversity decreased with increasing urbanisation level (impervious surface cover in a 500 and 1,000 m radius, or vegetation cover in a 500 m radius) in June only (Table 1C). In the remaining models, arthropod diversity varied between months (Table 1A); variations in arthropod diversity between months are detailed in Supplementary Appendix C.
3.4. Taxonomic group composition
The results of the pRDA were largely similar when using taxa abundance and presence/absence. Therefore, we present below the results of the pRDA on abundance data; the results of the pRDA on presence/absence data are detailed in Supplementary Appendix E. The global constrained ordination showed that the environmental variables significantly explained the variance in taxonomic composition between sampling sites (F = 6.08, df = 25, P = 0.001): all 20 environmental variables explained 22.6% of the variance in the dataset. The conditional variable “tree type” explained 2% of the variance. From these 20 variables, six significantly explained the variation in taxonomic group composition: “month,” “micro-habitat,” “impervious surface cover (500 m),” “D2N (100 m),” “distance house,” and “high vegetation cover (1,000 m).” All six selected environmental variables explained 20.3% of the variation in taxonomic group compositions (F = 12.38, df = 11, P = 0.001). Variation partitioning was as follows: “month” 10%, “micro-habitat” 8.4%, “impervious surface (500 m)” 0.8%, “D2N (100 m)” 0.6%, “distance house” 0.3%, and “high vegetation (1,000 m)” 0.5%. Overall, urbanisation level explained 10.7% of the total variance explained by the ordination analysis, while “month” explained 48.5% and “micro-habitat” explained 40.8%. Out of the 11 constrained axes, the first six axes were significant: RDA1 (F = 64.44, P = 0.001), RDA2 (F = 31.85, P = 0.001), RDA3 (F = 15.80, P = 0.001), RDA4 (F = 8.23, P = 0.001), RDA5 (F = 5.76, P = 0.001), and RDA6 (F = 3.17, P = 0.001). RDA1 is strongly correlated with “micro-habitat” while RDA2, RDA3, and RDA5 are primarily associated with “month.” RDA4 and RDA6 are associated with “month” and the four indexes of urbanisation level (Table 2).
RDA1 and RDA2 were interpreted to understand how arthropod communities varied according to “month” and “micro-habitat,” independently of the urbanisation level (Figure 4 and Supplementary Figure D1). RDA1 separates arthropod communities on tree bark, characterised by higher abundances of springtails (Collembola) and oribatid mites (Oribatida), from arthropod communities in the bush layer and the canopy, characterised by higher abundances of aphids (Aphididae) and lice (Psocodea) nymphs. RDA2 separates arthropod communities in winter (i.e., December and February), characterised by higher abundances of planthoppers (Issidae) and outer barklice (Ectopsocidae), from arthropod communities in summer (i.e., June and August), characterised by higher abundances of ants (Formicidae) and sac spiders (Clubionidae). Finally, communities in February were more bark-like while in October, they were more bush and canopy-like; this is in agreement with the results of the models on arthropod abundance (see section 3.1.).
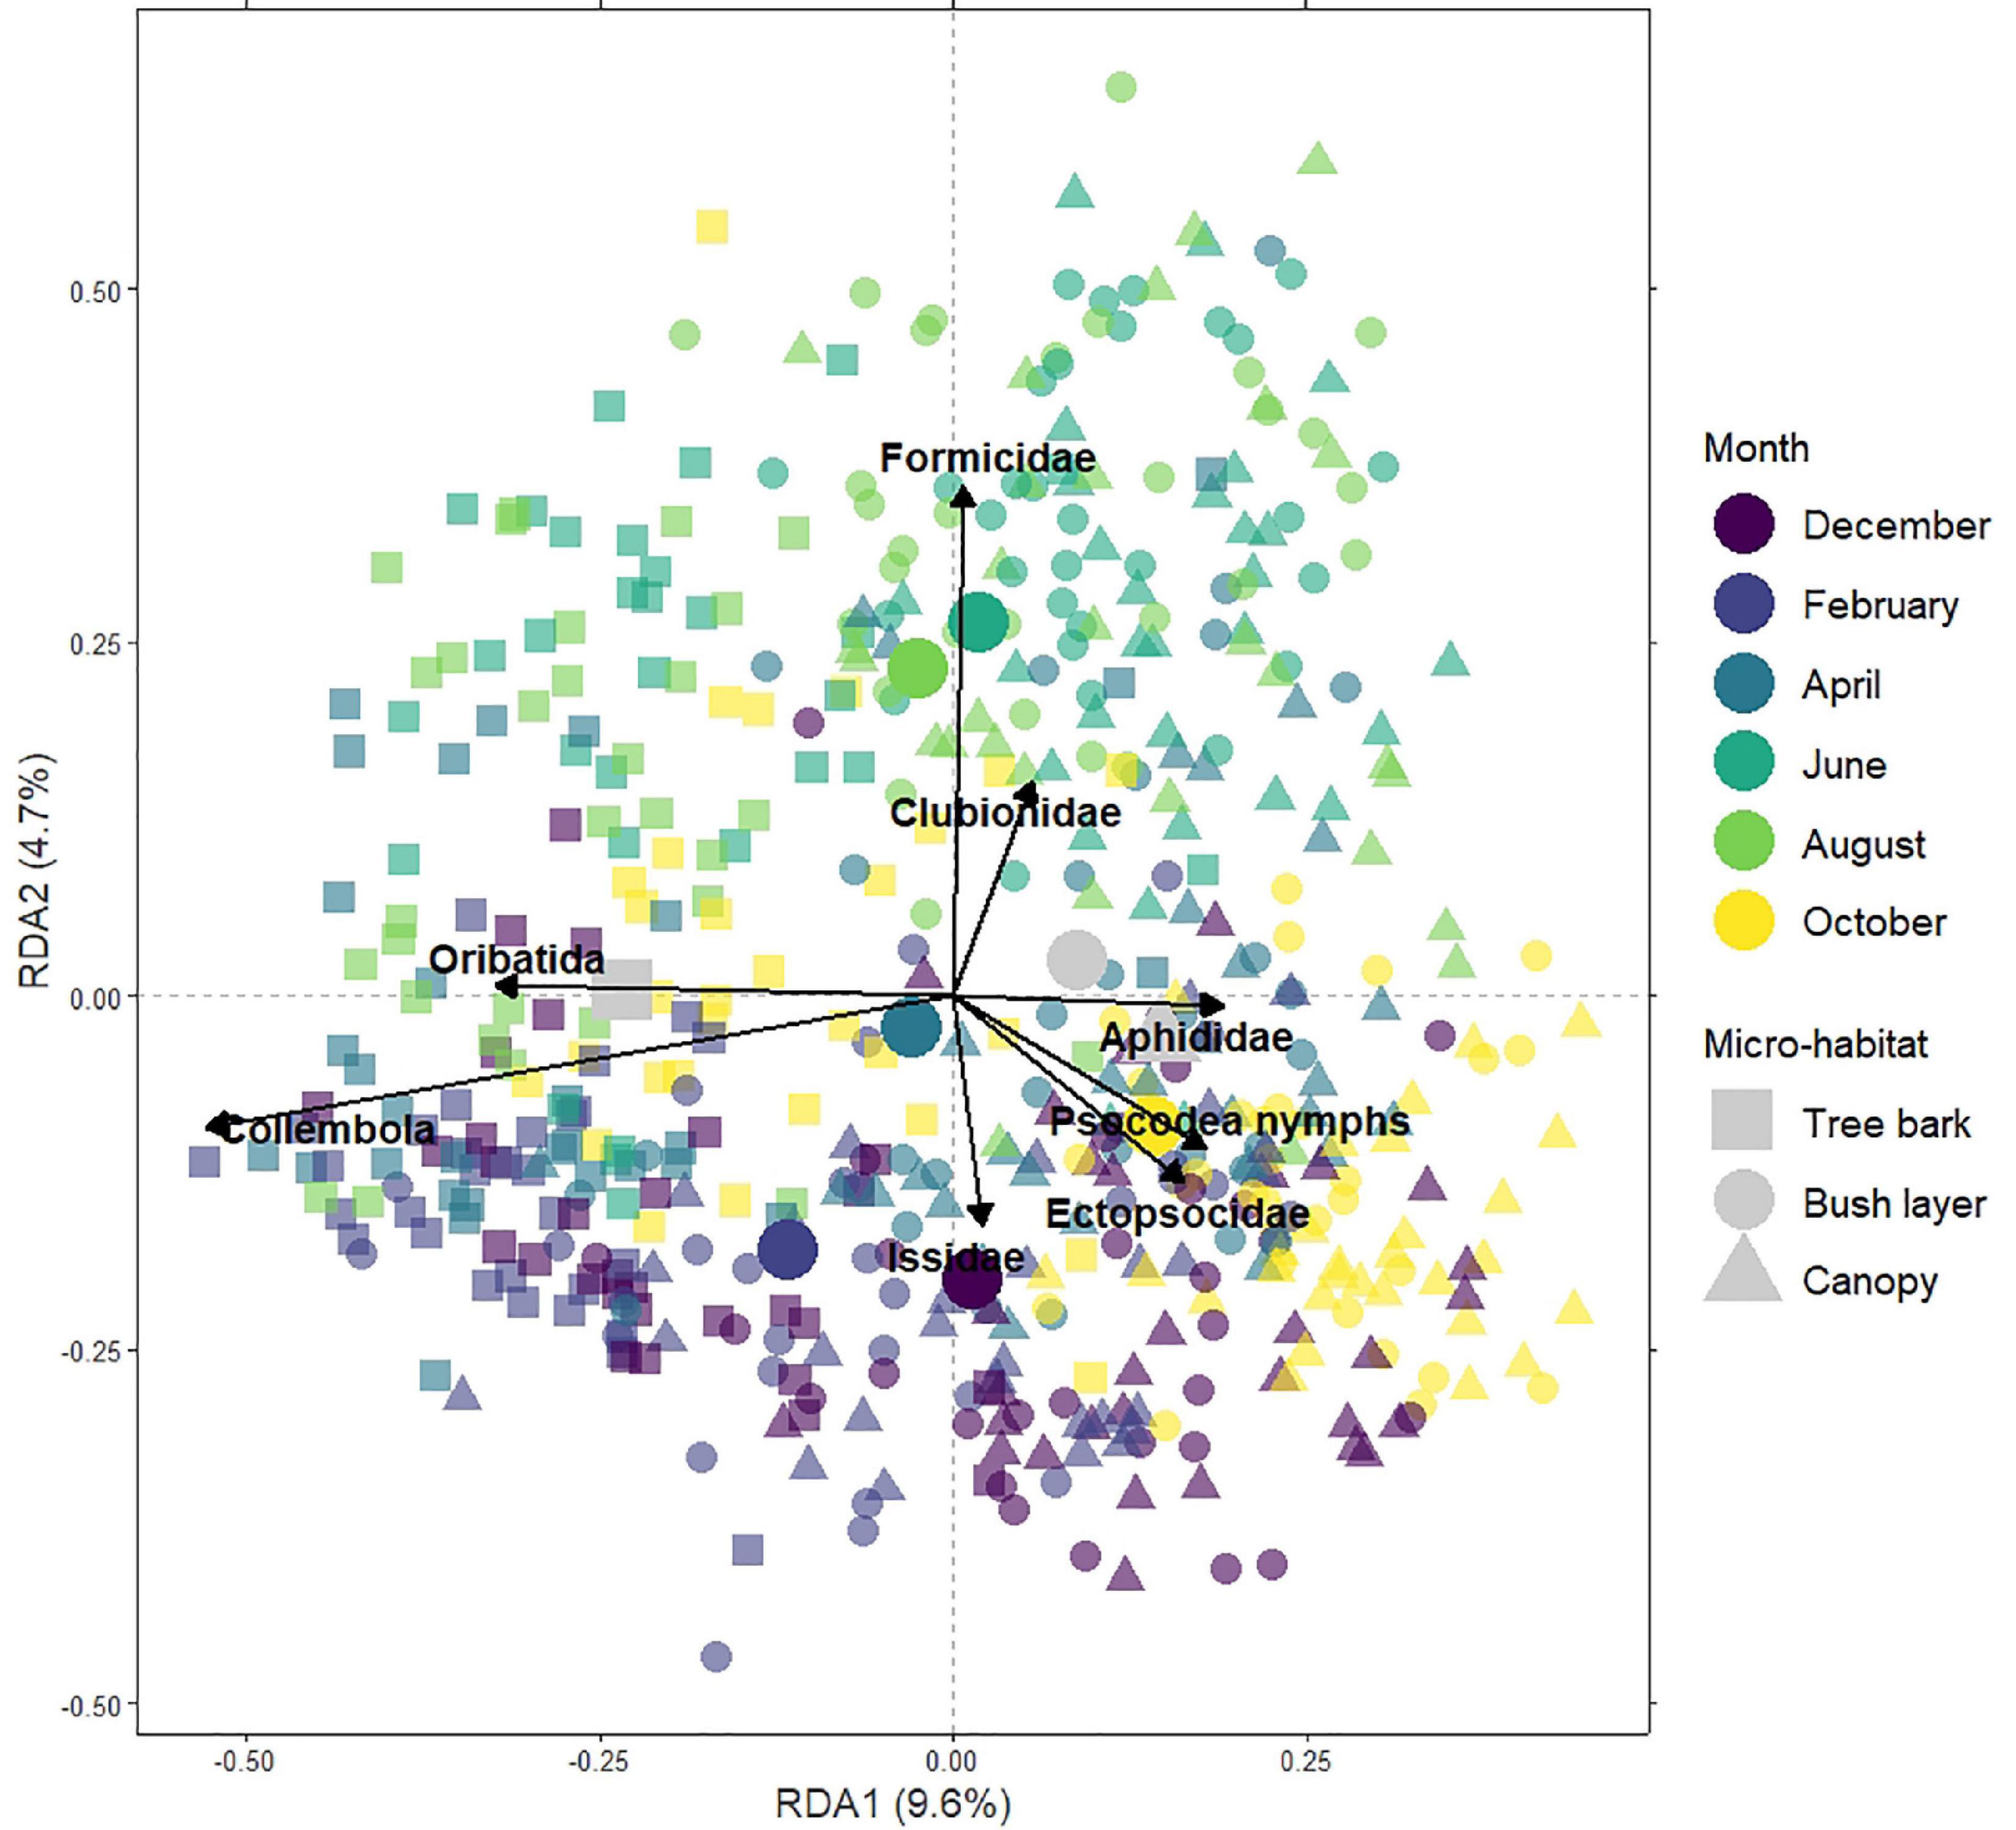
Figure 4. Triplot representing the 1st (RDA1) and 2nd (RDA2) components of the redundancy analysis on the full dataset. The sites (i.e., the micro-habitat at each 180 location within Innsbruck urban mosaic) are ordered based on their taxonomic composition. Different symbol colours highlight clusters by months, while different symbol shapes highlight clusters by micro-habitat. The main taxonomic groups explaining the ordination are highlighted by vectors. The large plain circles show the centroid for each month while the large grey shapes show the centroid for each micro-habitat.
3.5. Urbanisation-driven taxonomic group composition
Constrained ordinations were tested per micro-habitat and per month to better identify the effects of urbanisation level on taxonomic composition. The full data set on environmental variables significantly explained the variance in taxonomic composition between sampling sites irrespectively of the model, except for the RDA on tree bark (Table 3). Depending on model, the 18 proxies of urbanisation level explained together between 8 and 22.8% of the variation in arthropod community composition among sites; between one and six environmental variables significantly explained such variation (Table 3) but only one or two axes were significant per model (Figure 5).

Table 3. Results of the ordination analyses per (a) month and (b) per micro-habitat.
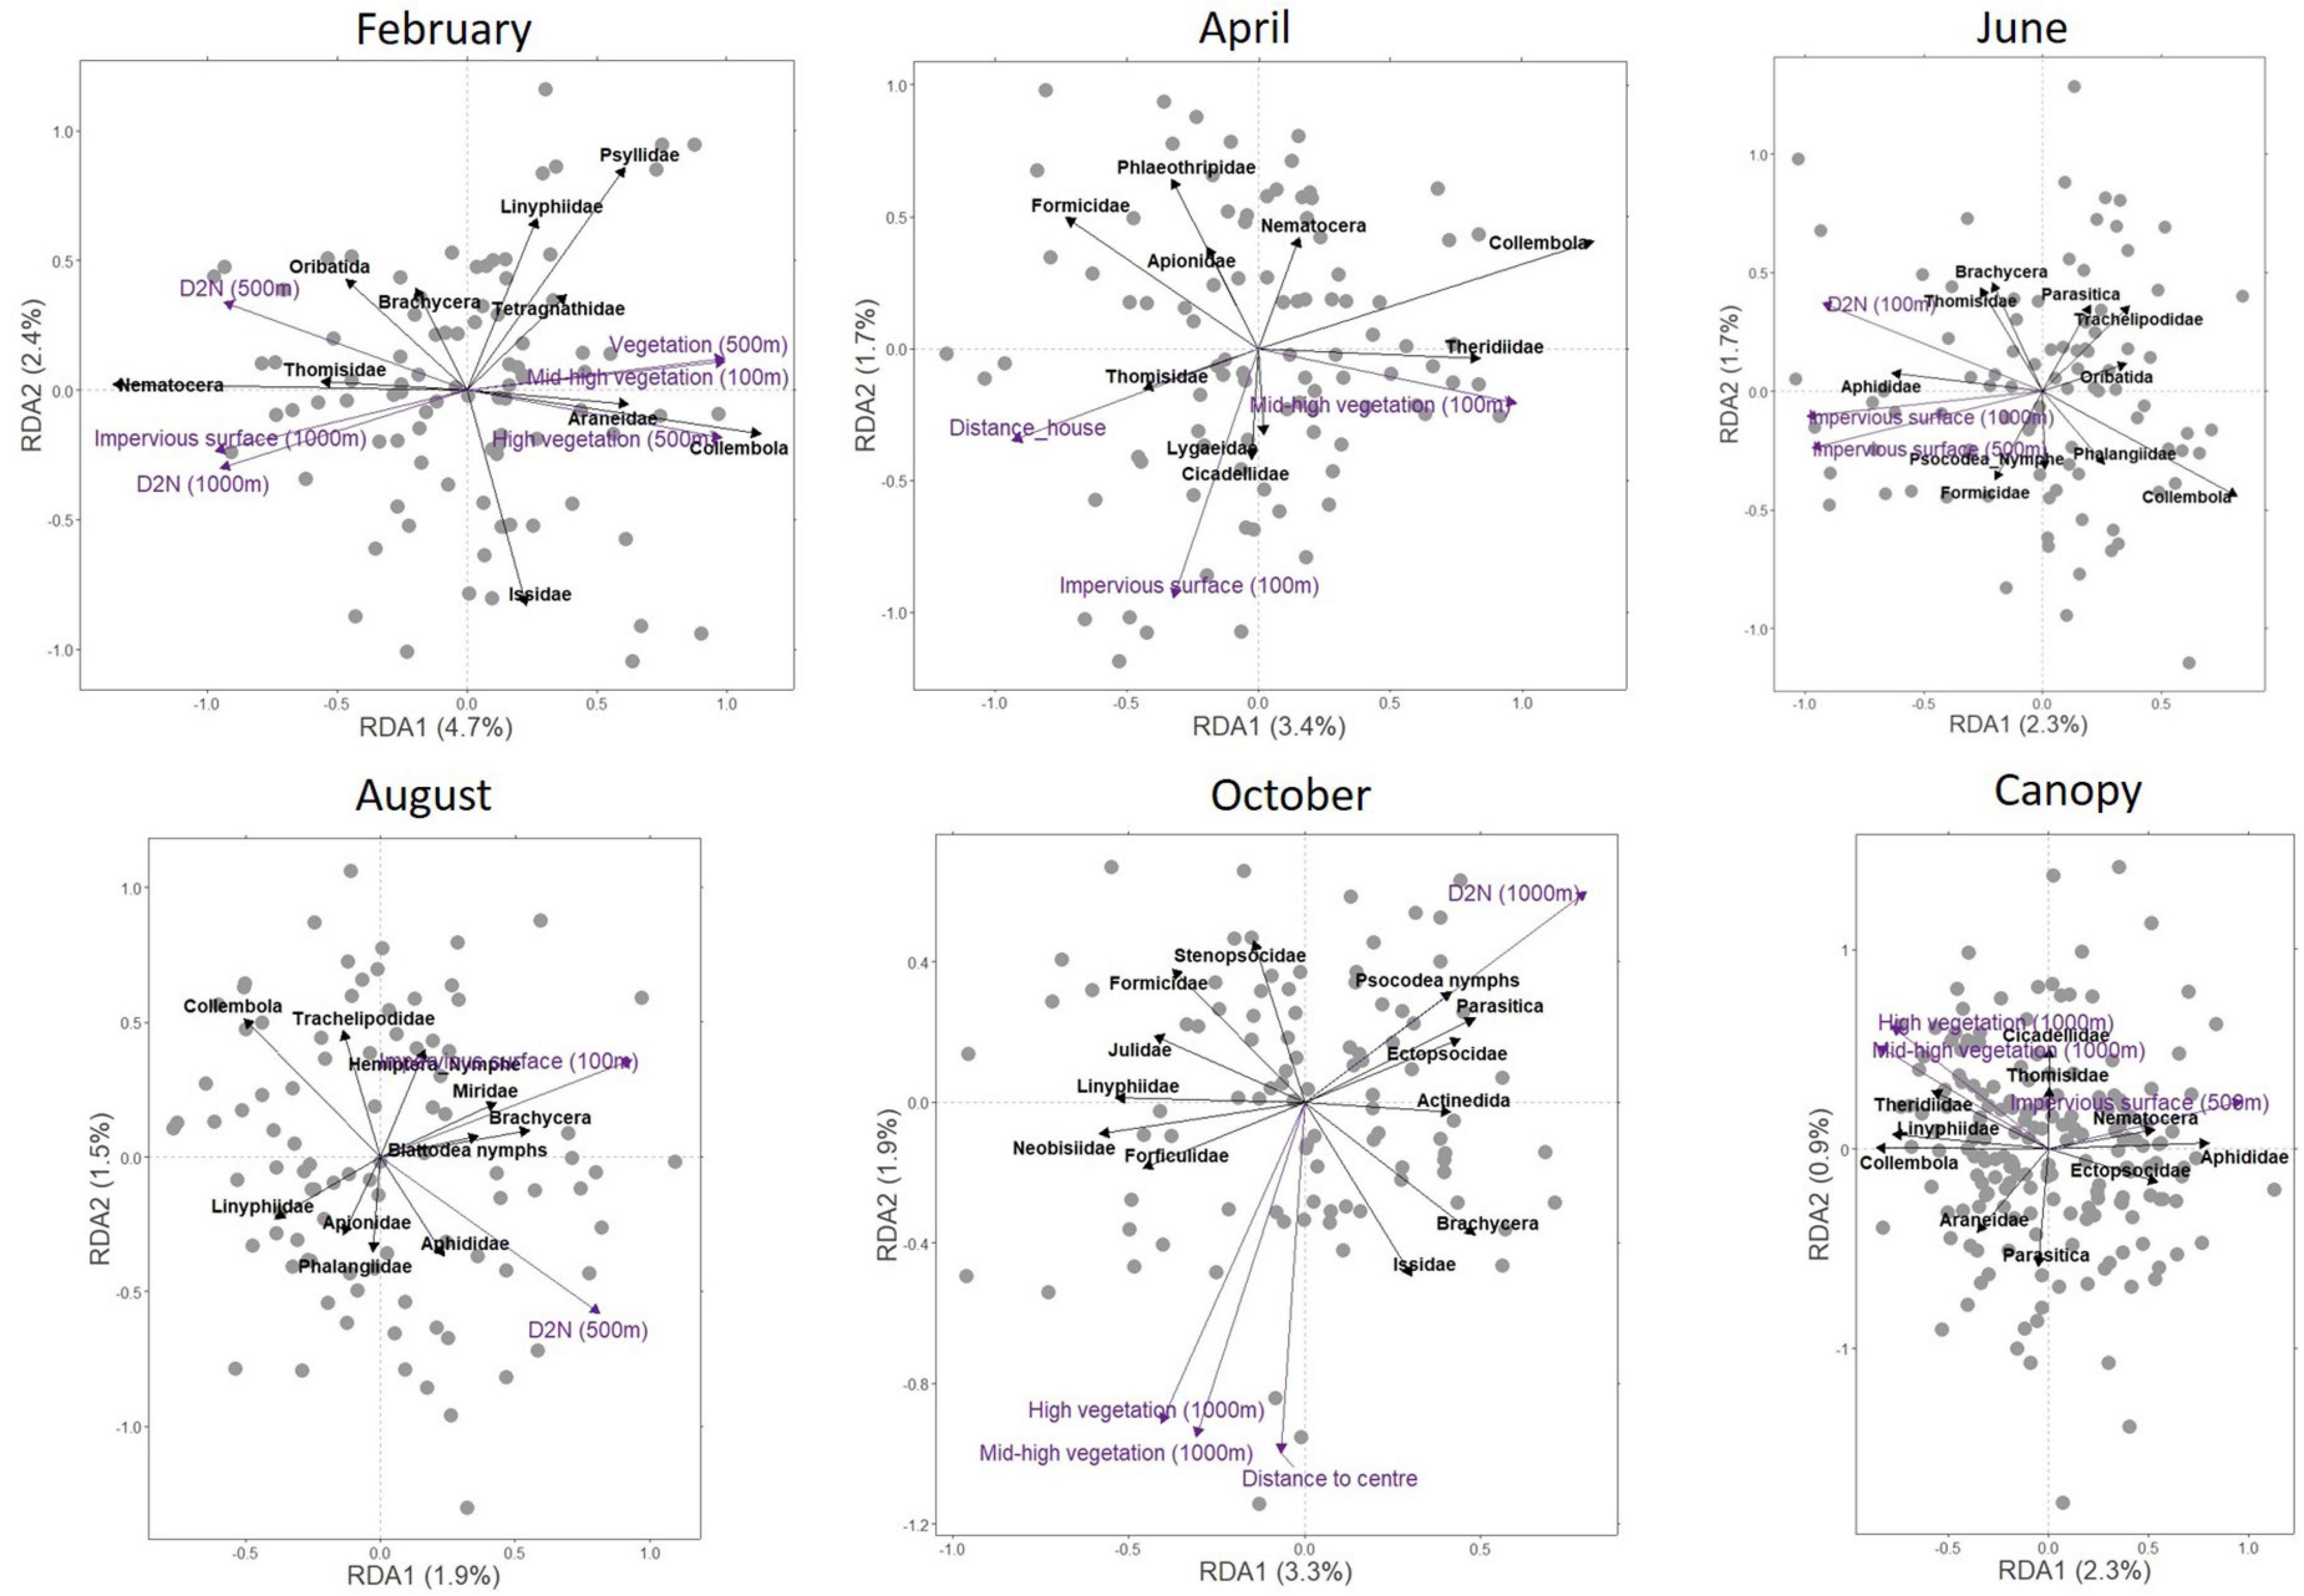
Figure 5. Redundancy analysis triplots per month and per micro-habitat. The triplots for December and for the micro-habitats “Bush layer” and “Tree bark” are not shown because, in these models, only one RDA component significantly explained arthropod community structuration. The environmental variables significantly explaining differences in arthropod communities between sites are represented by purple vectors. The main taxonomic groups explaining the ordination are highlighted by black vectors.
Response to urbanisation was taxon, month and micro-habitat specific. Overall, the numbers of spiders from four of the ten families present in our study area—tangle web spiders (Theridiidae), orb-weaver spiders (Araneidae), ghost spiders (Anyphaenidae), and sheetweb weavers (Linyphiidae) (in the canopy and the bush layer), springtails (in the canopy and on tree bark), and pin cushion millipedes (Polyxenidae) (on tree bark) decreased along the rural-urban gradient. On the contrary, the abundances of crab spiders (in the bush layer and on tree bark), barklice (in the canopy and the bush layer), flies (in the canopy and on tree bark), aphids (in the canopy) and leafhoppers (Cicadellidae) (on tree bark) increased with increasing habitat urbanisation level. Other taxonomic groups responded positively or negatively to the urbanisation level at specific time of the year. Of interest is the fact that more taxonomic groups negatively responded to urbanisation in February, while more taxonomic groups positively responded to urbanisation in August and October; in addition, more taxonomic groups responded negatively to urbanisation in the canopy and the bush layer than on tree bark. The results of the redundancy analyses per month (while controlling for between micro-habitat differences) and per micro-habitat (while controlling for between month differences) are summarised in Table 4; they are based on the interpretation of the redundancy analysis triplot for each month or for each micro-habitat (Figure 5). When only one RDA component significantly structured the communities, the results are based on the “species” coordinates (“scores”) on this single axis. Largely similar results were obtained on presence/absence data (see Supplementary Appendix E). Therefore, the results above can also be interpreted as a variation in taxonomic group occurrence along the rural-urban gradient.
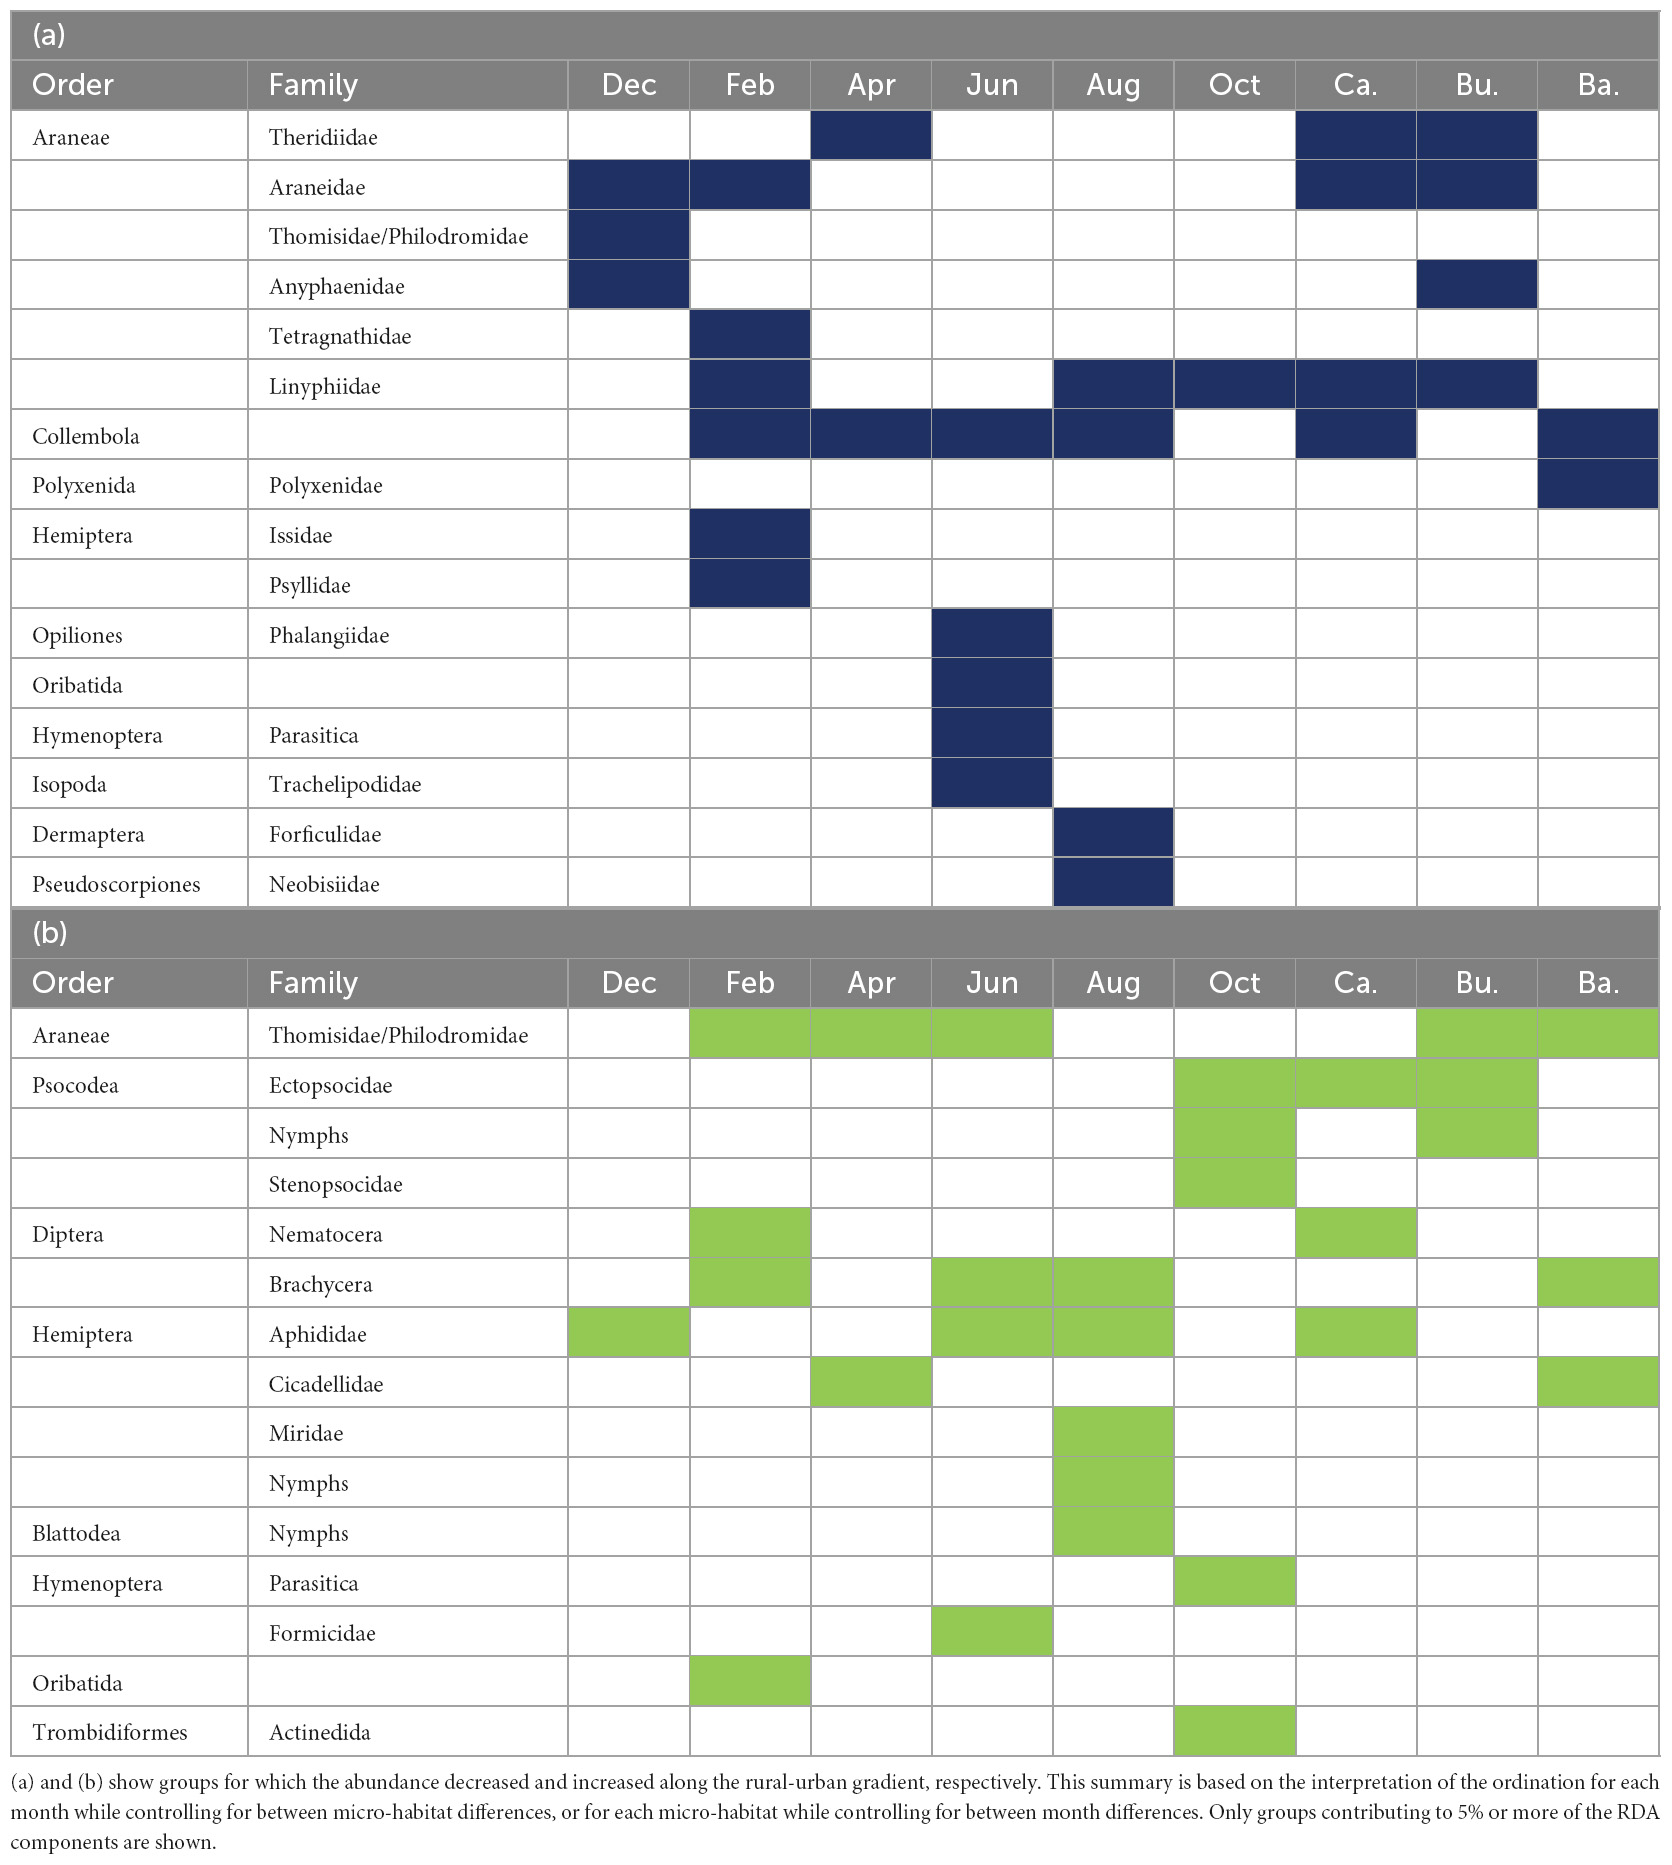
Table 4. Main taxonomic groups explaining variations in arthropod community composition along the rural-urban gradient.
4. Discussion
4.1. Urbanisation negatively affects arthropod richness and diversity in the canopy and the bush layer
Whatever the season, both the richness and the diversity of arthropods in the canopy and in the bush layer significantly decreased with increasing urbanisation level. More specifically, arthropod richness in the canopy and in the bush layer were around 30 and 20% higher at less urbanised sites than at highly urbanised ones, respectively. Similarly, arthropod diversity in the canopy and in the bush layer was around 10% higher at less urbanised sites than at highly urbanised ones. Such a decrease in arthropod richness and diversity along the rural-urban gradient likely results from urban environments selectively filtering species based on their traits. Our study shows that urbanisation mainly filters web spiders and springtails, which occurrence decreased along the rural-urban gradient. Both groups being wingless, our results support the findings of previous studies that suggested that arthropod dispersal ability is one of the main trait filtered by urbanisation, for instance with non-flying species being replaced by flying species along the rural-urban gradient (Kotze et al., 2011; Vergnes et al., 2014; Buchholz et al., 2018; Piano et al., 2020; Korányi et al., 2022). Such a hypothesis is also supported by our results on micro-habitat-specific effects of urbanisation (see section 4.3.).
4.2. Arthropod richness and diversity on tree bark does not respond to urbanisation
Contrary to arthropod communities in the canopy and the bush layer, communities on tree bark did not vary with urbanisation level in terms of richness and diversity. Compared to the canopy, tree bark is less exposed to solar radiations. Moreover, due to its structure, it increases heat loss through conduction and convection (Henrion and Tributsch, 2009). By offering cooler habitats (Briscoe et al., 2014), tree bark may dampen the selective pressure resulting from the urban heat island (Miles et al., 2019). Alternatively, because springtails and oribatid mites, the most abundant taxonomic groups on tree bark, were not identified to the family level, it might be that this study underestimated the actual richness of arthropods on tree bark, which might have reduced the possibility to measure variations in richness between sites. Results on taxonomic composition showed that springtail abundance on tree bark decreased with increasing the urbanisation level, thus supporting this second hypothesis (see section 4.3).
4.3. Urbanisation effects on arthropod abundance are micro-habitat specific
Unexpectedly, whatever the season, arthropod abundance in the bush layer increased with increasing urbanisation level. In particular, the abundances of barklice, and of crab spiders (Thomisidae and Philodromidae) increased along the rural-urban gradient. This pattern may result from differences in the vegetation structure along the rural-urban gradient. Indeed, urban green areas are often composed of isolated trees and/or hedges of shrubs. Therefore, shrubs in urban areas may be more productive, produce more nutritive leaves and sustain a higher number of herbivores compared to the often light-limited understorey in areas with higher tree cover (Basset et al., 1992). Surprisingly, arthropod overall abundance in the canopy did not vary significantly with urbanisation level. This could be explained by the fact that the abundances of aphids, barklice and nematoceran flies (e.g., mosquitos, crane flies, etc.) increased, while the abundances of springtails and several groups of spiders decreased along the rural-urban gradient (see section 4.4), thus resulting in different communities but similar numbers of individuals in different habitats. This result strongly suggests that urbanisation negatively affects non-flying arthropods while flying insects do manage to colonize and thrive in urban areas. Habitat fragmentation in urban areas is certainly the main driver of such a filtering pattern, as species with low dispersal capacities (here without wings) can hardly colonize such habitats (Fenoglio et al., 2021). This pattern is expected to be exacerbated in the case of canopy-dwelling arthropods, as trees in urban areas are usually isolated from each other. In line with this hypothesis, arthropod overall abundance on tree bark decreased with increasing urbanisation level. Such a decrease in overall abundance was mainly triggered by a decline in the number of springtails and pin cushion millipedes. While the abundances of other groups with higher mobility like brachyceran flies (e.g., hover flies, house flies, dagger fliers, etc.) and leafhoppers increased on tree bark along the rural-urban gradient, this did not balance the overall loss of individuals.
4.4. Urbanisation effects on spiders are family-dependent
The effects of urbanisation were taxon-specific, meaning that some taxonomic groups thrived while other suffered from urbanisation. Most importantly, 4 out of 10 families of spiders (tangle-web spiders, orb-weaver spiders, sheetweb spiders and ghost spiders) were consistently found in lower densities in the canopy and the bush layer of highly urbanised sites than of less urbanised ones. On the contrary, the abundance of crab spiders in the bush layer and on the bark consistently increased along the rural-urban gradient. Our results are in line with the results of previous studies that showed that urbanisation shifts spider taxonomic composition (Magura et al., 2010; Buchholz et al., 2018; Lowe et al., 2018; Lövei et al., 2019; Piano et al., 2020). However, while previous work suggest that urbanization increases the occurrence of species with higher dispersal capacity (species using ballooning), this pattern could not be measured in our study as sheet weavers, tangle-web spiders and orb-weaver spiders, the main families that were negatively affected by urbanisation in our study, are also the predominant families involved in ballooning (Blandenier, 2009; Simonneau et al., 2016). On the other hand, our study suggests that the filter explaining spider communities along the rural-urban gradient acts on habitat affinity and/or hunting mode. Indeed, the majority of “crab spider” (Thomicidae and Philodromidae) species prefer open-habitats (scrub, hedges, park and garden, wood pasture) (Bee et al., 2017), and are ambush predators or active hunters (Bee et al., 2017). On the contrary, the spider families that declined along the rural-urban gradient use webs to catch their prey. We could argue that web-building species have a lower hunting success in urban areas because of the lack of suitable support where attaching the webs, or because of the webs being damaged by green space management practices. However, previous studies showed that urbanisation do benefit some orb-weaver spiders (Lowe et al., 2014), who, for instance, take advantage of artificial light (Willmott et al., 2019). Identifying spiders to a lower taxonomic or functional level will certainly shed some light on the species traits that are filtered in the urban space and on the environmental characteristics acting as filters.
4.5. Urbanisation favours herbivorous taxa
Overall, more urbanised sites had higher abundances of aphids (in the canopy), barklice (in the canopy and the bush layer), flies (nematoceran flies in the canopy and brachyceran flies on tree bark), and leafhoppers (on tree bark). Therefore, our study suggests that urbanisation favours herbivorous species but disfavours most spiders, meaning arthropod main predators (Nyffeler and Birkhofer, 2017). Thus, our results suggest that these communities are shaped by top-down controls, with urbanisation decreasing the abundance of several groups of spiders, resulting in the increase in the abundance of their prey. In the same way, the abundance of spiders and other predatory arthropods decreased along a rural-urban gradient in Budapest (Hungary), which was also associated with the outbreak of aphids on urban trees (Korányi et al., 2021). Similarly, aphid suppression increased with increasing the diversity of aphid natural enemies in a field experiment carried out along a rural-urban gradient in south central Wisconsin (USA) (Bennett and Gratton, 2012b).
4.6. Urbanisation effects on arthropod abundance, richness and diversity are rather similar throughout the year
The effects of urbanisation on arthropod abundance, richness and diversity were rather similar between months. However, we found that the proximity to settlements increased arthropod abundance in April, and, in a lower extent, in February. This was confirmed by the analysis on taxonomic group composition that showed that, in April only, arthropod communities were structured by the distance to the closest house. More specifically, in April, the abundances of springtails, tangle-web spiders and nematoceran flies increased in proximity to houses. Because houses are usually surrounded by evergreen hedging trees such as Thuja and early flowering shrubs such as Winter Jasmine (Jasminum nudiflorum) and Forsythias (Forsythia suspense), the effect measured may result from the earlier appearance of arthropods in residential areas than in less urbanised environments, because of the earlier availability of food resources (Luder et al., 2018; Fisogni et al., 2020). In addition, our results suggest that the negative effect of urbanisation on arthropod richness and diversity in the canopy and the bush layer is greater in June than in the other months, although such correlations were measured with few urbanisation indexes only and were not evidenced by the analysis on taxonomic group composition. Replicating the study would be useful to verify this result and formulate strong conclusions.
4.7. Urbanisation-linked variations in arthropod community composition are season-specific
Contrary to the weak season-dependent effects of urbanisation on arthropod overall abundance, richness and diversity, the effects of urbanisation on the taxonomic composition of the communities strongly varied between months. Interestingly, in August and October, even though our results do not show that urban sites support higher numbers of arthropods overall, there were more taxonomic groups that benefited from urbanisation than of groups that declined along the rural-urban gradient. This result is in line with previous studies that demonstrated that, in more urban areas, because of warmer temperatures and/or higher food availability, adult survival of some arthropod species is extended even after the end of the summer (Lowe et al., 2016). Importantly, except for a particularly rainy December 2020, weather conditions during the time of this study were normal (World Weather Online, 2022), meaning that the results obtained in this study should accurately represent the main differences in arthropod communities along the rural-urban gradient. However, we cannot exclude that the link between arthropod communities and the urbanisation level may be different during years with unusual weather conditions.
4.8. Measuring “Impervious surface cover” at different scales appears to be the best practice in urban ecology
While the variation in arthropod abundance, richness and diversity explained by the model only slightly differed between models using different urbanisation level proxies, models using the percentage of impervious surface cover were systematically performing better (i.e., they were systematically in the top three of the models with the highest adjusted R2). Moreover, the percentage of impervious surface in a 500 m radius explained the highest proportion of the variation in arthropod taxonomic composition between sites. In addition, the percentage of impervious surface cover was selected in seven out of the nine ordination analyses run per month and per micro-habitat. Interestingly, arthropod abundance was better explained by local urbanisation level (i.e., the distance to the closest house and the “distance to nature” and percentage of impervious surface cover in a 100 m radius around the sampling point). This result is in line with a previous study showing that the local urbanisation level (within a 200 m × 200 m cell) better explains arthropod abundance than the urbanisation level measured at the scale of the landscape (within a 3 km × 3 km cell) (Piano et al., 2020). On the contrary, arthropod richness and diversity were better explained by the urbanisation level at a larger scale (i.e., the percentage of impervious surface cover or vegetation cover in a 1,000 m or 500 m radius around the sampling point). To explain these results, we suggest that richness and diversity reflects mostly the number of groups that managed to colonize the area, which depends on the fragmentation of the landscape (Buchholz et al., 2018; Fattorini et al., 2018). On the contrary, abundance reflects primarily population success in terms of reproduction and survival, which depends on the quality of the local habitat (Lowe et al., 2014). All in all, our study supports the importance of measuring urbanisation level at different spatial scale in order to uncover the effects of urbanisation on arthropod communities (Egerer et al., 2017; Piano et al., 2020). However, while some studies that did consider multiple spatial scales classified the sampling points into categories of urbanisation level (e.g., low, intermediate, high), we advise measuring continuous level of urbanisation; indeed, measuring categorical variables reduces the statistical power, increases the risk of false positive results and prevents from testing non-linear relationships (Altman and Royston, 2006). As for the environmental variable to measure, we advise using the percentage of impervious surface, which in general best explained changes in arthropod community composition in our study, but also in previous studies (Bennett and Gratton, 2012a; Lagucki et al., 2017; Maher et al., 2022).
5. Conclusion
All in all, our results show that arthropod communities in urbanised environments are shaped by the amount of built-up and paved-over areas at both the local and landscape scale. More specifically, wingless arthropods appears to be filtered out of dense urban matrices, within which green spaces are isolated. On the contrary, some flying herbivorous taxa thrive in such areas. Such urbanisation-linked modifications in arthropod communities are expected to have profound effects on ecological interactions such as predation. As a matter of fact, this study supports the hypothesis that aphid outbreaks in urban areas result from a lack of top-down population control by predatory spiders. Moreover, bottom-up effects on insectivorous birds are more than likely to occur. Indeed, urbanisation, by altering prey availability, is likely to alter bird foraging behaviour, for instance by shifting bird diet or increasing bird foraging effort, with consequences on bird nutritional status, success (Dresner and Moldenke, 2017) and/or species occurrence (Planillo et al., 2020). Studying ecological networks in urban ecosystems is the next step that will allow to understand how urbanisation alters biodiversity.
Data availability statement
The datasets presented in this study can be found in online repositories. Now that the manuscript has been accepted for publication, the dataset has been made public on OSF and is associated with the doi: 10.17605/OSF.IO/TV9B7.
Author contributions
MC: conceptualization, investigation, formal analysis, visualization, writing—original draft, writing—review and editing, and funding acquisition. JR: conceptualization, investigation, visualization, validation, and writing—review and editing. MT: conceptualization, validation, and writing—review and editing. All authors contributed to the article and approved the submitted version.
Funding
This work was financially supported by a Lise Meitner grant (M2628-B25) to MC from the Austrian Science Fund (FWF).
Acknowledgments
We would like to thank the following people for collecting and sorting the arthropods: Daniel Martin, Katharina Engl, Sabrina Achhorner, and Michael Abfalterer. We would also like to thank Marjana Ljubisavljevic and Britta Frei for providing advice on arthropod identification.
Conflict of interest
The authors declare that the research was conducted in the absence of any commercial or financial relationships that could be construed as a potential conflict of interest.
Publisher’s note
All claims expressed in this article are solely those of the authors and do not necessarily represent those of their affiliated organizations, or those of the publisher, the editors and the reviewers. Any product that may be evaluated in this article, or claim that may be made by its manufacturer, is not guaranteed or endorsed by the publisher.
Supplementary material
The Supplementary Material for this article can be found online at: https://www.frontiersin.org/articles/10.3389/fevo.2023.980387/full#supplementary-material
References
Altman, D. G., and Royston, P. (2006). The cost of dichotomising continuous variables. BMJ 332:1080. doi: 10.1136/bmj.332.7549.1080
Bang, C., and Faeth, S. H. (2011). Variation in arthropod communities in response to urbanization: Seven years of arthropod monitoring in a desert city. Landsc. Urban Plan. 103, 383–399. doi: 10.1016/j.landurbplan.2011.08.013
Banko, G., Mansberger, R., Gallaun, H., Grillmayer, R., Prüller, R., Riedl, M., et al. (2014). “Land information system Austria (LISA),” in Land use and land cover mapping in Europe remote sensing and digital image processing, eds I. Manakos and M. Braun (Dordrecht: Springer Netherlands), 237–254. doi: 10.1007/978-94-007-7969-3_15
Basset, Y., Aberlenc, H.-P., and Delvare, G. (1992). Abundance and stratification of foliage arthropods in a lowland rain forest of Cameroon. Ecol. Entomol. 17, 310–318. doi: 10.1111/j.1365-2311.1992.tb01063.x
Bee, L., Oxford, G., and Smith, H. (2017). Britain’s spiders: A field guide. Princeton, NJ: Princeton University Press. doi: 10.1515/9781400885060
Bennett, A. B., and Gratton, C. (2012b). Measuring natural pest suppression at different spatial scales affects the importance of local variables. Environ. Entomol. 41, 1077–1085. doi: 10.1603/EN11328
Bennett, A. B., and Gratton, C. (2012a). Local and landscape scale variables impact parasitoid assemblages across an urbanization gradient. Landsc. Urban Plan. 104, 26–33. doi: 10.1016/j.landurbplan.2011.09.007
Biella, P., Tommasi, N., Guzzetti, L., Pioltelli, E., Labra, M., and Galimberti, A. (2022). City climate and landscape structure shape pollinators, nectar and transported pollen along a gradient of urbanization. J. Appl. Ecol. 59, 1586–1595. doi: 10.1111/1365-2664.14168
Blandenier, G. (2009). Ballooning of spiders (Araneae) in Switzerland: General results from an eleven-year survey. Arachnology 14, 308–316. doi: 10.13156/arac.2009.14.7.308
Briscoe, N. J., Handasyde, K. A., Griffiths, S. R., Porter, W. P., Krockenberger, A., and Kearney, M. R. (2014). Tree-hugging koalas demonstrate a novel thermoregulatory mechanism for arboreal mammals. Biol. Lett. 10:20140235. doi: 10.1098/rsbl.2014.0235
Buchholz, S., Hannig, K., Möller, M., and Schirmel, J. (2018). Reducing management intensity and isolation as promising tools to enhance ground-dwelling arthropod diversity in urban grasslands. Urban Ecosyst. 21, 1139–1149. doi: 10.1007/s11252-018-0786-2
Burkman, C. E., and Gardiner, M. M. (2014). Urban greenspace composition and landscape context influence natural enemy community composition and function. Biol. Control 75, 58–67. doi: 10.1016/j.biocontrol.2014.02.015
Dresner, M., and Moldenke, A. (2017). Gardening for wildlife: Tree canopy and small-scale planting influences on arthropod and bird abundance. Biodivers. Ecosyst. Serv. Urban Design 10:9.
Egerer, M. H., Arel, C., Otoshi, M. D., Quistberg, R. D., Bichier, P., and Philpott, S. M. (2017). Urban arthropods respond variably to changes in landscape context and spatial scale. J. Urban Ecol. 3:jux001. doi: 10.1093/jue/jux001
Faeth, S. H., Bang, C., and Saari, S. (2011). Urban biodiversity: Patterns and mechanisms: Urban biodiversity. Ann. N. Y. Acad. Sci. 1223, 69–81. doi: 10.1111/j.1749-6632.2010.05925.x
Fattorini, S., Mantoni, C., De Simoni, L., and Galassi, D. M. P. (2018). Island biogeography of insect conservation in urban green spaces. Environ. Conserv. 45, 1–10. doi: 10.1017/S0376892917000121
Fenoglio, M. S., Calviño, A., González, E., Salvo, A., and Videla, M. (2021). Urbanisation drivers and underlying mechanisms of terrestrial insect diversity loss in cities. Ecol. Entomol. 46, 757–771. doi: 10.1111/een.13041
Fenoglio, M. S., Rossetti, M. R., and Videla, M. (2020). Negative effects of urbanization on terrestrial arthropod communities: A meta-analysis. Glob. Ecol. Biogeogr. 29, 1412–1429. doi: 10.1111/geb.13107
Fisogni, A., Hautekèete, N., Piquot, Y., Brun, M., Vanappelghem, C., Michez, D., et al. (2020). Urbanization drives an early spring for plants but not for pollinators. Oikos 129, 1681–1691. doi: 10.1111/oik.07274
Grimm, N. B., Faeth, S. H., Golubiewski, N. E., Redman, C. L., Wu, J., Bai, X., et al. (2008). Global change and the ecology of cities. Science 319, 756–760. doi: 10.1126/science.1150195
Henrion, W., and Tributsch, H. (2009). Optical solar energy adaptations and radiative temperature control of green leaves and tree barks. Sol. Energy Mater. Sol. Cells 93, 98–107. doi: 10.1016/j.solmat.2008.08.009
Korányi, D., Egerer, M., Rusch, A., Szabó, B., and Batáry, P. (2022). Urbanization hampers biological control of insect pests: A global meta-analysis. Sci. Total Environ. 834:155396. doi: 10.1016/j.scitotenv.2022.155396
Korányi, D., Szigeti, V., Mezõfi, L., Kondorosy, E., and Markó, V. (2021). Urbanization alters the abundance and composition of predator communities and leads to aphid outbreaks on urban trees. Urban Ecosyst. 24, 571–586. doi: 10.1007/s11252-020-01061-8
Kotze, J., Venn, S., Niemelä, J., and Spence, J. (2011). “Effects of urbanization on the ecology and evolution of arthropods,” in Urban ecology, eds J. H. Breuste, T. Elmqvist, G. Guntenspergen, P. James, and N. E. McIntyre (Oxford: Oxford University Press), 159–166. doi: 10.1093/acprof:oso/9780199563562.003.0019
Lagucki, E., Burdine, J. D., and McCluney, K. E. (2017). Urbanization alters communities of flying arthropods in parks and gardens of a medium-sized city. PeerJ 5:e3620. doi: 10.7717/peerj.3620
Lai, J., Zou, Y., Zhang, J., and Peres-Neto, P. R. (2022). Generalizing hierarchical and variation partitioning in multiple regression and canonical analyses using the rdacca.hp R package. Methods Ecol. Evol. 13, 782–788. doi: 10.1111/2041-210X.13800
Langellotto, G., and Hall, D. (2021). “Urban insects,” in The Routledge handbook of urban ecology, 2nd Edn, eds I. Douglas, P. M. Anderson, D. Goode, M. C. Houck, D. Maddox, H. Nagendra, et al. (London: Routledge), 412–424.
Lenth, R. V. (2022). Emmeans: estimated marginal means, aka least-squares means. R package version 1.7.2. Available online at: https://CRAN.R-project.org/package=emmeans
Lövei, G. L., Horváth, R., Elek, Z., and Magura, T. (2019). Diversity and assemblage filtering in ground-dwelling spiders (Araneae) along an urbanisation gradient in Denmark. Urban Ecosyst. 22, 345–353. doi: 10.1007/s11252-018-0819-x
Lowe, E. C., Threlfall, C. G., Wilder, S. M., and Hochuli, D. F. (2018). Environmental drivers of spider community composition at multiple scales along an urban gradient. Biodivers. Conserv. 27, 829–852. doi: 10.1007/s10531-017-1466-x
Lowe, E. C., Wilder, S. M., and Hochuli, D. F. (2014). Urbanisation at multiple scales is associated with larger size and higher fecundity of an orb-weaving spider. PLoS One 9:e105480. doi: 10.1371/journal.pone.0105480
Lowe, E. C., Wilder, S. M., and Hochuli, D. F. (2016). Persistence and survival of the spider Nephila plumipes in cities: Do increased prey resources drive the success of an urban exploiter? Urban Ecosyst. 19, 705–720. doi: 10.1007/s11252-015-0518-9
Luder, K., Knop, E., and Menz, M. H. M. (2018). Contrasting responses in community structure and phenology of migratory and non-migratory pollinators to urbanization. Divers. Distrib. 24, 919–927. doi: 10.1111/ddi.12735
Magura, T., Horváth, R., and Tóthmérész, B. (2010). Effects of urbanization on ground-dwelling spiders in forest patches, in Hungary. Landsc. Ecol. 25, 621–629. doi: 10.1007/s10980-009-9445-6
Maher, G. M., Johnson, G. A., and Burdine, J. D. (2022). Impervious surface and local abiotic conditions influence arthropod communities within urban greenspaces. PeerJ 10:e12818. doi: 10.7717/peerj.12818
McDonnell, M. J., and Pickett, S. T. A. (1990). Ecosystem structure and function along urban-rural gradients: An unexploited opportunity for ecology. Ecology 71, 1232–1237. doi: 10.2307/1938259
Merckx, T., Nielsen, M. E., Heliölä, J., Kuussaari, M., Pettersson, L. B., Pöyry, J., et al. (2021). Urbanization extends flight phenology and leads to local adaptation of seasonal plasticity in Lepidoptera. Proc. Natl. Acad. Sci. U.S.A. 118:e2106006118. doi: 10.1073/pnas.2106006118
Miles, L. S., Breitbart, S. T., Wagner, H. H., and Johnson, M. T. J. (2019). Urbanization Shapes the Ecology and Evolution of Plant-Arthropod Herbivore Interactions. Front. Ecol. Evol. 7:310. doi: 10.3389/fevo.2019.00310
Mimet, A., Pellissier, V., Quénol, H., Aguejdad, R., Dubreuil, V., and Rozé, F. (2009). Urbanisation induces early flowering: Evidence from Platanus acerifolia and Prunus cerasus. Int. J. Biometeorol. 53, 287–298. doi: 10.1007/s00484-009-0214-7
Mukai, A., Yamaguchi, K., and Goto, S. G. (2021). Urban warming and artificial light alter dormancy in the flesh fly. R. Soc. Open Sci. 8:210866. doi: 10.1098/rsos.210866
Nabielek, K., Hamers, D., and Evers, D. (2016). Cities in Europe–facts and figures on cities and urban areas. The Hague: Netherlands Environmental Assessment Agency.
Nyffeler, M., and Birkhofer, K. (2017). An estimated 400–800 million tons of prey are annually killed by the global spider community. Sci. Nat. 104:30. doi: 10.1007/s00114-017-1440-1
Oksanen, J., Blanchet, F., Kindt, R., Legendre, P., Minchin, P., O’hara, R., et al. (2020). Vegan: community ecology package. R package version 2.5-7. Available online at: https://CRAN.R-project.org/package=vegan
Piano, E., Souffreau, C., Merckx, T., Baardsen, L. F., Backeljau, T., Bonte, D., et al. (2020). Urbanization drives cross-taxon declines in abundance and diversity at multiple spatial scales. Glob. Change Biol. 26, 1196–1211. doi: 10.1111/gcb.14934
Planillo, A., Kramer-Schadt, S., Buchholz, S., Gras, P., von der Lippe, M., and Radchuk, V. (2020). Arthropod abundance modulates bird community responses to urbanization. Divers. Distrib. 27, 34–49. doi: 10.1111/ddi.13169
Rivkin, L. R., Santangelo, J. S., Alberti, M., Aronson, M. F. J., de Keyzer, C. W., Diamond, S. E., et al. (2019). A roadmap for urban evolutionary ecology. Evol. Appl. 12, 384–398. doi: 10.1111/eva.12734
Rüdisser, J., Tasser, E., and Tappeiner, U. (2012). Distance to nature–a new biodiversity relevant environmental indicator set at the landscape level. Ecol. Indic. 15, 208–216. doi: 10.1016/j.ecolind.2011.09.027
Sakamoto, Y., Ishiguro, M., and Kitagawa, G. (1986). Akaike information criterion statistics. Dordrecht: D. Reidel.
Santangelo, J. S., Miles, L. S., Breitbart, S. T., Murray-Stoker, D., Rivkin, L. R., Johnson, M. T. J., et al. (2020). “Urban environments as a framework to study parallel evolution,” in Urban evolutionary biology, eds M. Szulkin, J. Munshi-South, and A. Charmantier (Oxford: Oxford University Press), 36–53. doi: 10.1093/oso/9780198836841.003.0004
Simonneau, M., Courtial, C., and Pétillon, J. (2016). Phenological and meteorological determinants of spider ballooning in an agricultural landscape. C. R. Biol. 339, 408–416. doi: 10.1016/j.crvi.2016.06.007
Szulkin, M., Garroway, C. J., Corsini, M., Kotarba, A. Z., and Dominoni, D. (2020). “How to quantify urbanisation when testing for urban evolution?” in Urban evolutionary biology, eds M. Szulkin, J. Munshi-South, and A. Charmantier (Oxford: Oxford University Press).
Vergnes, A., Pellissier, V., Lemperiere, G., Rollard, C., and Clergeau, P. (2014). Urban densification causes the decline of ground-dwelling arthropods. Biodivers. Conserv. 23, 1859–1877. doi: 10.1007/s10531-014-0689-3
Warnes, G., Bolker, B., Bonebakker, L., Gentleman, R., Liaw, W., Lumley, T., et al. (2022). gplots: Various R programming tools for plotting data. R package version 3.1.3. Available online at: https://CRAN.R-project.org/package=gplots
Willmott, N. J., Henneken, J., Elgar, M. A., and Jones, T. M. (2019). Guiding lights: Foraging responses of juvenile nocturnal orb-web spiders to the presence of artificial light at night. Ethology 125, 289–297. doi: 10.1111/eth.12852
World Weather Online (2022). Innsbruck annual weather averages. Available online at: https://www.worldweatheronline.com/innsbruck-weather-averages/tirol/at.aspx (accessed September 21, 2022).
Keywords: urbanisation, urban mosaic, city, insects, food availability, naturalness, community composition
Citation: Chatelain M, Rüdisser J and Traugott M (2023) Urban-driven decrease in arthropod richness and diversity associated with group-specific changes in arthropod abundance. Front. Ecol. Evol. 11:980387. doi: 10.3389/fevo.2023.980387
Received: 29 June 2022; Accepted: 03 February 2023;
Published: 07 March 2023.
Edited by:
Jorge Doña, University of Illinois at Urbana–Champaign, United StatesReviewed by:
Adalbert Balog, Sapientia Hungarian University of Transylvania, RomaniaElina Mäntylä, Academy of Sciences of the Czech Republic (ASCR), Czechia
Copyright © 2023 Chatelain, Rüdisser and Traugott. This is an open-access article distributed under the terms of the Creative Commons Attribution License (CC BY). The use, distribution or reproduction in other forums is permitted, provided the original author(s) and the copyright owner(s) are credited and that the original publication in this journal is cited, in accordance with accepted academic practice. No use, distribution or reproduction is permitted which does not comply with these terms.
*Correspondence: Marion Chatelain,  bWFyaW9uLmNoYXRlbGFpbkB1aWJrLmFjLmF0