 Renyi Yang
 Zisheng Yang2,3*
- 1School of Economics, Yunnan University of Finance and Economics, Kunming, China
- 2Institute of Land & Resources and Sustainable Development, Yunnan University of Finance and Economics, Kunming, China
- 3Institute of Targeted Poverty Alleviation and Development, Yunnan University of Finance and Economics, Kunming, China
- 4School of Tourism and Hospitality Management, Yunnan University of Finance and Economics, Kunming, China
Land use/cover change (LUCC) and the evaluation of its ecological effects are the important and key areas of research on global environmental change and sustainable development. In response to the problems and limitations of various methods of evaluating the ecological effects of LUCC, this article takes Yunnan Province, a mountainous province with a relatively fragile “innate” ecological environment, as the research area. Based on LUCC data from the interpretation of seven phases of remote sensing (RS) images taken in Yunnan, combined with the investigation of soil erosion data by using remote sensing technology, an improved integrated ecological effect index (IEEI) for the LUCC and a method for its evaluation are proposed; this index was applied to calculate the integrated ecological effect index for the LUCC and analyze its spatiotemporal evolution in 129 counties in Yunnan from 1990 to 2020. The spatiotemporal changes, characteristics, and laws of the integrated ecological effects of LUCC in the whole province and counties from 1990 to 2020 were revealed, with the goal of offering a fundamental framework for long-term strategic planning and management in mountainous provinces. Overall, in the past 30 years, the integrated ecological effect of Yunnan Province and various counties has significantly improved. However, the IEEI of the province is not yet very high, and its regional differences are significant. It is urgent to increase the efforts of ecological civilization construction (ECC) throughout the province, adopt practical and effective ecologically-friendly land use ways and ecological environment protection and construction measures according to local conditions, and steadily improve the integrated ecological effect of various regions.
1 Introduction
Land use/cover change (LUCC) always has a major influence on biodiversity, biogeochemical processes, climate change, and ecosystems (Jonathan et al., 2005; Meyfroidt et al., 2022), thereby affecting the sustainable use and sustainable development of regional land. Therefore, since the 1990s, LUCC has become a frontier and key field of research on global environmental change and sustainable development (Turner et al., 1994; Li, 1996; Lambin et al., 1999; IGBP, 2005; Wang and Liu, 2009). Research results have continued to emerge, especially with the ecological effects of LUCC receiving more widespread attention.
From the perspective of indicator systems for the evaluation of ecological effects, research on LUCC can be loosely divided into three types: The first is that of relatively simple analysis of ecological effects based on some ecological problems according to the study area’s characteristics (Yang et al., 2004; Luo and Zhang, 2022). The characteristic of this type of research is to only analyze a single ecological indicator caused by LUCC, rather than an integrated evaluation of ecological effects. The second type is that in which a relatively scattered set of ecological indicators are selected based on the research purposes and the regional reality for the analysis of multiple ecological effects (Yang, 2011; Zhai, 2023). Compared to the first type, this type of research has made significant progress. Its characteristic is to analyze the various ecological indicators caused by LUCC, but its disadvantage is that these indicators have not been organically combined for integrated ecological effect evaluation. The third type is that in which a set of multiple quantitative indicators that reflect the ecological effects of LUCC in an integrated way are selected, and an “integrated evaluation method” is used to quantitatively calculate the integrated ecological effect index (IEEI). This type of research belongs to the integrated quantitative evaluation of ecological effects and is the mainstream of LUCC ecological effect research.
The research on the integrated ecological effect index (IEEI) has made significant progress in the past 20 years. At first, Li et al. (2003) used expert scoring to create a fuzzy assignment of the ecological environment quality of each land use type and demonstrated the connection between the regional biological environment quality and LUCC. This method is called the “Land-use Type Assignment Method (LTAM)” here. Due to their method’s simple operation, many researchers have refer to the research results of Li et al. (2003) to calculate and analyze the ecological environment quality index for land use in other regions (Zhang et al., 2011; Yang et al., 2018; Wang et al., 2022; Liao et al., 2023). The advantage of this method is that it is easy to operate, but its disadvantage is its strong subjectivity. The LUCC ecological effect index obtained is fuzzy, rough, or even inaccurate, making it difficult to truly reflect the objective situation of ecological effects in different regions. With the development of remote sensing (RS) technology, Xu (2013) developed the calculation method of RS ecological index (RSEI) to rapidly monitor and assess regional ecological quality by using information from RS. This index couples four evaluation indicators, which represent the four main ecological factors of heat, dryness, humidity, and greenness: the vegetation index, the humidity component, the surface temperature, and the soil index. Thereafter, Wan et al. (2021) added indicators that characterized the PM2.5 concentration to the RSEI model (Xu, 2013) and constructed the RSEInew. In recent years, RSEI and RSEInew models have been widely applied (Yue et al., 2019; Liao and Jiang, 2020; Cai et al., 2023). Although RSEI and RSEInew methods have made great progress in evaluating the ecological effects of LUCC, the ecological index values obtained are still difficult to accurately reflect the ecological effects in various regions, such as soil erosion in mountainous areas and land desertification in arid areas. In March 2006, the third method involves the concepts and calculation methods of the “ecological index (EI)” proposed by the State Environmental Protection Administration of the People’s Republic of China (SEPA), which reflects the status of the ecological environment quality of a given study area (State Environmental Protection Administration of the People’s Republic of China, 2006). The EI depends on five factors, namely, the biological richness index, vegetation coverage index, water network density index, land degradation index, and environmental quality index. In March 2015, the Ministry of Ecology and Environment revised the original calculation method and indicator weights of the EI (Ministry of Environmental Protection of the People’s Republic of China, 2015). The EI method can be used to generally reflect the ecological environment quality status of a research area in an integrated way and can be used for an integrated evaluation of the status of the ecological environment and dynamic trends at the county level and above. However, this method also has some limitations, which are mainly because calculating the index requires large amounts of statistical data and parameters obtained through monitoring. Due to the infrequent updates of statistical data in various regions, the evaluation of ecological environment status is limited in terms of time and space (Yang, 2019; Wang, 2022). Therefore, the promotion and application of the EI method are not easy.
In response to the problems and limitations of the various current methods for evaluating the ecological effects of LUCC, the research objective of this study is to take Yunnan Province, a mountainous province with a relatively fragile “innate” ecological environment, as the research area. Based on LUCC data that were interpreted from seven phases of RS images of Yunnan Province (1990, 1995, 2000, 2005, 2010, 2015, and 2020) in combination with an investigation of soil erosion data by using RS technology, an improved integrated ecological effect index (IEEI) is studied and proposed, and it was applied to the calculation and analysis of the spatiotemporal evolution of the integrated ecological effect index for LUCC in 129 counties in Yunnan Province from 1990 to 2020. This study is extremely important for sustainable land use and protection of the ecological environment in mountainous provinces with relatively fragile “innate” ecological environments. As unique natural–cultural complexes with specific altitudes and slopes, mountain regions are primarily characterized by their fragile ecological environment (Yu, 1998). Because of their natural fragility, mountain ecosystems are frequently unstable, it is difficult to increase their biological productivity, and their feedback mechanisms are poor, and it is difficult to restore damaged mountain ecosystems (Zhong, 1999). Consequently, the growth of the mountain economy and civilization is limited, as are the development and usage of the resources found in mountainous territories. The prominent characteristics of the economy and society of most mountainous areas are poverty and backwardness. Many mountainous areas (especially ecologically degraded areas, high cold mountainous areas, etc.) are still in extreme poverty, and their primary strategy for development is to bolster their resource development. As a result, they are trapped in a vicious cycle of “poverty–environmental resource degradation–poverty”, resulting in extreme fragility throughout their ecological–economic–social systems. Taking Yunnan, which is located in the mountainous areas of southwestern China, as an example, of the total land area, 94% is made up of mountainous terrain. The ecological environment is highly vulnerable (Yang et al., 2021), and the economic conditions are still comparatively underdeveloped. Therefore, in Yunnan, a typical mountainous province, conducting research on the spatiotemporal evolution of the integrated ecological effect index for LUCC based on RS is beneficial for the promotion of sustainable land use and economic and social development. On the other hand, because of the benefits of the technology used for RS when obtaining LUCC data and other related data quickly, accurately, and in real time, it has gradually become the main means of monitoring changes in the ecological environment in mountainous areas, making the development of this study feasible.
In view of this, it is of great scientific significance and practical value to further develop the theory and methods of LUCC integrated ecological effects by conducting a simple and improved quantitative evaluation based on RS. The characteristics and contributions of this study lie in the research and proposal of a method for calculating and evaluating an improved integrated ecological effect index (IEEI) for LUCC that is universal, has easily extractable indicators, and is used to analyze the spatiotemporal changes of the integrated ecological effects of LUCC in mountainous areas. In theory, this study not only promotes the sublimation and development of research on the integrated ecological effects of LUCC, but also provides basic ideas and methods for promoting sustainable land use strategies. In reality, this study provides a novel approach on evaluating the integrated ecological effects and dynamic changes in LUCC in the mountainous areas of Yunnan and comparable mountainous areas, and a quantitative analysis and qualitative assessment are conducted.
2 Materials and methods
2.1 Overview of the study area
Yunnan is located in southwestern China, between 21°8′32″-29°15′8″N and 97°31′39″-106°11′47″E, with a low latitude (Figure 1). Overall, it is the plateau and mountainous province that integrates 4 main features: a border, mountains, ethnic minorities, and underdeveloped area. There are a total of 129 county-level administrative units (Yunnan Provincial Bureau of Statistics, 2021). In 2020, Yunnan’s GDP reached CNY 2.452 trillion, with the primary, secondary, and tertiary industries contributing CNY 359.891 billion (14.68%), CNY 828.754 billion (33.80%), and CNY 1263.545 billion (51.53%), respectively. The per capita disposable income (PCDI) of all residents was CNY 23,295, ranking 28th (4th from the bottom) among China’s 31 provinces. Specifically, the PCDI of rural residents was CNY 12,842, also ranking 4th from the bottom (National Bureau of Statistics, 2021).
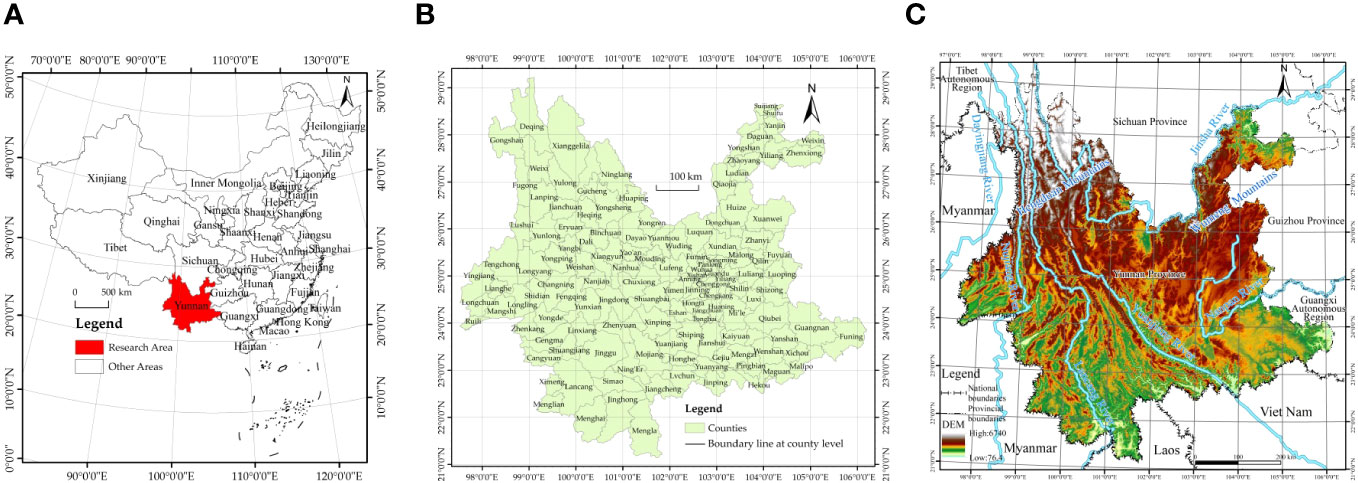
Figure 1 Geographical location and digital elevation model (DEM) map of the research area. (A) Geographical location; (B) distribution of the 129 counties; (C) DEM map.
Yunnan has a towering terrain, as it is a mountainous plateau with an average elevation of approximately 2000 m. The terrain varies significantly across the province, with a universal characteristic of high elevations in the northwest and low elevations in the southeast. The province is mainly composed of mountainous areas, which account for 94% of the terrain. Dam areas (flat land) with better conditions only account for 6% (Yang et al., 2014). In addition, 77% of the land has a slope of over 15°, and nearly 40% of the land is steep with a slope of over 25° (Office of Yunnan Provincial Agricultural Zoning Commission, 1987). At the county level, over 56% of the counties have a ratio of steep slopes to land of over 30%, while over 1/5 of the counties have a ratio of steep slope to land of over 1/2. There are numerous rivers in Yunnan. The rivers in the province belong to six major water systems, namely, the Yangtze River, the Pearl River, the Yuanjiang Honghe River, the Lancang River Mekong River, the Nujiang River Salween River, and the Irrawaddy River, all of which are outflow water systems that flow into the sea. There are over 40 large and small lakes in Yunnan, with a total area of about 1100 km2 (0.29% of the total area of the province). The catchment area is about 9000 km2 (2.34%). The total water storage capacity of the lakes is about 29 billion m3. The average annual total river runoff in Yunnan Province is 222.2 billion m3, ranking third among all provinces in China. The average runoff depth is 580.0 mm, which is 286.2 mm higher than the national average. In addition, Yunnan also has 77.15 billion m3 of groundwater resources.
The terrain characteristics dominated by mountainous areas make Yunnan’s “innate” ecological environment highly vulnerable, and it has very limited farmland resources. The unreasonable development and use of mountainous land resources for a long time can easily lead to disharmony in the relationship between humans and land in mountainous areas, causing ecological degradation and other problems. At present, the main ecological and environmental issues in Yunnan, such as soil erosion and rocky desertification, are still serious (General Office of the People’s Government of Yunnan Province, 2022). According to the China Statistical Yearbook, the total area affected by crop disasters from 2007 to 2020 was 18.843 million hectares (National Bureau of Statistics, 2021). Landslides, flows of debris, collapses, and other geological disasters frequently occur. By the end of 2020, the province had 23,267 registered hidden danger points for geological disasters (Department of Natural Resources of Yunnan Province, 2021). Yunnan’s unique geographical location, diverse topography, and complex climate have nurtured incredibly abundant biological resources, earning it the title of a “kingdom of animals and plants”. It serves as a vital genetic reservoir, as well as an ecological security barrier. China places great emphasis on protecting Yunnan’s ecological environment and ECC, and it has clearly demanded that Yunnan strive to become the vanguard of China’s ECC and build a robust ecological security barrier for the country.
2.2 Data sources and description
2.2.1 Sources and interpretation of RS image data from seven phases
The seven phases of RS image data (i.e., 1990, 1995, 2000, 2005, 2010, 2015, and 2020) used in this study were obtained from the website of the Resource and Environmental Science and Data Center of the Chinese Academy of Sciences (CAS) (https://www.resdc.cn/). They were downloaded with a spatial resolution of 30 m×30 m. The CAS has constructed a multi-temporal RS image database of land use / land cover (LULC) in China. Landsat RS images from the United States were used as the primary data source, and areas that could not be covered due to the poor temporal phase were supplemented with data from China–Brazil Satellite Resources or data from small environmental satellites. As for time, the LULC data in 1990 were primarily obtained from Landsat TM RS images from 1989 to 1992 as the main source of information; the source for the LULC data in 1995 was Landsat TM RS images from 1995 to 1996; the source for LULC data in 2000 was Landsat TM/ETM RS images from 1999 to 2000; the source for LULC data in 2005 was Landsat TM/ETM RS images from 2004 to 2005; the source for LULC data in 2010 was Landsat TM RS images from 2009 to 2010; the source for LULC data in 2015 was Landsat-8 RS image data; the source for LULC data in 2020 was Landsat-8 RS image data. In terms of seasonality, according to the actual situation in Yunnan, images with less than 10% cloud cover in winter were selected for interpretation (Table 1).
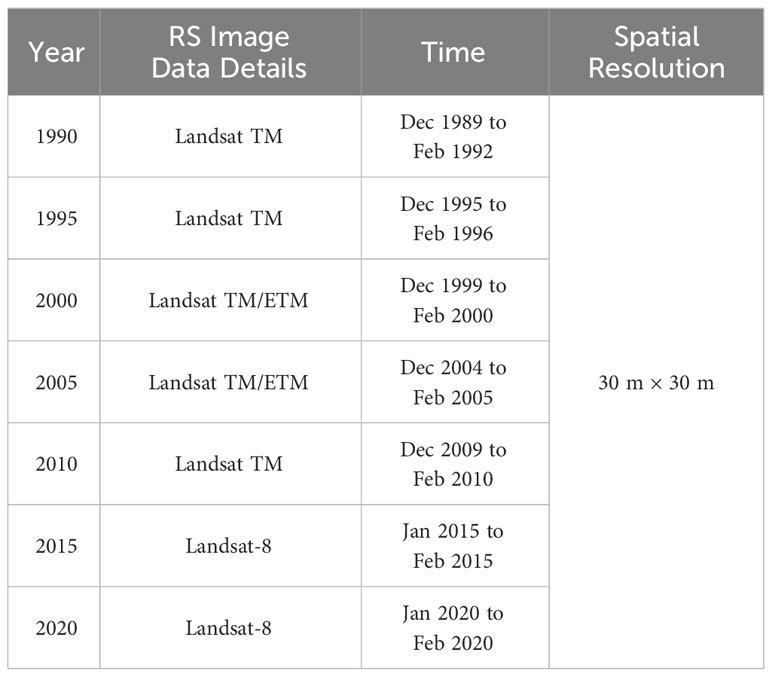
Table 1 Detailed information of the RS images from the seven phases.
Referring to Xu Xinliang and Liu Jiyuan et al (Xu et al., 2018), as well as the LULC classification system established by Liu Jiyuan et al (Liu et al., 2002; Liu et al., 2003; Liu et al., 2014; Kuang et al., 2022), combined with the specific circumstances of Yunnan and the research requirements, Yunnan’s land use classification was divided into 6 first-class types and 12 second-class types (Table 2). A seven-phase vector database of Yunnan’s land use was obtained through interactive human–machine interpretation involving the interpretation of LULC types based on the unified land use classification system mentioned above and the incorporation of RS interpretation indicators within the ArcGIS software environment. Firstly, after obtaining a remote sensing image, a series of operations, such as image preprocessing operations, including false color synthesis, precise geometric rectification, image stitching, and cropping, were performed; then, the latest administrative division map of Yunnan and its counties (from 2021) was overlaid to obtain the RS image map of each county. Afterwards, based on field investigations and integrated expert opinions, RS image interpretation markers that were suitable for Yunnan were established, and DEM maps, vegetation maps, and auxiliary materials, such as land use maps (including the first national land use survey map that was completed by the end of October 1996, the second national land survey map that was completed by the end of December 2009, and the third national land survey map that was completed by the end of 2019), were obtained as much as possible and used in the GIS software environment. During the interpretation process, counties were used as units to generate county-specific interpretations. After the interpretation was completed, the “Arcinfo Workstation” and “SHAPEARC” commands were used to generate a “coverage” file for each county. Then, the “ARCEDIT” module of “ARC/INFO” was applied for graphic editing, error checking, and modification. This included checking for incorrect patch attribute codes, missing codes, and duplicate codes. After making the necessary modifications, the adjacent county-level data were connected, and finally, the LULC vector database for Yunnan Province was generated. Based on this, the ArcGIS software was utilized to draw a seven-phase LULC map of the province (Figure 2), and the areas of the different land use classes were calculated (Table 2).

Table 2 The classified areas of LULC in Yunnan Province in 1990, 1995, 2000, 2005, 2010, 2015, and 2020.

Figure 2 LULC map of Yunnan Province in 1990, 1995, 2000, 2005, 2010, 2015, and 2020.
The LULC classification results obtained from the interpretation of 7 phases RS image data are in line with reality. Taking the 2020 LULC classification results as an example, compared with the Main Data Bulletin of the Third National Land Survey of Yunnan Province, which was compiled by the Office of the Leading Group of the Third National Land Survey of Yunnan Province on December 31, 2019, the total cultivated land area of the province interpreted by RS in 2020 was 5.3956 million hectares, while the total cultivated land area of Yunnan Province in 2019 from the Third National Land Survey of Yunnan Province (TNLS) was 5.3955 million hectares, which is relatively close. The total forest area of the province interpreted by RS in 2020 was 24.1867 million hectares, while the total forest area of TNLS in 2019 was 24.97 million hectares, with a difference of only 3.16% between the two. The total construction land area of the province interpreted by RS in 2020 was 1.2969 million hectares, while TNLS’s total construction land area in 2019 was 1.302 million hectares, with a difference of only 0.25%. It can be seen that the LULC classification in this RS interpretation is relatively accurate.
2.2.2 Additional data sources and their explanations
2.2.2.1 Socioeconomic data
The data came from statistical departments, such as the Yunnan Statistical Yearbook and the China Statistical Yearbook; some of them came from statistical bulletins and website materials from government functional departments.
2.2.2.2 Geospatial data
The geospatial data were sourced from 30 m × 30 m grid digital elevation model (DEM) in Yunnan Province; they were obtained from the Geospatial Data Cloud Platform (website: “http://www.gscloud.cn”).
2.2.2.3 Additional basic data and materials
This paper mainly obtained this information by consulting relevant government departments at all levels. This paper also conducted on-site investigations. In terms of soil erosion, reference was made to the soil erosion data from various remote sensing surveys conducted by the Yunnan Provincial Department of Water Resources from 1987 to 2020 in Yunnan Province.
2.2.2.4 Source of Yunnan county boundaries
We used the Yunnan county boundaries, which were derived from the county map of the province available on the Yunnan Provincial Platform for Common Geospatial Information Service on the MAP WORLD website. The approval number was YunS (2021) No. 50 (website: “https://yunnan.tianditu.gov.cn/MapResource”).
2.3 Improved method for calculating and evaluating the integrated ecological effect index
The ecological effects induced by LUCC are integrated and reflect the changes in the comprehensive ecological quality of the study area. Therefore, the integrated ecological effects here already include the content of ecological quality. As mentioned earlier, the three existing ecological effect index research methods for LUCC have varying degrees of limitations or shortcomings; among the three, the one that is relatively better is the EI method with the Technical Criterion for Eco-environmental Status Evaluation (TCESE) proposed by the SEPA (State Environmental Protection Administration of the People’s Republic of China, 2006; Ministry of Environmental Protection of the People’s Republic of China, 2015). It can reflect the ecological environment quality of a research area in an integrated way and can be used for an integrated evaluation of the status and dynamic changes in regional ecological environments. However, this method relies on large amounts of monitoring and statistical data, which limits the assessment of ecological environment conditions in terms of both time and space, and it is difficult to promote the application. In view of this, from the perspective of exploring a universal and easily extractable method of evaluating the integrated ecological effect of LUCC, this study took the EI method as the foundation and considered the accessibility of LUCC data based on RS image interpretation, and a method of measuring and evaluating the improved integrated ecological effect index (IEEI) is proposed.
2.3.1 Calculation method for the IEEI
The IEEI is composed of four evaluation indicators: the biological richness index (BRI), vegetation coverage index (VCI), water area index (WAI), and land degradation index (LDI). The calculation is performed as follows:
where IEEI is the integrated ecological effect index for LUCC, and w1, …, w4 are the weight values for BRI, VCI, WAI, and LDI in Equation 1, respectively. Referring to the TCESE (State Environmental Protection Administration of the People’s Republic of China, 2006; Ministry of Environmental Protection of the People’s Republic of China, 2015), the values determined here are shown in Table 3.
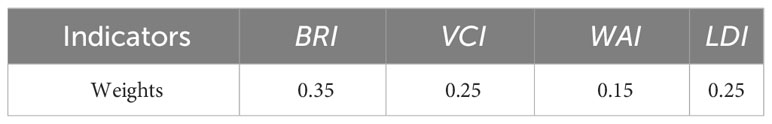
Table 3 Weight values of various indicators in IEEI.
2.3.1.1 Calculation method for the BRI
The BRI refers to the degree of abundance and poverty of organisms in an assessed area (Ministry of Environmental Protection of the People’s Republic of China, 2015). This indicator reflects the level of biodiversity in an area. Referring to the TCESE, the calculation method for the BRI is
where Abio is the normalization coefficient of the BRI according to the TCESE, Abio=100/Amax (Amax is the maximum value of an index before normalization), and w1, …, w6 are the weight values of the area of cultivated land (ACL), area of forest land (AFL), area of grassland (AG), area of water (AW), area of building land (ABL), and area of unused land (AUL) in Equation 2, respectively. Referring to the TCESE (State Environmental Protection Administration of the People’s Republic of China, 2006; Ministry of Environmental Protection of the People’s Republic of China, 2015), based on the actual situation in Yunnan, the values are shown in Table 4. ACL, AFL, AG, AW, ABL, and AUL are all LULC area data based on the interpretation of RS images; ATL refers to the total land area of a study area, and in this study, it refers to the areas of county-level administrative regions.
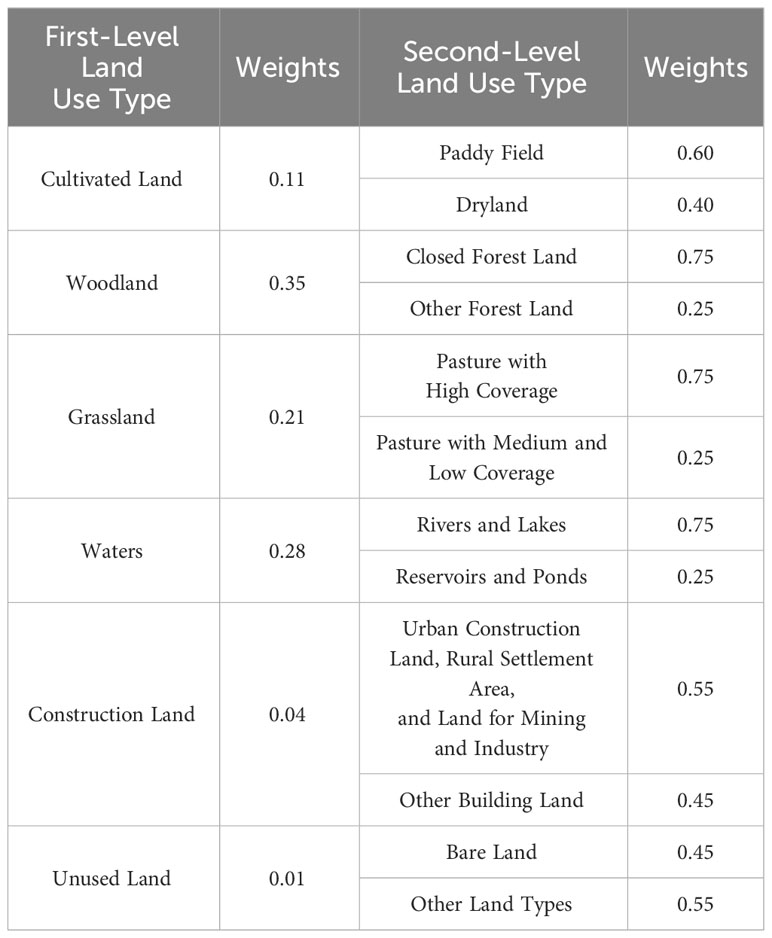
Table 4 Weight values of the BRI.
2.3.1.2 The Calculation method for the VCI
The VCI refers to the proportion of 5 types of land (excluding water), and it reflects the degree of vegetation coverage in a study area (State Environmental Protection Administration of the People’s Republic of China, 2006). Referring to the TCESE, the calculation method for the VCI is
where Aveg is the normalization coefficient of the VCI, which is calculated by using the same method as that for Abio; w1, …, w5 are the weight values of ACL, AFL, AG, ABL, and AUL in Equation 3, respectively. Referring to the TCESE (State Environmental Protection Administration of the People’s Republic of China, 2006), the values are shown in Table 5; ACL, AFL, AG, ABL, and AUL are all LULC area data based on the RS image interpretation.
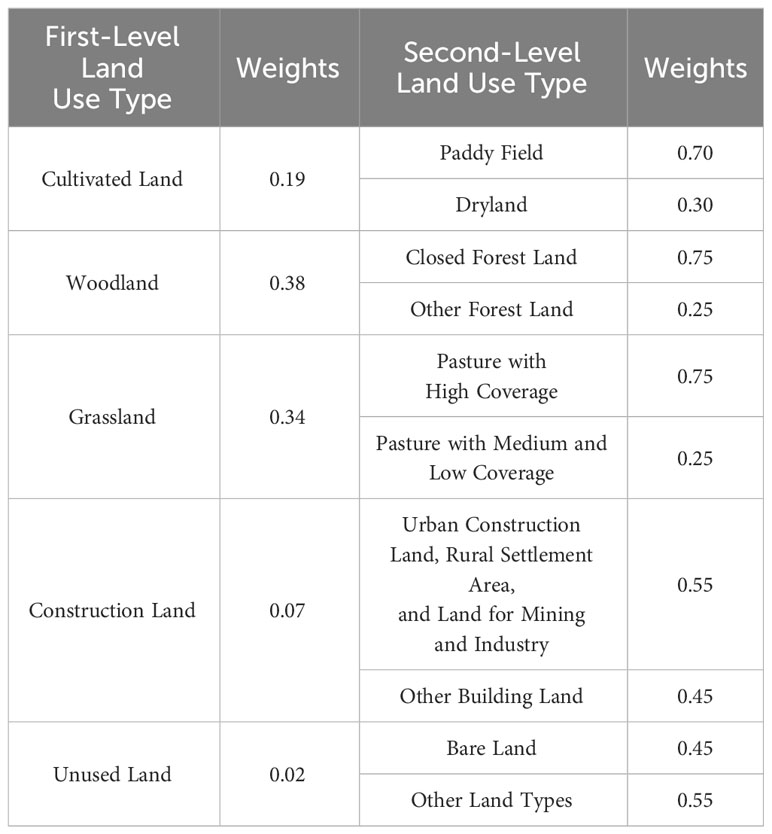
Table 5 Weight values of the VCI.
2.3.1.3 Calculation method for the WAI
The WAI refers to the proportion of the area of water in a study area (including rivers, lakes, reservoirs, ponds, and other water bodies), and it is used to reflect the richness of water in that area. The WAI is determined as follows:
where Awat is the normalization coefficient of the WAI, which is calculated by using the same method as that for Abio; the area of water (AW) in Equation 4 is LULC area data based on the RS image interpretation.
2.3.1.4 Calculation method for the LDI
According to TCESE-2006 (State Environmental Protection Administration of the People’s Republic of China, 2006), the LDI refers to the proportion of soil erosion areas in various types in the study area, and it is used to reflect the degree of land degradation in that area. TCESE-2006 assigns weight values for slight erosion, moderate erosion, and severe erosion. On this basis, based on the “Soil Erosion Classification and Grading Standard” (Ministry of Water Resources of the People’s Republic of China, 2008) and a multi-stage remote sensing survey of soil erosion carried out in Yunnan Province, this study assigned weight values to the five erosion levels (Table 6) and improved the calculation method for the LDI as follows:

Table 6 Weight values of the LDI.
where Aero is the normalization coefficient of the LDI, which is calculated by using the same method as that for Abio; w1, …, w5 are the weight values for the area of slight erosion (ASE), area of moderate erosion (AME), area of intensive erosion (AIE), area of very intensive erosion (AVIE), and area of drastic erosion (ADE) in Equation 5, respectively. ASE, AME, AIE, AVIE, and ADE are all areas with different levels of soil erosion, and they were interpreted according to the RS image data by referring to the previous soil erosion data from the RS survey in Yunnan Province and the Technical rules for applying remote sensing technology to survey the present situation of soil erosion in China and compiling the national soil erosion map formulated by the remote sensing center of the Ministry of Water Resources.
2.3.2 Classification of the integrated ecological effects and their ranges of change
Based on the calculated IEEI values and the Technical Criterion for Ecological Status Evaluation (TCESE) (State Environmental Protection Administration of the People’s Republic of China, 2006; Ministry of Environmental Protection of the People’s Republic of China, 2015) in combination with the actual situation in the province, the integrated ecological effect (IEE) of LUCC was divided into five levels: excellent, benign, medium, poor, and worse (Table 7).
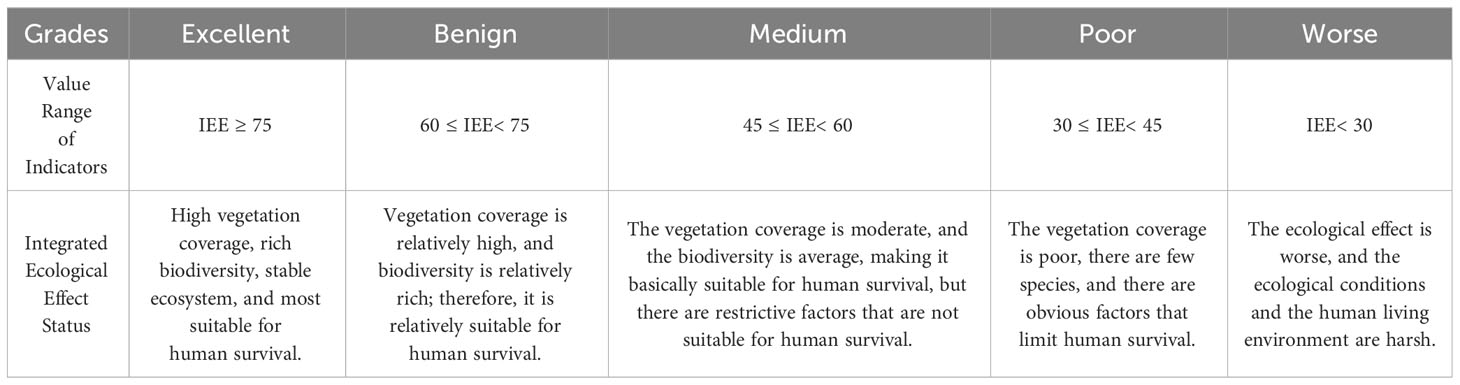
Table 7 Classification of the integrated ecological effect (IEE).
In addition, based on the range of changes in the values of the IEEI, the range of changes in integrated ecological effects can be graded. Referring to the Technical Criterion for Ecological Status Evaluation (TCESE) (State Environmental Protection Administration of the People’s Republic of China, 2006; Ministry of Environmental Protection of the People’s Republic of China, 2015), the range of changes in integrated ecological effects can be divided into four levels: no obvious change, slight change (good or bad), obvious change (good or bad), and significant change (good or bad), and they are described in Table 8.
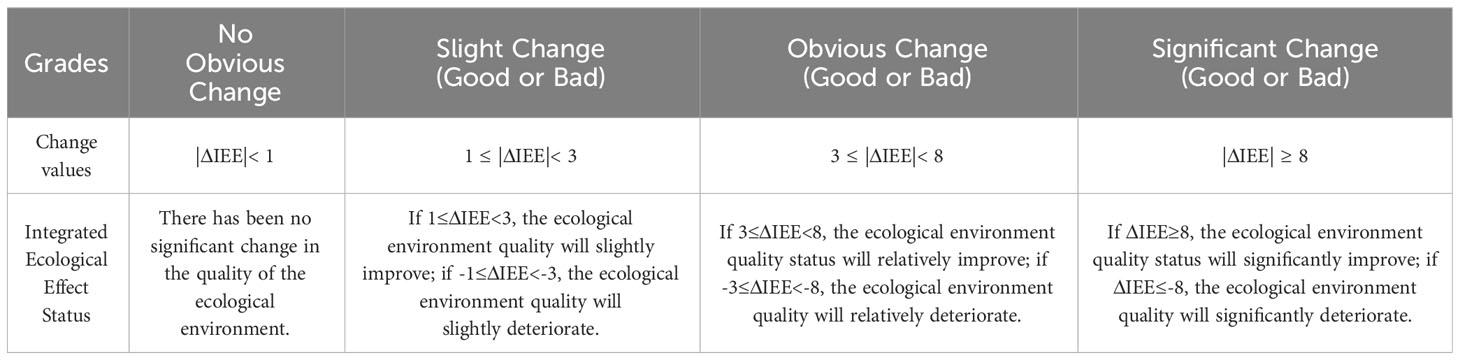
Table 8 Classification of the degree of change in the IEEI.
The overall technical framework of the study is presented in Figure 3.
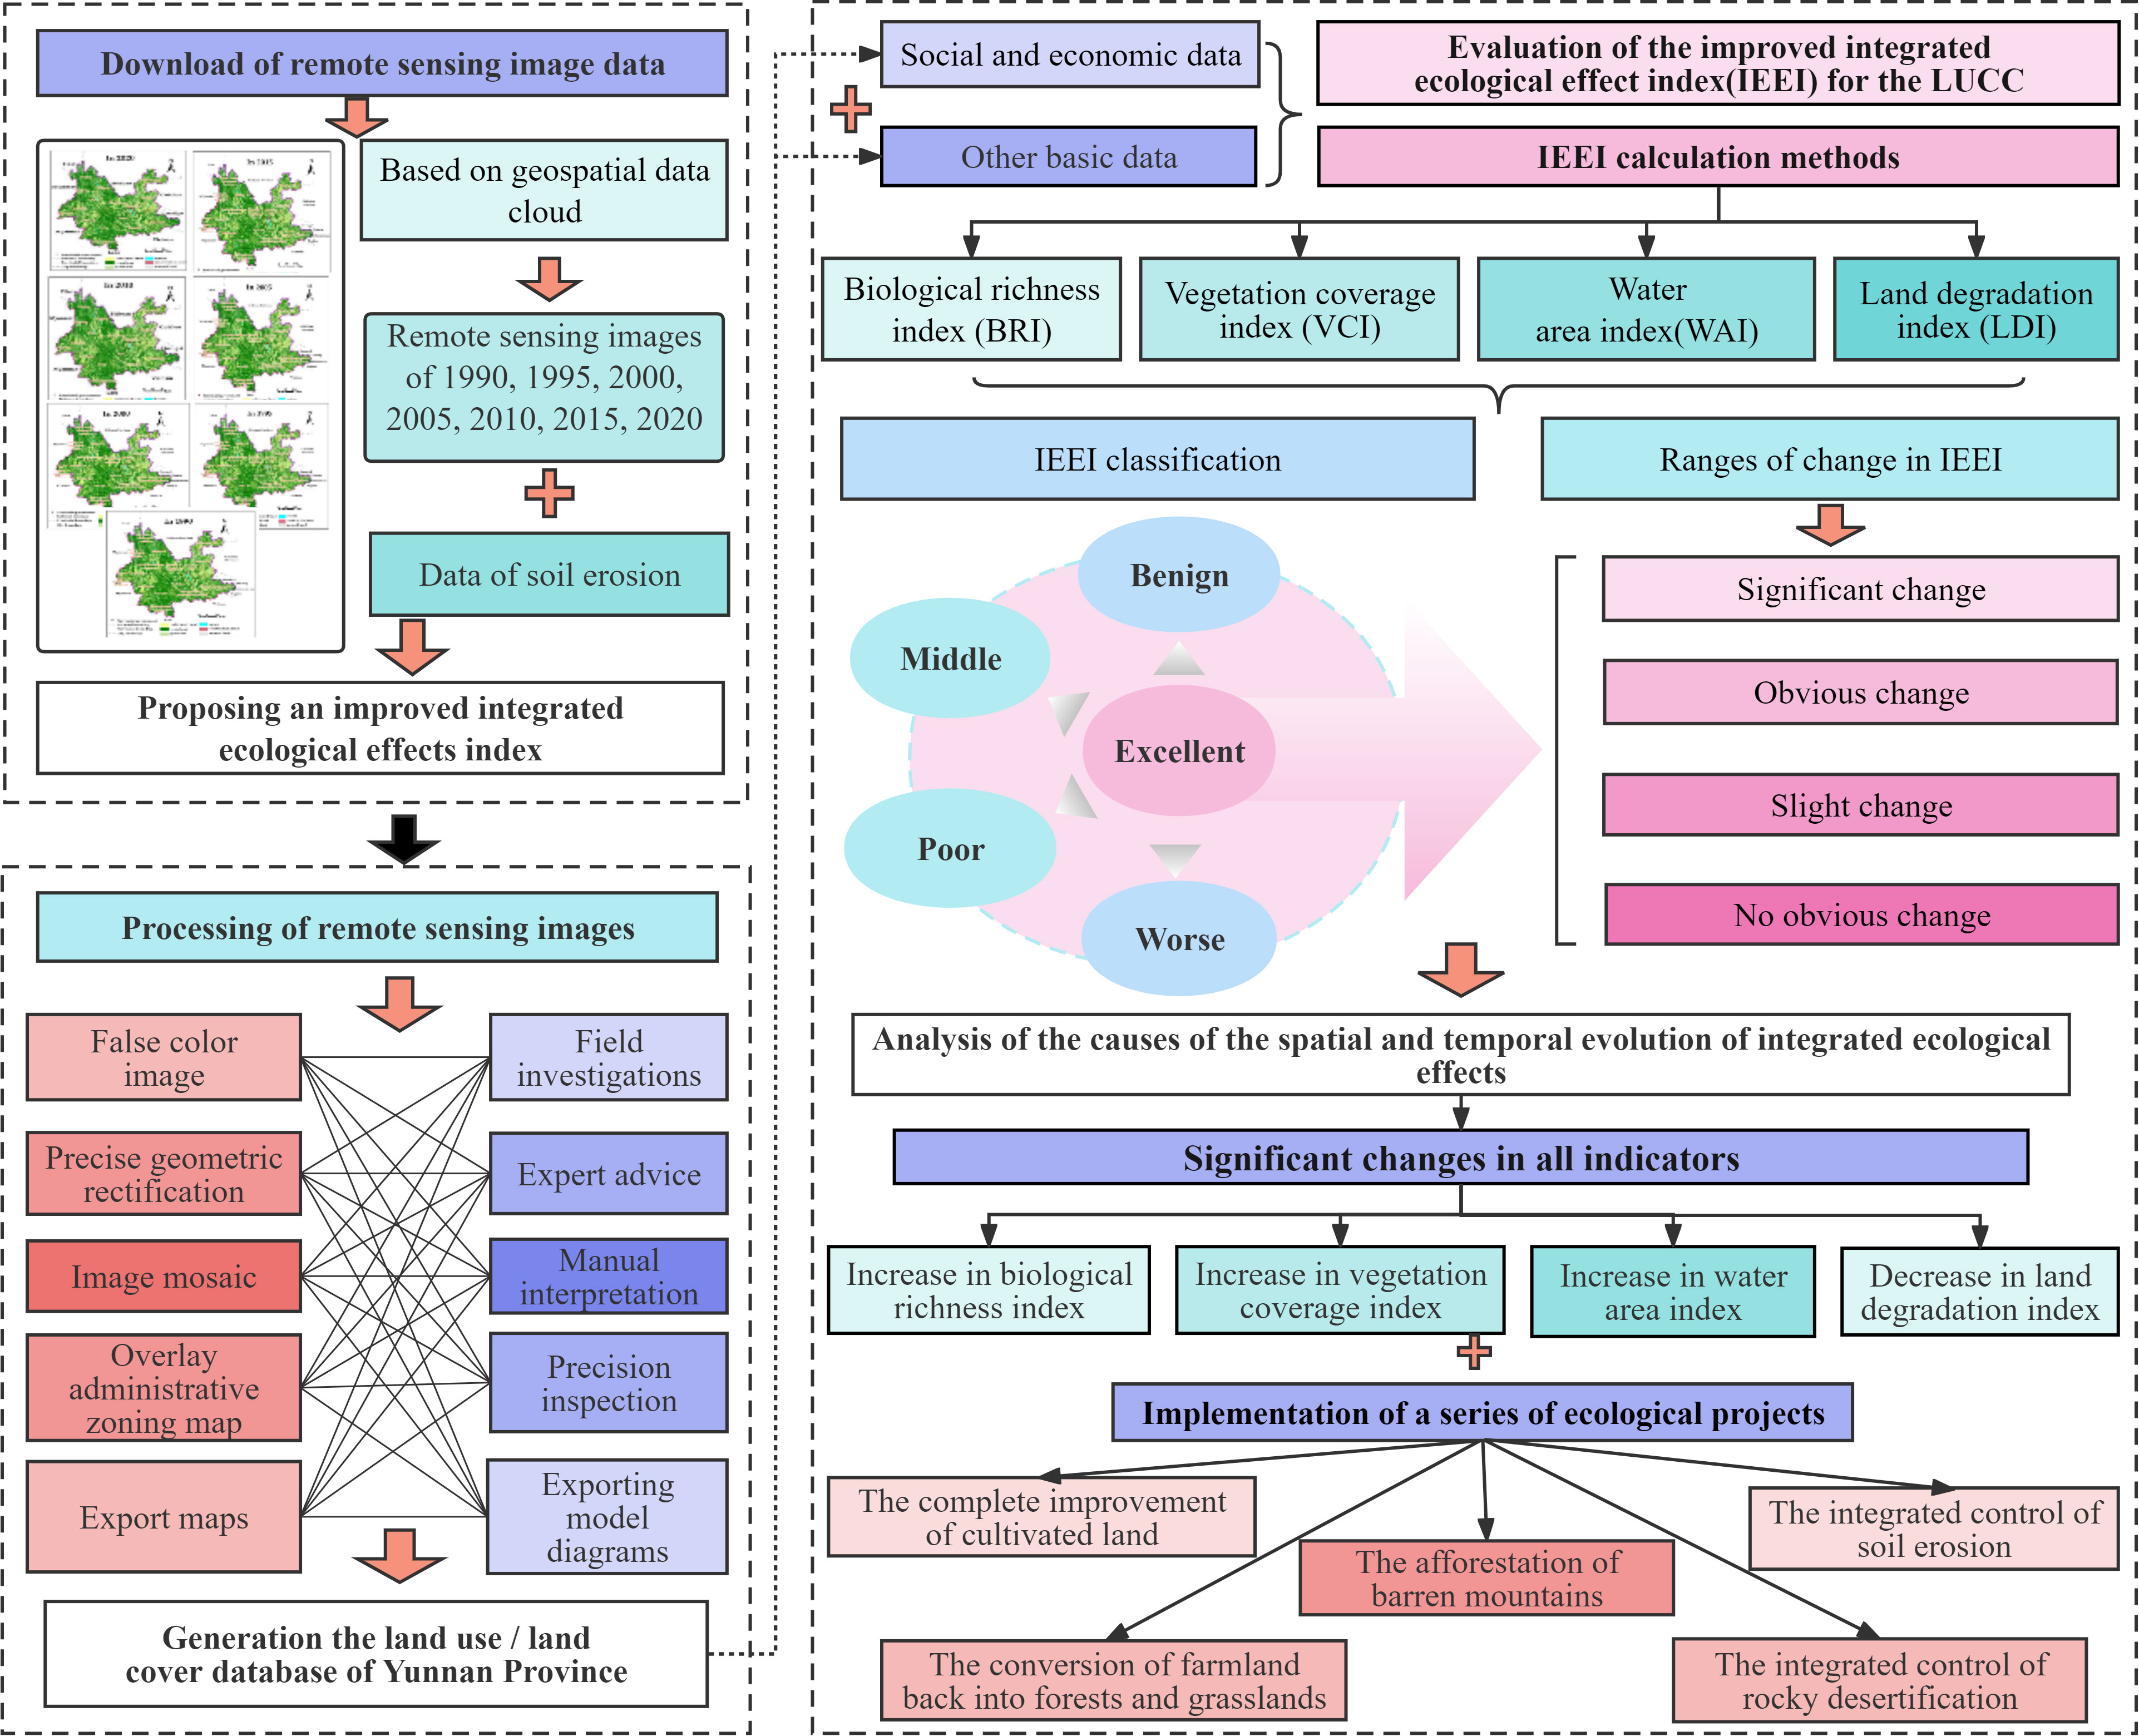
Figure 3 The technical framework of the study.
3 Results
The BRI, VCI, WAI, LDI, and IEEI of LUCC were quantitatively measured for 129 counties in the province in 1990, 1995, 2000, 2005, 2010, 2015, and 2020 in accordance with the improved IEE evaluation method described above. Maps depicting the evaluation of the IEE of LUCC in the 129 counties from 1990 to 2020 were compiled (Figure 4). According to the results, a spatiotemporal analysis of the IEE of LUCC in Yunnan Province was carried out.
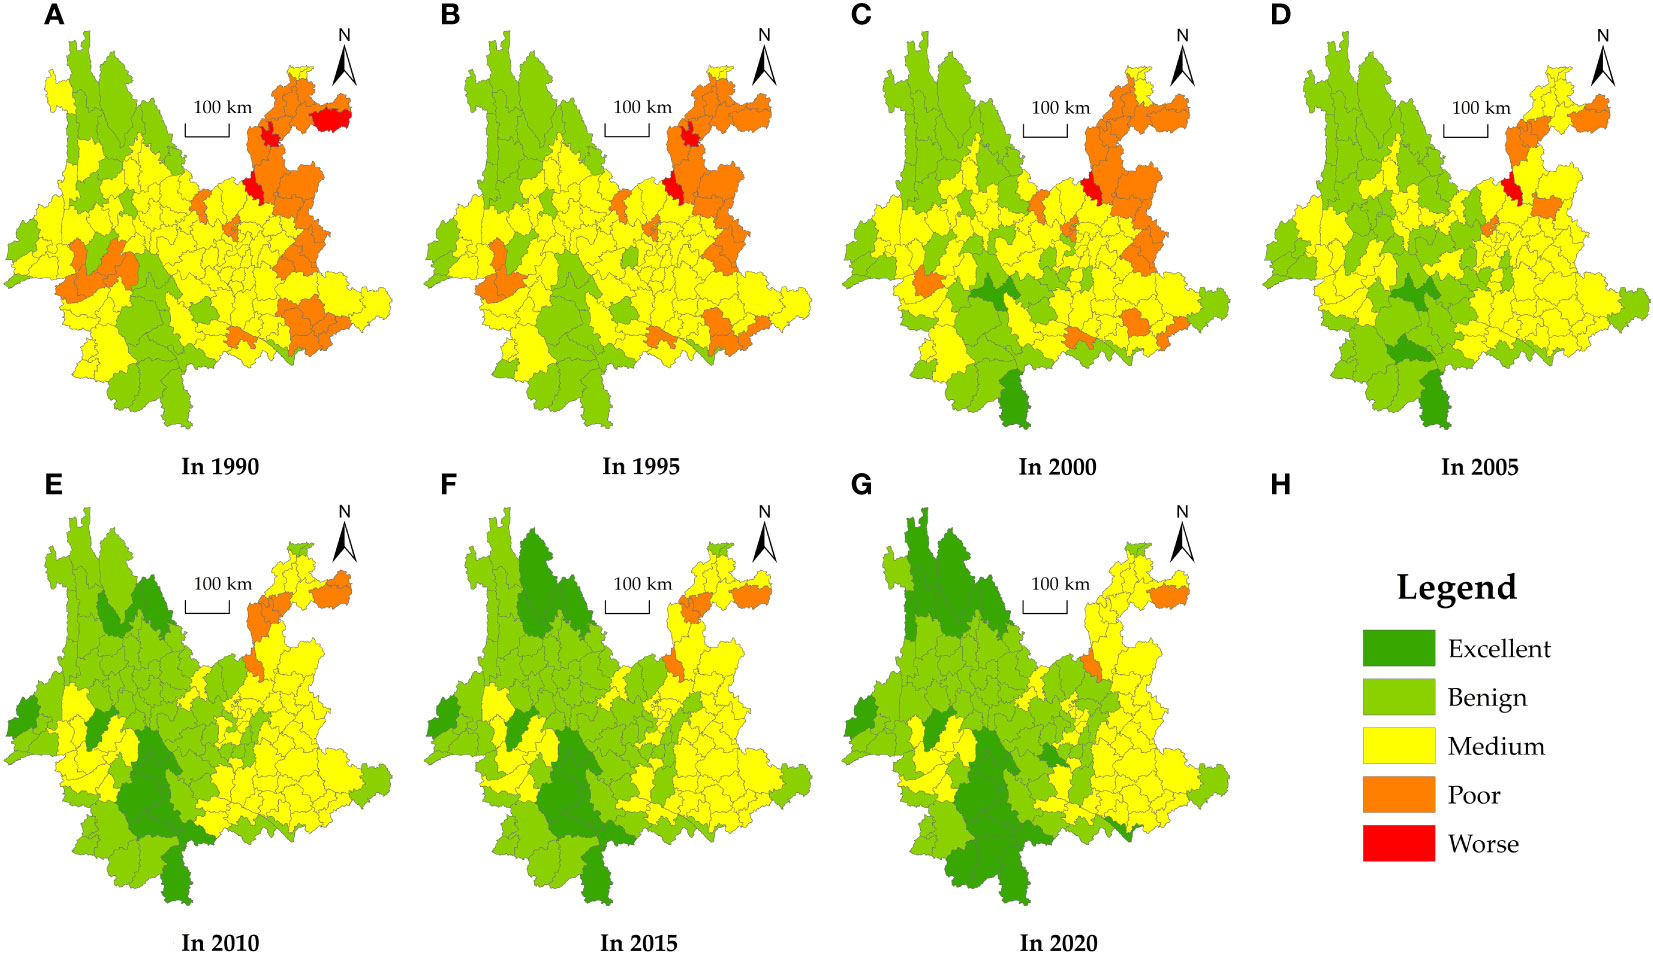
Figure 4 Maps of the evaluation of the IEE of LUCC at the county level in Yunnan from 1990 to 2020. (A) In 1990; (B) In 1995; (C) In 2000; (D) In 2005; (E) In 2010; (F) In 2015; (G) In 2020; (H) Legend.
3.1 The characteristics of the changes in the IEE in the last 30 years
Figure 4 illustrates the two main features of the changes in the integrated ecological effect index for LUCC and the IEE level in Yunnan between 1990 and 2020.
During the previous 30 years, the integrated ecological effect index for LUCC in Yunnan progressively increased, with the provincial-level integrated ecological effect level rising from “medium” to “benign”. The average IEEI of Yunnan in 1990 was 52.28, and it rose to 65.97 in 2020, resulting in a net increase of 13.69 and an average annual growth of 0.87%. Correspondingly, the integrated ecological effect level of the province increased from “medium” to “benign”. This indicated that the efforts to safeguard the natural environment and construct ecological civilization produced notable outcomes over the last 30 years, which is also a noteworthy accomplishment of Yunnan in its vigorous implementation of its leading strategy of ecological civilization construction (ECC).
The second finding was the significant regional differences in the changes in the integrated ecological effect index and integrated ecological effect level. According to the changes in the integrated ecological effect index and integrated ecological effect level of 16 states (cities) from 1990 to 2020, Diqing and Lijiang in northwest Yunnan, as well as Pu’er and Xishuangbanna in southern Yunnan, rose from a “benign” level to an “excellent” level; Yuxi, Chuxiong in central Yunnan, Dali in western Yunnan, and Dehong and Baoshan in southwestern Yunnan rose from a “medium” to a “benign” level; Zhaotong in northeastern Yunnan and Qujing in eastern Yunnan were upgraded from a “poor” to a “medium” level; Kunming, Lincang, Honghe, and Wenshan maintained a “medium” level without any changes; Nujiang in northwest Yunnan remained at the “benign” level without any changes in the hierarchy.
In terms of 129 counties’ IEE level and IEEI over the previous 30 years, the changes were relatively complex and could be roughly divided into the following nine categories: (1) “benign” level → “excellent” level, involving 18 counties and accounting for 13.95%; (2) from a “medium” level to an “excellent” level, involving 1 county and accounting for 0.78%; (3) from a “medium” level to a “benign” level, involving 53 counties and accounting for 41.09%; (4) “poor” level → “benign” level, involving 1 county and accounting for 0.78%; (5) “poor” level → “medium”, level involving 27 counties and accounting for 20.93%; (6) from a “worse” level to a “medium” level, involving 1 county and accounting for 0.78%; (7) “worse” level → “poor” level, involving 2 counties and accounting for 1.55%; (8) maintenance of a “benign” level (no change), involving 6 counties and accounting for 4.65%; (9) maintenance of a “medium” level (unchanged), involving 20 counties and accounting for 15.50%. The integrated ecological effect levels of 103 counties (79.84%) in the province improved over the last 30 years, while 26 counties (20.16%) witnessed little change in this regard.
It is worth pointing out that the 26 counties mentioned above that maintained the “benign” and “medium” levels without any changes showed a gradual upward trend in their actual IEEI values, but with only a small increase.
This dynamic evolution resulted in corresponding changes in the quantity of counties with varying degrees of IEE from 1990 to 2020. The fundamental rule was that the number of counties with smaller integrated ecological effects significantly decreased, while the number of counties with greater integrated ecological effects significantly increased (Table 9). The number with a “worse” level decreased from 3 counties in 1990 to 0 counties in 2020; the number with a “poor” level was reduced from 28 counties in 1990 to 2 counties in 2020; the number with a “medium” level was reduced from 74 counties in 1990 to 48 counties in 2020; the number with a “benign” level increased from 24 counties in 1990 to 59 counties in 2020; the number with an “excellent” level increased from 0 counties in 1990 to 20 counties in 2020.
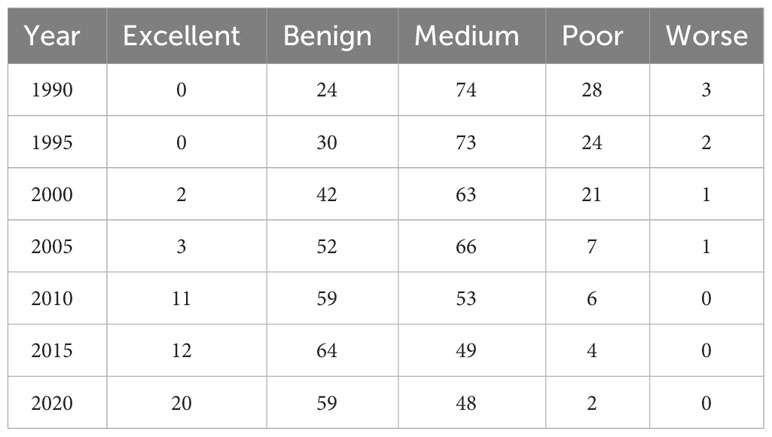
Table 9 Statistics on the numbers of counties with different integrated ecological effect levels for LUCC in Yunnan from 1990 to 2020.
3.2 Spatial differences in the integrated Ecological Effects of LUCC in Yunnan
According to the findings from the outcomes for 2020, the average IEEI value increased to 65.97, indicating that the overall integrated ecological effect of the province was upgraded to the “benign” level. Nonetheless, the province’s entire ecological effect varied significantly by location. Overall, the province’s IEE was lower in the mountainous karst regions of northeastern, eastern, and southeastern Yunnan and higher in the regions of western, southern, southwest, and northwestern Yunnan (Figure 4). From a county-level standpoint, the IEE was still not high. In 2020, 37.02% of the counties (48 counties) were still at the “medium” level, while Zhenxiong and Dongchuan were still at the “poor” level.
4 Discussion
This study presents an improved integrated ecological effect index for LUCC and a method of evaluating it on the basis of interpretations of RS images and soil erosion data from seven periods of LULC data in Yunnan Province. These were applied for the calculation and analysis of the spatiotemporal evolution of the integrated ecological effect index for LUCC in 129 counties from 1990 to 2020. The IEEI includes four indicators, namely, the BRI, VCI, WAI, and LDI. These four aspects mainly concentrate on the LULC status, land resource transformation level, and ecological environment protection level. In general, from 1990 to 2020, Yunnan progressively attached more importance to eco-environmental protection and construction, leading to the development of LULC in the direction of “ecological friendliness”. This is reflected in the forest coverage rate (FCR), proportion of bare land area (PBLA), IBR, VCI, and WAI, as well as the LDI; these all showed significant improvements, which was the fundamental cause of the gradual enhancement of the overall ecological environment in the province and most counties over the last 30 years. This also accurately depicts the visible accomplishments made in eco-environmental protection and construction over the last 30 years—particularly the noteworthy accomplishments in putting the vanguard approach of eco-civilization construction into action with vigor in recent years.
In general, due to Yunnan Province’s strong emphasis on ecological construction and environmental protection, as well as its implementation of the “ecological establishment and environmental priority” strategy, the province’s overall integrated ecological effect—that is, integrated ecological quality—gradually improved over the last 30 years. It has vigorously promoted terrain greening, the conversion of farmland back into forests and grasslands, the preservation of natural forests, building public welfare forests, the creation of a protective forest system, the restoration of grassland ecology, thorough control of the rocky desertification process, and integrated management of key ecological projects related to soil erosion and biodiversity conservation. These enormous safeguarding and governing efforts have effectively promoted the continuous improvement of the ecological environment, significantly heightened forest coverage, and steadily enhanced ecological service functions. From a provincial perspective, the land use situation from 2000 to 2020 showed a characteristic of “three increases and three decreases”. The so-called “three increases” refer to significant increases in AFL, AW, and ABL in the past 30 years, while the “three decreases” refer to significant decreases in ACL, AG, and AUL (Table 3). Among these changes, the most closely related to the improvement of integrated ecological effects is the significant increase in AFL; the AFL value in the province increased from 18.6892 million hectares in 1990 to 24.1867 million hectares in 2020. Correspondingly, the proportion of forest land area increased from 48.64% in 1990 to 62.95% in 2020, growing at an average yearly rate of 0.98%. The closed forest land with high ecological value increased from 11.1291 million hectares in 1990 to 18.8472 million hectares in 2020. Correspondingly, the forest coverage rate (i.e., the percentage of closed forest land area with respect to forest land and total land area) increased from 28.96% in 1990 to 49.05% in 2020, exhibiting an average yearly growth rate of 2.31%. In addition, the reduction of other land (especially bare land) also contributed to the integrated ecological effect to a certain extent, with the province’s bare land area decreasing from 1,055,600 hectares in 1990 to 648,300 hectares in 2020; accordingly, the proportion of bare land area decreased from 2.75% in 1990 to 1.69%, with a 1.29% annual decline on average. In the last thirty years, the characteristics of various indicators of the integrated ecological effect (integrated ecological quality) of LUCC have significantly improved (Table 10). The average BRI in the province increased from 57.06 in 1990 to 74.32 in 2020, with an average annual increase of 1.01%; the VCI increased from 61.24 in 1990 to 75.60 in 2020, with an average annual increase of 0.78%; the WAI increased from 5.78 in 1990 to 6.73 in 2020, with an average annual increase of 0.55%. In addition, the province’s areas undergoing soil erosion gradually decreased as a result of the execution of a number of ecological projects, including the complete improvement of cultivated land, the conversion of farmland back into forests and grasslands, the afforestation of barren mountains, the integrated control of rocky desertification, and the integrated control of soil erosion. The percentage of the land eroded by soil (including the sum of areas undergoing soil erosion at all levels) declined from 39.99% in 1990 to 25.55% in 2020, and correspondingly, the average LDI in the province decreased from 35.46 in 1990 to 19.79 in 2020, with an average annual decrease of 1.47%.
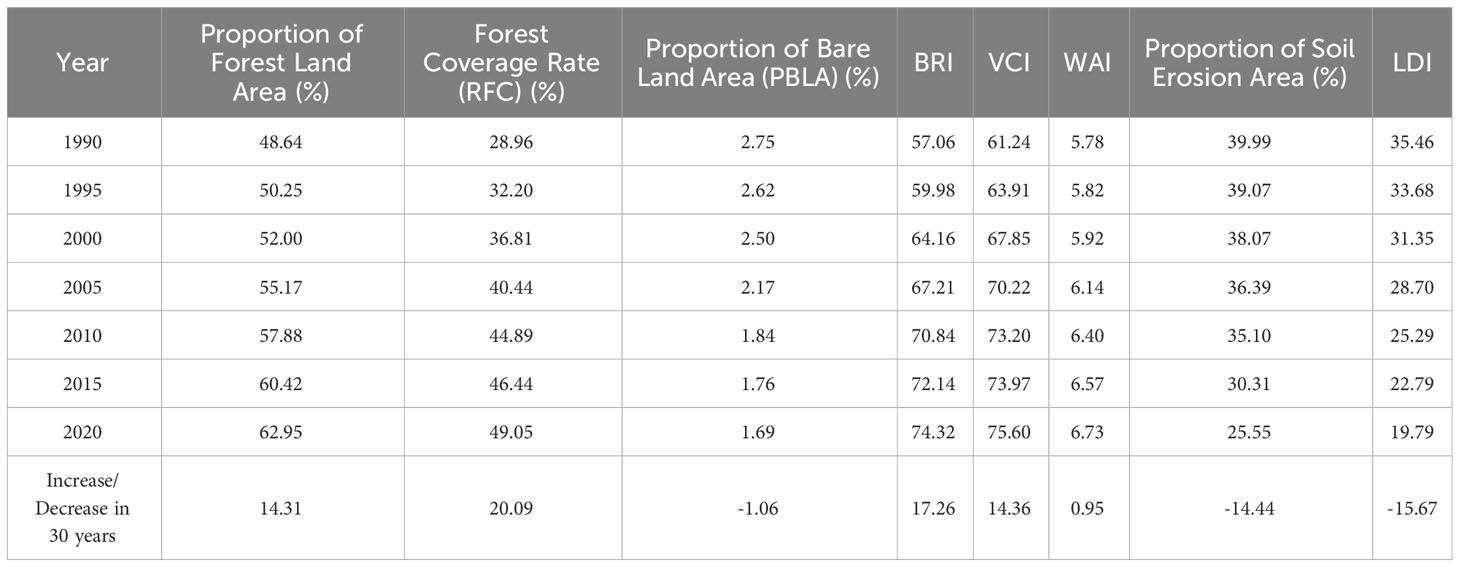
Table 10 The modifications of the main ecological effect indexes caused by LUCC in Yunnan from 1990 to 2020.
The situation in most counties is similar to the overall characteristics of Yunnan Province. In the past 30 years, the characteristics of LUCC had significantly improved various indicators that affect the integrated ecological effect. Taking the most important and typical index of forest coverage rate (FCR) as an example, as shown in Table 11, the forest coverage rate (FCR) of each county in the province has been significantly improved in the past 30 years. In 1990, none of them in the province had a FCR over 70%. While in 2020, there were 8 counties had the FCR over 70%. Also, in 1990, there were only 3 counties with a FCR of 50% to 70% in the province; while it increased to 44 counties in 2020, with an increase of 14.7 times. In addition, in 1990, there were 72 counties with a FCR of 10% to 30% in the province, while it had decreased to 27 counties in 2020, with a decrease of 62.50%. Furthermore, in 1990, there were 12 counties with a FCR of less than 10% in the province; while all counties had the FCR over 10% in 2020. The basic pattern of change is that the number of counties with lower FCR significantly decreases, while the number of counties with higher FCR significantly increases. From 1990 to 2020, there were 40 counties in the province saw a more than double increase in FCR, accounting for 31.01% of the total number of counties; there were 89 counties have increased their FCR by 1~2 times, accounting for 68.99%. More importantly, the overall FCR in Yunnan Province shows a trend of lower in the east and higher in the west, with a spatial pattern very similar to the IEEI. This feature not only further demonstrates the scientificity of using IEEI indicators to measure the integrated ecological effects of Yunnan, but also further explains the reasons for the ecological improvement in Yunnan in the past 30 years from another perspective. This is the basic reason for the gradual improvement of the overall IEEI in Yunnan and most counties. This also fully reflects the significant achievements of ecological environment protection and construction in Yunnan in the past 30 years, especially the important achievements of Yunnan in vanguard of ecological civilization construction (VECC) in recent years.
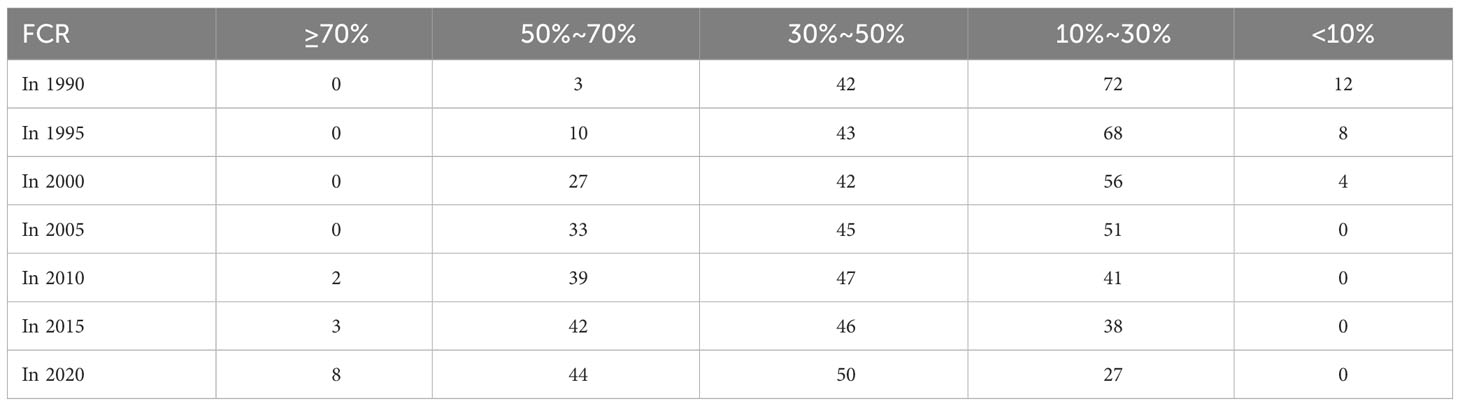
Table 11 Statistics of Counties with Different Levels of Forest Coverage Rate in Yunnan Province from 1990 to 2020.
In addition to the direct impact of ecological indicators such as FCR, population and economic development also have an important impact on the IEEI. From the perspective of population status, the main impact is that rural population has a greater impact on land use change. Overall, in the 30 years since 1990, due to the development of urbanization, the proportion of rural population in Yunnan has gradually decreased (Figure 5): in 1990, the proportion of agricultural population in Yunnan accounting for 87.70% of the total population; in 2000, the proportion of rural population decreased to 76.64%, and in 2010, it decreased to 65.19%; and in 2020, the proportion of rural population has decreased to 49.95%. The result of the decrease in the proportion of rural population has led to a significant reduction in the previous irrational development and utilization of land, such as deforestation, grassland reclamation, and steep slope cultivation. Correspondingly, the forest and grassland vegetation in mountainous areas has gradually recovered.
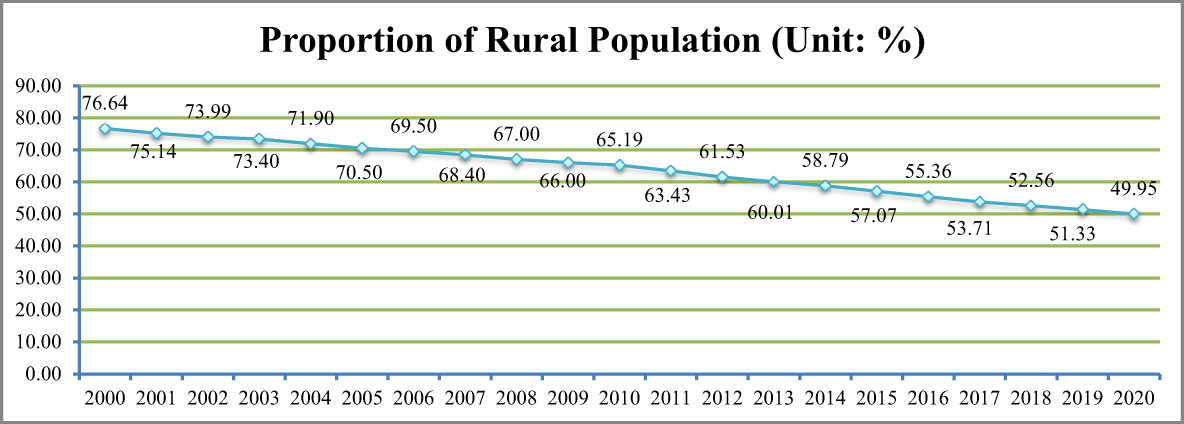
Figure 5 Changes in the Proportion of Rural Population in Yunnan from 2000 to 2020.
From the perspective of economic development, in the past 30 years, the economic development level of Yunnan and 129 counties has significantly improved, which is of great significance for the ecological construction and environmental protection (Figure 6). Taking the per capita GDP indicator as an example, compared to 1990 and 2020, there were 29 counties in the province having a per capita GDP increase of more than 50 times, accounting for 22.48% of the total number of counties; there were 71 counties having a 30-50 times increase, accounting for 55.04%; there were 20 counties having increased a 20-30 times increase, accounting for 15.50%; there were 9 counties having increased a 12-20 times increase, accounting for 6.98%. The rapid growth of GDP has given Yunnan and 129 counties strong economic foundation to invest in a series of ecological projects such as the project of converting farmland to forest (PCFF) on steep slopes, greening barren mountains, managing degraded land, and protecting the ecological environment of large rivers. This has greatly promoted the improvement of the ecological environment, thus enhancing the IEEI.

Figure 6 Changes in per capita GDP of Yunnan in 1990 and 2020. (A) Per Capita GDP in Yunnan in 1990 (Unit: CNY/Person); (B) Per Capita GDP in Yunnan in 2020 (Unit: CNY/Person).
However, the overall ecological effect (ecological environment quality) of Yunnan was not very high, which was an integrated reflection of the “innate” natural environmental conditions, such as the terrain and climate, as well as the long-term situation of excessive land development, the extent of resource transformation (remediation), and the eco-environmental protection level. From the viewpoint of the “innate” terrain, about 77% of the land has a slope of more than 15°, and nearly 40% of the land is steep with a slope greater than 25°; more than 56% of the counties have a steep slope–land ratio of over 30%, while more than 1/5 of the counties have a steep slope–land ratio of over 50% (Office of Yunnan Provincial Agricultural Zoning Commission, 1987). The outcome of the sustained overuse and development of land was especially reflected in excessive cultivation (encompassing farming and deforestation on steep slopes), and some mountainous areas even maintained primitive, extensive, and backward development and utilization methods, leading to the long-term, widespread usage of slope agriculture, with steep-slope farmland accounting for a considerable proportion (Yang et al., 2014). Farmland with a slope of 15°–25° accounted for over 1/4, the proportion of farmland with a steep slope of above 25° accounted for 18.64% (including terraced fields with a slope greater than 25°) (Office of the Leading Group of the Third National Land Survey of Yunnan Province et al., 2021). The area of suitable farmland in the province (including existing farmland and unused farmland) was 4,707,600 hectares, with a suitable cultivation rate of only 12.25%. However, the actual cultivation rate in 2020 reached 14.04%. The overcultivated area in the province reached 688,000 hectares, accounting for 14.62% (i.e., the overcultivation rate). Each county had varying degrees of overdevelopment and use. In addition, 68.22% of the counties in the province had an overcultivation rate of over 10%, and nearly 1/4 of the counties had an overcultivation rate of over 20%. This was one of the root causes of soil erosion and the overall poor ecological environment of the land in Yunnan. On the other hand, the corresponding measures for resource transformation (remediation) and ecological environment protection have failed to keep up. For example, soil erosion in the province is still relatively significant. Based on the findings of this RS image survey, the percentage of areas undergoing soil erosion in the province in 2020 was still 25.55%. Slight erosion accounted for 67.73%, moderate erosion accounted for 14.14%, intensive erosion accounted for 8.85%, very intensive erosion accounted for 6.41%, and drastic erosion accounted for 2.88%. The majority of the province’s counties had varying scales of bare land distribution because of the long-term effects of various intensities and means of land development and exploitation. In 2020, the province’s proportion of bare land area was 1.69%.
The LULC status and the state of construction of the ecological environment in different regions were related to the notable regional variations in the province’s overall ecological effects (quality of the ecological environment). For example, from the perspective of forest coverage, overall, the forest coverage rate was comparatively high in the high-altitude plateau canyon region in northwest Yunnan and the middle and low wide-valley basin area in southern and southwestern Yunnan, with Nujiang, Diqing, Lijiang, Pu’er, and Xishuangbanna reaching 63% to 68% and Dehong, Baoshan, and Dali reaching 54% to 58%; Kunming, Honghe, Wenshan, Qujing, and Zhaotong generally had low forest coverage rates, which were all below 36%, with Qujing and Zhaotong both being below 29%. From a county-level viewpoint, the province had 50 counties with a forest coverage rate of less than 40%, of which 9 had a rate of less than 20%. In Wenshan and Diqing, the percentage of bare land was around 8%. Looking at the province from the perspective of the counties, there were 55 counties with a bare land area ratio of more than 1%, of which 6 had a ratio of 5% to 10% and 5 had a ratio of more than 10%. The differences in the biological richness index and vegetation cover index among the different regions were quite prominent. In addition, 30.01% of counties in the province had a biological richness index below 60, with 17 counties having a biological richness index below 50; 27.13% of the counties in the province had a vegetation coverage index below 60, with 12 counties having a vegetation coverage index below 50. In addition, for the ratio of the amount of soil erosion to the entire area of land, 73.64% of the counties in the province had a value of over 20%, and 28.68% of these had a value of over 30%, and eight counties had a value of over 40%.
Therefore, major ecological protection and restoration measures must be immediately implemented in accordance with the local conditions, especially in the regions of high mountains and canyons of the Nu River and Lancang River, the dry and hot valley regions that are mainly predominated by the Jinsha River, and the rocky regions of Yunnan that are being desertified in the east and southeast, as these are particularly ecologically vulnerable areas (Development and Reform Commission of Yunnan Province et al., 2021). For the purpose of promoting the sustainability of land use and the development of the economy and society, it is necessary to improve the integrated ecological effects. Consequently, it is necessary to implement eco-friendly land use methods throughout the province, effectively increase the efforts of eco-civilization construction, effectively implement the “Yunnan Province Ecological Civilization Construction Vanguard Plan (2021–2025)” (The CPC Yunnan Provincial Committee, the People’s Government of Yunnan Province, 2022), and adopt sensible and efficient construction and eco-environment protection strategies based on local circumstances—particularly in accordance with the principles of ecological suitability and environmental friendliness—to reasonably develop and utilize various resources, fulfill the construction of beautiful areas, ensure provincial eco-environmental safety, steadily improve the integrated ecological effects of various regions, and ensure the sustainability of regional growth and the coherence of the system of population, resources, environment, and economic development. Regarding counties with evaluation results of “medium” and “poor” levels, it is necessary to fundamentally reverse the way in which resources are developed and utilized and take important measures for construction and eco-environment preservation to dramatically improve their integrated ecological effects, thus gradually enhancing the coherence of the system of population, resources, environment, and economy and the sustainability of regional development.
The evaluation of the integrated ecological effect of LUCC conducted in this study has obvious innovations in comparison with the existing literature. This is mainly because the study started from the interpretation of LUCC according to RS images and used modern RS technology to investigate soil erosion data. An improved integrated ecological effect index for LUCC was proposed and applied for the calculation and analysis of the spatiotemporal evolution of the integrated ecological effect index for LUCC in 129 counties in Yunnan Province from 1990 to 2020. This innovative research is of great significance for further enrichment and development of the theory and methods of evaluation of the ecological effects of LUCC. At the same time, from the perspective of practical needs, this study identified a technique for both quantitative analysis and qualitative assessment of the degree of integrated ecological effects and its patterns of variation in the mountainous regions of Yunnan Province and similar mountainous areas, thereby providing a basic reference and technological assistance for the scientific formulation of sustainable development strategies and management in mountainous areas.
On the other hand, from the viewpoint of the interpretation of LUCC according to RS images, researching the characteristics and laws of the spatiotemporal evolution of integrated regional ecological quality is a refinement and growth of earlier studies of ecological quality. LUCC frequently has a major effect on biodiversity, biogeochemical cycles, climate change, and ecosystems in various regions, thereby affecting the regional ecological quality and sustainable development. Consequently, since the 1990s, LUCC has become central content in research on environmental change around the world, and research results are constantly emerging. During the last several years, research on LUCC has grown to be a freestanding, multidisciplinary field named land change science (LCS) (Lu et al., 2006), which resulted in the establishment of the global land plan (GLP) project’s land system science (LSS) research group; thus, land system science (LSS) was formed. Improving ecological quality, increasing the sustainability of land use, and promoting the sustainability of regional development are the ultimate goals of both LCS and LSS research (TurnerII and Munroe, 2020; Verburg et al., 2015; Nielsen et al., 2019). Therefore, this study can, to some extent, encourage the additional refinement of research on land use changes based on remote sensing and promote the application of land change science and land system science in the areas of regional development and sustainable land use.
It should also be pointed out that although this study proposes an improved integrated ecological effect index and its evaluation method to address the problems and limitations of various LUCC ecological effect evaluation methods, which have significantly advanced research in this area, there are undoubtedly some limitations in this research, mainly due to the limitations of basic data. In the calculation of the IEEI, environmental quality (such as air quality, water quality, etc.) and sudden ecological environmental events were not considered. In future research, this study will integrate environmental quality factors and the impact of sudden ecological events as much as possible, and further improve the calculation and evaluation methods of the IEEI.
5 Conclusions
The basis of this research was LUCC data obtained by interpreting remote sensing images from Yunnan Province in seven periods (1990, 1995, 2000, 2005, 2010, 2015, and 2020). County-level administrative regions were used as the evaluation units, and a combination of multiple quantitative indicators with an integrated evaluation approach and a comprehensive qualitative analysis method was used to build a system for evaluating the integrated ecological effect index for LUCC in 129 counties in the province. Based on this, the integrated ecological effects of LUCC in the 129 counties in 1990, 1995, 2000, 2005, 2010, 2015, and 2020 were measured, and these were used to analyze the features of the ecological effects of LUCC in each county in an integrated way. The results indicated the following.
(1) From 1990 to 2020, the integrated ecological effect index for LUCC in Yunnan Province gradually increased, with an average annual increase of 0.87%. As manifested by the degree of integrated ecological effects, the province rose from a “medium” level in the 1990s to a “benign” level in 2020. This indicated that the eco-environmental protection and construction achieved significant outcomes throughout the previous 30 years, which was also a noteworthy accomplishment of Yunnan Province in vigorously implementing the vanguard strategy of construction of eco-civilization.
(2) The integrated ecological effect index for LUCC in 129 counties increased to different levels in the last 30 years. According to the variations in the levels of integrated ecological effects, in the last 30 years, 103 counties (accounting for 79.84% of all of the counties in the province) improved their levels. The integrated ecological effect levels of 26 counties (accounting for 20.16%) did not change, but their actual IEEI values showed a gradual upward trend, with only a small increase. The basic law of the number of counties with different levels of integrated ecological effects in the province over the last 30 years was that the number of counties with smaller integrated ecological effects significantly decreased, while the number of counties with greater integrated ecological effects significantly increased.
(3) The regional differences in the integrated ecological effects of LUCC within the province were significant. The overall ecological effect was comparatively lower in the mountainous regions of northeastern, eastern, and karst southeast Yunnan and higher in the southern, southwestern, western, northwest, and central parts of Yunnan.
(4) Overall, the integrated ecological effect of Yunnan is not yet very high. From a county-level perspective, 48 counties (37.02%) were still at the “medium” level in 2020, while Zhenxiong and Dongchuan were still at the “poor” level. It is essential to promote the creation of an ecological civilization across the entire province, adopt practical, effective, and eco-friendly land use practices and eco-environmental protection and construction practices tailored to the local context, steadily improve the integrated ecological quality of various regions, and ensure the coherence of systems and regional sustainable development.
Data availability statement
The original contributions presented in the study are included in the article/supplementary material. The RS image data were collected from https://www.resdc.cn/ (accessed on 18 January 2023). The DEM data were collected from http://www.gscloud.cn (accessed on 25 February 2023). The county boundaries of Yunnan Province were collected from "https://yunnan.tianditu.gov.cn/MapResource" (accessed on 7 March 2023).
Author contributions
RY: Conceptualization, Data curation, Investigation, Methodology, Resources, Software, Validation, Writing – original draft, Writing – review & editing. ZY: Data curation, Formal analysis, Funding acquisition, Methodology, Project administration, Resources, Software, Supervision, Validation, Visualization, Writing – original draft, Writing – review & editing. CZ: Funding acquisition, Project administration, Supervision, Validation, Writing – original draft, Writing – review & editing. YH: Data curation, Formal analysis, Investigation, Methodology, Resources, Visualization, Writing – original draft, Writing – review & editing.
Funding
The author(s) declare financial support was received for the research, authorship, and/or publication of this article. the National Natural Science Foundation of China (41261018); the National Natural Science Foundation of China (71673182); the Major Projects of National Social Science Foundation of China (18VSJ023).
Conflict of interest
The authors declare that the research was conducted in the absence of any commercial or financial relationships that could be construed as a potential conflict of interest.
Publisher’s note
All claims expressed in this article are solely those of the authors and do not necessarily represent those of their affiliated organizations, or those of the publisher, the editors and the reviewers. Any product that may be evaluated in this article, or claim that may be made by its manufacturer, is not guaranteed or endorsed by the publisher.
References
Cai Z. C., Zhang Z., Zhao F., Guo X. H., Zhao J. B., Xu Y. Y., et al. (2023). Assessment of eco-environmental quality changes and spatial heterogeneity in the Yellow River Delta based on the remote sensing ecological index and geo-detector model. Ecol. Inf. 77, 102203. doi: 10.1016/j.ecoinf.2023.102203.
Department of Natural Resources of Yunnan Province The 14th five-year plan for the prevention and control of geological disasters in Yunnan Province (2021-2025). Available online at: http://dnr.yn.gov.cn/html/2022-8/102349_1.html (Accessed 30 August 2022).
Development and Reform Commission of Yunnan Province, Department of Natural Resources of Yunnan Province, Forest and Grassland Bureau of Yunnan Province Master Plan of Major Projects for Protection and Restoration of Important Ecosystems in Yunnan province (2021-2035). Available online at: http://lcj.yn.gov.cn/html/2021/fazhanguihua1202/64715.html (Accessed 2 December 2021).
General Office of the People’s Government of Yunnan Province The 14th five-year plan for integrated disaster prevention, reduction and relief in Yunnan Province. Available online at: http://www.yn.gov.cn/zwgk/zcwj/zxwj/202204/t20220406_240190.html (Accessed 6 April 2022).
IGBP (2005). Science Plan and Implementation Strategy. 1st ed (Stockholm, Sweden: IGBP Secretariat).
Jonathan A. F., Ruth D., Gregory P. A., Carol A., Gordon B., Stephen R. C., et al. (2005). Global consequences of land use. Science 309, 570–574. doi: 10.1126/science.1111772.
Kuang W. H., Zhang S. W., Du G. M., Yan C. Z., Wu S. X., Li R. D., et al. (2022). Remotely sensed mapping and analysis of spatio-temporal patterns of land use change across China in 2015–2020. Acta Geograph. Sin. 77, 1056–1071. doi: 10.11821/dlxb202205002
Lambin E., Baulies X., Bockstael N., Fischer G., Krug T., Leemans R., et al. (1999). Land-use and land-cover change: Implementation strategy. 1st ed (Stockhdm, Sweden and Bonn, Germany: Scientific Steering Committee and International Project Office of LUCC).
Li X. B. (1996). A review of the international researches on land use/land cover change. Acta Geographica Sin. 51, 553–558. doi: 10.11821/xb199606009
Li X. W., Fang C. L., Huang J. C., Mao H. Y. (2003). The urban land use transformations and associated effects on eco-environment in northwest China arid region: a case study in Hexi region, Gansu Province. Quaternary Sci. 23, 280–290.
Liao W. H., Jiang W. G. (2020). Evaluation of the spatiotemporal variations in the eco-environmental quality in China based on the remote sensing ecological index. Remote Sens. 12, 2462. doi: 10.3390/rs12152462.
Liao Y. M., Yin L. J., Han M., Meng Y. B., Luo J. Q. (2023). Analysis of land use change and its ecological effects in Guizhou Province. Hubei Agric. Sci. 62, 25–30+63. doi: 10.14088/j.cnki.issn0439-8114.2023.09.005
Liu J. Y., Kuang W. H., Zhuang Z. X., Xu X. L., Qin Y. W., Ning J., et al. (2014). Spatiaotemporal characteristics, patterns and causes of land-use changes in China since the late 1980s. J. Geograph. Sci. 24, 195–210. doi: 10.1007/s11442-014-1082-6.
Liu J. Y., Liu M. L., Deng X. Z., Zhuang D. F., Zhang Z. X., Luo D. (2002). The land use and land cover change database and its relative studies in China. J. Geograph. Sci. 12, 275–282. doi: 10.1007/BF02837545.
Liu J. Y., Liu M. L., Zhuang D. F., Zhang Z. X., Deng X. Z. (2003). Study on spatial pattern of land-use change in China during 1995–2000. Sci. China (Ser. D) 46, 373–384. doi: 10.1360/03yd9033.
Lu Y. G., Cai Y. L., Xu Y. Q. (2006). Towards land change science: the progress of LUCC. China Land Sci. 20, 55–61.
Luo K. S., Zhang X. J. (2022). Increasing urban flood risk in China over recent 40 years induced by LUCC. Landscape Urban Plann. 219, 104317. doi: 10.1016/j.landurbplan.2021.104317.
Meyfroidt P., de Bremond A., Ryan C. M., Archer E., Aspinall R., Chhabra A., et al. (2022). Ten facts about land systems for sustainability. P. Natl. Acad. Sci. 119, e2109217118. doi: 10.1073/pnas.2109217118.
Ministry of Environmental Protection of the People’s Republic of China (2015). National Standard for Environment Protection in the People’s Republic of China HJ192-2006: Technical Criterion for Ecosystem Status Evaluation. 1st ed (Beijing, China: China Envi-ronmental Science Press).
Ministry of Water Resources of the People’s Republic of China (2008). Standard for classification and gradation of soil erosion. 1st ed (Beijing, China: China Water Conservancy and Hydropower Press).
National Bureau of Statistics (2021). China Statistical Yearbook 2021. 1st ed (Beijing, China: China Statistics Press).
Nielsen J. O., de Bremond A., Chowdhury R. R., Friis C., Metternicht G., Meyfroidt P., et al. (2019). Toward a normative land systems science. Curr. Opin. Environ. Sustain. 38, 1–6. doi: 10.1016/j.cosust.2019.02.003.
Office of the Leading Group of the Third National Land Survey of Yunnan Province, Department of Natural Resources of Yunnan Province, Statistics Bureau of Yunnan Province (2021). Main Data Bulletin of the Third National Land Survey of Yunnan Province (Kunming, Yunnan, China: Yunnan Daily), 8.
Office of Yunnan Provincial Agricultural Zoning Commission (1987). Land area of different climatic zones and slopes in Yunnan Province. 1st ed (Kunming, China: Yunnan Science and Technology Press).
State Environmental Protection Administration of the People’s Republic of China (2006). Industry Standard for Environment Protection in the People’s Republic of China HJ192-2006: Technical Criterion for Eco-environmental Status Evaluation. 1st ed (Beijing, China: China Environmental Science Press).
The CPC Yunnan Provincial Committee, the People’s Government of Yunnan Province (2022). The Plan for Yunnan Province to Take the Pioneer in Ecological Civilization Construction (2021-2025) (Kunming, Yunnan, China: Yunnan Daily), 4.
Turner B. L., Meyer W. B., Skole D. L. (1994). Global land-use / land-cover change: towards an integrated study. AMBIO 23, 91–95.
TurnerII B. L., Munroe D. K. (2020). “Land change science/land system science,” in International Encyclopedia of Human Geography, 2nd ed. Ed. Kobayashi A. (Elsevier, Amsterdam, the Netherlands), 87–92.
Verburg P. H., Crossman N., Ellis E. C., Heinimann A., Hostert P., Mertz O., et al. (2015). Land system science and sustainable development of the earth system: A global land project perspective. Anthropocene 12, 29–41. doi: 10.1016/j.ancene.2015.09.004.
Wan H. L., Huo F., Niu Y. F., Zhang W., Zhang Q. R. (2021). Dynamic monitoring and analysis of ecological environment change in Cangzhou city based on RSEI model considering PM2.5 concentration. Prog. Geophysics 36, 953–960. doi: 10.6038/pg2021FF0137
Wang H. R. (2022). Evaluation and analysis of eco-environmental index in Liaoning Province based remote sensing data. 1st ed (Shenyang, China: University of Science and Technology Liaoning). doi: 10.13961/j.cnki.stbctb.2022.01.047
Wang J., Hou L. G., He X. Q., Liu T., Deng Y. J. (2022). Land use change and its eco-environmental effects in urban agglomeration of Chengdu Plain during 2000-2019. Bull. Soil Water Conserv. 42, 360–368.
Wang J. Y., Liu Y. S. (2009). Land use and land cover change and its driving forces in Sanya]. J. Natural Resour. 24, 1458–1466. doi: 10.11849/zrzyxb.2009.08.015
Xu H. Q. (2013). A remote sensing index for assessment of regional ecological changes. China Environ. Sci. 33, 889–897.
Xu X. L., Liu J. Y., Zhang S. W., Li R. D., Yan C. Z., Wu S. X. (2018)Multi-period land use and land cover monitoring data set in China (CNLUCC). In: Resource and Environment Science Registration and Publication System (Beijing, China: Institute of Geographic Sciences and Natural Resources Research, Chinese Academy of Sciences). Available online at: http://www.resdc.cn/DOI (Accessed 8 February 2022).
Yang Z. S. (2011). Study on Land Use Change and Ecological Effects in Different Landforms of Yunnan Province Driven by the China Grain for Green Project. 1st ed (Beijing, China: China Science and Technology Press).
Yang Y. J. (2019). Ecological Quality Assessment Based on Remote Sensing Ecological Index: A case Study of Fujian Province. 1st ed (Xi’an, China: Chang’an University).
Yang R. Y., Du W. Y., Yang Z. S. (2021). Spatiotemporal evolution and influencing factors of urban land ecological security in yunnan province. Sustainability 13, 2936. doi: 10.3390/su13052936.
Yang Q. K., Duan X. J., Wang L., Jin Z. F. (2018). Land use transformation based on ecological-production-living spaces and associated eco-environment effects: A case study in the Yangtze river delta. Scientia Geographica Sin. 38, 97–106. doi: 10.13249/j.cnki.sgs.2018.01.011
Yang Z. S., He Y. M., Li Y. H., Zhang Y. L., Wang Y. P. (2004). Land use change and soil erosion control in dry-hot valley zone in the middle reaches of Jinsha River during 1960- 2000: a case study in Binchuan County, Yunnan Province. Prog. Geogr. 23, 16–26. doi: 0.11820/dlkxjz.2004.02.003
Yang Z. S., Zhao Q. G., Xin L. (2014). Yunnan Land Resources. 1st ed (Beijing, China: China Science and Technology Press).
Yu D. F. (1998). A brief discussion on the object and content of mountain science. J. Mountain Sci. 16, 69–72.
Yue H., Liu Y., Li Y., Lu Y. (2019). Eco-environmental quality assessment in China’s 35 major cities based on remote sensing eco-logical index. IEEE Access 7, 51295–51311. doi: 10.1109/Access.6287639.
Yunnan Provincial Bureau of Statistics (2021). Yunnan Statistical Yearbook 2021. 1st ed (Beijing, China: China Statistics Press).
Zhai Y. J. (2023). Study on Land Use / Cover Change and Its Ecological Effects in the Agro-Pastoral Ecotone of Western Jilin Province. 1st ed (Changchun, China: Jilin University).
Zhang Y., Liu Y. F., Gu J. P., Ding Q. (2011). Land use / land cover change and its environmental effects in Wuhan city. Scientia Geographica Sin. 31, 1280–1285. doi: 10.13249/j.cnki.sgs.2011.010.1280
Keywords: remote sensing (RS) image interpretation (RSII), land use/cover change (LUCC), integrated ecological effect, integrated ecological effect index, spatio-temporal evolution, Yunnan Province
Citation: Yang R, Yang Z, Zhong C and He Y (2024) Characteristics of the spatio-temporal evolution of the improved integrated ecological effect index (IEEI) in mountainous province based on remote sensing: a case study in Yunnan province of southwest China. Front. Ecol. Evol. 12:1343798. doi: 10.3389/fevo.2024.1343798
Received: 24 November 2023; Accepted: 31 January 2024;
Published: 22 February 2024.
Edited by:
Jun Li, Beijing, ChinaReviewed by:
Wayne C. Zipperer, Forest Service (USDA), United StatesVarun Narayan Mishra, Amity University, India
Copyright © 2024 Yang, Yang, Zhong and He. This is an open-access article distributed under the terms of the Creative Commons Attribution License (CC BY). The use, distribution or reproduction in other forums is permitted, provided the original author(s) and the copyright owner(s) are credited and that the original publication in this journal is cited, in accordance with accepted academic practice. No use, distribution or reproduction is permitted which does not comply with these terms.
*Correspondence: Zisheng Yang, enowOTc2QHludWZlLmVkdS5jbg==
†ORCID: Renyi Yang, orcid.org/0000-0003-3929-9970