 Md Khademul Islam1Md Badruddoza1Sumaiya Binte Salam1Mohammad Shamimul Alam2
 Md Alamgir Kabir3*Md Golam Rabbane4*
- 1Department of Fisheries, Faculty of Biological Sciences, University of Dhaka, Dhaka, Bangladesh
- 2Department of Zoology, Faculty of Biological Sciences, University of Dhaka, Dhaka, Bangladesh
- 3Aquaculture Genomics Laboratory, Department of Fisheries, Faculty of Biological Sciences, University of Dhaka, Dhaka, Bangladesh
- 4Fisheries Genetics and Biotechnology Laboratory, Department of Fisheries, Faculty of Biological Sciences, University of Dhaka, Dhaka, Bangladesh
Morphological and genetic diversity of three wild zebrafish populations in Bangladesh (Rangpur, Netrokona, and Cumilla) were elucidated using DNA barcoding and Random Amplified Polymorphic DNA (RAPD). Morphometric variation was minimal therefore, RAPD profiling and DNA barcoding were also used. Total 236 bands, including 29 polymorphic bands and 2 unique bands in RAPD showed 14.09% polymorphism indicating a low genetic diversity among them. Genetic distances were ranged from 0.0048 to 0.1031, with the highest genetic distance between Rangpur and Netrokona populations. DNA barcoding showed 99% similarity to Danio rerio from the GenBank, and multiple sequence alignment confirmed high genetic similarity (99.41) among these populations. Phylogenetic analysis showed these three zebrafish populations were grouped into distinct clusters, supporting the presence of genetic structure across populations. These information provides an essential reference data for the conservation, management, and potential selective breeding of zebrafish. The findings of this research also emphasize the efficacy of DNA barcoding and RAPD as complementary methods in the study of population genetics.
1 Introduction
Danio rerio, commonly known as zebrafish, is a widely used natural ornamental model species in fisheries research around the world (Rabbane et al., 2016; Rahman et al., 2024). The zebrafish are generally found in floodplains, streams, paddy fields, ditches, ponds, and rivers of India, Bangladesh, Nepal, Pakistan, and Myanmar (Rabbane and Rahman, 2017). They are mostly found in floodplains comprising almost entire part of Bangladesh (Lee et al., 2020). The diversity and abundance of zebrafish are influenced by climate and human activities such as farming and abuse of agrochemicals, raising industrial pollution, destruction of natural stock etc (Thomas, 2010; Kabir et al., 2020). So, there is a possibility of appearing genetic and morphometric variation among different wild populations of zebrafish collected from different sources. It was reported from a study that in the aspect of expected heterozygosity and allelic richness, there was a higher genetic variability in wild zebrafish while compared to strains from laboratory. This study also represented that geographical distribution influences the genetic variation of zebrafish and this genetic variation can be decreased due to a small size of effective population with respect of every breeding program (Coe et al., 2009). The geographical distribution of zebrafish causes genetic variation among their populations. So, it is necessary to determine the genetic variability and structure of zebrafish populations from different geographically isolated areas. This genetic information can provide a proper measure of biodiversity which would be useful for the conservation and management of a wild fish population (Affonso and Galetti, 2007).
The measurements of morphology within species have been used to comprehend genetics, population dynamics, and differences in populations brought on by environmental or genetic variables (Suresh et al., 2023). So, the classical morphometric measurements can help to identify diversity of zebrafish populations collected from geographically isolated areas. The diversity of zebrafish population comparing strain and wild had already been determined using various techniques such as microarray, single nucleotide polymorphism (SNP), simple sequence length polymorphism (SSLP), Random amplified polymorphic DNA(RAPD) etc (Azad et al., 2022). Among all these techniques, RAPD along with DNA barcoding have been considered as a vital tool for the identification of diversity in the species level (Weigt et al., 2012).
RAPD technique had already been used for determining genetic diversity of various species and sub-species of fishes such as in sea bass (Allegrucci et al., 1995); in tilapia (Bardakci and Skibinski, 1994); in red mullet (Mamuris et al., 1998) etc. RAPD marker has been used to determine the variance in genetic aspects among three geographically isolated wild fish populations of Catla catla in the Padma, Halda and Jamuna rivers and an artificially-reared population of a Hatchery in Bangladesh (Rahman et al., 2009). So, this marker can also help to determine genetic variance among the wild zebrafish populations collected from different areas. Similarly, DNA barcoding is an effective method which has already been proven in several studies. In fact, the species can be identified 90% accurately to species level using DNA barcoding method (Tsoupas et al., 2022). DNA barcoding method has been used in studies on different kinds of animals, like fishes (Ward et al., 2005), birds (Hebert et al., 2004), gastropods (Meyer and Paulay, 2005) etc. Zebrafish population diversity or variation between strain and wild had been identified by many researchers using various techniques like whole genome sequencing (Balik-Meisner et al., 2018), single nucleotide polymorphisms (SNPs) (Stickney et al., 2002), microarray hybridization (Stickney et al., 2002), single strand conformational polymorphism (SSCP) markers (Woods et al., 2005), simple sequence length poly morphism (SSLP) markers (Shimoda et al., 1999), single nucleotide polymorphism (SNP) (Guryev et al., 2006) etc. Among them, DNA barcoding and RAPD have gained considerable validation as a tool for species identification and discovery (Weigt et al., 2012).
In Bangladesh, a study has already been directed to know the genetic diversity of three geographically isolated wild zebrafish populations which were collected from Mymensingh, Faridpur, Khulna, and Munshiganj (Azad et al., 2022). But there is no research available for identifying genetic diversity of zebrafish collected from Rangpur, Netrokona, and Cumilla. Therefore, this study intended to assess the genetic diversity of three geographically isolated wild zebrafish populations of Bangladesh which are collected from Rangpur, Netrokona, and Cumilla.
2 Materials and methods
2.1 Ethical statement
This research was approved by the Ethics Committee of Faculty of Biological Sciences, University of Dhaka, Dhaka, Bangladesh with the reference number 285/Biol. Scs.
2.2 Fish sampling and morphometric measurements
Three zebrafish populations were collected from three different locations of Bangladesh, viz: Rangpur (25.7494° N, 89.2611° E), Netrokona (24.8821° N, 90.7231° E), and Cumilla (23.4498° N, 91.1847° E) based on their availability (Figure 1). Total 9 freshly dead fish as three fish for each population were collected from the local fishermen for morphometric and RAPD technique. It would be so interesting if we could do the sampling focused on life stages, specific sizes, specific sexes, etc. but we could not do that due to scarcity of zebrafishes in the wild source. We collected them randomly and focused on their morphometric characteristics where, a total of 16 classical morphometric parameters were measured. The 16 classical morphometric parameters include the total length, the standard length, the body width, the body weight, the body depth, the head length, the length of five fins (dorsal fin, pectoral fin, pelvic fin, anal fin and caudal fin), and number of five fin rays. Using taxonomic keys, fish specimens were identified morphologically (Jayaram, 1999). For further study, samples of whole fish were kept at -20°C.

Figure 1. Map showing three sampling locations of three Danio rerio populations with colorful bullets.
2.3 Extraction of genomic DNA
The genomic DNA was extracted from the fish sample’s muscle tissue for this investigation. A brief process was used in accordance with a modified methodology to isolate whole genomic DNA (Wu et al., 1995). An automated extractor of DNA (Model: Maxwell 16, Origin: Promega, USA) was utilized for the isolation process. Using a spectrophotometer, the ratio of the optical density recorded at 260/280 nm was applied to calculate the concentration and purity of the extracted genomic DNA. Before being used for PCR amplification, DNA samples from members of each community were diluted with nano pure water to around 25 ng/μL.
2.4 PCR primers
Two barcode primers, one forward F1 primer and another reverse R1 primer, were selected for DNA barcoding. For PCR amplification, 4 commercially available RAPD primers viz. OPA-11, OPC-05, OPG-03, and OPD-05 were used (Table 1). Here the different primers from Azad et al., 2022 were used for better identification of unique bands or polymorphic loci that can be different from previously used primers. Additionally, new primers can cover a more comprehensive picture of genetic diversity and can provide something new for their genetic diversity. From the comparison of newly used primer and previous primers, selection of best primers and better understanding can be done in future zebrafish research.
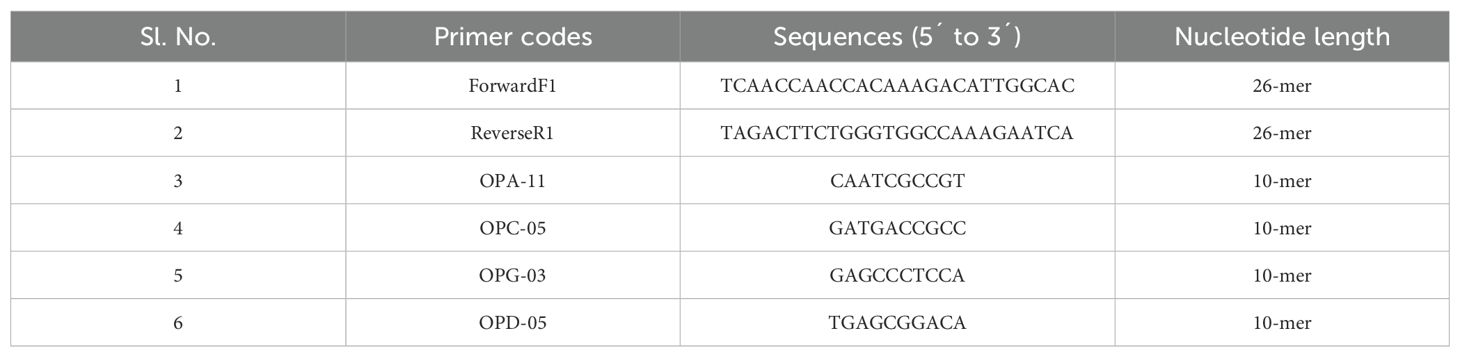
Table 1. Parameters of random primers used in this study.
2.5 PCR amplification for RAPD profiling and DNA barcoding
The PCR amplifications of DNA were performed in 20 μL volume containing Hot Start Green Master Mix of approximately 10 μL. The master mix contains dNTPs, MgCl2, Taq DNA polymerase (Cat: M7432, Promega, USA), Buffer, 2 μL of genomic DNA, 6 μL of Nuclease-Free Water, and 2 μL of primer. The PCR reactions for RAPD and DNA barcoding were carried out with selected primers in a thermal cycler (Applied Bio systems ® 2720 Thermal Cycler). The thermal cycler was programmed as initially 95 °C for 3minutes, total 40 cycles of 94 °C for 30 seconds, 48 °C for 30 seconds, 72 °C for 90 seconds and finally 72 °C for 5 minutes. The amplified DNA products were segregated by gel electrophoresis on 1% agarose gel. After segregation, they were observed on UV-transilluminator and the segregated bands were photographed. The pictures of the gel containing segregated DNA products were applied for the analysis of amplified products for RAPD analysis. The purified PCR products of DNA barcoding samples were sequenced from Malaysian FIRST BASE sequencing company.
2.6 Data analysis
The amplified fragments got from PCR amplification were scored using binary data where 1is scored for presence of bands and 0 is scored for absence of bands. For further statistical analysis, only data derived from reproducible bands which were present were utilized. Then the polymorphic loci (Nei, 1978) was calculated. Additionally, an Un-Weighted Pair Group Method of Arithmetic means (UPGMA) dendrogram was also built using POPGENE computer software version 1.31. The similarity index (SI) values were calculated between any 2 individuals on the same gel using following formula:
Where, NAB represents total number of bands in RAPD shared by individuals A and B, and NA and NB represent the number of bands scored for individuals A and B, respectively (Lynch, 1990).
In DNA barcoding, the results of sequencing of selected samples were expounded by Finch TV software. After that, the sequences were blasted in NCBI BLAST to find out the similarity. Then sequences were aligned by a multi sequence alignment (MSA) tool named CLUSTALW. Finally, a phylogenetic tree was built by MEGA 6.1 software.
3 Results
In this study, 16 classical morphometric measurements of three populations of zebrafish were analyzed for assessing morphometric variation. The morphometric measurements of the three zebrafish populations are mentioned in Table 2. The morphometric measurements were nearly similar among the three zebrafish populations. Some measurements of morphometric characteristics of the three zebrafish populations showed little variation from one population to another. However, the result of morphometric measurements found to be insignificant to set up the variation among the three zebrafish populations. So, this experiment was further carried out to evaluate the genetic variation and similarities among the fish populations.
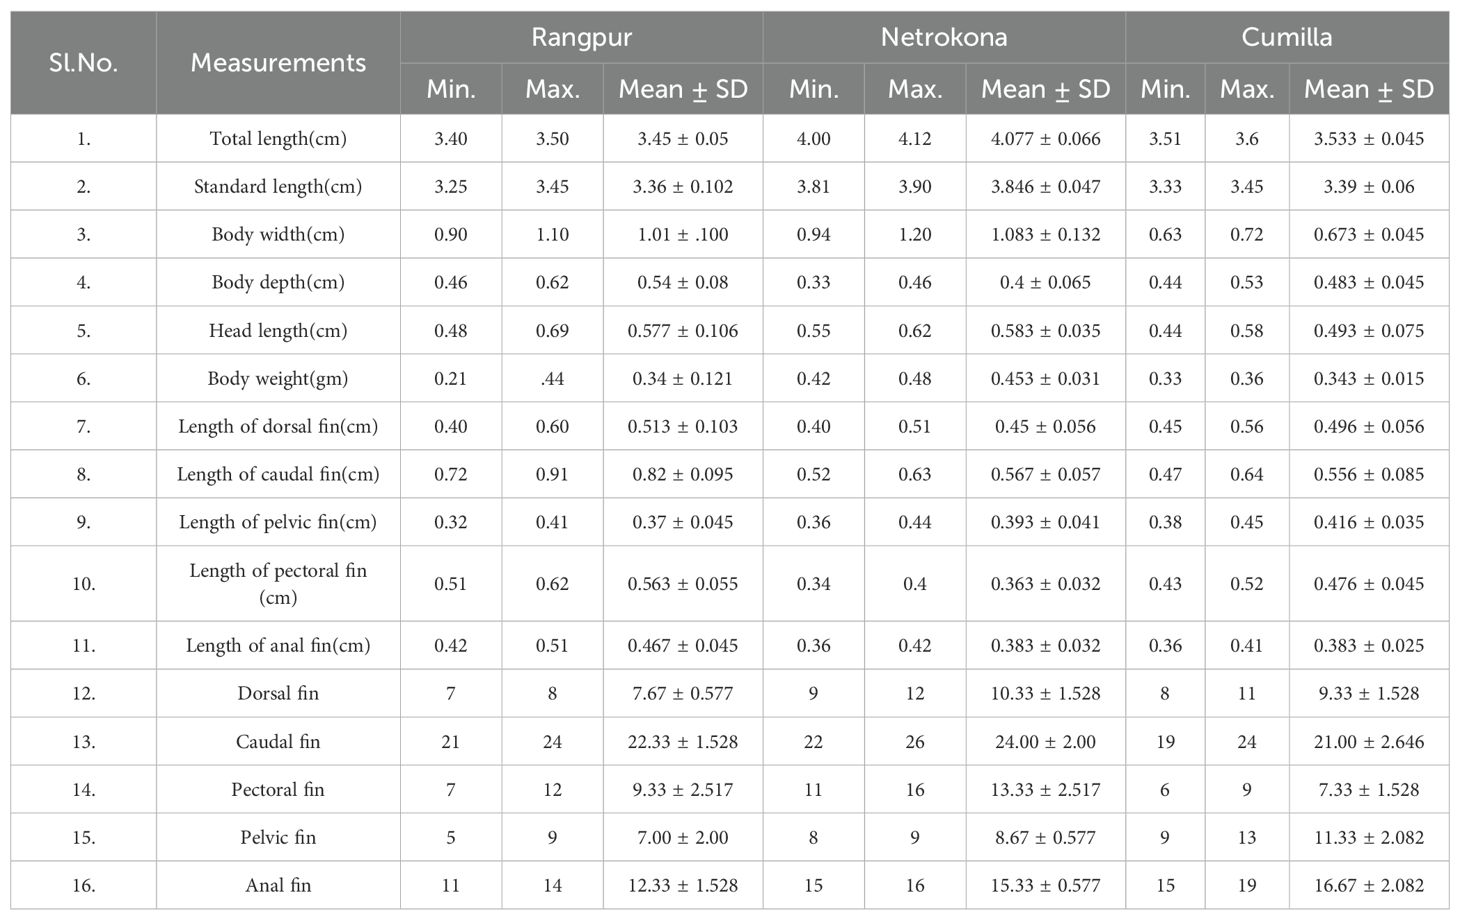
Table 2. Range of mean, variation, and standard deviation of morphometric measurements of Danio rerio.
3.1 RAPD polymorphism
The RAPD profiles of three zebrafish populations from three geographically distant areas of Rangpur, Netrokona, and Cumilla district were generated using four primers which are OPA-11, OPC-05, OPG-03, and OPD-05 having the ability of producing reproducible and well-defined bands. The results were described as RAPD profiles of 9 samples (3 from each population) of the three different zebrafish populations. From Figure 2, it is clearly visible that the data produced using the selected primers in the RAPD profiles of the three different zebrafish populations were somewhat distinct.
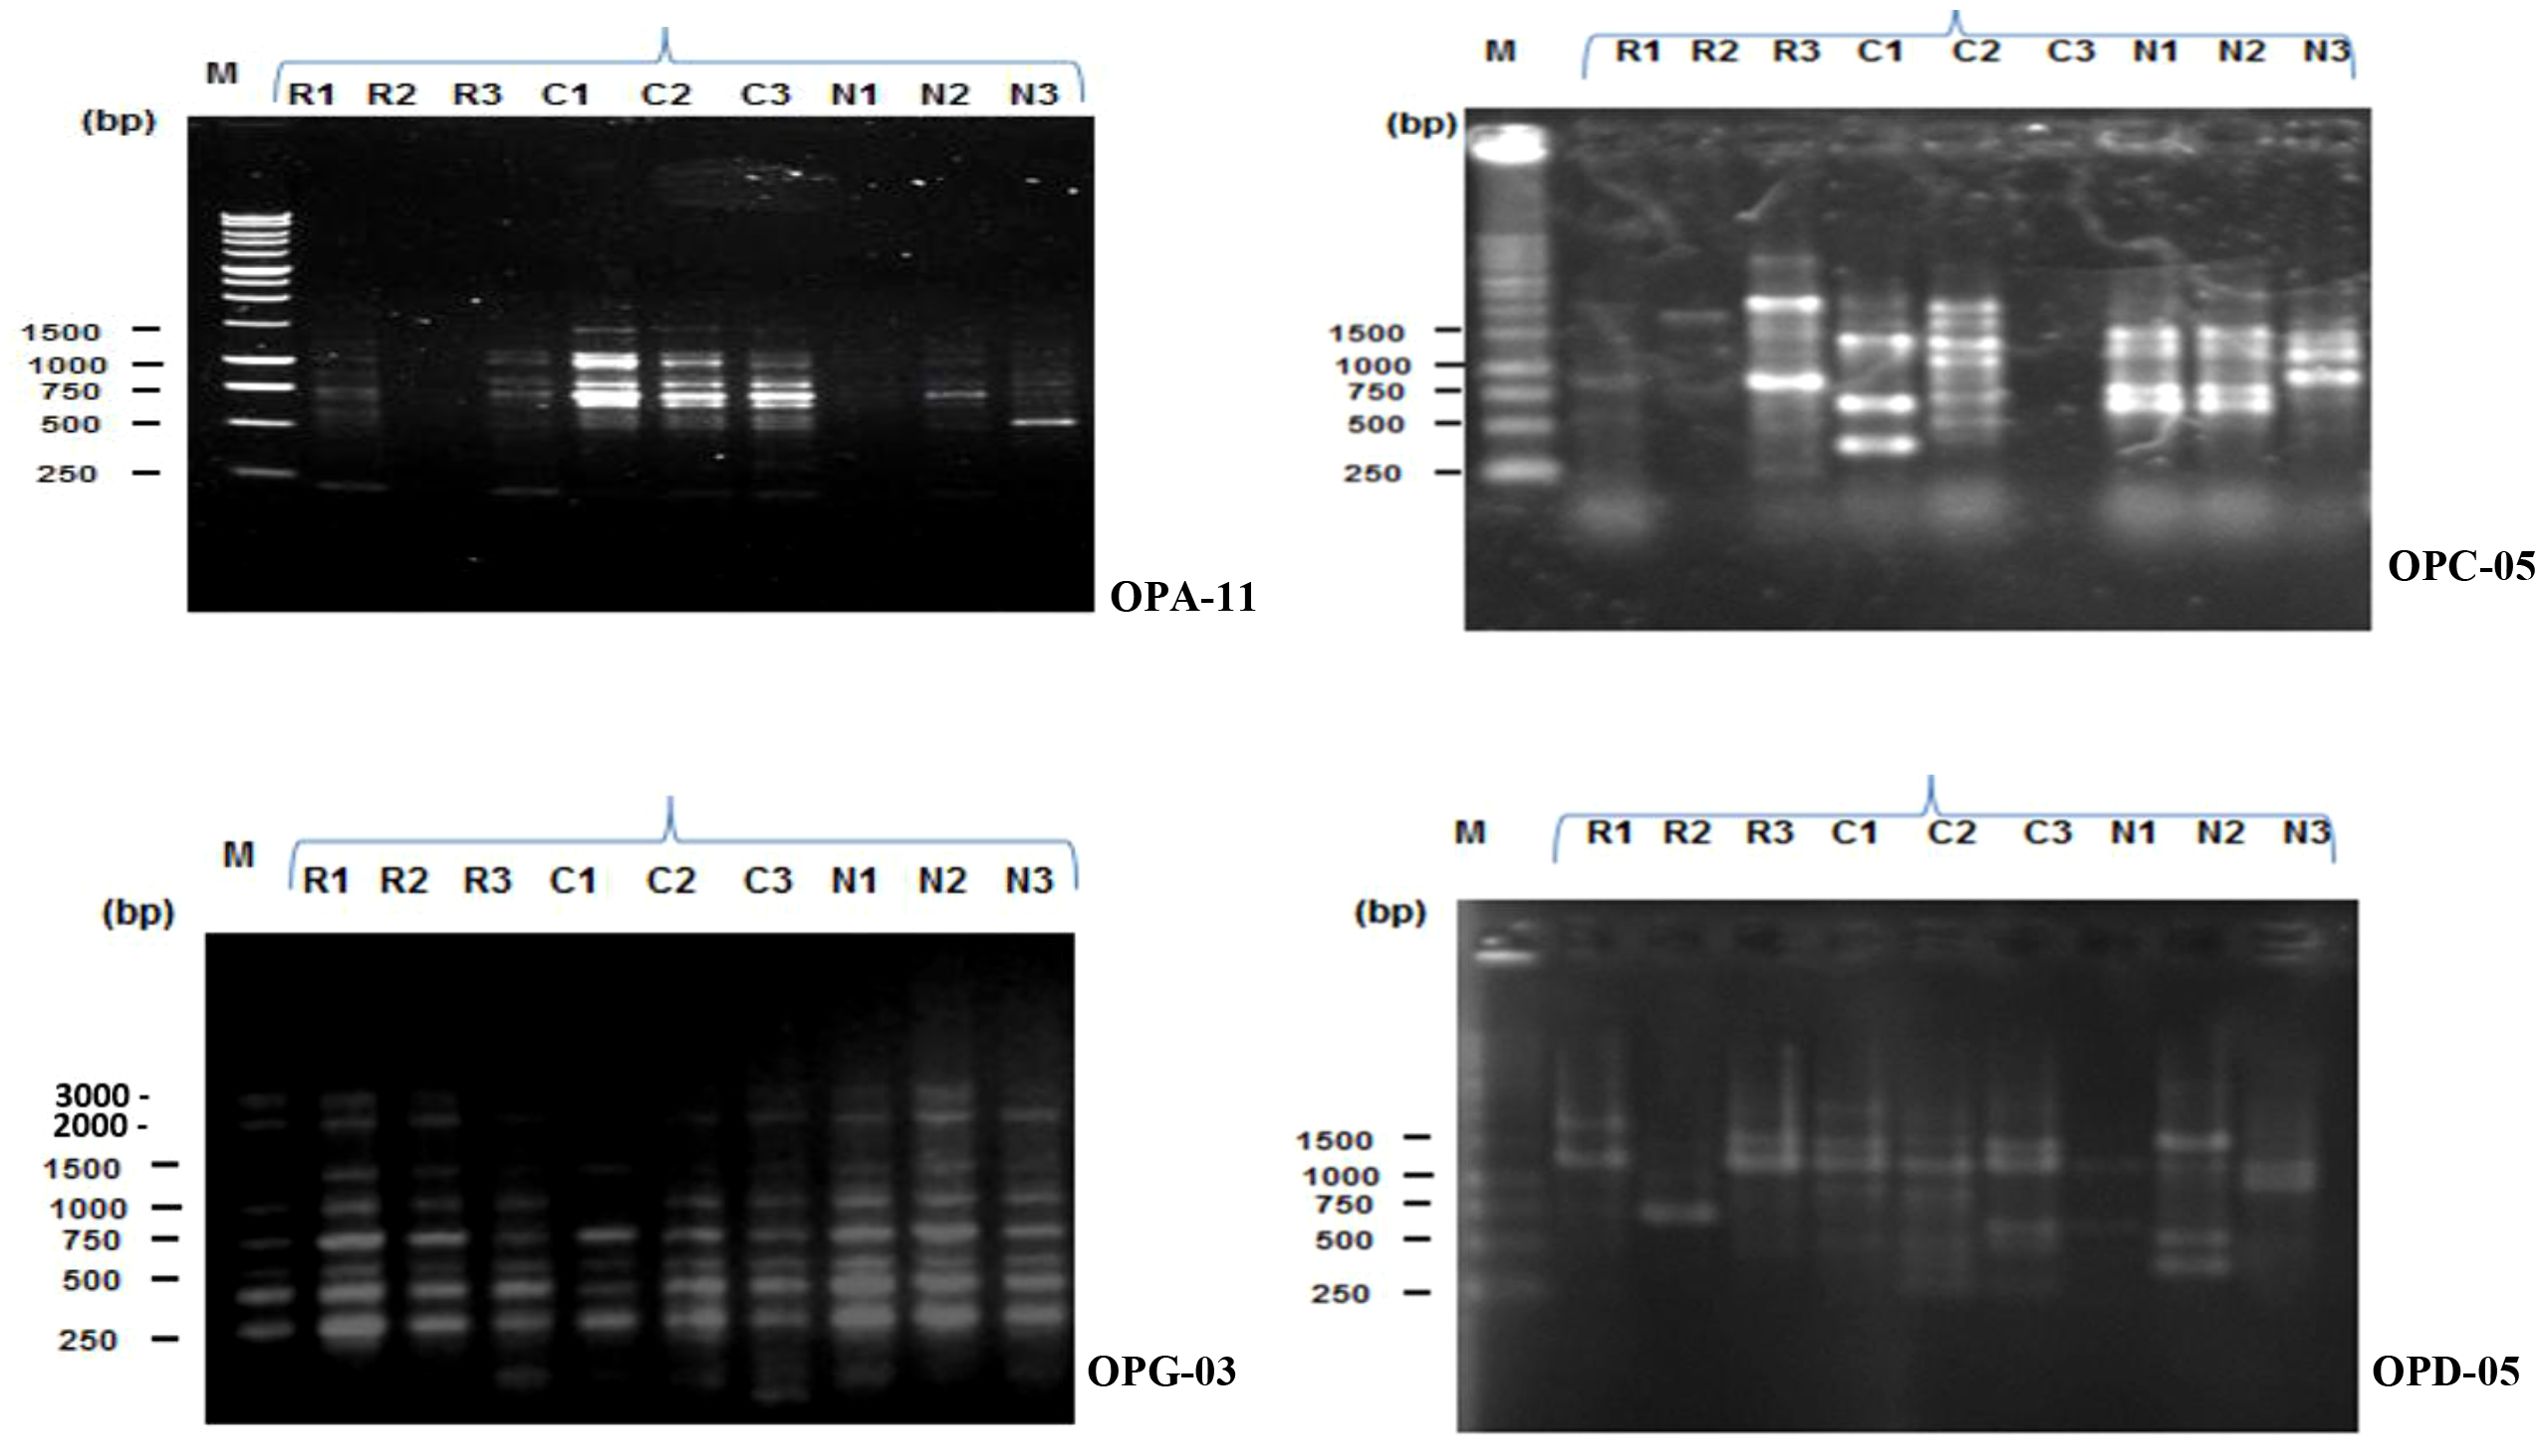
Figure 2. RAPD profiles of three zebrafish populations (R = Rangpur, C = Cumilla, N = Netrokona) produced by four primers (OPA-11, OPC-05, OPG-03, OPD-05). Here, 1, 2, 3 indicate sample number.
In RAPD analysis, total 236 bands were generated using these four primers. Among the 236 bands, 29 bands were polymorphic resulting 14.09% polymorphisms among three geographically distant zebrafish populations. This result indicates a low level of genetic variation and high level of similarity among the three zebrafish populations. The amplified DNA fragments varied in size between 250–1500 bp. Besides the 29 polymorphic bands, 2 unique bands were found in this study. Among the 2 unique bands, one band was observed in a zebrafish sample of Cumilla district for OPD-05primer and another unique band was observed in a zebrafish sample of Rangpur district for OPA-11 primer (Table 3).
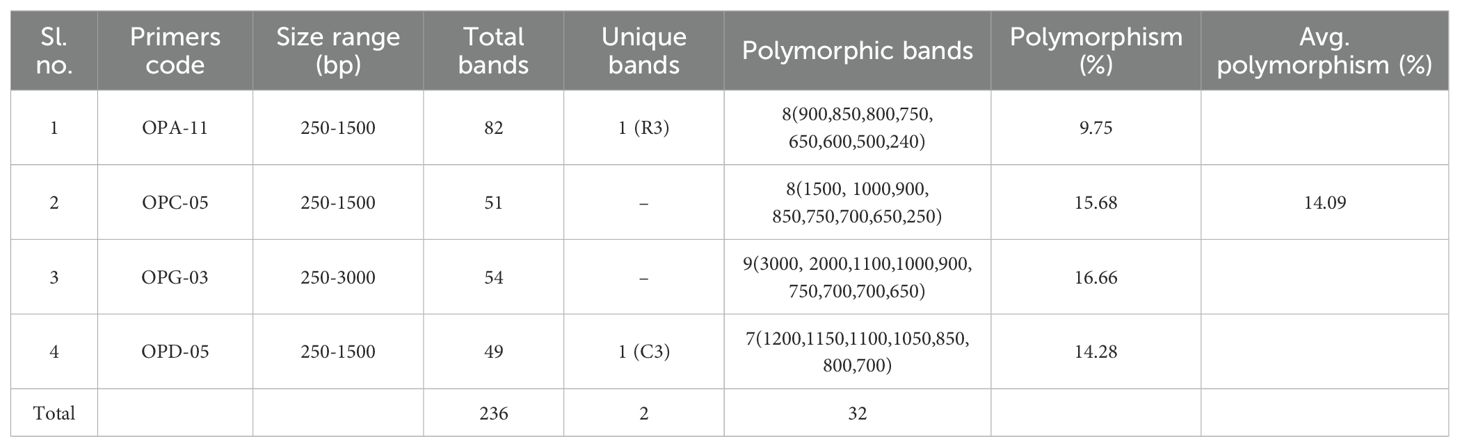
Table 3. Pattern of polymorphism and uniqueness in 4 primers (primer wise) of 9 individuals from 3 Danio rerio populations.
3.2 Genetic identity and genetic distance
According to the Nei’s original measure of genetic identity and genetic distance, the genetic identity among three zebrafish populations ranged between 0.9020 and 0.9952. The highest genetic identity (0.9952) was found between two fishes of Rangpur district which are Rangpur2 and Rangpur3. On the other hand, the lowest identity was found between the fishes of Rangpur and Netrokona district mentioned as Rangpur3 and Netrokona1 respectively. The genetic distances among three populations were between 0.0048 and 0.1031. The lowest genetic distance (0.0048) was found between two fishes of Rangpur denoted as Rangpur2 and Rangpur3 respectively. On the other hand, the highest genetic distance (0.0970) was found between the fish of Rangpur and Netrokona denoted as Rangpur3 and Netrokona1 respectively (Table 4).
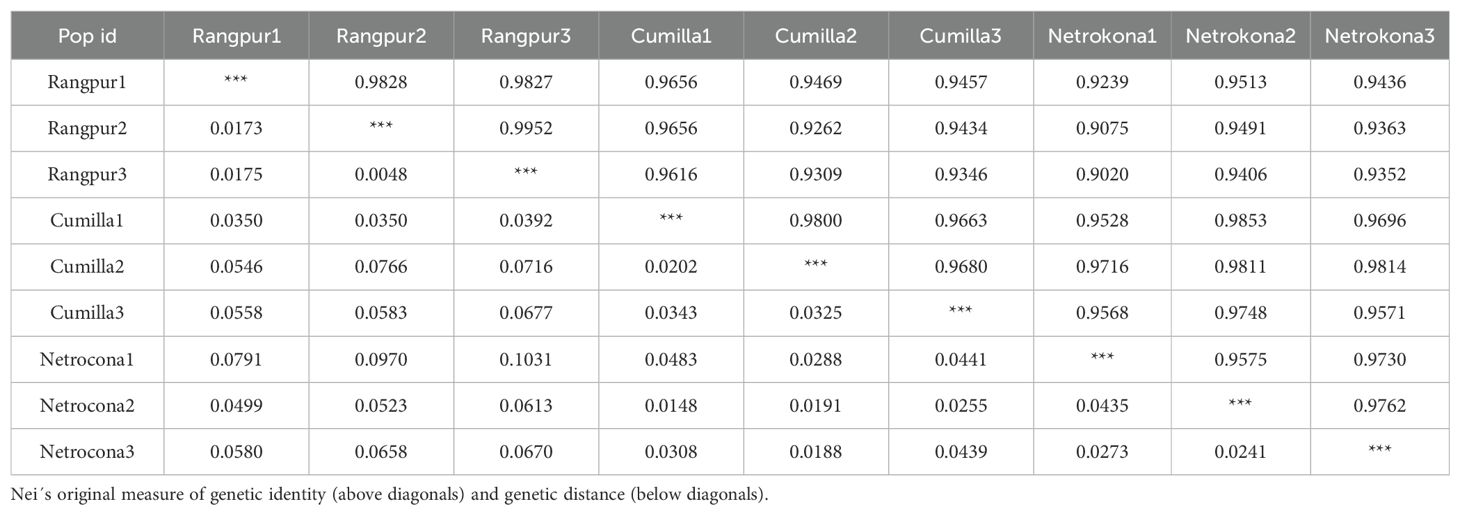
Table 4. Genetic identity and genetic distance among the three populations of Danio rerio.
3.3 UPGMA dendrogram
The unweighted pair group method of arithmetic means (UPGMA) dendrogram was built applying Nei’s (1972) original measures of genetic distance (D) of Danio rerio populations of the three geographically distant areas of Bangladesh (Figure 3). The UPGMA dendrogram divided all the 9 individuals collected from three different locations into 4 clusters. The maximum intra-specific genetic resemblance with minimal variation was observed among the fishes of Rangpur (R1, R2, and R3) than the other fish populations. So, they were grouped together, forming one distinct cluster. The genetic distance was higher between the populations of Netrokona and Rangpur. It is clearly evident from the dendrogram that two individuals of Cumilla (C1, and C2) and one individual of Netrokona (N2) have more similarity. Other two individuals of Netrokona (N1 and N3) showed similarity forming a distinct cluster. C3 is the most distinct individual of all, as seen by its outlier appearance at the base of the dendrogram.
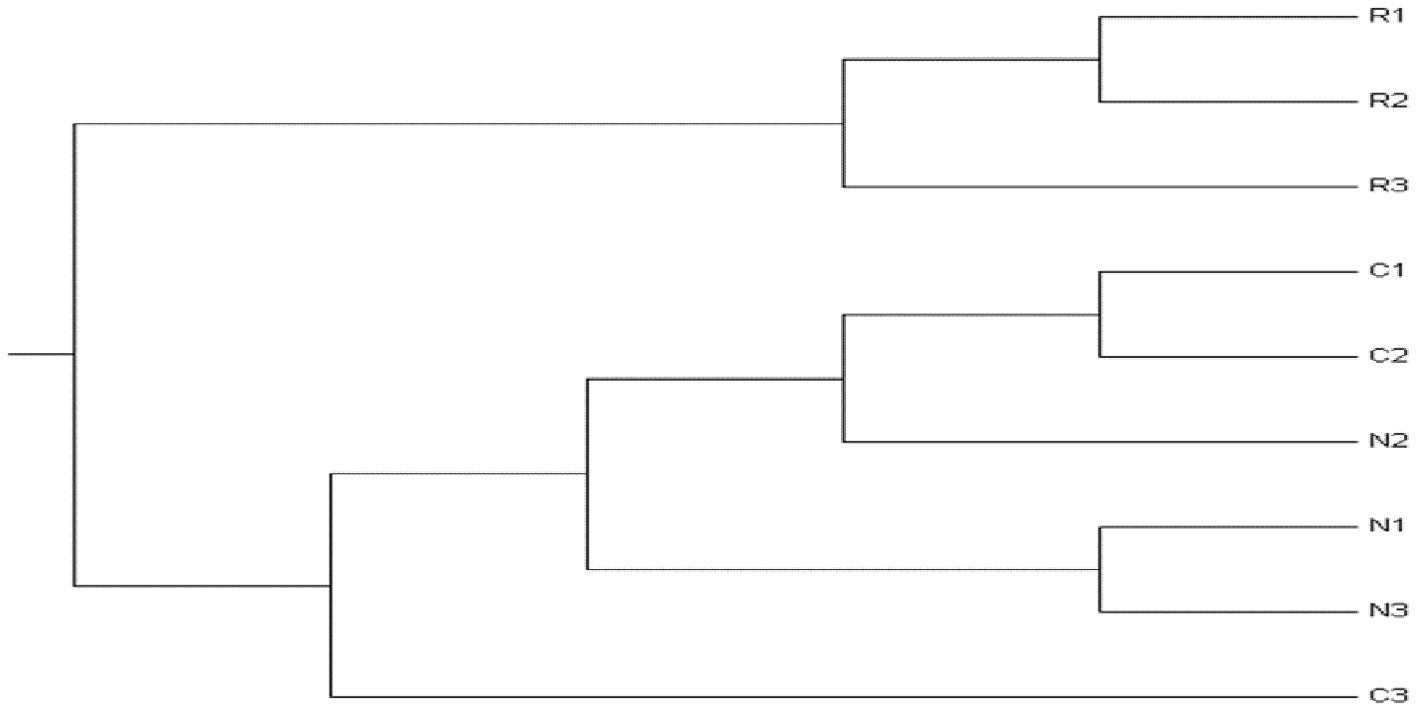
Figure 3. UPGMA dendrogram based on Nei’s (1972) original measures of genetic distance among D. rerio populations according to RAPD analysis. Dendrogram was conducted in POPGENE. Here, R = Rangpur, N = Netrokona, and C = Cumilla.
3.4 Genetic diversity analysis through DNA barcodes
Total six samples (two samples from each study area) were successfully amplified through PCR and were subsequently sequenced bi-directionally to assemble a 675 bp length COI barcode accurately. Then all the sequences were blasted against NCBI database and the results showed that sequences were almost similar to COI gene of Danio rerio (Table 5). No insertions, stop codons and deletions were detected in any of the sample sequences. The GenBank (NCBI) database was used for evaluating genetic variation and species identification based on the sequence similarity. All the six samples selected for DNA barcoding showed about 100% similarity with the available sequences of D. rerio in the GenBank.
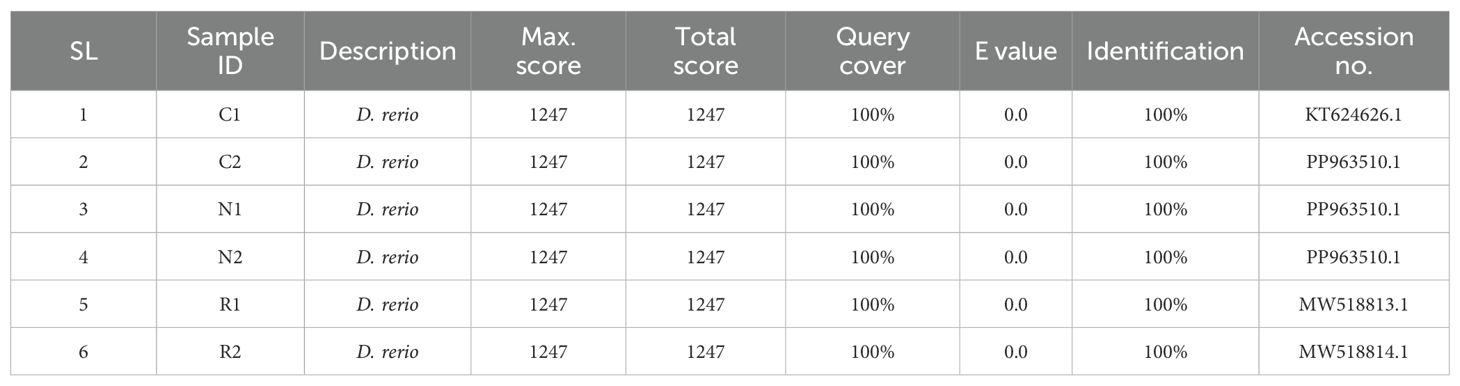
Table 5. Results of sequence blast.
In addition, an evolutionary relationship tree was constructed with the sequence data of the samples. The evolutionary tree in Figure 4 showed that the three populations formed three distinct clusters. According to the clusters, the highest similarity was found among Cumilla (C2) and Netrokona (N1 and N2) and the population of Rangpur found to be closer to them. But one fish sample collected from Cumilla (C1) seemed to be more distant from other samples.
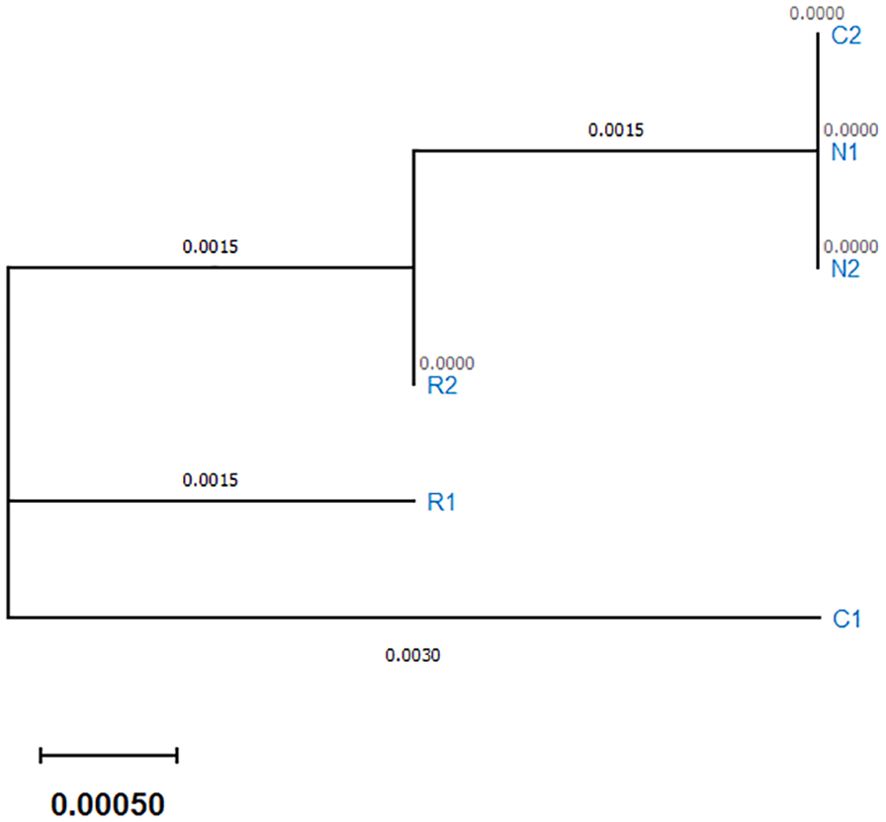
Figure 4. Evolutionary relationship tree based on partial COI gene sequences using MEGA6 software. The evolutionary history was deduced using the Neighbor-joining method.
3.5 Multiple sequence alignment
The assessment of genetic variations among the three fish populations was done by mitochondrial COI gene based multiple sequence alignment. Multiple sequence alignment revealed that the length of nucleotide alignment was 675 bp. Among these 675 bp, 671 bp found to be similar indicating the similarity about 99.41% based on the alignment data. There was a little dissimilarity as only 4 bp seemed to be different according to the alignment data and the polymorphism of the nucleotide is only 0.59%. The result of multiple sequence alignment showed that there was high similarity among the three zebrafish populations which indicates that the three zebrafish populations were strongly close to each other.
Multiple combination of pair wise alignments among six zebrafish individuals of the three populations was done to evaluate the intra-species genetic diversity of these three zebrafish populations. Intra-population pair wise alignments showed that two individuals from Netrokona (N1 and N2) have the highest similarity, 100% (675 bd out of 675 bp) and individuals of Cumilla population (C1 and C2) have the lowest similarity, 99.56% (672 bp out of 675bp). Moreover, inter-population pairwise alignment revealed that the highest, 100% (675 bp out of 675 bp) was found between Rangpur (R2) and Netrokona (N1 and N2) fish populations and Cumilla (C2) and Netrokona (N1 and N2) populations. The lowest similarity, 99.56% (672bp out of 675 bp) was found between Cumilla (C1) and Netrokona (N1 and N2) fish populations. So, according to the alignment result, there is a high similarity among all the three fish populations (Figure 5).
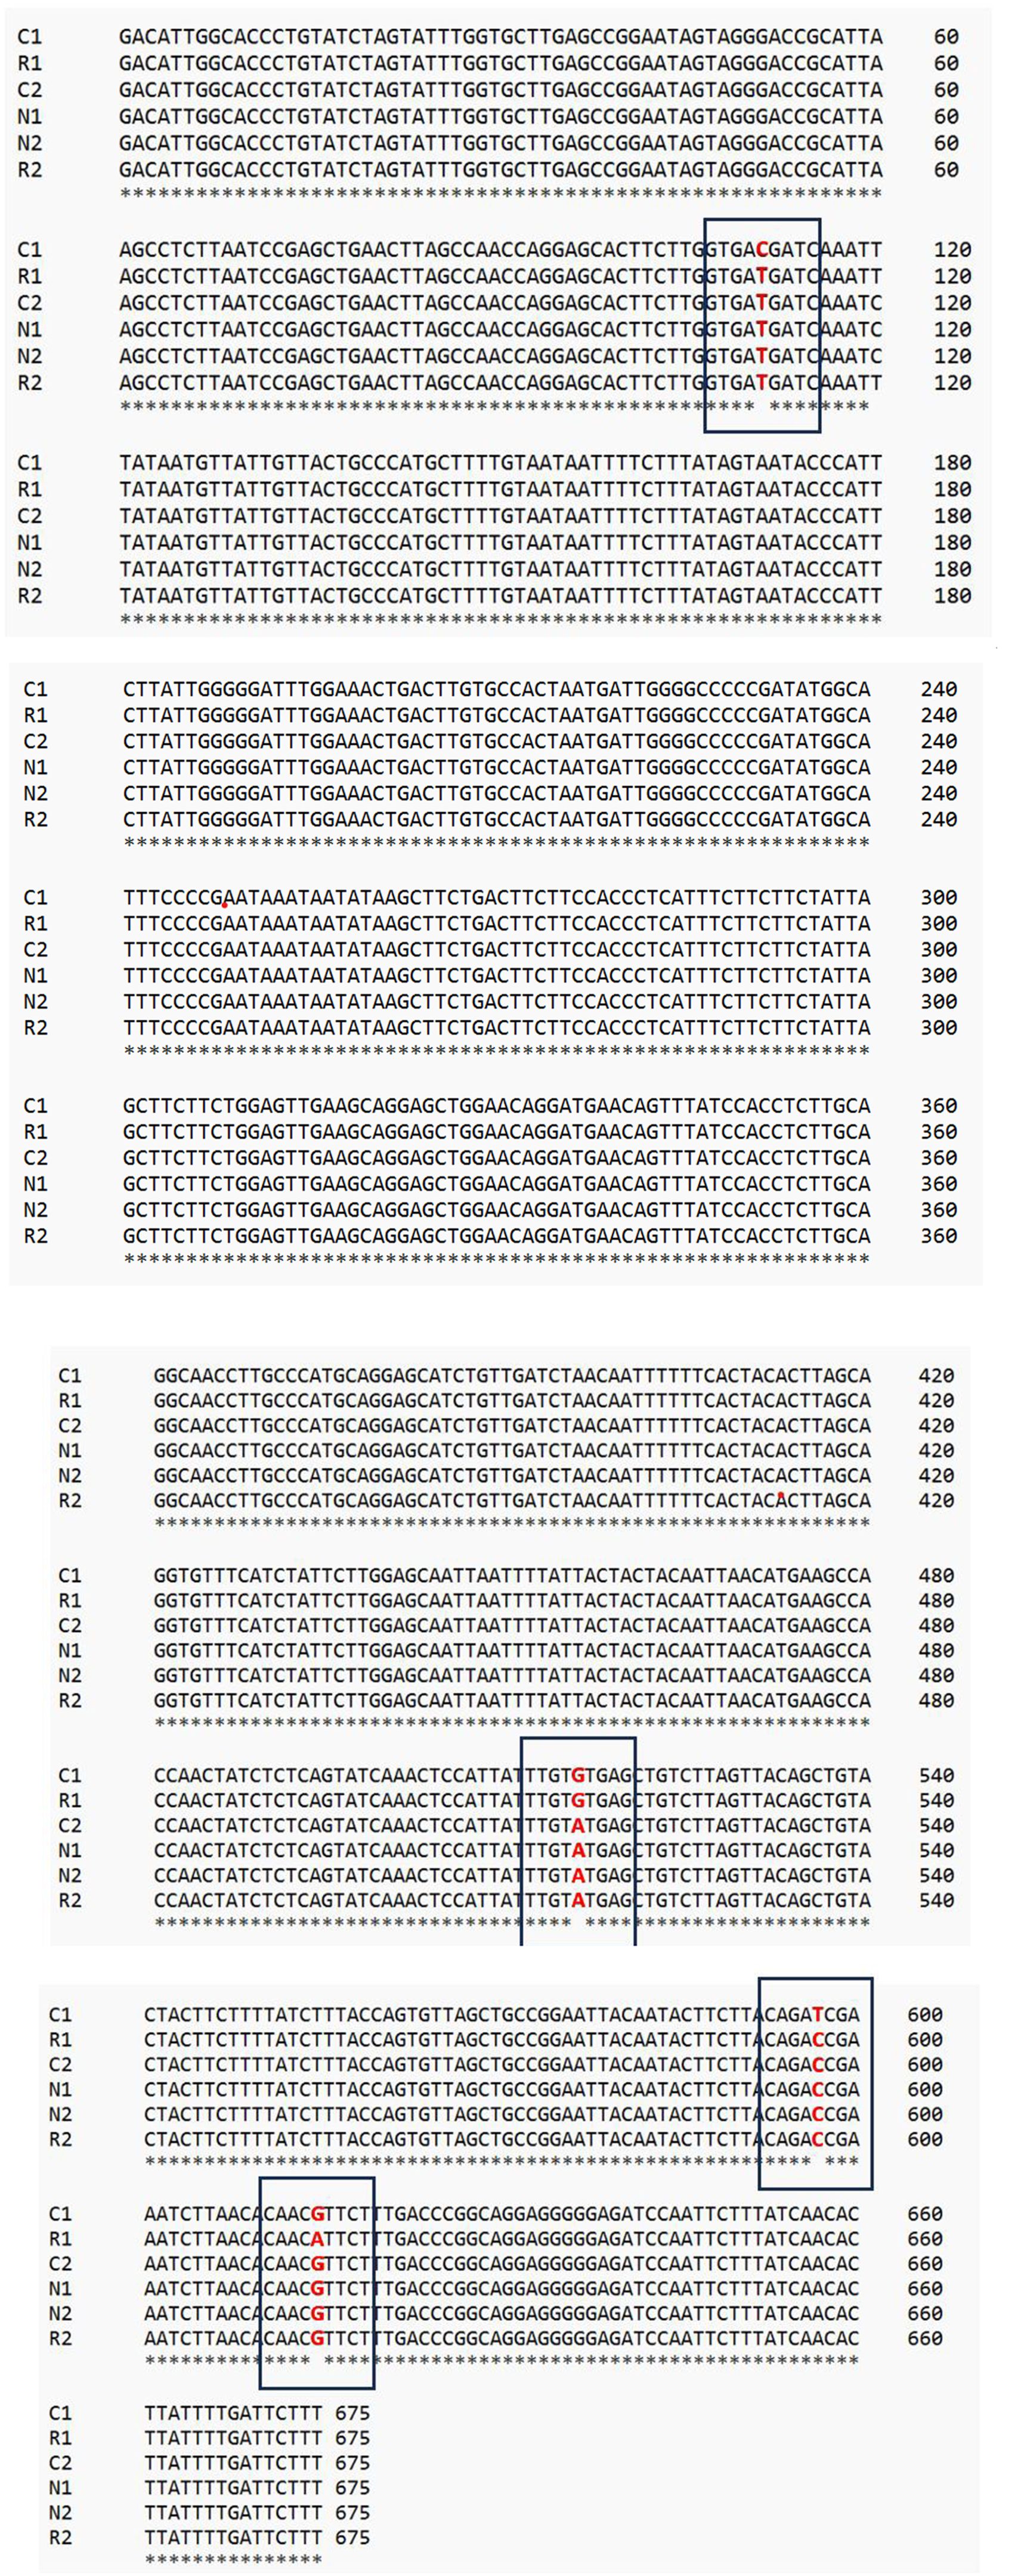
Figure 5. Multiple sequence alignment of COI gene fragment from 6 samples of three Danio rerio populations. Polymorphic sites are denoted by nucleotide positions illustrated by dark blue box. Alignment length: 675bp; Similarity (*): 671bp (99.41%); Dissimilarity: 4bp (0.59%). Black color = Similarity and Red color = Dissimilarity.
4 Discussion
The integrity of the fishery stocks is weakened by aquaculture, accidental cross-breeding, excessive exploitation, and improper fishery management. This deterioration may cause the loss of the entire gene pool (Smith et al., 1991). So, the assessment of genetic variation among fish populations are required for the conservation of different fish stocks. Classical morphometric assessments in this study showed minimal morphological variations between the three distinct populations of zebrafish. Fish morphometric traits were generally similar and frequently intermingled among the three populations. There is frequently taxonomic confusion since these classical morphometric data are insufficient to support the variations of the population’s known genetic structure (Daniels, 1997). Baseline data regarding the genetic diversity and the gene pool of fish populations are required to preserve genetic integrity. So, the genetic similarity and variation of the zebrafish species was assessed in this study by analyzing the genetic diversity of three distinct wild zebrafish (Danio rerio) populations from various geographic locations using the RAPD and DNA barcoding techniques. This was done because there are currently a few data on wild zebrafish in Bangladesh, despite the fact that the zebrafish is an important research model fish (Rabbane et al., 2016).
According to the findings of RAPD technique, the present study revealed that the average percentages of polymorphism is 14.09% in all the bands obtained from the four primers. In this study, a wide range of polymorphic loci (9.75-15.68%) was found among these three zebrafish populations. Primer OPC-05 showed the highest polymorphism (15.68%) whereas the lowest polymorphism (9.75%) was exhibited by primer OPA-11. It is possible to identify any potential mixing of these populations using these population-specific distinctive bands, particularly during selective breeding initiatives (Ferguson et al., 1995). Mishra et al. (2009); Nagarajan et al. (2006); Tassanakajon et al. (1998); Mostafa et al. (2009); Kabir et al. (2017) and Saad et al. (2012) also observed population specific bands in Metapenaeus dobsoni, Channa punctatus, Penaeus monodon, Labeo calbasu, Labeo rohita and Plectropomus leopardus respectively. Numerous uses for RAPD markers have been discovered in the fields of molecular evolutionary genetics, gene mapping, population genetics, and breeding of plant and animal (Bardakci and Skibinski, 1994; Ertaş and Şeker, 2005).
Nei’s original measure of genetic identity and genetic distance was calculated using the data derived from RAPD-PCR profile and genetic identity (GI) ranged from 0.9020 to 0.9952 and the genetic distance varies from 0.0048 to 0.1031. Several RAPD primers were used to investigate intra-population genetic diversity in tilapia (Bardakci and Skibinski, 1994). This method seems to be more sensitive than mitochondrial DNA analysis, which was unable to identify differences among populations of tilapia (Seyoum and Kornfield, 1992; Capili, 1990). On the other hand, the RAPD approach was used to examine genetic variation among four distinct populations of Hilsa Shad from the Indian rivers Ganga, Yamuna, Hoogly, and Narmada (Brahmane et al., 2006). Consequently, RAPD has been applied to study genetic variation of fish populations considering it as a useful tool for analyzing variance among populations with varying levels of geographic isolation. The RAPD approach has also been used to investigate the evolutionary relationships between cichlid and tilapia species in a previous study (Bardakci and Skibinski, 1994). Another study also showed that RAPD technique can be an effective tool for assessing the genetic structure of Kalibaus fish species (Mostafa et al., 2009). In this study, a dendrogram emerged from Nei’s genetic distance was built to illustrate the phylogenetic relationships among the populations under investigation. The UPGMA dendrogram divided all the 9 individuals (3 individuals from each population) in 4 clusters but the samples were collected from three geographically isolated areas. This observation represented that; all the populations have distinct gene pool. Highest similarity was found among the individuals of Rangpur. The population of Netrokona and Rangpur showed the lowest similarities. Conversely, the individual of Rangpur2 and Rangpur3 had the smallest genetic distance, while the zebrafish population of Netrokona and Rangpur had the highest genetic distance. The zebrafish of Rangpur shared more intra-specific genetic traits than the other two zebrafish populations. Thus, the dendrogram showed genetic variation among and within the three zebrafish populations.
The sequences of the cytochrome oxidase c subunit 1 (COI) gene of six individuals where two from each of the three populations, gave an insight to this study by giving a better understanding of the genetic variation among the populations. The sequences were then compared with reference sequences from GenBank. The results showed a 100% sequence similarity with Danio rerio references when compared to the NCBI blast. Multiple sequence alignment (MSA) of the sequences revealed 99.41% similarity and 0.59% dissimilarity of nucleotides among the three zebrafish populations. This MSA indicated that all zebrafish in all geographical areas in Bangladesh are very little diversified. According to other researches, DNA barcodes seemed to be able to identify genetic variation within a number of fish species (Ardura et al., 2010; Ivanova et al., 2007; Rosso et al., 2012; Saad et al., 2012; Waugh, 2007). Lakra et al. (2011) and Zhang et al. (2017) also used DNA barcoding technique to establish genetic diversity among fish species in India and China respectively. Thus, it is considered as one of the most important methods for identifying species is DNA barcoding, which provides a simple identification process and efficiently illustrates genetic variation both within and between species. By establishing genetic similarity and dissimilarity, it can also display the relationships between and within species (Cross and King, 1983).
Using DNA barcodes and RAPD markers, the current study discovered a baseline understanding of genetic variation within and between three distinct Danio rerio populations in Bangladesh. For populations to survive and effectively adapt to changes in their environment, there must be variety both within and between populations (Ryman et al., 1995). As a result, this study has a lot of potential for the use and development of molecular markers for zebrafish population identification. This is because future conservation and management of commercially harvested endangered inland wild populations depend on a clear understanding of the population’s genetic makeup (Allendorf, 1983). The genetic structure of Danio rerio populations resulted in this research by RAPD primers will be useful for establishing stock-specific management strategies for the conservation of the species, as well as in creating superior strains for aquaculture practices through selective breeding. Furthermore, a thorough understanding of the genetic diversity of zebrafish will significantly enhance its study value as a vertebrate model.
5 Conclusions
The data of genetic diversity has various applications in studies conducted on conservation, evolution, and management of natural resources. To gather genetic variance within and between populations, the genetic diversity study used RAPD analysis and DNA barcoding. As a result, the current study can be used as a reference for future investigations of genetic variations among commercially significant fish populations, and the potential application of DNA markers may open up new management options for fisheries resources in fish molecular biology research in Bangladesh.
6 Limitations and recommendation
Sample size was one of the important limitations of this research. More samples should be used for further study. Additionally, further advanced molecular technique should be used for in depth analysis for their genetic variation.
Data availability statement
The datasets presented in this study can be found in online repositories. The names of the repository/repositories and accession number(s) can be found in the article/supplementary material.
Ethics statement
The animal studies were approved by the Ethics Committee of the Faculty of Biological Sciences, University of Dhaka, Dhaka, Bangladesh with the reference number 285/Biol. Scs. The studies were conducted in accordance with the local legislation and institutional requirements. Written informed consent was obtained from the owners for the participation of their animals in this study.
Author contributions
MI: Formal Analysis, Investigation, Methodology, Writing – original draft. MB: Formal Analysis, Investigation, Methodology, Writing – review & editing. SS: Data curation, Formal Analysis, Investigation, Methodology, Writing – review & editing. MA: Formal Analysis, Investigation, Methodology, Writing – review & editing. MK: Conceptualization, Formal Analysis, Supervision, Writing – review & editing. MR: Conceptualization, Formal Analysis, Investigation, Supervision, Writing – review & editing.
Funding
The author(s) declare that no financial support was received for the research, and/or publication of this article.
Conflict of interest
The authors declare that the research was conducted in the absence of any commercial or financial relationships that could be construed as a potential conflict of interest.
Generative AI statement
The author(s) declare that Generative AI was used in the creation of this manuscript. During the preparation of this work, we did not use any AI technology for any analysis except for language editing. We reviewed and edited the content as needed and took full responsibility for the content of the published article.
Any alternative text (alt text) provided alongside figures in this article has been generated by Frontiers with the support of artificial intelligence and reasonable efforts have been made to ensure accuracy, including review by the authors wherever possible. If you identify any issues, please contact us.
Publisher’s note
All claims expressed in this article are solely those of the authors and do not necessarily represent those of their affiliated organizations, or those of the publisher, the editors and the reviewers. Any product that may be evaluated in this article, or claim that may be made by its manufacturer, is not guaranteed or endorsed by the publisher.
References
Affonso P. R. A. M. and Galetti P. M. Jr. (2007). Genetic diversity of three ornamental reef fishes (Families Pomacanthidae and Chaetodontidae) from the Brazilian coast. Braz. J. Biol. 67, 925–933. doi: 10.1590/S1519-69842007000500017, PMID: 18278361
Allegrucci G., Caccone A., Cataudella S., Powell J. R., and Sbordoni V. (1995). Acclimation of the European sea bass to freshwater: monitoring genetic changes by RAPD polymerase chain reaction to detect DNA polymorphisms. Mar. Biol. 121, 591–599. doi: 10.1007/BF00349294
Allendorf F. W. (1983). Isolation, gene flow, and genetic differentiation among populations. Genet. Conserv. 18, 51–65.
Ardura A., Linde A. R., Moreira J. C., and Garcia-Vazquez E. (2010). DNA barcoding for conservation and management of Amazonian commercial fish. Biol. Conserv. 143, 1438–1443. doi: 10.1016/j.biocon.2010.03.019
Azad M. A. K., Rahman M. S., Rabbane M. G., Kabir M. A., Raknuzzaman M., and Hossain J. (2022). Genetic diversity of wild zebrafish Danio rerio populations available in Bangladesh. Ecol. Genet. Genomics 23, 100116. doi: 10.1016/j.egg.2022.100116
Balik-Meisner M., Truong L., Scholl E. H., Tanguay R. L., and Reif D. M. (2018). Population genetic diversity in zebrafish lines. Mamm. Genome 29, 90–100. doi: 10.1007/s00335-018-9735-x, PMID: 29368091
Bardakci F. and Skibinski D. O. F. (1994). Application of the RAPD technique in tilapia fish: species and subspecies identification. Heredity 73, 117–123. doi: 10.1038/hdy.1994.110, PMID: 8071079
Brahmane M. P., Das M. K., Sinha M. R., Sugunan V. V., Mukherjee A., Singh S. N., et al. (2006). Use of RAPD fingerprinting for delineating populations of hilsa shad Tenualosa ilisha (Hamilton 1822). Genet. Mol. Res. 5(4), 643–652., PMID: 17183476
Capili J. B. (1990). Isozyme and mitochondrial DNA restriction endonuclease analysis of three strains of oreochromis niloticus. (Doctoral dissertation). University College of Swansea.
Coe T. S., Hamilton P. B., Griffiths A. M., Hodgson D. J., Wahab M. A., and Tyler C. R. (2009). Genetic variation in strains of zebrafish (Danio rerio) and the implications for ecotoxicology studies. Ecotoxicology 18, 144–150. doi: 10.1007/s10646-008-0267-0, PMID: 18795247
Cross T. F. and King J. (1983). Genetic effects of hatchery rearing in Atlantic salmon. Aquaculture 33, 33–40. doi: 10.1016/0044-8486(83)90384-8
Daniels R. R. (1997). Taxonomic uncertainties and conservation assessment of the Western Ghats. Curr. Sci. 73, 169–170.
Ertaş H. B. and Şeker E. (2005). Isolation of Listeria monocytogenes from fish intestines and RAPD analysis. Turkish J. Vet. Anim. Sci. 29, 1007–1011.
Ferguson A. J. B. T., Taggart J. B., Prodöhl P. A., McMeel O., Thompson C., Stone C., et al. (1995). The application of molecular markers to the study and conservation of fish populations, with special reference to Salmo. J. Fish Biol. 47, 103–126. doi: 10.1111/j.1095-8649.1995.tb06048.x
Guryev V., Koudijs M. J., Berezikov E., Johnson S. L., Plasterk R. H., Van Eeden F. J., et al. (2006). Genetic variation in the zebrafish. Genome Res. 16, 491–497. doi: 10.1101/gr.4791006, PMID: 16533913
Hebert P. D. N., Stoeckle M. Y., Zemlak T. S., and Francis C. M. (2004). Identification of birds through DNA barcodes. PloS Biol. 2, e312. doi: 10.1371/journal.pbio.0020312, PMID: 15455034
Ivanova N. V., Zemlak T. S., Hanner R. H., and Hebert P. D. (2007). Universal primer cocktails for fish DNA barcoding. Mol. Ecol. Notes 7, 544–548. doi: 10.1111/j.1471-8286.2007.01748.x
Kabir T., Anwar S., Mourosi J. T., Hossain J., Rabbane M. G., Rahman M. M., et al. (2020). Arsenic hampered embryonic development: An in vivo study using local Bangladeshi Danio rerio model. Toxicol. Rep. 7, 155–161. doi: 10.1016/j.toxrep.2019.12.009, PMID: 31993334
Kabir M. A., Rahman M. S., Begum M., and Faruque M. H. (2017). Genetic diversity by RAPD in four populations of Rohu Labeo rohita. Croatian J. Fisheries 75, 12–17. doi: 10.1515/cjf-2017-0003
Lakra W. S., Verma M. S., Goswami M., Lal K. K., Mohindra V., Punia P., et al. (2011). DNA barcoding Indian marine fishes. Mol. Ecol. Resour. 11(1), 60–71. doi: 10.1111/j.1755-0998.2010.02894.x, PMID: 21429101
Lee C. J., Tyler C. R., and Paull G. C. (2020). “Geographic range and natural distribution,” in The Zebrafish in Biomedical Research (Academic Press), 41–56.
Mamuris Z., Apostolidis A. P., Theodorou A. J., and Triantaphyllidis C. (1998). Application of random amplified polymorphic DNA (RAPD) markers to evaluate intraspecific genetic variation in red mullet (Mullus barbatus). Mar. Biol. 132, 171–178. doi: 10.1007/s002270050383
Meyer C. P. and Paulay G. (2005). DNA barcoding: error rates based on comprehensive sampling. PloS Biol. 3, e422. doi: 10.1371/journal.pbio.0030422, PMID: 16336051
Mishra P. S., Chaudhari A., Krishna G., Kumar D., and Lakra W. S. (2009). Genetic diversity in Metapenaeus dobsoni using RAPD analysis. Biochem. Genet. 47, 421–426. doi: 10.1007/s10528-009-9241-7, PMID: 19396627
Mostafa M. G., Ishtiaq Ahmed A. S., Mustafa M. G., Rabbane M. G., Islam M. G., and Rafiquzzaman S. M. (2009). Genetic diversity of wild and farmed Kalibaus (Labeo calbasu, Hamilto 1822) by RAPD analysis of the genomic DNA. Croatian J. Fisheries 67, 41–52.
Nagarajan M., Haniffa M. A., Gopalakrishnan A., Basheer V. S., and Muneer A. (2006). Genetic variability of Channa punctatus populations using randomly amplified polymorphic DNA. Aquacult. Res. 37, 1151–1155. doi: 10.1111/j.1365-2109.2006.01539.x
Nei M. (1978). Estimation of average heterozygosity and genetic distance from a small number of individuals. Genetics 89, 583–590. doi: 10.1093/genetics/89.3.583, PMID: 17248844
Rabbane M. G., Ahmed M. F., Alam M. S., and Hossain M. M. (2016). Culture, reproduction and embryogenesis of wild zebrafish (Danio rerio) in laboratory condition. Dhaka Univ. J. Biol. Sci. 25, 139–148. doi: 10.3329/dujbs.v25i2.46336
Rabbane M. G. and Rahman M. R. (2017). Effects of natural and commercial feeds on growth, reproductive performances and embryogenesis of zebrafish (Danio rerio). Dhaka Univ. J. Biol. Sci. 26, 159–166. doi: 10.3329/dujbs.v26i2.46399
Rahman U. O., Jaman A., Sultana Z., Rahman M. H., Shahjahan M., and Islam M. S. (2024). Unlocking the secrets of successful spawning: laboratory techniques for breeding ornamental zebrafish Danio rerio (Hamilto 1822). Aquacult. Aquarium Conserv. Legislation 17, 1732–1748.
Rahman S. M., Khan M. R., Islam S., and Alam S. (2009). Genetic variation of wild and hatchery populations of the catla Indian major carp (Catla catla Hamilton 1822: Cypriniformes, Cyprinidae) revealed by RAPD markers. Genet. Mol. Biol. 32, 197–201. doi: 10.1590/S1415-47572009005000013, PMID: 21637668
Rosso J. J., Mabragaña E., González Castro M., and Díaz de Astarloa J. M. (2012). DNA barcoding N eotropical fishes: recent advances from the P ampa P lain, A rgentina. Mol. Ecol. Resour. 12, 999–1011. doi: 10.1111/1755-0998.12010, PMID: 22984883
Ryman N., Utter F., and Laikre L. (1995). Protection of intraspecific biodiversity of exploited fishes. Rev. Fish Biol. Fisheries 5, 417–446. doi: 10.1007/BF01103814
Saad Y. M., AbuZinadah O. A. H., El-Domyati F. M., and Sabir J. M. (2012). Analysis of Genetic signature for some Plectropomus species based on some dominant DNA markers. Life Sci. J. 9, 2370–2375.
Seyoum S. and Kornfield I. (1992). Identification of the subspecies of Oreochromis niloticus (Pisces: Cichlidae) using restriction endonuclease analysis of mitochondrial DNA. Aquaculture 102, 29–42. doi: 10.1016/0044-8486(92)90286-T
Shimoda N., Knapik E., Ziniti J., Sim C., Yamada E., Kaplan S., et al. (1999). Zebrafish genetic map with 2000 microsatellite markers. Genomics 58, 219–232., PMID: 10373319
Smith P. J., Francis R. I. C. C., and McVeagh M. (1991). Loss of genetic diversity due to fishing pressure. Fisheries Res. 10, 309–316. doi: 10.1016/0165-7836(91)90082-Q
Stickney H. L., Schmutz J., Woods I. G., Holtzer C. C., Dickson M. C., Kelly P. D., et al. (2002). Rapid mapping of zebrafish mutations with SNPs and oligonucleotide microarrays. Genome Res. 12, 1929–1934. doi: 10.1101/gr.777302, PMID: 12466297
Suresh V. R., Naskar M., Brahmane M. P., Prusty A. K., Panda D., Behera B. K., et al. (2023). Morphometric differentiation of Labeocatla (Hamilton 1822) (Cyprinidae) in rivers: Possible adaptation to hydrology. Zool. Ecol. 33, 63–76. doi: 10.35513/21658005.2023.1.8
Tassanakajon A., Pongsomboon S., Jarayabhand P., Klinbunga S., and Boonsaeng V. (1998). Genetic structure in wild populations of black tiger shrimp (Penaeus monodon) using randomly amplified polymorphic DNA analysis. J. Mar. Biotechnol. 6, 249–254., PMID: 9852621
Thomas C. D. (2010). Climate, climate change and range boundaries. Diversity Distribut. 16, 488–495. doi: 10.1111/j.1472-4642.2010.00642.x
Tsoupas A., Papavasileiou S., Minoudi S., Gkagkavouzis K., Petriki O., Bobori D., et al. (2022). DNA barcoding identification of Greek freshwater fishes. PloS One 17(1), e0263118. doi: 10.1371/journal.pone.0263118, PMID: 35081163
Ward R. D., Zemlak T. S., Innes B. H., Last P. R., and Hebert P. D. (2005). DNA barcoding Australia’s fish species. Philos. Trans. R. Soc. B: Biol. Sci. 360, 1847–1857. doi: 10.1098/rstb.2005.1716, PMID: 16214743
Waugh J. (2007). DNA barcoding in animal species: progress, potential and pitfalls. BioEssays 29, 188–197. doi: 10.1002/bies.20529, PMID: 17226815
Weigt L. A., Driskell A. C., Baldwin C. C., and Ormos A. (2012). DNA Barcoding Fishes. In: Kress, W., Erickson, D. (eds) DNA Barcodes Methods in Molecular Biology (Totowa, NJ: Humana Press), vol 858. doi: 10.1007/978-1-61779-591-6_6, PMID: 22684954
Woods I. G., Wilson C., Friedlander B., Chang P., Reyes D. K., Nix R., et al. (2005). The zebrafish gene map defines ancestral vertebrate chromosomes. Genome Res. 15, 1307–1314. doi: 10.1101/gr.4134305, PMID: 16109975
Wu Q., Chen M., Buchwald M., and Phillips R. A. (1995). A simple, rapid method for isolation of high-quality genomic DNA from animal tissues. Nucleic Acids Res. 23, 5087. doi: 10.1093/nar/23.24.5087, PMID: 8559671
Keywords: Danio rerio, zebrafish, morphometric difference, genetic diversity, RAPD, DNA barcoding
Citation: Islam MK, Badruddoza M, Salam SB, Alam MS, Kabir MA and Rabbane MG (2025) Genetic variation of three wild zebrafish population (Danio rerio) in Bangladesh. Front. Ecol. Evol. 13:1582204. doi: 10.3389/fevo.2025.1582204
Received: 24 February 2025; Accepted: 24 September 2025;
Published: 15 October 2025.
Edited by:
Samuel A. Cushman, United States Department of Agriculture, United StatesReviewed by:
Matias Leonel Giglio, The University of Utah, United StatesBismay Sahoo, Central Institute of Freshwater Aquaculture (ICAR), India
Copyright © 2025 Islam, Badruddoza, Salam, Alam, Kabir and Rabbane. This is an open-access article distributed under the terms of the Creative Commons Attribution License (CC BY). The use, distribution or reproduction in other forums is permitted, provided the original author(s) and the copyright owner(s) are credited and that the original publication in this journal is cited, in accordance with accepted academic practice. No use, distribution or reproduction is permitted which does not comply with these terms.
*Correspondence: Md Alamgir Kabir, bWFrYWJpckBkdS5hYy5iZA==; Md Golam Rabbane, cmFiYmFuZUBkdS5hYy5iZA==