 Sakar Jha
 Sheng-I Yang
 Thomas J. Brandeis
 Olaf Kuegler3
- 1School of Natural Resources, University of Tennessee, Knoxville, TN, United States
- 2United States Department of Agriculture Forest Service, Southern Research Station, Knoxville, TN, United States
- 3United States Department of Agriculture Forest Service, Pacific Northwest Research Station, Portland, OR, United States
- 4United States Department of Agriculture Forest Service, Southern Research Station, San Juan, PR, United States
Height-diameter relationship models, denoted as H-D models, have important applications in sustainable forest management which include studying the vertical structure of a forest stand, understanding the habitat heterogeneity for wildlife niches, analyzing the growth rate pattern for making decisions regarding silvicultural treatments. Compared to monocultures, characterizing allometric relationships for uneven-aged, mixed-species forests, especially tropical forests, is more challenging and has historically received less attention. Modeling how the competitive interactions between trees of varying sizes and multiple species affects these relationships adds a high degree of complexity. In this study, five regression methods and five distance-independent competition indices were evaluated for temperate and pantropical tree species in different physiographic regions. A total of 163,922 individual tree measurements from the US Department of Agriculture, Forest Inventory and Analysis (FIA) database were used in analyses, which cover Appalachian plateau (AP) and Ridge and Valley (VR) in the southeastern US, as well as Caribbean (CAR) and Pacific (PAC) islands. Results indicated that the generalized additive model (GAM) and the Pearl and Reed model provided more accurate predictions than other regression methods examined. Models with competition indices had a varying level of predictability, while diameter ratio, cumulative distribution function and partitioned stand density index (PSDI) were found to improve the prediction accuracy for AP, VR and CAR. The results of this work provide additional insights on modeling H-D relationships for a variety of species in temperate and pantropical forests.
1 Introduction
As vital components of the global carbon cycle, forest ecosystems play an important role in sustainable forest management. Temperate forests in the eastern US and tropical forests in the Caribbean and Pacific regions conserve critical, unique and vulnerable forest ecosystems. Accurately assessing current forest resources is required for the development of effective silvicultural and forest management practices for wood products, wildlife habitat and ecosystem services (Burkhart and Tomé, 2012). Total tree height (H) and diameter at breast height (DBH) are important components in estimating tree carbon, predicting tree growth and understanding stand vertical structure. However, measuring tree height in a forest is often more time consuming and labor intensive than DBH. When faced with resource constraints, a subsampling strategy is commonly combined with height-diameter (H-D) relationship models to provide an efficient approach to obtaining these data in forest inventories (Yang and Burkhart, 2020). In addition, H-D relationship models can also be applied to predict the intact length of top-broken trees, thereby improving the estimation of tree volume loss from wind disturbance such as hurricanes (Yang et al., 2022).
Due to important applications of H-D relationship models in natural resources, several models have been extensively explored and proposed according to forest types and regions (e.g., Curtis, 1967; Huang et al., 2000; Soares and Tomé, 2002). Temesgen et al. (2014) used nonlinear mixed-effects models to quantify the H-D relationships for 23 tree species in northeastern China. Mehtätalo et al., 2015 examined the performance of 16 nonlinear functions using 126,000 trees collected from different parts of the world. It was found that the model performance varied among tree species and regions (Mehtätalo et al., 2015). With increased computing power in recent decades, alternative modeling methods (e.g., semi-parametric and nonparametric approaches) have been applied to model H-D relationships. Semi-parametric models like generalized additive model (GAM) have shown to have comparable and sometimes better performance than parametric models in forestry research (Robinson et al., 2011; Adamec and Drápela, 2015; Zang et al., 2016; Yang et al., 2023). Adamec and Drápela (2015) found that GAM models are suitable for modeling the H-D relationship for Norway spruce. Similarly, Zang et al. (2016) found that GAM models had comparable performance to parametric mixed models. Furthermore, Özçelik et al. (2013) applied back-propagation artificial neural networks (ANN) models to predict total tree height of Crimean pines in southwestern Turkey. The prediction accuracy of the back-propagation artificial neural network models was comparable to the parametric methods (Özçelik et al., 2013). Chen et al. (2020) built H-D relationship models with 31 stand, environmental and climatic variables using ANN models for six boreal species in Ontario, Canada. Their models can explain more than 90% of the height variation (Chen et al., 2020). Ogana and Ercanli (2022) compared deep learning algorithms to model H-D relationships for tropical rain forest species and found that they performed better than nonlinear models. Decision tree-based algorithms such as random forests have also been found to perform well for diverse-species forests in the insular Caribbean (Yang et al., 2022). Extreme gradient boosting (XGBoost) is another tree-based algorithm which gained popularity after winning several data-mining competitions hosted by Kaggle in 2015 (Chen and Guestrin, 2016) and has been a go-to machine learning algorithm among data scientists since then. XGBoost is based on the ensemble learning method where multiple weak decision trees are combined into a strong decision tree. At each iteration, a new decision tree is trained on the residual errors of the previous tree. These decision trees are generated based on the objective function. Different from traditional gradient boosting algorithm, the objective function in XGBoost is penalized with regularization techniques to prevent overfitting (Chen and Guestrin, 2016). XGBoost has been applied in several areas of forestry, especially in using remote sensing for forestry research (e.g., Wang et al., 2022; Xu et al., 2022; Zhang et al., 2022). However, to our understanding, applying XGBoost in modeling H-D relationships for a variety of species has not been explicitly examined in the literature.
In addition to DBH and H, distance-independent competition index is another important variable in individual tree growth and allometric models. The distance-independent indices are used to quantify the influence of competition by the local neighbors of the subject tree, which do not require individual tree coordinates (Burkhart and Tomé, 2012). Sun et al. (2019) evaluated six different distance-independent competition indices for loblolly pine (Pinus taeda L.) in predicting tree growth and mortality. Diameter ratio ranked highest to predict tree survival while relative position indices performed the best for predicting diameter growth (Sun et al., 2019). For quantifying H-D relationships, Temesgen et al. (2014) indicated that the inclusion of the relative position or rank of a tree based on the size of the trees in the stand (sum of basal area of trees greater than the subject tree) in the models improved the prediction precision compared to the original models. Yang et al. (2022) pointed out that the ratio of the subject tree DBH to the sampling-unit-level quadratic mean diameter (QMD) is one of the key predictors in H-D models for multi-species subtropical forests.
In this region, significant efforts were dedicated to modeling H-D relationships for single-species, even-aged forests. Compared to monocultures, characterizing allometric relationships for uneven-aged, mixed-species forests, especially tropical forests, is more challenging and has historically received less attention. Modeling how the competitive interactions between trees of varying sizes and multiple species affects these relationships adds a high degree of complexity. Further, generic models and default values developed for temperate species are currently applied in the Caribbean and Pacific regions, which may not provide the accurate quantitative information for assessing the impact of natural disturbances and forest health.
Therefore, the objective of this study was to evaluate different regression methods and competition indices in characterizing H-D relationships. This was accomplished by comparing the prediction accuracy of two commonly used parametric models, one semi-parametric model and two machine learning algorithms. The effect of five different competition indices in predicting tree height was evaluated. Tree data queried from the US national forest inventory were used in analyses, which cover a wide range of ecosystems. Models were built for key species in the temperate forests of the eastern US and the pantropical forests on Caribbean and Pacific islands. The variations of H-D relationships among different species and regions were quantified and compared. The results of this work provide additional insights on modeling H-D relationships for a variety of species.
2 Materials and methods
2.1 Study area and species
A total of 163,922 observations used in analyses were collected from temperate forests in the eastern US and pantropical forests in Caribbean and Pacific islands. Spatial distribution of the study area is shown in Figure 1. Description of all forests is given below.
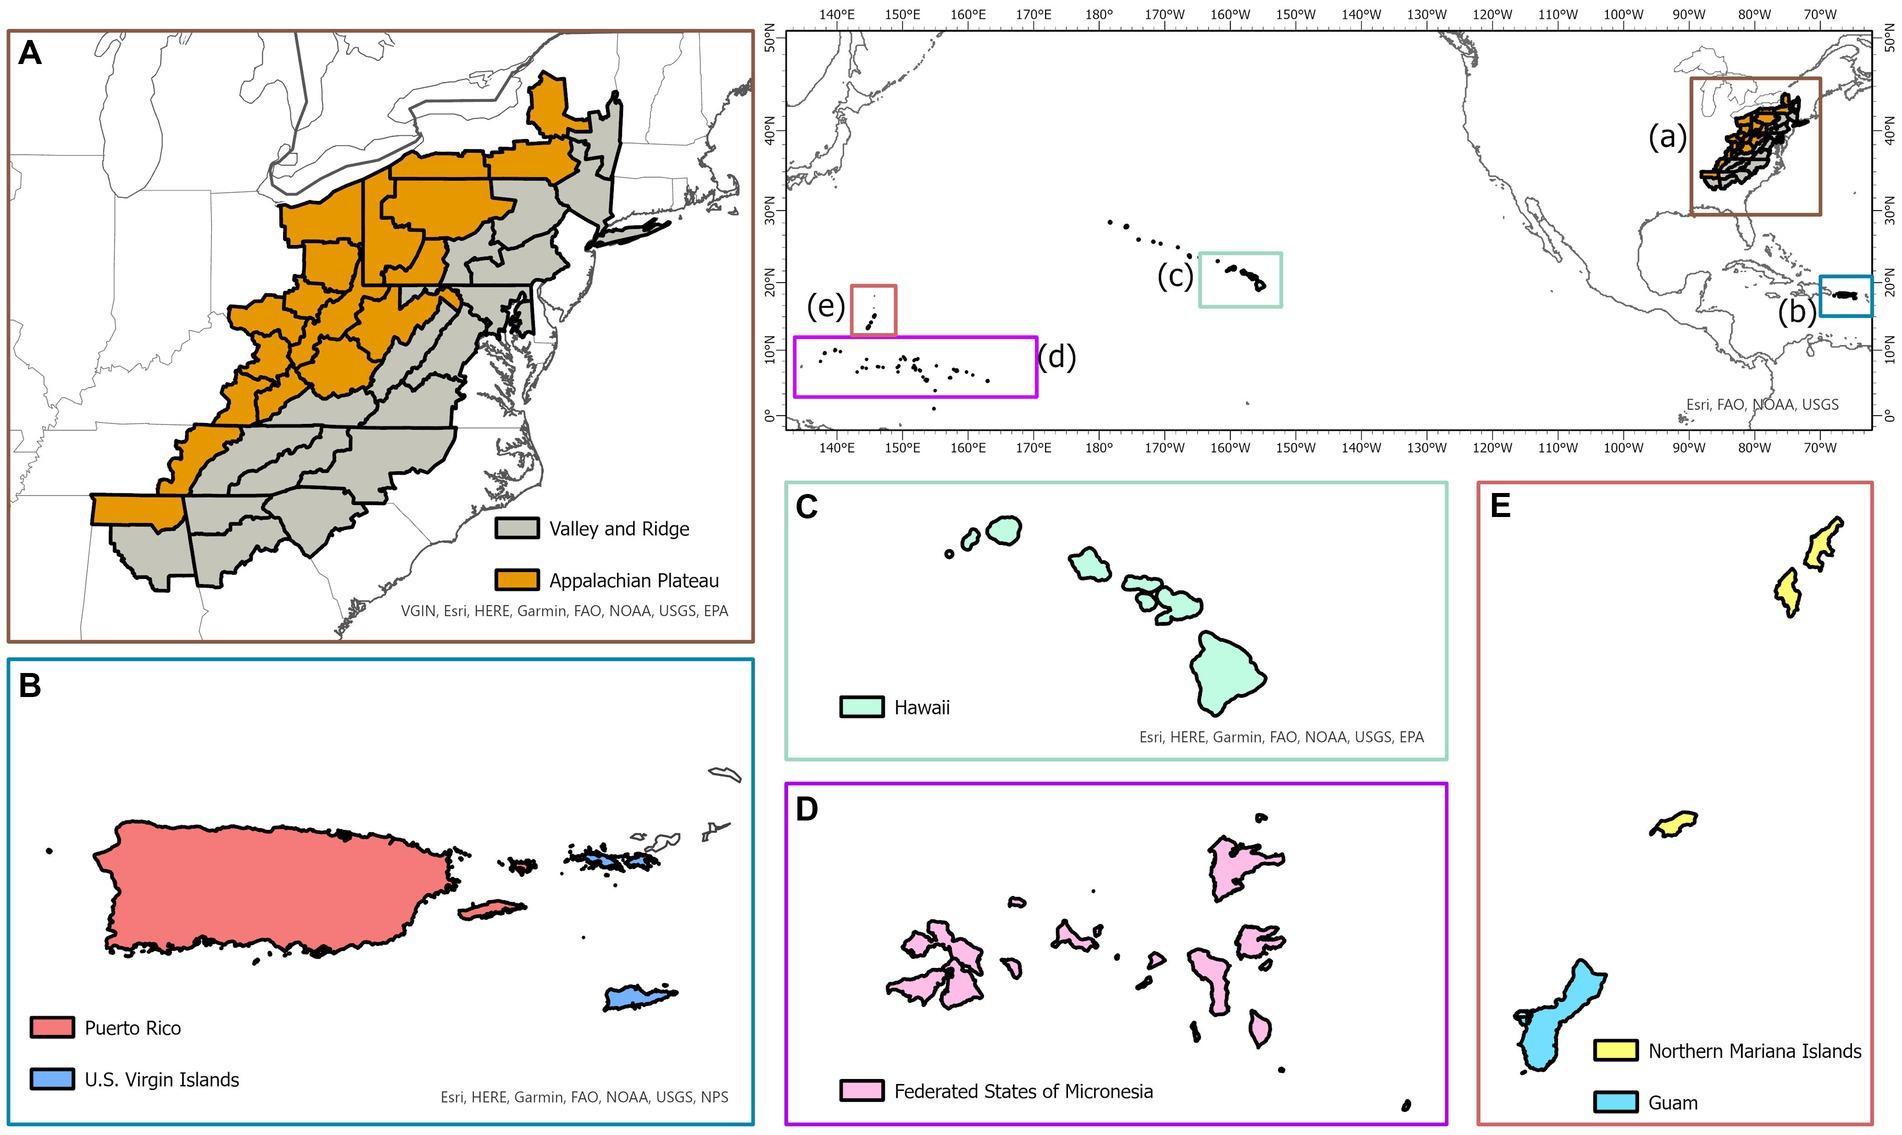
Figure 1. Map of the temperate physiographic regions (Appalachian Plateau and Ridge and Valley; A) and pantropical islands (Puerto Rico and US Virgin Islands in the Caribbean; B) and Hawaiʻi, Federated States of Micronesia, Guam and Northern Mariana Islands in the Pacific (C–E).
2.1.1 Temperate forests
The oak-hickory forests located in Appalachian Plateau (AP), and Ridge and Valley (VR) were selected, which provide critical forest ecosystems and important wildlife habitats in the eastern US. The boundaries of both physiographic zones (AP and VR) were delineated with the classification made by Fenneman and Johnson (1946) and the map of the FIA survey units listed in Burrill et al. (2021). The study area starts from northern Alabama and extends northeast toward New York covering parts of several eastern states, including Georgia, South Carolina, North Carolina, Tennessee, Kentucky, Virginia, West Virginia, Ohio, Maryland, and Pennsylvania. In this study, six ecologically and economically important species were selected in model building, which include eastern white pine (Pinus strobus L.), red maple (Acer rubrum L.), sweetgum (Liquidambar styraciflua L.), white oak (Quercus alba L.), yellow poplar (Liriodendron tulipifera L.) and hickory spp. (Carya spp.). The models were constructed at the genus level for hickories due to the limited number of trees for each individual species in the database.
2.1.2 Pantropical forests
The Caribbean islands of Puerto Rico and US Virgin Islands and the Pacific islands of Guam, Hawaiʻi, Federated States of Micronesia, and Northern Mariana Islands were selected. The Caribbean and Pacific islands have unique climatic conditions which allow for diverse forests to grow (Whiffin, 1992). Four common species groups in Puerto Rico and US Virgin Islands were selected, including pink trumpet tree (Tabebuia heterophylla DC.), muskwood (Guarea guidonia L.), African tulip tree (Spathodea campanulata P.Beauv) and Acacia (Acacia spp.). For the Pacific Island forests, common species groups: African tulip tree (Spathodea campanulata P.Beauv), ʻŌhiʻa lehua (Metrosideros polymorpha Gaudich.) and Acacia (Acacia spp.), were selected. Similar to hickories in temperate forests, models were constructed at the genus level for Acacia.
2.2 Tree data
Tree data were obtained from the US national forest inventory established and maintained by the Forest Inventory and Analysis (FIA) program under the US Department of Agriculture (USDA) Forest Service. The permanent sample plots were installed throughout the country with 10 to 20% of the sample plots being measured annually depending on the region (Burrill et al., 2018). The FIA program has regularly monitored forest resources in the US commonwealth of Puerto Rico since 1980, with US Virgin Islands, associated Pacific Islands and the state of Hawaiʻi being incorporated into the inventory network more recently. Each FIA permanent plot consisted of four fixed-radius subplots, each measuring 7.3-m (24 ft) in radius, and four fixed-radius microplots nested within each subplot, each measuring 2.1-m (6.8 ft) in radius. On each subplot, DBH and H were measured for all trees with DBH ≥ 12.7 cm (5 in.). On each nested microplot, tree with 2.5 cm (1 in.) ≤ DBH < 12.7 cm (5 in.) were measured. The permanent plots were classified based on site condition including land use, forest type, stand origin, regeneration status, ownership group and disturbance history. An FIA permanent plot can have multiple condition classes based on distinct differences between forested growing conditions. Throughout this study, a distinct forested condition class within a plot was considered as the fundamental sampling unit (i.e., an individual sample of trees). Stand characteristics (e.g., QMD, stand density index) used in computing competition indices were computed from all live trees on a “condition class” rather than a whole “plot.” Irregular observations (e.g., broken-top individuals, seriously-damaged stems) were removed from analysis. More details of the FIA sampling design and measurement procedures are available in (Bechtold and Patterson, 2005). A summary of tree characteristics for all species in temperate and pantropical forests is given in Table 1.
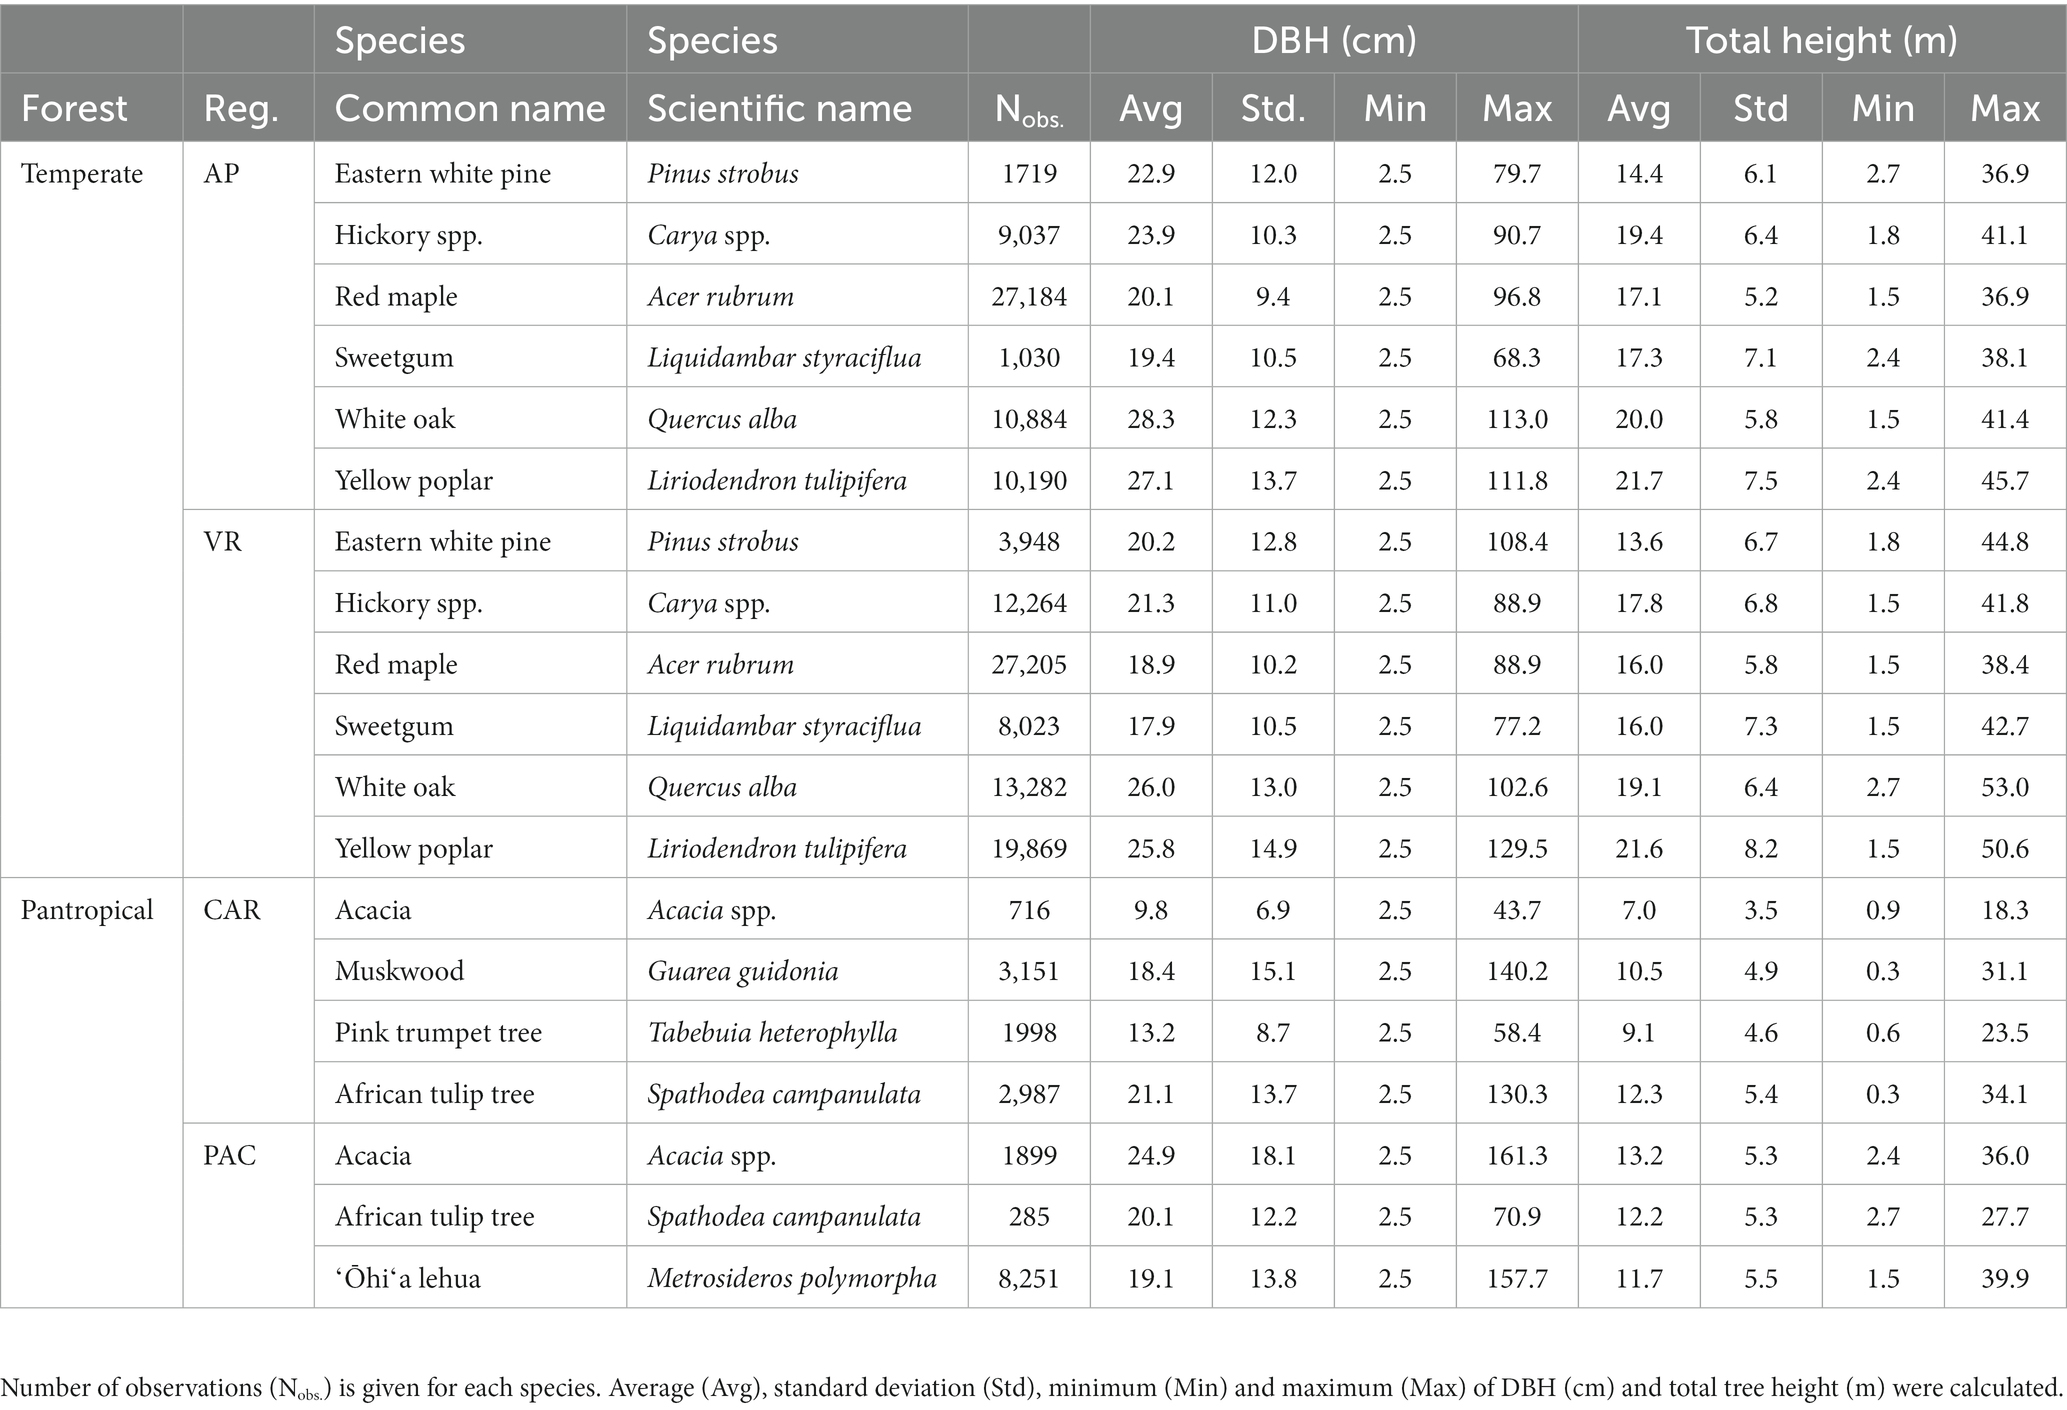
Table 1. Summary of tree data among temperate (Appalachian Plateau, AP, and Valley and Ridge, VR) and pantropical forests (Caribbean islands, CAR, and Pacific islands, PAC).
2.3 Regression methods
Five regression methods: two parametric functions (Pearl and Reed, 1920; Wykoff et al., 1982), one semi-parametric algorithm (GAM) and two nonparametric machine learning algorithms (XGBoost and ANN), were used to quantify H-D relationships. The regression methods were applied to each combination of species and region. For a given regression method, two types of H-D models were built. The first type included only DBH, denoted as base model, while the other type was composed of DBH and a competition index. In this study, five different competition indices were evaluated, resulting in a total of five H-D models in the second type. Detailed descriptions of the methods and competition indices are given below.
2.3.1 Parametric model 1
The Pearl and Reed (1920) model, denoted as PR model, was first introduced for predicting population growth in the US. It has been adopted in forestry to predict tree height for different species, such as oaks (Misik et al., 2016) and subtropical trees (Yang et al., 2022). Similar to Yang et al. (2022), the competition index was added in the exponent with DBH in the model. That is,
where h is total tree height in m, DBH is diameter at breast height in cm, CI is competition index, , , and are model coefficients. To construct the base model, in Equation (1) was removed and other variables remained the same.
2.3.2 Parametric model 2
Wykoff et al. (1982) developed a statistical model to estimate the missing heights of trees, which is another commonly used H-D model in forestry. In our preliminary analysis, the original form of the Wykoff et al. (1982) model, denoted as WK model, did not fit well for our data. Thus, a modified version of the WK model was used in the formal analysis, which can be written as:
where all variables and symbols have been defined as above. Similar to the PR model, the base model was built using Equation 2 without in the model.
The ‘nlsLM’ function from the R package ‘minpack.lm’ (Elzhov et al., 2022) was used to estimate the model coefficients. Initial values of the model coefficients were selected based on previous studies (e.g., Misik et al., 2016; Yang et al., 2022).
2.3.3 Semi-parametric model 1 – general additive model
GAM is the blended product of generalized linear models and additive models that uses smoothing functions of the predictor variables to capture any non-linear relationship between the response and the predictor variables. The relationship between the response variable (tree height) and the predictor variables (DBH and competition index) is modeled as a sum of smooth functions of the predictor variables which can be represented as:
where h is the total tree height (m), is the model intercept and f1 to fk are the smooth functions for predictors x1 to xk. The smooth functions f1 to fk are used to find the signal in predictor variables to make predictions for the tree height without being constrained by predefined assumptions about the distribution of the data. The ‘gam’ function from the R package ‘mgcv’ (Wood, 2017) was used to fit the model.
2.3.4 Nonparametric model 1 – extreme gradient boosting
The working mechanism of XGBoost involves minimizing the loss function using gradient descent optimization, while incorporating regularization techniques to prevent overfitting and improve generalization performance (Chen and Guestrin, 2016). The input data is a matrix X of dimension n × p where n is the number of observations and p is the number of predictor variables (DBH and CI in this case). X can be represented as X = [x1, x2, …, xp] where xi is a column vector of size n containing the values of the ith predictor variable for all n observations. The predicted height ( can be represented as:
where is the predicted tree height w0, w1, …, wk are the weights assigned to each decision tree, di(X) is the output of the ith decision tree for input X, and k is the number of decision trees in the model. The optimal weights and decision trees are computed using the objective function. The objective function of XGBoost is composed of a loss function and regularization parameters, given by,
where is the sum of differentiable loss function for the ith observation that measures the difference between the predicted tree height ( and observed tree height ( , represents the regularization parameters that penalizes the complex model and is the kth decision tree in the ensemble model. The loss function is minimized using the gradient descent optimization technique where the gradient of the loss function with respect to the predicted values for each observation is represented as:
The gradient descent algorithm then updates the predicted height ( ) by adding a shrinkage parameter (λ) multiplied by the output of the ith decision tree (di(X)) with the predicted height from previous decision ( ) tree given as:
The XGBoost model has seven hyperparameters that need to be tuned for optimal model performance. They are: nrounds, eta, max_depth, colsample_bytree, subsample, gamma and min_child_weight for every given species in a region. These hyperparameters were tuned using 5-fold cross-validation method using the ‘caret’ package in R (Kuhn, 2008). The results of parameter tuning for the XGBoost model for a given species in a region are shown in Supplementary Table 1.
2.3.5 Nonparametric model 2 – artificial neural networks
Artificial neural network (ANN) is a powerful machine learning algorithm that has been used to solve highly complex prediction problems (Abiodun et al., 2018). ANNs are based on a simplified model of biological neural systems where the output from a layer of nodes serves as input for the next layer of nodes (Walczak and Cerpa, 2003). ANNs can have multiple layers of nodes which includes the input and output layers that have same number of nodes as the number of input and output variables, respectively, (Walczak and Cerpa, 2003). The layers between the input and output layers are called hidden layers. The hidden layers are generally composed of mutiple dense layers and dropout layers specified by the researcher. Dense layers have specified number of nodes for training the model and dropout layers are used to drop some of the nodes from the previous layer based on a specified dropout rate to prevent overfitting. The output of a particular node is given by a activation function with the sum of the weighted inputs and biases from the previous dense layer. ANN uses back propagation training algorithm that allows the ANN to iteratively adjust the weight and biases of the nodes by propagating the error from the output layer back through the network.
We employed an ANN model with four hidden layers between the input and output layers. The input layer was passed through a dense layer followed by a dropout layer, followed by another dense layer and a dropout layer and finally an output layer (see Supplementary Figure 1). The rectified linear unit (ReLU) activation function was used for the dense layers. For each of the ANN models, the number of nodes in dense layers, the dropout rate of the dropout layers and the batch size was tuned for optimal model performance using the ‘tfruns’ package in R (Kalinowski et al., 2022). The result of parameter tuning for ANN model for a given species in a region are shown in Supplementary Table 2.
2.4 Competition index
Competition between neighboring trees is a primary determinant of resource availability for tree establishment and growth (Stage, 1973; Huang and Titus, 1995). Several distance-dependent and distance-independent competition indices have been developed to mathematically represent the level of competition for a target tree (Burkhart and Tomé, 1989). In this study, we selected five commonly used distance-independent competition indices (CI’s).
2.4.1 Diameter ratio
Diameter ratio ( ) is the ratio of DBH of subject tree to the average DBH on a sampling unit. The quadratic mean diameter (QMD) was used as the average DBH instead of arithmetic mean diameter because QMD tends to better represent the average diameter in a stand with a wide range of diameters (Curtis and Marshall, 2000).
where all variables have been defined as above.
2.4.2 Basal area ratio
Similar to , basal area ratio ( is the ratio of individual tree basal area (BA) to the mean tree BA ( ) calculated from all sample trees on a sampling unit, which can be expressed as:
where is the basal area of tree and is the mean basal area in the condition class.
2.4.3 Partitioned stand density index
Stand density index (SDI) proposed by Reineke (1933) was a standardized measure of stand density. Stage (1968) showed that Reineke’s SDI can be partitioned into additive components at individual tree and group level. Partitioned SDI (PSDI) divides the stand density index at the individual tree level and was used as an individual tree competition index by Sun et al. (2019), which is expressed as:
where EF is the expansion factor which is constant for FIA subplots = 6.018046 (Burrill et al., 2021), d is the diameter at breast height of subject tree, a is the weight of the presence of subject tree, b is the weight of size of subject tree (Lu et al., 2017). They are given as:
where c is the self-thinning constant = 1.605 (Reineke, 1933).
2.4.4 Cumulative distribution function
The cumulative distribution function provides the observed cumulative probability of the individual tree in a sampling unit (Poudel and Cao, 2013). It was used as competition index by Sun et al. (2019) to illustrate the relative position of a loblolly pine tree in a population, which can be written as:
where is the rank of tree in terms of DBH (from largest to smallest) and is the number of trees in the condition class.
2.4.5 Basal area of larger trees
Proposed by Wykoff et al. (1982), basal area in larger trees (BAL) was calculated by summing up the BA of all trees larger than the subject tree based on DBH. BAL can be used to quantify the relative dominance of the subject tree in the population. A greater BAL implies that the subject tree has a smaller diameter than other trees.
2.5 Model building and evaluation
For a given species in a region, all sampling units were randomly divided into fit and test datasets with an 80/20 split. Specifically, fit dataset includes 80% of the sampling units to construct the models, and the test dataset was composed of the remaining 20% of the data for model evaluation. To account for the correlation among sample trees within the same sampling unit, the cluster bootstrap technique was used to estimate the confidence intervals of the model parameters and evaluation statistics. The cluster bootstrap was applied at the sampling unit (condition class) level, rather than at the individual tree level. Sampling units in the fit and test data were sampled with replacement, respectively, and all trees within the selected sampling units were included in model building and evaluation. A total of 500 bootstrapped samples were drawn for a given combination of species and region. The 50% quantile of the 500 bootstrapped samples served as the point estimate of the model parameters and evaluation statistics. The 97.5 and 2.5% quantiles of the 500 bootstrapped samples were used as the upper and lower limits of the 95% confidence intervals for the model parameters and evaluation statistics.
Evaluation statistics were computed using the test data, including coefficient of determination (R2) which represents the amount of variance explained, mean bias (MB) represents precision and root-mean-square error (RMSE) represents accuracy of the model. They were computed as:
where is total number of observations for a given species in a region, and is prediction residual, which was defined as:
where is the observed total tree height and is the predicted total tree height of the individual tree.
The relative rank proposed by Poudel and Cao (2013) was used to rank the models. The evaluation statistics computed for every combination of regression method and competition index was used to rank the models for a given species in a region. The relative rank for absolute MB and RMSE is given as:
where Ranki is the rank of ith combination of regression method and competition index for a given species in a region, m is the number of models evaluated. ESi is the evaluation statistics of the ith combination of regression method and competition index, ESmin and ESmax are the minimum and maximum values of evaluation statistics for a given species in a region. Similarly, the relative rank for R2 is given as Equation (18) where the symbols are same as defined above. The ranks among the three evaluation statistics were averaged to compute the final rank of the model. The base models were ranked separately to identify the best regression methods, and all models were ranked together to identify the best combination of regression method and competition index.
3 Results
3.1 Predictability of the base models on temperate trees
In general, the GAM model was found to have the highest rank for all the species across the regions (Figure 2A). The PR model was found to have the highest rank for the temperate species in AP and XGBoost and GAM were found to have the highest rank for species in VR (Figure 2B). The GAM model provided the least biased predictions for two species in AP and three species in VR and the lowest RMSE for two species in AP and three species in VR (see Tables 2, 3). The evaluation statistics for GAM, XGBoost and PR models are similar in VR (see Table 3). The PR model produced the least biased predictions for two species in AP and two species in VR. The WK model provided the least biased predictions for only one species and did not provide the highest R2 or least RMSE for any of the species. However, it did provide a higher R2 for three species and a lower RMSE for two species in AP compared to either XGBoost or ANN models. The predictive performance of XGBoost and ANN models had more variation compared to other regression methods in the temperate region. Although XGBoost and ANN produced the highest average rank for two species in AP and two species in VR respectively, they also produced lowest overall rank for other species in the temperate region (Figures 3A,B).
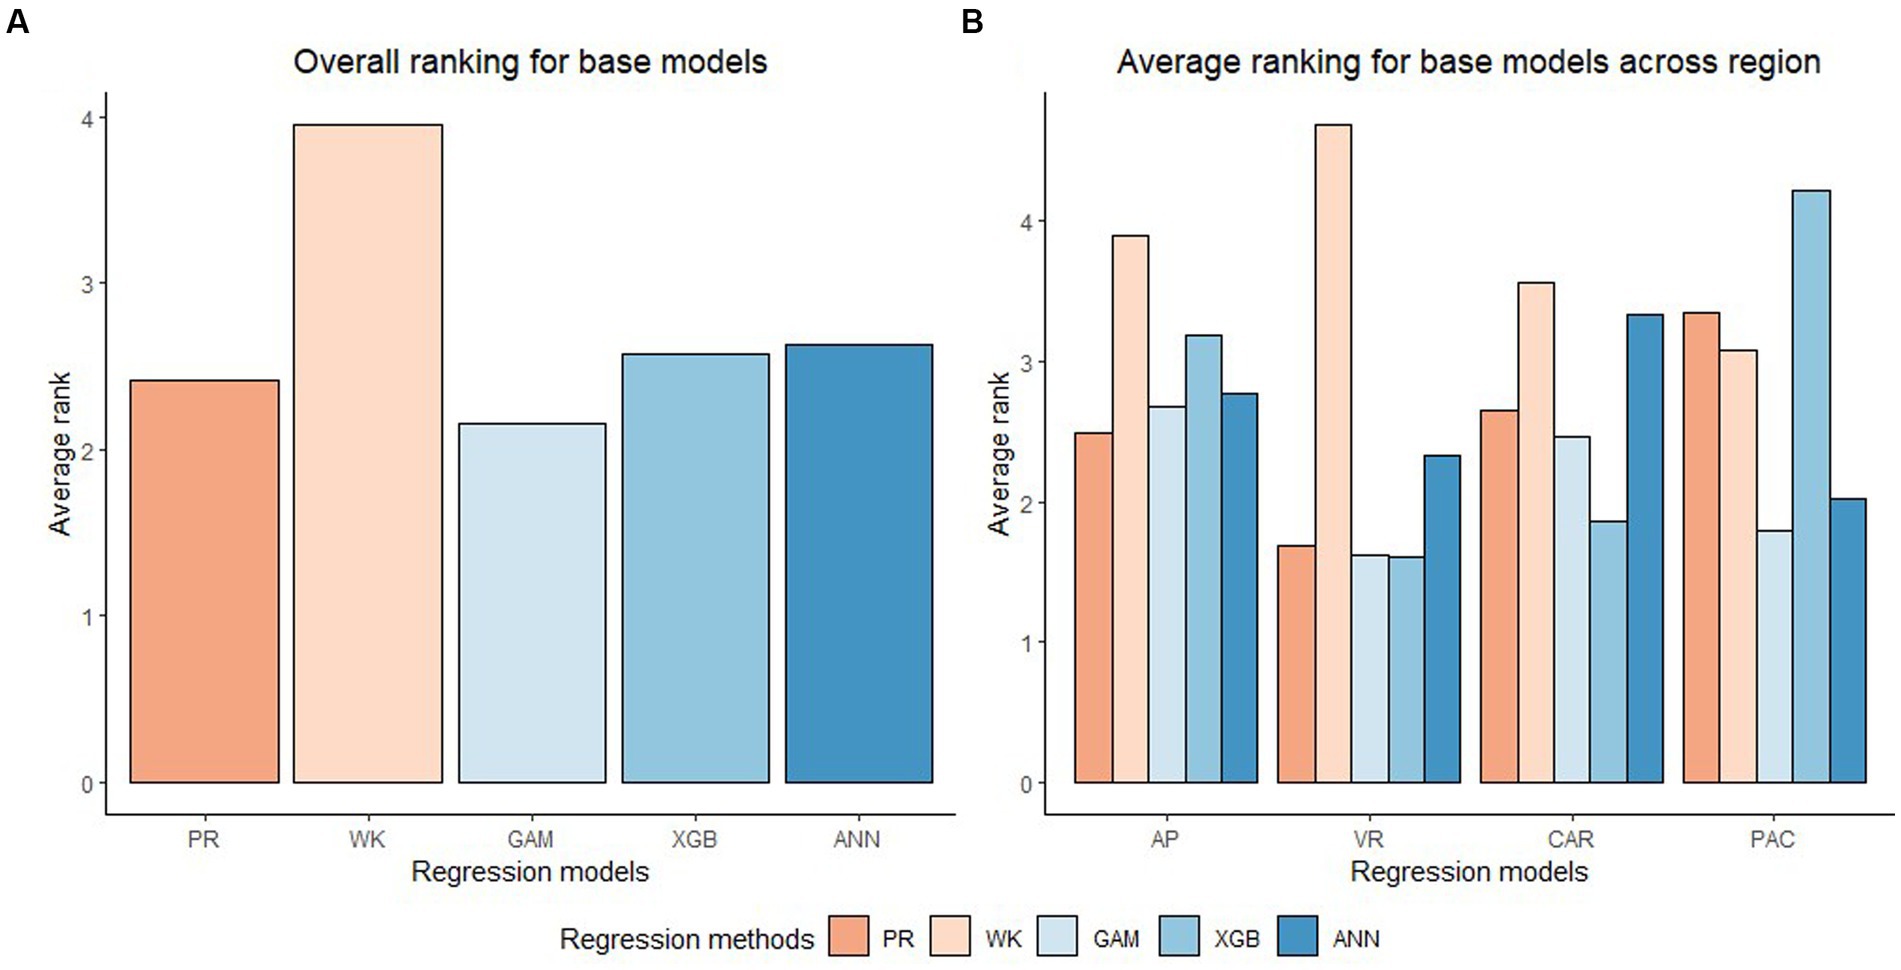
Figure 2. Overall ranking (Lowest rank is the best) of five base regression methods (Pearl and Reed (1920), PR; Wykoff et al., 1982, WK; Generalized additive model, GAM; Extreme gradient boost, XGB; Artificial neural network, ANN) across all the species and physiographic region in (A) and across all species in four physiographic regions (Apalachian plateau, AP; Ridge and Valley, VR; Caribbean islands, CAR; Pacific islands, PAC) in (B).
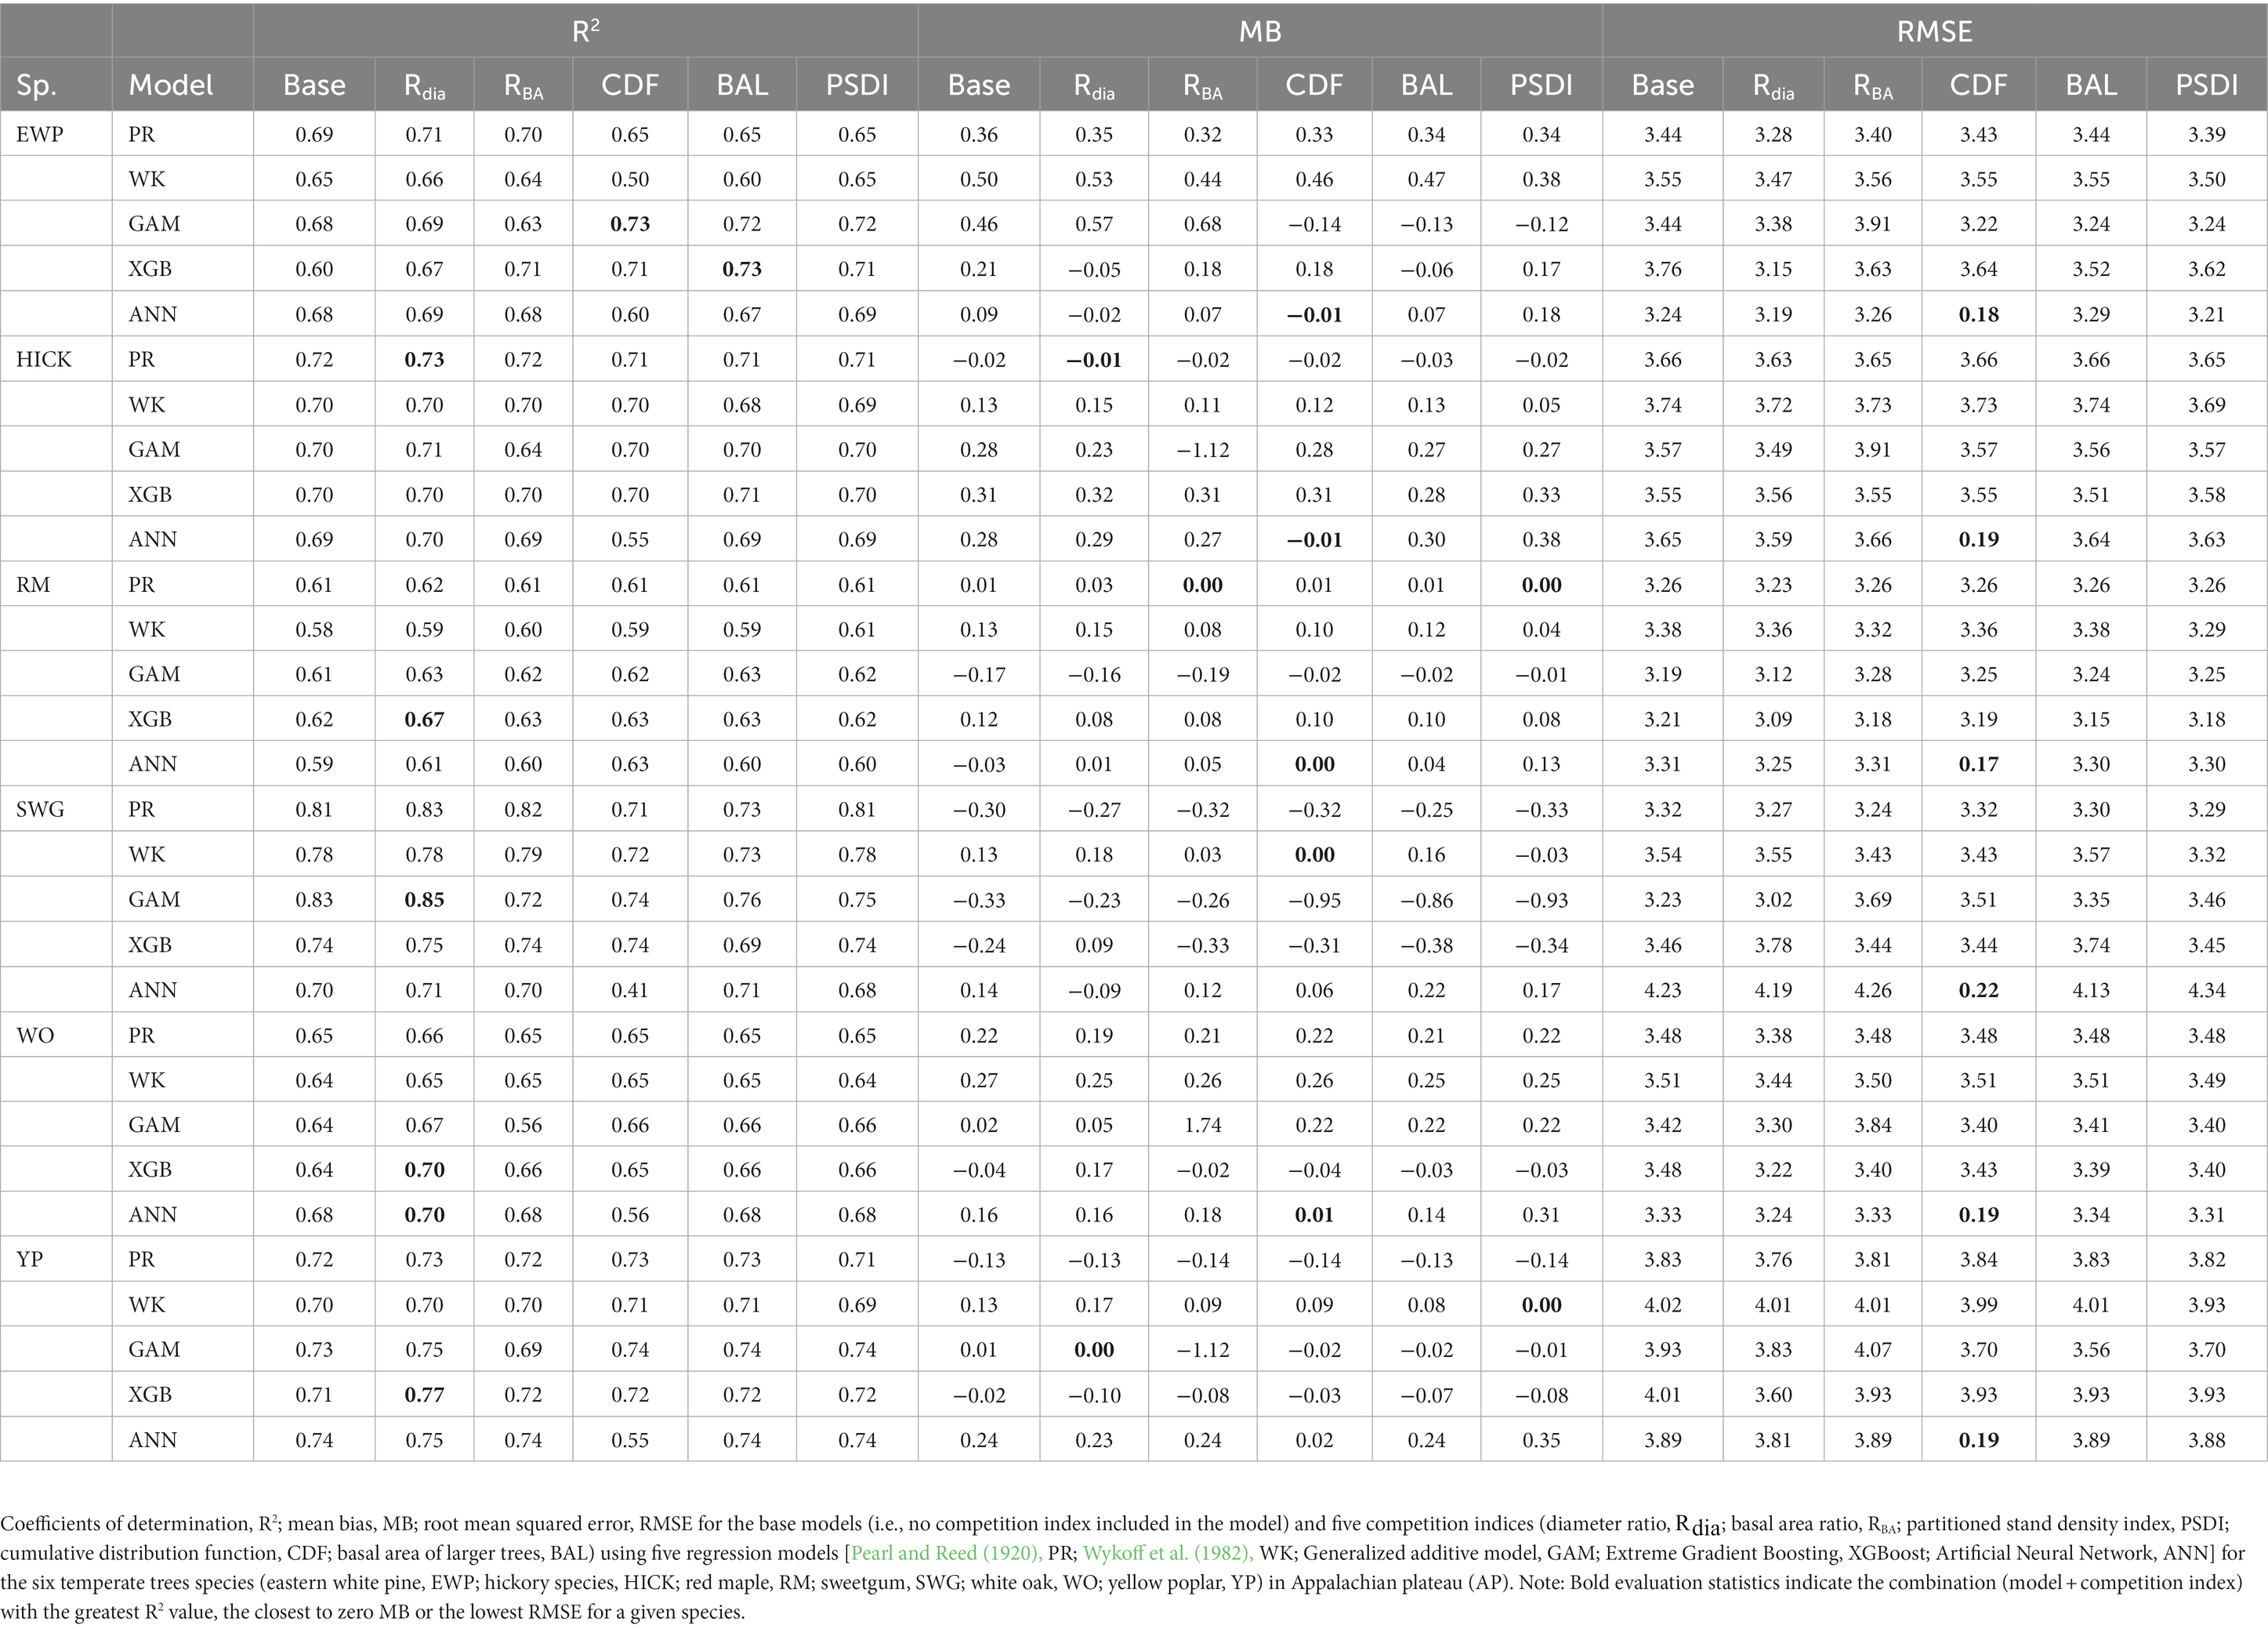
Table 2. Median of the evaluation statistics.
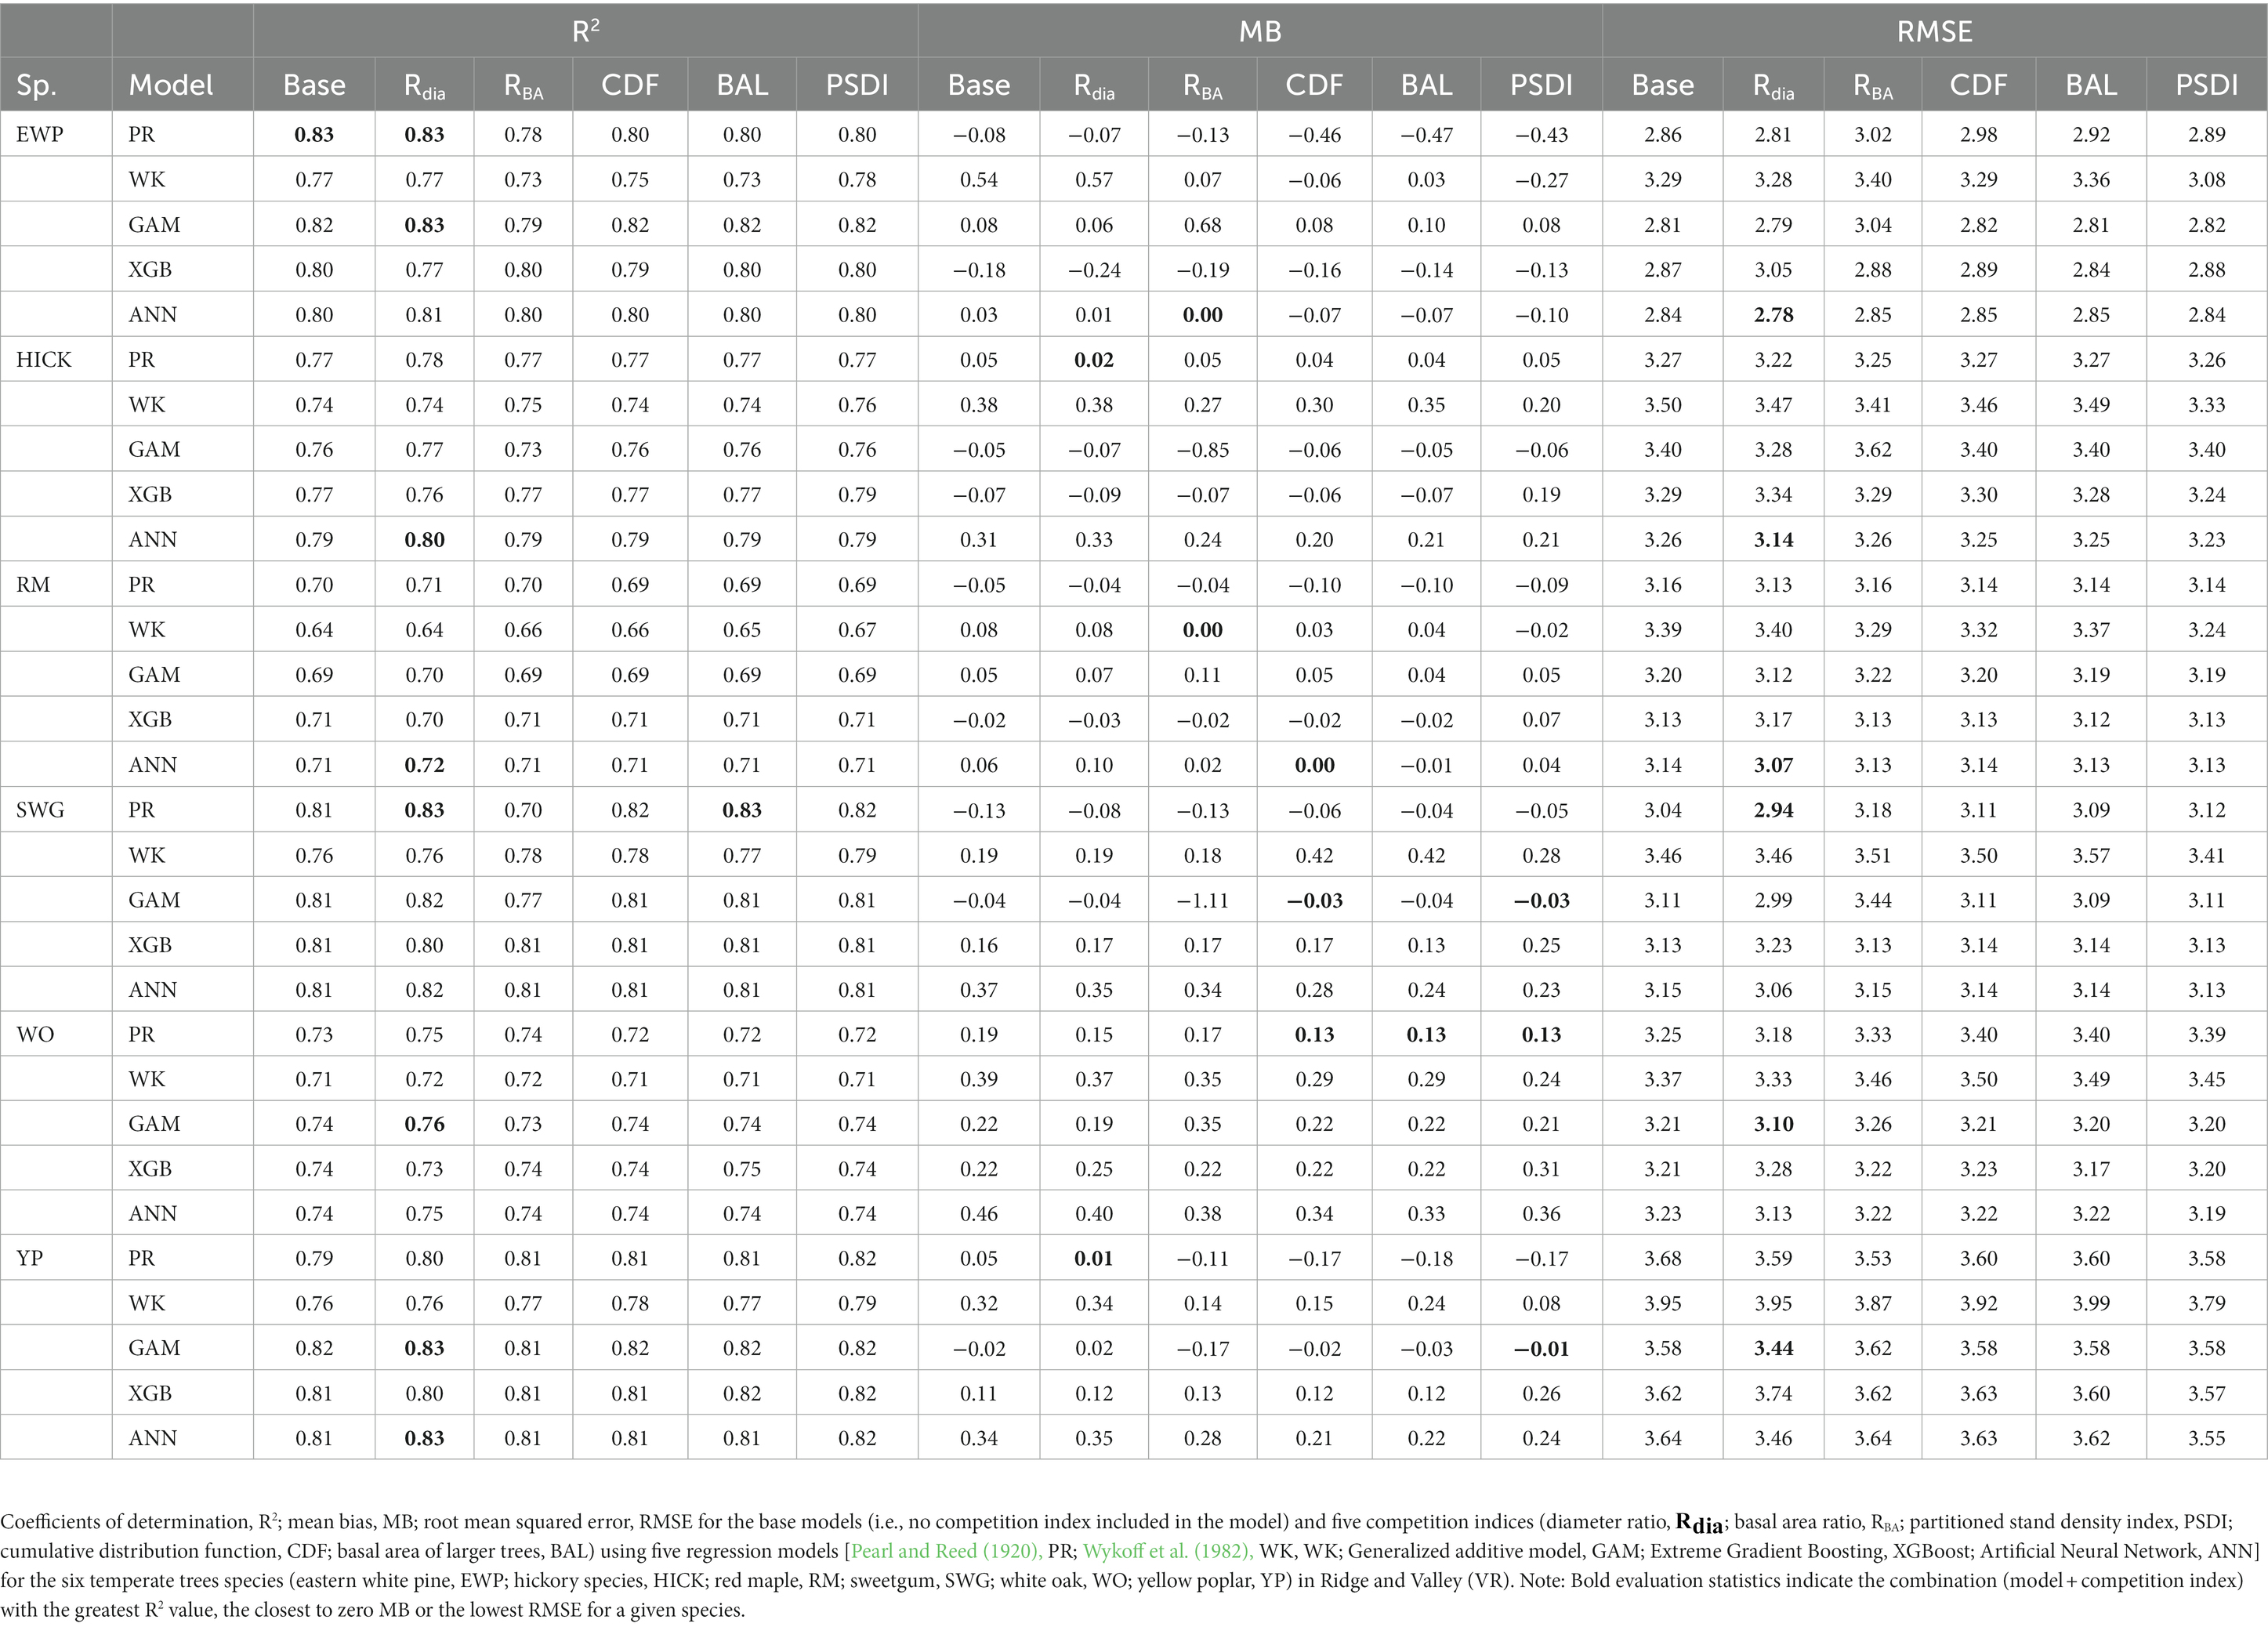
Table 3. Median of the evaluation statistics.
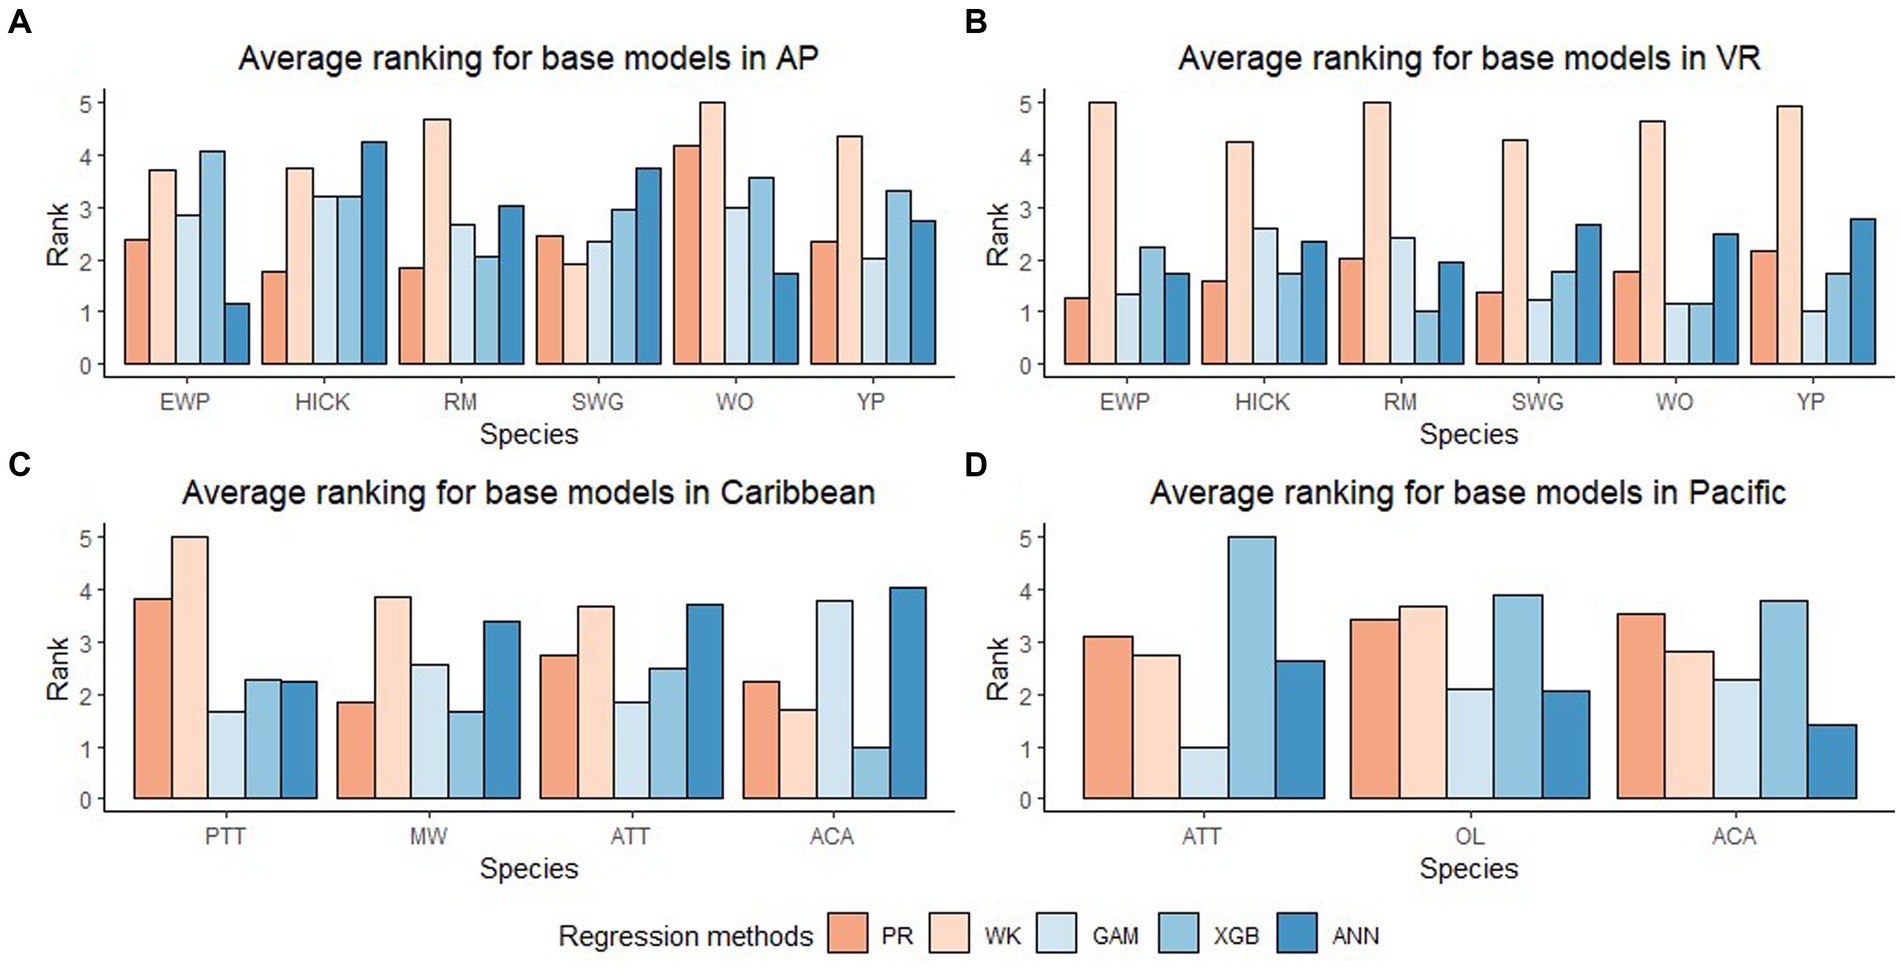
Figure 3. Average rank (Lowest rank is the best) of five base regression methods for species in Appalachian plateau (AP) in (A) (eastern white pine, EWP; hickory species, HICK; red maple, RM; sweetgum, SWG; white oak, WO; yellow poplar, YP), Ridge and Valley (VR) in (B) (eastern white pine, EWP; hickory species, HICK; red maple, RM; sweetgum, SWG; white oak, WO; yellow poplar, YP), Caribbean islands (CAR) in (C) (pink trumpet tree, PTT; muskwood, MW; African tulip tree, ATT; acacia species, ACA) and Pacific islands (PAC) in (D) (African tulip tree, ATT; ʻŌhiʻa lehua, OL; acacia species, ACA).
3.2 Predictability of base models on pantropical trees
The XGBoost model performed the best for species in CAR and GAM performed the best for species in PAC (Figure 2B). XGBoost produced the least biased prediction for one species and most accurate (lowest RMSE) predictions for two species in CAR. It also had the lowest overall rank for all the species in PAC (Figure 3D). GAM produced most precise predictions for one species in PAC and most accurate predictions for two species in CAR and two species in PAC. The ANN model produced the most precise predictions for one species in CAR and most accurate predictions for one species in PAC, respectively. The WK model had comparatively closer to zero MB values for species in PAC than other regions but also had the highest RMSE values for two of the species in PAC (see Table 4).
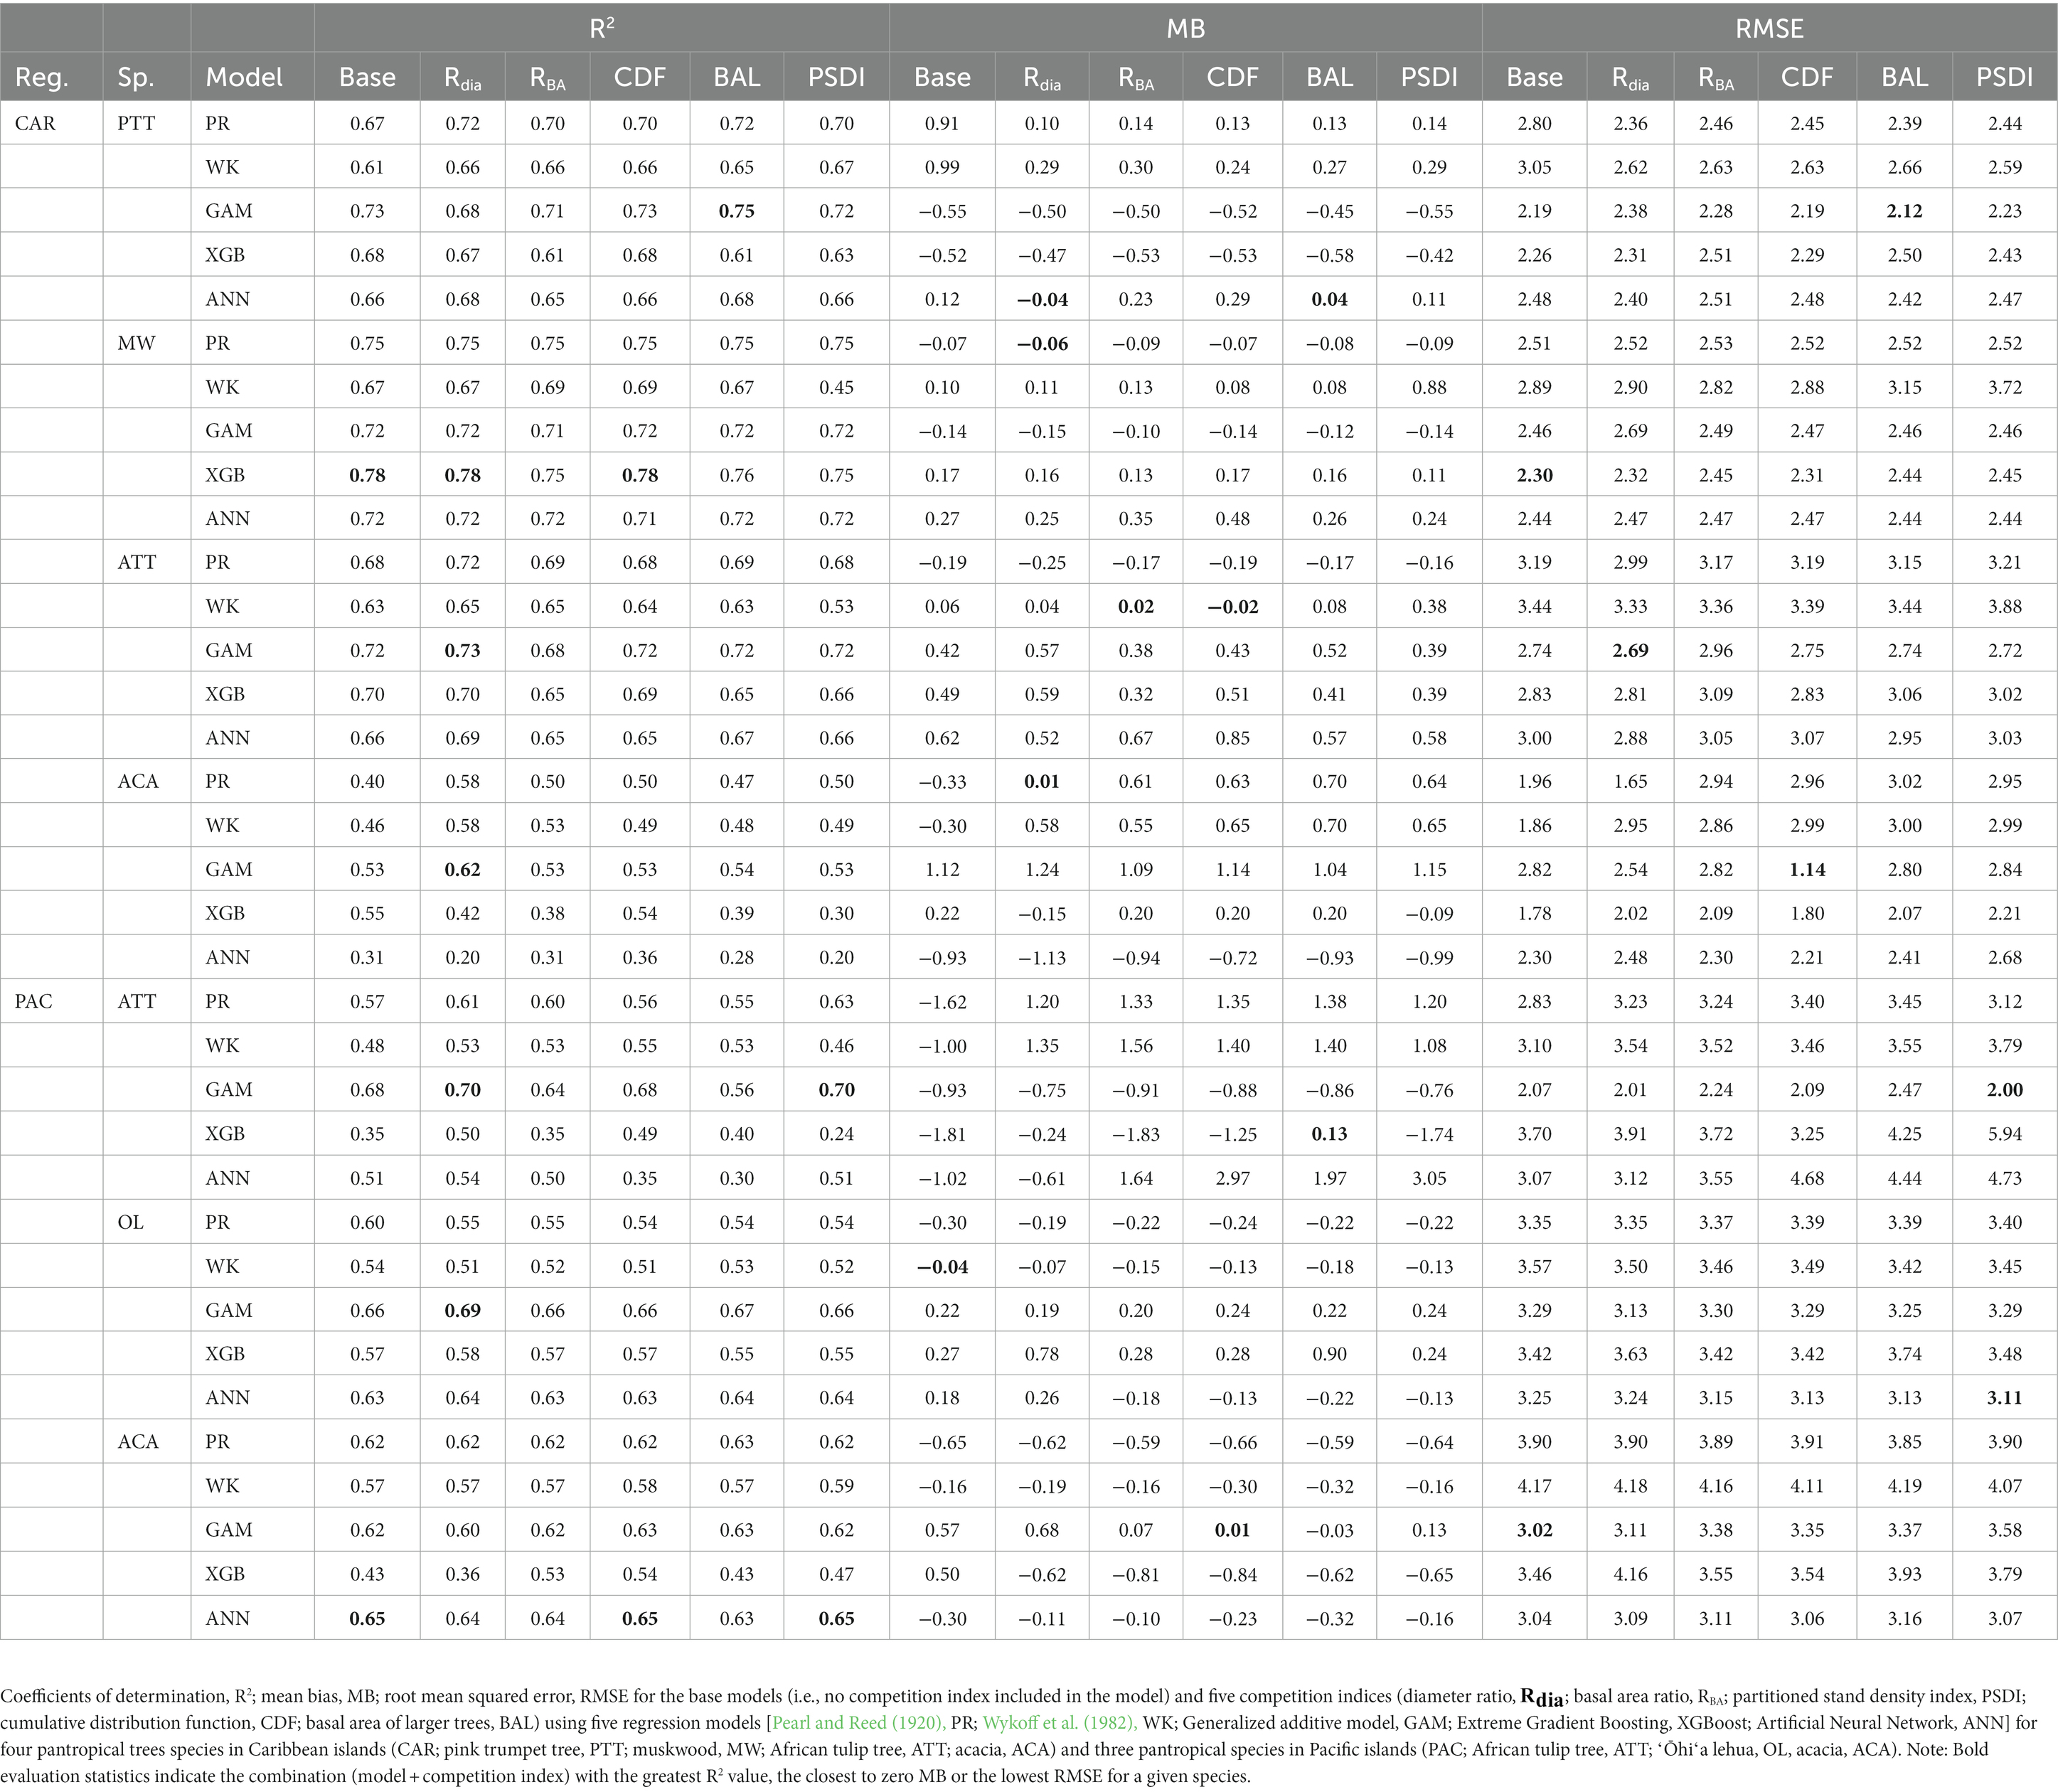
Table 4. Median of the evaluation statistics.
3.3 Predictability of models with and without competition index
The inclusion of competition index improved the predictive abilities of most of the models for the temperate and pantropical species. On average, Rdia was found to have the highest rank for PR and GAM models (Figures 4A,C). PSDI was found to have the highest rank for WK models (Figure 4B). Similarly, CDF was found to have the highest rank for XGBoost and ANN models (Figures 4D,E). The R2 values for every species increased by an average of 4.8% and absolute MB and RMSE decreased by an average of 79.3 and 48.8%, respectively, in the temperate region. Similarly, the R2 value increased by an average of 4.0% and absolute MB and RMSE decreased by an average of 43.3 and 10.3%, respectively, in the pantropical region (see Table 5). However, the magnitude of improvement varied by species. The inclusion of competition index increased the R2 value by a minimum of 1.3% for hickory spp. in AP and 0.0% for eastern white pine in VR to a maximum of 21.6% for eastern white pine in AP and 2.7% for white oak in VR (see Table 5). Among the pantropical species, R2 values did not increase for muskwood in CAR and acacia in PAC (see Table 5).
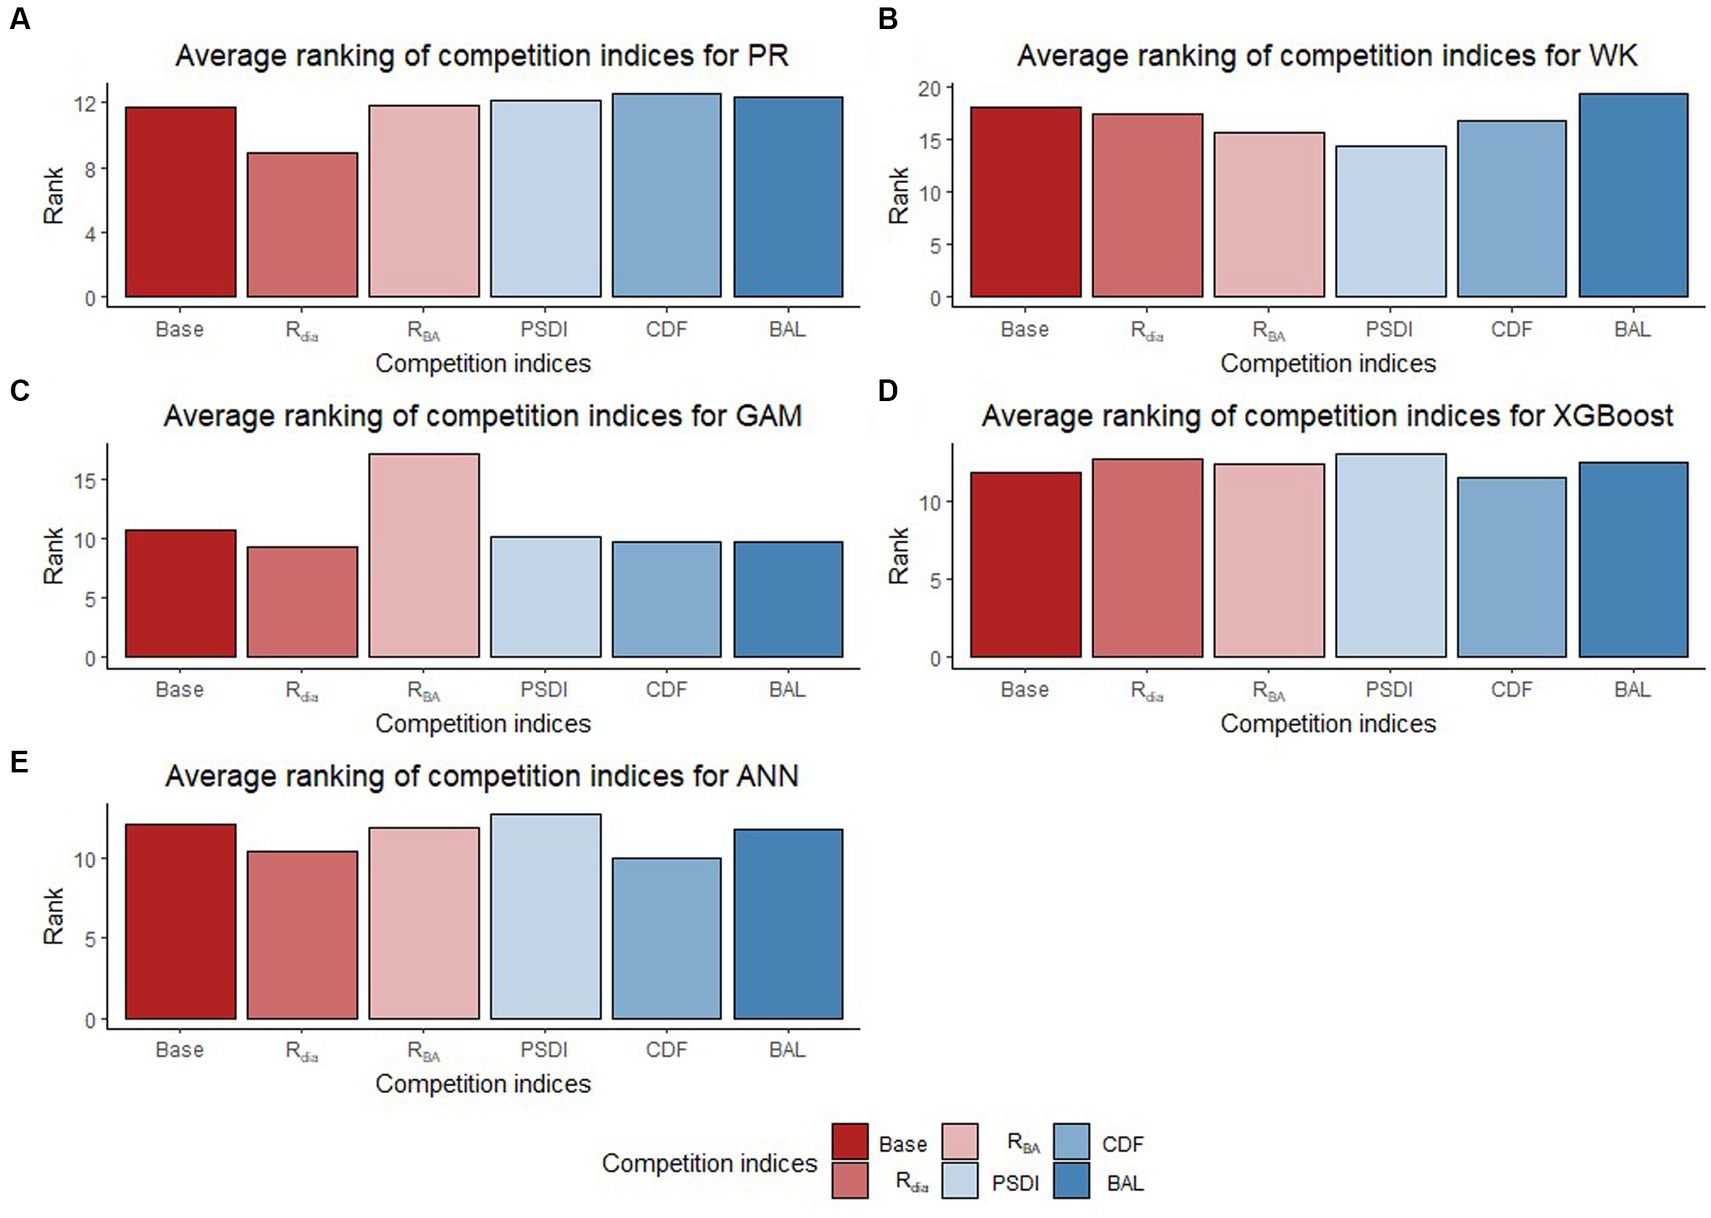
Figure 4. Average ranking (Lowest rank is the best) of competition indices (diameter ratio, Rdia; basal area ratio, RBA; partitioned stand density index, PSDI; cumulative distribution function, CDF; basal area of larger trees, BAL) for five regression models [Pearl and Reed (1920), PR (A); Wykoff et al. (1982), WK (B); Generalized additive model, GAM (C); Extreme Gradient Boosting, XGBoost (D); Artifical Neural Network, ANN (E)] across all species and physiographic regions.
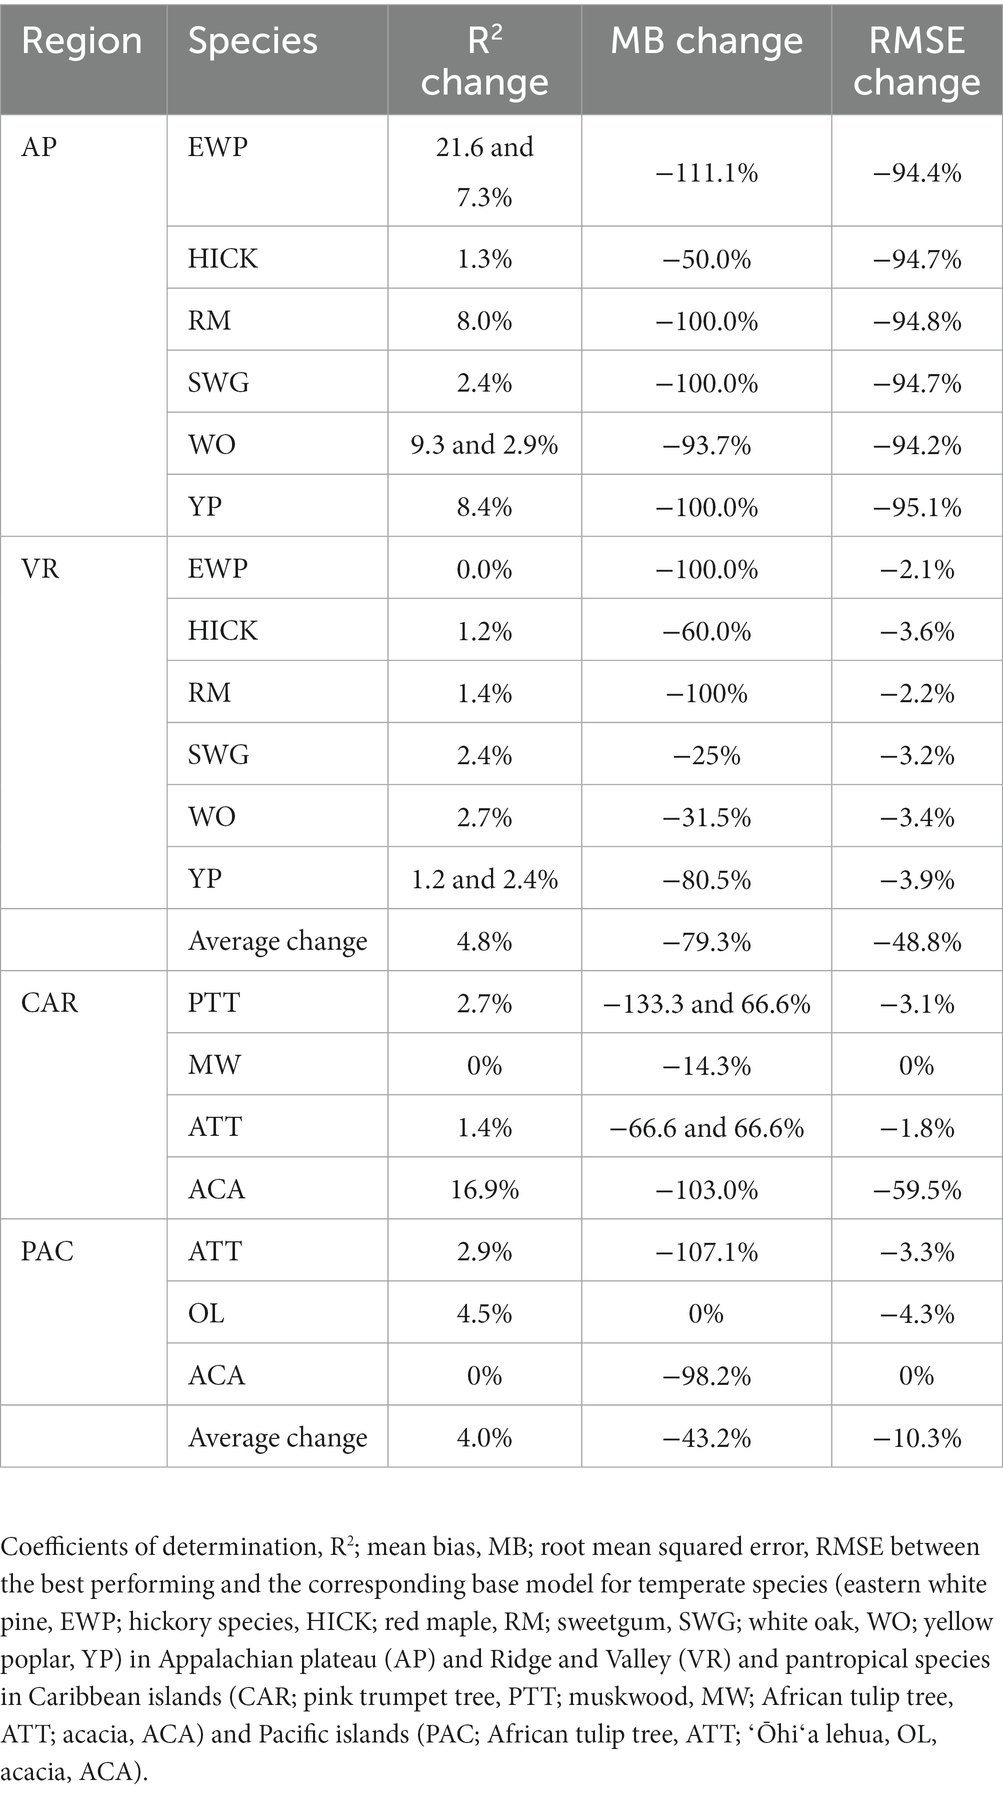
Table 5. Percentage change of evaluation statistics.
3.4 Best combination of regression method and competition index for different regions
The combination of regression method and competition index that had the highest rank was different for the four physiographic regions. The combination of ANN and CDF ranked the highest for AP (see Figure 5A). Specifically, the ANN model with CDF as competition index provided the least biased predictions for four species and most accurate predictions for all the species in AP (see Table 2). For the temperate species in VR, GAM with Rdia as competition index performed the best (see Figure 5B). This combination of regression method and competition index provided the highest coefficient of determination for three species and lowest RMSE for two species (see Table 3). For the pantropical species in CAR, PR with Rdia was found to perform the best (see Figure 5C). This combination provided the least biased prediction for two of the CAR species. Similarly, GAM with CDF performed the best for species in PAC region (see Figure 5D). The height-diameter curves of the highest and lowest ranked model for the four physiographic regions are given in Figure 6. For some of the species, more than one combination of regression method and competition index provided the highest rank for one of the three evaluation statistics. For example, PR with RBA and PSDI provided the least biased predictions for red maple in AP (see Table 2). Further, some base models had the same evaluation statistics as models with competition index which was best for the species. For example, base XGB, XGB with Rdia and XGB with CDF had the highest amount for variation explained for muskwood in CAR.
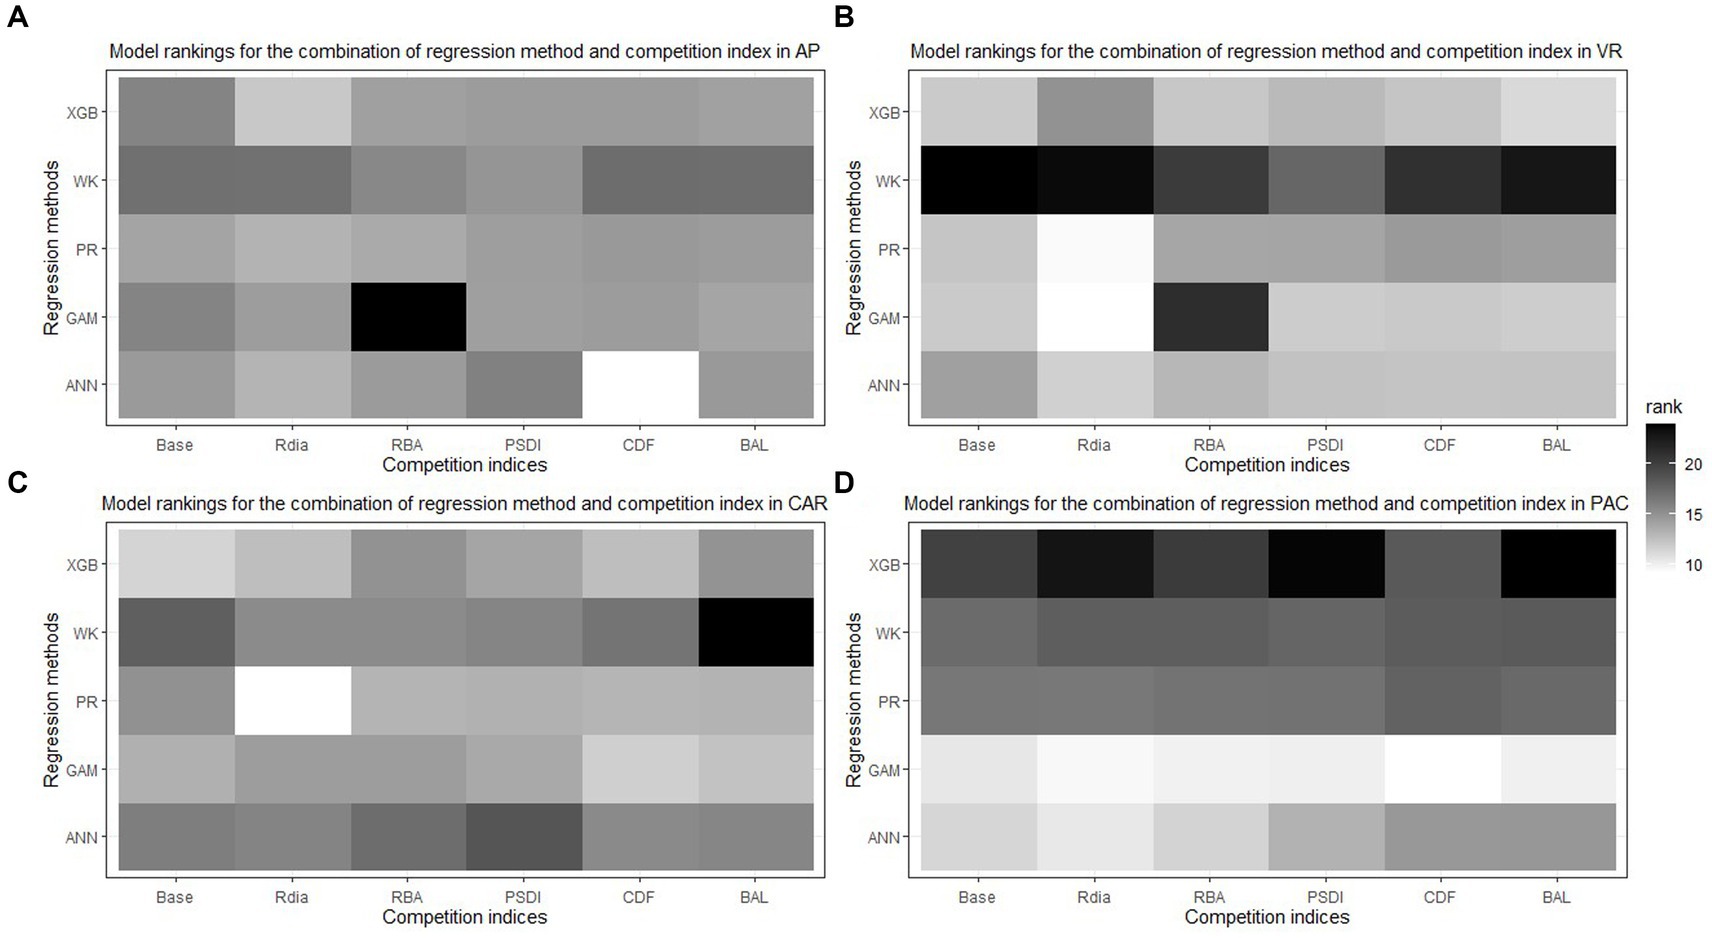
Figure 5. Best combination of regression method [Pearl and Reed (1920), PR; Wykoff et al. (1982), WK; Generalized additive model, GAM; Extreme Gradient Boosting, XGBoost; Artificial Neural Network, ANN] and competition index (diameter ratio, Rdia; basal area ratio, RBA; partitioned stand density index, PSDI; cumulative distribution function, CDF; basal area of larger trees, BAL) for all the species across four physiographic regions [Appalachian plateau, AP (A); Ridge and Valley, VR (B); Caribbean islands, CAR (C); Pacific islands, PAC (D)].
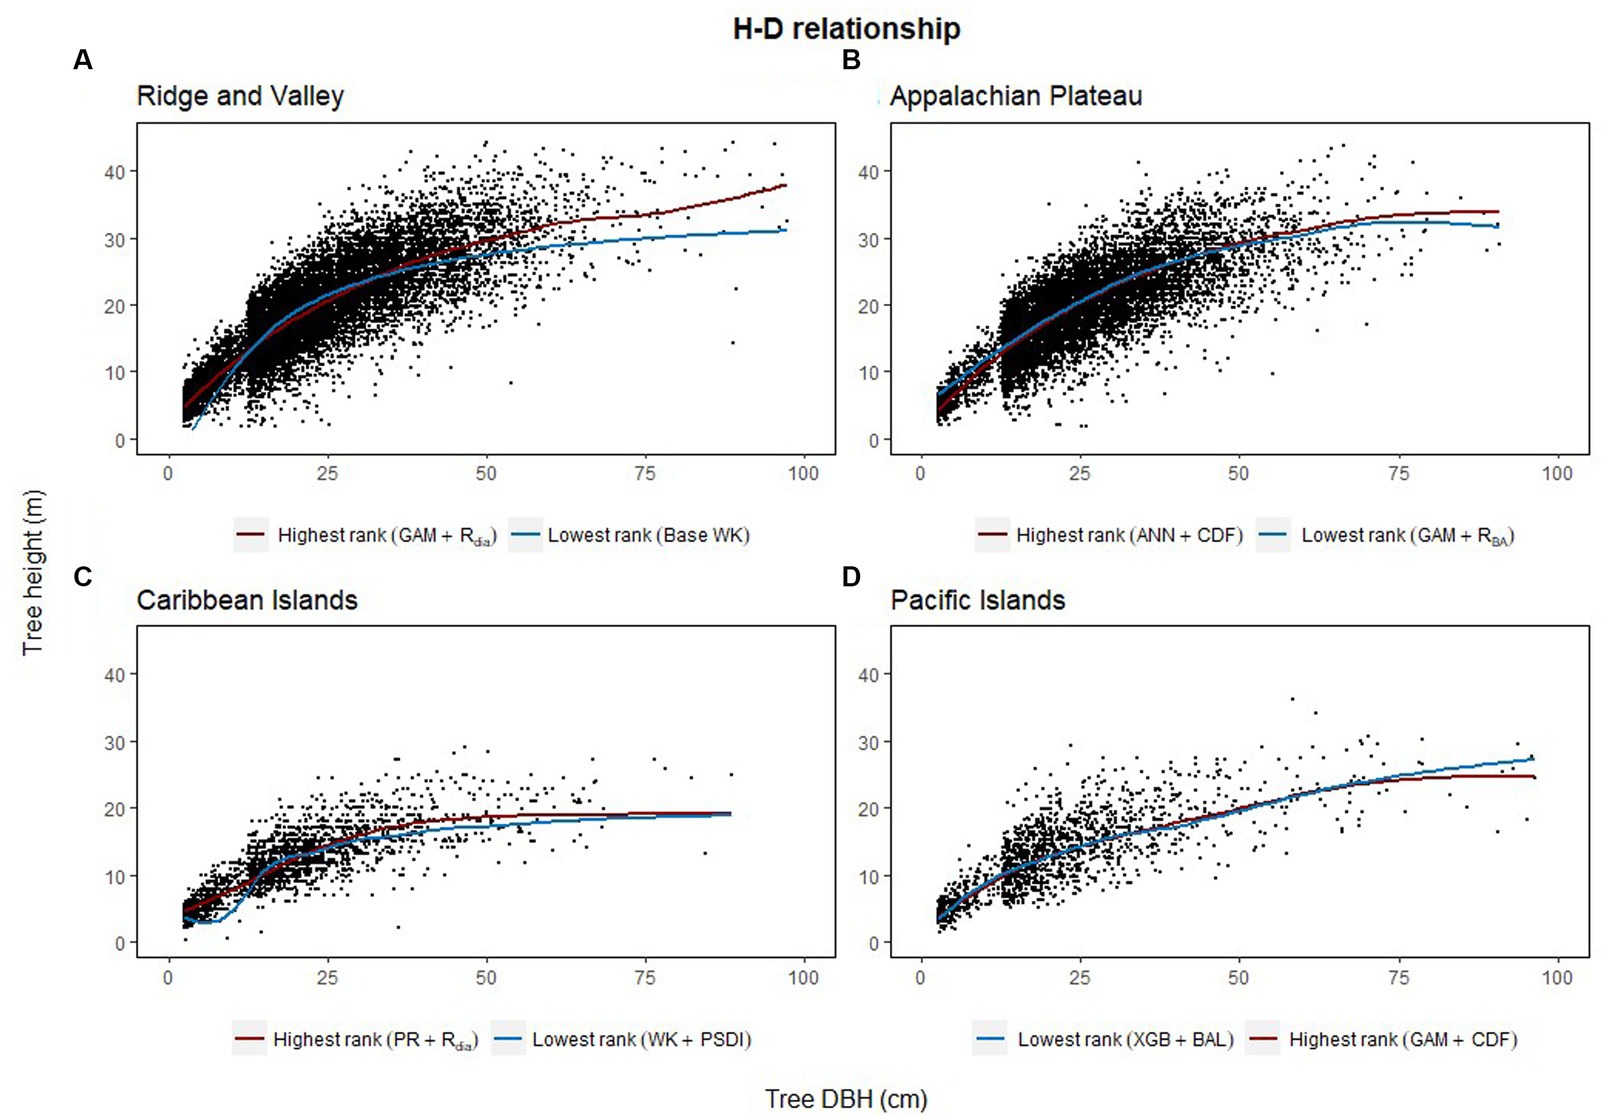
Figure 6. Height diameter relationship of the testing dataset (20% of the dataset) for each of the four physiographic region [Appalachian plateau, AP (A); Ridge and Valley, VR (B); Caribbean islands, CAR (C); Pacific islands, PAC (D)]. The curves show the predicted relationship for the highest and the lowest ranked models for each of the physiographic regions.
4 Discussion
4.1 Comparison among regression methods
Among the five regression methods examined in this study, all of them were found to have adequate performance for predicting individual tree height from diameter at breast height. However, a universally superior H-D model was not found for all 19 species in the four physiographic regions, which is consistent with the findings from Mehtätalo et al. (2015). Although none of the models stood out with the best performance, GAM was found to perform relatively better than the rest of the models. On average, GAM ranks the highest among the parametric and nonparametric models examined based on R2, MB and RMSE (see Figure 2A). The base GAM provided the most precise predictions for seven of the 19 species (see Tables 2–4). We confirmed the findings of Adamec and Drápela (2015) that GAM can be used to provide precise predictions of H using DBH as a predictor. The flexibility of the model was able to characterize variable shapes of H-D relationships for different species in different regions (see Figure 6). However, it should be noted that GAM may not be optimal model for a given species or region. As shown in Figure 4, GAM model ranks lower than PR for eastern white pine, hickory spp. and red maple in AP and VR. Specifically, GAM yielded the least precise predictions for red maple and sweetgum in AP and Acacia spp. in CAR (see Tables 2, 4).
The ANN models rank the highest for four of the 19 species while ranking the lowest for three of the 19 species (see Figure 3). Özçelik et al. (2013) and Castaño-Santamaría et al. (2013) found that the ANN models without considering diameter variation for each sampling unit performed worse than those accounting for it. This is only partially supported by our results because five of the base ANN models in this study performed the best compared to other regression methods, albeit the diameter variation of each condition class was not taken into consideration. This may be because the network architecture used in this study was more complex compared to Özçelik et al. (2013) and Castaño-Santamaría et al. (2013). More hidden layers (two dense layers and two dropout layers) and more nodes per dense layer were incorporated in this study.
Misik et al. (2016) and Cui et al. (2022) reported that the PR and WK model generally had lower RMSE for temperate species in Turkey and China, respectively. However, our results indicate that the PR model performs well for the 19 species, but the WK model generally had poor prediction accuracy. Specifically, the PR model had the highest rank of RMSE for two species whereas the WK model did not have the highest rank of RMSE for any species examined. Notably, the WK model tends to underpredict the height of the tallest and shortest trees in the stand (see Supplementary Figure 9B). Varying degrees of performance have been reported when employing the WK model in predicting tree height (e.g., Temesgen et al., 2014; Yang et al., 2022). Temesgen et al. (2014) found that this model provided the lowest MB and RMSE for most of the tree species in Northern China. However, Yang et al. (2022) reported that the WK model had the highest overall RMSE for pantropical tree species in Trinidad and Tobago. They also found that the WK model tends to be more inaccurate for trees in large DBH classes (see Table 3 of Yang et al. (2022)).
This study aimed to evaluate commonly used regression methods and competition indices to characterize the H-D relationships of temperate and pantropical tree species. The results of this study showed that the semiparametric model (GAM) produced more accurate predictions than parametric (PR and WK) and nonparametric models (XGBoost and ANN). The smoothing functions used by GAM for model fitting increases the flexibility of the curves while still retaining the structure of the curves like parametric models (see Figures 6A,D). However, GAM is a data-driven model similar to XGBoost and ANN which may not produce satisfactory results when there are not many data points available for training the model. GAM is also often criticized for its tendency to overfit (Robinson et al., 2011; Adamec and Drápela, 2015). Although such issue was not found in this study, it needs to be taken into consideration when building H-D models.
Lastly, the predictive performance of the H-D models was found to be better for the temperate species than the pantropical species. The range of the evaluation statistics was wider with larger extremes values for the pantropical species compared to the temperate species (see Table 6). This may be because the pantropical forests have higher tree species diversity which causes the trees to interact in a different manner compared to temperate forests. It is worth mentioning that the models presented in this study may not be optimal for a given species and region, but the models selected in comparison are commonly used in forest practices. Besides, in the preliminary analysis, random forest algorithm was tested, but the predictive performance of the models was poorer than ANN and XGBoost which was also reported by Li et al. (2020) and Raczko and Zagajewski (2017).
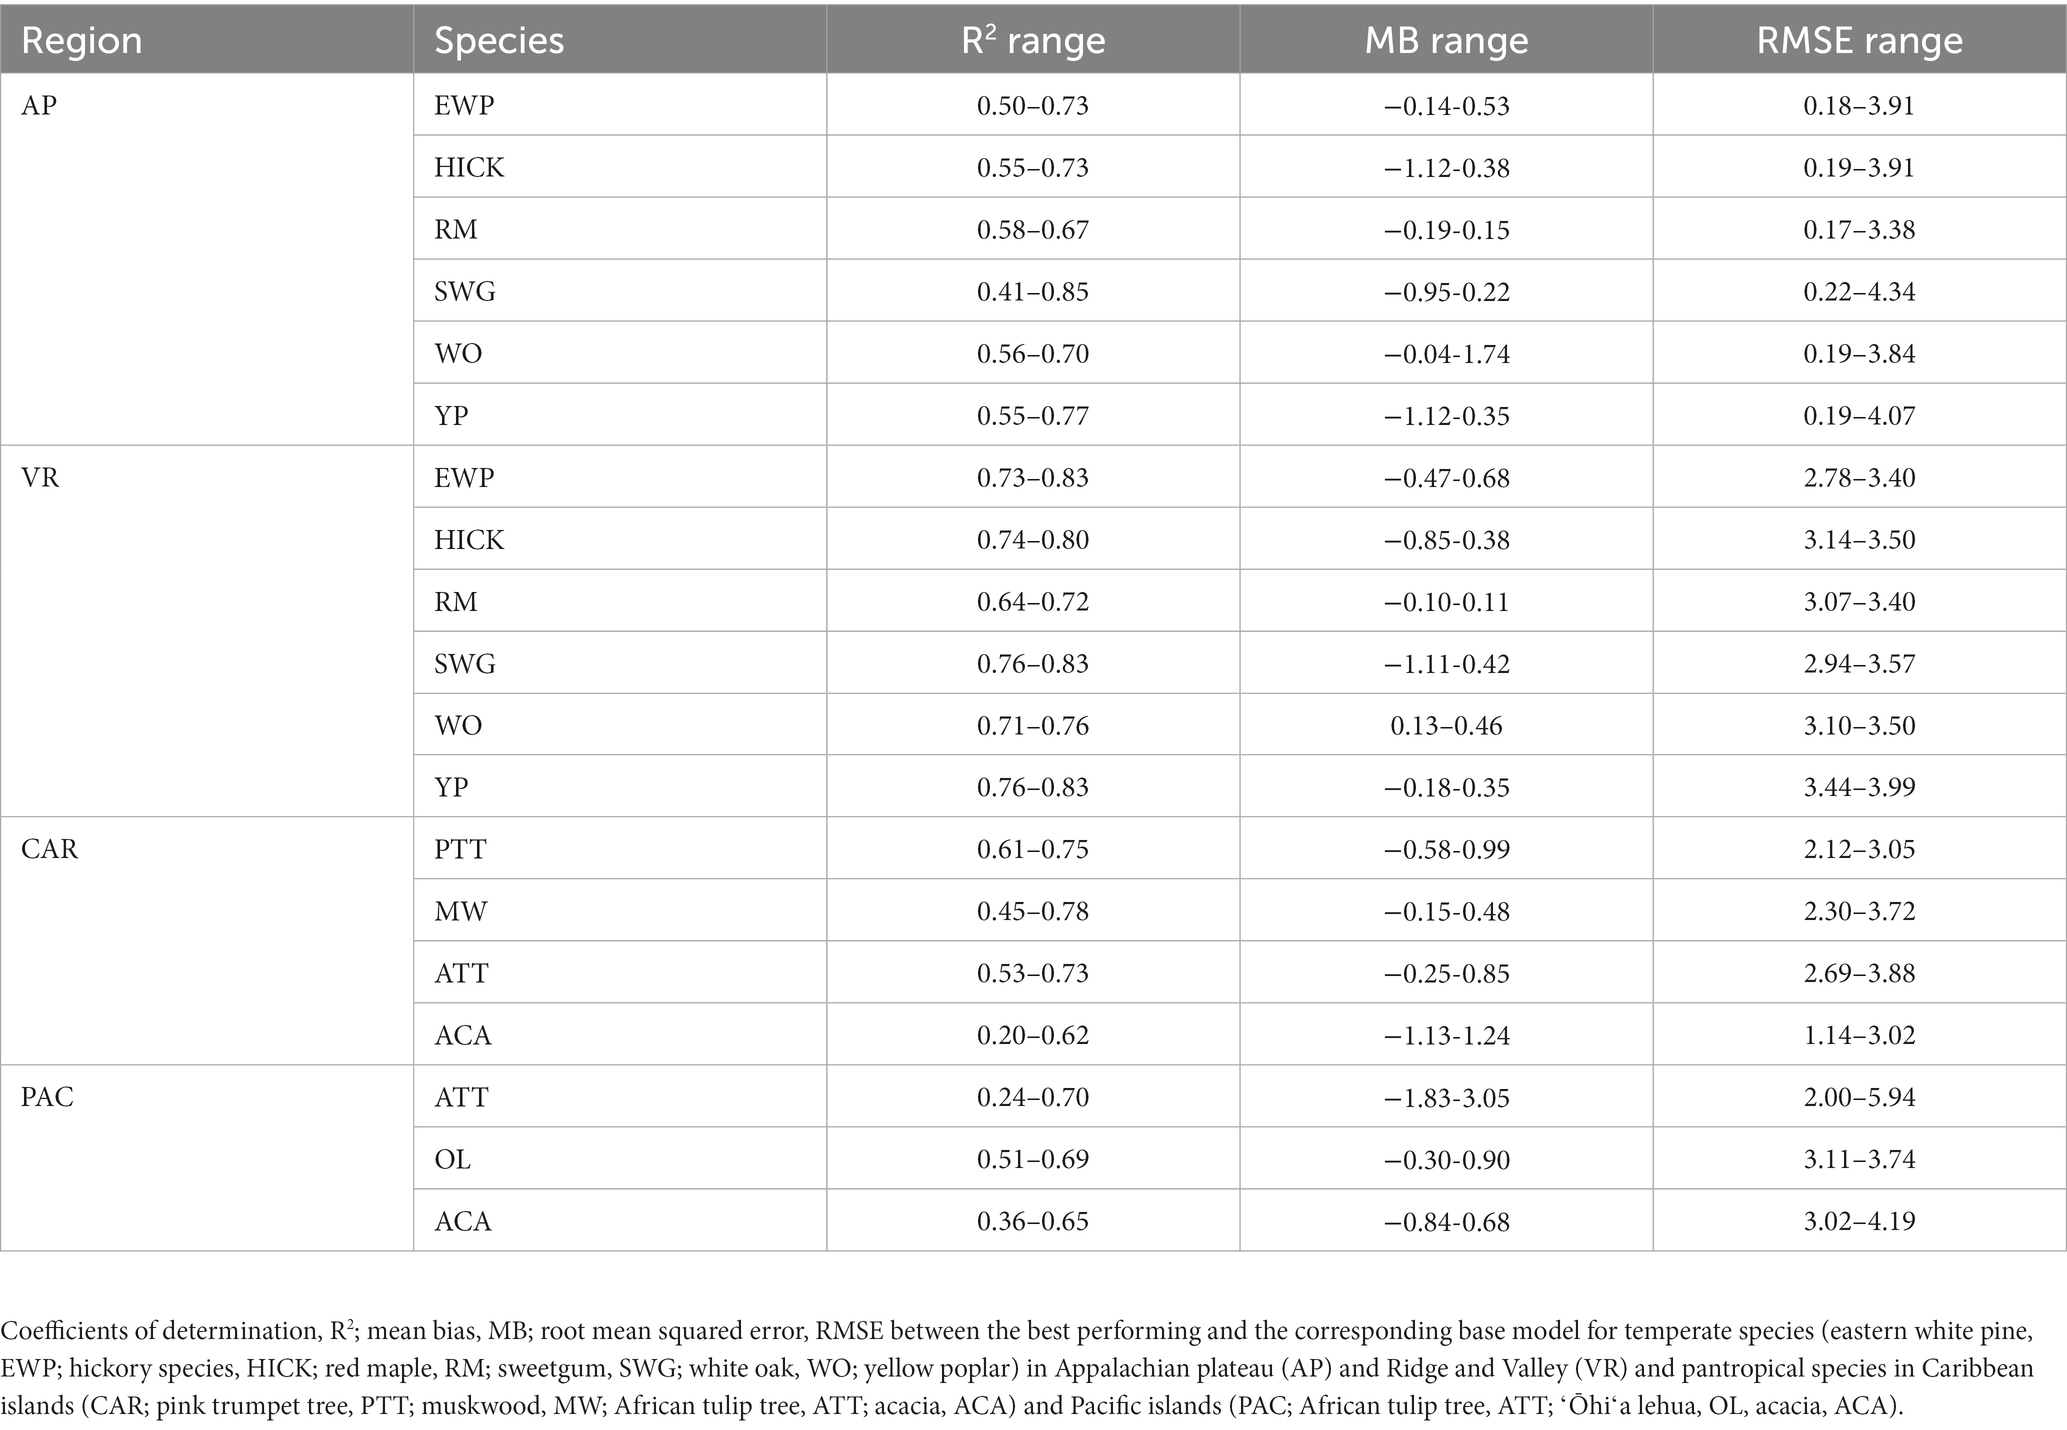
Table 6. Range of evaluation statistics.
4.2 Inclusion of a competition index in H-D models
Inclusion of a competition index improved the predictive abilities of the models for most of the species in the AP, VR and CAR regions compared to the corresponding base model. Competition indices are generally included in individual tree models to represent the competition effect of neighboring trees on a subject tree (Burkhart and Tomé, 2012). The results of this study confirm that inclusion of distance-independent competition indices can improve the performance of height diameter models when spatially explicit information at the individual tree level is not available. However, for the PAC region, the base model on average was found to perform better than the models with competition indices across all the species and regression methods based on the evaluation statistics (see Supplementary Figure 6). The forested areas in PAC are severely depleted due to large-scale harvesting in the 1970s and severe cyclones in 1990s (FAO, 2010). In addition, the PAC islands are infested with various insects, pathogens and invasive species which are significant threats to the forest health (USDAFS, 2022). Frequent anthropogenic and natural disturbance may cause the large variation of tree allometry in the region. Thus, a single competition index may not be adequate to predict total tree height for Pacific islands’ forests. Adding additional predictor variables (e.g., site or environmental variables) may help improve the prediction accuracy of the models, which is suggested as the next step of this study.
In general, Rdia, PSDI and CDF performed best for the five regression method across the physiographic regions and species. PR and GAM models with Rdia as competition index tended to have the highest rank. Similarly, PSDI had the highest rank for the WK models. CDF worked well with non-parametric regression methods (XGBoost and ANN). These competition indices are used to mathematically represent the ability of a particular tree to grow without explicit spatial information about the neighboring trees (Burkhart and Tomé, 1989). Diameter ratio and basal area ratio (size ratios) represented by the ratio of diameter and basal area of subject tree to the average diameter and basal area in the stand, respectively, provide information about the relative position of the subject tree in the stand. Basal area ratio emphasizes more weight on the size of the tree compared to diameter ratio. The size ratios assume that the competition is two-sided and smaller trees can also affect larger trees. Cumulative distribution function and basal area of larger trees also express the relative position of subject tree in the stand but the assumption for these indices is that competition is only one-sided and larger trees put the subject trees at a disadvantageous position while smaller trees do not affect them. The partitioned stand density index represents the general environment of competition by dividing the stand density index at the individual tree level. Rdia performed the best for AP, VR and CAR. Yang et al. (2022) reported that Rdia was consistently the second most important predictor (after DBH) for the RF and MERF models. It has also been reported to work well for other individual tree level models such as tree survival model (Sun et al., 2019), diameter growth models (Holmes and Reed, 1991). Similarly, Temesgen et al. (2007) found that inclusion of relative position of trees on the stand based on size of tree and stand density measures to the base model performs better for predicting tree height. CDF was found to perform well for the species in AP and CAR and PSDI was found to provide the least biased estimates for species in VR. Sun et al. (2019) pointed out that CDF ignores the variation in relative competition among mixed forests and might not have a good performance. However, it was not supported by our study because all four of the physiographic regions are mixed forest and the CDF was calculated at the condition class level. In addition to this, the indices that had similar characteristics (e.g., size ratios) yielded different results. For most of the cases, Rdia performed better than RBA and CDF performed better than BAL. Sun et al. (2019) also reported similar results for the diameter growth and survival equations for even-aged loblolly pine stands.
4.3 Further discussion
Height-diameter relationship models have important applications in sustainable forest management which include studying the vertical structure of a forest stand. The models in this study were evaluated using data from natural temperate and pantropical mixed forests which incorporate multiple biomes and forest types. The results of this study indicate that H-D relationships are variable for the same species in different regions, and a universally applicable method is difficult to ascertain. The graphs of the predicted height values and the residuals are given in Figures 7–9. The forests in the Caribbean and Pacific regions are frequently affected by severe wind disturbances. These intense disturbance events severely affect tree growth and yield, causing widespread tree damage and mortality. The models developed in this study can be used to estimate the original length of trees in order to quantify the impact of wind damage in the regions. Although none of the models were found to perform well for all 19 species, we recommend the highest ranked model for each of the physiographic regions (Figure 6) would provide adequate results.
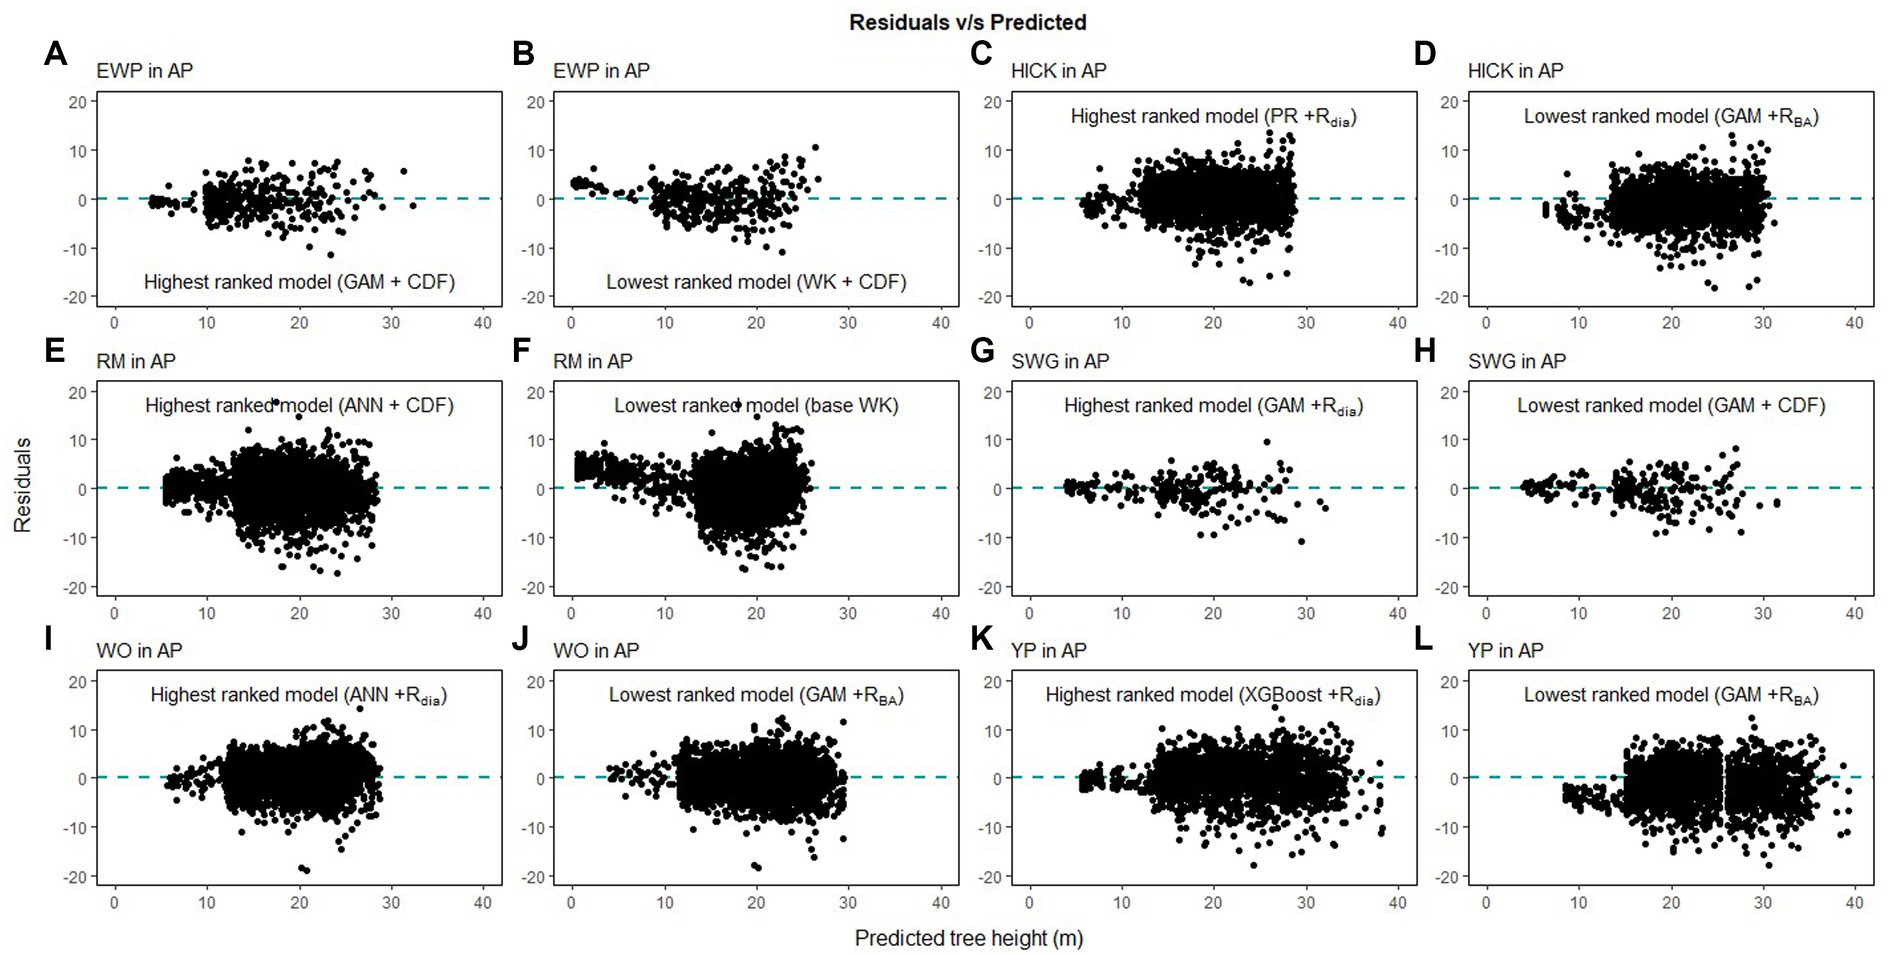
Figure 7. Comparison of the predicted tree height and the residual height for the highest ranking and lowest ranking combination of regression method and competition index for species in Appalachian plateau (AP; eastern white pine, EWP, A,B; hickory species, HICK, C,D; red maple, RM, E,F; sweetgum, SWG, G,H, white oak, WO, I,J; yellow poplar, YP, K,L).
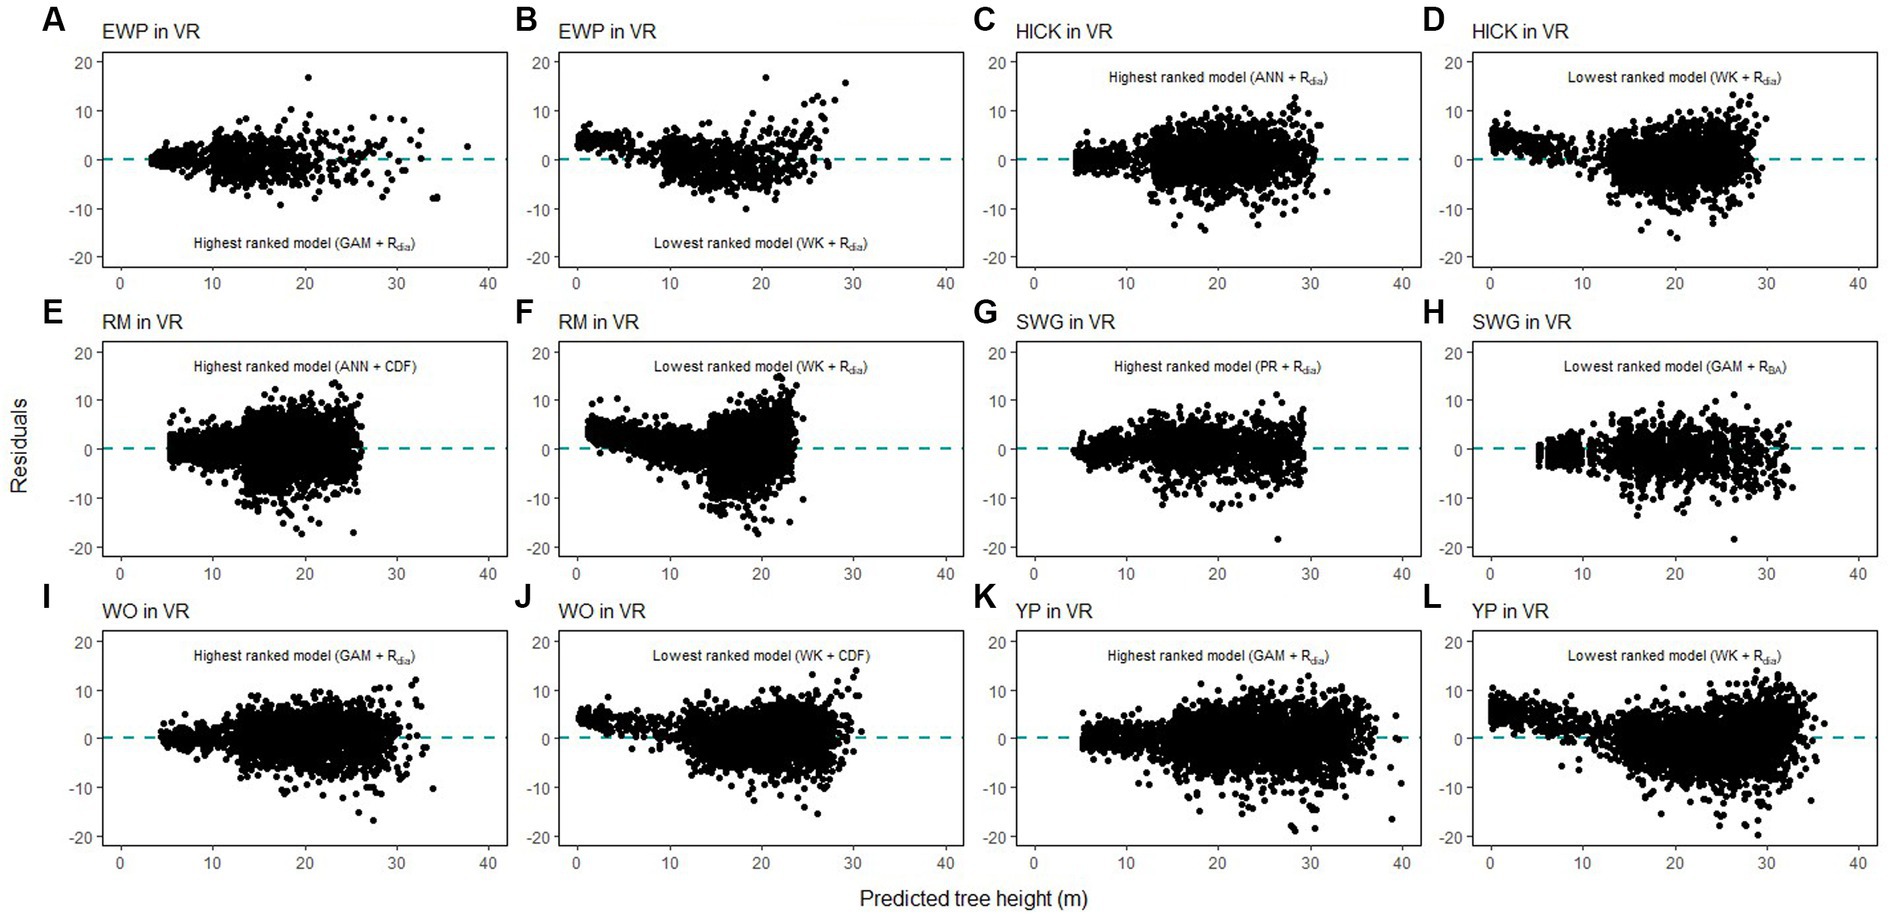
Figure 8. Comparison of the predicted tree height and the residual height for the highest ranking and lowest ranking combination of regression method and competition index for species in Ridge and Valley (VR; eastern white pine, EWP, A,B; hickory species, HICK, C,D; red maple, RM, E,F; sweetgum, SWG, G,H, white oak, WO, I,J; yellow poplar, YP, K,L).
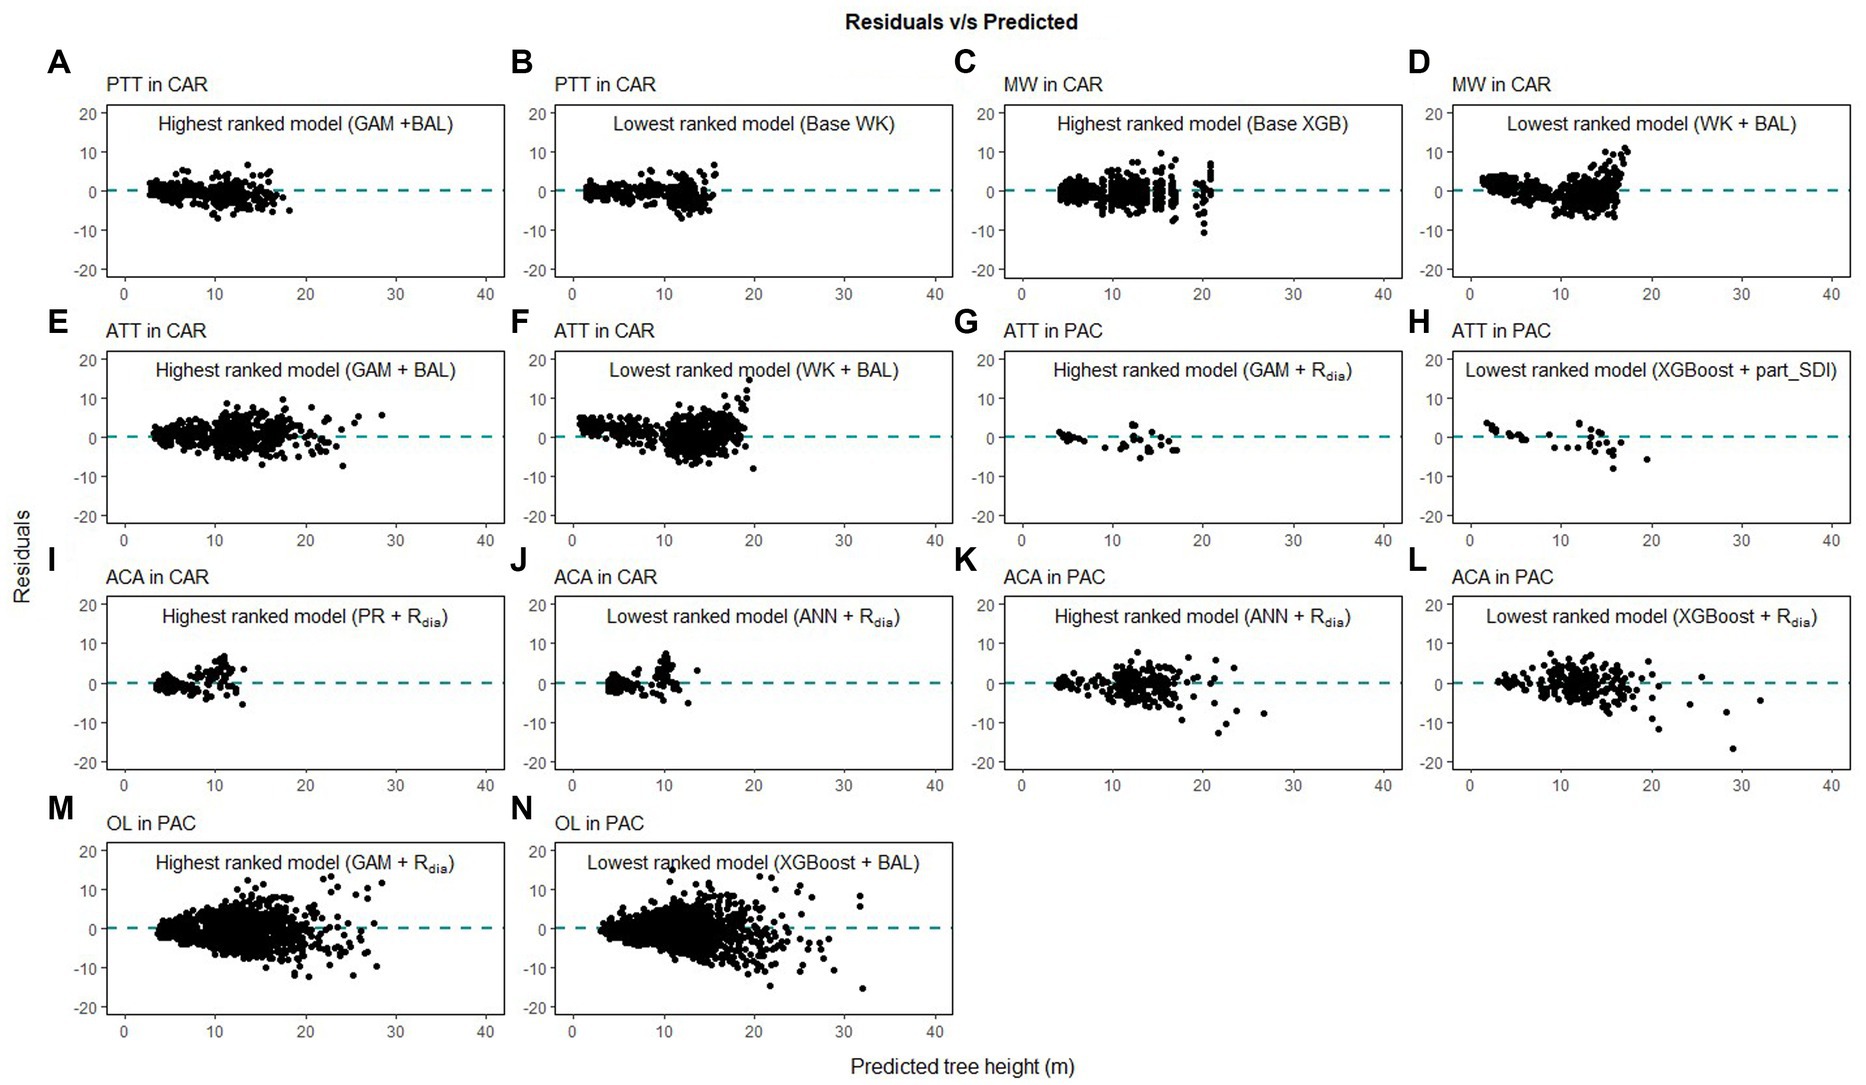
Figure 9. Comparison of the predicted tree height and the residual height for the highest ranking and lowest ranking combination of regression method and competition index for species in Caribbean (CAR) and Pacific (PAC) islands (pink trumpet tree, PTT, A,B; muskwood, MW, C,D; African tulip tree, ATT, E–H; acacia species, ACA, I–L; ʻŌhiʻa lehua, OL, M,N).
The competition between species in a mixed forest has complex relationships that can be within the same species and between different species. This complex relationship was demonstrated by our study as the highest-ranking competition indices varied according to the species, physiographic region and regression method. The highest ranked competition indices (Rdia, PSDI and CDF for AP, VR and CAR) for the physiographic regions show that the influence of tree growth varies according to the region. Although this study did not use more than one competition index for evaluating the H-D models, a future study that uses more than one competition index as predictors is warranted to further understand the effect of competition in natural mixed forests.
Lastly, the GAM, ANN and XGBoost models can be transferred while the transferring approach is different from the classic parametric models. For parametric models, the transfer is done by sharing the equations with the estimated coefficients. In GAM, ANN and XGBoost, the transfer can be done by sharing the preprocessing script (or even an R package) and data used to build the models. Then the user can re-train (i.e., calibrate) the models with their own dataset. Another approach is to build an app that runs the algorithm in the background. Users can input the values of DBH and competition index, and then the predicted tree heights can be generated. Users can upload their own dataset, allowing the app to re-train the models for localized predictions of tree height.
5 Conclusion
This study shows that all the regression methods examined in this study were capable of predicting tree height from tree DBH. Among them, GAM can be used as the initial model when fitting H-D relationships, although it may not produce optimal predictions for a given species and physiographic region. However, it can be used to provide preliminary information about total tree length, especially to provide a quick assessment of the wind damage on total tree height. The results also showed that different competition indices are suitable for different regression methods. Diameter ratio, partitioned stand density index and cumulative distribution function were found to improve the predictive abilities of the regression methods for species in AP VR and CAR. These competition indices are easy to calculate and hence we recommend including competition indices when building H-D models.
Data availability statement
Data used in this study can be found at https://www.fia.fs.usda.gov/.
Author contributions
SJ: Conceptualization, Methodology, Writing – original draft. SY: Conceptualization, Methodology, Writing – original draft. TJB: Conceptualization, Data curation, Methodology, Writing – review & editing. OK: Data curation, Writing – review & editing. HM-V: Conceptualization, Data curation, Writing – review & editing.
Funding
The author(s) declare financial support was received for the research, authorship, and/or publication of this article. Support from the USDA Forest Service (project #: 21-CR-11330145-070) is greatly appreciated.
Acknowledgments
The authors would like to express their gratitude for the review comments and time provided by three reviewers.
Conflict of interest
The authors declare that the research was conducted in the absence of any commercial or financial relationships that could be construed as a potential conflict of interest.
Publisher’s note
All claims expressed in this article are solely those of the authors and do not necessarily represent those of their affiliated organizations, or those of the publisher, the editors and the reviewers. Any product that may be evaluated in this article, or claim that may be made by its manufacturer, is not guaranteed or endorsed by the publisher.
Supplementary material
The Supplementary material for this article can be found online at: https://www.frontiersin.org/articles/10.3389/ffgc.2023.1282297/full#supplementary-material
References
Abiodun, O. I., Jantan, A., Omolara, A. E., Dada, K. V., Mohamed, N. A., and Arshad, H. (2018). State-of-the-art in artificial neural network applications: a survey. Heliyon 4:e00938. doi: 10.1016/j.heliyon.2018.e00938
Adamec, Z., and Drápela, K. (2015). Generalized additive models as an alternative approach to the modelling of the tree height-diameter relationship. J. For. Sci. 61, 235–243. doi: 10.17221/14/2015-JFS
Bechtold, W. A., and Patterson, P. L. (2005). The enhanced Forest inventory and analysis program National Sampling Design and estimation procedures. US. Department of Agriculture, Forest Service, Southern Research Station. Asheville, NC.
Burkhart, H. E., and Tomé, M. (1989). Distance-dependent competition measures for predicting growth of individual trees. For. Sci. 35, 816–831.
Burrill, E. A., Di Tommaso, A. M., Turner, J. A., Pugh, S. A., Christensen Perry, C. J., and Conkling, B. L. (2021). The Forest Inventory and Analysis Database: database description and user guide version 9.0.1 for Phase 2. U.S. Department of Agriculture, Forest Service, 1026.
Burrill, E. A., Wilson, A. M., Turner, J. A., Pugh, S. A., Menlove, J., Christensen, G., et al. (2018). The Forest Inventory and Analysis Database: database description and user guide version 8.0 for Phase 2. U.S. Department of Agriculture, Forest Service, 946.
Castaño-Santamaría, J., Crecente-Campo, F., Fernández-Martínez, J. L., Barrio-Anta, M., and Obeso, J. R. (2013). Tree height prediction approaches for uneven-aged beech forests in northwestern Spain. For. Ecol. Manag. 307, 63–73. doi: 10.1016/j.foreco.2013.07.014
Chen, T., and Guestrin, C. (2016). “XGBoost: A scalable tree boosting system”, in Proceedings of the 22nd ACM SIGKDD International Conference on Knowledge, Discovery and Data Mining, ACM.
Chen, J., Yang, H., Man, R., Wang, W., Sharma, M., Peng, C., et al. (2020). Using machine learning to synthesize spatiotemporal data for modelling DBH-height and DBH-height-age relationships in boreal forests. For. Ecol. Manag. 466:118104. doi: 10.1016/j.foreco.2020.118104
Cui, K., Wu, X., Zhang, C., Zhao, X., and von Gadow, K. (2022). Estimating height-diameter relations for structure groups in the natural forests of northeastern China. For. Ecol. Manag. 519:120298. doi: 10.1016/j.foreco.2022.120298
Curtis, R. O. (1967). Height-diameter and height-diameter-age equations for second-growth Douglas-fir. For. Sci. 13, 365–375.
Curtis, R., and Marshall, D. D. (2000). Why quadratic mean diameter? West. J. Appl. For. 15, 137–139. doi: 10.1093/wjaf/15.3.137
Elzhov, V., Mullen, K. M., Spiess, A. N., and Bolker, B. (2022). minpack.lm: R Interface to the Levenberg-Marquardt Nonlinear Least-Squares Algorithm Found in MINPACK, Plus Support for Bounds. 1.2-4 Ed. CRAN.
FAO. (2010) Pacific forests and forestry to 2020: Subregional report of the second asia-pacific forestry sector outlook study. Bangkok, Thailand: Food and agriculture organization of the United Nations.
Fenneman, N. M., and Johnson, D. W. (1946). Physiographic divisions of the conterminous US. Geological Survey, Reston, VA.
Holmes, M. J., and Reed, D. D. (1991). Competition indices for mixed species northern hardwoods. For. Sci. 37, 1338–1349.
Huang, S., Price, D., and Titus, S. J. (2000). Development of ecoregion-based height-diameter models for white spruce in boreal forests. For. Ecol. Manag. 129, 125–141. doi: 10.1016/S0378-1127(99)00151-6
Huang, S., and Titus, S. J. (1995). An individual tree diameter increment model for white spruce in Alberta. Can. J. For. Res. 25, 1455–1465. doi: 10.1139/x95-158
Kalinowski, T., Allaire, J. J., Falbel, D., Bostock, M., Masayuki, T., Bowe, S., et al. (2022). tfruns: Training run tools for ‘TensorFlow’. 1.5.1 Ed., CRAN.
Kuhn, M. (2008). Building predictive models in R using the caret package. J. Stat. Softw. 28, 1–26. doi: 10.18637/jss.v028.i05
Li, Y., Li, M., Li, C., and Liu, Z. (2020). Forest aboveground biomass estimation using Landsat 8 and sentinel-1A data with machine learning algorithms. Sci. Rep. 10:9952. doi: 10.1038/s41598-020-67024-3
Lu, H.-C. B., Martin, F., and Johnson, R. (2017). “Theoretical foundation of stage’s formulation of stand density index”, in Proceedings of the 2017 Forest Vegetation Simulator (FVS) e-Conference, U.S. Department of Agriculture, Forest Service, Southern Research Station, 64–69.
Mehtätalo, L., De-Miguel, S., and Gregoire, T. G. (2015). Modeling height-diameter curves for prediction. Can. J. For. Res. 45, 826–837. doi: 10.1139/cjfr-2015-0054
Misik, T., Antal, K., Kárász, I., and Tóthmérész, B. (2016). Nonlinear height-diameter models for three woody, understory species in a temperate oak forest in Hungary. Can. J. For. Res. 46, 1337–1342. doi: 10.1139/cjfr-2015-0511
Ogana, F. N., and Ercanli, I. (2022). Modelling height-diameter relationships in complex tropical rain forest ecosystems using deep learning algorithm. J. For. Res. 33, 883–898. doi: 10.1007/s11676-021-01373-1
Özçelik, R., Diamantopoulou, M. J., Crecente-Campo, F., and Eler, U. (2013). Estimating Crimean juniper tree height using nonlinear regression and artificial neural network models. For. Ecol. Manag. 306, 52–60. doi: 10.1016/j.foreco.2013.06.009
Pearl, R., and Reed, L. J. (1920). On the rate of growth of population of the United States since 1790 and its mathematical representation. PNAS 6, 275–288. doi: 10.1073/pnas.6.6.275
Poudel, K. P., and Cao, Q. V. (2013). Evaluation of methods to predict weibull parameters for characterizing diameter distributions. For. Sci. 59, 243–252. doi: 10.5849/forsci.12-001
Raczko, E., and Zagajewski, B. (2017). Comparison of support vector machine, random forest and neural network classifiers for tree species classification on airborne hyperspectral APEX images. European J. Remote Sensing 50, 144–154. doi: 10.1080/22797254.2017.1299557
Reineke, L. H. (1933). Perfecting a stand-density index for even-aged forests. J. Agric. Res. 46, 627–638.
Robinson, A. P., Lane, S. E., and Thérien, G. (2011). Fitting forestry models using generalized additive models: a taper model example. Can. J. For. Res. 41, 1909–1916. doi: 10.1139/x11-095
Soares, P., and Tomé, M. (2002). Height-diameter equation for first rotation eucalypt plantations in Portugal. For. Ecol. Manag. 166, 99–109. doi: 10.1016/S0378-1127(01)00674-0
Stage, A. R. (1968). A tree-by-tree measure of site utilization for grand fir related to stand density index. Ogden, Utah.
Sun, S., Cao, Q. V., and Cao, T. (2019). Evaluation of distance-independent competition indices in predicting tree survival and diameter growth. Can. J. For. Res. 49, 440–446. doi: 10.1139/cjfr-2018-0344
Temesgen, H., Hann, D. W., and Monleon, V. J. (2007). Regional height-diameter equations for major tree species of Southwest Oregon. West. J. Appl. For. 22, 213–219. doi: 10.1093/wjaf/22.3.213
Temesgen, H., Zhang, C. H., and Zhao, X. H. (2014). Modelling tree height-diameter relationships in multi-species and multi-layered forests: a large observational study from Northeast China. For. Ecol. Manag. 316, 78–89. doi: 10.1016/j.foreco.2013.07.035
USDAFS (2022). Pacific Islands Forest Health Highlights 2021, U.S. Department of Agriculture Forest Service.
Walczak, S., and Cerpa, N. (2003). “Artificial neural networks” in Encyclopedia of physical science and technology. ed. R. A. Meyers. 3rd ed (US: Academic Press), 631–645.
Wang, Y., Liu, H., Sang, L., and Wang, J. (2022). Characterizing Forest cover and landscape pattern using multi-source remote sensing data with ensemble learning. Remote Sens. 14. doi: 10.3390/rs14246296
Wood, S. N. (2017). Generalized additive models: An introduction with R, second edition. US: CRC Press, 1–476 p.
Wykoff, W. R., Crookston, N. L., and Stage, A. R. (1982). User's guide to the stand Prognosis model. Ogden, Utah.
Xu, Z., Zhang, Q., Xiang, S., Li, Y., Huang, X., Zhang, Y., et al. (2022). Monitoring the severity of Pantana phyllostachysae Chao infestation in Moso bamboo forests based on UAV multi-spectral remote sensing feature selection. Forests 13:418. doi: 10.3390/f13030418
Yang, S. I., Brandeis, T. J., Helmer, E. H., Oatham, M. P., Heartsill-Scalley, T., and Marcano-Vega, H. (2022). Characterizing height-diameter relationships for Caribbean trees using mixed-effects random forest algorithm. For. Ecol. Manag. 524:120507. doi: 10.1016/j.foreco.2022.120507
Yang, S. I., and Burkhart, H. E. (2020). Evaluation of total tree height subsampling strategies for estimating volume in loblolly pine plantations. For. Ecol. Manag. 461:117878. doi: 10.1016/j.foreco.2020.117878
Yang, S.-I., Burkhart, H. E., and Seki, M. (2023). Evaluating semi- and nonparametric regression algorithms in quantifying stem taper and volume with alternative test data selection strategies. Forestry: Int. J. Forest Res. 96, 465–480. doi: 10.1093/forestry/cpad019
Zang, H., Lei, X., and Zeng, W. (2016). Height-diameter equations for larch plantations in northern and northeastern China: a comparison of the mixed-effects, quantile regression and generalized additive models. Forestry 89, 434–445. doi: 10.1093/forestry/cpw022
Keywords: temperate forest, Caribbean islands, Pacific islands, tree allometry, generalized additive model, machine learning
Citation: Jha S, Yang S, Brandeis TJ, Kuegler O and Marcano-Vega H (2023) Evaluation of regression methods and competition indices in characterizing height-diameter relationships for temperate and pantropical tree species. Front. For. Glob. Change. 6:1282297. doi: 10.3389/ffgc.2023.1282297
Edited by:
Ram P. Sharma, Tribhuvan University, NepalReviewed by:
Paula Soares, University of Lisbon, PortugalFriday N. Ogana, Virginia Tech, United States
Zhaohui Yang, Shanxi Agricultural University, China
Copyright © 2023 Jha, Yang, Brandeis, Kuegler and Marcano-Vega. This is an open-access article distributed under the terms of the Creative Commons Attribution License (CC BY). The use, distribution or reproduction in other forums is permitted, provided the original author(s) and the copyright owner(s) are credited and that the original publication in this journal is cited, in accordance with accepted academic practice. No use, distribution or reproduction is permitted which does not comply with these terms.
*Correspondence: Sakar Jha, sjha3@vols.utk.edu