 Sharad Purohit1,2,3†*
 Paul Minh Huy Tran1†
 Lynn Kim Hoang Tran1Khaled Bin Satter1Mingfang He1Wenbo Zhi1Shan Bai1Diane Hopkins1Melissa Gardiner1
 Chandramohan Wakade1Jennifer Bryant1Risa Bernard1John Morgan4
 Bruce Bode5John Chip Reed6Jin-Xiong She1,2*
- 1Center for Biotechnology and Genomic Medicine, Augusta University, Augusta, GA, United States
- 2Department of Obstetrics and Gynecology, Medical College of Georgia, Augusta University, Augusta, GA, United States
- 3Department of Undergraduate Health Professionals, College of Allied Health Sciences, Augusta University, Augusta, GA, United States
- 4Department of Neurology, Medical College of Georgia, Augusta University, Augusta, GA, United States
- 5Atlanta Diabetes Associates, Atlanta, GA, United States
- 6Southeastern Endocrine & Diabetes, Atlanta, GA, United States
Chronic low-grade inflammation is involved in the pathogenesis of type-1 diabetes (T1D) and its complications. In this cross-section study design, we investigated association between serum levels of soluble cytokine receptors with presence of peripheral neuropathy in 694 type-1 diabetes patients. Sex, age, blood pressure, smoking, alcohol intake, HbA1c and lipid profile, presence of DPN (peripheral and autonomic), retinopathy and nephropathy was obtained from patient’s chart. Measurement of soluble cytokine receptors, markers of systemic and vascular inflammation was done using multiplex immunoassays. Serum levels were elevated in in DPN patients, independent of gender, age and duration of diabetes. Crude odds ratios were significantly associated with presence of DPN for 15/22 proteins. The Odds ratio (OR) remained unchanged for sTNFRI (1.72, p=0.00001), sTNFRII (1.45, p=0.0027), sIL2Rα (1.40, p=0.0023), IGFBP6 (1.51, p=0.0032) and CRP (1.47, p=0.0046) after adjusting for confounding variables, HbA1C, hypertension and dyslipidemia. Further we showed risk of DPN is associated with increase in serum levels of sTNFRI (OR=11.2, p<10), sIL2Rα (8.69, p<10-15), sNTFRII (4.8, p<10-8) and MMP2 (4.5, p<10-5). We combined the serum concentration using ridge regression, into a composite score, which can stratify the DPN patients into low, medium and high-risk groups. Our results here show activation of inflammatory pathway in DPN patients, and could be a potential clinical tool to identify T1D patients for therapeutic intervention of anti-inflammatory therapies.
Introduction
The morbidity and mortality associated with type-1 diabetes (T1D) is mainly related to the development of long-term micro- and macro-vascular complications (1). The microvascular damage due to hyperglycemia can lead to neuropathy, retinopathy, and nephropathy (2–4). The macro-vascular damage can lead to thrombosis (5). Neuropathies (DPN) are one of the first and more common diabetic complications and present in up to 50% of patients (6), is frequently underdiagnosed by physicians (7) and can be unrecognized by the patients (8). The major characteristic of diabetic peripheral neuropathy (DPN) is the progressive loss of nerve fibers from both the autonomic and peripheral nervous system. This loss of sensory function has major detrimental effects, including risk of foot ulcerations, amputations, and increased mortality rates (6).
The Diabetic Control and Complications Trial/Epidemiology of Diabetes and Complications (DCCT/EDIC) study suggests that despite intensive glycemic control, incidence and prevalence of DPN increased in both the subjects under intensive (7% incidence) and permissive (17% incidence) glycemic control (9, 10). The reported prevalence of diabetic peripheral neuropathy (DPN) in type 1 diabetes (T1D) patients is highly variable (11). It was 13% in a Scottish registry population study (12), 11% in the 25,000‐person T1D Exchange Clinic Network in the U.S (13) and 28% in EURODIAB IDDM Complications Study (14). Recent reports from DCCT/EDIC suggests that prevalence of DPN is 28% in T1D patients after 20 years of diabetes (9, 15, 16). In a Danish study, presence of subclinical DPN was 55.1% whereas only 2.6% individuals were confirmed to have DPN (17). The Pittsburgh Epidemiology of Diabetes Complications Study, suggested that DPN was prevalent in 18% of the 18–29-year-old individuals (18).
The high rates of DPN among youth with diabetes are a cause of concern and requires early detection and better risk factor management. Interventions to address poor glycemic control and dyslipidemia may prevent or delay debilitating neuropathic complications (17–19). The long-term complications of T1D require lifestyle changes and medications that will modify risk factors such as hyperglycemia, hyperlipidemia, and hypertension (10, 17, 18). Yet, the current age and duration of type 1 diabetes remain important predictors of developing DPN. These studies suggest some T1D patients would still develop complications despite intensive treatment. Therefore, there is a need for additional markers to identify these at-risk population.
The precise mechanisms by which DPN occurs is multi-factorial (20, 21). However, chronic low-grade inflammation is considered the root cause of development of complications in both type-1 and type-2 diabetes patients (21, 22). Previous reports have shown that serum levels of inflammatory proteins, such as TNF-α, IL-16, soluble TNF receptors (sTNFR1 and 2) were increased in the serum of T1D patients with micro-vascular (23–25) and macro-vascular complications (26). In T1D subjects with DPN, serum levels of sTNFR1 and sTNFR2 were associated with DPN after adjusting for confounders (27). The majority of the studies on inflammatory proteins in DPN is on the type-2 diabetes (T2D) patients. We have shown that serum levels of insulin like growth factor binding proteins (IGFBP), TNF-α and IL-6 pathways were able to stratify T1D patients into risk categories for a number of complications (28), including nephropathy (24) and retinopathy (25). Results presented here show that serum levels of five inflammatory proteins are associated with increased risk of DPN in T1D individuals after adjusting for age, duration, gender, hypertension and dyslipidemia. We utilized a machine learning approach to combine the serum level of several proteins into a linear predictor to stratify T1D subjects.
Materials and Methods
Study Population
Serum samples for this cross-sectional study were obtained from Caucasian subjects recruited into the Phenome and Genome of Diabetes Autoimmunity (PAGODA) study between 2002 and 2010. These subjects attended the Augusta University (AU) Medical Center and/or endocrinology clinics in the Augusta and metro-Atlanta areas of Georgia. The presence and year of diagnosis of diabetic peripheral neuropathy was identified by retrospective chart review. The vast majority of subjects were diagnosed with DPN based on a neurological history and exam by the treating endocrinologist. Many, but not all, had further evaluations and confirmation of DPN by a neurologist. Patients with diabetic foot ulcers and amputations were excluded from analysis. Patients with non-DPN microvascular complications were excluded from the control nDPN group. Medical history, clinical, and demographic profiles for T1D subjects were obtained from the medical charts (Table 1). All study participants gave written informed consent before enrolling in the study. The study was carried out according to The Code of Ethics of the World Medical Association (Declaration of Helsinki, 1997) and was approved by the institutional review board at AU.
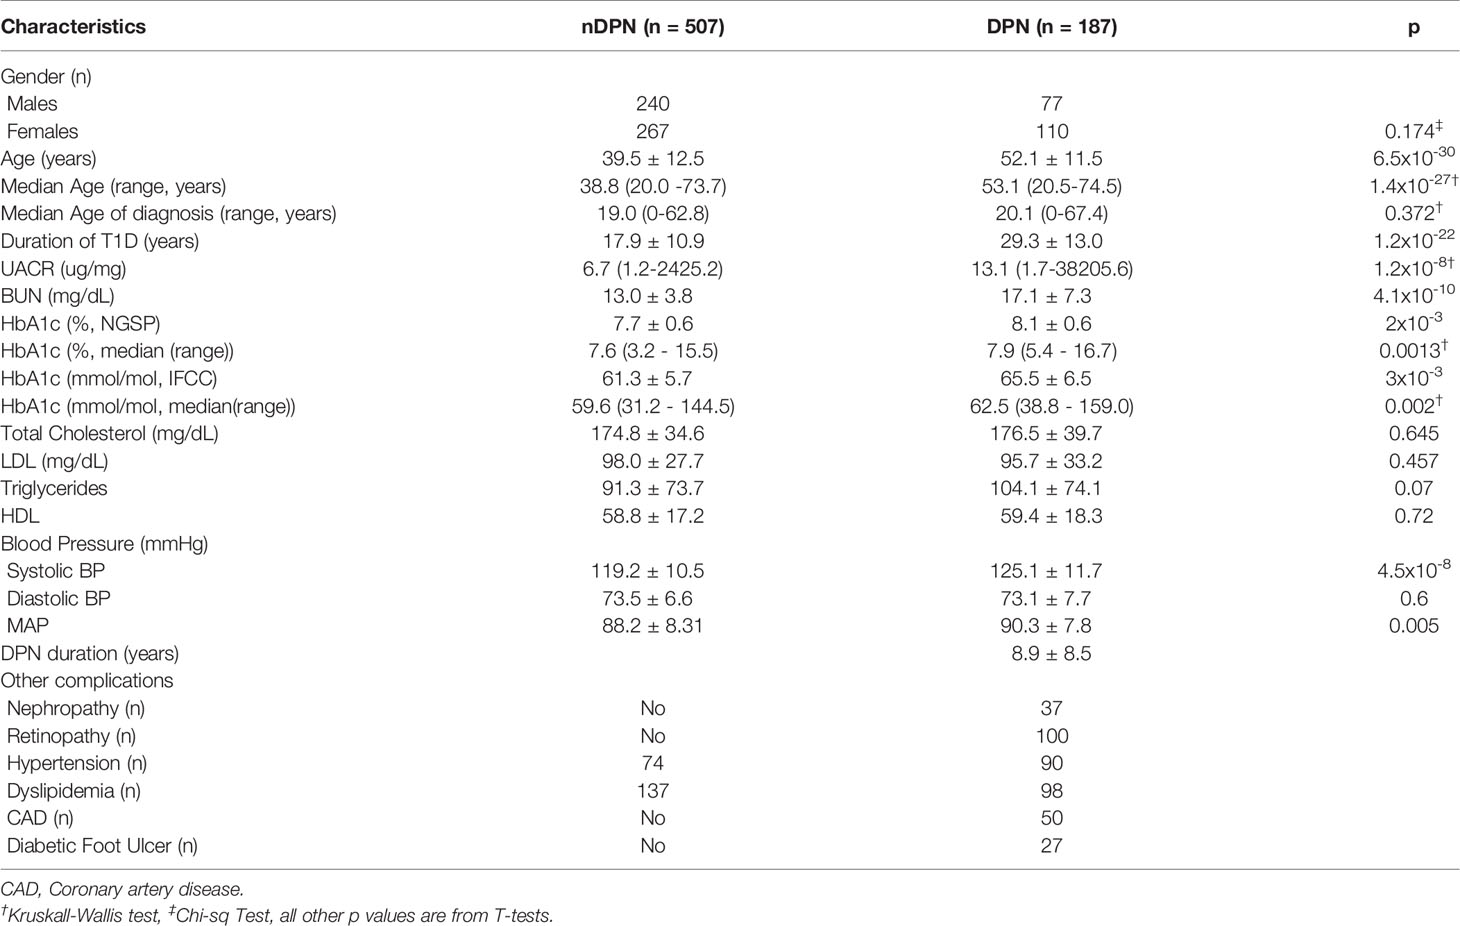
Table 1 Demographic and Clinical variable for 694 Caucasian T1D patients without (nDPN) and with Peripheral Neuropathy (DPN).
Venous blood was collected in clot activator tubes, allowed to clot at room temperature for 30 minutes prior to centrifugation at 3000g. Separated serum was then aliquoted into wells of 96-well plate to create a master plate. Individual daughter plates were then created by aliquoting 5-10µl of serum from this master plate. All master and daughter plates were stored at -80°C until use.
Laboratory Measurements
We measured twenty-two proteins (IL1Ra, IL8, MCP-1, MIP-1β, CRP, SAA, MMP1, MMP2, MMP9, sgp130, sICAM1, sVCAM1, sIL2Rα, sIL6R, sTNFRI, sTNFRII, sEGFR, IGFBP1, IGFBP2, IGFBP3, IGFBP6 and tPAI1) in the serum of subjects recruited in the Phenome and Genome of Diabetes Autoimmunity (PAGODA) Study. These proteins have all been reported in the inflammation pathways associated with progression of T1D and its complications (24–26, 28, 29). Luminex assays for these proteins were obtained from Millipore (Millipore Inc., Billerica, MA, USA). Prior to the full-scale study, we optimized the dilution of sera for a distribution of intensity in the linear portion of the standard curve. Multiplex assays were performed according to the instructions provided with the kit. Briefly, serum samples were incubated with antibody coated microspheres, followed by biotinylated detection antibody. Detection of the proteins was accomplished by incubation with phycoerythrin-labeled streptavidin. The resultant bead immuno-complexes were then read on a FLEXMAP3D (Luminex, TX, USA) with the instrument settings recommended by manufacturer.
The captured median fluorescence intensity (MFI) data was passed through quality control steps as described in our earlier study (30). Briefly, wells with individual bead counts below 30, or bead count coefficient of variation (CV) above 200 were flagged for exclusion. Replicate wells with CV≥25% were excluded from further analyses. The standard concentration and MFI were log2 transformed prior to regression. Protein concentrations were estimated using a regression fit to the standard curve with serial dilution of known concentration for each protein (30).
Construction of Inflammation Score
Ridge regression (R package “glmnet”) was used to create a multi-protein score that accounted for serum levels of multiple proteins (31). The algorithm combines the serum levels of multiple proteins in a linear combination by using the sum of the squares of the coefficients of individual proteins generated in the model based on a penalty term. The effect of the penalty term is adjusted by providing a matrix of values for lambda from 0 to infinity. The optimum lambda was determined using the lambda.min function in R, which chooses the minimum lambda value on cross validation. We optimized the model by using recursive feature elimination. We fit all 22 proteins to the peripheral neuropathy outcome using a least absolute shrinkage and selection operator (LASSO) by setting alpha=0 in the cv.glmnet function. We manually removed the proteins contributing the lowest weight to the linear predictor (Supplementary Figure 2). After the selection of proteins for the final model, we ran ridge regression using cv.glmnet function to obtain a linear predictor. We used the composite score obtained from the ridge regression model to calculate the odds ratios (OR) of having DPN for the upper four quintiles using the first quintile as reference.
Statistical Analysis
Data is presented as count, percentages, and means ± standard deviation for normally distributed variables. Median and range is presented for non-normal variables. Prior to any statistical analysis, protein concentration data was log2 transformed to follow the normal distribution. For generation of the figures, the data was back transformed to natural units. For all statistical analysis we removed T1D subjects with diabetic foot ulcer (n=27). Potential univariate differences between T1D patients without any complication (nDPN) and T1D patients with diabetic neuropathy (DPN) was examined using boxplots and t-test. Pairwise correlations between individual proteins were determined using Pearson correlation coefficient, and presented as a heatmap with hierarchical clustering. The association between the serum levels of each candidate molecule and age and T1D duration was determined using a linear regression including sex and disease status as covariates.
For all association analysis, log2 transformed concentration data was converted into z-scores by centering and scaling to unit standard deviation. The potential relationship between DPN and inflammatory proteins was evaluated using logistic regression models where presence/absence of DPN was incorporated as dependent variable. Covariates, Age, sex, duration of T1D, HbA1c, hypertension (HTN), and dyslipidemia were adjusted in separate models in the logistic regression.
We divided serum level for each protein into 5 quintiles containing 20% DPN patients in each quintile (20th percentile). The cutoff protein levels from DPN patients were then used to count nDPN and DPN subjects in each quintile. The 1st quintile was used as reference and OR for DPN was calculated for the upper four quintiles. Pearson’s Chi-squared test with Yates’ continuity correction was used to calculate the ORs. The chi-squared test for trend in proportions was used to calculate the p-value of overall trend.
All P-values were two-tailed and a P< 0.05 was considered statistically significant. All statistical analyses were performed using the R language and environment for statistical computing (v 4.0.3; R Foundation for Statistical Computing; www.r-project.org).
Results
Description of the Study Participants
Serum samples from T1D subjects (n=694) were analyzed in this study. These subjects were divided into, T1D with no complications (nDPN, n=507) and T1D patients who were diagnosed with peripheral neuropathy (DPN, n=187). The patients in DPN group were older (median age: 53.1 vs 38.8 years) and had type-1 diabetes for a longer duration (29.3 ± 13.0 vs 17.9 ± 10.9 years) than the nDPN group (Table 1). Subjects in DPN group have higher values for HbA1c and systolic blood pressure. There were no differences in the serum level of HDL, LDL, or cholesterol between the DPN and nDPN groups (Table 1). Of the 187 T1D subjects with DPN, 37 had diabetic nephropathy, 100 had retinopathy, 50 had coronary artery disease, and 27 had diabetic foot ulcer(s). Hypertension and dyslipidemia were present in both the groups (Table 1).
Relationships of Inflammatory Proteins in DPN Patients
We evaluated the serum level of 22 inflammatory proteins which have been associated with T1D progression and complications (24–26, 29). Six out of twenty-two proteins (sTNFRI, sTNFRII, MMP2, IGFBP2, sIL2Rα, IGFBP6, CRP) showed elevated (1.2-1.8 fold) mean serum levels in the DPN group compared to the nDPN group (Figure 1 and Supplementary Figure 1). There was a slight but significant elevation in serum levels of sgp130 (1.16-fold), sICAM1 (1.13-fold), MCP1 (1.14-fold) and sVCAM1 (1.16-fold). Six proteins, MMP1, IGFBP1, SAA, IL1Ra, sEGFR, and IL8 showed non-significant elevation in DPN group (Figure 1 and Supplementary Figure 1).
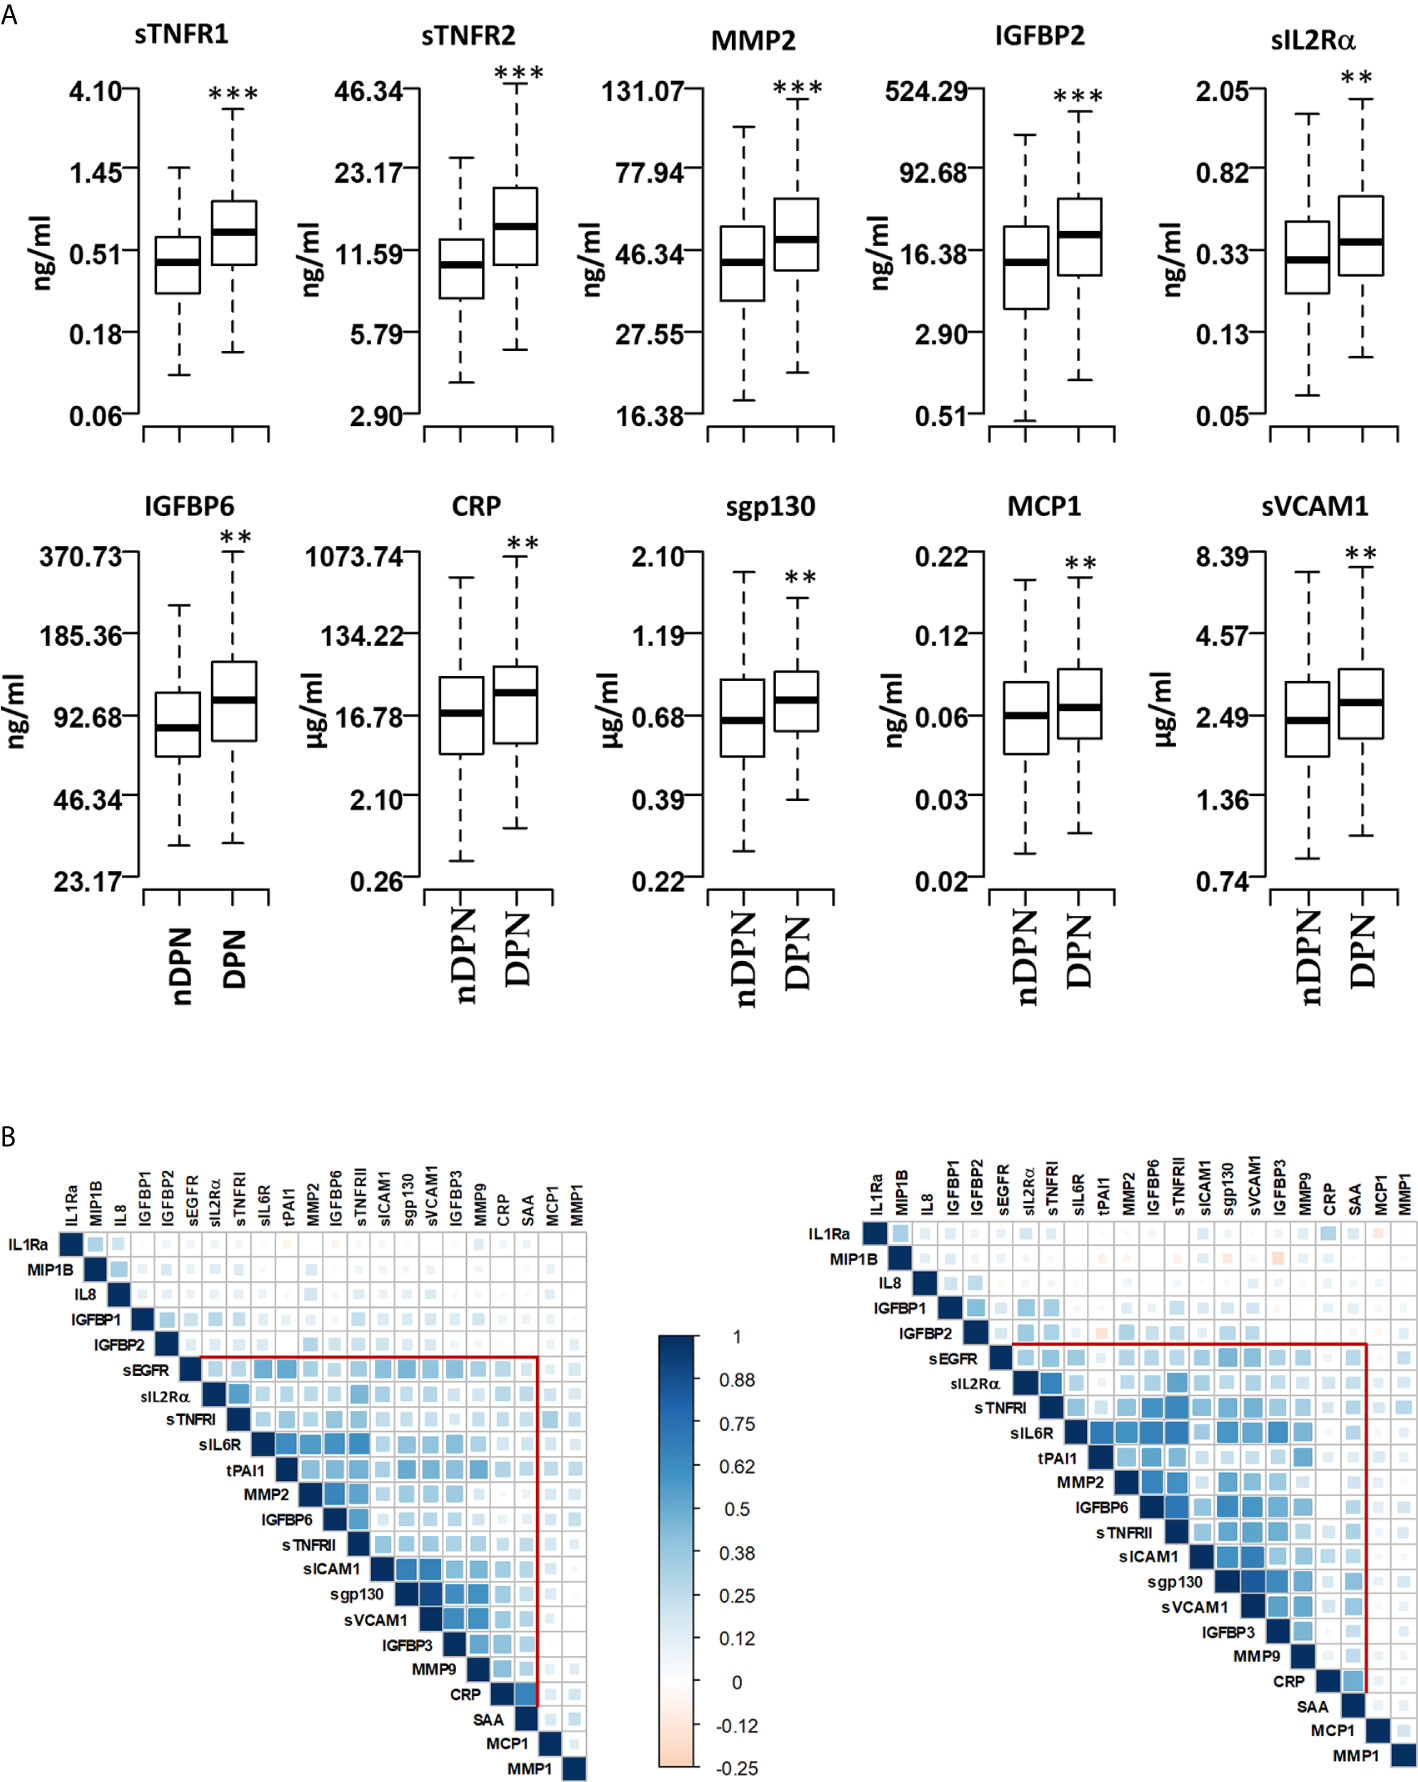
Figure 1 Serum levels of proteins and pairwise correlations. (A) Boxplots showing the measured levels of selected proteins in T1D patients without diabetic neuropathy (nDPN, n=507) and with diabetic neuropathy (DPN, n=187). (B) Heatmaps showing the pairwise correlation coefficients in nDPN (left) and DPN (right) patients. The correlation coefficients are clustered based on the supervised hierarchical clustering. The color density represents the strength of correlation (r) values and the size of the squares represent the significance. ***P < 0.000001, **P < 0.01.
We next evaluated the correlation structure of these inflammatory proteins by pairwise Pearson’s correlation analysis in the nDPN and DPN groups separately. Hierarchical clustering of the correlation matrix suggests a single cluster with 11 proteins in the T1D group. Within this cluster, the first sub-cluster, including proteins sIL6R, tPAI1, MMP2, IGFBP6 and sTNFRII, had correlation coefficient (r) values ranging from 0.41 to 0.65 (p<10-32). The second sub-cluster of highly correlated group of proteins contained sICAM1, sgp130, sVCAM1, and IGFBP3 (r=0.42-0.90, p<10-32, Figure 1B, left). In the DPN group, we observed a stronger correlation among the 11 proteins compared to the nDPN group (Figure 1B, right). The first sub-cluster had r-values in range of 0.41-0.7 (p=0-4x10⁻⁸), the second cluster had r-values in range of 0.38-0.83 (p=0-8x10⁻⁷). The most notable difference was the strength of correlation among sEGFR, sIL2Rα, sTNFRI, sIL6R, tPAI1, MMP2, IGFBP6 and sTNFRII in the DPN group. These results suggest that inflammation plays a more coordinated role in patients with DPN compared to nDPN subjects.
Influence of Age, Duration of Diabetes and Gender on Serum Levels
In nDPN group, the subject’s age at the time of sample collection was significantly correlated with serum levels of IGFBP2 (r=0.27, p=1x10⁻⁹), MMP1 (r=0.161, p=0.0003), and SAA (r=0.12, p=0.009) (Supplementary Table 1). The subject’s duration of T1D disease burden was significantly correlated with IGFBP1 (r=0.16, p=0.0003), IGFBP2 (r=0.26, p=2.2x10⁻⁹), MMP2 (r=0.22, p=1x10⁻⁶), and sTNFR2 (r=0.18, p=7.2x10⁻⁵). Females have a higher serum level on average than males for IL-1Ra (F/M ratio=1.48, p=2.8x10⁻⁵), IGFBP1 (F/M ratio=17.6, p=1.2x10⁻⁸), IGFBP2 (F/M ratio=156, p=1.2x10⁻³), IGFBP6 (F/M ratio=0.76, p=2.4x10⁻⁷).
In DPN group, the subject’s age at the time of sample collection was significantly correlated with serum levels of IGFBP3 (r=-0.2, p=0.008) and MMP2 (r=0.2, p=0.007). Only MMP2 (r=0.19, p=0.008) showed significant correlation with disease duration in DPN group. Only IGFBP6 (F/M ratio=0.74, p=0.007) showed significant differences between females and males in the DPN group.
We also evaluated the relationship between hemoglobin A1c (HbA1c) and serum levels of inflammatory proteins. A positive correlation was observed for CRP in the nDPN group (r=0.18, p=0.0002, Supplementary Table 4). A negative correlation was observed for MIP1β with HbA1c in DPN group (r=-0.3, p=0.001, Supplementary Table 4). Only serum concentration of MCP1 was correlated with systolic blood pressure (r=0.2, p=3.7x10⁻⁵)
DPN Is Associated With Increase in Serum Levels of Inflammatory Proteins
We assessed the difference in protein level between the DPN and nDPN groups adjusting for clinical confounders in a multivariate logistic regression model (Table 2). The crude OR (95% CI) for the presence of DPN was significant for per SD increase in protein concentration for 15 proteins (Model 1, Table 2). The positive associations remained significant after multivariate adjusting of age, duration of diabetes and gender (Model 2, Table 2), glycemic control (Model 3, Table 2), hypertension (HTN) and dyslipidemia (Model 4, Table 2). The associations remained unchanged for sTNFR1, sIL2Rα, sTNFRII, IGFBP6 and CRP (Table 2). We did not observe any weakening of the associations for these five proteins in any of the models presented in Table 2.
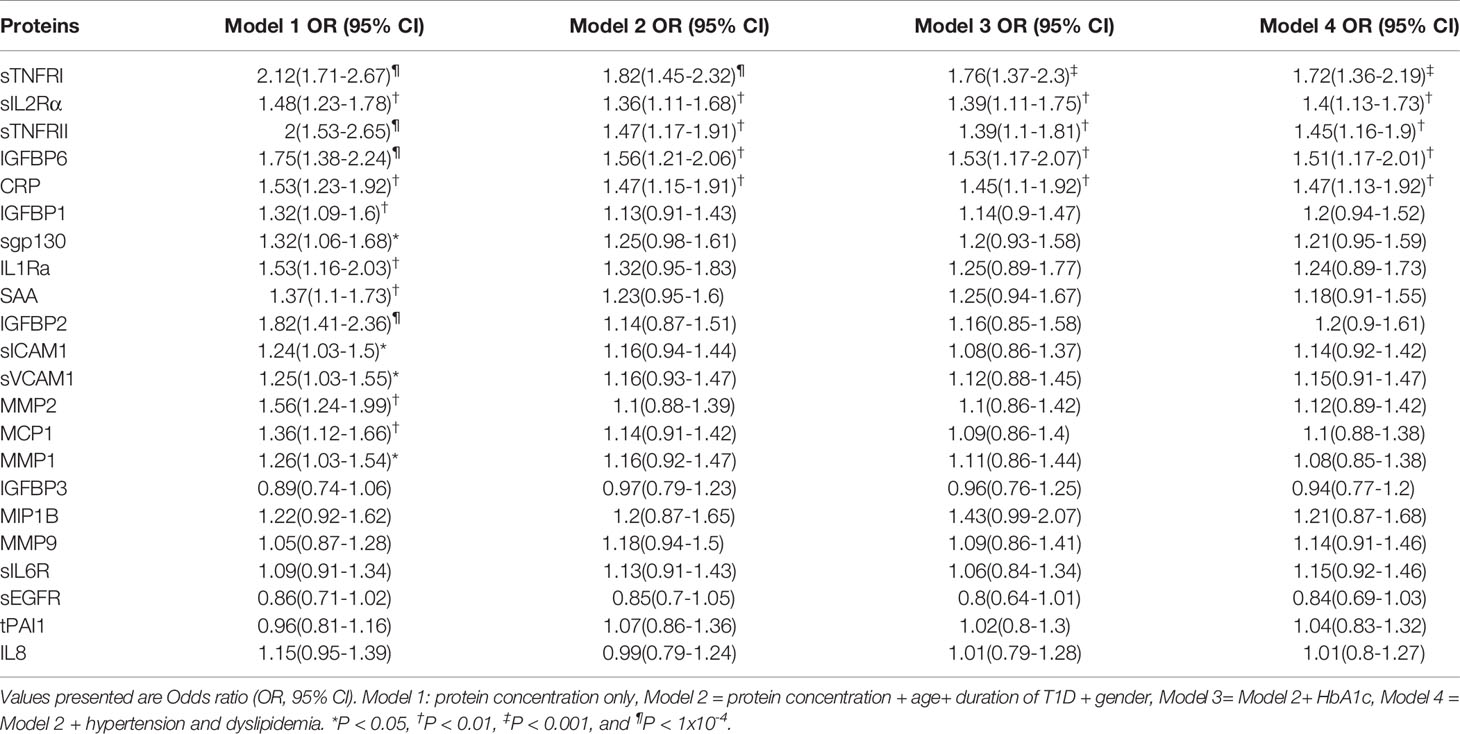
Table 2 DPN is independently associated with per SD increase in serum levels, after adjusting for age at sample, duration of T1D, Gender, glycemic control, hypertension and dyslipidemia.
Non-linear associations are difficult to detect on the logistic regression models we described. Thus, we determined odds ratio (OR) after dividing the protein concentrations into quintiles (Figure 2 and Table 3). The serum levels of each protein in the DPN group were divided into quantiles containing 20 percent of subjects. The cutoff values obtained from the DPN patients was used to assign the T1D patients into five quantiles. For all comparisons, we used the first quintile as a reference to calculate the OR for quintiles 2-5. Figure 2 and Table 3 shows the odds ratio with 95% CI. We observed that DPN is associated with an increase in serum levels of 15 of the 22 proteins measured. The strongest association was noted for sTNFRI (p<1.5x10⁻¹⁵), followed by sTNFRII (p<1.5x10⁻¹⁵), IGFBP6 (p<7.1x10⁻⁸), IGFBP2 (p<5.7x10⁻⁶) and MMP2 (p<9.4x10⁻⁵). The OR for these proteins increased with the serum levels in the fifth quintile to 11.2 (sTNFRI), 8.69 (sTNFRII), 4.8 (IGFBP6) and 3.13 (IGFBP2). Results on MMP2 levels suggested that any increase over 20th percentile has an OR of 2-4.5 of having DPN in these individuals. Markers of endothelial dysfunction (sgp130, sICAM1, sVCAM1) showed an increase in OR of from 1.5 to 2.5 as the levels of these proteins increased in the serum (Supplementary Figure 3).
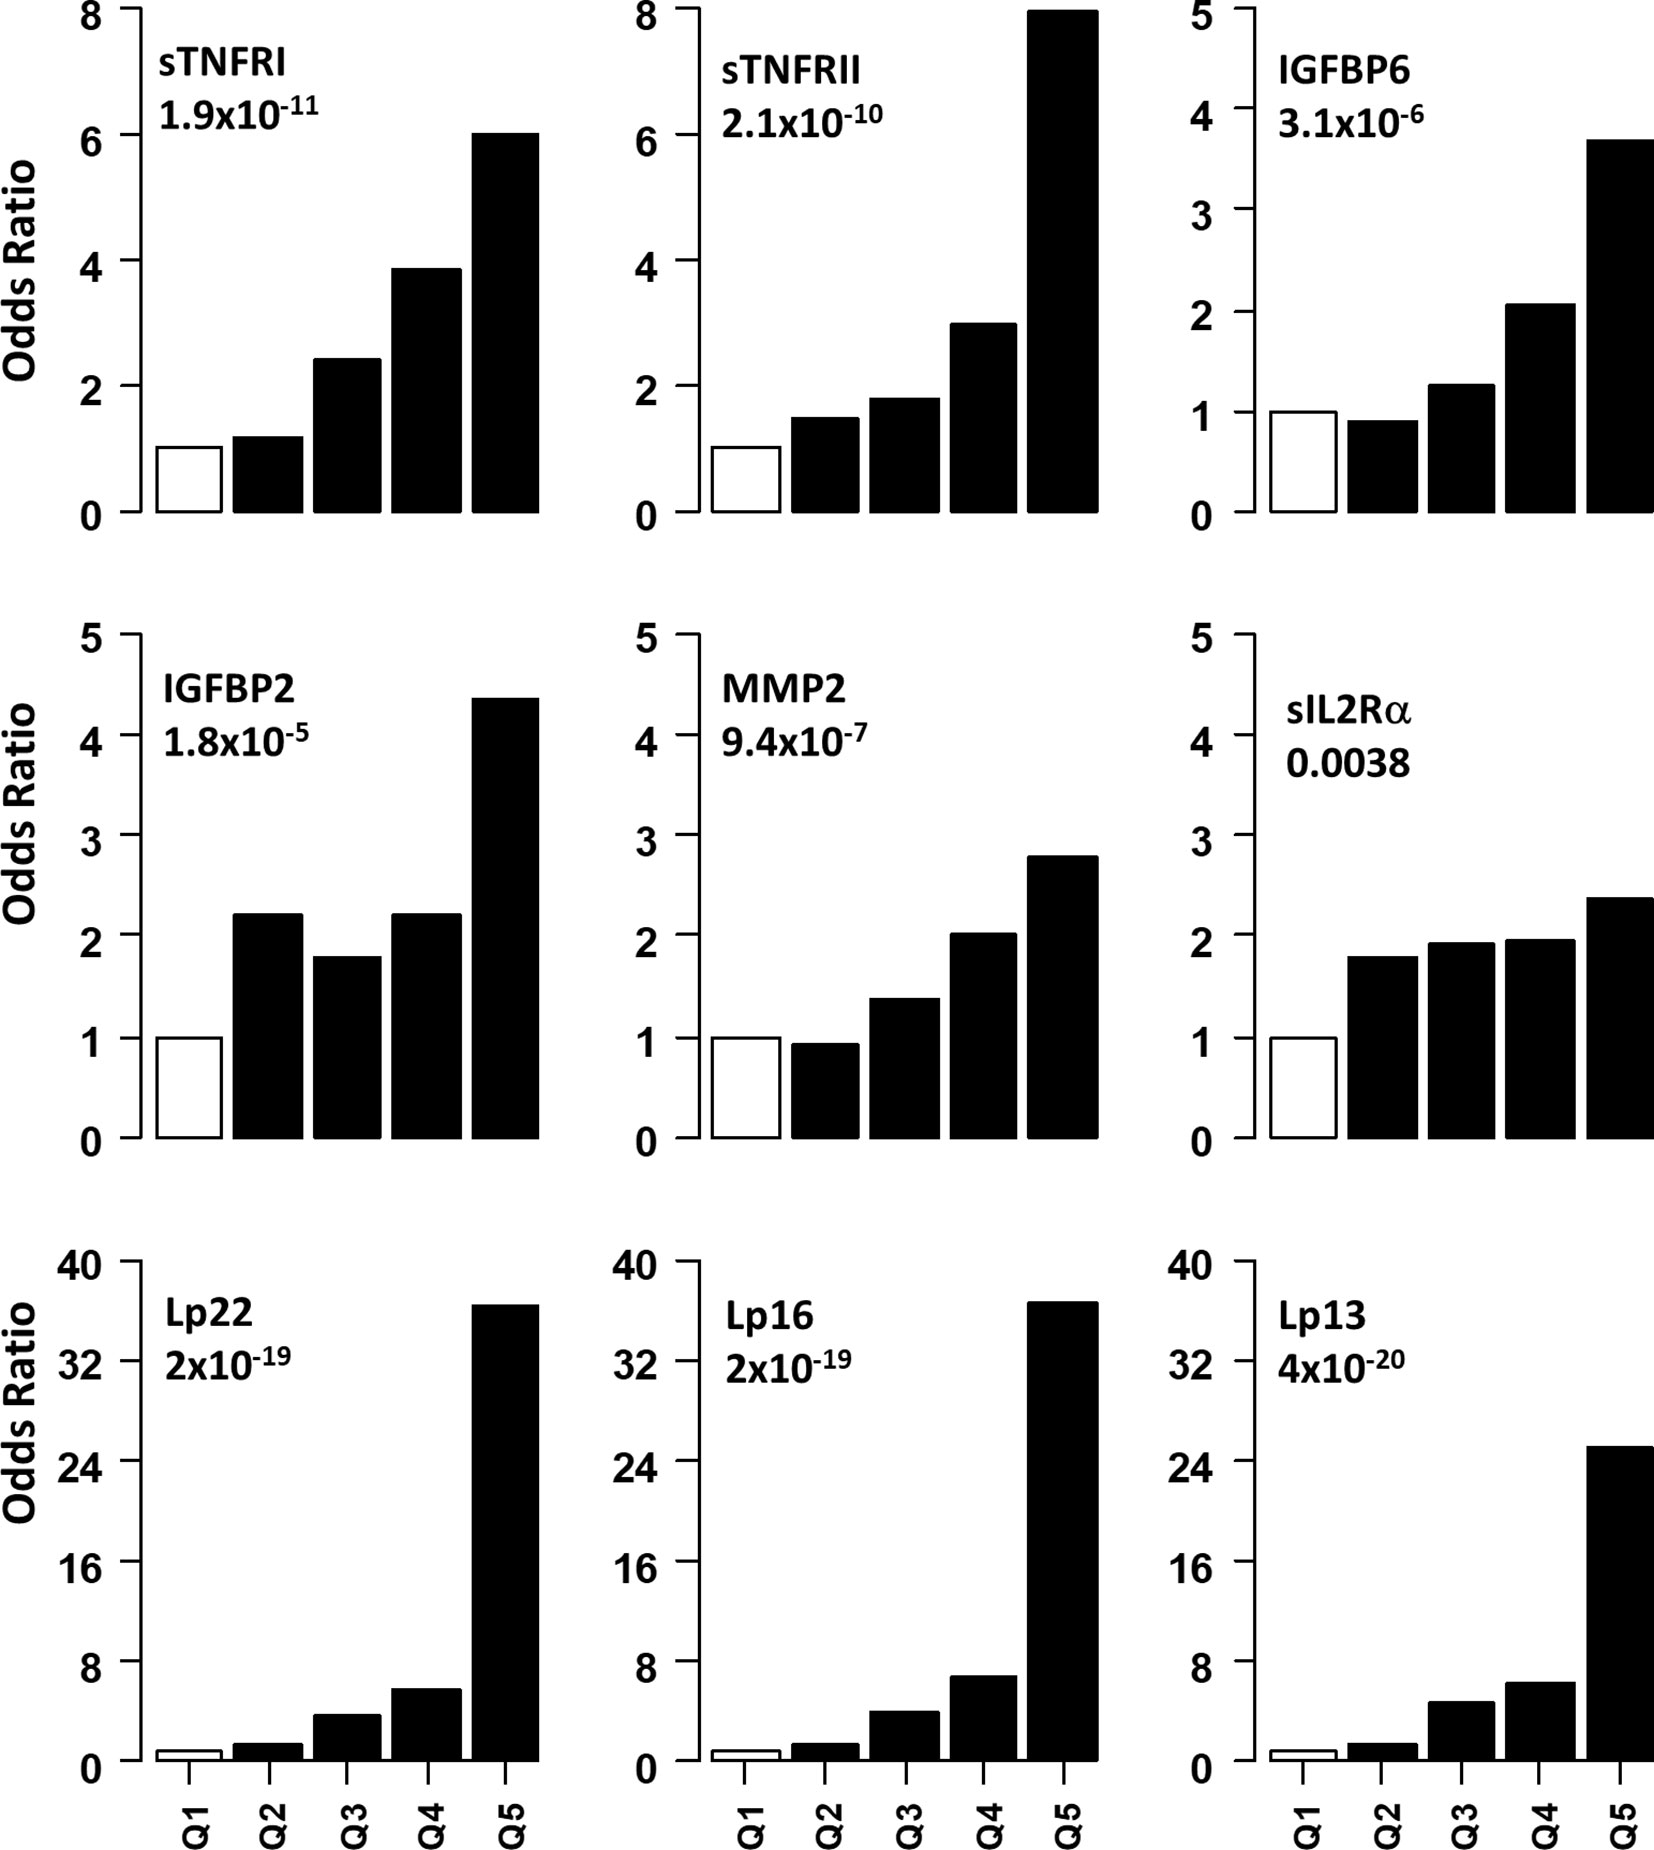
Figure 2 Association of serum level of proteins with presence of DPN. Odds ratios associated with each of the top four quintiles compared to the bottom 1st quintile for each of the twelve individual proteins. The open bar represents the 1st quintile as reference (OR = 1). From left to right, each of the other four solid bars represents the 2nd to 5th quintile (20% of the DPN patients). Odds ratios associated with the risk scores calculated based on different combinations of 22 (Lp22), 16, (Lp), 13(Lp) and 11 (Lp) proteins using ridge regression. Vertical axes are odds ratios.
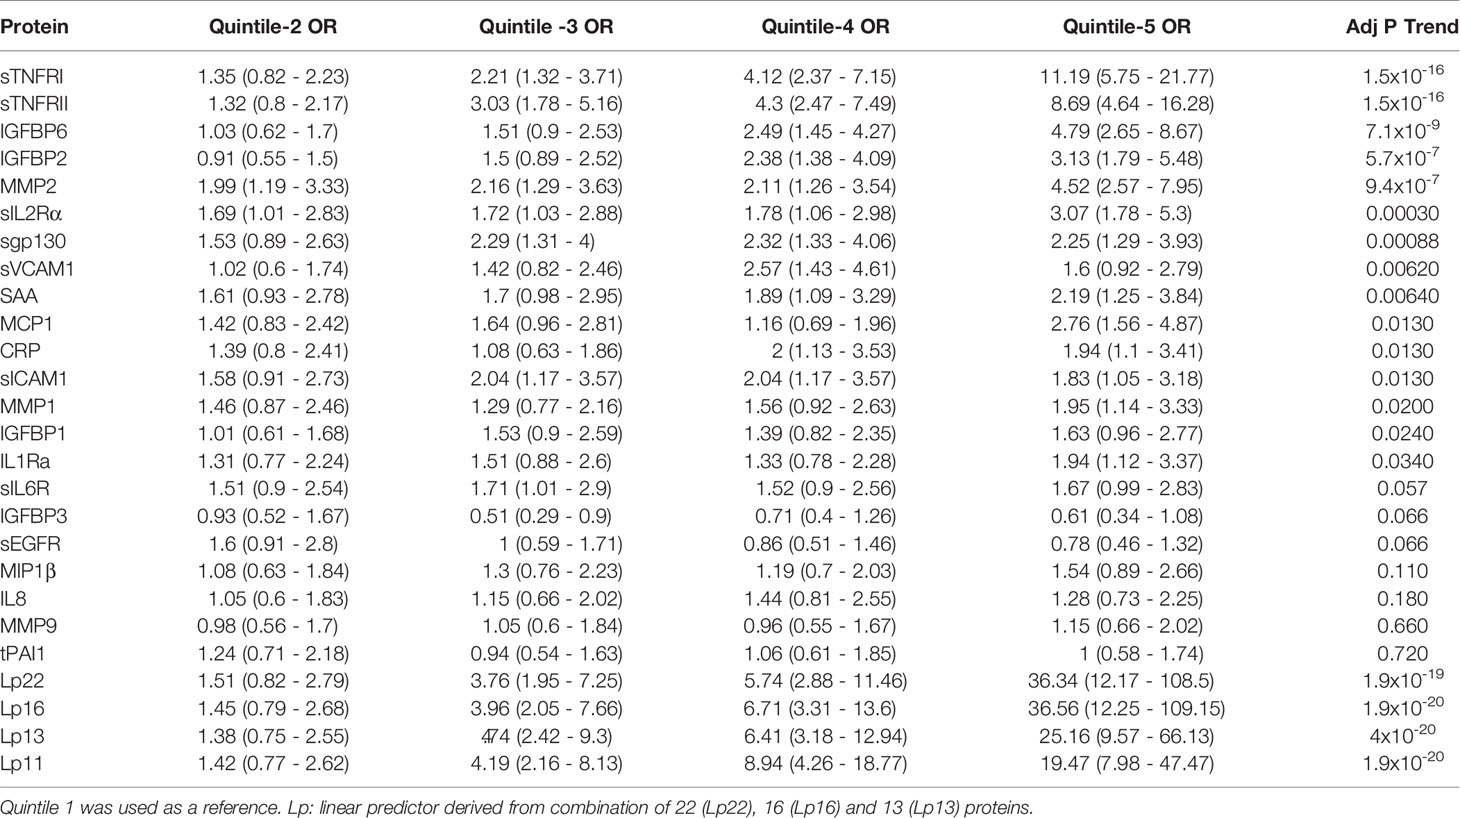
Table 3 Odds ratio (95% CI) of having DPN based on serum levels in quintile (20th percentile) categories.
We implemented a machine-learning approach using ridge regression to find the a combination of proteins optimally associated with DPN. The combination of 22 proteins gave the highest OR of 36.3 in 5th quintile, which was higher than that of any single protein. We then proceeded to determine the minimum number of proteins that can be combined together to improve the OR of having DPN. We found an optimal combination of 16 molecules (IL1Ra, MCP1, MIP1β, CRP, IGFBP2, IGFBP3, IGFBP6, MMP1, MMP2, MMP9, sEGFR, sgp130, sIL2Rα, sTNFRI, sTNFRII and tPAI1) which still have comparable ORs in the 3rd-5th quintile (Figure 2 and Table 3). Our composite score results suggest three different risk groups in DPN patients, group 1 includes low risk DPN patients who have serum levels in 2nd quintile (OR<1.5). The individuals in 3rd and 4th quintile represents medium risk group of DPN patients with OR between 3.5-9.0. The individuals in the highest quintile belongs to the highest risk and depending on the combination of protein may have ORs between 20-36.
Discussion
We report increased serum levels of five out of twenty-two proteins assessed in T1D patients with DPN. The differences were significant after accounting for age, duration of diabetes, and gender. The strongest associations with DPN were with the two TNF-α receptors (TNFR1 and TNFR2). Moderate associations were observed for solubleIL2 receptor (sIL2Rα), a marker of activated helper T-cell marker, as well as IGF binding protein (IGFBP6) and, CRP, a marker of inflammation. Using a quintile-based risk assessment approach, we identified several proteins associated with increased risk of DPN in T1D patients. Increase in serum levels of SAA, MMP2, sIL2Rα, sIL1Ra, sgp130, sICAM-1 and sIL6R in the 2nd-5th quintiles were significantly associated with DPN, whereas serum levels in 3rd to 5th quintile showed associations with DPN for IGFBP1, IGFBP2, IGFBP6 and sVCAM1. The associations observed in this study are potential therapeutic targets for DPN prevention. The TNF-α/IL-6 pathway is reportedly involved in DPN pathogenesis (20, 26).
The higher levels of inflammation markers in the DPN group supports association between inflammation and pathogenesis of DPN. Our results on the serum level of sTNFRI and sTNFRII are in agreement with previous report showing activation of TNF-α system in T1D patients with nephropathy, retinopathy and neuropathy (23–27). The soluble form of TNFRs are known to act as stabilizers of TNF-α activity, which prolongs systemic and vascular inflammation associated with complications (32). We did not noticed any weakening of the associations with DPN for sTNFRII for any of the models (27).
Activation of the TNF-α system is associated with activation of T-cells (33), which is evident with increase in serum levels of sIL2Rα, a marker for activated T-cells in several autoimmune diseases including T1D. We have not identified any other study that has evaluated the association between sIL2Rα and presence of DPN in T1D patients. Contrary to a previously published report (27) CRP was strongly associated with presence of DPN in our study. This indicates role of systemic inflammation in DPN. In our study, markers of endothelial dysfunctions (IL6, sgp130, sVCAM1, sICAM1) were not significant after multivariate adjustment. We measured serum levels of two proteins that are required for IL6 signaling, sgp130 and sIL6R. Classical IL6 signaling is only limited to immune cells. The majority of the cell types’ action of IL6 is dependent on its binding to soluble IL6 receptor (sIL6R) and a signal transducing glycoprotein, sgp130, on the cell via trans-signaling (34). In our logistic regression analysis, we did not see any significant association of these two proteins with the presence of DPN. However, our quintile analysis suggests that any increase above the 20th percentile in the serum levels for sIL6R and sgp130 is strongly associated with presence of DPN (OR=1.5-2.25, Table 3). The results of our study, suggests there is increase in the inflammation promoting IL6 trans-signaling in DPN patients (35). Taken together, out results suggests an activation of TNF-α/IL6 inflammatory pathways in DPN, similar to those reported in retinopathy (25) and nephropathy (24).
Chronic hyperglycemia is shown to be one of the pathogenic factors in activation of inflammatory pathways. In our analysis, the association with DPN remained unchanged for sTNFRI, sTNFRII, sIL2Rα, IGFBP6 and CRP, after adjusting for HbA1c levels in study subjects, suggesting that factors other than hyperglycemia are also involved in pathogenesis of DPN (36). Similar to earlier studies we did not see any effect of HTN and dyslipidemia (26, 27, 37). The results presented here suggests that our combined model may be a useful clinical tool to identify patients at risk for developing DPN.
We applied a ridge regression model to calculate the risk of DPN in T1D individuals. Ridge regression allows for individual coefficients to model the association between each individual protein and DPN. This model allows more model flexibility compared to the composite z-score approach to predict diabetes-related microvascular complications as reported by Schram et al. (26).
Our study limitations include its cross-sectional nature and the classification of DPN only based on chart review without further clinical validation. Although age was included as a confounder, DPN patients were still 14 years older than nDPN patients on average and aging is associated with inflammatory markers (26). The study has several strengths including measurement of multiple markers in a multiplex format, which enhances the replicability of the results. We have included proteins that are involved in the activation of inflammation (sTNFRI, sTNFRII and sIL2Rα), systemic inflammation (SAA and CRP), insulin like growth factor signaling (IGFBPs) and vascular function (sIL6R, sgp130, sVCAM1 and sICAM1). Our study has a larger DPN population (n=187) and more inflammatory markers than previously reported studies (26, 27). The most important contribution is the machine learning approach to combine the information to an individualized linear predictor score.
We report here that serum levels of sTNFRI, sTNFRII, sIL2Rα, IGFBP6 and CRP are increased in DPN patients with T1D after adjusting for confounding co-variates. We have successfully shown that the serum levels can also be used for stratifying DPN patients into risk groups. Our study indicates that DPN patients have an activation of inflammatory pathways, unaffected by glycemic control and hypertension. This suggests a new therapeutic strategy to prevent DPN. Our inflammatory signature may be of clinically useful tool to screen for activated inflammation in diabetes patients.
Data Availability Statement
The raw data supporting the conclusions of this article will be made available by the authors, without undue reservation.
Ethics Statement
The studies involving human participants were reviewed and approved by Augusta University IRB. The patients/participants provided their written informed consent to participate in this study.
Author Contributions
SP and J-XS were involved with conception of the project. SP and MH acquired the Luminex data. SP, LT, and PT were responsible for data analysis. WZ, KB, DH, MG, JB, RB, BB, JM, and JR contributed to clinical samples. All authors contributed to the article and approved the submitted version.
Funding
This work was supported by grants from the National Institutes of Health (R21HD050196, R33HD050196, and 2RO1HD37800) and JDRF (1-2004-661) to J-XS. SP (2-2011-153, 10-2006-792 and 3-2004-195) and WZ (3-2009-275) were supported by Postdoctoral Fellowship and Career Development Award from JDRF. PT was supported by NIH/NIDDK fellowship (F30DK12146101A1).
Conflict of Interest
The authors declare that the research was conducted in the absence of any commercial or financial relationships that could be construed as a potential conflict of interest.
Acknowledgments
We are very grateful to all patients and other volunteers who participated in this study.
Supplementary Material
The Supplementary Material for this article can be found online at: https://www.frontiersin.org/articles/10.3389/fimmu.2021.654233/full#supplementary-material
References
1. Marcovecchio ML, Tossavainen PH, Dunger DB. Prevention and treatment of microvascular disease in childhood type 1 diabetes. Br Med Bull (2010) 94:145–64. doi: 10.1093/bmb/ldp053
2. Mattila TK, de Boer A. Influence of intensive versus conventional glucose control on microvascular and macrovascular complications in type 1 and 2 diabetes mellitus. Drugs (2010) 70:2229–45. doi: 10.2165/11585220-000000000-00000
3. McCrimmon RJ, Ryan CM, Frier BM. Diabetes and cognitive dysfunction. Lancet (2012) 379:2291–9. doi: 10.1016/S0140-6736(12)60360-2
4. Melendez-Ramirez LY, Richards RJ, Cefalu WT. Complications of type 1 diabetes. Endocrinol Metab Clin North Am (2010) 39:625–40. doi: 10.1016/j.ecl.2010.05.009
5. Laing SP, Swerdlow AJ, Slater SD, Burden AC, Morris A, Waugh NR, et al. Mortality from heart disease in a cohort of 23,000 patients with insulin-treated diabetes. Diabetologia (2003) 46:760–5. doi: 10.1007/s00125-003-1116-6
6. Boulton AJM, Malik RA, Arezzo JC, Sosenko JM. Diabetic Somatic Neuropathies. Diabetes Care (2004) 27:1458. doi: 10.2337/diacare.27.6.1458
7. Herman WH, Kennedy L. Underdiagnosis of peripheral neuropathy in type 2 diabetes. Diabetes Care (2005) 28:1480–1. doi: 10.2337/diacare.28.6.1480
8. Bongaerts BW, Rathmann W, Heier M, Kowall B, Herder C, Stöckl D, et al. Older subjects with diabetes and prediabetes are frequently unaware of having distal sensorimotor polyneuropathy: the KORA F4 study. Diabetes Care (2013) 36:1141–6. doi: 10.2337/dc12-0744
9. Martin CL, Albers JW, Pop-Busui R. Neuropathy and related findings in the diabetes control and complications trial/epidemiology of diabetes interventions and complications study. Diabetes Care (2014) 37:31–8. doi: 10.2337/dc13-2114
10. Nathan DM, Genuth S, Lachin J, Cleary P, Crofford O, Davis M, et al. The effect of intensive treatment of diabetes on the development and progression of long-term complications in insulin-dependent diabetes mellitus. N Engl J Med (1993) 329:977–86. doi: 10.1056/NEJM199309303291401
11. Perkins BA. Rethinking Neuropathy in Type 1 Diabetes: Had We Lost Sight of What Matters Most? Diabetes Care (2020) 43:695–7. doi: 10.2337/dci19-0076
12. Jeyam A, McGurnaghan SJ, Blackbourn LAK, McKnight JM, Green F, Collier A, et al. Diabetic Neuropathy Is a Substantial Burden in People With Type 1 Diabetes and Is Strongly Associated With Socioeconomic Disadvantage: A Population-Representative Study From Scotland. Diabetes Care (2020) 43:734–42. doi: 10.2337/dc19-1582
13. Mizokami-Stout KR, Li Z, Foster NC, Shah V, Aleppo G, McGill JB, et al. The Contemporary Prevalence of Diabetic Neuropathy in Type 1 Diabetes: Findings From the T1D Exchange. Diabetes Care (2020) 43:806. doi: 10.2337/dc19-1583
14. Tesfaye S, Stevens LK, Stephenson JM, Fuller JH, Plater M, Ionescu-Tirgoviste C, et al. Prevalence of diabetic peripheral neuropathy and its relation to glycaemic control and potential risk factors: the EURODIAB IDDM Complications Study. Diabetologia (1996) 39:1377–84. doi: 10.1007/s001250050586
15. Pop-Busui R, Boulton AJM, Feldman EL, Bril V, Freeman R, Malik RA, et al. Diabetic Neuropathy: A Position Statement by the American Diabetes Association. Diabetes Care (2017) 40:136. doi: 10.2337/dc16-2042
16. Pop-Busui R, Martin C. Neuropathy in the DCCT/EDIC-What Was Done Then and What We Would Do Better Now. Int Rev Neurobiol (2016) 127:9–25. doi: 10.1016/bs.irn.2016.02.020
17. Christensen MMB, Hommel EE, Jørgensen ME, von Scholten BJ, Fleischer J, Hansen CS. Prevalence of Diabetic Neuropathy in Young Adults with Type 1 Diabetes and the Association with Insulin Pump Therapy. Diabetes Technol Ther (2018) 20:787–96. doi: 10.1089/dia.2018.0249
18. Maser RE, Steenkiste AR, Dorman JS, Nielsen VK, Bass EB, Manjoo Q, et al. Epidemiological Correlates of Diabetic Neuropathy: Report From Pittsburgh Epidemiology of Diabetes Complications Study. Diabetes (1989) 38:1456. doi: 10.2337/diabetes.38.11.1456
19. Jaiswal M, Divers J, Dabelea D, Isom S, Bell RA, Martin CL, et al. Prevalence of and Risk Factors for Diabetic Peripheral Neuropathy in Youth With Type 1 and Type 2 Diabetes: SEARCH for Diabetes in Youth Study. Diabetes Care (2017) 40:1226–32. doi: 10.2337/dc17-0179
20. Pop-Busui R, Ang L, Holmes C, Gallagher K, Feldman EL. Inflammation as a Therapeutic Target for Diabetic Neuropathies. Curr Diabetes Rep (2016) 16:29. doi: 10.1007/s11892-016-0727-5
21. Jin HY, Park TS. Role of inflammatory biomarkers in diabetic peripheral neuropathy. J Diabetes Investig (2018) 9:1016–8. doi: 10.1111/jdi.12794
22. Goldberg RB. Cytokine and cytokine-like inflammation markers, endothelial dysfunction, and imbalanced coagulation in development of diabetes and its complications. J Clin Endocrinol Metab (2009) 94:3171–82. doi: 10.1210/jc.2008-2534
23. Zoppini G, Faccini G, Muggeo M, Zenari L, Falezza G, Targher G. Elevated plasma levels of soluble receptors of TNF-alpha and their association with smoking and microvascular complications in young adults with type 1 diabetes. J Clin Endocrinol Metab (2001) 86:3805–8. doi: 10.1210/jcem.86.8.7786
24. Purohit S, Sharma A, Zhi W, Bai S, Hopkins D, Steed L, et al. Proteins of TNF-α and IL6 Pathways Are Elevated in Serum of Type-1 Diabetes Patients with Microalbuminuria. Front Immunol (2018) 9:154. doi: 10.3389/fimmu.2018.00154
25. Sharma S, Purohit S, Sharma A, Hopkins D, Steed L, Bode B, et al. Elevated Serum Levels of Soluble TNF Receptors and Adhesion Molecules Are Associated with Diabetic Retinopathy in Patients with Type-1 Diabetes. Mediators Inflammation (2015) 2015:279393. doi: 10.1155/2015/279393
26. Schram MT, Chaturvedi N, Schalkwijk CG, Fuller JH, Stehouwer CD. Markers of inflammation are cross-sectionally associated with microvascular complications and cardiovascular disease in type 1 diabetes–the EURODIAB Prospective Complications Study. Diabetologia (2005) 48:370–8. doi: 10.1007/s00125-004-1628-8
27. González-Clemente JM, Mauricio D, Richart C, Broch M, Caixàs A, Megia A, et al. Diabetic neuropathy is associated with activation of the TNF-α system in subjects with type 1 diabetes mellitus. Clin Endocrinol (2005) 63:525–9. doi: 10.1111/j.1365-2265.2005.02376.x
28. Sharma A, Purohit S, Sharma S, Bai S, Zhi W, Ponny SR, et al. IGF-Binding Proteins in Type-1 Diabetes Are More Severely Altered in the Presence of Complications. Front Endocrinol (Lausanne) (2016) 7:2. doi: 10.3389/fendo.2016.00002
29. Purohit S, Sharma A, Hopkins D, Steed L, Bode B, Anderson SW, et al. Large-Scale Discovery and Validation Studies Demonstrate Significant Reductions in Circulating Levels of IL8, IL-1Ra, MCP-1, and MIP-1β in Patients With Type 1 Diabetes. J Clin Endocrinol Metab (2015) 100:E1179–87. doi: 10.1210/JC.2015-1388
30. Zhi W, Sharma A, Purohit S, Miller E, Bode B, Anderson SW, et al. Discovery and validation of serum protein changes in type 1 diabetes patients using high throughput two dimensional liquid chromatography-mass spectrometry and immunoassays. Mol Cell Proteomics (2011) 10(11):M111.012203. doi: 10.1074/mcp.M111.012203
31. Friedman J, Hastie T, Tibshirani R. Regularization Paths for Generalized Linear Models via Coordinate Descent. J Stat Softw (2010) 33:1–22. doi: 10.18637/jss.v033.i01
32. Aderka D, Engelmann H, Maor Y, Brakebusch C, Wallach D. Stabilization of the bioactivity of tumor necrosis factor by its soluble receptors. J Exp Med (1992) 175:323–9. doi: 10.1084/jem.175.2.323
33. Burrack AL, Martinov T, Fife BT. T Cell-Mediated Beta Cell Destruction: Autoimmunity and Alloimmunity in the Context of Type 1 Diabetes. Front Endocrinol (2017) 8:343. doi: 10.3389/fendo.2017.00343
34. Su H, Lei C-T, Zhang C. Interleukin-6 Signaling Pathway and Its Role in Kidney Disease: An Update. Front Immunol (2017) 8:405. doi: 10.3389/fimmu.2017.00405
35. Reeh H, Rudolph N, Billing U, Christen H, Streif S, Bullinger E, et al. Response to IL-6 trans- and IL-6 classic signalling is determined by the ratio of the IL-6 receptor α to gp130 expression: fusing experimental insights and dynamic modelling. Cell Commun Signaling (2019) 17:46. doi: 10.1186/s12964-019-0356-0
36. Satoh J, Yagihashi S, Toyota T. The possible role of tumor necrosis factor-alpha in diabetic polyneuropathy. Exp Diabesity Res (2003) 4:65–71. doi: 10.1155/EDR.2003.65
Keywords: autoimmunity, chronic inflammation, type-1 diabetes, cytokines, receptors, peripheral neuropathy
Citation: Purohit S, Tran PMH, Tran LKH, Satter KB, He M, Zhi W, Bai S, Hopkins D, Gardiner M, Wakade C, Bryant J, Bernard R, Morgan J, Bode B, Reed JC and She J-X (2021) Serum Levels of Inflammatory Proteins Are Associated With Peripheral Neuropathy in a Cross-Sectional Type-1 Diabetes Cohort. Front. Immunol. 12:654233. doi: 10.3389/fimmu.2021.654233
Received: 15 January 2021; Accepted: 08 March 2021;
Published: 31 March 2021.
Edited by:
Poornima Paramasivan, Abertay University, United KingdomReviewed by:
Rayaz A. Malik, Weill Cornell Medicine, QatarShibu Marthandam Asokan, The Buddhist Tzu Chi Medical Foundation, Taiwan
Copyright © 2021 Purohit, Tran, Tran, Satter, He, Zhi, Bai, Hopkins, Gardiner, Wakade, Bryant, Bernard, Morgan, Bode, Reed and She. This is an open-access article distributed under the terms of the Creative Commons Attribution License (CC BY). The use, distribution or reproduction in other forums is permitted, provided the original author(s) and the copyright owner(s) are credited and that the original publication in this journal is cited, in accordance with accepted academic practice. No use, distribution or reproduction is permitted which does not comply with these terms.
*Correspondence: Jin-Xiong She, anNoZUBhdWd1c3RhLmVkdQ==; Sharad Purohit, c3B1cm9oaXRAYXVndXN0YS5lZHU=
†These authors have contributed equally to this work