 David Brown1†‡
 Michael Altermatt1†‡
 Tatyana Dobreva2†
 Sisi Chen1†
 Alexander Wang3†
 Matt Thomson1*
 Viviana Gradinaru1*†
- 1Division of Biology and Biological Engineering, California Institute of Technology, Pasadena, CA, United States
- 2Andrew and Peggy Cherng Department of Medical Engineering, California Institute of Technology, Pasadena, CA, United States
- 3Division of Engineering and Applied Science, California Institute of Technology, Pasadena, CA, United States
Engineered variants of recombinant adeno-associated viruses (rAAVs) are being developed rapidly to meet the need for gene-therapy delivery vehicles with particular cell-type and tissue tropisms. While high-throughput AAV engineering and selection methods have generated numerous variants, subsequent tropism and response characterization have remained low throughput and lack resolution across the many relevant cell and tissue types. To fully leverage the output of these large screening paradigms across multiple targets, we have developed an experimental and computational single-cell RNA sequencing (scRNA-seq) pipeline for in vivo characterization of barcoded rAAV pools at high resolution. Using this platform, we have both corroborated previously reported viral tropisms and discovered unidentified AAV capsid targeting biases. As expected, we observed that the tropism profile of AAV.CAP-B10 in mice was shifted toward neurons and away from astrocytes when compared with AAV-PHP.eB. Transcriptomic analysis revealed that this neuronal bias is due mainly to increased targeting efficiency for glutamatergic neurons, which we confirmed by RNA fluorescence in situ hybridization. We further uncovered cell subtype tropisms of AAV variants in vascular and glial cells, such as low transduction of pericytes and Myoc+ astrocytes. Additionally, we have observed cell-type-specific transitory responses to systemic AAV-PHP.eB administration, such as upregulation of genes involved in p53 signaling in endothelial cells three days post-injection, which return to control levels by day twenty-five. The presented experimental and computational approaches for parallel characterization of AAV tropism will facilitate the advancement of safe and precise gene delivery vehicles, and showcase the power of understanding responses to gene therapies at the single-cell level.
1 Introduction
Recombinant AAVs (rAAVs) have become the preferred gene delivery vehicles for many clinical and research applications (1, 2) owing to their broad viral tropism, ability to transduce dividing and non-dividing cells, low immunogenicity, and stable persistence as episomal DNA ensuring long-term transgene expression (3–8). However, current systemic gene therapies using AAVs have a relatively low therapeutic index (9). High doses are necessary to achieve sufficient transgene expression in target cell populations, which can lead to severe adverse effects from off-target expression (10–12). Increased target specificity of rAAVs would reduce both the necessary viral dose and off-target effects; thus, there is an urgent need for AAV gene delivery vectors that are optimized for cell-type-specific delivery (13). Lower viral doses would also alleviate demands on vector manufacturing and minimize the chances of undesirable immunological responses (14–16). Capsid-specific T-cell activation was reported to be dose-dependent in vitro (17, 18) and in humans (19, 20). Shaping the tropism of existing AAVs to the needs of a specific disease has the potential to reduce activation of the immune system by detargeting cell types, such as dendritic cells, that have an increased ability to activate T-cells (21–26).
Several studies have demonstrated that the transduction efficiency and specificity of natural AAVs can be improved by engineering their capsids using rational design (27–31) or directed evolution (32–47). These engineering methods yield diverse candidates that require thorough, preferably high-throughput, in vivo vector characterization to identify optimal candidates for a particular clinical or research application. Toward this end, conventional immunohistochemistry (IHC) and various in situ hybridization (ISH) techniques are commonly employed to profile viral tropism by labeling proteins expressed by the viral transgene or viral nucleic acids, respectively (10, 32, 34, 45, 48–59).
Although these histological approaches preserve spatial information, current technical challenges limit their application to profiling the viral tropism of just one or two AAV variants across a few gene markers, thus falling short of efficiently characterizing multiple AAVs across many complex cell types characteristic of tissues in the central nervous system (CNS). The reliance on known marker genes also prevents the unbiased discovery of tropisms since such marker genes need to be chosen a priori. Choosing marker genes is particularly challenging for supporting cell types, such as pericytes in the CNS microvasculature and oligodendrocytes, which often have less established cell type identification strategies (60, 61). The advent of single-cell RNA sequencing (scRNA-seq) has enabled comprehensive transcriptomic analysis of entire cell-type hierarchies, and brought new appreciation to the role of cell subtypes in disease (62–66). However, experimental and computational challenges, such as the sparsity of RNA capture and detection, strong batch effects between samples, and the presence of ambient RNA in droplets, reduce the statistical confidence of claims about individual gene expression (67–69). Computational methods have been developed to address some of these challenges, such as identifying contaminating RNA (68), accounting for or removing batch effects (70–72), and distinguishing intact cells from empty droplets (69, 73, 74). However, strategies for simultaneously processing transcripts from multiple delivery vehicles and overcoming the computational challenges of confidently detecting individual transcripts have not yet been developed for probing the tropism of AAVs in complex, heterogeneous cell populations.
Collecting the entire transcriptome of injected and non-injected animals also offers an opportunity to study the effects of AAV transduction on the host cell transcriptome. A similar investigation has been conducted with G-deleted rabies virus (75). This study demonstrated that virus infection led to the downregulation of genes involved in metabolic processes and neurotransmission in host cells, whereas genes related to cytokine signaling and the adaptive immune system were upregulated. At present, no such detailed examination of transcriptome changes upon systemic AAV injection has been conducted. High-throughput single-cell transcriptomic analysis could provide further insight into the ramifications of AAV capsid and transgene modifications with regard to innate (76–80) and adaptive immune recognition (20, 81–84). Innate and adaptive immune responses to AAV gene delivery vectors and transgene products constitute substantial hurdles to their clinical development (85, 86). The study of brain immune response to viral gene therapy has been limited to antibody staining and observation of brain tissue slices post direct injection. In particular, prior studies have shown that intracerebral injection of rAAV vectors in rat brains does not induce leukocytic infiltration or gliosis (87, 88); however, innate inflammatory responses were observed (89). Results reported by these methods are rooted in single-marker staining and thus prevent the discovery of unexpected cell-type-specific responses. A comprehensive understanding of the processes underlying viral vector or transgene-mediated responses is critical for further optimizing AAV gene delivery vectors and treatment modalities that mitigate such immune responses.
Here, we introduce an experimental and bioinformatics workflow capable of profiling the viral tropism and response of multiple barcoded AAV variants in a single animal across numerous complex cell types by taking advantage of the transcriptomic resolution of scRNA-seq techniques (Figure 1A). For this proof-of-concept study, we profile the tropism of previously-characterized AAV variants that emerged from directed evolution with the CREATE (AAV-PHP.B, AAV-PHP.eB) (32, 34) or M-CREATE (AAV-PHP.C1, AAV-PHP.C2, AAV-PHP.V1, AAV.CAP-B10) (45, 90) platforms. We selected the AAV variants based on their unique CNS tropism following intravenous injection. AAV-PHP.B and AAV-PHP.eB are known to exhibit overall increased targeting of the CNS compared with AAV9 and preferential targeting of neurons and astrocytes. Despite its sequence similarity to AAV-PHP.B, the tropism of AAV-PHP.V1 is known to be biased toward transducing brain vascular cells. AAV-PHP.C1 and AAV-PHP.C2 have both demonstrated enhanced blood–brain barrier (BBB) crossing relative to AAV9 across two mouse strains (C57BL/6J and BALB/cJ). Finally, AAV.CAP-B10 is a recently-developed variant with a bias toward neurons compared to AAV-PHP.eB (90).
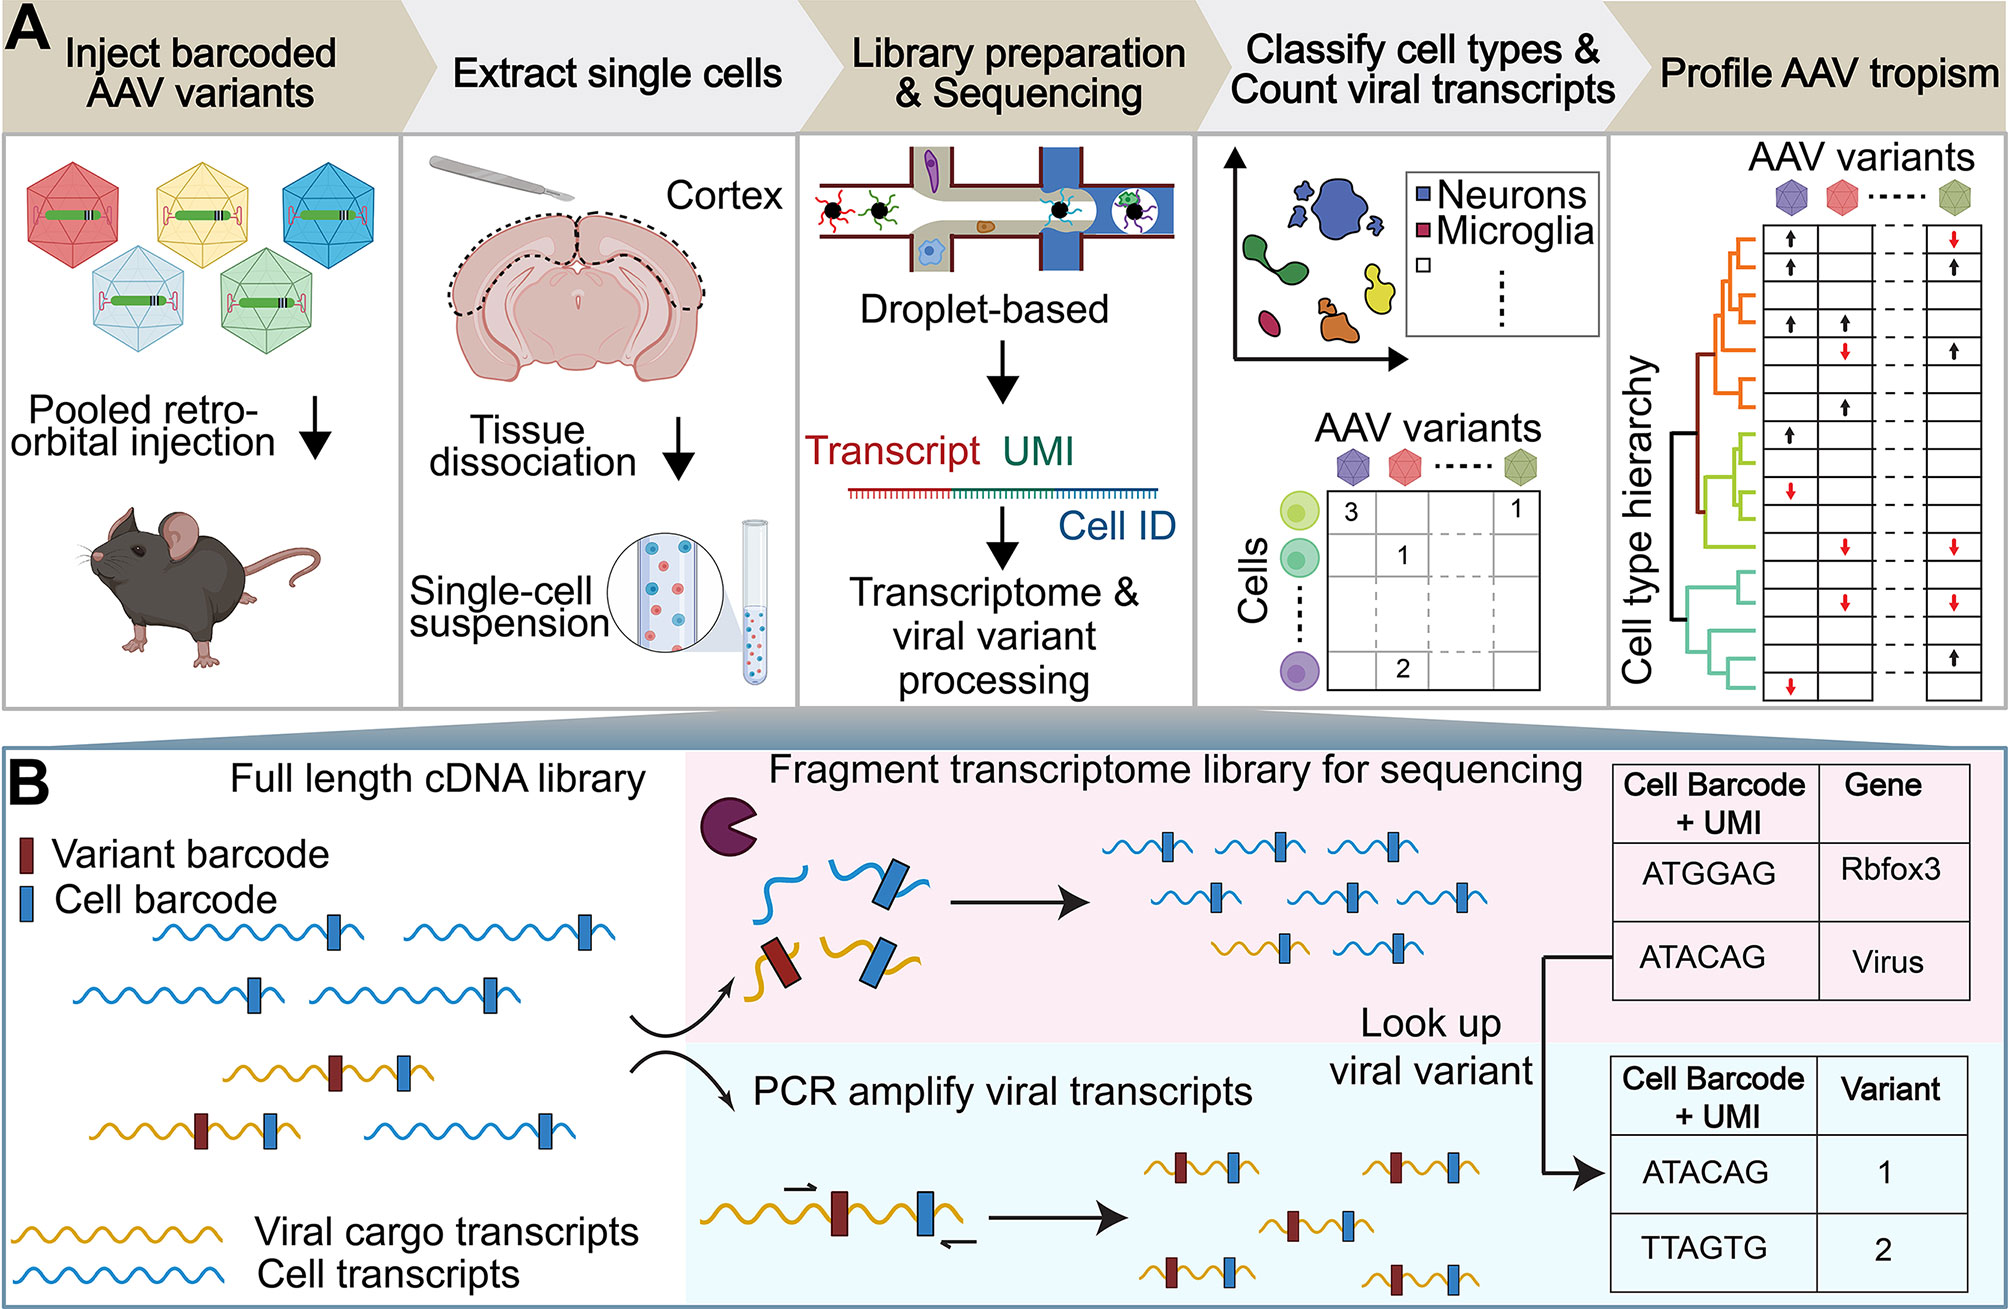
Figure 1 Workflow of AAV tropism characterization by scRNA-seq. (A) (I) Injection of a single AAV variant or multiple barcoded AAV variants into the retro-orbital sinus. (II) After 3–4 weeks post-injection, the brain region of interest is extracted and the tissue is dissociated into a single-cell suspension. (III) The droplet-based 10x Genomics Chromium system is used to isolate cells and build transcriptomic libraries [see (B)]. (IV) Cells are assigned a cell-type annotation and a viral transcript count. (V) AAV tropism profiling across numerous cell types. (B) The full length cDNA library is fragmented for sequencing as part of the single-cell sequencing protocol (top). To enable viral tropism characterization of multiple rAAVs in parallel, an aliquot of the intact cDNA library undergoes further PCR amplification of viral transcripts (bottom). During cDNA amplification, Illumina sequencing primer targets are added to the viral transcripts such that the sequence in between the Illumina primer targets contains the AAV capsid barcode sequence. Viral cargo in the cell transcriptome is converted to variant barcodes by matching the corresponding cell barcode + UMI in the amplified viral transcript library (right).
In the initial validation experiment, we quantify the transduction biases of AAV-PHP.eB and AAV.CAP-B10 across major cell types using scRNA-seq, and demonstrate results which correlate well with both published results and conventional IHC-based quantification. We then demonstrate the power of the transcriptomic approach by going beyond the major cell types to reveal significant differences in cell-subtype transduction specificity. Compared with AAV.CAP-B10, AAV-PHP.eB displays biased targeting of inhibitory neurons, and both variants transduce Sst+ or Pvalb+ inhibitory neurons more efficiently than Vip+ inhibitory neurons. We validate these results with fluorescent in situ hybridization – hybridization chain reaction (FISH-HCR). We then develop and validate a barcoding strategy to investigate the tropism of AAV-PHP.V1 relative to AAV-PHP.eB in non-neuronal cells and reveal that pericytes, a subclass of vascular cells, evade transduction by this and other variants. We further use scRNA-seq to profile cell-type-specific responses to AAV-PHP.eB at 3 and 25 days post-injection (DPI), finding numerous genes implicated in the p53 pathway in endothelial cells to be upregulated at 3 DPI and returning back to control levels at 25 DPI. Finally, we showcase the capabilities of parallel characterization by verifying the preceding findings in a single animal with seven co-injected AAV variants and revealing their respective cell-type biases.
2 Results
2.1 Multiplexed Single-Cell RNA Sequencing-Based AAV Profiling Pipeline
To address the current bottleneck in AAV tropism profiling, we devised an experimental and computational workflow (Figure 1A) that exploits the transcriptomic resolution of scRNA-seq to profile the tropism of multiple AAV variants across complex cell-type hierarchies. In this workflow, single or multiple barcoded rAAVs are injected into the retro-orbital sinus of mice followed by tissue dissociation, single-cell library construction using the 10X Genomics Chromium system, and sequencing with multiplexed Illumina next-generation sequencing (NGS) (69). The standard mRNA library construction procedure includes an enzymatic fragmentation step that truncates the cDNA amplicon such that its final size falls within the bounds of NGS platforms (Figure 1B). These cDNA fragments are only approximately 450 bp in length and, due to the stochastic nature of the fragmentation, sequencing from their 5’ end does not consistently capture any particular region. The fragment length limit and heterogeneity pose a problem for parallelizing AAV tropism profiling, which requires reliable recovery of regions of the transgene that identify the originating AAV capsid. For example, posttranscriptional regulatory elements, such as the 600 bp Woodchuck hepatitis virus posttranscriptional regulatory element (WPRE), are commonly placed at the 3’ end of viral transgenes to modulate transgene expression. The insertion of such elements pushes any uniquely identifying cargo outside the 450 bp capture range, making them indistinguishable based on the cDNA library alone (Supplemental Figure 1A). An alternative strategy of adding barcodes in the 3’ polyadenylation site also places the barcode too distant for a 5’ sequencing read, and reading from the 3’ end would require sequencing through the homopolymeric polyA tail, which is believed to be unreliable in NGS platforms (91, 92).
We circumvented these limitations in viral cargo identification by taking an aliquot of the intact cDNA library and adding standard Illumina sequencing primer recognition sites to the viral transcripts using PCR amplification such that the identifying region is within the two Illumina primer target sequences (e.g. Figure 2B). The cell transcriptome aliquots undergoing the standard library construction protocol and the amplified viral transcripts are then sequenced as separate NGS libraries. We sequence shorter viral transcripts in the same flow cell as the cell transcriptomes and longer viral transcripts on the Illumina MiSeq, which we found to be successful at sequencing cDNAs up to 890 bp long. The sequencing data undergoes a comprehensive data processing pipeline (see Methods). Using a custom genome reference, reads from the cell transcriptome that align to the viral cargo plasmid sequences are counted as part of the standard 10X Cell Ranger count pipeline (see Methods and Supplemental Figure 1C). In parallel, reads from the amplified viral transcripts are used to count the abundance of each viral barcode associated with each cell barcode and unique molecular identifier (UMI). The most abundant viral barcode for each cell barcode and UMI is assumed to be the correct viral barcode, and is used to construct a variant lookup table. This lookup table approach identifies an originating capsid in 65.7 ± 2.3% of viral transcripts detected in the cell transcriptome aliquots (Supplemental Table 4).
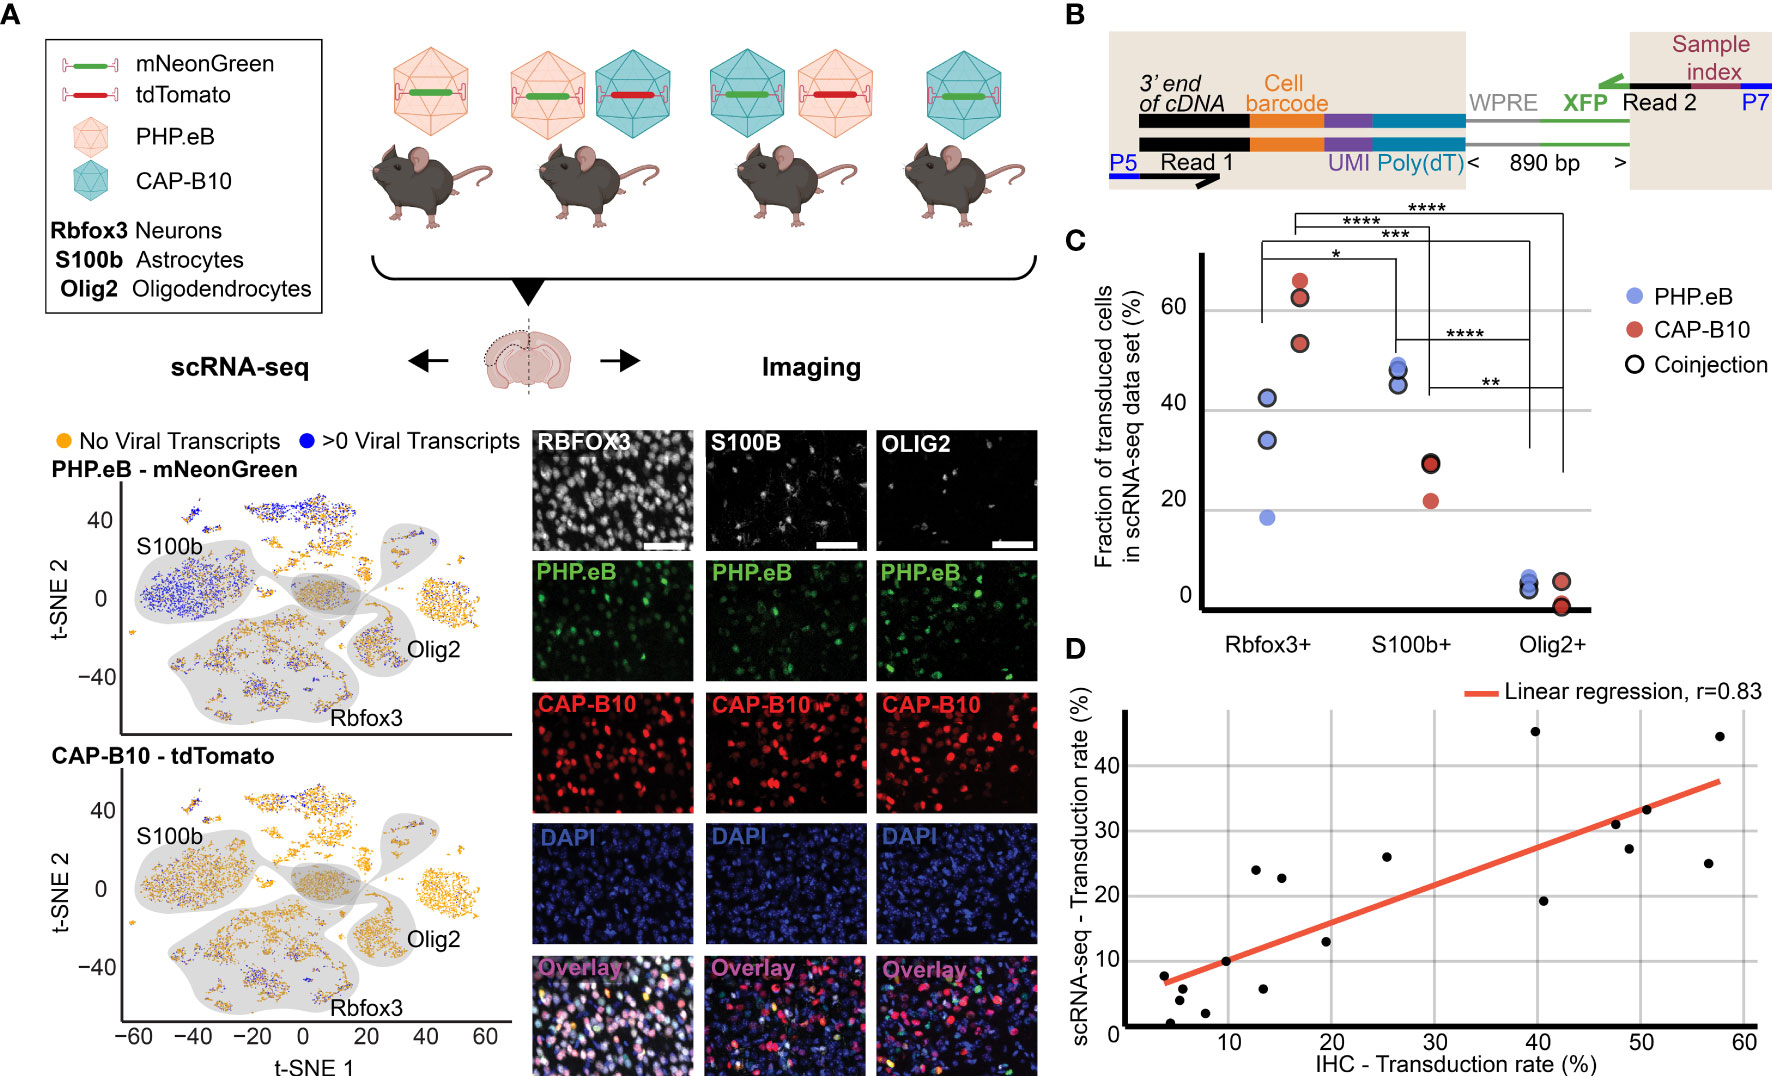
Figure 2 Comparison of viral tropism profiling with traditional IHC and scRNA-seq. (A) Overview of the experiment. Four animals were injected with 1.5 × 10¹¹ viral genomes (vg) packaged in AAV-PHP.eB and/or AAV.CAP-B10. The bottom panels show a representative dataset collected from an animal that was co-injected with AAV-PHP.eB and AAV.CAP-B10. The left side displays the scRNA-seq dataset in the lower dimensional t-SNE space, with cells colored according to presence of viral transcripts. The shaded areas indicate clusters with high expression of the corresponding gene marker. The right side shows representative confocal images of cortical tissue labeled with IHC. Scale bar, 50 µm. (B) Viral transcript recovery strategy. The shaded areas highlight sequences added during library construction. (C) The fraction of the total number of transduced cells labeled as expressing the corresponding marker gene. For each AAV variant, the results of a two-way ANOVA with correction for multiple comparisons using Sidak’s test are reported with adjusted P-values (****P ≤ 0.0001, ***P ≤ 0.001, and **P ≤ 0.01, and *P ≤ 0.05 are shown; P > 0.05 is not shown). (D) Comparison of transduction rates based on quantification via scRNA-seq or IHC. Transduction rate in IHC was calculated as (number of transduced cells in the group)/(total number of cells in the group). Transduction rate in scRNA-seq is based on an estimate of the fraaction of cells containing transcripts above background (see Methods). Each dot represents the transduction rate of neurons/Rbfox3+, astrocytes/S100b+, or oligodendrocytes/Olig2+ by AAV-PHP.eB or AAV.CAP-B10 in one animal. Histology data are averages across three brain slices per gene marker and animal. r indicates the Pearson correlation coefficient.
For determining viral cell-type tropism, we developed a method to estimate the fraction of cells within a cell type that express viral transcripts. Viral RNA expression levels depend on both the multiplicity of infection and the transcription rate of the delivered cargo. Thus, directly using viral RNA counts to determine tropism is confounded by differences in transcription rate between cell types, limiting comparison with imaging-based tropism quantification methods. As evidence of this, we detected that viral RNA expression levels can vary by cell type but are not perfectly rank correlated with the percent of cells detected as expressing that transcript (Supplemental Figure 2B). An additional confound arises from the ambient RNA from cellular debris co-encapsulated with cell-containing droplets, which can lead to false positives, i.e., detecting viral RNA in droplets containing a cell that was not expressing viral RNA. For example, we detected low levels of viral transcripts in large percentages of cells, even in cell types suspected to evade transduction, such as immune cells (Supplemental Figure 2A). To reduce the effect of both variability in expression and ambient RNA, we developed an empirical method to estimate the percentage of cells expressing transcripts above the noise, wherein the distribution of viral transcript counts in a set of cells of interest is compared to a background distribution of cell-free (empty) droplets (see Methods, Supplemental Figure 2C). In simulation, this method accurately recovers the estimated number of cells expressing transcripts above background across a wide range of parameterizations of negative binomial distributions (see Methods, Supplemental Figure 2D). Importantly, this method can yield a different ranking of viral tropism as compared to mean transcript expression rate (Supplemental Figure 2E).
To address several additional technical problems in default single-cell pipelines, we developed a simultaneous quality control (QC) and droplet identification pipeline. Our viral transduction rate estimation method described above relies on having an empirical background distribution of viral transcript counts in empty droplets to compare against the cell type of interest. However, the default cell vs. empty droplet identification method provided by the 10X Cell Ranger software, which is based on the EmptyDrops method (73), yielded unexpectedly high numbers of cells and clusters with no recognizable marker genes, suggesting they may consist of empty droplets of ambient RNA or cellular debris (Supplemental Figures 3A, B). Additionally, we sought to remove droplets containing multiple cells (multiplets) from our data due to the risk of falsely attributing viral tropism of one cell type to another. However, using Scrublet (93), an established method for identifying droplets containing multiplets, failed to identify multiplets in some of our samples and only identified small proportions of clusters positive for known non-overlapping marker genes, such as Cldn5 and Cx3cr1 (Supplemental Figure 3C). To address both the empty droplet and multiplet detection issues, we built a droplet classification pipeline based on scANVI, a framework for classifying single-cell data via neural-network-based generative models (94). Using clusters with a high percentage of predicted multiplets from Scrublet as training examples of multiplets, and clusters positive for known neuronal and non-neuronal marker genes as training examples of neurons and non-neuronal cells, we trained a predictive model to classify each droplet as a neuron, non-neuron, multiplet, or empty droplet (see Methods, Supplemental Figure 4A). This model performed with 97.4% accuracy on 10% of cells held out for testing, and yielded a database of 334,151 cortical cells (Supplemental Figure 4B). Inspection of the cells classified as empty droplets reveals that these droplets have lower transcript counts and higher mitochondrial gene ratios, consistent with other single-cell quality control pipelines (Supplemental Figure 4D). Critically, we discovered that non-neuronal clusters contained significantly more cells that had been previously removed by the Cell Ranger filtering method as compared to neuronal clusters (P = 0.025, 2-sided student t-test). In some clusters within cell subtypes, such as mature oligodendrocytes and endothelial cells, we identified up to 67% more cells than what were recovered via Cell Ranger.
Using our combined experimental and computational pipeline for viral transcript recovery and droplet identification, we can recover a lower bound on the expected number of cells expressing each unique viral cargo within groups of cells in heterogeneous samples.
2.2 Single-Cell RNA Sequencing Recapitulates AAV Capsid Cell-Type-Specific Tropisms
As a first step, we validated our method by comparing the quantification of AAV transduction of major cell types via scRNA-seq to conventional IHC. For this purpose, we characterized the tropism of two previously reported AAV variants, AAV-PHP.eB (32) and AAV.CAP-B10 (90) (Figure 2A). In total, four animals received single or dual retro-orbital injections of AAV-PHP.eB and/or AAV.CAP-B10 with 1.5 × 10¹¹ viral genomes (vg) per variant. Co-injection of both variants served to test the ability of our approach to parallelize tropism profiling. By having each variant package a distinct fluorophore, tropism could be simultaneously assessed via multi-channel fluorescence and mRNA expression of the distinct transgene. After 3–4 weeks of expression, we harvested the brains and used one hemisphere for IHC and one hemisphere for scRNA-seq. To recover viral transcripts, we chose primers such that enough of the XFP sequence was contained within the Illumina primer target sequences to differentiate the two variants (Figure 2B, Supplemental Table 1). For this comparison, we focused on the transduction rate for neurons (Rbfox3), astrocytes (S100b), and oligodendrocytes (Olig2). For IHC, a cell was classified as positive for the marker gene on the basis of antibody staining, and was classified as transduced on the basis of expression of the delivered fluorophore. For scRNA-seq, all cells that passed our QC pipeline were projected into a joint scVI latent space and clustered. To most closely match our imaging quantification, we considered all clusters that were determined to be positive for the respective marker gene as belonging to the corresponding cell type (see Methods). All clusters of the same marker gene were grouped together, and the transduction rate of the combined group of cells was determined using our viral transduction rate estimation method.
Our analysis of the scRNA-seq data demonstrates that the viral tropism biases across the three canonical marker genes are consistent with previous reports (Figure 2C) (32, 90). In contrast to AAV-PHP.eB, AAV.CAP-B10 preferentially targets neurons over astrocytes and oligodendrocytes. No marked discrepancies in viral tropism characterization were observed with single versus dual injections.
To quantify the similarity of the AAV tropism characterizations obtained with IHC and scRNA-seq, we directly compared the transduction rate of each AAV variant for every cell type and its corresponding marker gene (i.e., Rbfox3, S100b, or Olig2) as determined by each technique and noticed a good correlation (Figure 2D). Despite the different underlying biological readouts–protein expression in IHC and RNA molecules in labeled cell types for scRNA-seq–the two techniques reveal similar viral tropisms.
2.3 Tropism Profiling at Transcriptomic Resolution Reveals AAV Variant Biases for Neuronal Subtypes
After validating our approach against the current standard of AAV tropism characterization (IHC imaging), we scrutinized the tropism of AAV-PHP.eB and AAV.CAP-B10 beyond the major cell types (Figure 3). Since AAV.CAP-B10 has increased neuronal bias relative to AAV-PHP.eB, we first sought to understand if there were neuronal subtypes that were differentially responsible for this bias. However, in-depth cell typing of transcriptomes collected from tissues with numerous and complex cell types, such as neurons in the brain, requires expert knowledge of the tissue composition, time to manually curate the data, and the availability of large datasets (66). To minimize the burden of manual annotation, computational tools have been developed that use previously-annotated single-cell databases to predict the cell type of cells in new, unannotated single-cell experiments, even across single-cell platforms (94, 96, 97). We decided to leverage these tools and expanded our marker gene-based cell typing approach by having more complicated or well-established cell types be assigned based on annotations in a reference dataset (Supplemental Figure 4A). To this end, we again employed scANVI to construct a joint model of cells from our samples and cells from an annotated reference database. For this model, we used the Mouse Whole Cortex and Hippocampus 10x v2 dataset available from the Allen Brain Institute (95). Since this is a neuron-enriched dataset, we constructed the model using only the 125,341 cells in our dataset classified as neurons from our marker-based QC pipeline combined with the 561,543 neuronal cells from cortical regions from the reference database. We trained this model to predict to which of 14 neuron subtype groupings each cell belonged. We held out 10% of the data for testing: the model performed with 97.9% classification accuracy on the held-out data. We then applied the model to predict the neuron subtypes of our cells.
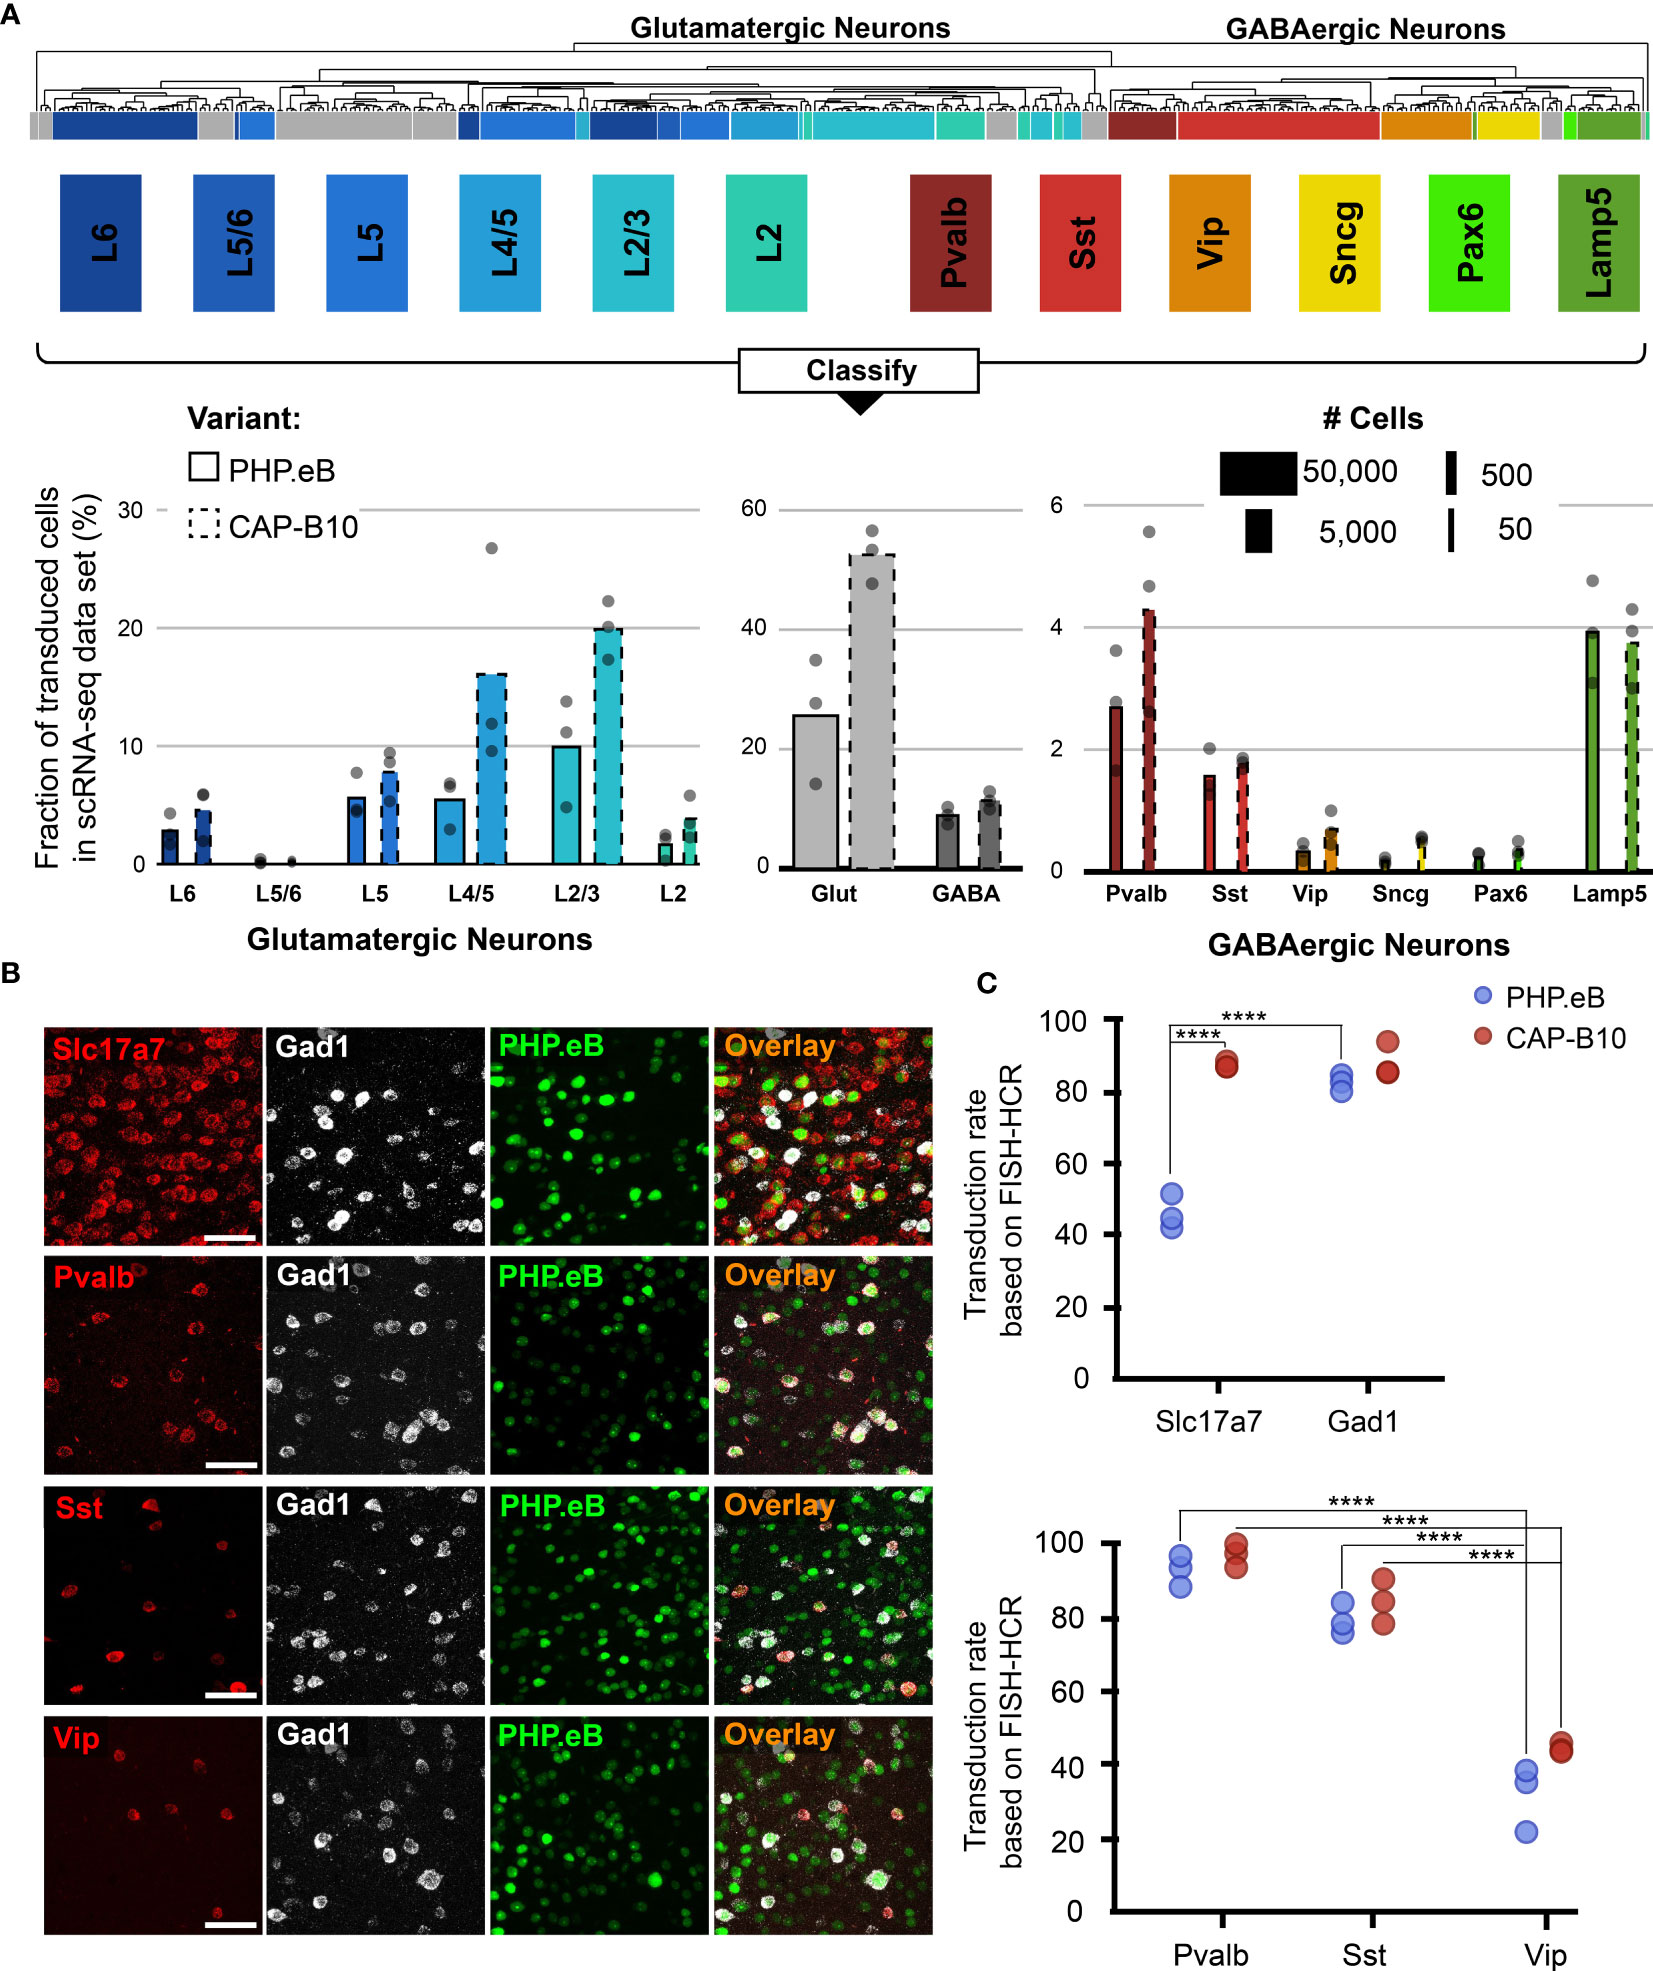
Figure 3 In-depth AAV tropism characterization of neuronal subtypes at transcriptomic resolution. (A) Viral tropism profiling across neuronal subtypes. Neuronal subtype annotations are predicted by a model learned from the Allen Institute reference dataset using scANVI (94, 95). Each dot represents data from one animal injected with AAV-PHP.eB and/or AAV.CAP-B10. Bar width indicates the total number of cells of a particular cell type present in our dataset. (B) Representative confocal images of cortical tissue from an animal injected with 1.5 × 10¹¹ vg of AAV-PHP.eB. Tissue was labeled with FISH-HCR for gene markers of glutamatergic neurons (Slc17a7) and GABAergic neurons (Gad1, Pvalb, Sst, Vip). AAV-PHP.eB shows the endogenous fluorescence of mNeonGreen. Scale bar, 50 µm. (C) Confirmation of viral tropism biases across neuronal subtypes using FISH-HCR (3 mice per AAV variant, 1.5 × 10¹¹ vg dose). Dots represent the average values across three brain slices from one animal. Results from a two-way ANOVA with correction for multiple comparisons using Tukey’s test is reported with adjusted P-values (****P ≤ 0.0001; and P > 0.05 is not shown on the plot).
During our in-depth characterization, we discovered several previously unnoticed cell-subtype biases for AAV-PHP.eB and AAV.CAP-B10 (Figure 3A). Starting at the top of our neuronal hierarchy, the fraction of transduced cells that were glutamatergic neurons was markedly reduced for AAV-PHP.eB compared with AAV.CAP-B10 (P = 0.03, 2-sided student t-test, corrected for 2 neuron subtype comparisons). Furthermore, Pvalb+ and Sst+ inhibitory neurons both represented a larger fraction of transduced cells than Vip+ inhibitory neurons (adjusted P = 0.0009, P = 0.045, respectively, two-way ANOVA with multiple comparison correction for inhibitory neuron subtypes using Tukey’s method).
To confirm these tropism biases in neuronal subtypes with a traditional technique, we performed FISH-HCR for glutamatergic and GABAergic gene markers (Figure 3B) (98, 99). As indicated by our scRNA-seq data, AAV.CAP-B10, when compared with AAV-PHP.eB, has increased transduction efficiency of glutamatergic neurons (SLC17A7). Furthermore, FISH-HCR verified the downward trend in transduction efficiency from Pvalb+, to Sst+, to Vip+ neurons in both AAV variants (Figure 3C).
2.4 Pooled AAVs Packaging Barcoded Cargo Recapitulate the Non-Neuronal Tropism Bias of PHP.V1
To enable profiling viral variants in parallel without needing distinct transgenes per variant, we established a barcoding strategy whereby we package AAV variants with the same transgene and regulatory elements but with short, distinguishing nucleotide sequences within the 3’ UTR (Figure 4A). To verify that this barcoding strategy can recover tropisms consistent with our previous transgene-based capsid-identification strategy, we performed a set of experiments to re-characterize the tropism of AAV-PHP.eB in parallel with that of the recently developed AAV-PHP.V1, which has increased specificity for vascular cells over AAV-PHP.eB (45).
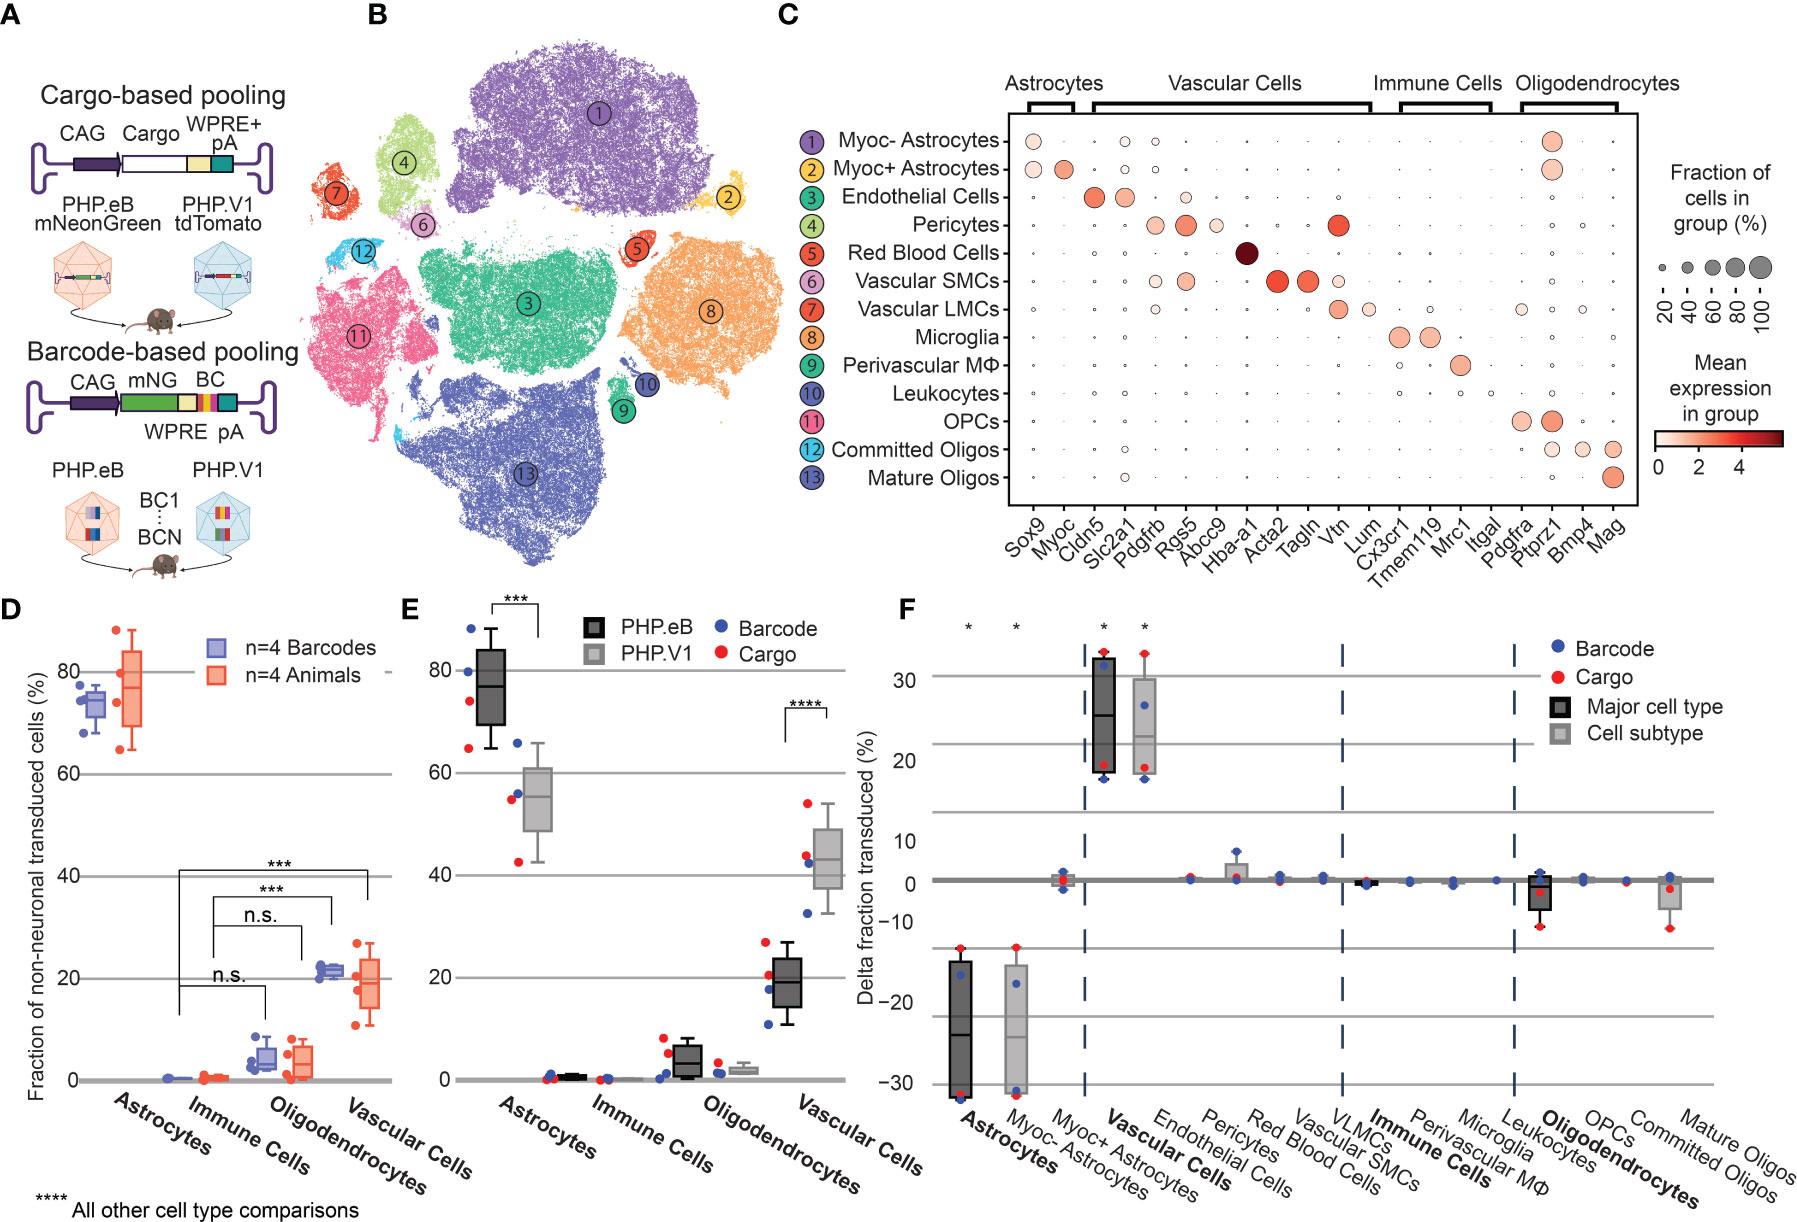
Figure 4 Barcoded co-injected rAAVs reveal the non-neuronal tropism bias of AAV-PHP.V1. (A) Experimental design for comparing barcode vs cargo-based tropism profiling. Animals received dual injections of AAV-PHP.eB and AAV-PHP.V1, carrying either distinct fluorophores (cargo) or the same fluorophore with distinct barcodes. (B) t-SNE projection of the single-cell Variational Inference (scVI) latent space of cells and their cell type classification of the 176,724 labeled non-neuronal cells across all our samples. Each number corresponds to the cell type labeled in (C). (C) Marker genes used to identify non-neuronal cell types. Darker colors indicate higher mean expression, and dot size correlates with the abundance of the gene in that cell type. (D) The distribution of non-neuronal cells expressing transcripts from AAV-PHP.eB across 4 barcodes within one animal (blue) and across 5 animals (red). All animals received dual injections, with one of the vectors being 1.5 x 10¹¹ vg of PHP.eB carrying CAG-mNeonGreen. The y-axis represents the fraction of transduced non-neuronal cells that are of the specified cell type. (***P≤ 0.001 and P > 0.05 (n.s.) is shown; all other cell-type comparisons within a paradigm were significant at P ≤ 0.0001). (E) The distribution of non-neuronal cells expressing transcripts from AAV-PHP.eB (black) and AAV-PHP.V1 (gray). Results from the different experimental paradigms are combined. Results shown are from a two-way ANOVA with correction for multiple comparisons using Sidak’s test comparing transduction by AAV-PHP.eB to AAV-PHP.V1 for each cell type, with adjusted P-values (****P ≤ 0.0001, ***P ≤ 0.001 is shown; P > 0.05 is not shown). (F) Within-animal difference in the fraction of cells transduced with AAV-PHP.V1 relative to AAV-PHP.eB across four animals, two from each experimental paradigm. For each cell type in each sample, the combined 2-proportion z score for the proportion of that cell type transduced by AAV-PHP.V1 vs AAV-PHP.eB is reported. Cell types with fewer than 2 cells transduced by both variants were discarded. Z scores were combined across multiple animals using Stouffer’s method and corrected for multiple comparisons. Cell-type differences with an adjusted P-value below 0.05 are indicated with *.
We produced AAV-PHP.eB carrying CAG-mNeonGreen and AAV-PHP.V1 carrying either CAG-mRuby2 or CAG-tdTomato. Additionally, we produced AAV-PHP.eB and AAV-PHP.V1 both carrying CAG-mNeonGreen with 7-nucleotide barcodes 89 bp upstream of the polyadenylation start site such that they did not interfere with the WPRE. We ensured each barcode had equal G/C content, and that all barcodes were Hamming distance 3 from each other (Supplemental Table 5). Each of the barcoded variants was packaged with multiple barcodes that were pooled together during virus production. Four animals received a retro-orbital co-injection of 1.5 x 10¹¹ vg/each of AAV-PHP.V1 and AAV-PHP.eB. Two animals received viruses carrying separate fluorophores (cargo-based), and two animals received viruses carrying the barcoded cargo (barcode-based). For amplification of the viral cDNA in the animals receiving the barcoded cargo, we used primers closer to the polyA region such that the sequencing read covered the barcoded region (Supplemental Table 1). During the single-cell sequencing dissociation and recovery, one of our dissociations resulted in low recovery of neurons (Supplemental Figure 4C); thus, we investigated only non-neuronal cells for this experiment.
Despite variability in the total transgene RNA content between barcodes of the same variant (Supplemental Figure 5A), the estimated percent of cells expressing the transgene within each cell type was consistent between barcodes within a single animal, with standard deviations ranging from 0.002 to 0.056 (Supplemental Figure 6A). Our analysis of both the barcode-based animals and cargo-based animals shows the same bias in non-neuronal tropism, with AAV-PHP.eB significantly preferring astrocytes over oligodendrocytes, vascular cells, and immune cells (Figure 4D). Interestingly, our analysis also revealed that the variance between barcodes within an animal was less than the variance between animals, even when controlling for cargo and dosage (P = 0.030, Bartlett’s test, P-values combined across all variants and cell types using Stouffer’s method, weighted by transduced cell type distribution). This is not surprising, since we found differences in cell type distribution alone can account for up to 58% of the perceived variability in tropism bias (Supplemental Figure 6B).
Next, we investigated the distribution of cells transduced by AAV-PHP.eB vs AAV-PHP.V1 in the major non-neuronal cell types across both barcode-based and cargo-based paradigms (Figure 4E). The single-cell tropism data confirms the previously-established finding that AAV-PHP.V1 has a bias toward vascular cells relative to AAV-PHP.eB. Additionally, we uncovered that this is coupled with a bias away from astrocytes relative to AAV-PHP.eB, but that transduction bias of oligodendrocytes and immune cells did not differ between the variants. To investigate for a specific effect of the barcoding strategy, we performed a three-way ANOVA across the variant, cell type, and experimental paradigm factors. We found that the cell type factor accounted for 87.80% of the total variation, the combined cell type + variant factor accounted for 8.39% of the total variation, and the combined cell type + experimental paradigm factor accounted for only 2.36% of the total variation, confirming our hypothesis that barcoded pools can recover tropism with minimal effect.
2.5 Relative Tropism Biases Reveal Non-Neuronal Subtypes With Reduced AAV Transduction
To further characterize the tropism biases of AAV-PHP.V1 and expand our method to less well-established cell hierarchies, we explored the non-neuronal cell types in our dataset. Since the Allen Brain Institute reference database that we used to investigate neuronal tropism was enriched for neurons, it does not contain enough non-neuronal cells to form a robust non-neuronal cell atlas. Our combined dataset consists of 203,661 non-neuronal cells, making it large enough to establish our own non-neuronal cell clustering. Thus, we performed an additional round of automatic clustering on the cells classified as non-neuronal in our combined dataset, and identified 13 non-neuronal cell subtypes based on previously established marker genes (Figures 4B, C and Supplemental Table 2).
Most cell subtypes had multiple clusters assigned to them, which suggested there may be additional subtypes of cells for which we did not find established marker genes. To determine whether any of these clusters delineated cell types with distinct transcriptional profiles, we investigated the probability of gene expression in each cluster compared to the other clusters of the same cell subtype (see Methods). Our approach determined two subclusters of pericytes and astrocytes. Both clusters of pericytes had strong expression of canonical pericytes marker genes Rgs5, Abcc9, and Higd1b. However, one of the clusters had no marker genes that made it distinct from the other pericyte cluster, nor from endothelial cells. Consistent with previous reports, this suggests that this cluster could be pericytes contaminated with endothelial cell fragments, and thus was not considered for further analysis (100–102). Two distinct groups of astrocytes were detected, one of which had unique expression of Myoc and Fxyd6. Using these new marker genes, we expanded our non-neuronal cell taxonomy to 13 cell types, now including Myoc+ and Myoc- astrocytes.
Given our finding that inter-sample variability exceeds intra-sample variability, we established a normalization method for comparing transduction biases between variants co-injected into the same animal. This normalization–calculating the difference in the fraction of transduced cells between variants–captures the relative bias between variants, instead of the absolute tropism of a single variant (see Methods). By considering the relative bias between variants, we are able to interrogate tropism in a way that is more robust to inter-sample variability that arises from different distributions of recovered cells, expression rate of delivered cargo, and success of the injection. Using this normalization method, we evaluated the non-neuronal cell type bias of AAV-PHP.V1 relative to AAV-PHP.eB in both the cargo-based animals and the barcode-based animals across our non-neuronal cell-type taxonomy (Figure 4F). We discovered that the bias of AAV-PHP.V1 for vascular cells is driven by an increase in transduction of endothelial cells, but not pericytes. Similarly, AAV-PHP.V1’s bias away from astrocytes is driven by a decrease in transduction of Myoc- astrocytes, but not Myoc+ astrocytes. Further inspection of the transduction of pericytes and Myoc+ astrocytes revealed that pericytes are not highly transduced by any of the AAVs tested in this work, and that Myoc+ astrocytes have both lower viral transcript expression and lower abundance than Myoc- astrocytes, and thus do not contribute significantly to tropism (Supplemental Figures 4, 7A, B).
2.6 Single-Cell RNA Sequencing Reveals Early Cell-Type-Specific Responses to IV Administration of AAV-PHP.eB That Return to Baseline by 3.5 Weeks
To investigate the temporal cell-type-specific transcriptional effects of systemic AAV delivery and cargo expression, we performed a single-cell profiling experiment comparing animals injected with AAV to saline controls. We injected six male mice with AAV-PHP.eB (1.5 x 10¹¹ vg) carrying mNeonGreen, and performed single-cell sequencing on three mice three days post-injection (3 DPI) and three mice twenty-five days post-injection (25 DPI). These time points were chosen based on previous work showing MHC presentation response peaking around day seven and transgene response peaking around day 30 (89). Three saline control mice were processed 3 DPI. We then analyzed differential gene expression for each cell type between injected animals and controls using DESeq2 (Supplemental Table 8). Of note, we excluded cell types with less than 50 cells in each sample, and excluded leukocytes and red blood cells given the risk of their presence due to dissociation rather than chemokine mediated infiltration. Additionally, we collapsed subtypes of excitatory neurons, inhibitory neurons, and OPCs to have greater than 50 cells for differential expression analysis. We estimated viral transduction rate of AAV-PHP.eB using its delivered cargo, mNeonGreen, across cell types and time points. We identified that Myoc- astrocytes have significantly higher estimated transduction rate at 25 DPI compared to 3 DPI (adjusted P-value = 0.0438, two-way ANOVA with multiple comparison correction using Sidak’s method). It is also worth noting that endothelial cells have a similar transduction rate between the time points in all animals, while one of the animals at 25 DPI exhibited higher transduction in neurons (Figure 5A). The number of statistically relevant genes between the injected and control group (adjusted P-value < 0.05, DESeq2) were highest in endothelial cells (41 genes) at 3 DPI, followed by inhibitory neurons (9 genes) at 25 DPI (Figure 5B) (adjusted P-value < 0.05, DESeq2).
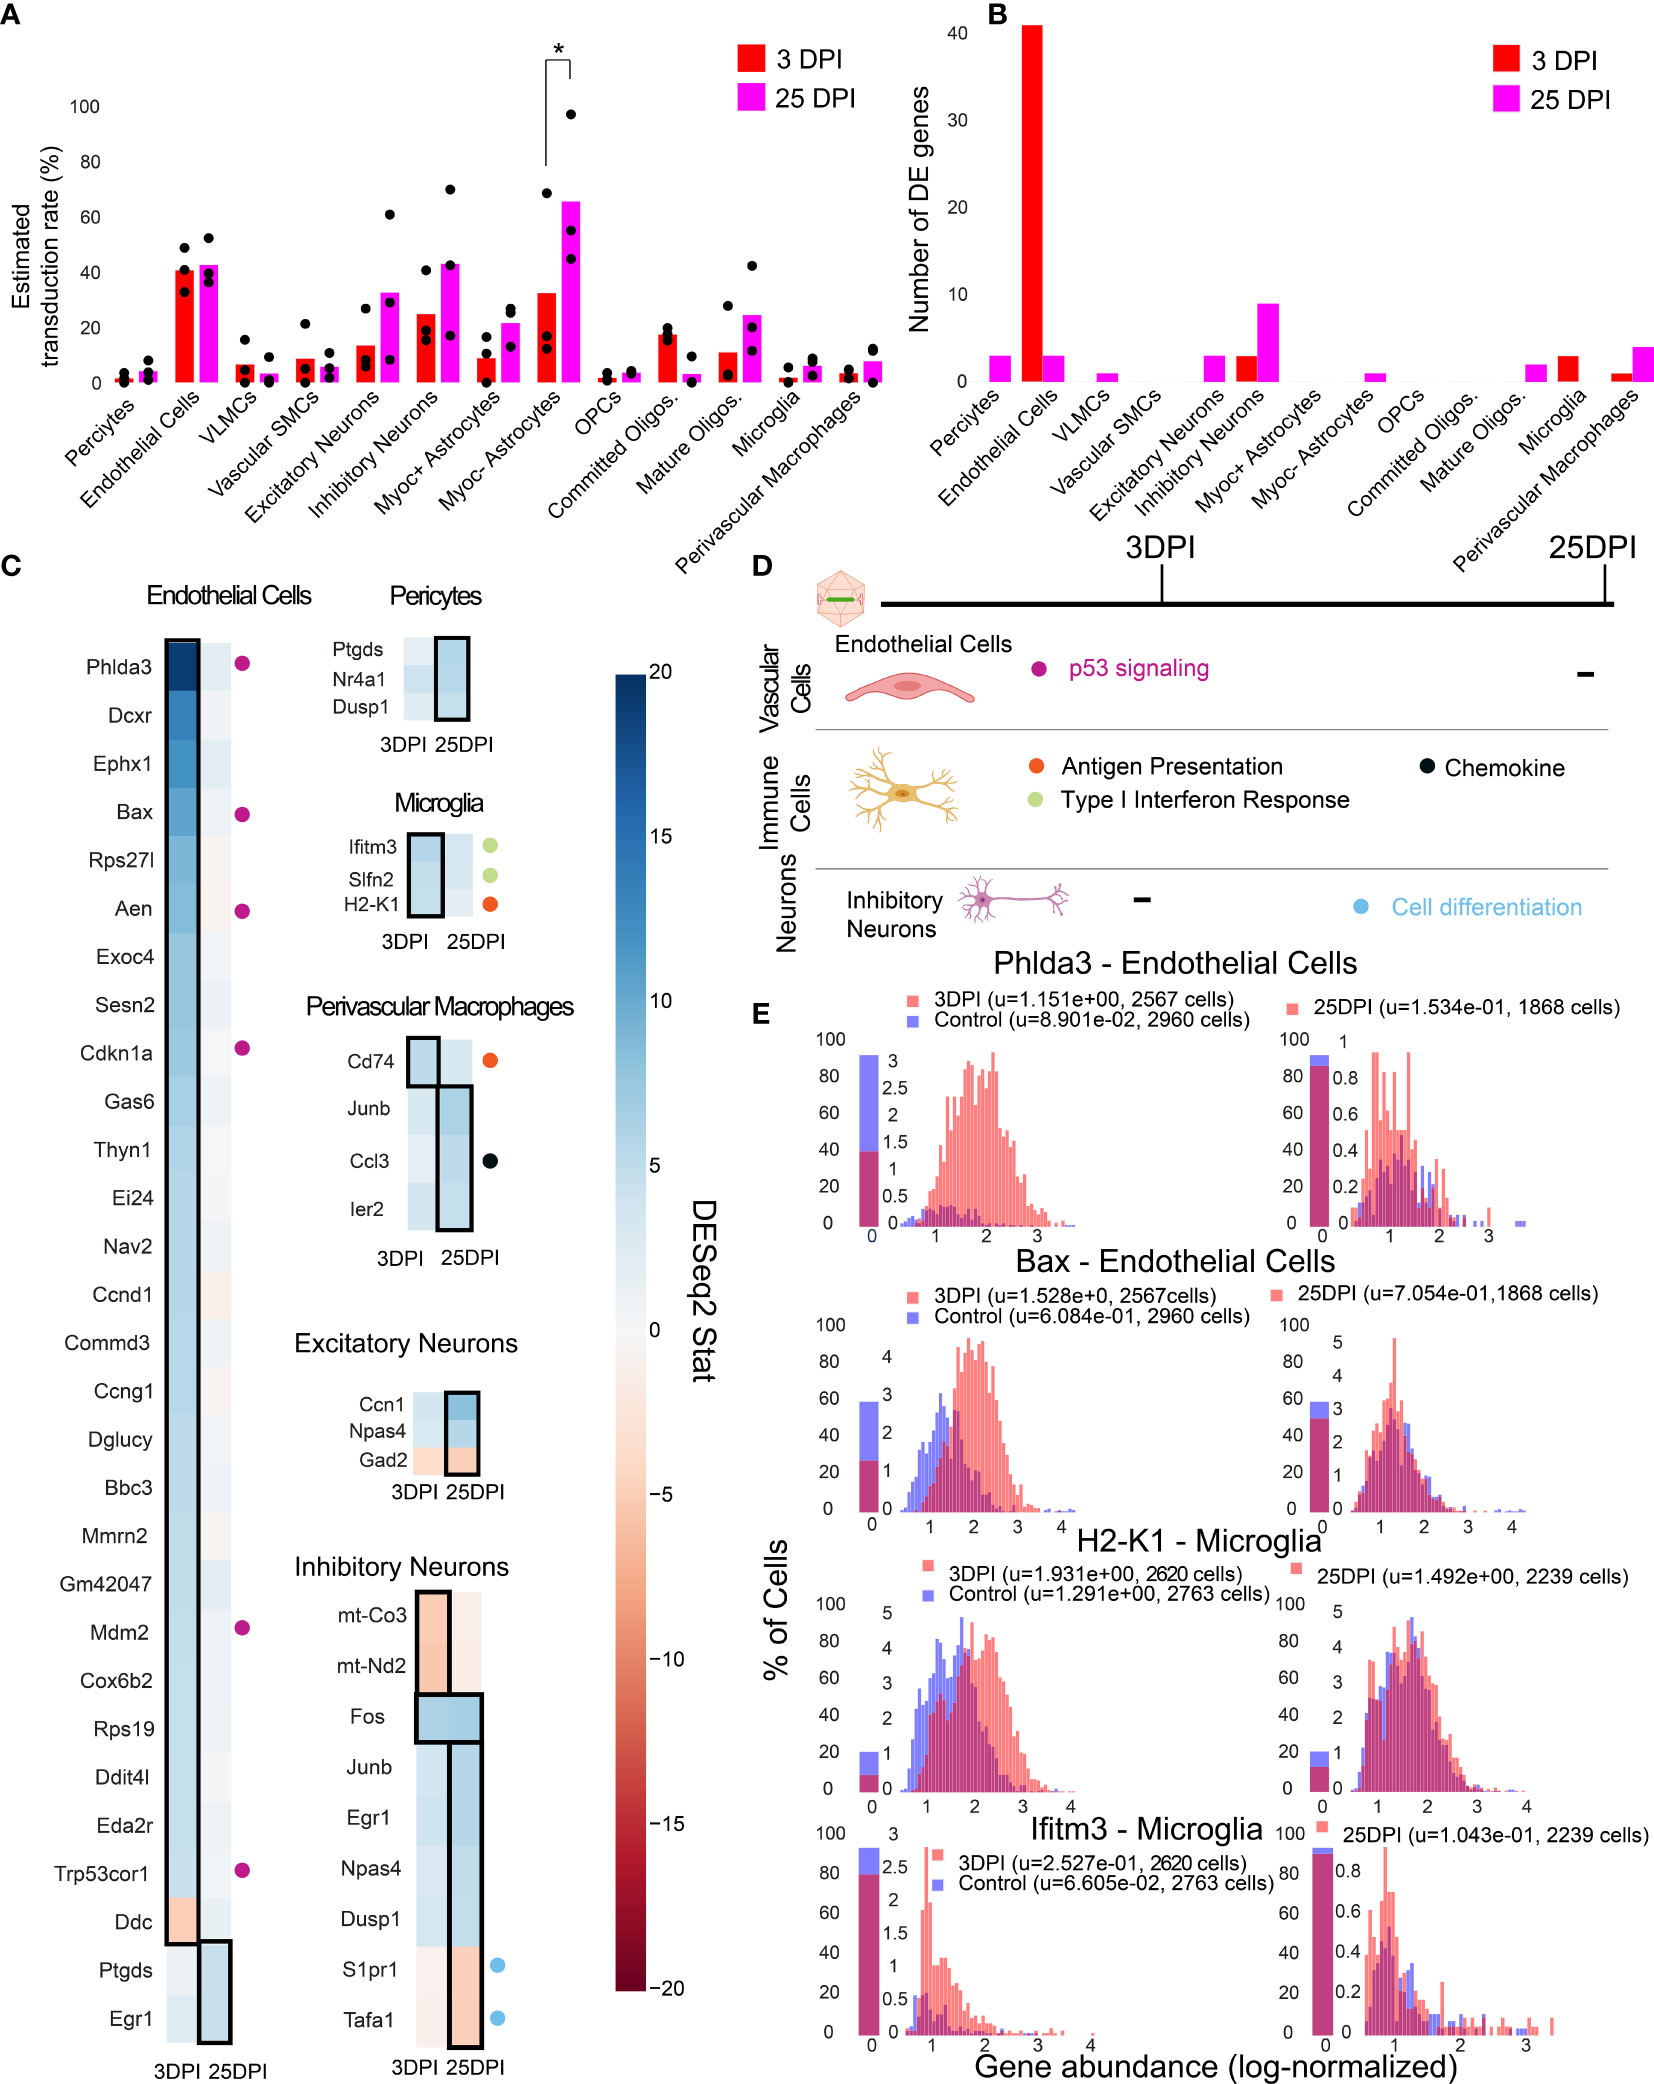
Figure 5 Single-cell gene expression profiling finds cell-type-specific responses to AAV transduction in endothelial cells. (A) Estimated transduction rate (%) of mNeonGreen cargo at three and twenty-five days post-injection (DPI). Results from a two-way ANOVA with correction for multiple comparisons using Sidak’s method is reported with adjusted P-values (*P ≤ 0.05 is shown; and P > 0.05 is not shown on the plot). (B) Number of differentially expressed genes (adjusted P-value < 0.05, DESeq2) at 3 DPI and 25 DPI across 3 animals. (C) Differentially expressed genes across the two time points in endothelial cells, pericytes, microglia, perivascular macrophages, inhibitory neurons, and excitatory neurons. Color indicates DESeq2 test statistic with red representing downregulation and blue representing upregulation. Genes outlined by a black rectangle are determined to have statistically significant differential expression compared to controls (adjusted P-value < 0.05, DESeq2, after Benjamini/Hochberg multiple comparison correction across all cell types and conditions). Colored circles adjacent to each gene indicate the corresponding pathway presented in (D). (D) A summary of corresponding pathways in which the differentially regulated genes in (C) are involved across the time points. (E) Distribution of p53 signaling transcripts in endothelial cells (3 animals are combined) and an example of an MHC-I gene upregulated in microglia at 3 DPI.
We found that endothelial cells had the most acute response at 3 DPI with p53 signaling pathway notably impacted. A significant upregulation of Phlda3 and its effectors Bax, Aen, Mdm2, and Cdkn1a, all involved in the p53/Akt signaling pathway, was present (Figures 5C, E) (103, 104). Of relevance, we also detected Trp53cor1/LincRNA-p21, responsible for negative regulation of gene expression (105), upregulated in endothelial cells at 3 DPI. Another example of an upregulated gene relevant to inflammation and stress response in endothelial cells is Mmrn2, responsible for regulating angiogenesis in endothelial cells (106).
In brain immune cells, we observe a few substantial changes in genes pertaining to immune regulation at 3 DPI for microglia and at 25 DPI for perivascular macrophages. For example, we observe an upregulation of MHC-I gene H2-K1 at 3 DPI in microglia, which then stabilizes back to control levels at 25 DPI (Figure 5C). Ifitm3 and Slfn2, genes implicated in type I interferon response (107, 108), also show upregulation at 3 DPI in microglia. Cd74, a chaperon responsible for regulating antigen presentation during immune response, was upregulated in perivascular macrophages at 3 DPI (109). We did not observe significant differences in pro-inflammatory chemokines, Ccl2 and Ccl5, which are related to breakdown of the blood-brain barrier via regulation of tight-junction proteins and recruitment of peripheral leukocytes (110). Ccl3, responsible for infiltration of leukocytes and CNS inflammation (111), was upregulated in perivascular macrophages in 25 DPI (Figure 5C).
We found that neurons had only a few differentially expressed genes at 25 DPI. Immediate early genes, such as Fos and Junb were upregulated in inhibitory neurons, while genes involved in modulating cell proliferation, such as Tafa1 and S1pr1, were downregulated at 25 DPI (79, 112).
By investigating the gene expression differences in subpopulations of cells post-injection, we found that endothelial cells upregulate genes linked to p53 signaling at 3 DPI (Figure 5D) which all return to control levels at 25 DPI. Immune cells such as microglia and perivascular macrophages upregulate genes involved in type I interferon response, MHC-I antigen processing, and chemokine signaling (Figure 5D). Inhibitory neurons display a subtle effect, consisting of differential expression of genes involved in stress response and cell proliferation at 25 DPI.
2.7 Larger Pools of Barcoded AAVs Recapitulate Complex Tropism Within a Single Animal
To showcase the capabilities of parallel characterization, we next designed a 7-variant barcoded pool that included the three previously characterized variants (AAV-PHP.eB, AAV-CAP-B10, and AAV-PHP.V1), AAV9 and AAV-PHP.B controls, and two additional variants, AAV-PHP.C1 and AAV-PHP.C2. For simplification of cloning and virus production, we designed a plasmid, UBC-mCherry-AAV-cap-in-cis, that contained both the barcoded cargo, UBC-mCherry, and the AAV9 capsid DNA (Supplemental Figure 1B). We assigned three distinct 24 bp barcodes to each variant (Supplemental Table 5). Each virus was produced separately to control the dosage, and 1.5 x 10¹¹ vg of each variant was pooled and injected into a single animal.
After 3 weeks of expression, we performed single-cell sequencing on extracted cortical tissue. To increase the number of cells available for profiling, we processed two aliquots of cells, for a total of 36,413 recovered cells. To amplify the viral transcripts, we used primers that bind near the 3’ end of mCherry such that the barcode was captured in sequencing (Supplemental Table 1).
Using our cell typing and viral transcript counting methods, we investigated the transcript counts and transduction bias of the variants in the pool. Compared with our previous profiling experiments, the log-transformed transcript abundance of UBC-mCherry detected per cell was lower than CAG-mNeonGreen-WPRE and CAG-tdTomato (adjusted P < 0.0001, P=0.0767, respectively, two-way ANOVA with multiple comparison correction using Tukey’s method) and shifted towards vascular cells (adjusted P < 0.0001, P=0.0004, respectively, two-way ANOVA with multiple comparison correction using Tukey’s method) (Supplemental Figures 5B, C). Next, we looked at the transduction rate difference for each variant compared with the rest of the variants in the pool for each cell type in our taxonomy (Figures 6A, B). Despite the lower expression rate and bias shift, the transduction rate difference metric captured the same tropism biases for AAV.CAP-B10 and AAV-PHP.V1 as determined from our previous experiments. AAV.CAP-B10 showed enhanced neuronal targeting relative to other variants in the pool, with this bias coming specifically from an increase in the transduction of glutamatergic neurons. All five variants with transcripts detected in neurons showed a decreased transduction rate in Vip+ neurons relative to other GABAergic neuronal subtypes (Supplemental Figure 7C). AAV-PHP.eB showed enhanced targeting of astrocytes (+5.9%, P = 3.0 x 10⁻¹⁰, 2-proportion z-test, multiple comparison corrected with Benjamini/Hochberg correction), and AAV-PHP.V1 showed strong bias for vascular cells (+49.7%, p = 1.7 x 10-45). In addition to confirming all our existing hypotheses, we were able to identify biases for the previously reported AAV-PHP.C2, which has not been characterized in depth. This variant, which was reported as having a non-neuronal bias similar to AAV-PHP.V1, showed significant transduction bias not only toward vascular cells (+15.7%, P = 1.5 x 10⁻⁷), but also toward astrocytes (+21.5%, P = 3.0-28), and a bias away from neurons (−38%, p = 4.5 x 10⁻³²).
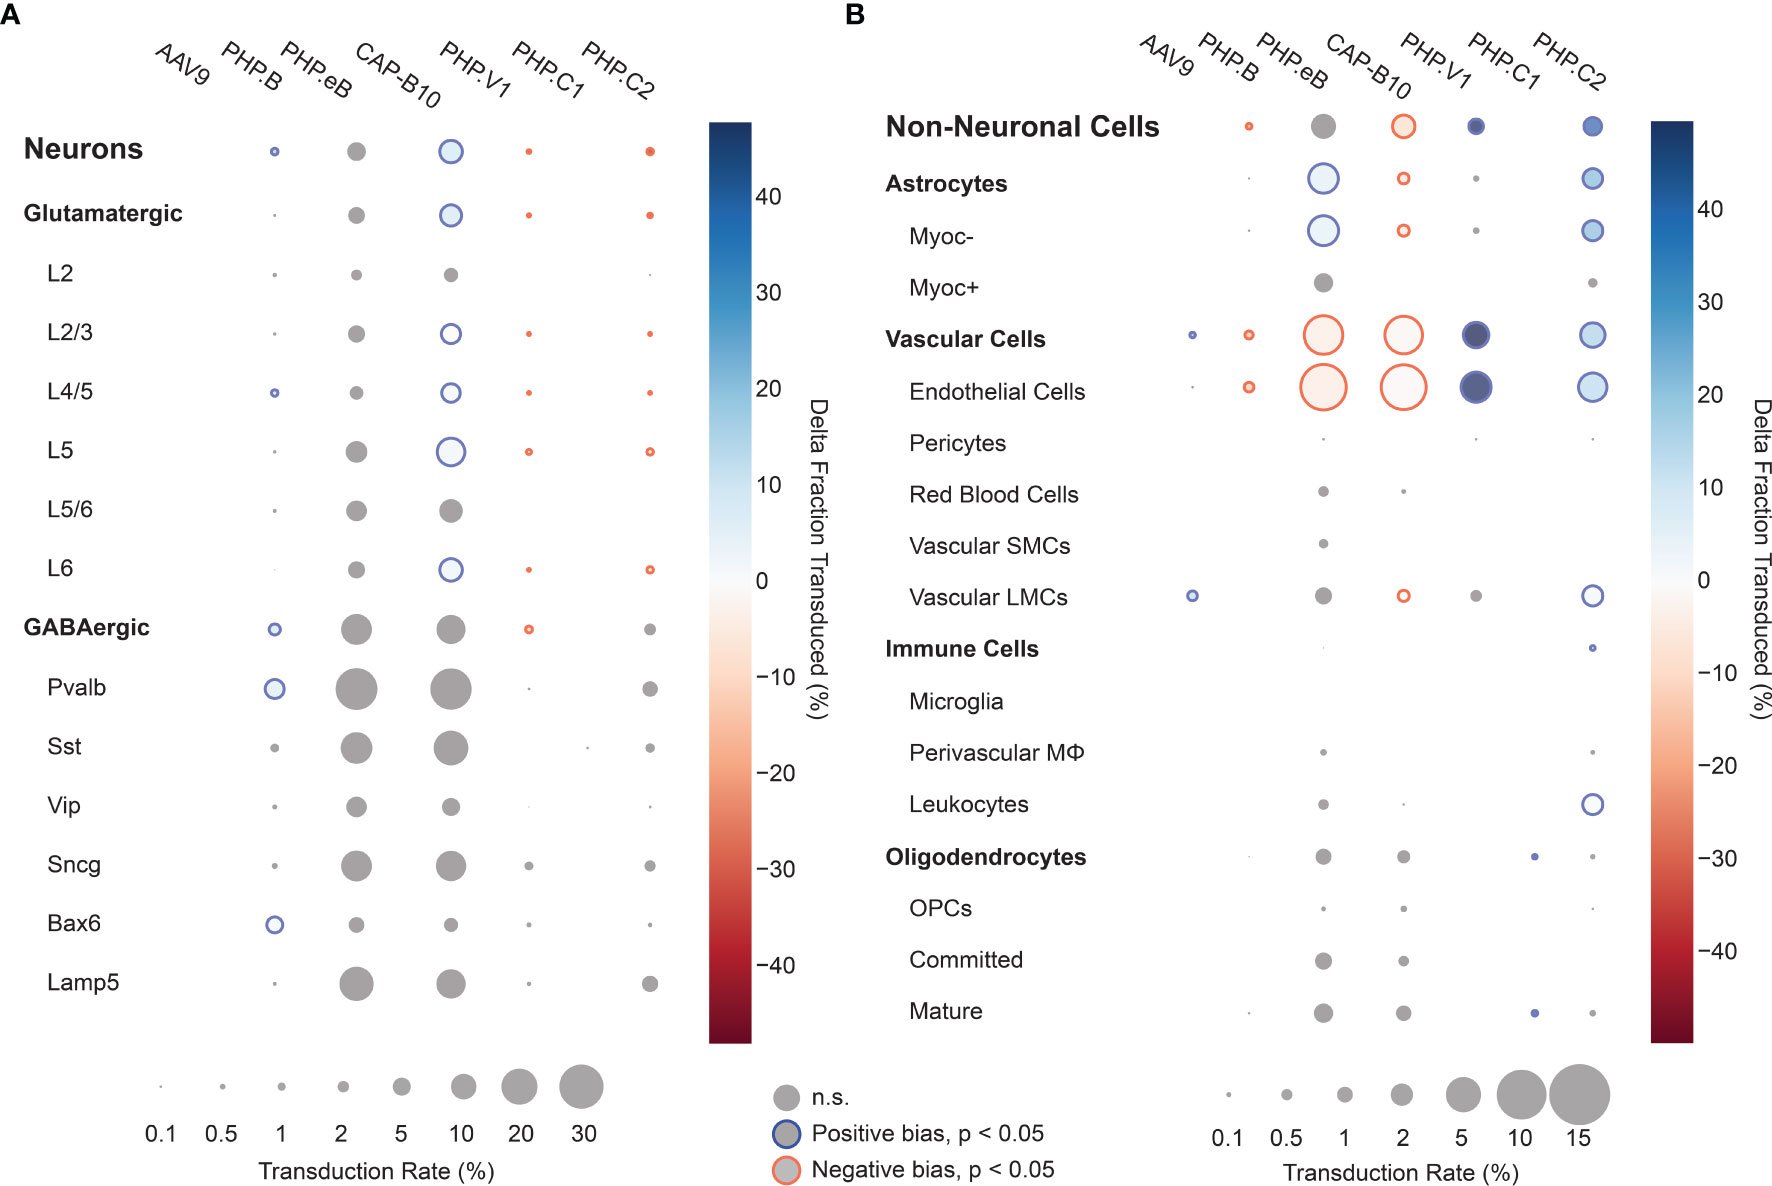
Figure 6 Single animal injections of multiple barcoded rAAVs enables deep, parallel characterization. (A, B) Relative cell type tropism of 7 co-injected rAAVs for neuronal (A) and non-neuronal (B) cell types. The color scale indicates the difference in transduction bias of a variant relative to all other variants in the pool. The area of each circle scales linearly with the fraction of cells of that type with viral transcripts above background. For each variant and cell type, a 2-proportion z score was calculated to compare the number of cells of that type transduced by that variant relative to all other variants combined. Z scores were combined across two single-cell sequencing aliquots using Stouffer’s method and corrected for multiple comparisons. Cell types with fewer than 10 transduced cells in either the variant or variants compared against were discarded. Only cell-type biases at an adjusted P-value < 0.05 are colored; otherwise they are grayed out.
3 Discussion
The advent of NGS has enabled screening of large libraries of AAV capsids in vivo by extracting viral DNA from relevant tissue followed by sequencing of capsid gene inserts or DNA barcodes corresponding to defined capsids. To date, NGS-based screening has been successfully applied to libraries created by peptide insertions (28, 113), DNA shuffling of capsids (114–116), and site-directed mutagenesis (117). Although these NGS-based strategies allow the evolution of new AAV variants with diverse tissue tropisms, it has been difficult to obtain a comprehensive profiling for multiple variants across cell types, which is of utmost importance in organs with complex cell-type compositions, such as the brain (34, 45, 64–66). Towards this end, techniques such as IHC, fluorescent in situ RNA hybridization (98, 118–122) or in situ RNA sequencing (123–125) can be employed. Several limitations make it challenging to apply these techniques as high-throughput, post-selection AAV tropism profiling methods. First, the limits of optical resolution and the density of transcripts in single cells pose challenges for full in situ transcriptome analysis and, until recently, have restricted the total number of simultaneously measured genes in single cells within tissue to several hundred (121, 123–126). By contrast, scRNA-seq with the 10x Genomics Chromium system enables detection of over 4000 genes per cell (95), fast transcriptomic analysis, and multiplexing across different tissue types (127, 128). Furthermore, the method is already widely used by the research community which can help with adoption of our proposed pipelines. Although droplet-based scRNA-seq methods lose spatial information during the dissociation procedure, analysis packages have been developed that can infer single-cell localization by combining scRNA-seq data with pre-existing information from ISH-based labeling for specific marker genes (129–134). Therefore, scRNA-seq techniques have great potential to rapidly profile the tropism of multiple AAV variants in parallel across several thousand cells defined by their entire transcriptome.
Here, we established an experimental and data-analysis pipeline that leverages the capabilities of scRNA-seq to achieve simultaneous characterization of several AAV variants across multiplexed tissue cell types within a single animal. To differentiate multiple AAV capsid variants in the sequencing data, we packaged variants with unique transgenes or the same transgene with unique barcodes incorporated at the 3’ end. We added standard Illumina sequencing primer recognition sites (Read 2) to the viral transcripts using PCR amplification such that the barcoded region could be consistently read out from the Illumina sequencing data. Our computational pipeline demultiplexes viral reads found in the transcriptome according to which matching sequence is most abundant in a separate amplified viral transgene library. Comparing the distribution of viral transcripts by cell type to a null model of empty droplets, we could then determine the cell-type biases.
Our platform has corroborated the tropism of several previously characterized AAV variants and has provided more detailed tropism information beyond the major cell types. The fraction of transduced cells that are glutamatergic neurons was found to be markedly reduced for AAV-PHP.eB when compared with AAV.CAP-B10. Furthermore, within all the variants we tested, both Pvalb+ and Sst+ inhibitory neurons have greater transduction rates than Vip+ neurons. This bodes well for delivery to Pvalb+ neurons, which have been implicated in a wide range of neuro-psychiatric disorders (135), and suggests Vip+ interneurons, which have recently been identified as being a sufficient delivery target for induction of Rett syndrome-like symptoms, as a target for optimization (136). Awareness of neuronal subtype biases in delivery vectors is critical both for neuroscience researchers and for clinical applications. Dissection of neural circuit function requires understanding the roles of neuronal subtypes in behavior and disease and relies on successful and sometimes specific delivery of transgenes to the neuronal types under study (1).
We further discovered that the vascular bias of AAV-PHP.V1 originates from its transduction bias towards endothelial cells. Interestingly, this is the only cell type we detected expressing Ly6a (Supplemental Figure 8), a known surface receptor for AAV variants in the PHP.B family (137–139). Given AAV-PHP.V1’s sequence similarity to AAV-PHP.B and its tropism across mouse strains, this pattern suggests that AAV-PHP.V1 transduction may also be Ly6a-mediated. Finding such associations between viral tropism and cell-surface membrane proteins also suggests that full transcriptome sequencing data may hold a treasure trove of information on possible mechanisms of transduction of viral vectors.
We also revealed that AAV-PHP.C2 has a strong, broad non-neuronal bias toward both vascular cells and astrocytes. AAV-PHP.C2 also transduces BALB/cJ mice, which do not contain the Ly6a variant that mediates transduction by PHP.B family variants (137–139). This suggests that PHP.C2 may be the most promising candidate from this pool for researchers interested in delivery to non-neuronal cells with minimal neuronal transduction both in C57BL/6J mice and in strains and organisms that do not have the Ly6a variant.
All our tested variants with non-neuronal transduction have lower expression in Myoc+ astrocytes and pericytes. Astrocytes expressing Myoc and Gfap, which intersect in our data (Supplemental Figure 8), have been previously identified as having reactive behavior in disease contexts, making them a target of interest for research on neurological diseases (140, 141). Similarly, pericytes, whose dysfunction has been shown to contribute to multiple neurological diseases, may be an important therapeutic target (60, 142, 143). Both of these cell types may be good candidates for further AAV optimization but may have been missed with marker gene-based approaches. In both AAV characterization and neuroscience research efforts, different marker genes are often used for astrocyte classification – sometimes more restrictive genes such as Gfap, and other times more broadly expressing genes such as S100b or Aldh1l1 (144, 145). Similarly, defining marker genes for pericytes is still an active field (100, 102). Given the constraints of having to choose specific marker genes, it is difficult for staining-based characterizations to provide tropism profiles that are relevant for diverse and changing research needs. This highlights the importance of using unbiased, full transcriptome profiling for vector characterization.
We have shown that our combined experimental and computational platform is able to recover transduction biases and profile multiple variants in a single animal, even amidst the noise of ambient RNA. We have further shown that our method is robust to the variability inherent in delivery and extraction from different animals, with different transgenes, and with different regulatory elements. For example, we discovered lower overall expression from vectors carrying UBC-mCherry compared with CAG-mNeonGreen-WPRE. Such differences are not surprising since the WPRE is known to increase RNA stability and therefore transcript abundance (146). Furthermore, the shift in cell-type bias may come from the UBC promoter, as even ubiquitous promoters such as CAG and UBC have been shown to have variable levels of expression in different cell types (147). Despite these biases, looking at the differences in transduction between variants delivering the same construct within an individual animal reveals the strongest candidate vectors for on-target and off-target cell types of interest. While we show that our method can profile AAVs carrying standard fluorescent cargo, caution is needed when linking differences in absolute viral tropism to changes in capsid composition alone without considering the contribution of the transgene, regulatory elements, and distribution of cell types in recovered tissue. Therefore, for more robust and relative tropism between variants, we found it beneficial to use small barcodes and co-injections of pools of vectors. Our scRNA-seq-based approach is not restricted to profiling capsid variants but can be expanded in the future to screen promoters (148–150), enhancers (151, 152), or transgenes (86, 153), all of which are essential elements requiring optimization to improve gene therapy.
Finally, we have used scRNA-seq to understand how intra-orbital administration of AAV-PHP.eB affects the host cell transcriptome across distinct time points. Results from our study show genes pertaining to the p53 pathway in endothelial cells are differentially expressed 3 days after injection, an effect which vanishes at a later time point of 25 DPI. Though other cell types such as immune cells and neurons had a few differentially expressed genes pertaining to antigen presentation and cell differentiation, respectively, endothelial cells at 3 DPI are the only cells with a profound response signature. The highest number of differentially expressed genes being in endothelial cells suggests that vascular cells could be the initial responders to viral transduction and expression of the transgene. This is supported by Kodali et al., who have shown that endothelial cells are the first to elicit a response to peripheral inflammatory stimulation by transcribing genes for proinflammatory mediators and cytokines (154). With regards to p53 differentially expressed genes, Ghouzzi, et al. have also shown that the genes Phdla3, Aen, and Cdkn1a were upregulated in cells infected with ZIKA virus, signifying genotoxic stress and apoptosis induction (104). Upregulation of genes such as Bax and Cdkn1a could be a response to cellular stress induced by viral transduction (103, 155). However, the initial inflammatory responses did not escalate as shown by the low number of differential expressed genes across all cells (Figure 5B) at day twenty-five. Additionally, antigen presenting genes, such as Cd74 and H2-K1, returning back to control expression levels in microglia and a lack of proinflammatory cytokines being upregulated support that the event of infiltration of peripheral leukocytes is unlikely, in agreement with prior studies (87, 88). Based on prior studies, the few genes that are differentially expressed at day 25 in excitatory and inhibitory neurons could also be due to transgene expression rather than the virion (89). Upregulation of immediate early genes such as Fos, Junb, and Ier2 in inhibitory neurons could indicate that the cells which are transduced and expressing viral transcripts could be under increased stress and metabolic demands, either directly in response to transgene expression, or in combination with the stresses of dissociation. For example, c-jun and c-fos were found to be upregulated by lung epithelial cells as part of the response to measles virus (156). Given that scRNA-seq is a sensitive technique, it can be prone to high false discovery rates if not properly controlled. To account for this, we used a highly conservative pseudo-bulk differential expression procedure, which has been shown to minimize false discovery rates compared to other batch correction methods (157). This conservative procedure, however, has lower relative power, and thus there may be additional effects in cell subtypes to AAV transduction. The confidence and statistical power of future scRNA-seq studies looking at AAV-related immune responses could be improved with increased sample size, such as via sample multiplexing strategies to pool multiple animals (127), or by increasing the sensitivity and specificity of viral transcript detection and performing differential expression within animals. It is also important to note that the findings discussed here are specific to the rAAV, transgene, and dosage. Nonetheless, our results highlight the power of single-cell profiling in being able to ascertain cell-type-specific responses at an early time point post-injection.
As shown throughout this work, there are several challenges we had to overcome to gain valuable insights from our droplet-based single-cell RNA sequencing approach. While we were able to overcome these in the context of our study, they hint at some important limitations of this method. First, droplet-based single-cell sequencing of tissues that are difficult to dissociate, such as brain, can lead to substantial background noise from debris. Alternative methods, such as single-nucleus RNA sequencing (158, 159), could potentially overcome this debris problem. Exploratory work would need to be performed to determine whether single-nucleus RNA sequencing captures a sufficient amount of immature viral transcripts, but, if effective, may obviate the need for computational detection of transduction above a background level. Another potential challenge of our method is scaling up to much larger numbers of variants. In order to establish high statistical confidence in tropism, many cells need to be transduced. However, given restrictions on the total dosage an animal can receive, adding more variants would require a lower dosage per variant. In simulation, we found that subsampling our 2-variant pool by 10-fold did not change the major tropism findings (Supplemental Figure 9). Given our current injections are 8-fold lower than the maximum allowed dosage, this suggests this method could scale up to 80 variants; however, further work would need to be done to validate whether this holds for a diversity of variants that may be competing for binding. Scaling higher would be challenging with current droplet-based single-cell RNA sequencing pipelines that process on the order of 104 cells per reaction. Alternative approaches, such as split-pool strategies, which can profile many more cells (160), may thus be appealing for larger variant pools.
In summary, our platform enables thorough tropism characterization of existing and emerging recombinant AAVs and helps uncover cellular responses to rAAV-mediated gene therapy, thus further guiding the engineering and use of gene delivery vehicles.
4 Materials and Methods
4.1 Animals
Male C57BL/6J mice (Stock No: 000664) used in this study were purchased from the Jackson Laboratory (JAX). AAV variants were injected i.v. into the retro-orbital sinus of 6–7 week old mice.
4.2 Plasmids
In vivo vector characterization of AAV variant capsids was conducted using single-stranded (ss) rAAV genomes. pAAV : CAG-NLS-mNeonGreen, pAAV : CAG-NLS-mRuby2, pAAV : CAG-tdTomato, and pAAV : CAG-NLS-tdTomato constructs were adapted from previous publications (32, 45). To introduce barcodes into the polyA region of CAG-NLS-mNeonGreen, we digested the plasmid with BglII and EcoRI, and performed Gibson assembly (E2611, NEB) to insert synthesized fragments with 7bp degenerate nucleotide sequences 89 bp upstream of the polyadenylation site. We then seeded bacterial colonies and selected and performed Sanger sequencing on the resulting plasmids to determine the corresponding barcode.
The UBC-mCherry-AAV-cap-in-cis plasmid was adapted from the rAAV-Cap-in-cis-lox plasmid from a previous publication (34). We performed a restriction digest on the plasmid with BsmbI and SpeI to remove UBC-mCherry and retain the AAV9 cap gene and remaining backbone. We then circularized the digested plasmid using a gblock joint fragment to get a plasmid containing AAV2-Rep, AAV9-Cap, and the remaining backbone via T4 ligation. In order to insert UBC-mCherry with the desired orientation and location, we amplified its linear segment from the original rAAV-Cap-in-cis-lox plasmid. The linear UBC-mCherry-polyA segment and circularized AAV2-Rep,AAV9-cap plasmid were then both digested with HindIII and ligated using T4 ligation. In order to get the SV40 PolyA element in the proper orientation with respect to the inserted UBC-mCherry, we removed the original segment from the plasmid using AvrII and AccI enzymes and inserted AvrII, AccI treated SV40 gblock using T4 ligation to get the final plasmid.
To insert barcodes into UBC-mCherry-AAV-cap-in-cis, we obtained 300 bp DNA fragments containing the two desired capsid mutation regions for each variant and the variant barcode, flanked by BsrGI and XbaI cut sites. The three segments of the fragment were separated by BsaI Type I restriction sites. We digested the UBC-mCherry-AAV-cap-in-cis plasmid with BsrGI and XbaI, and ligated each variant insert to this backbone. Then, to reinsert the missing regions, we performed Golden Gate assembly with two inserts and BsaI-HF.
4.3 Viral Production
To produce viruses carrying in trans constructs, we followed established protocols for the production of rAAVs (161). In short, HEK293T cells were triple transfected using polyethylenimine (PEI) with three plasmids: pAAV (see Plasmids), pUCmini-iCAP-PHP.eB (32), pUCmini-iCAP-CAP-B10 (90), or pUCmini-iCAP-PHP.V1 (45), and pHelper. After 120 h, virus was harvested and purified using an iodixanol gradient (Optiprep, Sigma). For our 7-variant pool, we modified the protocol to be a double transfection using PEI with two plasmids: UBC-mCherry-AAV-cap-in-cis and pHelper.
4.4 Tissue Processing for Single-Cell Suspension
Three to four weeks after the injection, mice (9-10 weeks old) were briefly anesthetized with isoflurane (5%) in an isolated plexiglass chamber followed by i.p. injection of euthasol (100 mg/kg). The following dissociation procedure of cortical tissue into a single-cell suspension was adapted with modifications from a previous report (162). Animals were transcardially perfused with ice-cold carbogenated (95% O2 and 5% CO2) NMDG-HEPES-ACSF (93 mM NMDG, 2.5 mM KCl, 1.2 mM NaH2PO4, 30 mM NaHCO3, 20 mM HEPES, 25 mM glucose, 5 mM Na L-ascorbate, 2 mM thiourea, 3 mM Na-pyruvate, 10 mM MgSO4, 1 mM CaCl2, 1 mM kynurenic acid Na salt, pH adjusted to 7.35 with 10N HCl, osmolarity range 300–310 mOsm). Brains were rapidly extracted and cut in half along the anterior-posterior axis with a razor blade. Half of the brain was used for IHC histology while the second half of the brain was used for scRNA-seq. Tissue used for scRNA-seq was immersed in ice-cold NMDG-HEPES-ACSF saturated with carbogen. The brain was sectioned into 300-μm slices using a vibratome (VT-1200, Leica Biosystems, IL, USA). Coronal sections from Bregma −0.94 mm to −2.80 mm were collected in a dissection dish on ice containing NMDG-HEPES-ACSF. Cortical tissue from the dorsal surface of the brain to ~3.5 mm ventral was cut out and further sliced into small tissue pieces. NMDG-HEPES-ACSF was replaced by trehalose-HEPES-ACSF (92 mM NaCl, 2.5 mM KCl, 1.2 mM NaH2PO4, 30 mM NaHCO3, 20 mM HEPES, 25 mM glucose, 2 mM MgSO4, 2 mM CaCl2, 1 mM kynurenic acid Na salt, 0.025 mM D-(+)-trehalose dihydrate*2H2O, pH adjusted to 7.35, osmolarity ranging 320–330 mOsm) containing papain (60 U/ml; P3125, Sigma Aldrich, pre-activated with 2.5 mM cysteine and a 0.5–1 h incubation at 34°C, supplemented with 0.5 mM EDTA) for the enzymatic digestion. Under gentle carbogenation, cortical tissue was incubated at 34°C for 50 min with soft agitation by pipetting every 10 min. 5 μl 2500 U/ml DNase I (04716728001 Roche, Sigma Aldrich) was added to the single-cell suspension 10 min before the end of the digestion. The solution was replaced with 200 μl trehalose-HEPES-ACSF containing 3 mg/ml ovomucoid inhibitor (OI-BSA, Worthington) and 1 μl DNase I. At room temperature, the digested cortical tissue was gently triturated with fire-polished glass Pasteur pipettes for three consecutive rounds with decreasing pipette diameters of 600, 300, and 150 μm. 800 μl of trehalose-HEPES-ACSF with 3 mg/ml ovomucoid inhibitor was added. The uniform single-cell suspension was pipetted through a 40 μm cell strainer (352340, Falcon) into a new microcentrifuge tube followed by centrifugation at 300 g for 5 min at 4°C. The supernatant was discarded and cell pellet was resuspended in 1 ml of trehalose-HEPES-ACSF. After mixing using a Pasteur pipette with a 150 μm tip diameter, the single-cell suspension was centrifuged again. Supernatant was replaced with fresh trehalose-HEPES-ACSF and the resuspended cell pellet was strained with a 20 μm nylon net filter (NY2004700, Millipore). After resuspension in trehalose-HEPES-ACSF, cells were pelleted again and resuspended in 100 μl of ice-cold resuspension-ACSF (117 mM NaCl, 2.5 mM KCl, 1.2 mM NaH2PO4, 30 mM NaHCO3, 20 mM HEPES, 25 mM glucose, 1 mM MgSO4, 2 mM CaCl2, 1 mM kynurenic acid Na salt and 0.05% BSA, pH adjusted to 7.35 with Tris base, osmolarity range 320–330 mOsm). Cells were counted with a hemocytometer and the final cell densities were verified to be in the range of 400–2,500 cells/μl. The density of single-cell suspension was adjusted with resuspension-ACSF if necessary.
4.5 Transcriptomic Library Construction
Cell suspension volumes containing 16,000 cells–expected to retrieve an estimated 10,000 single-cell transcriptomes–were added to the 10x Genomics RT reaction mix and loaded to the 10x Single Cell Chip A (230027, 10x Genomics) for 10x v2 chemistry or B (2000168, 10x Genomics) for 10x v3 chemistry per the manufacturer’s protocol (Document CG00052, Revision F, Document CG000183, Revision C, respectively). We used the Chromium Single Cell 3’ GEM and Library Kit v2 (120237, 10x genomics) or v3 (1000075, 10x Genomics) to recover and amplify cDNA, applying 11 rounds of amplification. We took 70 ng to prepare Illumina sequencing libraries downstream of reverse transcription following the manufacturer’s protocol, applying 13 rounds of sequencing library amplification.
4.6 Viral Library Construction
We selectively amplified viral transcripts from 15 ng of cDNA using a cargo-specific primer binding to the target of interest and a primer binding the partial Illumina Read 1 sequence present on the 10x capture oligos (Supplemental Table 1). For animals injected with a single cargo, amplification was performed only once using the primer for the delivered cargo; for animals with distinct cargo sequences per variant, amplification was performed in parallel reactions from the same cDNA library using different cargo-specific primers for each reaction. We performed the amplification using 2x KAPA HiFi HotStart ReadyMix (KK2600) for 28 cycles at an annealing temperature of 53°C. Afterwards, we performed a left-sided SPRI cleanup with a concentration dependent on the target amplicon length, in accordance with the manufacturer’s protocol (SPRISelect, Beckman Coulter B23318). We then performed an overhang PCR on 100 ng of product with 15 cycles using primers that bind the cargo and the partial Illumina Read 1 sequence and appending the P5/P7 sequences and Illumina sample indices. We performed another SPRI cleanup, and analyzed the results via an Agilent High Sensitivity DNA Chip (Agilent 5067-4626).
4.7 Sequencing
Transcriptome libraries were pooled together in equal molar ratios according to their DNA mass concentration and their mean transcript size as determined via bioanalyzer. Sequencing libraries were processed on Novaseq 6000 S4 300-cycle lanes. The run was configured to read 150 bp from each end. Sequencing was outsourced to Fulgent Genetics and the UCSF Center for Advanced Technology.
All viral transcript libraries except barcoded UBC-mCherry were pooled together in equal molar ratios into a 4 nM sequencing library, then diluted and denatured into a 12 pM library as per the manufacturer’s protocol (Illumina Document #15039740v10). The resulting library was sequenced using a MiSeq v3 150-cycle reagent kit (MS-102-3001), configured to read 91 base pairs for Read 2 and 28 base pairs for Read 1. To characterize the effect of sequencing depth, one viral transcript library was additionally processed independently on a separate MiSeq run.
The UBC-mCherry viral transcript library, which was recovered with primers near the polyadenylation site, consisted of fragments ~307 bp long. Since this length is within the common range for an Illumina NovaSeq run, this viral transcript library was pooled and included with the corresponding transcriptome library.
4.8 Transcriptome Read Alignment
For transcriptome read alignment and gene expression quantification, we used 10x Cell Ranger v5.0.1 with default options to process the FASTQ files from the transcriptome sequencing library. The reads were aligned against the mus musculus reference provided by Cell Ranger (mm10 v2020-A, based on Ensembl release 98).
To detect viral transcripts in the transcriptome, we ran an additional alignment using 10x Cell Ranger v5.0. 1 with a custom reference genome based on mm10 v2020-A. We followed the protocol for constructing a custom Cell Ranger reference as provided by 10x Genomics. This custom reference adds a single gene containing all the unique sequences from our delivered plasmids in the study, delineated as separate exons. Sequences that are common between different cargo are provided only once, and annotated as alternative splicings.
4.9 Viral Transcript Read Alignment
For viral read alignment, we aligned each Read 2 to a template derived from the plasmid, excluding barcodes. The template sequence was determined by starting at the ATG start site of the XFP cargo and ending at the AATAAA polyadenylation stop site. We used a Python implementation of the Striped Smith-Waterman algorithm from scikit-bio to calculate an alignment score for each read, and normalized the score by dividing by the maximum possible alignment score for a sequence of that length, minus the length of the barcode region. For each Read 2 that had a normalized alignment score of greater than 0.7, we extracted the corresponding cell barcode and UMI from Read 1, and any insertions into the template from Read 2.
4.10 Constructing the Variant Lookup Table
For co-injections with multiple templates and injections of barcoded templates, we constructed a lookup table to identify which variant belongs to each cell barcode/UMI. For each template, we counted the number of reads for each cell barcode/UMI. For reads of barcoded cargo, we only counted reads where the detected insertion in the barcode region unambiguously aligned to one of the pre-defined variant barcodes. Due to sequencing and PCR amplification errors, most cell barcode/UMI combinations had reads associated with multiple variants. Thus, we identified the variant with the largest count for each cell barcode/UMI. We discarded any cell barcode/UMIs that had more than one variant tied for the largest count. Finally, each cell barcode/UMI that was classified as a viral transcript in the transcriptome (see Transcriptome Read Alignment) was converted into the virus detected in the variant lookup table, or was discarded if it did not exist in the variant lookup table.
4.11 Estimating Transduction Rate
To determine an estimate of the percent of cells within a group expressing viral cargo above background, we compared the viral transcript counts in that group of cells to a background distribution of viral transcript counts in debris (see Droplet Type Classification). First, we obtained the empirical distribution of viral transcript counts by extracting the viral counts for that variant in cell barcodes classified as the target cell type as well as cell barcodes classified as debris. Next, we assumed a percentage of cells containing debris. For each viral transcript count, starting at 0, we calculated the number of cells that would contain this transcript count, if the assumed debris percentage was correct. We then calculated an error between this estimate and the number of cells with this transcript count in the cell type of interest. We tallied this error over all the integer bins in the histogram, allowing the error in a previous bin to roll over to the next bin. We repeated this for all possible values of percentage of debris from 0 to 100 in increments of 0.25, and the value that minimized the error was the estimated percentage of cells whose viral transcript count could be accounted for by debris. The inverse of this was our estimate of the number of cells expressing viral transcripts above background.
To validate that this method reliably recovers an estimate of transduction rate, we performed a series of simulations using models of debris viral transcript counts added to proposed cell type transcript count distributions across a range of parameterizations. To get estimates of the background distribution of debris, we used diffxpy (https://github.com/theislab/diffxpy) to fit the parameters of a negative binomial distribution to the viral transcript counts in debris droplets within a sample. We then postulated 1,000 different parameterizations of the negative binomial representing transcript counts in groups of cells, with 40 values of r ranging from 0.1 to 10, spaced evenly apart, and 25 values of p ranging from 0.001 to 0.99, spaced evenly apart. For each proposed negative binomial model, we drew 1,000 random samples of viral counts from the learned background distribution, and 1,000 random samples from the proposed cell distribution, and summed the two vectors. This summed vector was then used in our transduction rate estimation function, along with a separate 1,000 random samples of background viral transcripts for the function to use as an estimate of the background signal. We calculated the true probability of non-zero expression in our proposed cell negative binomial model (1 – P(X = 0)), and compared this value with the estimated value from the transduction rate estimation method.
4.12 Calculating Viral Tropism
For each variant vn and cell type of interest ci, we estimated the percentage of cells expressing viral cargo. To calculate tropism bias, we used this estimated expression rate, , to estimate the number of cells expressing viral transcripts in that cell type, out of the total number of cells of that type, . Cell type bias, within a sample was then calculated as the ratio of the number of cells of interest divided by the total number of transduced cells, . Finally, to calculate the difference in transduction bias for a particular variant relative to other variants in the sample, , we subtracted the bias of the variant from the mean bias across all other variants, .
4.13 Histology
4.13.1 Immunohistochemistry
The immunohistochemistry procedure was adapted from a previous publication (163). Brain tissue was fixed in 4% paraformaldehyde (PFA) at 4°C overnight on a shaker. Samples were immersed in 30% sucrose in 1x phosphate buffered saline (PBS) solution for >2 days and then embedded in Tissue-Tek O.C.T. Compound (102094-104, VWR) before freezing in dry ice for 1 h. Samples were sectioned into 50 μm coronal slices on a cryostat (Leica Biosystems). Brain slices were washed once with 1x phosphate buffered saline (PBS) to remove O.C.T. Compound. Samples were then incubated overnight at 4°C on a shaker in a 1x PBS solution containing 0.1% Triton X-100, 10% normal goat serum (NGS; Jackson ImmunoResearch, PA, USA), and primary antibodies. Sections were washed three times for 15 min each in 1x PBS. Next, brain slices were incubated at 4°C overnight on a shaker in a 1x PBS solution containing 0.1% Triton X-100, 10% NGS, and secondary antibodies. Sections were washed again three times for 15 min each in 1x PBS. Finally, slices were mounted on glass microscope slides (Adhesion Superfrost Plus Glass Slides, #5075-Plus, Brain Research Laboratories, MA, USA). After the brain slices dried, DAPI-containing mounting media (Fluoromount G with DAPI, 00-4959-52, eBioscience, CA, USA) was added before protecting the slices with a cover glass (Cover glass, #4860-1, Brain Research Laboratories, MA, USA). Confocal images were acquired on a Zeiss LSM 880 confocal microscope (Zeiss, Oberkochen, Germany). The following primary antibodies were used: rabbit monoclonal to NeuN (Rbfox3) (1:500; ab177487; Abcam, MA, USA), rabbit monoclonal to S100 beta (1:500; ab52642; Abcam, MA, USA), and rabbit monoclonal to Olig2 (1:500; ab109186; Abcam, MA, USA). The following secondary antibody was used: goat anti-rabbit IgG H&L Alexa Fluor 647 (1:500; ab150079; Abcam, MA, USA).
4.13.2 Fluorescent In Situ Hybridization Chain Reaction
FISH-HCR was conducted as previously reported (99). Probes targeting neuronal markers were designed using custom-written software (https://github.com/GradinaruLab/HCRprobe). Probes contained a target sequence of 20 nucleotides, a spacer of 2 nucleotides, and an initiator sequence of 18 nucleotides. Criteria for the target sequences were: (1) a GC content between 45%–60%, (2) no nucleotide repeats more than three times, (3) no more than 20 hits when blasted, and (4) the ΔG had to be above –9 kcal/mol to avoid self-dimers. Last, the full probe sequence was blasted and the Smith-Waterman alignment score was calculated between all possible pairs to prevent the formation of cross-dimers. In total, we designed 26 probes for Gad1, 20 probes for Vip, 22 probes for Pvalb, 18 probes for Sst, and 28 probes for Slc17a7. Probes were synthesized by Integrated DNA Technologies.
4.14 Droplet Type Identification
scRNA-seq datasets were analyzed with custom-written scripts in Python 3.7.4 using a custom fork off of scVI v0.8.1, and scanpy v1.6.0. To generate a training dataset for classifying a droplet as debris, multiplets, neuronal, or non-neuronal cells, we randomly sampled cells from all 27 cortical tissue samples. We sampled a total of 200,000 cells, taking cells from each tissue sample proportional to the expected number of cells loaded into the single-cell sequencing reaction. Within each sample, cells were drawn randomly, without replacement, weighted proportionally by their total number of detected UMIs. For each sample, we determined a lower bound on the cutoff between cells and empty droplets by constructing a histogram of UMI counts per cell from the raw, unfiltered gene count matrix. We then found the most prominent trough preceding the first prominent peak, as implemented by the scipy peak_prominences function. We only sampled from cells above this lower bound. Using these sampled cells, we trained a generative neural network model via scVI with the following parameters: 20 latent features, 2 layers, and 256 hidden units. These parameters were chosen from a coarse hyperparameter optimization centered around the scVI default values (Supplemental Table 3). We included the sample identifier as the batch key so that the model learned a latent representation with batch correction.
After training, Leiden clustering was performed on the learned latent space as implemented by scanpy. We used default parameters except for the resolution, which we increased to 2 to ensure isolation of small clusters of cell multiplets. Using the learned generative model, we draw 5000 cells from the posterior distribution based on random seed cells in each cluster. We draw an equal number conditioned on each batch. From these samples, we then calculated a batch-corrected probability of each cluster expressing a given marker gene (see Cluster Marker Gene Determination). For this coarse cell typing, we chose a single marker gene for major cell types expected in the cortex (Supplemental Table 2). If a cluster was expressing the neuron marker gene Rbfox3, it was labeled as “Neurons”. If a cluster was expressing any of the other non-neuronal marker genes, it was labelled as “Non-neurons”. Next, we ran Scrublet on the training cells to identify potential multiplets. Scrublet was run on each sample independently, since it is not designed to operate on combined datasets with potential batch-specific confounds. We then calculated the percentage of droplets in each cluster of the combined data that were identified as multiplets by Scrublet. We found a percentage threshold for identifying a cluster as containing predominantly multiplets by using Otsu’s threshold, as implemented by scikit-image. All droplets in any cluster above the multiplet percentage threshold were labelled as “Multiplets”. All other clusters were labelled as “Debris”.
Next, we trained a cell-type classifier using scANVI on the droplets labeled as training data. We used the weights from the previously trained scVI model as the starting weights for scANVI. Rather than using all cells for every epoch of the trainer, we implemented an alternative sampling scheme that presented each cell type to the classifier in equal proportions. Once the model was trained, all cells above the UMI lower noise bound were run through the classifier to obtain their cell-type classification. Droplets classified as “Neurons” or “Non-neurons” were additionally filtered by their scANVI-assigned probability. We retained only cells above an FDR threshold of 0.05, corrected for multiple comparisons using the Benjamini-Hochberg procedure. Finally, since the original run of Scrublet for multiplet detection was performed on only the training data, and thus did not take advantage of all the cells available, we ran Scrublet on all droplets classified as cells, and removed any identified multiplets.
4.15 Cluster Marker Gene Determination
To identify which clusters are expressing marker genes, we determined an estimated probability of a marker gene being expressed by a random cell in that cluster. For each cluster, we randomly sampled 5,000 cells, with replacement. We used scVI to project each cell into its learned latent space, and then used scVI’s posterior predictive sampling function to generate an example cell from this latent representation, and tallied how many times the gene is expressed. We repeated this for each batch, conditioning the posterior sample on that batch, to account for technical artifacts such as sequencing depth. Once we obtained a probability of expression of a marker gene for each cluster, we find a threshold for expression using Otsu’s method, as implemented by scikit-image. Clusters that have a probability of expression above the threshold are considered positive for that marker gene.
4.16 Neuronal Subtype Classification
Cells classified as neurons were further subtyped using annotations from a well-curated reference dataset. We used the Mouse Whole Cortex and Hippocampus 10x dataset from the Allen Institute for Brain Science as our reference dataset (95). First, we filtered the reference dataset to contain only cell types that are found within the brain regions collected for our experiments. To ensure that, overall, enough cells per cell type were present in our datasets, we merged cell types with common characteristics, such as expression of key marker genes. We re-aligned our cell transcriptome reads to the same pre-mRNA reference used to construct the reference dataset, so that the gene count matrices had a 1:1 mapping. We then trained a joint scANVI model with all cells identified as neurons from our samples and the reference database to learn a common latent space between them. The model was trained to classify cells based on the labels provided in the reference dataset. Cells were sampled from each class in equal proportions during training. After the model was trained, all neurons from our sample were run through the model to obtain their cell type classification.
4.17 Non-Neuronal Subtype Classification
Cells classified as non-neuronal were further subtyped using automatic clustering and marker gene identification. We trained an scVI model using only the non-neuronal cells and performed Leiden clustering as implemented by scanpy on the latent space. We determined which clusters were expressing each of 31 marker genes across 13 cell subtypes. Marker genes were identified from a review of existing scRNA-seq, bulk RNA-seq, or IHC studies of mouse brain non-neuronal subtypes (Supplemental Table 2). Each cluster was assigned to a cell subtype if it was determined positive for all the marker genes for that cell subtype (see Cluster Marker Gene Determination). If a cluster contained all the marker genes for multiple cell subtypes, the cluster was assigned to the cell subtype with the greatest number of marker genes. Clusters that did not express all the marker genes for any cell subtype were labeled as “Unknown”. Clusters that expressed all the marker genes for multiple cell subtypes with the same total number of marker genes were labeled as “Multiplets”. For cell types that contained multiple clusters, we then calculated the probability of every gene being zero in each cluster (see Cluster Marker Gene Determination). We then compared gene presence between clusters of the same cell type to see if there were any subclusters that had a dominant marker gene (present in > 50% of samples), that was not present in any of the other clusters (< 10% of samples). For the three cell types that had unique marker genes, we named the cluster after the gene with the highest 2-proportion z-score between the sampled gene counts in that cluster vs the rest.
4.18 Quantification of Images
Quantitative data analysis of confocal images was performed blind with regard to AAV capsid variant. Manual quantification was performed using the Cell Counter plugin, present in the Fiji distribution of ImageJ (National Institutes of Health, Bethesda, MD) (164). Transduction rate was calculated as the total number of double positive cells (i.e. viral transgene and cell type marker) divided by the total number of cell type marker labeled cells. For each brain slice, at least 100 cells positive for the gene markers of interest were counted in the cortex.
4.19 Differential Expression
To calculate differential expression within cell types between groups of animals, we used the DESeq2 R package (165). For each cell type, the gene counts are summed across all cells of that type and treated as a pseudo-bulk sample. The summed gene counts from each animal are then included as individual columns for a DESeq2 differential expression analysis. We performed DE for 3 DPI and 25 DPI separately, testing each sample against saline-injected controls. For each cell type, only genes that were present in all samples of at least one condition are included.
4.20 Marker Gene Dot Plots
To generate dot plots for marker genes, we used scanpy’s dotplot function (166). Gene counts were normalized to the sum of the total transcript counts per cell using scanpy’s normalize_total function. Normalized gene expression values are log-transformed as part of the plotting function.
4.21 Statistics
Statistical analyses comparing the fraction of transduced cells and transduction rate in different cell types for Figures 2, 3, 4D, E and 5A were conducted using GraphPad Prism 9. Statistical analyses comparing proportions of transduced cells within an animal in Figures 4F and Figure 6 were performed using the Python statsmodels library v0.12.1. No statistical methods were used to predetermine sample sizes. The statistical test applied, sample sizes, and statistical significant effects are reported in each figure legend. The significance threshold was defined as a = 0.05.
Data Availability Statement
All raw FASTQ files are available under the SRA BioProject PRJNA758711 (https://www.ncbi.nlm.nih.gov/bioproject/PRJNA758711/). Processed gene count matrices for droplets identified as cells, as well as the demultiplexed virus cargo counts, are available at CaltechData, doi: 22002/D1.2090 (http://dx.doi.org/10.22002/D1.2090).
Ethics Statement
Animal husbandry and all experimental procedures involving animals were performed in accordance with the California Institute of Technology Institutional Animal Care and Use Committee (IACUC) guidelines and reviewed and approved by the Office of Laboratory Animal Resources at the California Institute of Technology (animal protocol no. 1650).
Author Contributions
DB, MA, TD, and VG conceived the project and designed the experiments. SC and MT provided critical single-cell RNA sequencing expertise. TD, MA, and DB prepared the DNA constructs and produced virus. MA performed the injections, tissue dissociation, histology, imaging and image quantification. DB and TD performed the single-cell library preparation and prepared samples for sequencing. DB and MA built the data processing pipeline. DB, MA, TD, and AW performed the analysis. All authors contributed to the MS as drafted by DB, MA, and VG. MT supervised single-cell RNA sequencing computational pipelines while VG supervised the overall project. All authors contributed to the article and approved the submitted version.
Funding
This work was supported by the NIH Pioneer DP1OD025535, NIH BRAIN R01MH117069, Beckman Institute for CLARITY, Optogenetics and Vector Engineering Research (CLOVER) at Caltech, the Single-Cell Profiling and Engineering Center (SPEC) in the Beckman Institute at Caltech, the Curci Foundation, the CZI Neurodegeneration Challenge Network (VG), and the Vallee Foundation (VG). VG and MT are Heritage Principal Investigators supported by the Heritage Medical Research Institute. DB was supported by PHS Grant Number 5T32NS105595-02.
Conflict of Interest
VG is a Co-founder and BoD member for Capsida Biotherapeutics, a Fully Integrated AAV Engineering and Gene Therapy Company in Southern California.
The remaining authors declare that the research was conducted in the absence of any commercial or financial relationships that could be construed as a potential conflict of interest.
Publisher’s Note
All claims expressed in this article are solely those of the authors and do not necessarily represent those of their affiliated organizations, or those of the publisher, the editors and the reviewers. Any product that may be evaluated in this article, or claim that may be made by its manufacturer, is not guaranteed or endorsed by the publisher.
Acknowledgments
We thank the Gradinaru and Thomson labs for helpful discussions, Allan-Hermann Pool for advice on the mouse brain tissue dissociation procedure, Jeff Park for advice on 10X Genomics Chromium single-cell library preparation, Min Jee Jang for help in designing probes and troubleshooting FISH-HCR, and Ben Deverman and Ken Chan for early discussions on strategy. We also thank the software packages employed for visualization. Figures 1, 2, and Supplemental Figures 1, 2, and 4 were partially created with Biorender.com. Bar graphs, scatter plots, and box plots were generated with the help of the Plotly Python graphing library.
Supplementary Material
The Supplementary Material for this article can be found online at: https://www.frontiersin.org/articles/10.3389/fimmu.2021.730825/full#supplementary-material
References
1. Bedbrook CN, Deverman BE, Gradinaru V. Viral Strategies for Targeting the Central and Peripheral Nervous Systems. Annu Rev Neurosci (2018) 41(1):323–48. doi: 10.1146/annurev-neuro-080317-062048
2. Samulski RJ, Muzyczka N. AAV-Mediated Gene Therapy for Research and Therapeutic Purposes. Annu Rev Virol (2014) 1(1):427–51. doi: 10.1146/annurev-virology-031413-085355
3. Daya S, Berns KI. Gene Therapy Using Adeno-Associated Virus Vectors. Clin Microbiol Rev (2008) 21(4):583–93. doi: 10.1128/CMR.00008-08
4. Deverman BE, Ravina BM, Bankiewicz KS, Paul SM, Sah DWY. Gene Therapy for Neurological Disorders: Progress and Prospects. Nat Rev Drug Discovery (2018) 17(9):641–59. doi: 10.1038/nrd.2018.110
5. Gaj T, Epstein BE, Schaffer DV. Genome Engineering Using Adeno-Associated Virus: Basic and Clinical Research Applications. Mol Ther (2016) 24(3):458–64. doi: 10.1038/mt.2015.151
6. Hirsch ML, Samulski RJ. AAV-Mediated Gene Editing via Double-Strand Break Repair. In: Storici F, editor. Gene Correction: Methods and Protocols. Totowa, NJ: Humana Press (2014). p. 291–307. Available at: https://doi.org/10.1007/978-1-62703-761-7_19.
7. Naso MF, Tomkowicz B, Perry WL, Strohl WR. Adeno-Associated Virus (AAV) as a Vector for Gene Therapy. BioDrugs (2017) 31(4):317–34. doi: 10.1007/s40259-017-0234-5
8. Wu Z, Asokan A, Samulski RJ. Adeno-Associated Virus Serotypes: Vector Toolkit for Human Gene Therapy. Mol Ther (2006) 14(3):316–27. doi: 10.1016/j.ymthe.2006.05.009
9. Mével M, Bouzelha M, Leray A, Pacouret S, Guilbaud M, Penaud-Budloo M, et al. Chemical Modification of the Adeno-Associated Virus Capsid to Improve Gene Delivery. Chem Sci (2020) 11(4):1122–31. doi: 10.1039/C9SC04189C
10. Hinderer C, Katz N, Buza EL, Dyer C, Goode T, Bell P, et al. Severe Toxicity in Nonhuman Primates and Piglets Following High-Dose Intravenous Administration of an Adeno-Associated Virus Vector Expressing Human SMN. Hum Gene Ther (2018) 29(3):285–98. doi: 10.1089/hum.2018.015
11. Srivastava A. AAV Vectors: Are They Safe? Hum Gene Ther (2020) 31(13–14):697–9. doi: 10.1089/hum.2020.187
12. Wilson JM, Flotte TR. Moving Forward After Two Deaths in a Gene Therapy Trial of Myotubular Myopathy. Hum Gene Ther (2020) 31(13–14):695–6. doi: 10.1089/hum.2020.182
13. Paulk N. Gene Therapy: It Is Time to Talk About High-Dose AAV: The Deaths of Two Children With X-Linked Myotubular Myopathy in the ASPIRO Trial Prompts a Reexamination of Vector Safety. Genet Eng Biotechnol News (2020) 40(9):14–6. doi: 10.1089/gen.40.09.04
14. Calcedo R, Chichester JA, Wilson JM. Assessment of Humoral, Innate, and T-Cell Immune Responses to Adeno-Associated Virus Vectors. Hum Gene Ther Methods (2018) 29(2):86–95. doi: 10.1089/hgtb.2018.038
15. Gao G, Wang Q, Calcedo R, Mays L, Bell P, Wang L, et al. Adeno-Associated Virus-Mediated Gene Transfer to Nonhuman Primate Liver Can Elicit Destructive Transgene-Specific T Cell Responses. Hum Gene Ther (2009) 20(9):930–42. doi: 10.1089/hum.2009.060
16. Mingozzi F, High KA. Immune Responses to AAV Vectors: Overcoming Barriers to Successful Gene Therapy. Blood (2013) 122(1):23–36. doi: 10.1182/blood-2013-01-306647
17. Finn JD, Hui D, Downey HD, Dunn D, Pien GC, Mingozzi F, et al. Proteasome Inhibitors Decrease AAV2 Capsid Derived Peptide Epitope Presentation on MHC Class I Following Transduction. Mol Ther (2010) 18(1):135–42. doi: 10.1038/mt.2009.257
18. Pien GC, Basner-Tschakarjan E, Hui DJ, Mentlik AN, Finn JD, Hasbrouck NC, et al. Capsid Antigen Presentation Flags Human Hepatocytes for Destruction After Transduction by Adeno-Associated Viral Vectors. J Clin Invest (2009) 119(6):1688–95. doi: 10.1172/JCI36891
19. Mingozzi F, Meulenberg JJ, Hui DJ, Basner-Tschakarjan E, Hasbrouck NC, Edmonson SA, et al. AAV-1–Mediated Gene Transfer to Skeletal Muscle in Humans Results in Dose-Dependent Activation of Capsid-Specific T Cells. Blood (2009) 114(10):2077–86. doi: 10.1182/blood-2008-07-167510
20. Nathwani AC, Tuddenham EGD, Rangarajan S, Rosales C, McIntosh J, Linch DC, et al. Adenovirus-Associated Virus Vector–Mediated Gene Transfer in Hemophilia B. N Engl J Med (2011) 365(25):2357–65. doi: 10.1056/NEJMoa1108046
21. Herzog RW, Cooper M, Perrin GQ, Biswas M, Martino AT, Morel L, et al. Regulatory T Cells and TLR9 Activation Shape Antibody Formation to a Secreted Transgene Product in AAV Muscle Gene Transfer. Cell Immunol (2019) 342:103682. doi: 10.1016/j.cellimm.2017.07.012
22. Rogers GL, Shirley JL, Zolotukhin I, Kumar SRP, Sherman A, Perrin GQ, et al. Plasmacytoid and Conventional Dendritic Cells Cooperate in Crosspriming AAV Capsid-Specific CD8+ T Cells. Blood (2017) 129(24):3184–95. doi: 10.1182/blood-2016-11-751040
23. Rossi A, Dupaty L, Aillot L, Zhang L, Gallien C, Hallek M, et al. Vector Uncoating Limits Adeno-Associated Viral Vector-Mediated Transduction of Human Dendritic Cells and Vector Immunogenicity. Sci Rep (2019) 9(1):3631. doi: 10.1038/s41598-019-40071-1
24. Somanathan S, Breous E, Bell P, Wilson JM. AAV Vectors Avoid Inflammatory Signals Necessary to Render Transduced Hepatocyte Targets for Destructive T Cells. Mol Ther (2010) 18(5):977–82. doi: 10.1038/mt.2010.40
25. Vandenberghe LH, Wang L, Somanathan S, Zhi Y, Figueredo J, Calcedo R, et al. Heparin Binding Directs Activation of T Cells Against Adeno-Associated Virus Serotype 2 Capsid. Nat Med (2006) 12(8):967–71. doi: 10.1038/nm1445
26. Zhu J, Huang X, Yang Y. The TLR9-MyD88 Pathway Is Critical for Adaptive Immune Responses to Adenoassociated Virus Gene Therapy Vectors in Mice. J Clin Investig (2009) 119(8):2388–98. doi: 10.1172/JCI37607
27. Bartlett JS, Kleinschmidt J, Boucher RC, Samulski RJ. Targeted Adeno-Associated Virus Vector Transduction of Nonpermissive Cells Mediated by a Bispecific F(Ab’γ) 2 Antibody. Nat Biotechnol (1999) 17(2):181–6. doi: 10.1038/6185
28. Davidsson M, Wang G, Aldrin-Kirk P, Cardoso T, Nolbrant S, Hartnor M, et al. A Systematic Capsid Evolution Approach Performed In Vivo for the Design of AAV Vectors With Tailored Properties and Tropism. Proc Natl Acad Sci USA (2019) 116(52):27053–62. doi: 10.1073/pnas.1910061116
29. Davis AS, Federici T, Ray WC, Boulis NM, O’Connor D, Clark KR, et al. Rational Design and Engineering of a Modified Adeno-Associated Virus (AAV1)-Based Vector System for Enhanced Retrograde Gene Delivery. Neurosurgery (2015) 76(2):216–25. doi: 10.1227/NEU.0000000000000589
30. Lee EJ, Guenther CM, Suh J. Adeno-Associated Virus (AAV) Vectors: Rational Design Strategies for Capsid Engineering. Curr Opin BioMed Eng (2018) 7:58–63. doi: 10.1016/j.cobme.2018.09.004
31. Sen D. Improving Clinical Efficacy of Adeno Associated Vectors by Rational Capsid Bioengineering. J BioMed Sci (2014) 21(1):103. doi: 10.1186/s12929-014-0103-1
32. Chan KY, Jang MJ, Yoo BB, Greenbaum A, Ravi N, Wu W-L, et al. Engineered AAVs for Efficient Noninvasive Gene Delivery to the Central and Peripheral Nervous Systems. Nat Neurosci (2017) 20(8):1172–9. doi: 10.1038/nn.4593
33. Dalkara D, Byrne LC, Klimczak RR, Visel M, Yin L, Merigan WH, et al. In Vivo-Directed Evolution of a New Adeno-Associated Virus for Therapeutic Outer Retinal Gene Delivery From the Vitreous. Sci Transl Med (2013) 5(189):189ra76. doi: 10.1126/scitranslmed.3005708
34. Deverman BE, Pravdo PL, Simpson BP, Kumar SR, Chan KY, Banerjee A, et al. Cre-Dependent Selection Yields AAV Variants for Widespread Gene Transfer to the Adult Brain. Nat Biotechnol (2016) 34(2):204–9. doi: 10.1038/nbt.3440
35. Excoffon KJDA, Koerber JT, Dickey DD, Murtha M, Keshavjee S, Kaspar BK, et al. Directed Evolution of Adeno-Associated Virus to an Infectious Respiratory Virus. Proc Natl Acad Sci USA (2009) 106(10):3865–70. doi: 10.1073/pnas.0813365106
36. Grimm D, Lee JS, Wang L, Desai T, Akache B, Storm TA, et al. In Vitro and In Vivo Gene Therapy Vector Evolution via Multispecies Interbreeding and Retargeting of Adeno-Associated Viruses. J Virol (2008) 82(12):5887–911. doi: 10.1128/JVI.00254-08
37. Körbelin J, Sieber T, Michelfelder S, Lunding L, Spies E, Hunger A, et al. Pulmonary Targeting of Adeno-Associated Viral Vectors by Next-Generation Sequencing-Guided Screening of Random Capsid Displayed Peptide Libraries. Mol Ther (2016) 24(6):1050–61. doi: 10.1038/mt.2016.62
38. Kotterman MA, Schaffer DV. Engineering Adeno-Associated Viruses for Clinical Gene Therapy. Nat Rev Genet (2014) 15(7):445–51. doi: 10.1038/nrg3742
39. Maheshri N, Koerber JT, Kaspar BK, Schaffer DV. Directed Evolution of Adeno-Associated Virus Yields Enhanced Gene Delivery Vectors. Nat Biotechnol (2006) 24(2):198–204. doi: 10.1038/nbt1182
40. Müller OJ, Kaul F, Weitzman MD, Pasqualini R, Arap W, Kleinschmidt JA, et al. Random Peptide Libraries Displayed on Adeno-Associated Virus to Select for Targeted Gene Therapy Vectors. Nat Biotechnol (2003) 21(9):1040–6. doi: 10.1038/nbt856
41. Ogden PJ, Kelsic ED, Sinai S, Church GM. Comprehensive AAV Capsid Fitness Landscape Reveals a Viral Gene and Enables Machine-Guided Design. Science (2019) 366(6469):1139–43. doi: 10.1126/science.aaw2900
42. Ojala DS, Sun S, Santiago-Ortiz JL, Shapiro MG, Romero PA, Schaffer DV. In Vivo Selection of a Computationally Designed SCHEMA AAV Library Yields a Novel Variant for Infection of Adult Neural Stem Cells in the SVZ. Mol Ther (2018) 26(1):304–19. doi: 10.1016/j.ymthe.2017.09.006
43. Pekrun K, De Alencastro G, Luo Q-J, Liu J, Kim Y, Nygaard S, et al. Using a Barcoded AAV Capsid Library to Select for Clinically Relevant Gene Therapy Vectors. JCI Insight (2019) 4(22):e131610. doi: 10.1172/jci.insight.131610
44. Pulicherla N, Shen S, Yadav S, Debbink K, Govindasamy L, Agbandje-McKenna M, et al. Engineering Liver-Detargeted AAV9 Vectors for Cardiac and Musculoskeletal Gene Transfer. Mol Ther (2011) 19(6):1070–8. doi: 10.1038/mt.2011.22
45. Ravindra Kumar S, Miles TF, Chen X, Brown D, Dobreva T, Huang Q, et al. Multiplexed Cre-Dependent Selection Yields Systemic AAVs for Targeting Distinct Brain Cell Types. Nat Methods (2020) 17:541–50. doi: 10.1038/s41592-020-0799-7
46. Tervo DG, Hwang BY, Viswanathan S, Gaj T, Lavzin M, Ritola KD, et al. A Designer AAV Variant Permits Efficient Retrograde Access to Projection Neurons. Neuron (2016) 92(2):372–82. doi: 10.1016/j.neuron.2016.09.021
47. Ying Y, Müller OJ, Goehringer C, Leuchs B, Trepel M, Katus HA, et al. Heart-Targeted Adeno-Associated Viral Vectors Selected by In Vivo Biopanning of a Random Viral Display Peptide Library. Gene Ther (2010) 17(8):980–90. doi: 10.1038/gt.2010.44
48. Arruda VR, Fields PA, Milner R, Wainwright L, De Miguel MP, Donovan PJ, et al. Lack of Germline Transmission of Vector Sequences Following Systemic Administration of Recombinant AAV-2 Vector in Males. Mol Ther (2001) 4(6):586–92. doi: 10.1006/mthe.2001.0491
49. Deleage C, Wietgrefe SW, Del Prete G, Morcock DR, Hao XP, Piatak M, et al. Defining HIV and SIV Reservoirs in Lymphoid Tissues. Pathog Immun (2016) 1(1):68–106. doi: 10.20411/pai.v1i1.100
50. Deleage C, Chan CN, Busman-Sahay K, Estes JD. Next-Generation In Situ Hybridization Approaches to Define and Quantify HIV and SIV Reservoirs in Tissue Microenvironments. Retrovirology (2018) 15(1):4. doi: 10.1186/s12977-017-0387-9
51. Grabinski TM, Kneynsberg A, Manfredsson FP, Kanaan NM. A Method for Combining RNAscope in Situ Hybridization With Immunohistochemistry in Thick Free-Floating Brain Sections and Primary Neuronal Cultures. PloS One (2015) 10(3):e0120120. doi: 10.1371/journal.pone.0120120
52. Hunter JE, Gurda BL, Yoon SY, Castle MJ, Wolfe JH. In Situ Hybridization for Detection of AAV-Mediated Gene Expression. Methods Mol Biol (2019) 1950:107–22. doi: 10.1007/978-1-4939-9139-6_6
53. Miao CH, Nakai H, Thompson AR, Storm TA, Chiu W, Snyder RO, et al. Nonrandom Transduction of Recombinant Adeno-Associated Virus Vectors in Mouse Hepatocytes In Vivo: Cell Cycling Does Not Influence Hepatocyte Transduction. J Virol (2000) 74(8):3793–803. doi: 10.1128/JVI.74.8.3793-3803.2000
54. Polinski NK, Gombash SE, Manfredsson FP, Lipton JW, Kemp CJ, Cole-Strauss A, et al. Recombinant Adenoassociated Virus 2/5-Mediated Gene Transfer Is Reduced in the Aged Rat Midbrain. Neurobiol Aging (2015) 36(2):1110–20. doi: 10.1016/j.neurobiolaging.2014.07.047
55. Polinski NK, Manfredsson FP, Benskey MJ, Fischer DL, Kemp CJ, Steece-Collier K, et al. Impact of Age and Vector Construct on Striatal and Nigral Transgene Expression. Mol Ther Methods Clin Dev (2016) 3:16082. doi: 10.1038/mtm.2016.82
56. Puray-Chavez M, Tedbury PR, Huber AD, Ukah OB, Yapo V, Liu D, et al. Multiplex Single-Cell Visualization of Nucleic Acids and Protein During HIV Infection. Nat Commun (2017) 8(1):1882. doi: 10.1038/s41467-017-01693-z
57. Wang SK, Lapan SW, Hong CM, Krause TB, Cepko CL. In Situ Detection of Adeno-Associated Viral Vector Genomes With SABER-FISH. Mol Ther Methods Clin Dev (2020) 19:376–86. doi: 10.1016/j.omtm.2020.10.003
58. Zhang X, Lu W, Zheng Y, Wang W, Bai L, Chen L, et al. In Situ Analysis of Intrahepatic Virological Events in Chronic Hepatitis B Virus Infection. J Clin Invest (2016) 126(3):1079–92. doi: 10.1172/JCI83339
59. Zhao J, Yue Y, Patel A, Wasala L, Karp JF, Zhang K, et al. High-Resolution Histological Landscape of AAV DNA Distribution in Cellular Compartments and Tissues Following Local and Systemic Injection. Mol Ther Methods Clin Dev (2020) 18:856–68. doi: 10.1016/j.omtm.2020.08.006
60. Liu Q, Yang Y, Fan X. Microvascular Pericytes in Brain-Associated Vascular Disease. Biomed Pharmacother (2020) 121:109633. doi: 10.1016/j.biopha.2019.109633
61. Marques S, Zeisel A, Codeluppi S, van Bruggen D, Mendanha Falcao A, Xiao L, et al. Oligodendrocyte Heterogeneity in the Mouse Juvenile and Adult Central Nervous System. Science (2016) 352(6291):1326–9. doi: 10.1126/science.aaf6463
62. Berto S, Liu Y, Konopka G. Genomics at Cellular Resolution: Insights Into Cognitive Disorders and Their Evolution. Hum Mol Genet (2020) 29(R1):R1–9. doi: 10.1093/hmg/ddaa117
63. Gokce O, Stanley GM, Treutlein B, Neff NF, Camp JG, Malenka RC, et al. Cellular Taxonomy of the Mouse Striatum as Revealed by Single-Cell RNA-Seq. Cell Rep (2016) 16(4):1126–37. doi: 10.1016/j.celrep.2016.06.059
64. Tasic B, Menon V, Nguyen TN, Kim TK, Jarsky T, Yao Z, et al. Adult Mouse Cortical Cell Taxonomy Revealed by Single Cell Transcriptomics. Nat Neurosci (2016) 19(2):335–46. doi: 10.1038/nn.4216
65. Tasic B, Yao Z, Graybuck LT, Smith KA, Nguyen TN, Bertagnolli D, et al. Shared and Distinct Transcriptomic Cell Types Across Neocortical Areas. Nature (2018) 563(7729):72–8. doi: 10.1038/s41586-018-0654-5
66. Zeisel A, Hochgerner H, Lönnerberg P, Johnsson A, Memic F, van der Zwan J, et al. Molecular Architecture of the Mouse Nervous System. Cell (2018) 174(4):999–1014.e22. doi: 10.1016/j.cell.2018.06.021
67. Lähnemann D, Köster J, Szczurek E, McCarthy DJ, Hicks SC, Robinson MD, et al. Eleven Grand Challenges in Single-Cell Data Science. Genome Biol (2020) 21(1):31. doi: 10.1186/s13059-020-1926-6
68. Yang S, Corbett SE, Koga Y, Wang Z, Johnson WE, Yajima M, et al. Decontamination of Ambient RNA in Single-Cell RNA-Seq With DecontX. Genome Biol (2020) 21(1):57. doi: 10.1186/s13059-020-1950-6
69. Zheng GXY, Terry JM, Belgrader P, Ryvkin P, Bent ZW, Wilson R, et al. Massively Parallel Digital Transcriptional Profiling of Single Cells. Nat Commun (2017) 8(1):14049. doi: 10.1038/ncomms14049
70. Korsunsky I, Millard N, Fan J, Slowikowski K, Zhang F, Wei K, et al. Fast, Sensitive and Accurate Integration of Single-Cell Data With Harmony. Nat Methods (2019) 16(12):1289–96. doi: 10.1038/s41592-019-0619-0
71. Lin Y, Ghazanfar S, Wang KYX, Gagnon-Bartsch JA, Lo KK, Su X, et al. Scmerge Leverages Factor Analysis, Stable Expression, and Pseudoreplication to Merge Multiple Single-Cell RNA-Seq Datasets. Proc Natl Acad Sci USA (2019) 116(20):9775–84. doi: 10.1073/pnas.1820006116
72. Lopez R, Regier J, Cole MB, Jordan MI, Yosef N. Deep Generative Modeling for Single-Cell Transcriptomics. Nat Methods (2018) 15(12):1053–8. doi: 10.1038/s41592-018-0229-2
73. Lun ATL, Riesenfeld S, Andrews T, Dao TP, Gomes T, Marioni JC, et al. EmptyDrops: Distinguishing Cells From Empty Droplets in Droplet-Based Single-Cell RNA Sequencing Data. Genome Biol (2019) 20(1):63. doi: 10.1186/s13059-019-1662-y
74. Macosko EZ, Basu A, Satija R, Nemesh J, Shekhar K, Goldman M, et al. Highly Parallel Genome-Wide Expression Profiling of Individual Cells Using Nanoliter Droplets. Cell (2015) 161(5):1202–14. doi: 10.1016/j.cell.2015.05.002
75. Huang KW, Sabatini BL. Single-Cell Analysis of Neuroinflammatory Responses Following Intracranial Injection of G-Deleted Rabies Viruses. Front Cell Neurosci (2020) 14:65. doi: 10.3389/fncel.2020.00065
76. Duan D. Systemic AAV Micro-Dystrophin Gene Therapy for Duchenne Muscular Dystrophy. Mol Ther (2018) 26(10):2337–56. doi: 10.1016/j.ymthe.2018.07.011
77. Hösel M, Broxtermann M, Janicki H, Esser K, Arzberger S, Hartmann P, et al. Toll-Like Receptor 2–Mediated Innate Immune Response in Human Nonparenchymal Liver Cells Toward Adeno-Associated Viral Vectors. Hepatology (2012) 55(1):287–97. doi: 10.1002/hep.24625
78. Martino AT, Suzuki M, Markusic DM, Zolotukhin I, Ryals RC, Moghimi B, et al. The Genome of Self-Complementary Adeno-Associated Viral Vectors Increases Toll-Like Receptor 9–Dependent Innate Immune Responses in the Liver. Blood (2011) 117(24):6459–68. doi: 10.1182/blood-2010-10-314518
79. Shao W, Earley LF, Chai Z, Chen X, Sun J, He T, et al. Double-Stranded RNA Innate Immune Response Activation From Long-Term Adeno-Associated Virus Vector Transduction. JCI Insight (2018) 3(12):e120474. doi: 10.1172/jci.insight.120474
80. Zaiss AK, Cotter MJ, White LR, Clark SA, Wong NCW, Holers VM, et al. Complement Is an Essential Component of the Immune Response to Adeno-Associated Virus Vectors. J Virol (2008) 82(6):2727–40. doi: 10.1128/JVI.01990-07
81. George LA, Sullivan SK, Giermasz A, Rasko JEJ, Samelson-Jones BJ, Ducore J, et al. Hemophilia B Gene Therapy With a High-Specific-Activity Factor IX Variant. N Engl J Med (2017) 377(23):2215–27. doi: 10.1056/NEJMoa1708538
82. Manno CS, Pierce GF, Arruda VR, Glader B, Ragni M, Rasko JJE, et al. Successful Transduction of Liver in Hemophilia by AAV-Factor IX and Limitations Imposed by the Host Immune Response. Nat Med (2006) 12(3):342–7. doi: 10.1038/nm1358
83. Mingozzi F, Maus MV, Hui DJ, Sabatino DE, Murphy SL, Rasko JEJ, et al. CD8 + T-Cell Responses to Adeno-Associated Virus Capsid in Humans. Nat Med (2007) 13(4):419–22. doi: 10.1038/nm1549
84. Nathwani AC, Reiss UM, Tuddenham EGD, Rosales C, Chowdary P, McIntosh J, et al. Long-Term Safety and Efficacy of Factor IX Gene Therapy in Hemophilia B. N Engl J Med (2014) 371(21):1994–2004. doi: 10.1056/NEJMoa1407309
85. Colella P, Ronzitti G, Mingozzi F. Emerging Issues in AAV-Mediated In Vivo Gene Therapy. Mol Ther Methods Clin Dev (2018) 8:87–104. doi: 10.1016/j.omtm.2017.11.007
86. Shirley JL, de Jong YP, Terhorst C, Herzog RW. Immune Responses to Viral Gene Therapy Vectors. Mol Ther (2020) 28(3):709–22. doi: 10.1016/j.ymthe.2020.01.001
87. Chamberlin NL, Du B, de Lacalle S, Saper CB. Recombinant Adeno-Associated Virus Vector: Use for Transgene Expression and Anterograde Tract Tracing in the CNS. Brain Res (1998) 793(1–2):169–75. doi: 10.1016/S0006-8993(98)00169-3
88. McCown TJ, Xiao X, Li J, Breese GR, Jude Samulski R. Differential and Persistent Expression Patterns of CNS Gene Transfer by an Adeno-Associated Virus (AAV) Vector. Brain Res (1996) 713(1–2):99–107. doi: 10.1016/0006-8993(95)01488-8
89. Lowenstein P, Mandel R, Xiong W, Kroeger K, Castro M. Immune Responses to Adenovirus and Adeno-Associated Vectors Used for Gene Therapy of Brain Diseases: The Role of Immunological Synapses in Understanding the Cell Biology of Neuroimmune Interactions. CGT (2007) 7(5):347–60. doi: 10.2174/156652307782151498
90. Flytzanis NC, Goeden N, Goertsen D, Cummins A, Pickel J, Gradinaru V. Broad Gene Expression Throughout the Mouse and Marmoset Brain After Intravenous Delivery of Engineered AAV Capsids. bioRxiv (2020). 2020.06.16.152975. doi: 10.1101/2020.06.16.152975
91. Chang H, Lim J, Ha M, Kim VN. TAIL-Seq: Genome-Wide Determination of Poly(A) Tail Length and 3′ End Modifications. Mol Cell (2014) 53(6):1044–52. doi: 10.1016/j.molcel.2014.02.007
92. Shin S, Park J. Characterization of Sequence-Specific Errors in Various Next-Generation Sequencing Systems. Mol Biosyst (2016) 12(3):914–22. doi: 10.1039/C5MB00750J
93. Wolock SL, Lopez R, Klein AM. Scrublet: Computational Identification of Cell Doublets in Single-Cell Transcriptomic Data. Cell Syst (2019) 8(4):281–91.e9. doi: 10.1016/j.cels.2018.11.005
94. Xu C, Lopez R, Mehlman E, Regier J, Jordan MI, Yosef N. Probabilistic Harmonization and Annotation of Single-Cell Transcriptomics Data With Deep Generative Models. Mol Syst Biol (2021) 17(1):e9620. doi: 10.15252/msb.20209620
95. Yao Z, van Velthoven CTJ, Nguyen TN, Goldy J, Sedeno-Cortes AE, Baftizadeh F, et al. A Taxonomy of Transcriptomic Cell Types Across the Isocortex and Hippocampal Formation. Cell (2021) 184(12):3222–41.e26. doi: 10.1016/j.cell.2021.04.021
96. Cao Z-J, Wei L, Lu S, Yang D-C, Gao G. Searching Large-Scale scRNA-Seq Databases via Unbiased Cell Embedding With Cell BLAST. Nat Commun (2020) 11(1):3458. doi: 10.1038/s41467-020-17281-7
97. Tan Y, Cahan P. SingleCellNet: A Computational Tool to Classify Single Cell RNA-Seq Data Across Platforms and Across Species. Cell Syst (2019) 9(2):207–13.e2. doi: 10.1016/j.cels.2019.06.004
98. Choi HMT, Beck VA, Pierce NA. Next-Generation In Situ Hybridization Chain Reaction: Higher Gain, Lower Cost, Greater Durability. ACS Nano (2014) 8(5):4284–94. doi: 10.1021/nn405717p
99. Patriarchi T, Cho JR, Merten K, Howe MW, Marley A, Xiong W-H, et al. Ultrafast Neuronal Imaging of Dopamine Dynamics With Designed Genetically Encoded Sensors. Science (2018) 360(6396):eaat4422. doi: 10.1126/science.aat4422
100. He L, Vanlandewijck M, Raschperger E, Andaloussi Mäe M, Jung B, Lebouvier T, et al. Analysis of the Brain Mural Cell Transcriptome. Sci Rep (2016) 6(1):35108. doi: 10.1038/srep35108
101. Vanlandewijck M, He L, Mäe MA, Andrae J, Ando K, Del Gaudio F, et al. A Molecular Atlas of Cell Types and Zonation in the Brain Vasculature. Nature (2018) 554(7693):475–80. doi: 10.1038/nature25739
102. Yang AC, Vest RT, Kern F, Lee DP, Maat CA, Losada PM, et al. A Human Brain Vascular Atlas Reveals Diverse Cell Mediators of Alzheimer’s Disease Risk. bioRxiv (2021) 2021.04.26.441262. doi: 10.1101/2021.04.26.441262
103. Ferreira MP, Nagai MA. PHLDA3 (Pleckstrin Homology-Like Domain, Family A, Member 3). Atlas Genet Cytogenetics Oncol Haematol (2019) 24(1):8–12. doi: 10.4267/2042/70642
104. Ghouzzi VE, Bianchi FT, Molineris I, Mounce BC, Berto GE, Rak M, et al. ZIKA Virus Elicits P53 Activation and Genotoxic Stress in Human Neural Progenitors Similar to Mutations Involved in Severe Forms of Genetic Microcephaly and P53. Cell Death Dis (2016) 7(10):e2440–0. doi: 10.1038/cddis.2016.266
105. Amirinejad R, Rezaei M, Shirvani-Farsani Z. An Update on Long Intergenic Noncoding RNA P21: A Regulatory Molecule With Various Significant Functions in Cancer. Cell Biosci (2020) 10(1):82. doi: 10.1186/s13578-020-00445-9
106. Lorenzon E, Colladel R, Andreuzzi E, Marastoni S, Todaro F, Schiappacassi M, et al. MULTIMERIN2 Impairs Tumor Angiogenesis and Growth by Interfering With VEGF-A/VEGFR2 Pathway. Oncogene (2012) 31(26):3136–47. doi: 10.1038/onc.2011.487
107. Fischietti M, Arslan AD, Sassano A, Saleiro D, Majchrzak-Kita B, Ebine K, et al. Slfn2 Regulates Type I Interferon Responses by Modulating the NF-κb Pathway. Mol Cell Biol (2018) 38(16):e00053-18. doi: 10.1128/MCB.00053-18
108. Mathys H, Adaikkan C, Gao F, Young JZ, Manet E, Hemberg M, et al. Temporal Tracking of Microglia Activation in Neurodegeneration at Single-Cell Resolution. Cell Rep (2017) 21(2):366–80. doi: 10.1016/j.celrep.2017.09.039
109. Jordão MJC, Sankowski R, Brendecke SM, Sagar, Locatelli G, Tai Y-H, et al. Single-Cell Profiling Identifies Myeloid Cell Subsets With Distinct Fates During Neuroinflammation. Science (2019) 363(6425):eaat7554. doi: 10.1126/science.aat7554
110. Gralinski LE, Ashley SL, Dixon SD, Spindler KR. Mouse Adenovirus Type 1-Induced Breakdown of the Blood-Brain Barrier. JVI (2009) 83(18):9398–410. doi: 10.1128/JVI.00954-09
111. Chui R, Dorovini-Zis K. Regulation of CCL2 and CCL3 Expression in Human Brain Endothelial Cells by Cytokines and Lipopolysaccharide. J Neuroinflamm (2010) 7(1):1. doi: 10.1186/1742-2094-7-1
112. Nishimura H, Akiyama T, Irei I, Hamazaki S, Sadahira Y. Cellular Localization of Sphingosine-1-Phosphate Receptor 1 Expression in the Human Central Nervous System. J Histochem Cytochem (2010) 58(9):847–56. doi: 10.1369/jhc.2010.956409
113. Körbelin J, Dogbevia G, Michelfelder S, Ridder DA, Hunger A, Wenzel J, et al. A Brain Microvasculature Endothelial Cell-Specific Viral Vector With the Potential to Treat Neurovascular and Neurological Diseases. EMBO Mol Med (2016) 8(6):609–25. doi: 10.15252/emmm.201506078
114. De Alencastro G, Pekrun K, Valdmanis P, Tiffany M, Xu J, Kay MA. Tracking Adeno-Associated Virus Capsid Evolution by High-Throughput Sequencing. Hum Gene Ther (2020) 31(9–10):553–64. doi: 10.1089/hum.2019.339
115. Herrmann A-K, Bender C, Kienle E, Grosse S, El Andari J, Botta J, et al. A Robust and All-Inclusive Pipeline for Shuffling of Adeno-Associated Viruses. ACS Synth Biol (2019) 8(1):194–206. doi: 10.1021/acssynbio.8b00373
116. Paulk NK, Pekrun K, Zhu E, Nygaard S, Li B, Xu J, et al. Bioengineered AAV Capsids With Combined High Human Liver Transduction In Vivo and Unique Humoral Seroreactivity. Mol Ther (2018) 26(1):289–303. doi: 10.1016/j.ymthe.2017.09.021
117. Adachi K, Enoki T, Kawano Y, Veraz M, Nakai H. Drawing a High-Resolution Functional Map of Adeno-Associated Virus Capsid by Massively Parallel Sequencing. Nat Commun (2014) 5(1):3075. doi: 10.1038/ncomms4075
118. Chen KH, Boettiger AN, Moffitt JR, Wang S, Zhuang X. Spatially Resolved, Highly Multiplexed RNA Profiling in Single Cells. Science (2015) 348(6233):aaa6090. doi: 10.1126/science.aaa6090
119. Femino AM, Fay FS, Fogarty K, Singer RH. Visualization of Single RNA Transcripts In Situ. Science (1998) 280(5363):585–90. doi: 10.1126/science.280.5363.585
120. Lubeck E, Coskun AF, Zhiyentayev T, Ahmad M, Cai L. Single-Cell In Situ RNA Profiling by Sequential Hybridization. Nat Methods (2014) 11(4):360–1. doi: 10.1038/nmeth.2892
121. Shah S, Lubeck E, Zhou W, Cai L. In Situ Transcription Profiling of Single Cells Reveals Spatial Organization of Cells in the Mouse Hippocampus. Neuron (2016) 92(2):342–57. doi: 10.1016/j.neuron.2016.10.001
122. Shah S, Lubeck E, Schwarzkopf M, He TF, Greenbaum A, Sohn CH, et al. Single-Molecule RNA Detection at Depth by Hybridization Chain Reaction and Tissue Hydrogel Embedding and Clearing. Development (2016) 143(15):2862–7. doi: 10.1242/dev.138560
123. Ke R, Mignardi M, Pacureanu A, Svedlund J, Botling J, Wählby C, et al. In Situ Sequencing for RNA Analysis in Preserved Tissue and Cells. Nat Methods (2013) 10(9):857–60. doi: 10.1038/nmeth.2563
124. Lee JH, Daugharthy ER, Scheiman J, Kalhor R, Yang JL, Ferrante TC, et al. Highly Multiplexed Subcellular RNA Sequencing In Situ. Science (2014) 343(6177):1360–3. doi: 10.1126/science.1250212
125. Wang X, Allen WE, Wright MA, Sylwestrak EL, Samusik N, Vesuna S, et al. Three-Dimensional Intact-Tissue Sequencing of Single-Cell Transcriptional States. Science (2018) 361(6400):eaat5691. doi: 10.1126/science.aat5691
126. Liao J, Lu X, Shao X, Zhu L, Fan X. Uncovering an Organ’s Molecular Architecture at Single-Cell Resolution by Spatially Resolved Transcriptomics. Trends Biotechnol (2020) 39(1):43–58. doi: 10.1016/j.tibtech.2020.05.006
127. McGinnis CS, Patterson DM, Winkler J, Conrad DN, Hein MY, Srivastava V, et al. MULTI-Seq: Sample Multiplexing for Single-Cell RNA Sequencing Using Lipid-Tagged Indices. Nat Methods (2019) 16(7):619–26. doi: 10.1038/s41592-019-0433-8
128. Stoeckius M, Zheng S, Houck-Loomis B, Hao S, Yeung BZ, Mauck WM, et al. Cell Hashing With Barcoded Antibodies Enables Multiplexing and Doublet Detection for Single Cell Genomics. Genome Biol (2018) 19(1):224. doi: 10.1186/s13059-018-1603-1
129. Achim K, Pettit J-B, Saraiva LR, Gavriouchkina D, Larsson T, Arendt D, et al. High-Throughput Spatial Mapping of Single-Cell RNA-Seq Data to Tissue of Origin. Nat Biotechnol (2015) 33(5):503–9. doi: 10.1038/nbt.3209
130. Durruthy-Durruthy R, Gottlieb A, Heller S. 3D Computational Reconstruction of Tissues With Hollow Spherical Morphologies Using Single-Cell Gene Expression Data. Nat Protoc (2015) 10(3):459–74. doi: 10.1038/nprot.2015.022
131. Halpern KB, Shenhav R, Matcovitch-Natan O, Tóth B, Lemze D, Golan M, et al. Single-Cell Spatial Reconstruction Reveals Global Division of Labour in the Mammalian Liver. Nature (2017) 542(7641):352–6. doi: 10.1038/nature21065
132. Nitzan M, Karaiskos N, Friedman N, Rajewsky N. Gene Expression Cartography. Nature (2019) 576(7785):132–7. doi: 10.1038/s41586-019-1773-3
133. Satija R, Farrell JA, Gennert D, Schier AF, Regev A. Spatial Reconstruction of Single-Cell Gene Expression Data. Nat Biotechnol (2015) 33(5):495–502. doi: 10.1038/nbt.3192
134. Stuart T, Butler A, Hoffman P, Hafemeister C, Papalexi E, Mauck WM, et al. Comprehensive Integration of Single-Cell Data. Cell (2019) 177(7):1888–902.e21. doi: 10.1016/j.cell.2019.05.031
135. Ruden JB, Dugan LL, Konradi C. Parvalbumin Interneuron Vulnerability and Brain Disorders. Neuropsychopharmacol (2021) 46(2):279–87. doi: 10.1038/s41386-020-0778-9
136. Mossner JM, Batista-Brito R, Pant R, Cardin JA. Developmental Loss of MeCP2 From VIP Interneurons Impairs Cortical Function and Behavior. eLife (2020) 9:e55639. doi: 10.7554/eLife.55639
137. Batista AR, King OD, Reardon CP, Davis C, Shankaracharya, Philip V, et al. Ly6a Differential Expression in Blood–Brain Barrier Is Responsible for Strain Specific Central Nervous System Transduction Profile of AAV-PHP.B. Hum Gene Ther (2020) 31(1–2):90–102. doi: 10.1089/hum.2019.186
138. Hordeaux J, Yuan Y, Clark PM, Wang Q, Martino RA, Sims JJ, et al. The GPI-Linked Protein LY6A Drives AAV-PHP.B Transport Across the Blood-Brain Barrier. Mol Ther (2019) 27(5):912–21. doi: 10.1016/j.ymthe.2019.02.013
139. Huang Q, Chan KY, Tobey IG, Chan YA, Poterba T, Boutros CL, et al. Delivering Genes Across the Blood-Brain Barrier: LY6A, a Novel Cellular Receptor for AAV-PHP.B Capsids. PloS One (2019) 14(11):e0225206. Di Pasquale G, editor. doi: 10.1371/journal.pone.0225206
140. Perez-Nievas BG, Serrano-Pozo A. Deciphering the Astrocyte Reaction in Alzheimer’s Disease. Front Aging Neurosci (2018) 10:114. doi: 10.3389/fnagi.2018.00114
141. Wu YE, Pan L, Zuo Y, Li X, Hong W. Detecting Activated Cell Populations Using Single-Cell RNA-Seq. Neuron (2017) 96(2):313–29.e6. doi: 10.1016/j.neuron.2017.09.026
142. Blanchard JW, Bula M, Davila-Velderrain J, Akay LA, Zhu L, Frank A, et al. Reconstruction of the Human Blood-Brain Barrier In Vitro Reveals a Pathogenic Mechanism of APOE4 in Pericytes. Nat Med (2020) 26(6):952–63. doi: 10.1038/s41591-020-0886-4
143. Montagne A, Nation DA, Sagare AP, Barisano G, Sweeney MD, Chakhoyan A, et al. APOE4 Leads to Blood–Brain Barrier Dysfunction Predicting Cognitive Decline. Nature (2020) 581(7806):71–6. doi: 10.1038/s41586-020-2247-3
144. Yang Y, Vidensky S, Jin L, Jie C, Lorenzini I, Frankl M, et al. Molecular Comparison of GLT1+ and ALDH1L1+ Astrocytes In Vivo in Astroglial Reporter Mice. Glia (2011) 59(2):200–7. doi: 10.1002/glia.21089
145. Zhang Z, Ma Z, Zou W, Guo H, Liu M, Ma Y, et al. The Appropriate Marker for Astrocytes: Comparing the Distribution and Expression of Three Astrocytic Markers in Different Mouse Cerebral Regions. BioMed Res Int (2019) 2019:1–15. doi: 10.1155/2019/9605265
146. Johansen J, Tornøe J, Møller A, Johansen TE. Increased In Vitro and In Vivo Transgene Expression Levels Mediated Through Cis -Acting Elements: Cis Elements Increased Ex Vivo Gene Expression. J Gene Med (2003) 5(12):1080–9. doi: 10.1002/jgm.444
147. Qin JY, Zhang L, Clift KL, Hulur I, Xiang AP, Ren B-Z, et al. Systematic Comparison of Constitutive Promoters and the Doxycycline-Inducible Promoter. PloS One (2010) 5(5):e10611. Hansen IA, editor. doi: 10.1371/journal.pone.0010611
148. Chuah MK, Petrus I, De Bleser P, Le Guiner C, Gernoux G, Adjali O, et al. Liver-Specific Transcriptional Modules Identified by Genome-Wide In Silico Analysis Enable Efficient Gene Therapy in Mice and Non-Human Primates. Mol Ther (2014) 22(9):1605–13. doi: 10.1038/mt.2014.114
149. Jüttner J, Szabo A, Gross-Scherf B, Morikawa RK, Rompani SB, Hantz P, et al. Targeting Neuronal and Glial Cell Types With Synthetic Promoter AAVs in Mice, Non-Human Primates and Humans. Nat Neurosci (2019) 22(8):1345–56. doi: 10.1038/s41593-019-0431-2
150. Rincon MY, Sarcar S, Danso-Abeam D, Keyaerts M, Matrai J, Samara-Kuko E, et al. Genome-Wide Computational Analysis Reveals Cardiomyocyte-Specific Transcriptional Cis-Regulatory Motifs That Enable Efficient Cardiac Gene Therapy. Mol Ther (2015) 23(1):43–52. doi: 10.1038/mt.2014.178
151. Hrvatin S, Tzeng CP, Nagy MA, Stroud H, Koutsioumpa C, Wilcox OF, et al. A Scalable Platform for the Development of Cell-Type-Specific Viral Drivers. eLife (2019) 8:e48089. West AE, Dulac C, editors. doi: 10.7554/eLife.48089
152. Mich JK, Graybuck LT, Hess EE, Mahoney JT, Kojima Y, Ding Y, et al. Functional Enhancer Elements Drive Subclass-Selective Expression From Mouse to Primate Neocortex. Cell Rep (2020) 34(13):108754. doi: 10.1016/j.celrep.2021.108754
153. Gustafsson C, Govindarajan S, Minshull J. Codon Bias and Heterologous Protein Expression. Trends Biotechnol (2004) 22(7):346–53. doi: 10.1016/j.tibtech.2004.04.006
154. Kodali MC, Chen H, Liao F-F. Temporal Unsnarling of Brain’s Acute Neuroinflammatory Transcriptional Profiles Reveals Panendothelitis as the Earliest Event Preceding Microgliosis. Mol Psychiatry (2020) s41380-020-00955-5. doi: 10.1038/s41380-020-00955-5
155. Zamagni A, Pasini A, Pirini F, Ravaioli S, Giordano E, Tesei A, et al. CDKN1A Upregulation and Cisplatin−Pemetrexed Resistance in Non−Small Cell Lung Cancer Cells. Int J Oncol (2020) 56(6):1574–84. doi: 10.3892/ijo.2020.5024
156. Helin E, Matikainen S, Julkunen I, Heino J, Hyypiä T, Vainionpää R. Measles Virus Enhances the Expression of Cellular Immediate-Early Genes and DNA-Binding of Transcription Factor AP-1 in Lung Epithelial A549 Cells. Arch Virol (2002) 147(9):1721–32. doi: 10.1007/s00705-002-0835-1
157. Chen W, Zhang S, Williams J, Ju B, Shaner B, Easton J, et al. A Comparison of Methods Accounting for Batch Effects in Differential Expression Analysis of UMI Count Based Single Cell RNA Sequencing. Comput Struct Biotechnol J (2020) 18:861–73. doi: 10.1016/j.csbj.2020.03.026
158. Ding J, Adiconis X, Simmons SK, Kowalczyk MS, Hession CC, Marjanovic ND, et al. Systematic Comparison of Single-Cell and Single-Nucleus RNA-Sequencing Methods. Nat Biotechnol (2020) 38(6):737–46. doi: 10.1038/s41587-020-0465-8
159. Lacar B, Linker SB, Jaeger BN, Krishnaswami SR, Barron JJ, Kelder MJE, et al. Nuclear RNA-Seq of Single Neurons Reveals Molecular Signatures of Activation. Nat Commun (2016) 7(1):11022. doi: 10.1038/ncomms11022
160. Rosenberg AB, Roco CM, Muscat RA, Kuchina A, Sample P, Yao Z, et al. Single-Cell Profiling of the Developing Mouse Brain and Spinal Cord With Split-Pool Barcoding. Science (2018) 360(6385):176–82. doi: 10.1126/science.aam8999
161. Challis RC, Kumar SR, Chan KY, Challis C, Beadle K, Jang MJ, et al. Systemic AAV Vectors for Widespread and Targeted Gene Delivery in Rodents. Nat Protoc (2019) 14:379–414. doi: 10.1038/s41596-018-0097-3
162. Pool A-H, Wang T, Stafford DA, Chance RK, Lee S, Ngai J, et al. The Cellular Basis of Distinct Thirst Modalities. Nature (2020) 588:112–7. doi: 10.1038/s41586-020-2821-8
163. Oikonomou G, Altermatt M, Zhang R, Coughlin GM, Montz C, Gradinaru V, et al. The Serotonergic Raphe Promote Sleep in Zebrafish and Mice. Neuron (2019) 103(4):686–701.e8. doi: 10.1016/j.neuron.2019.05.038
164. Schindelin J, Arganda-Carreras I, Frise E, Kaynig V, Longair M, Pietzsch T, et al. Fiji: An Open-Source Platform for Biological-Image Analysis. Nat Methods (2012) 9(7):676–82. doi: 10.1038/nmeth.2019
165. Love MI, Huber W, Anders S. Moderated Estimation of Fold Change and Dispersion for RNA-Seq Data With Deseq2. Genome Biol (2014) 15(12):550. doi: 10.1186/s13059-014-0550-8
166. Wolf FA, Angerer P, Theis FJ. SCANPY: Large-Scale Single-Cell Gene Expression Data Analysis. Genome Biol (2018) 19(1):15. doi: 10.1186/s13059-017-1382-0
167. Cahoy JD, Emery B, Kaushal A, Foo LC, Zamanian JL, Christopherson KS, et al. A Transcriptome Database for Astrocytes, Neurons, and Oligodendrocytes: A New Resource for Understanding Brain Development and Function. J Neurosci (2008) 28(1):264–78. doi: 10.1523/JNEUROSCI.4178-07.2008
168. Sun W, Cornwell A, Li J, Peng S, Osorio MJ, Aalling N, et al. SOX9 Is an Astrocyte-Specific Nuclear Marker in the Adult Brain Outside the Neurogenic Regions. J Neurosci (2017) 37(17):4493–507. doi: 10.1523/JNEUROSCI.3199-16.2017
169. Lin Y-S, Wang H-Y, Huang D-F, Hsieh P-F, Lin M-Y, Chou C-H, et al. Neuronal Splicing Regulator RBFOX3 (NeuN) Regulates Adult Hippocampal Neurogenesis and Synaptogenesis. PloS One (2016) 11(10):e0164164. Borlongan CV, editor. doi: 10.1371/journal.pone.0164164
170. Song HW, Foreman KL, Gastfriend BD, Kuo JS, Palecek SP, Shusta EV. Transcriptomic Comparison of Human and Mouse Brain Microvessels. Sci Rep (2020) 10(1):12358. doi: 10.1038/s41598-020-69096-7
171. Veys K, Fan Z, Ghobrial M, Bouché A, García-Caballero M, Vriens K, et al. Role of the GLUT1 Glucose Transporter in Postnatal CNS Angiogenesis and Blood-Brain Barrier Integrity. Circ Res (2020) 127(4):466–82. doi: 10.1161/CIRCRESAHA.119.316463
172. Winkler EA, Bell RD, Zlokovic BV. Pericyte-Specific Expression of PDGF Beta Receptor in Mouse Models With Normal and Deficient PDGF Beta Receptor Signaling. Mol Neurodegeneration (2010) 5(1):32. doi: 10.1186/1750-1326-5-32
173. Capellera-Garcia S, Pulecio J, Dhulipala K, Siva K, Rayon-Estrada V, Singbrant S, et al. Defining the Minimal Factors Required for Erythropoiesis Through Direct Lineage Conversion. Cell Rep (2016) 15(11):2550–62. doi: 10.1016/j.celrep.2016.05.027
174. Chasseigneaux S, Moraca Y, Cochois-Guégan V, Boulay A-C, Gilbert A, Le Crom S, et al. Isolation and Differential Transcriptome of Vascular Smooth Muscle Cells and Mid-Capillary Pericytes From the Rat Brain. Sci Rep (2018) 8(1):12272. doi: 10.1038/s41598-018-30739-5
175. Dai J, Bercury KK, Ahrendsen JT, Macklin WB. Olig1 Function Is Required for Oligodendrocyte Differentiation in the Mouse Brain. J Neurosci (2015) 35(10):4386–402. doi: 10.1523/JNEUROSCI.4962-14.2015
176. Suzuki N, Sekimoto K, Hayashi C, Mabuchi Y, Nakamura T, Akazawa C. Differentiation of Oligodendrocyte Precursor Cells From Sox10-Venus Mice to Oligodendrocytes and Astrocytes. Sci Rep (2017) 7(1):14133. doi: 10.1038/s41598-017-14207-0
Keywords: gene therapy, next generation sequencing, computational biology, molecular biology, neuroscience
Citation: Brown D, Altermatt M, Dobreva T, Chen S, Wang A, Thomson M and Gradinaru V (2021) Deep Parallel Characterization of AAV Tropism and AAV-Mediated Transcriptional Changes via Single-Cell RNA Sequencing. Front. Immunol. 12:730825. doi: 10.3389/fimmu.2021.730825
Received: 25 June 2021; Accepted: 17 September 2021;
Published: 21 October 2021.
Edited by:
Nicole K. Paulk, University of California, San Francisco, United StatesReviewed by:
Ronzitti Giuseppe, Genethon, FranceMartin Borch Jensen, Gordian Biotechnology, Inc., United States
Copyright © 2021 Brown, Altermatt, Dobreva, Chen, Wang, Thomson and Gradinaru. This is an open-access article distributed under the terms of the Creative Commons Attribution License (CC BY). The use, distribution or reproduction in other forums is permitted, provided the original author(s) and the copyright owner(s) are credited and that the original publication in this journal is cited, in accordance with accepted academic practice. No use, distribution or reproduction is permitted which does not comply with these terms.
*Correspondence: Viviana Gradinaru, dml2aWFuYUBjYWx0ZWNoLmVkdQ==; Matt Thomson, bXRob21zb25AY2FsdGVjaC5lZHU=
†ORCID: David Brown, orcid.org/0000-0002-9757-1744
Michael Altermatt, orcid.org/0000-0003-2841-5374
Tatyana Dobreva, orcid.org/0000-0002-2625-8873
Sisi Chen, orcid.org/0000-0001-9448-9713
Alex Wang, orcid.org/0000-0001-7375-5445
Viviana Gradinaru, orcid.org/0000-0001-5868-348X
‡These authors have contributed equally to this work