 James F. Read1,2*
 Michael Serralha1
 Danny Mok1Barbara J. Holt1
 Mark Cruickshank3Yuliya V. Karpievitch1,3
 David I. Broadhurst4
 Peter D. Sly5
 Deborah H. Strickland1,6
 Stacey N. Reinke4Patrick G. Holt1,6
 Anthony Bosco1,6,7,8*
- 1Telethon Kids Institute, The University of Western Australia, Perth, WA, Australia
- 2School of Medicine, The University of Western Australia, Nedlands, WA, Australia
- 3School of Biomedical Sciences, The University of Western Australia, Nedlands, WA, Australia
- 4Centre for Integrative Metabolomics & Computational Biology, School of Science, Edith Cowan University, Joondalup, WA, Australia
- 5Child Health Research Centre, The University of Queensland, Brisbane, QLD, Australia
- 6The University of Western Australia Centre for Child Health Research, The University of Western Australia, Nedlands, WA, Australia
- 7Asthma and Airway Disease Research Center, University of Arizona, Tucson, AZ, United States
- 8Department of Immunobiology, The University of Arizona College of Medicine, Tucson, AZ, United States
Appropriate innate immune function is essential to limit pathogenesis and severity of severe lower respiratory infections (sLRI) during infancy, a leading cause of hospitalization and risk factor for subsequent asthma in this age group. Employing a systems biology approach to analysis of multi-omic profiles generated from a high-risk cohort (n=50), we found that the intensity of activation of an LPS-induced interferon gene network at birth was predictive of sLRI risk in infancy (AUC=0.724). Connectivity patterns within this network were stronger among susceptible individuals, and a systems biology approach identified IRF1 as a putative master regulator of this response. These findings were specific to the LPS-induced interferon response and were not observed following activation of viral nucleic acid sensing pathways. Comparison of responses at birth versus age 5 demonstrated that LPS-induced interferon responses but not responses triggered by viral nucleic acid sensing pathways may be subject to strong developmental regulation. These data suggest that the risk of sLRI in early life is in part already determined at birth, and additionally that the developmental status of LPS-induced interferon responses may be a key determinant of susceptibility. Our findings provide a rationale for the identification of at-risk infants for early intervention aimed at sLRI prevention and identifies targets which may be relevant for drug development.
Introduction
Severe lower respiratory tract infections (sLRIs) are a leading cause of emergency room presentations by infants and children (1, 2), and are a major risk factor for the development of asthma and wheeze (3–6). Rhinovirus (RV) and Respiratory Syncytial Virus (RSV) are the most important triggers of early life respiratory infections and asthma development (7–9). Several studies have found that associations between sLRI and asthma are strongest in children with RV-related wheezing and early aeroallergen sensitization (5, 6, 10, 11), although a causal relationship remains to be established (7). However, RV can routinely be detected in asthmatic children in the absence of asthmatic symptoms, suggesting that RV may be necessary but not sufficient to drive the pathogenesis of asthma (12). In this regard it has been demonstrated that bacterial pathogens, including Moraxella, Streptococcus, and Haemophilus species, are important triggers of wheezy episodes in young children (13, 14), and may also contribute towards asthma inception (15, 16). Furthermore, the presence of pathogenic bacteria in the nasopharynx during acute respiratory viral infections may increase the likelihood of infection spread to the lower airways, amplifying ensuing inflammatory symptoms and increasing risk of subsequent asthma development (17, 18), although much remains unknown regarding virus-bacteria interactions in the airways and asthma development (19, 20). Conversely, exposure to microbes and their products during early childhood has also been shown to protect against asthma, perhaps most elegantly illustrated through the “farm effect” (21, 22). The underlying immunological mechanisms that determine why some individuals are more susceptible to sLRIs in early life, and subsequent asthma, are not well understood. Innate immune function in the immediate postnatal period, which experiences drastic developmental changes (8, 23–25), provides a logical link between early life microbial exposure and infection susceptibility. This has prompted investigation of molecular events downstream of pathogen recognition receptor (PRR) activation, such as Toll-like receptors (TLRs), in blood collected at birth and in early life (26–31). For example, reduced type 1/3 interferon response capacity following stimulation with Polyinosinic-polycytidylic acid (Poly(I:C)) – a potent activator of TLR3 – in cord blood cells is associated with increased risk for febrile LRIs and early childhood wheeze (31). Moreover, enhanced production of the proinflammatory cytokine IL-1β following bacterial lipopolysaccharide (LPS) activation of cord blood was observed in individuals at risk of childhood-onset asthma, in association with increased SMAD3 methylation and maternal asthma status (30). These examples reveal that aspects of innate immunity which may confer risk for sLRIs and subsequent asthma are already detectable at birth. The aim of the present study was to determine if innate immune response profiles induced by bacterial LPS or viral nucleic acid sensing pathways (Poly(I:C) and Imiquimod) at birth could predict sLRI in the first year of life. The rationale for selecting these pathways is that previous studies have highlighted the role of bacteria, respiratory viral infections, and innate immune responses to the selected TLR agonists in asthma risk (7, 9, 15, 30–33).
Materials and methods
Study population
Subjects were a subset of 50 individuals from the Childhood Asthma Study, a 10 year prospective birth cohort enrolled prenatally for high risk of asthma development, as described previously (5, 31, 34–36). Of the 60 subjects with at least one CBMC aliquot remaining from the cohort, nine were excluded due to insufficient information (withdrawn before the 1 year follow-up) and a further subject was excluded for insufficient sample volume. Acute respiratory infections were considered sLRIs if wheeze and/or fever was present in addition to chest rattle, as this definition has previously been linked to persistent wheeze and asthma in this cohort (5, 35) (Supplementary Methods). Respiratory viral infection histories were determined from detailed assessment and nasopharyngeal aspirates (RT-PCR) collected during home visits within 48 hours of symptom development (5, 34). Ethics was approved by The University of Western Australia (reference RA/4/1/7560), and fully informed parental consent was obtained for all subjects.
Immunophenotyping
Approximately 1x10⁶ CBMCs from each sample were immunophenotyped with a panel of 11 monoclonal antibodies to measure CD3, CD4, CD11c, CD14, CD19, CD25, CD123, CD127, FcϵRIα, FoxP3, and HLA-DR. Individual cells were acquired using the LSRFortessa platform with FACSDiva software (BD Biosciences) following quality control measures. FlowJo (v10.5) software and R were used for pre-processing and analysis (Supplementary Methods).
In vitro cell culture
Samples were assigned randomized blocks and cultured sequentially by the same personnel using consistent reagent/stimuli stocks. Cord blood erythrocytes were immunomagnetically depleted (EasySep kit, StemCell, Cat no. 18170) and each sample was cultured in RPMI 1640 (Gibco, Cat No. 11875119) supplemented with 5% AB serum (Sigma-Aldrich, Cat. No. H3667) for 18 hours (37°C, 5% CO2) with 1ng/ml LPS (Enzo Biochem, Cat No. ALX-581-007-L001; derived from E. coli, serotype R515), 5μl/ml Imiquimod (In vivo Gen, Cat. Code: tlrl-imq) or 50μl/ml Poly(I:C) (In vivo Gen, Cat. Code: tlrl-pic), alongside matched unstimulated controls. Poly(I:C), bacterial LPS, and Imiquimod were selected as they are activators of TLRs 3, 4, and 7, respectively, thereby triggering innate immune responses to LPS and viral nucleic acid sensing pathways. However, it is noteworthy that Poly(I:C), a synthetic analogue of double-stranded RNA, can also activate the viral-related PRRs RIG-I and MDA5 (37). Aliquots of culture supernatant were immediately snap frozen in liquid nitrogen for metabolomic profiling or stored at -20°C for cytokine quantification. Cell pellets were stored in TRIzol reagent (Invitrogen, Cat No. 15596026) at -20°C for RNA extraction.
Data generation
Detailed information on sample and data processing and quality control are available in the Supplementary Methods.
RNA-Seq: RNA was purified with RNeasy MinElute Kits (Qiagen, Cat No. 74204) and libraries were prepared with NEBNext Ultra II Kits (NE BioLabs) for sequencing on the NovaSeq 6000 (Illumina) platform. Standard methods were applied for pre-processing, alignment (GRCh38), and transcript quantification. RNA-Seq data is available from the NCBI Gene Expression Omnibus repository (38) (accession number GSE184383).
Cytokines: The concentrations of 48 cytokines (Bio-plex Pro, BioRad, Cat. No: 12007283) were simultaneously quantified with the Luminex 200 system (Luminex). Nine cytokines were outside the limit of detection in >20% of stimulated samples and were removed. Raw and processed data are provided in Data S1.
Metabolites: Untargeted metabolomic data was generated with liquid chromatography (HILIC and C18 modes) separation coupled to a Q Exactive Orbitrap mass spectrometer (Thermo Fisher Scientific) in electrospray positive ionisation mode (LC-MS/MS). QC samples were interspersed throughout the run order to assess and correct variability. Metabolites were filtered according to stringent statistical and annotation thresholds (39). Raw and processed data are provided in Data S2.
Transcriptomic analysis
Differentially expressed genes (DEG) were identified [EdgeR (40)] using an absolute log2 fold change >1.5 and an adjusted P value < 0.01 (Benjamini-Hochberg adjusted False Discovery Rate). Moderated t-statistics were calculated with limma/voom (41). Pathways analysis of upregulated/downregulated genes was performed with InnateDB (42). Cellular composition was estimated from post-culture gene expression with CIBERSORTx (43) with single cell RNA-seq cord blood reference profiles curated from the Human Cell Atlas (44). Gene expression data was partitioned into response context-specific modules with WGCNA (45). Modules were annotated by employing a consensus approach derived from Gene Ontology (GOenrichmentAnalysis), ReactomePA (46), and clusterProfiler (47) R packages, and InnateDB (42). Additionally, we employed the blood transcriptional module repertoire from BloodGen3Module to confirm that the principal modules of interest related to innate immune function we identified following WGCNA analysis (interferon and proinflammatory modules) were captured with an independent method (48). Separate response networks were created for each condition and included matched unstimulated controls, as detailed in the Supplementary Methods.
Master regulator analysis
To identify transcription factors that act as master regulators of gene expression profiles, a gene regulator network was reverse engineered with ARACNe (49) and transcription factor activity was inferred with VIPER (50) (detailed in Supplementary Methods). Significant TFs (p<0.05) were considered drivers of the responses if they had known binding motifs in the region of regulon target genes (500bp upstream and 100bp downstream) determined by RcisTarget (51). Normalised expression scores (NES) outputted from VIPER were retained for downstream analysis.
Machine learning
Gene expression data was randomly assigned into training and validation sets and filtered to only the respective module genes for each analysis. The random assignment was 50% training/50% validation. The RandomForest R package was used for random forest model construction, and the number of decision trees (ntree) and candidate variables (mtry) were optimized according to the out-of-bag error rate (Supplementary Methods). Model construction and classification was repeated thousands of times after randomly re-assigning samples into train/validation groups (retaining the original optimized parameters) and this was repeated with 60/40 and 70/30 splits (Supplementary Methods). This step was included to ensure the results were robust with respect to the randomized train/test group assignment. The same random assignment with respect to individual subjects was applied for LPS/CTRL, Poly(I:C)/CTRL, and Imiquimod/CTRL models. For random forest models used to predict infection status in independent cohorts of infant/childhood infection, CAS cohort data was filtered to respective module genes and used as the training set, and the external gene expression data was used for validation (filtered to identical input genes).
Multi-omic data integration
A DIABLO (52) model was constructed for supervised multi-omic data integration, which generalizes Partial Least Squares analysis to maximize co-expression between matched datasets. All datasets (except immunophenotyping) for LPS-stimulated CBMC samples were baseline adjusted prior to analysis, and gene expression data was filtered to significantly variable genes (n=6344) to reduce noise. The number of components and feature selection parameters were tuned with 5x cross-validation (Supplementary Methods).
Results
Study population
The study population consisted of a subset of 50 children within the Childhood Asthma Study (CAS) cohort (5, 34–36, 53). 23 subjects (46%) experienced at least one wheezy and/or febrile sLRI in their first year (infancy) and this was the primary outcome of interest (Table 1). These individuals typically experienced 1 or 2 sLRIs in the first year of life, and a similar number recorded both wheezy and febrile (8/23, 34.8%), wheezy only (7/23, 30.4%), and febrile only (8/23, 34.8%) sLRIs (Table S1 and Figure S1A). No difference was observed with respect to sex, gestational weeks, birth weight, skin prick test positivity to common aeroallergens, and URIs in infancy for the primary outcome (Table S1). Overall, this subset was found to be representative of the total CAS cohort (n=263) with respect to key clinical characteristics (Table 1). RV was the most frequent viral agent identified from the first year of life in this subset (present in 56.9% of infectious nasopharyngeal samples) followed by RSV (13.125%), and this was representative of the total cohort (Figures 1, S1).
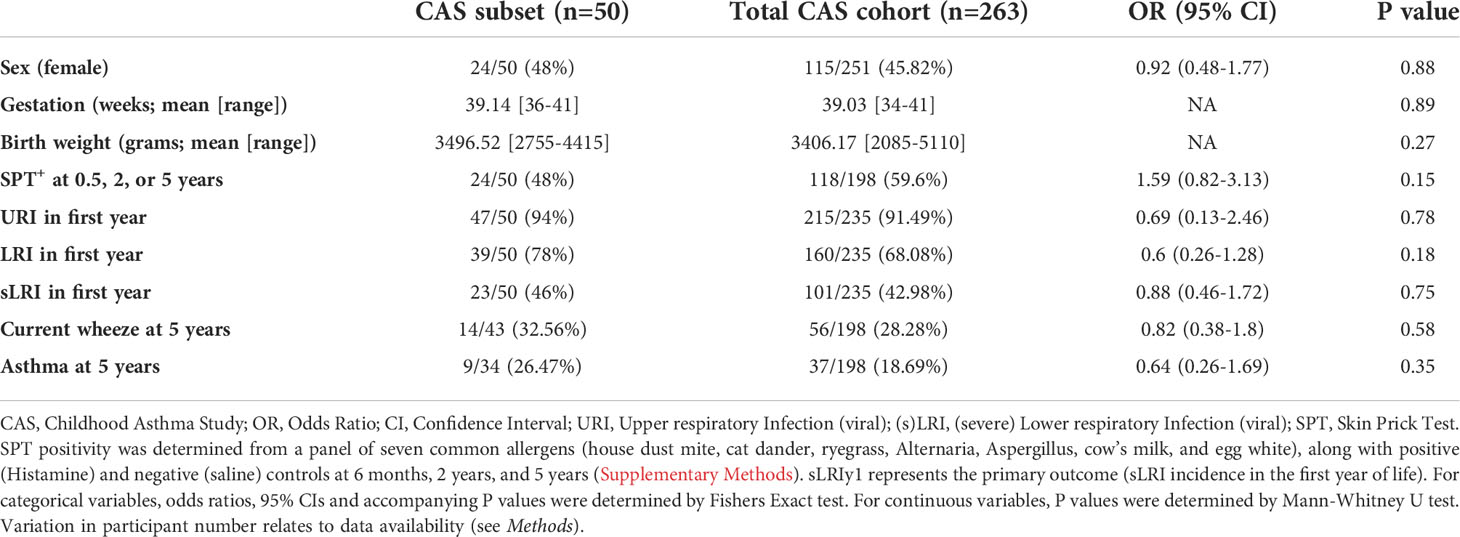
Table 1 Characteristics and representativeness of the study subset.
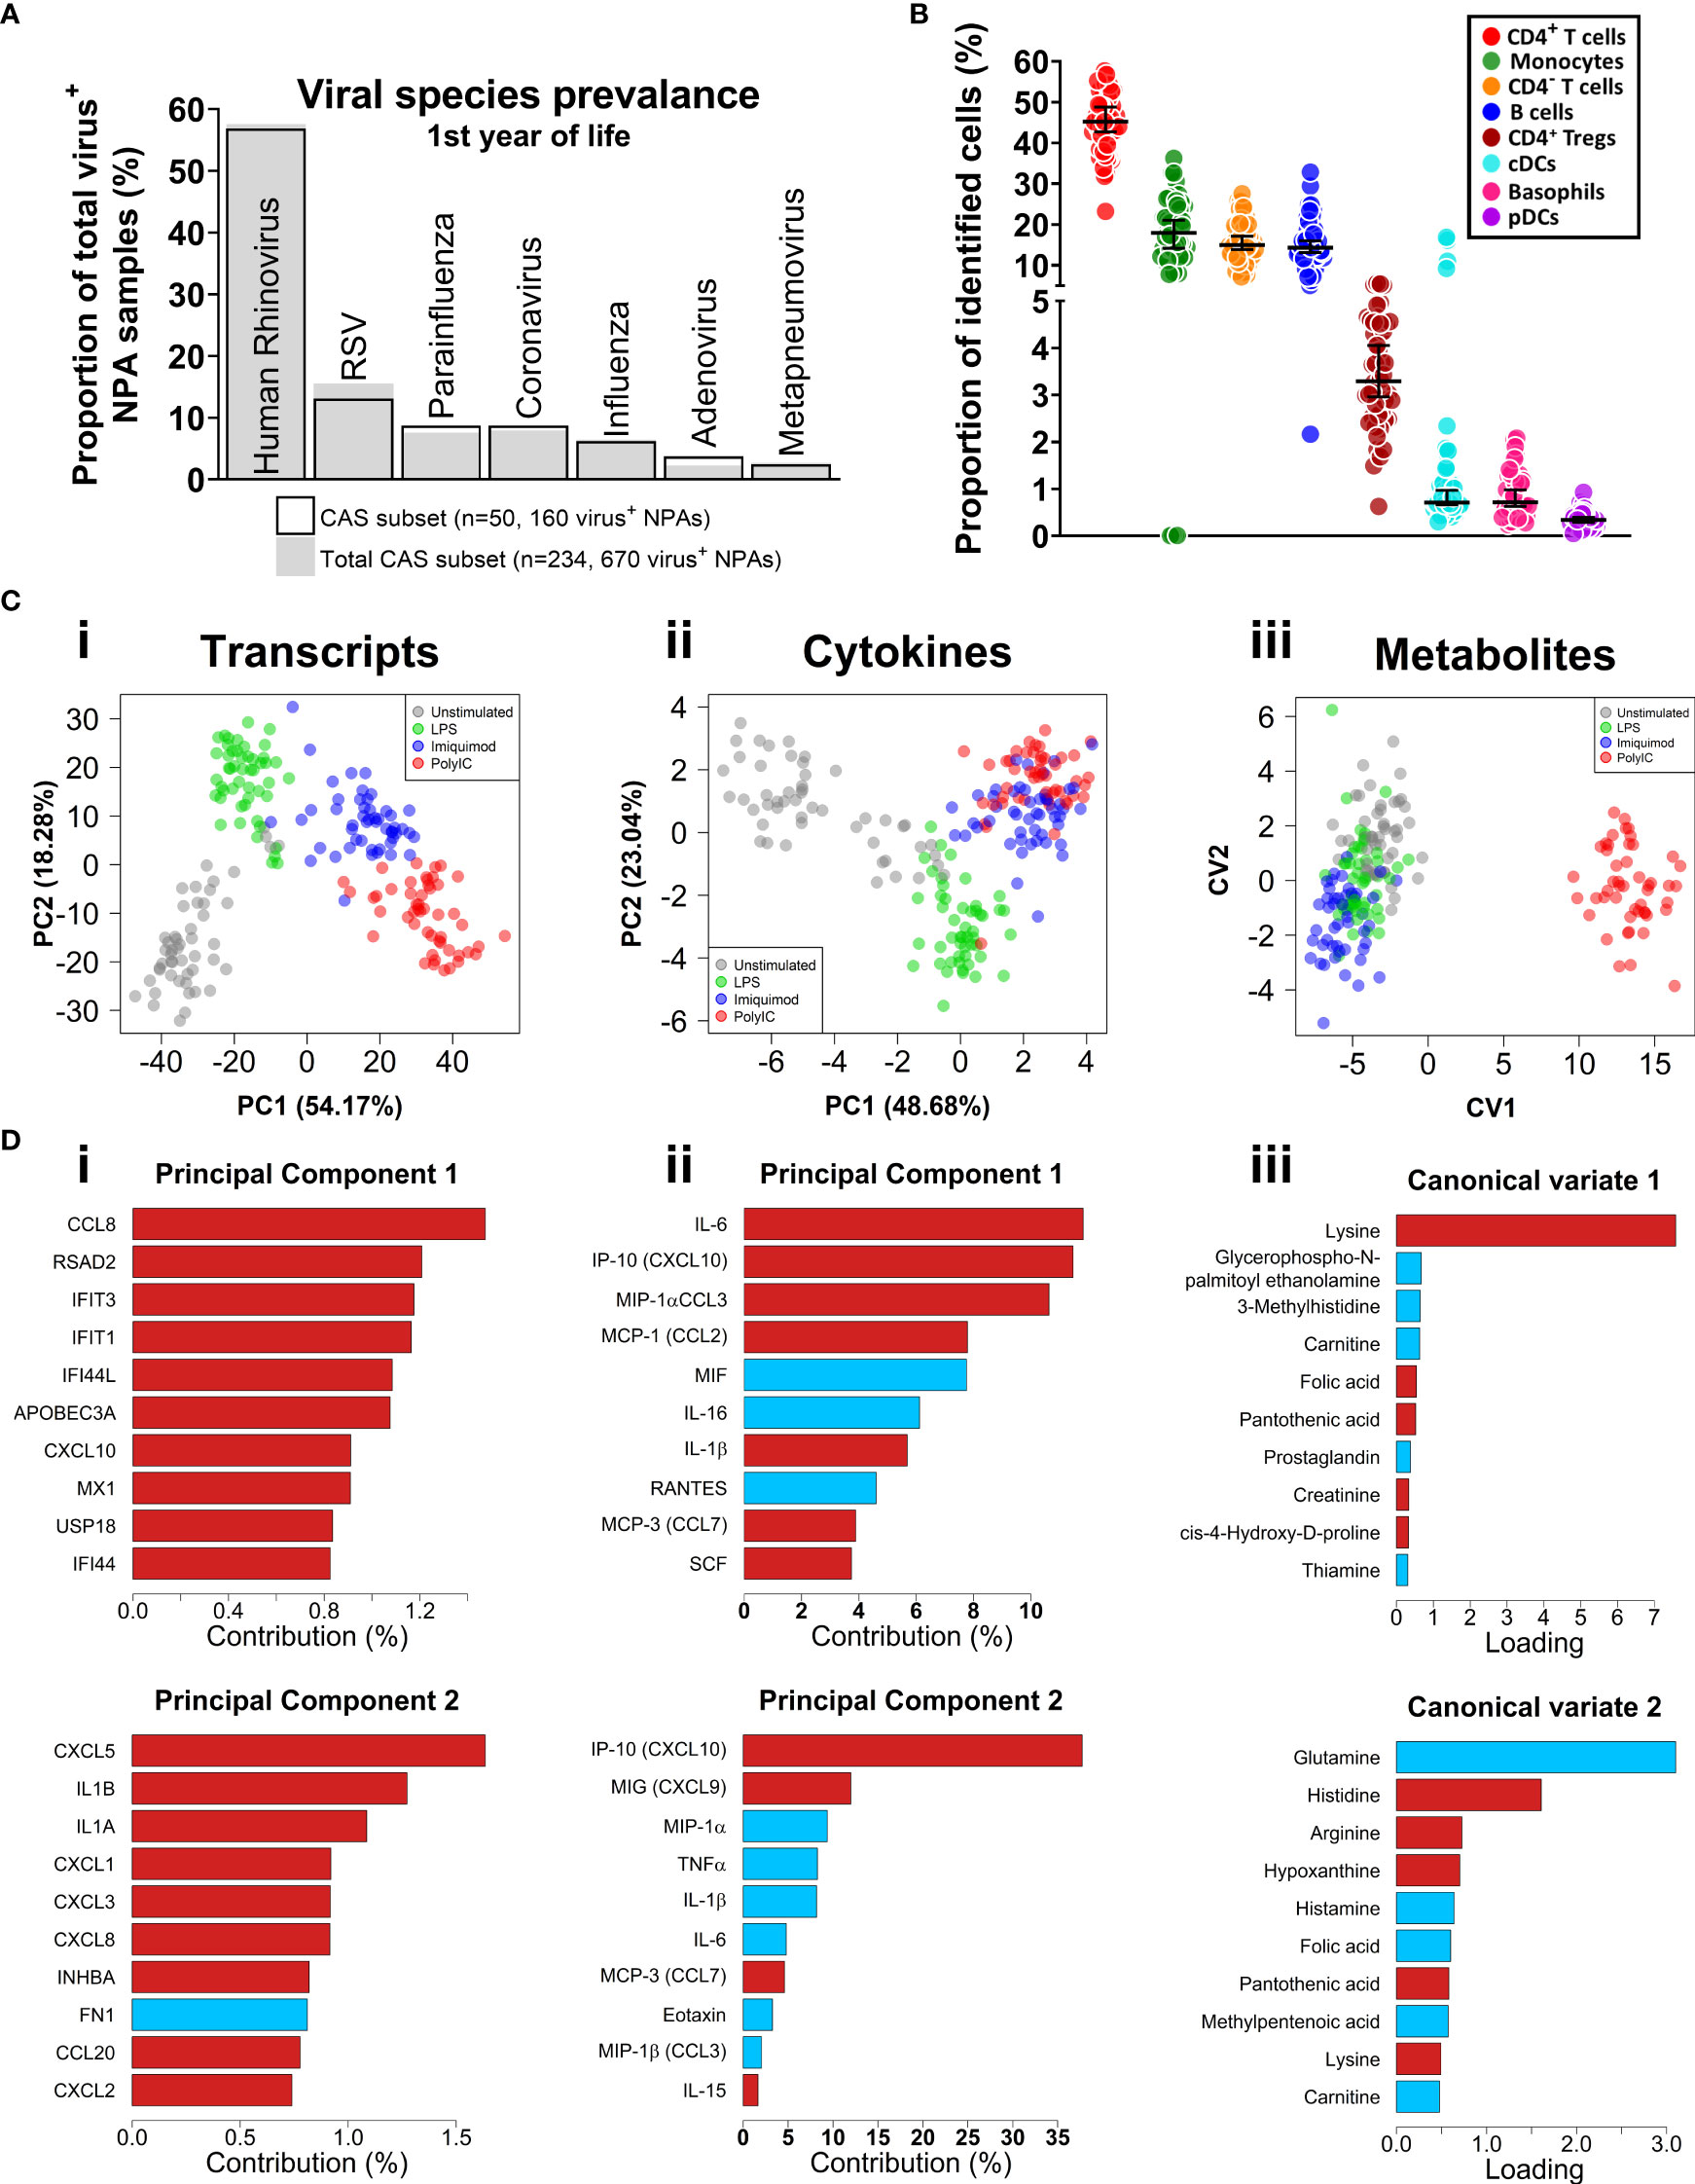
Figure 1 Respiratory virus prevalence, baseline CBMC cell proportions, multi-omic data set overview. (A) Bar plot of viral agents detected from infectious NPAs taken during year one (proportion of total virus+ NPAs). Bars denote study subset (n=50), grey fill represents individuals who recorded an sLRI in year 1 from the total cohort (n=234). (B) Immunophenotyping of baseline CBMC samples. Y-axis shows cell type as a proportion of identified cells. Scatterplots shows median and 95% CI. (C) Multi-level dimensionality reduction for gene expression (PCA), cytokine (PCA), and metabolite (cross validated CVA) datasets. Axes show coordinates of the first (x-axis) and second (y-axis) components/variates. (D) Horizontal bar plots showing top contributing features for the first (i-iii) and second (iv-vi) principal components or canonical variates for the corresponding plots in (C), above. X-axis shows absolute contribution (%)/loading; red/blue indicates positive/negative relative contribution.
Baseline flow cytometry
We applied an 11-colour flow cytometry panel to baseline cord blood mononuclear cell (CBMC) samples to assess cellular composition. Lymphocytes (T and B cells) composed the majority of cell types identified among CBMC (Figures 1B and S1B). CD14+ monocytes and conventional dendritic cells (cDC) were identified among the myeloid compartment, and smaller proportions of plasmacytoid DCs (pDC) and basophils were also identified. The was no difference in baseline cellular composition with respect to sLRI in the first year of life (Figure S1C).
Multi-omic profiling of innate immune responses in CBMC
CBMC from all 50 subjects were cultured for 18 hours with LPS, or Imiquimod, or Poly(I:C) to trigger innate immune responses, along with unstimulated controls. This timepoint was selected to capture signalling cascades downstream of the immediate and secondary response programs (54–56). Gene expression was profiled from cell pellets (RNA-Seq) and supernatants were used to profile cytokines (multiplex assay) and metabolites (LC-MS/MS). Matching PBMC samples collected at age 5 were available for a subset of the subjects (n = 27), and these were cultured in parallel under the same conditions. Following data pre-processing and filtering, 17,363 transcripts, 39 cytokines, and 47 metabolites were available for analysis (see Methods). We applied unsupervised Principal Component Analysis (PCA; transcripts, cytokines) and supervised Canonical Variate Analysis (CVA; metabolites) dimensionality reduction for exploratory data analysis. The samples from each biological layer clustered by stimuli as expected (Figure 1C). For transcripts and cytokines, the first two principal components captured interferon (IFN) and proinflammatory features (e.g., CXCL10/IP-10, IL-1β, IL-6) (Figure 1D). Poly(I:C)-stimulated cord blood sample clustering by metabolites was driven by lysine on the first canonical variate, and other amino acids (e.g., glutamine, histidine) were identified for the second and third canonical variates (Figures 1C, D, S1D,E).
IFN and proinflammatory gene expression programs are upregulated in CBMC responses
We focused on the transcriptomics data to further investigate cord blood responses to LPS, Poly(I:C), and Imiquimod treatment as these data provide genome-wide coverage. Employing differential expression analysis, we identified 641 differently expressed genes (DEGs) for the cord blood LPS response (Log2-fold change > 1, FDR adjusted-P value < 0.01), and greater than 1000 DEGs for the imiquimod and Poly(I:C) responses (Figure 2A). Pathways analysis [InnateDB (42)] identified an enrichment of cytokine and chemokine signalling pathways from upregulated genes in all responses, and IFN signalling pathways were prominent for imiquimod and Poly(I:C) CBMC responses (Figures 2B, S1F). Notably, the viral-related stimuli triggered a common set of 429 upregulated genes and this constituted a core antiviral response shared between Poly(I:C) and Imiquimod responses (Figure S1G). In addition, we identified 462 and 243 genes that were specifically upregulated in response to Poly(I:C) and Imiquimod respectively, demonstrating unique signalling pathways downstream of their receptors (Figure S1G). We next employed CIBERSORTx to estimate the post-culture cellular composition from the RNA-Seq data (43). Prominent cell types included monocytes, B cells, and CD4+ T cells (Figures S2A,B). The erythrocyte proportion was negligible as a result of immunomagnetic depletion (see Methods). Cell composition changes were identified between stimuli and age, but not sequence order or sex (Figures S2C,D). There was also no difference in the estimated cellular composition between individuals who were resistant or susceptible to sLRI in infancy, aligning with the baseline flow cytometry findings (Figures S1C, S2D). We also investigated variations in innate immune gene expression in the matching samples collected at birth versus age 5 (n=27 per age/stimuli) (Figures S2E, F). Interestingly, the LPS response at 5 years was characterised by upregulation of IFN-related genes, including IRF1, STAT1, and IFIT1-3, compared to birth. In contrast, IFN-related pathways were not prominent from differentially expressed genes between birth and age 5 following imiquimod or Poly(I:C) stimulation (Figures S2E, F). Finally, no genes were significantly different between individuals resistant and susceptible to sLRIs in infancy for any condition from this analysis (data not shown), suggesting that sLRI risk is not conferred by individual gene expression magnitude alone.
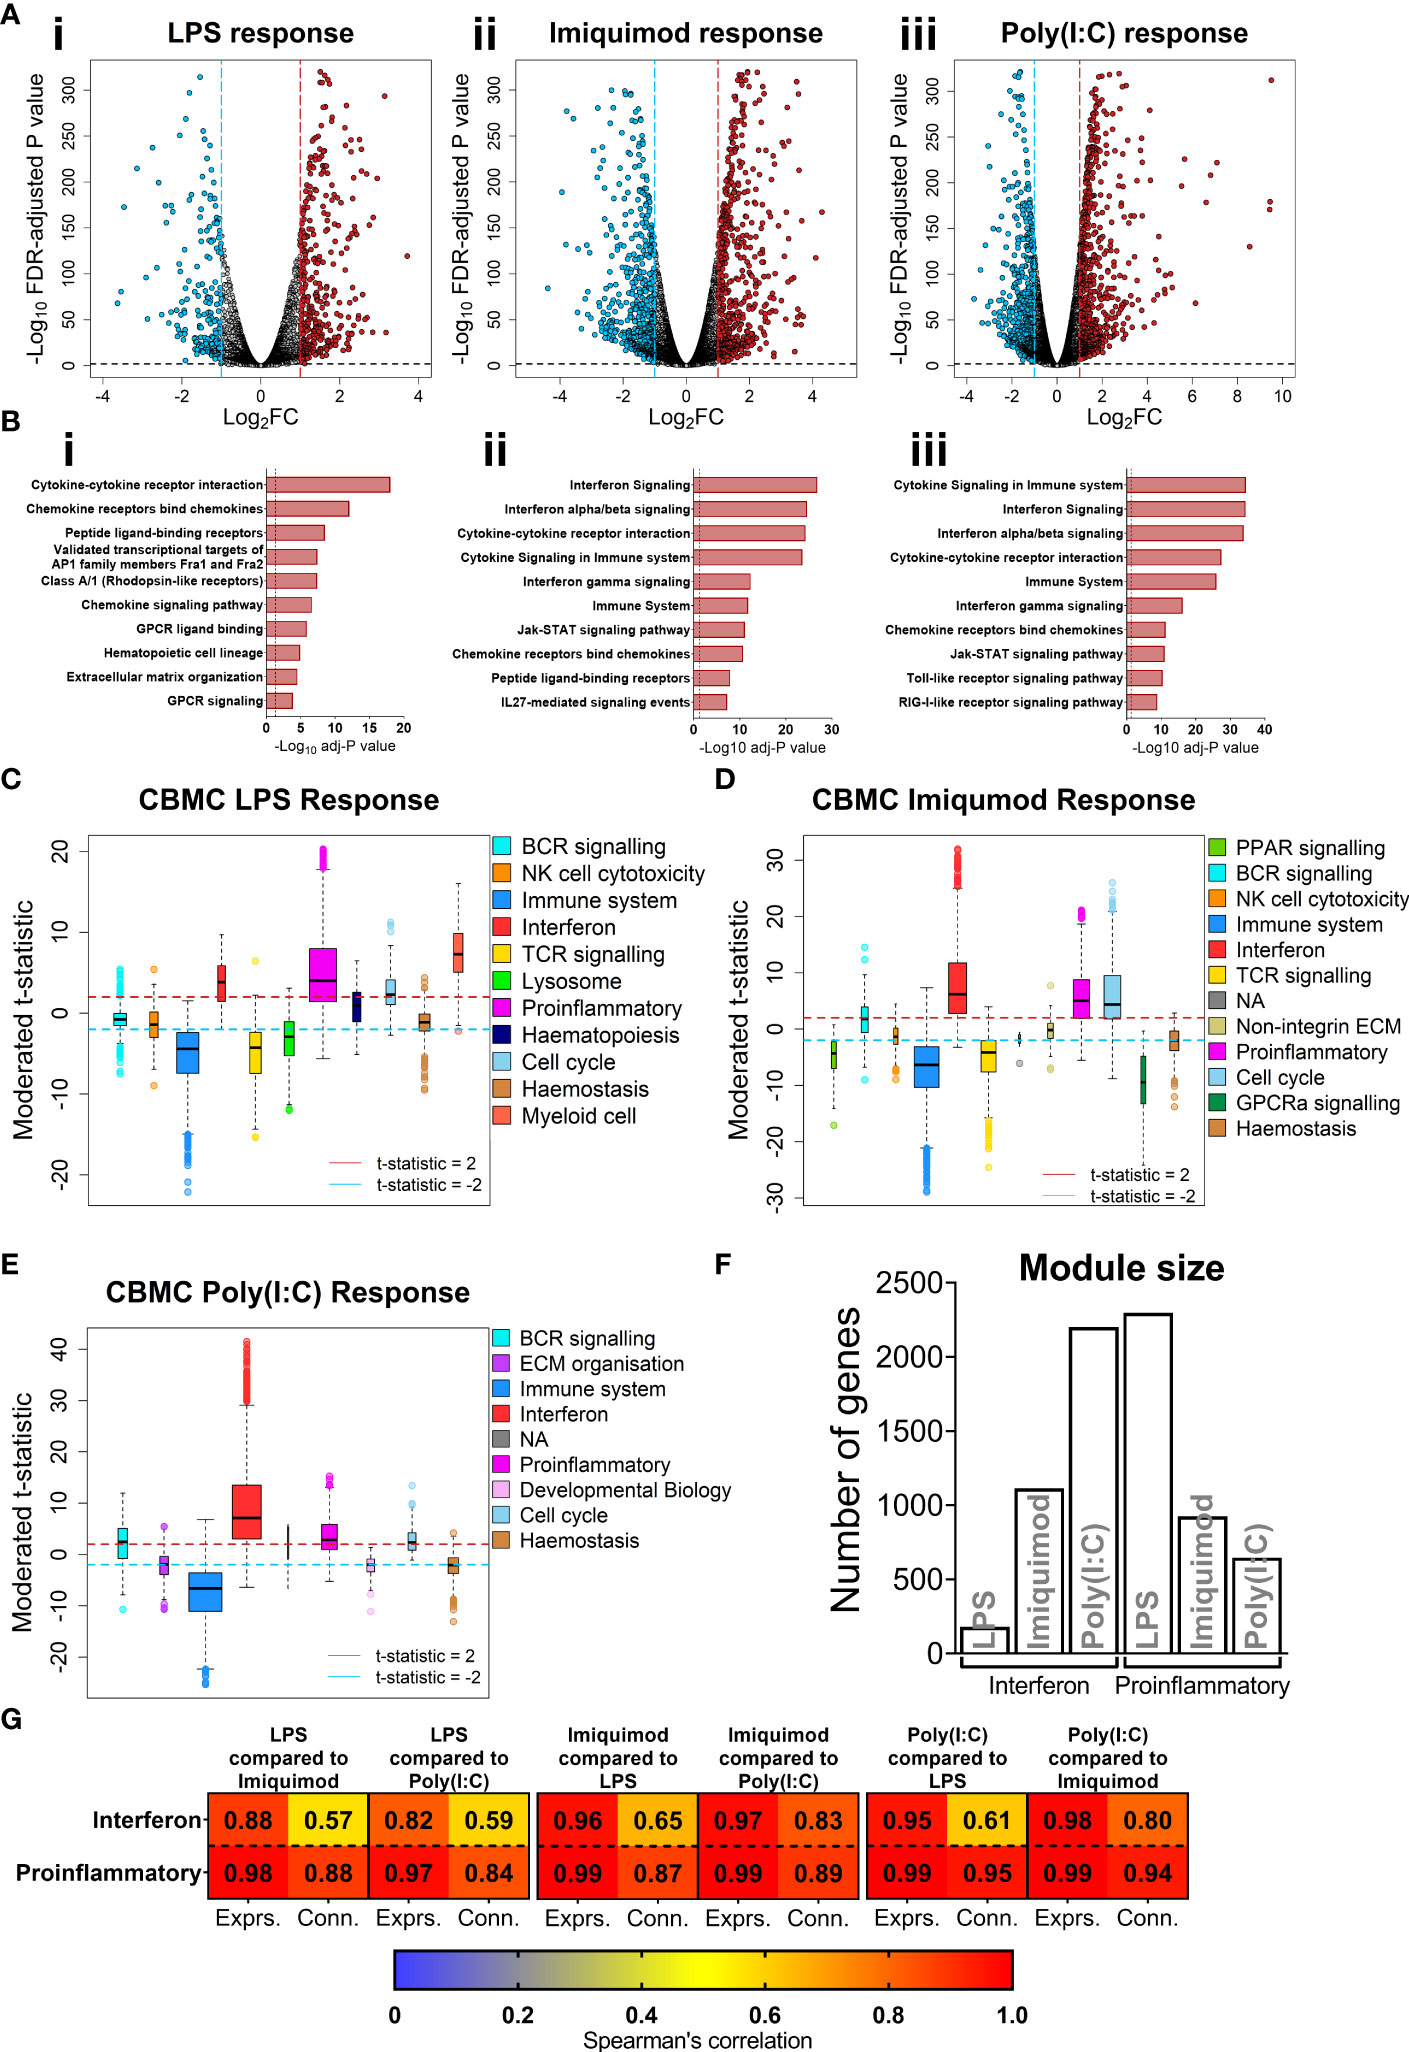
Figure 2 IFN and proinflammatory gene expression following TLRs 3/4/7 activation in CBMC. (A) Volcano plot showing significantly upregulated (red) and downregulated (blue) genes compared to matched unstimulated samples for the LPS (i), Imiquimod (ii), and Poly(I:C) (iii) responses, respectively. Plots show the Log2 fold-change (x-axis) and FDR-adjusted p value (-Log10 transformed). Blue and red dashed lines indicate a Log2FC of -1 and 1, respectively; black dashed line denotes a -Log10 FDR-adjusted p value of 2. (B) Top 10 overrepresented pathways from significantly upregulated genes of the CBMC LPS (i), Imiquimod (ii), and Poly(I:C) (iii) responses. X-axis shows the FDR corrected p value (-Log10 transformed); black dashed line indicated corrected p ≈ 0.05. (C–E) Modules identified from network analysis (WGCNA) of the LPS, Imiquimod, and Poly(I:C) responses, respectively. Modules are plotted by moderated t-statistics (y-axis) and show the median, 25th and 75th quartiles ±1.5xIQR and outliers. Modules with medians above the red line (moderated t-statistic = 2) are considered significantly upregulated and those below the blue line (-2) are considered significantly downregulated. (F) Bar plot of the number of genes in the interferon and proinflammatory modules for the respective responses. (G) Heatmap showing Spearman’s correlation values of ranked expression and ranked connectivity between CBMC response module genes. Expression of member genes from the IFN and proinflammatory modules of each response were correlated against the expression of the same genes from the other responses. The p value associated with all correlations was < 0.01.
Identification of co-expression networks underlying the innate immune responses at birth
Genes do not function in isolation, they work together in networks (57), and for this reason gene expression data is not only informative for differences in expression magnitude (e.g. fold changes) but also in network structure (e.g. connectivity). We employed weighted gene co-expression network analysis (WGCNA) to elucidate the global connectivity structure and functional organisation of gene expression patterns observed from our CBMC samples. This analysis identified 11, 11, and 8 co-expression modules for the LPS, Imiquimod and Poly(I:C) responses, respectively (Figures 2C–E, S3A,B). All responses exhibited upregulation of IFN and proinflammatory modules, and as we had already identified these as integral components of the cord blood innate responses with dimensionality reduction and differential expression analysis, they were therefore carried forward for downstream analysis (Figures 2C–E, S3C–E). The LPS response had the smallest IFN module (180 genes) compared to Imiquimod (1114 genes) and Poly(I:C) (2201 genes) and the inverse was true of the proinflammatory modules (LPS, 2297 genes; Imiquimod, 924 genes; Poly(I:C), 646 genes) (Figure 2F). Notably, there was substantial overlap between IFN and proinflammatory module genes of different stimuli, particularly between the Poly(I:C) IFN and LPS proinflammatory modules (n=385 genes) (Figure S3F). We next compared gene network patterns between the respective responses. First, we calculated module preservation statistics, and the results showed that the LPS-induced IFN module was highly preserved within the IFN modules of the imiquimod and Poly(I:C) responses but not vice versa (Figure S3G). The IFN modules associated with the imiquimod and Poly(I:C) responses were preserved within one another and the proinflammatory modules were preserved between all responses (Figure S3G). Second, we calculated ranked gene expression and ranked connectivity to compare modules. A prominent disparity was observed between expression magnitude (r = 0.88 & 0.82) and intra-module connectivity (r = 0.57 & 0.59) between the cord blood LPS-induced IFN module genes and the same genes following Imiquimod and Poly(I:C) stimulation, respectively (Figure 2G). To examine connectivity within modules, we plotted the connectivity density across all genes in each module and also identified the top 20 most connected genes (Figures 3A, B). The connectivity of the LPS-induced IFN module was characterised by a normal distribution, whereas the viral stimuli produced left-skewed distributions (Figure 3A). Key IFN signalling genes (e.g. IRF1, STAT1) were present among the most connected genes within the LPS-induced IFN module, however the strength of the most connected genes was reduced compared to the IFN modules of the viral stimuli (Figure 3B). The LPS-induced proinflammatory module displayed greater connectivity compared to the imiquimod- or Poly(I:C)-induced proinflammatory modules (Figure S4A). Genes encoding innate immune/proinflammatory cytokines (e.g. IL1A/B, CXCL2/3/8) were among to most connected genes in the proinflammatory modules of all responses at birth (Figure S4A). In summary, although viral nucleic acid and bacterial related stimuli activated overlapping sets of proinflammatory and IFN response genes, the underlying network structure was markedly different.
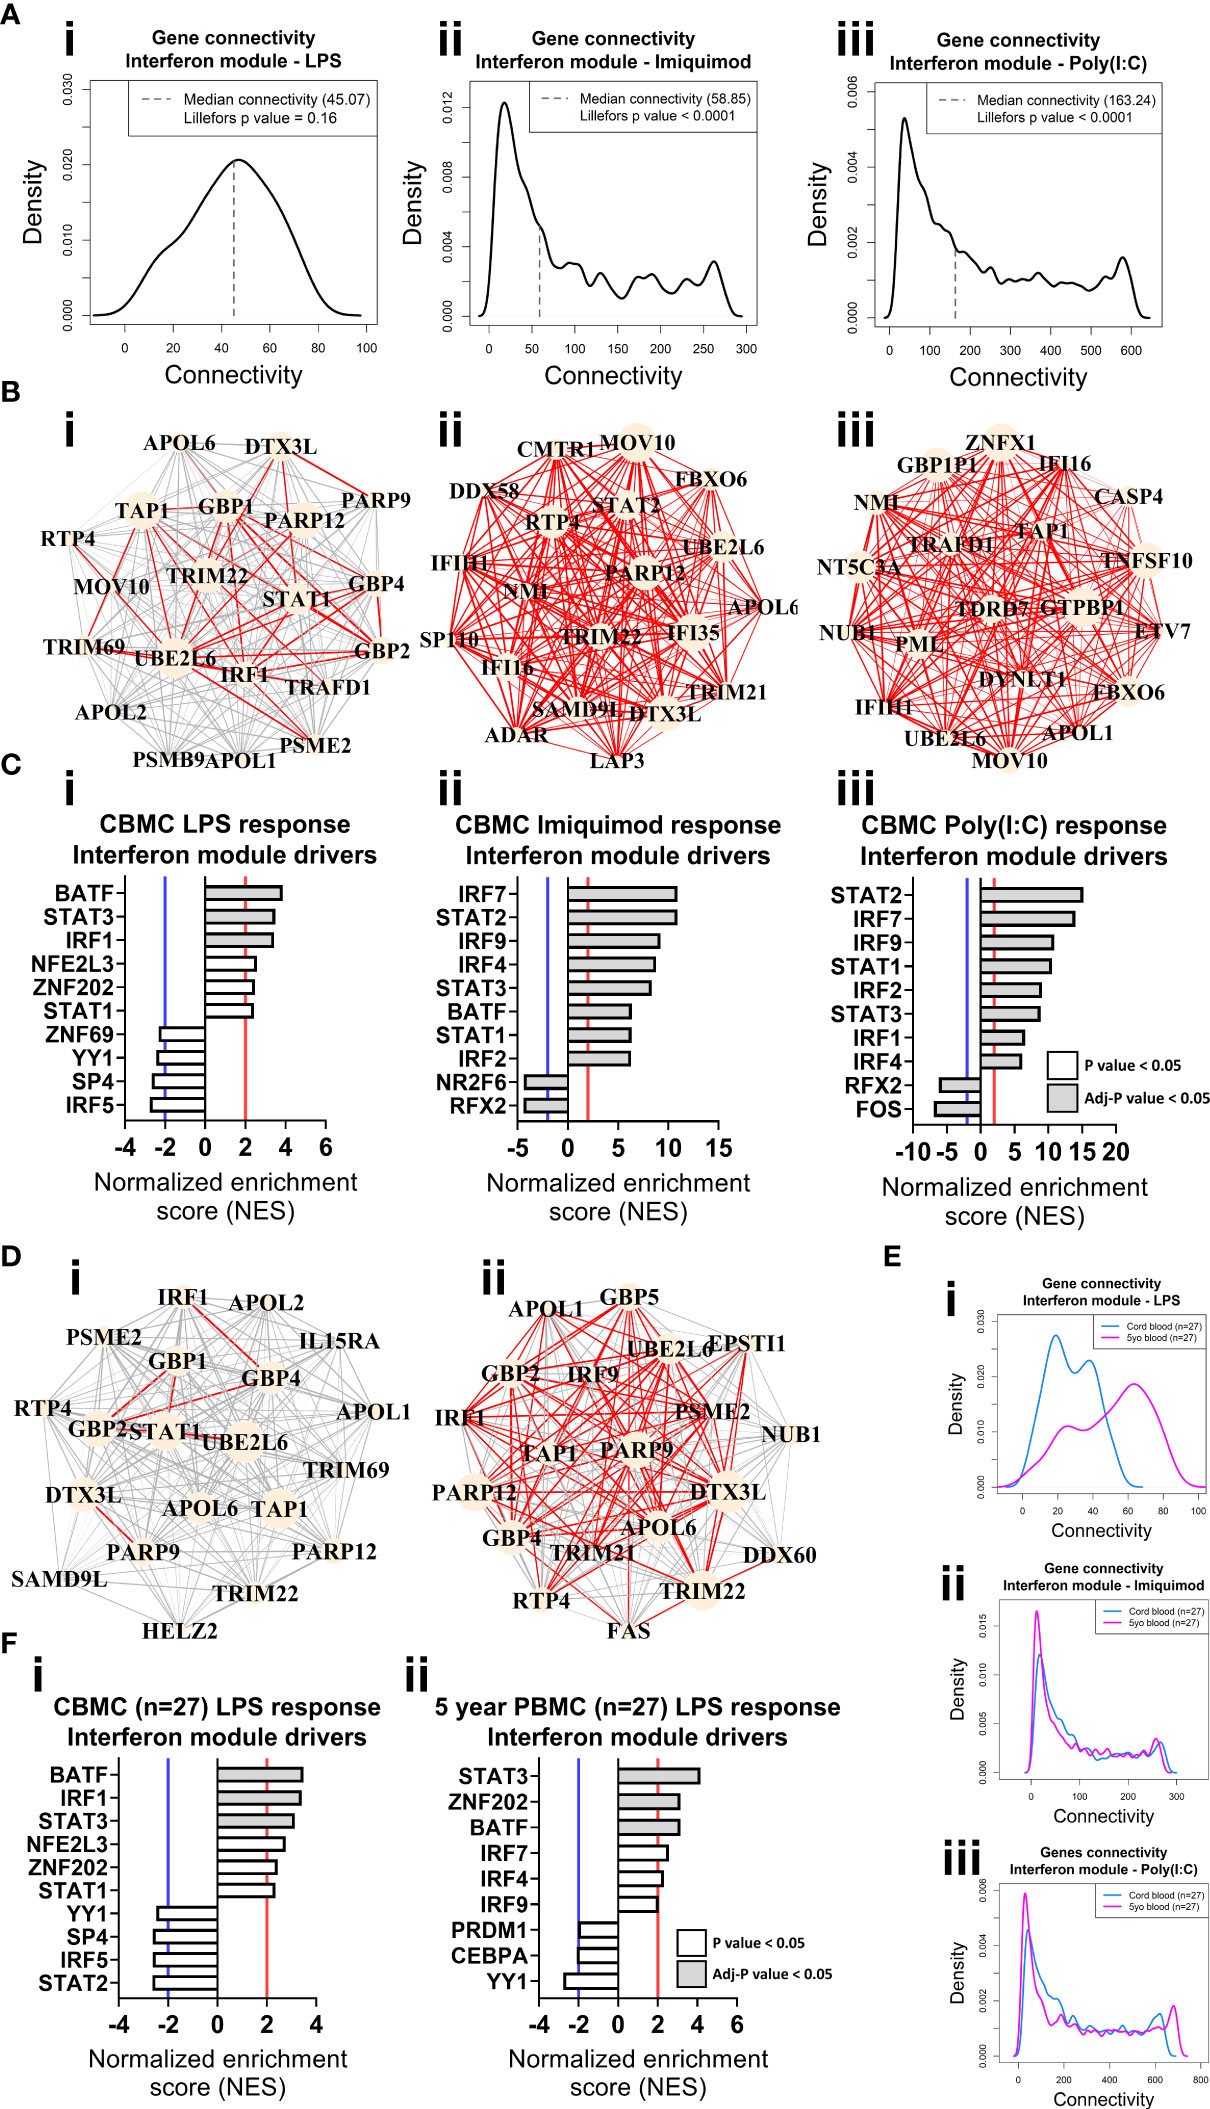
Figure 3 Network connectivity and master regulator analysis of IFN responses at birth and age 5 years identify IRF1 as a key driver. (A) Density plot of the LPS (i), Imiquimod (ii), and Poly(I:C) (iii) CBMC response IFN module connectivity, respectively. Dashed line denotes median. Lilliefors p value > 0.05 indicates normal distribution. (B) Network wiring diagrams of the top 20 most connected genes for the LPS (i), Imiquimod (ii), and Poly(I:C) (iii) CBMC IFN modules, respectively. Node size represents number of connections (degree) among the total network and edge width indicates strength of correlation (red edges > 0.8). (C) Top 10 master regulators for the respective CBMC IFN modules. Bar plots show normalized enrichment score (NES) for transcription factors which are significantly activated (NES>2, red line) or inactive/inhibited (NES<-2, blue line). Grey shading indicates an adjusted P value < 0.05. (D) Network wiring diagrams of the most connected CBMC LPS-induced IFN module genes from matched CBMC (i) and 5 year PBMC (ii) samples. Network characteristics are the same as above (B). (E) Network connectivity density plot for the interferon module gene connectivity of the matched CBMC (blue) and 5 year PBMC (magenta) responses to LPS (i), Imiquimod (ii), and Poly(I:C) (iii) stimulation. (F) Top drivers of the LPS-induced interferon module genes identified for matched CBMC (i) and 5 year PBMC (ii, 9 drivers were significant at P <0.05 samples. Bar plot characteristics are the same as above (C).
Identification of master regulators of the innate immune responses at birth and age 5
We employed VIPER (50) analysis to identify master regulators which are predicted to drive module connectivity patterns. This approach revealed that the LPS-induced IFN module was putatively driven by BATF, STAT3 and IRF1 transcription factors (TFs) at birth, whereas the Imiquimod- and Poly(I:C)-induced IFN module top drivers included multiple STAT (e.g. STAT2) and IRF (e.g. IRF7) TFs (Figure 3C). The proinflammatory modules for all three responses were enriched for CEBPB, AP-1 (e.g. JUN, FOSL1/2) and NF-κB (e.g. NF-κB, RELB) (Figure S4A). Importantly, we repeated our analyses with input genes restricted to only those preserved from the LPS responses IFN (169/180, 93.89%) and proinflammatory (443/2297, 19.29%) modules and the result was unchanged (Figures S4B, C). Finally, we compared gene network patterns between CMBC and matched PBMCs samples (n=27) collected at 5 years. The connectivity of the genes of the LPS-induced IFN module was markedly higher at 5 years compared to birth among matched samples, suggesting that the wiring of this module is subject to developmental regulation (Figures 3D, E). Additionally, IRF1 enrichment was only identified from cord blood (Figure 3F). In contrast, the IFN responses provoked by imiquimod and Poly(I:C) stimulation displayed comparatively similar connectivity patterns between birth and age 5 years and, supporting this, the putative drivers were also comparable between birth and 5 years (e.g. STAT2, IRF7) (Figures 3E, S5A). Imiquimod and poly(I:C) proinflammatory modules were characterised by reduced intra-module connectivity in blood collected at 5 years compared to birth (Figures S5B, C).
Innate immune responses at birth are predictive of sLRI in the first year of life
To determine whether innate immune responses at birth could predict the development of sLRIs in the first year of life, we randomly assigned the data set into training (50%, n=25) and validation sets (50%, n=25) and trained a random forest classifier on the CBMC IFN modules. The classifier trained on the LPS-induced IFN module genes could predict sLRIs in the first year of life with an accuracy of 72% in the validation data set (Area under the ROC curve = 0.724) (Figure 4A). Whilst the accuracy of this model may appear modest, it is known that risk biomarkers in general possess poor accuracy to predict subsequent disease over a specific time interval because the at-risk population will almost always be heterogeneous with respect to the disease outcome (58). In contrast, classifiers built from the Imiquimod- or Poly(I:C)-induced IFN module genes were not predictive of sLRIs in the first year of life (Figure 4A). To test whether this finding was reproducible given the relatively small sample numbers available as input, we repeated the analysis by randomly re-sampling subject membership in the training/validation sets (retaining the initial optimization parameters), and again found that only the LPS-induced IFN module genes could predict sLRIs in infancy better than chance on average (Figures 4B, S6A–C). Furthermore, we observed markedly different connectivity patterns for the LPS-induced IFN modules when stratified by individuals who did and did not experience and sLRI in the first year of life (Figures 4C, D, S6D), and this was not evident from the imiquimod- or Poly(I:C)-induced IFN modules (Figures 4C, S6E, F). Specifically, susceptible individuals had stronger gene network patterns for the LPS-induced IFN module, although the putative drivers of the response were comparable (IRF1, STAT3, BATF) (Figures 4D, E). Restricting the Imiquimod and Poly(I:C) IFN responses to only those genes of the LPS-induced IFN module did not exhibit noticeable differences in connectivity density patterns in relation to sLRI susceptibility in infancy (Figures S6E(iii),F(iii)). Whist the connectivity density plot of the LPS-induced IFN module of CBMCs of susceptible individuals (Figure 4C) resembled the overall connectivity density of the 5 year PBMC connectivity (n=27) (Figure 3E), the intra-module connectivity was significantly different (Figures S6G, H), suggesting the similarity may emerge from different processes. However, it should be noted that among the subjects which had a PBMC sample available at 5 years (n=27), the proportion of individuals who experienced an sLRI in infancy (29.63%) differed to that of the total subset (n=50, 46% sLRI positive in infancy). We also calculated module eigengenes to summarise overall module expression and compared this with clinical traits. The CBMC LPS-induced IFN module eigengene stratified individuals susceptible to sLRIs in the first year of life (p=0.016), as well as those with asthma (p=0.015) and current wheeze (p=0.02) at 5 years of age (Figures 4F, S7A,B). This result was only significant for the LPS response, was specific for the IFN module, and was only observed for comparisons of severe LRIs (Figures 4G, S7C–E).
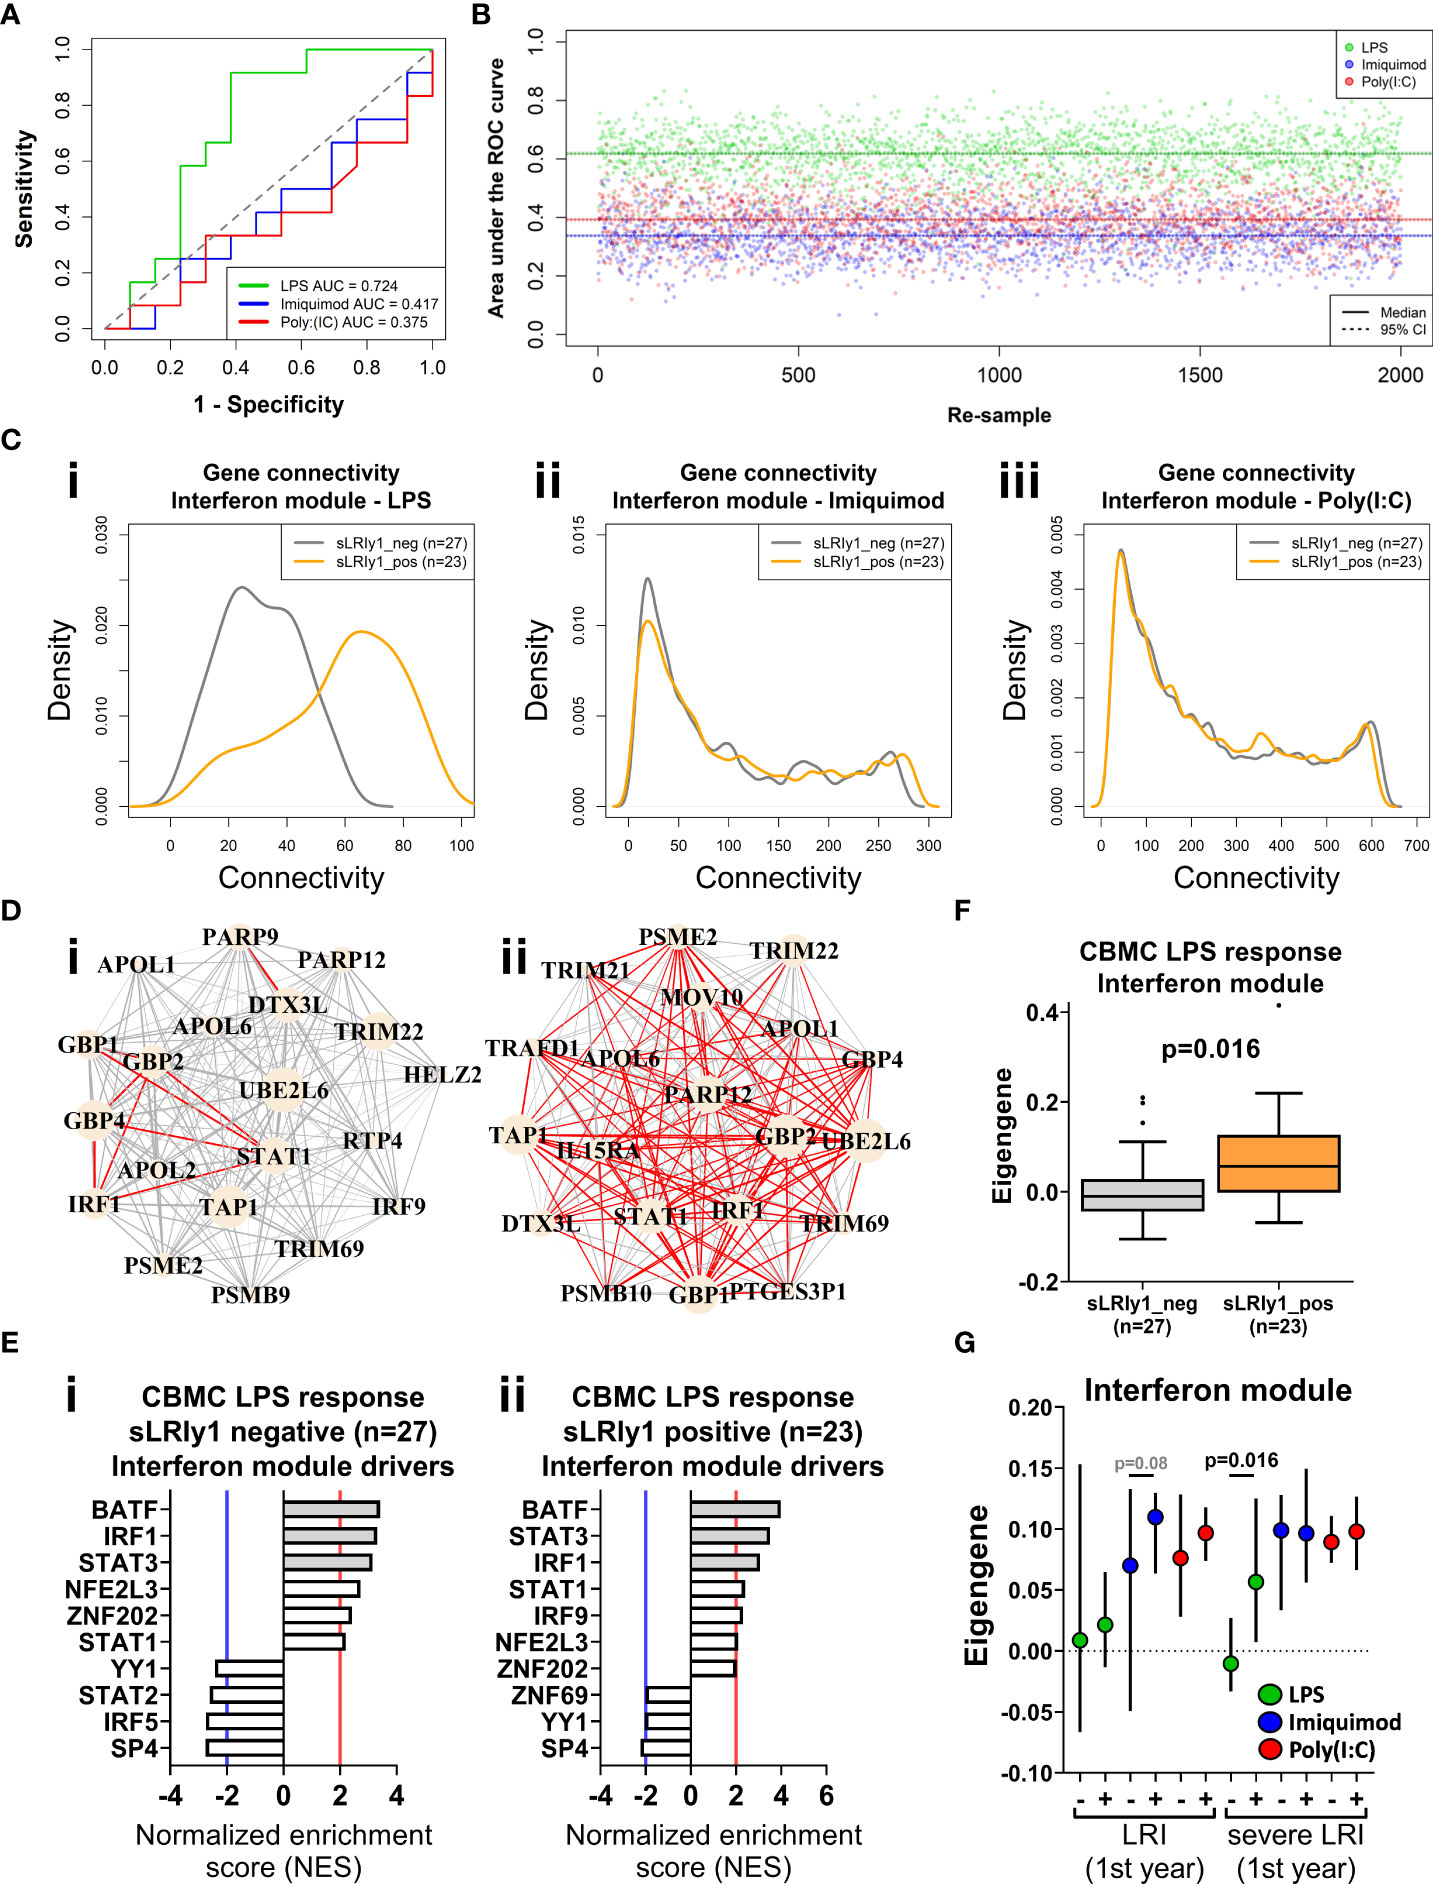
Figure 4 IFN genes activated following LPS stimulation at birth predict sLRI susceptibility in the first year of life. (A) Random forest (RF) classifiers were trained on the respective IFN module genes from half the study subjects and validated on the remaining subjects (50/50). RF models were optimised with respect to number of genes sampled at each split and number of trees grown. Plot depicts the area under the Receiver Operator Characteristic curve (AUC-ROC) defined by the rate of false (x-axis, 1-specificity) and true (y-axis, sensitivity) positives. (B) RF model predictions were repeated by re-sampling the training/validation set (50/50 random assignment) 2,000 times. Plot show the AUC-ROC for each re-sample, with median (solid lines) and 95% CIs (dashed lines). (C) Network connectivity density plot of IFN module gene networks stratified by individuals who did (orange) and did not (grey) record an sLRI in the first year of life. (D) Network wiring diagram of the most connected genes of the CBMC LPS-induced IFN module gene from individuals resistant (I, n=27) and susceptible (II n=23) to sLRIs in infancy. Node and edge characteristics are the same as Figure 3B. (E) Top 10 master regulators identified for the CBMC LPS-induced IFN response module for resistant (i) and susceptible (ii) subjects. Bar plot characteristics are the same Figure 3C. (F) Box-and-whisker plot of the CBMC LPS-induced IFN module eigengene, grouped by susceptible (orange) and resistant (grey) individuals. Boxes show median, 25th and 75th quartiles and whiskers are determined by the Tukey method; P value determined by Mann-Whitney U test. (G) Plot of IFN module eigengenes for CBMC responses grouped by individuals who were resistant (-) and susceptible (+) to LRIs and sLRIs in infancy. P values determined by Mann-Whitney U test and significant result reflects (F). Plot shows median (symbol) and 95% CI (bars).
IFN responses induced in CBMCs by TLR ligands in vitro are representative of IFN responses during natural infections
We questioned whether the IFN module gene expression profiles exhibited by CBMCs following in vitro culture with model antigens in our study are reflective of naturally occurring IFN responses to childhood infections in vivo. To address this issue, we trained RF classifiers on our CBMC-derived IFN module genes and used them to classify samples from publicly available data sets from the Gene Expression Omnibus. Gene expression data from external cohorts was filtered to only those genes present in the corresponding IFN modules for each analysis. The first data set comprised whole blood gene expression profiles from children (<17yrs) with febrile illnesses requiring hospitalization with confirmed bacterial (n = 52) or viral (n = 92) infections versus healthy controls (n = 52) [GSE72809 (59)]. We found that RF classifiers trained on LPS- and Imiquimod/Poly(I:C)-induced IFN module genes accurately predicted children with bacterial (AUC = 0.889) and viral (AUC = 0.874/0.838) infections, respectively (Figures 5A, S7F). The second data set consisted of PBMC samples from infants (<18mo, n=30) and young children (18mo-5yrs, n = 32) who were hospitalized with acute viral bronchiolitis [GSE113211 (60)]. Classifiers built on unstimulated and either Imiquimod- (AUC=0.8) or Poly(I:C)- (AUC=0.877) induced IFN genes could accurately stratify samples collected during acute illness compared to matched post-convalescent samples (symptom-free, 8.8 ± 2.5 weeks post-infection), independent of age (Figures 5B, S7G). The models performed well for infants (AUC = 0.922, Poly(I:C); AUC = 0.827, Imiquimod) and children (AUC = 0.789, Poly(I:C); AUC = 0.842, Imiquimod) separately (Figure S7G). The third data set consisted of nasal-derived gene expression profiles from study visits of asthmatic children (6-17yrs) with viral-related or non-viral “cold”-like illness (1-6 days post-onset), some of which later experienced exacerbations (n=83, 58 were viral-positive) [GSE115770 (61)]. Symptomatic children with respiratory viral infections were accurately predicted from symptomatic, yet virus-negative, children from Imiquimod (AUC=0.8) and Poly(I:C) (AUC=0.832) defined RF classifiers (Figures 5C, S7H). Additionally, there was comparable accuracy classifying virus-positive and virus-negative asthmatic children who subsequently experienced an exacerbation (within 10 days of symptom onset) (Figure S7H). In the same study, prediction performance was less accurate from peripheral blood-derived gene expression profiles (Figure S7H). Taken together, these analyses demonstrate that CBMC-derived IFN gene expression patterns induced with LPS, Imiquimod, or poly(I:C) in this study are representative of childhood IFN responses to microbial pathogens.
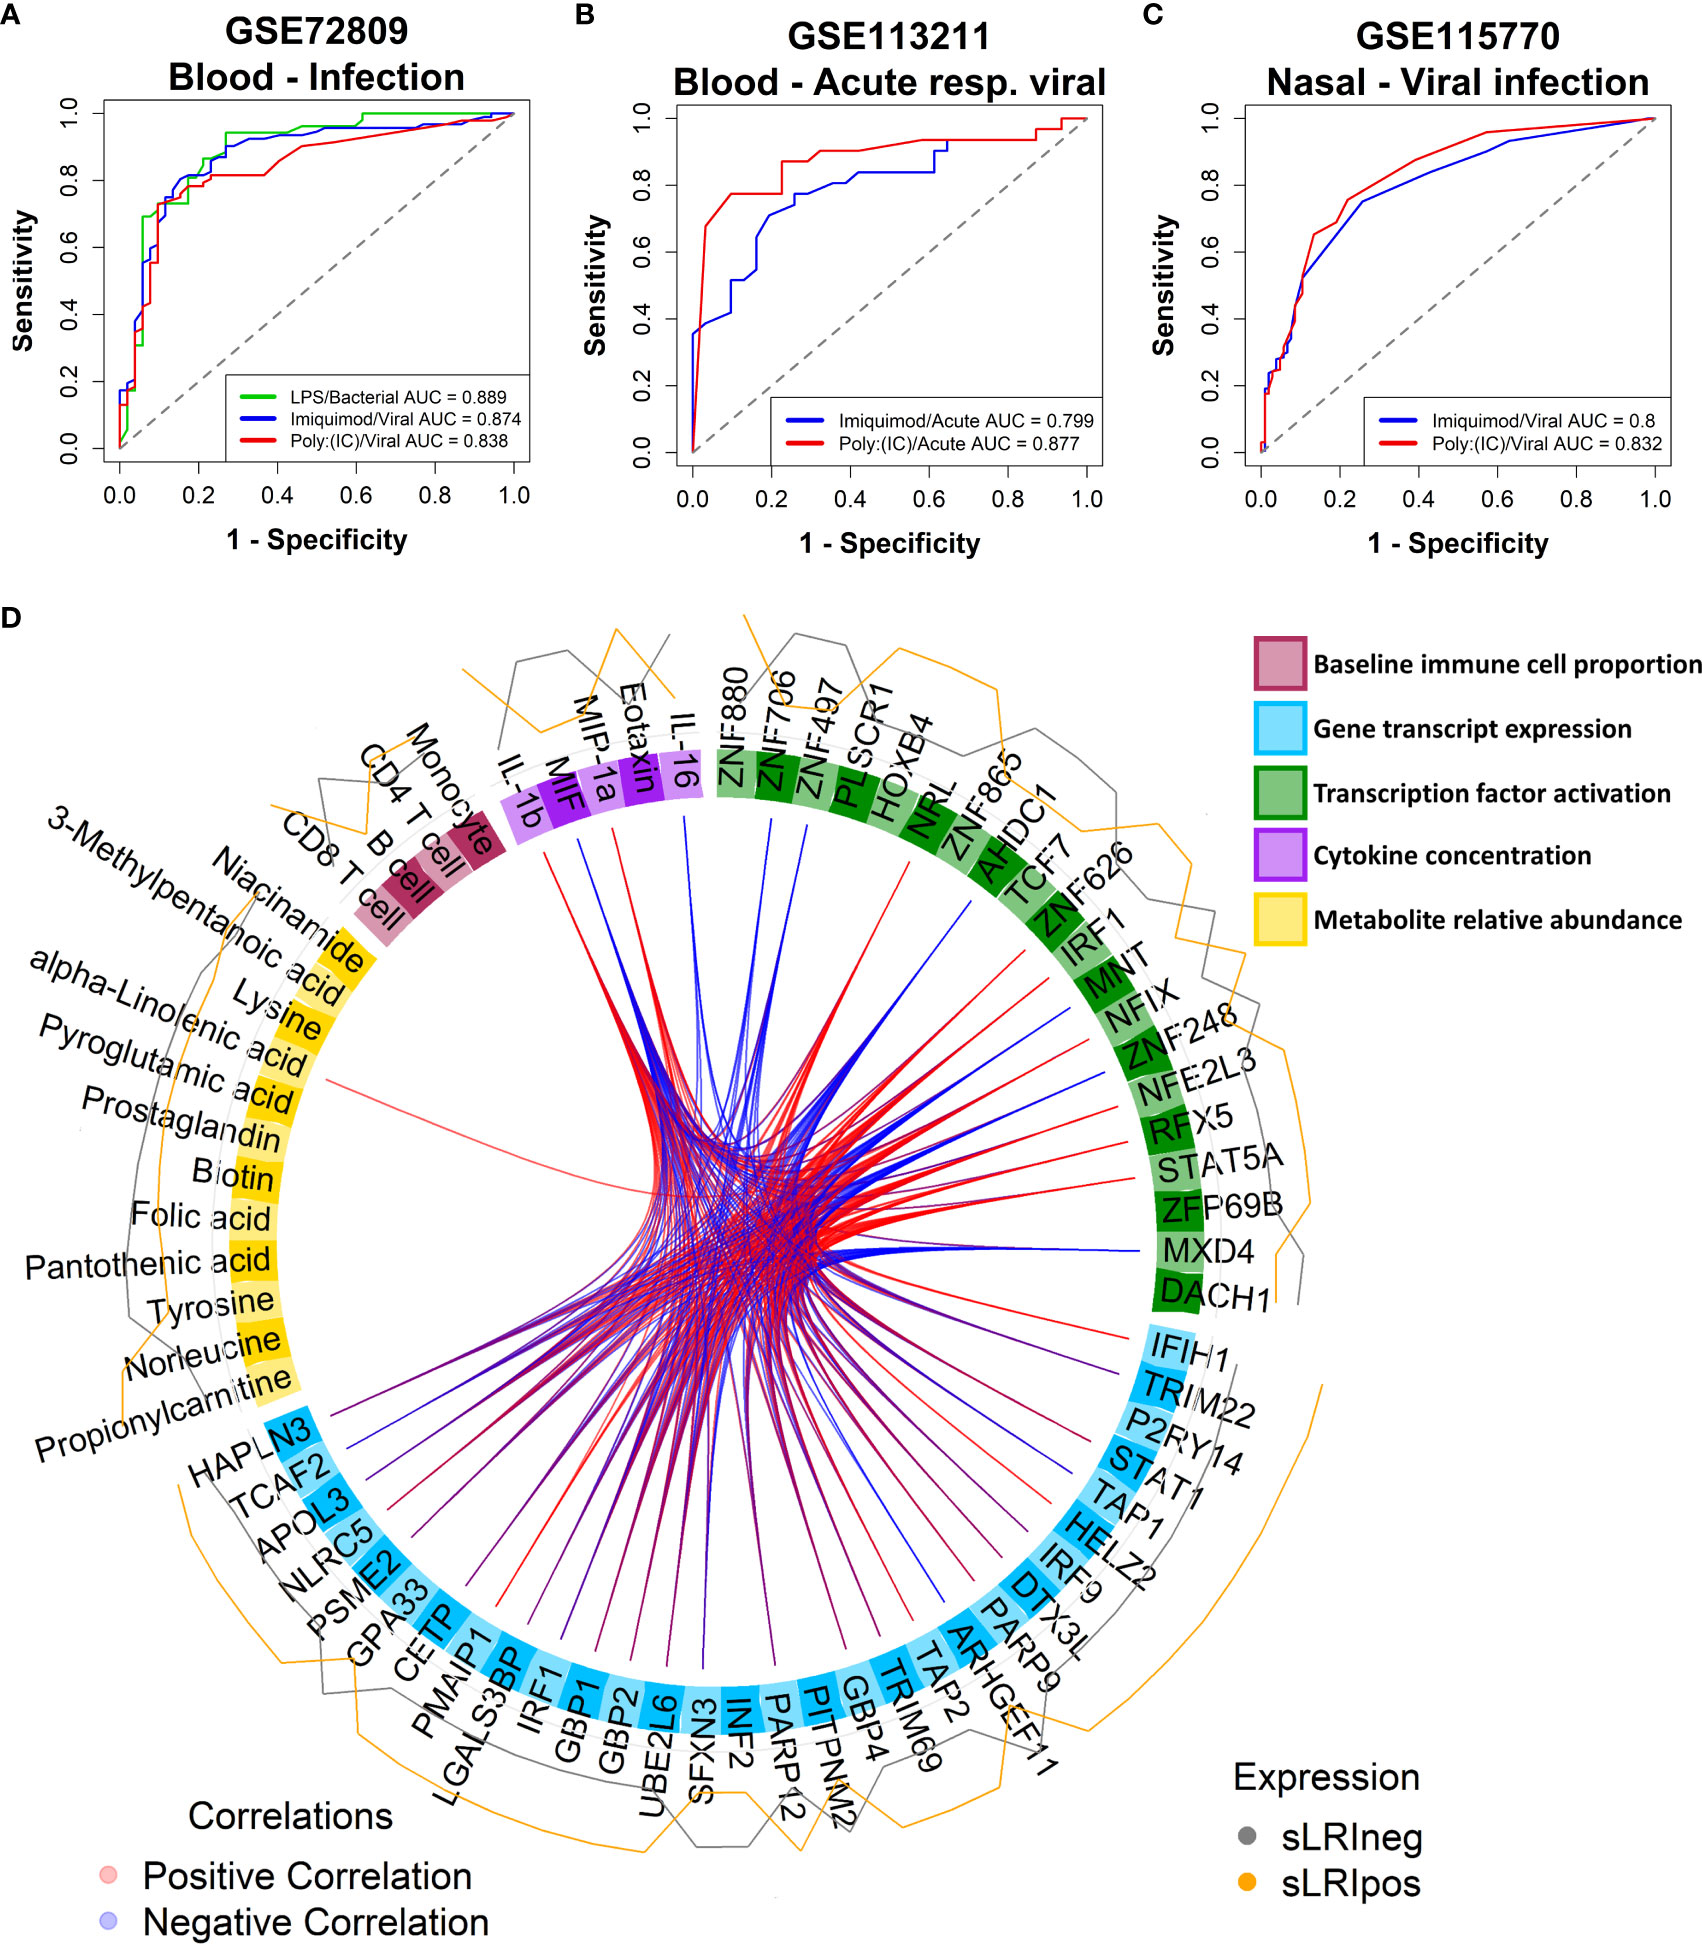
Figure 5 CBMC IFN responses reflect natural childhood response to infection; Multi-omic integration reinforces that LPS-induced IFN signalling at birth is a determinant of sLRI risk in infancy. (A) A random forest classifier was trained on Unstimulated and LPS or Imiquimod/Poly(I:C) CBMC IFN module gene expression data (n = 100) and used to predict children (<17yrs) hospitalized with bacterial (n = 52) and viral infections (n = 92), respectively, from healthy controls (n = 52) from blood-derived gene expression profiles. Gene expression data sets were restricted to available IFN module genes and RF models were optimised with respect to the number of genes and trees. Plot depicts the AUC-ROC defined by the rate of false (x-axis, 1-specificity) and true (y-axis, sensitivity) positives. (B) RF classifiers trained on Unstimulated and Imiquimod or Poly(I:C) CBMC IFN module gene expression data (n=100) and used to predict PBMC gene expression profiles from infants (<18mo; n=15) and children (18mo-5yrs; n=16) presenting to hospital with acute viral respiratory infections from profiles collected during convalescence. Plot depicts the AUC-ROC. (C) RF classifiers trained on Unstimulated and Imiquimod or Poly(I:C) CBMC IFN module gene expression data (n=100) and used to predict asthmatic children (6-17yrs) with cold-like symptoms who do (n=193) and do not (n=105) have detectable airway viral infection from nasal-derived gene expression profiles. Plot depicts the AUC-ROC. (D) Circos plot displaying the multi-layer risk profile for sLRI susceptibility in infancy determined from multi-omic data integration, showing between block correlation from the 1st latent component; correlations stronger that ±0.8 are shown. Peripheral lines represent the relative expression of features from individuals who were resistant (grey) or susceptible (orange) to sLRIs in the first year of life. Input data was adjusted with respect to matched unstimulated samples (except baseline immunophenotype data).
Multi-omic integration of LPS-stimulated CBMC data
Lastly, we employed multi-omic data integration (DIABLO (52)) to identify correlated molecular features across biological layers which may confer sLRI risk. Input data consisted of CBMC baseline immune cell type proportions (n = 8), significantly variable mRNA transcripts (n=6344), VIPER-derived regulon activity scores (n = 1224), metabolites (n = 49), and cytokine/chemokine proteins (n = 39). Importantly for this analysis, input genes were selected as those which were significantly variable between LPS-stimulated and unstimulated CBMC samples and were not selectively enriched for IFN-related transcripts. The data reinforced that LPS-induced IFN-signalling transcripts (IRF9, STAT1, GBP2/4) and IRF1 activity were key determinants of risk for sLRI in the first year of life, in combination with lymphocyte and monocyte proportions, immune regulators (e.g. RFX5, NFIX), amino acids, and proinflammatory cytokines/chemokines (IL-1β, MIP-1α, MIF) (Figure 5D). As we separately identified LPS-induced IRF1 activity from network, master regulator, and integrative analyses, we further investigated IRF1 gene expression correlations. IRF1 gene expression at birth positively correlated with selective STAT and IRF family transcription factor genes (e.g. STAT1, IRF7/9), proinflammatory mediators (e.g. IL-1β, IL-6, CCL3/MIP-1α), and viral-related receptor genes (e.g. ICAM1, IFIH1) (Figure 6A). Additionally, CBMC STAT1 and IFIH1 gene expression was higher in response to LPS among individuals who were susceptible to sLRIs in infancy, and IFIH1 expression correlated with IRF1 and STAT1 expression (Figures 6B, C).
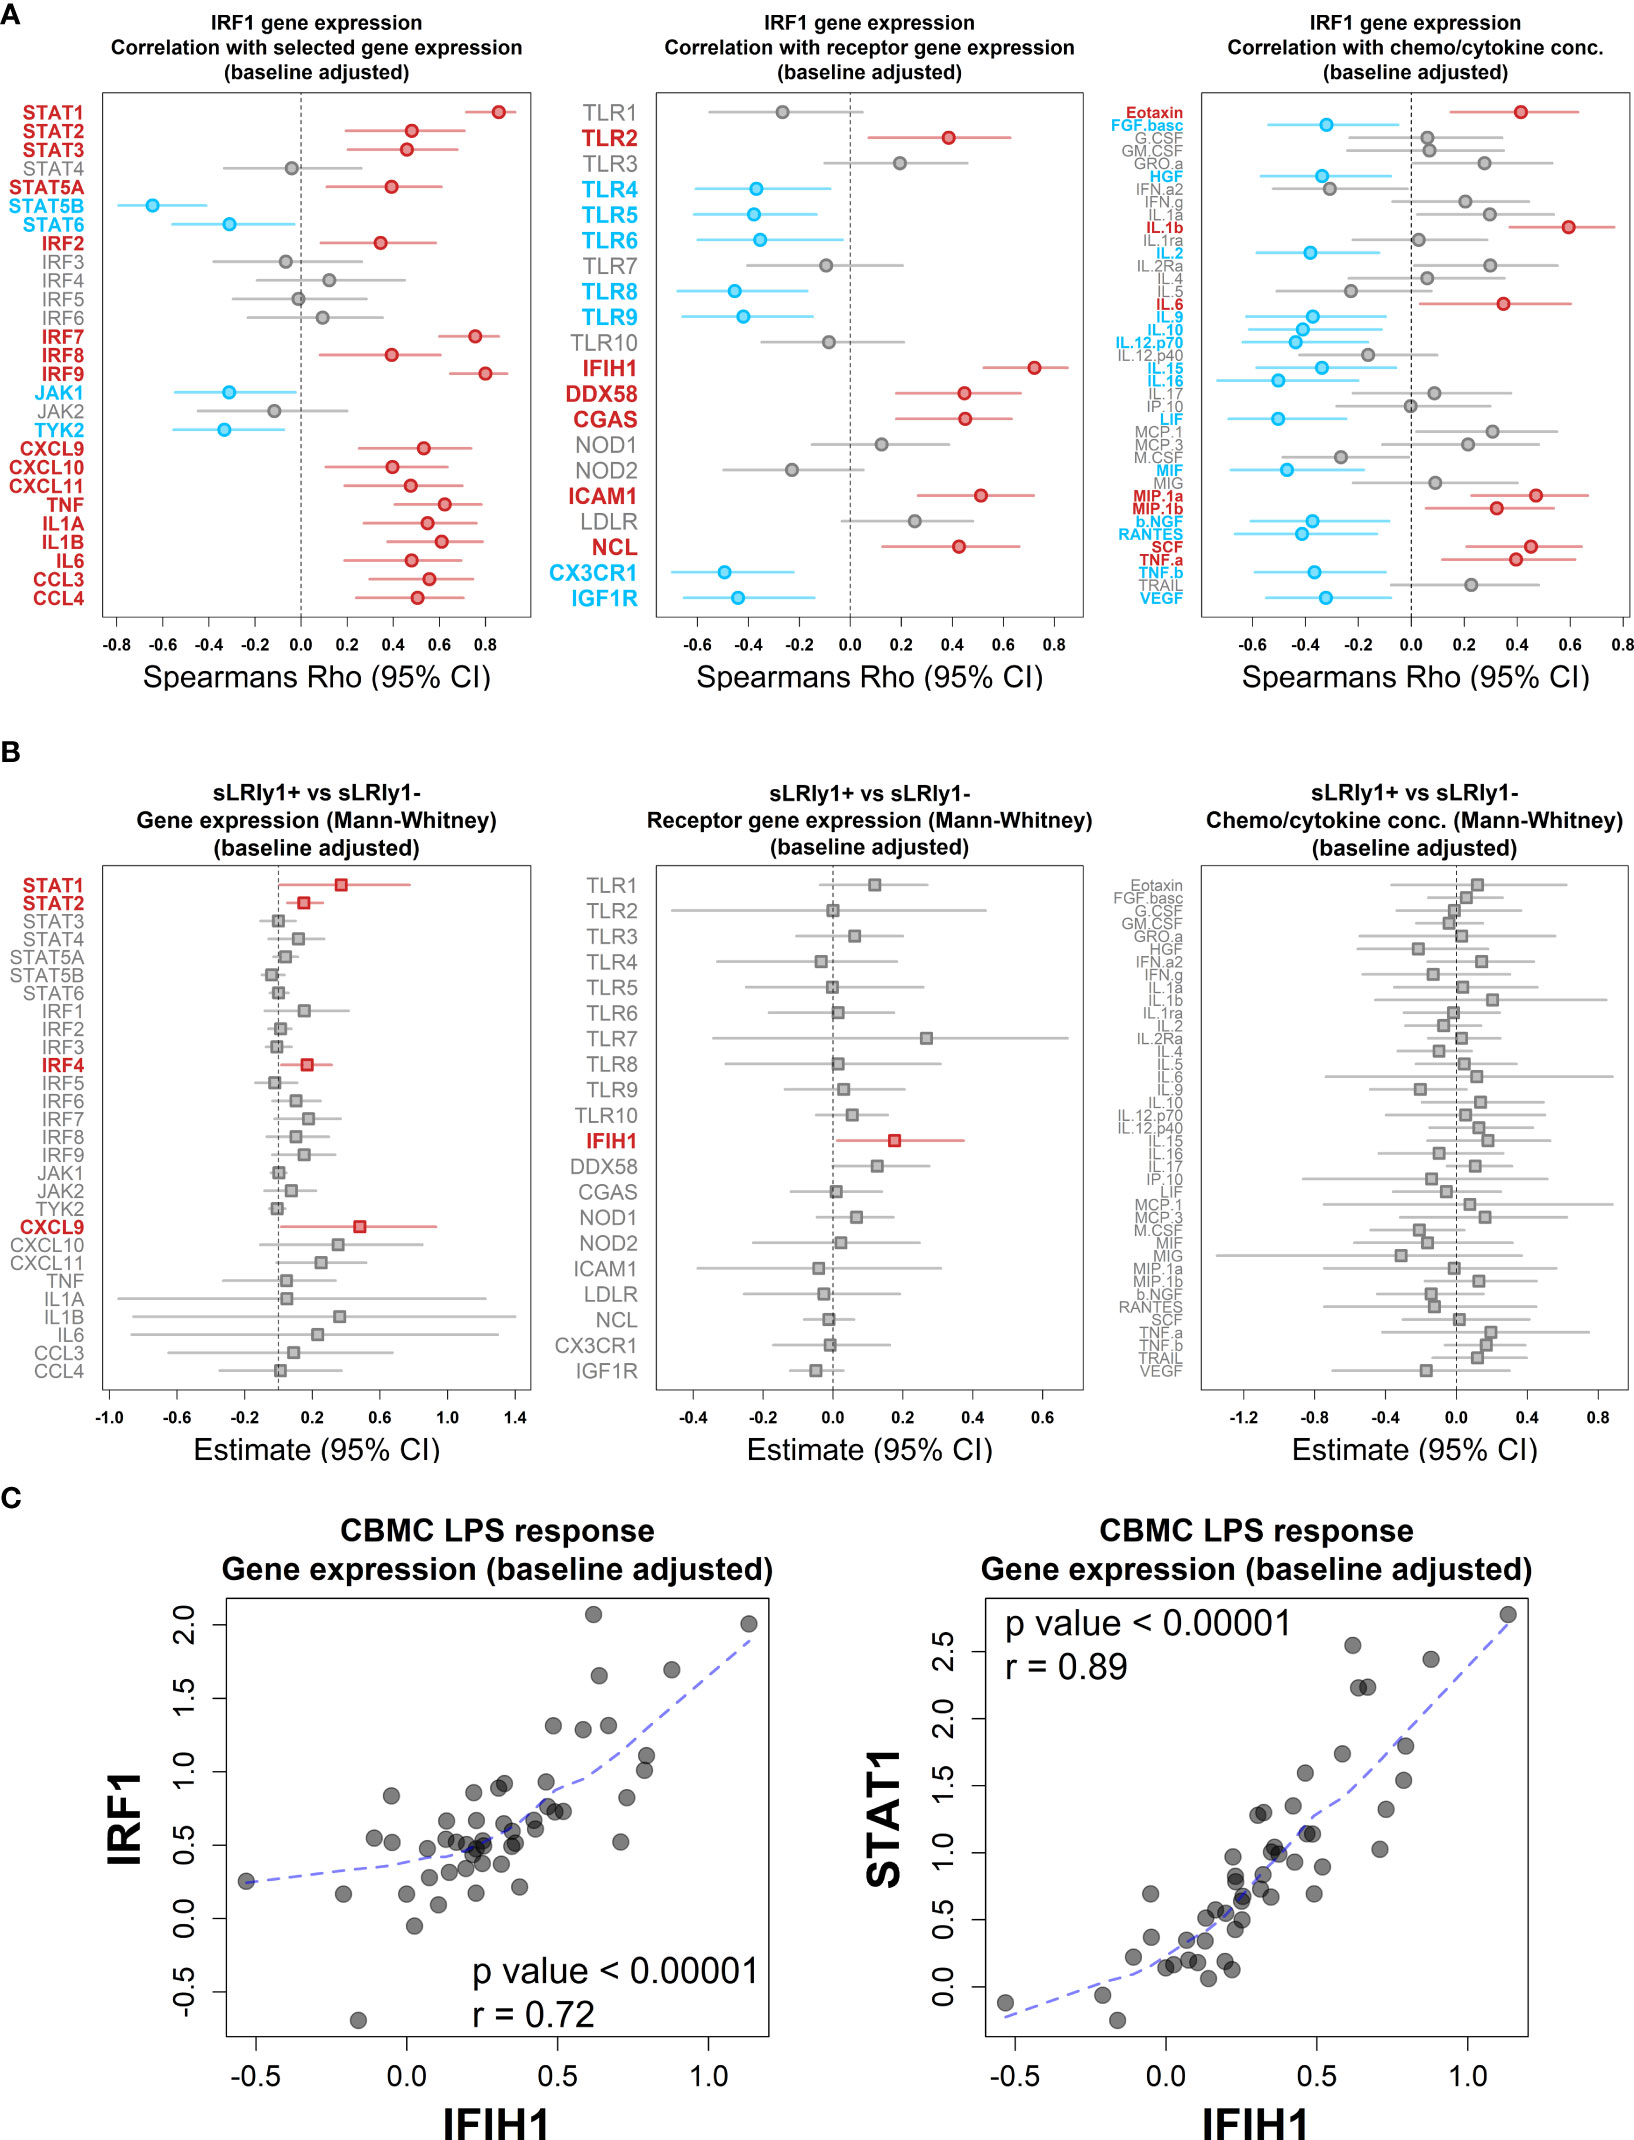
Figure 6 LPS-induced IRF1 correlates with key interferon/proinflammatory mediators. (A) Plot of the association between LPS-induced IRF1 gene expression with selected IFN and proinflammatory gene expression (left), viral-related receptor gene expression (center) and chemo/cytokine protein concentration (right). Data was adjusted with respect to matched unstimulated samples and plots shows Spearman’s Rho value (symbol) and 95% CI (bars, 1000 bootstraps); Red and blue data points/labels denote positive and negative correlations, respectively, with a BH-adjusted p value <0.05. (B) Analysis of selected IFN and proinflammatory gene expression (left), viral-related receptor gene expression (center) and chemo/cytokine protein concentration (right) with respect to sLRI susceptibility in the first year of life. Data was adjusted with respect to matched unstimulated samples and plots show the Mann-Whitney U test estimates and 95% CIs for CBMC data of individuals who are susceptible compared to resistant to sLRIs in infancy. Red data points/labels indicate increased expression with a p value < 0.05. (C) Spearman’s correlation and associated p value between IFIH1 (x-axis) and IRF1/STAT1 (y-axis) gene expression from CBMC samples stimulated with LPS (n=50). Data was adjusted with respect to matched unstimulated samples. Dashed blue line represents a loess fit of the data.
Discussion
Severe viral lower respiratory tract infections (sLRIs) are a leading cause of hospitalization for infants and children and constitute a major risk factor for subsequent asthma development (2–6). Whilst it is increasingly recognised that bacterial and viral pathogens may interact to drive the pathogenesis of sLRIs, the underlying innate immune mechanisms are not well understood. We employed a multi-omic approach to systematically profile innate immune responses to bacterial (LPS) and viral nucleic acid (Poly(I:C)/Imiquimod) related stimuli at birth to first characterize these responses and then investigate whether any response patterns are associated with susceptibility to sLRI in the first year of life. The data showed that whilst innate immune responses to the panel of stimuli comprised overlapping proinflammatory and IFN-mediated gene expression programs, the LPS but not Poly(I:C)/Imiquimod response profiles at birth were predictive of sLRI incidence in the first year of life. Moreover, sLRI susceptibility was associated with the activation of a network of IFN genes, and the connectivity patterns of this network in cord blood LPS responses were strikingly exaggerated among infants susceptible to sLRI. Furthermore, the connectivity pattern of these genes was highly variable between the cord and 5 year LPS responses. These findings were specific for the LPS-induced IFN responses and were not observed following activation of viral nucleic acid sensing pathways, nor from proinflammatory module genes of any response tested, suggesting that the wiring of the LPS response is specifically altered in children who are at heightened risk for sLRI in infancy. It is noteworthy that expression of the LPS-induced IFN module was not associated with mild (non-wheezy/non-febrile) lower respiratory tract infections, highlighting a specific link to infection severity. Master regulator analysis identified IRF1 as a key driver of LPS-induced IFN responses at birth. By age 5, the data showed that the activity of IRF1 may be replaced by other members of the IRF transcription factor family, including IRF7, suggesting that this response is subject to developmental regulation. In contrast, IRF7 was the dominant driver of Poly(I:C)-/Imiquimod-induced IFN response at birth and 5 years. IRF1 was also identified as a highly connected node of the LPS-induced IFN network and correlated with distinct IFN-signalling (e.g. STAT1 but not JAK1/TYK2) and proinflammatory (e.g. CXCL9/10/11, IL-1β) mediators, several of which exhibited significantly higher expression in infants at risk of sLRI. These data suggest that an LPS-induced and IRF1-regulated IFN gene network, detectable at birth, is associated with sLRI susceptibility in infancy. Consequently, we conclude that susceptibility to sLRI in infancy may be in part already determined at birth and this may be exploited to identify at-risk infants for early intervention and identify potential targets for drug development.
The contribution of bacteria and their products to the severity of viral-related respiratory infections has been suggested by numerous studies. For example, environmental LPS exposure modulates the severity of RSV infections depending on the levels of LPS exposure and TLR4 genotype (62). Moreover, studies from our group in the same cohort have demonstrated that sLRIs are often preceded by the transient incursion of pathogenic bacteria in the airway microbiome (17, 18). Multiple other studies have reported that the presence of pathogenic bacteria in the airways is associated with more severe viral respiratory tract infections for both RSV and RV (63–66). Additionally, bacterial colonization of the airway in neonates with Streptococcus pneumoniae, Haemophilus influenzae, or Moraxella catarrhalis was associated with persistent wheeze and severe exacerbations of wheeze (15), which are generally initiated by viral respiratory infections. Finally, Illi et al. demonstrated that LPS responses at 12 months of age in individuals who carry asthma-risk alleles on 17q21 are associated with risk of wheeze (32).
The proposition that heightened LPS-induced IFN responses/gene network connectivity patterns at birth may confer risk of viral-related sLRI during infancy at first sight may appear counterintuitive given the acknowledged protective role of IFNs in antiviral immunity (67, 68). However, hyper-production of IFNs in the airways during viral-associated infections, especially during infancy, are also known to contribute to accompanying inflammatory symptom severity (60, 69). Furthermore, IFN responses during bacterial infections have pleiotropic effects which may be beneficial or detrimental, depending on the site of infection and the specific pathogen involved (70, 71). For example, type I IFN mediated suppression of IL-1β responses (72) on the one hand attenuates lethal hyperinflammation associated with S. pyogenes (73) and on the other hand diminishes the antimicrobial function of IL-1β, resulting in increased airway and systemic M. tuberculosis colonisation (74). This suggests a balance exists between IFN and proinflammatory responses which impacts the clinical outcome of bacterial infection, although it is not clear how anti-bacterial responses may protect against or exacerbate viral infections. IRF1 promotes the constitutive expression of interferon-mediated antiviral programs at baseline and the inducible expression of these programs triggered by respiratory viral infections (75–78), and acts as a branch point between IFN responses and induction of specific pro-inflammatory genes (79). The function of IRF1 following bacterial infections is incompletely understood, although it appears essential for IFN-related inflammasome activation during Francisella novicida infection (75, 80) indicating a role in IFN and proinflammatory responses following pathogenic bacterial exposure. It is also notable in this context that IRF1 gene variants have been linked to childhood asthma risk and dysregulated proinflammatory responses (81). We did not observe a direct difference in IRF1 expression between individuals who did or did not record an sLRI in the first year of life at the time point investigated in our study. This suggests that the sLRI risk putatively associated with IRF1 may be conferred by its regulatory actions rather than its gene expression magnitude, or that IRF1 expression dysregulation occurs earlier than was measured in this study (18hrs). It is our interpretation of the data that IRF1 is a key driver of the LPS-induced IFN response networks associated with sLRI susceptibility in the first year of life.
The immune system of newborns is subject to drastic developmental changes in the first weeks (82) and months (83) of life. Since our study focused on CBMC-derived innate immune responses, we explored the extent to which CBMC responses reflect immune responses to infections occurring at later ages during childhood by applying classifiers trained on gene expression data generate in this study to infection-associated host response data derived from published cohorts. This approach was not intended as validation of the principal findings linking LPS-induced IFN response at birth with subsequent sLRI risk, but rather to establish whether the IFN response networks characterized from our in vitro experiments in CBMCs are representative of those operating in nature. LPS-induced IFN responses from CBMCs were used to accurately stratify children presenting to hospital with current bacterial infections, compared to controls, from whole blood samples (59). Likewise, Imiquimod/Poly(I:C)-induced CBMC IFN responses accurately classified children with febrile viral infections. Moreover, the CBMC-derived IFN responses induced by imiquimod or Poly(I:C) could classify infants and children with viral bronchiolitis and asthma exacerbations from blood and airway samples compared to controls, suggesting that these signatures are robust to some extent to variations in cellular composition between circulating blood and airway tissue. We also found that the accuracy of the random forest models was higher when predicting infants (<18mo) compared to younger (18mo-5yrs) (GSE113211 (60)) or older (6-17yrs) children (GSE115770 (61)). These data support that the IFN gene networks identified from our in vitro investigation of cord blood are bona fide response mediators of infection in real world contexts.
We acknowledge that our study has limitations that should be addressed. Firstly, gene expression profiles were generated from mixed cord blood cell populations and as such cannot distinguish cell-specific information. Further investigation with single-cell RNA sequencing may localize gene expression programs potentially responsible for sLRI risk in individual cells. Secondly, the study population consisted of 50 subjects from a high-risk cohort, limiting the power to detect disease-associated mechanisms. Follow-up studies with samples from large, unselected cohorts may identify more subtle mechanisms that confer risk for sLRI. Additionally, we utilised CBMC samples for this work, because they are readily available and abundant at birth. However, recent advances in sample processing methods now enable the generation of multi-omic data from small sample volumes, enabling longitudinal profiling of infants/children with natural infections (82). We profiled innate immune responses at a single timepoint (18hrs), and therefore our analyses cannot capture response dynamics. Finally, we employed three TLR ligands to mimic PRR activation events experienced during bacterial or viral infections. However, we acknowledge using TLR ligands is not equivalent to using live bacteria or virus. Notwithstanding these limitations, the major strengths of this study lie in the systems biology approach that provided genome-wide investigation of the CBMC responses, and the well characterized prospective cohort design, which allowed us to investigate sLRI risk with the totality of viral infections and relevant clinical outcomes recorded. In summary, our findings demonstrate that the risk of sLRI in early life is in part already determined at birth, and that the developmental status of LPS-induced interferon responses may represent a key factor which confers susceptibility. Our findings provide a rationale for the early identification of infants at risk for sLRI and identifies potential targets which may be relevant for drug development.
Data availability statement
The datasets presented in this study are available. RNA-Seq data is available from the NCBI Gene Expression Omnibus repository with accession number GSE184383. Raw and processed cytokine/chemokine data are provided as a Supplement (Data S1). Raw and processed metabolite data are provided as a Supplement (Data S2).
Ethics statement
Ethics was approved by The University of Western Australia (reference RA/4/1/7560). Written informed consent to participate in this study was provided by the participants’ legal guardian/next of kin.
Author contributions
PGH, AB, and PDS conceived the study and designed the experiments. JFR analysed the data. JFR and MS assisted with the experimental design and optimized and performed the experiments. JFR, MS, AB, SNR, DM, BJH, DIB, and DHS were involved in data acquisition. JFR, AB, PGH, DHS, SNR, DIB, MC, and YVK were involved in determining the analysis approach and optimization. JFR, AB, and PGH interpreted the data and drafted the manuscript. All authors contributed to the article and approved the submitted version.
Funding
This work was funded by National Health and Medical Research Council (NHMRC) project grant #1129996. PDS is a Leadership Fellow (L3) of the NHMRC.
Acknowledgments
The authors would like to thank the study participants and their families for their involvement.
Conflict of interest
JFR and AB are co-inventors on a provisional patent filed subsequent to this work. JFR and AB are co-founders, equity holders, and directors of a startup company Respiradigm Pty Ltd related to this provisional patent.
The remaining authors declare that the research was conducted in the absence of any commercial or financial relationships that could be construed as a potential conflict of interest.
Publisher’s note
All claims expressed in this article are solely those of the authors and do not necessarily represent those of their affiliated organizations, or those of the publisher, the editors and the reviewers. Any product that may be evaluated in this article, or claim that may be made by its manufacturer, is not guaranteed or endorsed by the publisher.
Supplementary material
The Supplementary Material for this article can be found online at: https://www.frontiersin.org/articles/10.3389/fimmu.2022.876654/full#supplementary-material
Data S1 | Raw and normalized cytokines multiplex assay data.
Data S2 | Raw and corrected metabolite relative abundances.
References
1. Nair H, Nokes DJ, Gessner BD, Dherani M, Madhi SA, Singleton RJ, et al. Global burden of acute lower respiratory infections due to respiratory syncytial virus in young children: a systematic review and meta-analysis. Lancet. (2010) 375(9725):1545–55. doi: 10.1016/S0140-6736(10)60206-1
2. Kieninger E, Fuchs O, Latzin P, Frey U, Regamey N. Rhinovirus infections in infancy and early childhood. Eur Respir J (2013) 41(2):443–52. doi: 10.1183/09031936.00203511
3. Sigurs N, Bjarnason R, Sigurbergsson F, Kjellman B. Respiratory syncytial virus bronchiolitis in infancy is an important risk factor for asthma and allergy at age 7. Am J Respir Crit Care Med (2000) 161(5):1501–7. doi: 10.1164/ajrccm.161.5.9906076
4. Jackson DJ. The role of rhinovirus infections in the development of early childhood asthma. Curr Opin Allergy Clin Immunol (2010) 10(2):133–8. doi: 10.1097/ACI.0b013e3283352f7c
5. Kusel MM, de Klerk NH, Kebadze T, Vohma V, Holt PG, Johnston SL, et al. Early-life respiratory viral infections, atopic sensitization, and risk of subsequent development of persistent asthma. J Allergy Clin Immunol (2007) 119(5):1105–10. doi: 10.1016/j.jaci.2006.12.669
6. Jackson DJ, Gangnon RE, Evans MD, Roberg KA, Anderson EL, Pappas TE, et al. Wheezing rhinovirus illnesses in early life predict asthma development in high-risk children. Am J Respir Crit Care Med (2008) 178(7):667–72. doi: 10.1164/rccm.200802-309OC
7. Jartti T, Gern JE. Role of viral infections in the development and exacerbation of asthma in children. J Allergy Clin Immunol (2017) 140(4):895–906. doi: 10.1016/j.jaci.2017.08.003
8. Heinonen S, Rodriguez-Fernandez R, Diaz A, Oliva Rodriguez-Pastor S, Ramilo O, Mejias A. Infant immune response to respiratory viral infections. Immunol Allergy Clin North Am (2019) 39(3):361–76. doi: 10.1016/j.iac.2019.03.005
9. Jartti T, Bonnelykke K, Elenius V, Feleszko W. Role of viruses in asthma. Semin Immunopathol (2020) 42(1):61–74. doi: 10.1007/s00281-020-00781-5
10. Rubner FJ, Jackson DJ, Evans MD, Gangnon RE, Tisler CJ, Pappas TE, et al. Early life rhinovirus wheezing, allergic sensitization, and asthma risk at adolescence. J Allergy Clin Immunol (2017) 139(2):501–7. doi: 10.1016/j.jaci.2016.03.049
11. Lukkarinen M, Koistinen A, Turunen R, Lehtinen P, Vuorinen T, Jartti T. Rhinovirus-induced first wheezing episode predicts atopic but not nonatopic asthma at school age. J Allergy Clin Immunol (2017) 140(4):988–95. doi: 10.1016/j.jaci.2016.12.991
12. Olenec JP, Kim WK, Lee WM, Vang F, Pappas TE, Salazar LE, et al. Weekly monitoring of children with asthma for infections and illness during common cold seasons. J Allergy Clin Immunol (2010) 125(5):1001–6.e1. doi: 10.1016/j.jaci.2010.01.059
13. Bisgaard H, Hermansen MN, Bonnelykke K, Stokholm J, Baty F, Skytt NL, et al. Association of bacteria and viruses with wheezy episodes in young children: prospective birth cohort study. BMJ (2010) 341:c4978. doi: 10.1136/bmj.c4978
14. Carlsson CJ, Vissing NH, Sevelsted A, Johnston SL, Bonnelykke K, Bisgaard H. Duration of wheezy episodes in early childhood is independent of the microbial trigger. J Allergy Clin Immunol (2015) 136(5):1208–14.e1-5. doi: 10.1016/j.jaci.2015.05.003
15. Bisgaard H, Hermansen MN, Buchvald F, Loland L, Halkjaer LB, Bonnelykke K, et al. Childhood asthma after bacterial colonization of the airway in neonates. N Engl J Med (2007) 357(15):1487–95. doi: 10.1056/NEJMoa052632
16. Larsen JM, Brix S, Thysen AH, Birch S, Rasmussen MA, Bisgaard H. Children with asthma by school age display aberrant immune responses to pathogenic airway bacteria as infants. J Allergy Clin Immunol (2014) 133(4):1008–13. doi: 10.1016/j.jaci.2014.01.010
17. Teo SM, Mok D, Pham K, Kusel M, Serralha M, Troy N, et al. The infant nasopharyngeal microbiome impacts severity of lower respiratory infection and risk of asthma development. Cell Host Microbe (2015) 17(5):704–15. doi: 10.1016/j.chom.2015.03.008
18. Teo SM, Tang HHF, Mok D, Judd LM, Watts SC, Pham K, et al. Airway microbiota dynamics uncover a critical window for interplay of pathogenic bacteria and allergy in childhood respiratory disease. Cell Host Microbe (2018) 24(3):341–52.e5. doi: 10.1016/j.chom.2018.08.005
19. Bellinghausen C, Rohde GGU, Savelkoul PHM, Wouters EFM, Stassen FRM. Viral-bacterial interactions in the respiratory tract. J Gen Virol (2016) 97(12):3089–102. doi: 10.1099/jgv.0.000627
20. Beigelman A, Bacharier LB. Early-life respiratory infections and asthma development: role in disease pathogenesis and potential targets for disease prevention. Curr Opin Allergy Clin Immunol (2016) 16(2):172–8. doi: 10.1097/ACI.0000000000000244
21. von Mutius E, Vercelli D. Farm living: effects on childhood asthma and allergy. Nat Rev Immunol (2010) 10(12):861–8. doi: 10.1038/nri2871
22. Stein MM, Hrusch CL, Gozdz J, Igartua C, Pivniouk V, Murray SE, et al. Innate immunity and asthma risk in Amish and Hutterite farm children. N Engl J Med (2016) 375(5):411–21. doi: 10.1056/NEJMoa1508749
23. Kollmann TR, Kampmann B, Mazmanian SK, Marchant A, Levy O. Protecting the newborn and young infant from infectious diseases: Lessons from immune ontogeny. Immunity. (2017) 46(3):350–63. doi: 10.1016/j.immuni.2017.03.009
24. Georgountzou A, Papadopoulos NG. Postnatal innate immune development: From birth to adulthood. Front Immunol (2017) 8:957. doi: 10.3389/fimmu.2017.00957
25. Yu JC, Khodadadi H, Malik A, Davidson B, Salles E, Bhatia J, et al. Innate immunity of neonates and infants. Front Immunol (2018) 9:1759. doi: 10.3389/fimmu.2018.01759
26. Belderbos ME, van Bleek GM, Levy O, Blanken MO, Houben ML, Schuijff L, et al. Skewed pattern of toll-like receptor 4-mediated cytokine production in human neonatal blood: low LPS-induced IL-12p70 and high IL-10 persist throughout the first month of life. Clin Immunol (2009) 133(2):228–37. doi: 10.1016/j.clim.2009.07.003
27. Kollmann TR, Crabtree J, Rein-Weston A, Blimkie D, Thommai F, Wang XY, et al. Neonatal innate TLR-mediated responses are distinct from those of adults. J Immunol (2009) 183(11):7150–60. doi: 10.4049/jimmunol.0901481
28. Nguyen M, Leuridan E, Zhang T, De Wit D, Willems F, Van Damme P, et al. Acquisition of adult-like TLR4 and TLR9 responses during the first year of life. PLoS One (2010) 5(4):e10407. doi: 10.1371/journal.pone.0010407
29. Marr N, Wang TI, Kam SH, Hu YS, Sharma AA, Lam A, et al. Attenuation of respiratory syncytial virus-induced and RIG-i-dependent type I IFN responses in human neonates and very young children. J Immunol (2014) 192(3):948–57. doi: 10.4049/jimmunol.1302007
30. DeVries A, Wlasiuk G, Miller SJ, Bosco A, Stern DA, Lohman IC, et al. Epigenome-wide analysis links SMAD3 methylation at birth to asthma in children of asthmatic mothers. J Allergy Clin Immunol (2017) 140(2):534–42. doi: 10.1016/j.jaci.2016.10.041
31. Holt PG, Mok D, Panda D, Renn L, Fabozzi G, deKlerk NH, et al. Developmental regulation of type 1 and type 3 interferon production and risk for infant infections and asthma development. J Allergy Clin Immunol (2019) 143(3):1176–82.e5. doi: 10.1016/j.jaci.2018.08.035
32. Illi S, Depner M, Pfefferle PI, Renz H, Roduit C, Taft DH, et al. Immune responsiveness to LPS determines risk of childhood wheeze and asthma in 17q21 risk allele carriers. Am J Respir Crit Care Med (2022) 205(6):641–50. doi: 10.1164/rccm.202106-1458OC
33. Roponen M, Yerkovich ST, Hollams E, Sly PD, Holt PG, Upham JW. Toll-like receptor 7 function is reduced in adolescents with asthma. Eur Respir J (2010) 35(1):64–71. doi: 10.1183/09031936.00172008
34. Kusel MM, de Klerk NH, Holt PG, Kebadze T, Johnston SL, Sly PD. Role of respiratory viruses in acute upper and lower respiratory tract illness in the first year of life: a birth cohort study. Pediatr Infect Dis J (2006) 25(8):680–6. doi: 10.1097/01.inf.0000226912.88900.a3
35. Kusel MM, Kebadze T, Johnston SL, Holt PG, Sly PD. Febrile respiratory illnesses in infancy and atopy are risk factors for persistent asthma and wheeze. Eur Respir J (2012) 39(4):876–82. doi: 10.1183/09031936.00193310
36. Holt PG, Rowe J, Kusel M, Parsons F, Hollams EM, Bosco A, et al. Toward improved prediction of risk for atopy and asthma among preschoolers: a prospective cohort study. J Allergy Clin Immunol (2010) 125(3):653–9.9.e1-9 e7. doi: 10.1016/j.jaci.2009.12.018
37. Yu M, Levine SJ. Toll-like receptor, RIG-i-like receptors and the NLRP3 inflammasome: key modulators of innate immune responses to double-stranded RNA viruses. Cytokine Growth Factor Rev (2011) 22(2):63–72. doi: 10.1016/j.cytogfr.2011.02.001
38. Barrett T, Wilhite SE, Ledoux P, Evangelista C, Kim IF, Tomashevsky M, et al. NCBI GEO: archive for functional genomics data sets–update. Nucleic Acids Res (2013) 41(Database issue):D991–5. doi: 10.1093/nar/gks1193
39. Broadhurst D, Goodacre R, Reinke SN, Kuligowski J, Wilson ID, Lewis MR, et al. Guidelines and considerations for the use of system suitability and quality control samples in mass spectrometry assays applied in untargeted clinical metabolomic studies. Metabolomics. (2018) 14(6):72. doi: 10.1007/s11306-018-1367-3
40. Robinson MD, McCarthy DJ, Smyth GK. edgeR: a bioconductor package for differential expression analysis of digital gene expression data. Bioinformatics. (2010) 26(1):139–40. doi: 10.1093/bioinformatics/btp616
41. Ritchie ME, Phipson B, Wu D, Hu Y, Law CW, Shi W, et al. Limma powers differential expression analyses for RNA-sequencing and microarray studies. Nucleic Acids Res (2015) 43(7):e47. doi: 10.1093/nar/gkv007
42. Breuer K, Foroushani AK, Laird MR, Chen C, Sribnaia A, Lo R, et al. InnateDB: systems biology of innate immunity and beyond–recent updates and continuing curation. Nucleic Acids Res (2013) 41(Database issue):D1228–33. doi: 10.1093/nar/gks1147
43. Newman AM, Steen CB, Liu CL, Gentles AJ, Chaudhuri AA, Scherer F, et al. Determining cell type abundance and expression from bulk tissues with digital cytometry. Nat Biotechnol (2019) 37(7):773–82. doi: 10.1038/s41587-019-0114-2
44. Regev A, Teichmann SA, Lander ES, Amit I, Benoist C, Birney E, et al. The human cell atlas. Elife (2017) 6:e27041. doi: 10.7554/eLife.27041
45. Langfelder P, Horvath S. WGCNA: an r package for weighted correlation network analysis. BMC Bioinf (2008) 9:559. doi: 10.1186/1471-2105-9-559
46. Yu G, He QY. ReactomePA: an R/Bioconductor package for reactome pathway analysis and visualization. Mol Biosyst (2016) 12(2):477–9. doi: 10.1039/C5MB00663E
47. Yu G, Wang LG, Han Y, He QY. clusterProfiler: an r package for comparing biological themes among gene clusters. OMICS. (2012) 16(5):284–7. doi: 10.1089/omi.2011.0118
48. Rinchai D, Roelands J, Toufiq M, Hendrickx W, Altman MC, Bedognetti D, et al. BloodGen3Module: Blood transcriptional module repertoire analysis and visualization using r. Bioinformatics (2021) 37(16):2382–9. doi: 10.1101/2020.07.16.205963
49. Margolin AA, Nemenman I, Basso K, Wiggins C, Stolovitzky G, Dalla Favera R, et al. ARACNE: an algorithm for the reconstruction of gene regulatory networks in a mammalian cellular context. BMC Bioinf (2006) 7 Suppl 1:S7. doi: 10.1186/1471-2105-7-S1-S7
50. Alvarez MJ, Shen Y, Giorgi FM, Lachmann A, Ding BB, Ye BH, et al. Functional characterization of somatic mutations in cancer using network-based inference of protein activity. Nat Genet (2016) 48(8):838–47. doi: 10.1038/ng.3593
51. Aibar S, Gonzalez-Blas CB, Moerman T, Huynh-Thu VA, Imrichova H, Hulselmans G, et al. SCENIC: single-cell regulatory network inference and clustering. Nat Methods (2017) 14(11):1083–6. doi: 10.1038/nmeth.4463
52. Singh A, Shannon CP, Gautier B, Rohart F, Vacher M, Tebbutt SJ, et al. DIABLO: an integrative approach for identifying key molecular drivers from multi-omics assays. Bioinformatics. (2019) 35(17):3055–62. doi: 10.1093/bioinformatics/bty1054
53. Kusel MM, Holt PG, de Klerk N, Sly PD. Support for 2 variants of eczema. J Allergy Clin Immunol (2005) 116(5):1067–72. doi: 10.1016/j.jaci.2005.06.038
54. Shalek AK, Satija R, Shuga J, Trombetta JJ, Gennert D, Lu D, et al. Single-cell RNA-seq reveals dynamic paracrine control of cellular variation. Nature. (2014) 510(7505):363–9. doi: 10.1038/nature13437
55. Jovanovic M, Rooney MS, Mertins P, Przybylski D, Chevrier N, Satija R, et al. Immunogenetics. dynamic profiling of the protein life cycle in response to pathogens. Science. (2015) 347(6226):1259038. doi: 10.1126/science.1259038
56. Lawlor N, Nehar-Belaid D, Grassmann JDS, Stoeckius M, Smibert P, Stitzel ML, et al. Single cell analysis of blood mononuclear cells stimulated through either LPS or anti-CD3 and anti-CD28. Front Immunol (2021) 12:636720. doi: 10.3389/fimmu.2021.636720
57. de Jong E, Bosco A. Unlocking immune-mediated disease mechanisms with transcriptomics. Biochem Soc Trans (2021) 49(2):705–14. doi: 10.1042/BST20200652
58. Burke HB. Predicting clinical outcomes using molecular biomarkers. biomark Cancer (2016) 8:89–99. doi: 10.4137/BIC.S33380
59. Herberg JA, Kaforou M, Wright VJ, Shailes H, Eleftherohorinou H, Hoggart CJ, et al. Diagnostic test accuracy of a 2-transcript host RNA signature for discriminating bacterial vs viral infection in febrile children. JAMA. (2016) 316(8):835–45. doi: 10.1001/jama.2016.11236
60. Jones AC, Anderson D, Galbraith S, Fantino E, Gutierrez Cardenas D, Read JF, et al. Personalized transcriptomics reveals heterogeneous immunophenotypes in children with viral bronchiolitis. Am J Respir Crit Care Med (2019) 199(12):1537–49. doi: 10.1164/rccm.201804-0715OC
61. Altman MC, Gill MA, Whalen E, Babineau DC, Shao B, Liu AH, et al. Transcriptome networks identify mechanisms of viral and nonviral asthma exacerbations in children. Nat Immunol (2019) 20(5):637–51. doi: 10.1038/s41590-019-0347-8
62. Caballero MT, Serra ME, Acosta PL, Marzec J, Gibbons L, Salim M, et al. TLR4 genotype and environmental LPS mediate RSV bronchiolitis through Th2 polarization. J Clin Invest (2015) 125(2):571–82. doi: 10.1172/JCI75183
63. de Steenhuijsen Piters WA, Heinonen S, Hasrat R, Bunsow E, Smith B, Suarez-Arrabal MC, et al. Nasopharyngeal microbiota, host transcriptome, and disease severity in children with respiratory syncytial virus infection. Am J Respir Crit Care Med (2016) 194(9):1104–15. doi: 10.1164/rccm.201602-0220OC
64. Diaz-Diaz A, Bunsow E, Garcia-Maurino C, Moore-Clingenpeel M, Naples J, Juergensen A, et al. Nasopharyngeal codetection of haemophilus influenzae and streptococcus pneumoniae shapes respiratory syncytial virus disease outcomes in children. J Infect Dis (2022) 225(5):912–23. doi: 10.1093/infdis/jiab481
65. McCauley K, Durack J, Valladares R, Fadrosh DW, Lin DL, Calatroni A, et al. Distinct nasal airway bacterial microbiotas differentially relate to exacerbation in pediatric patients with asthma. J Allergy Clin Immunol (2019) 144(5):1187–97. doi: 10.1016/j.jaci.2019.05.035
66. McCauley KE, Flynn K, Calatroni A, DiMassa V, LaMere B, Fadrosh DW, et al. Seasonal airway microbiome and transcriptome interactions promote childhood asthma exacerbations. J Allergy Clin Immunol (2022) 150(1):204–13. doi: 10.1016/j.jaci.2022.01.020
67. Fensterl V, Sen GC. Interferons and viral infections. Biofactors. (2009) 35(1):14–20. doi: 10.1002/biof.6
68. McNab F, Mayer-Barber K, Sher A, Wack A, O'Garra A. Type I interferons in infectious disease. Nat Rev Immunol (2015) 15(2):87–103. doi: 10.1038/nri3787
69. Jones AC, Anderson D, Galbraith S, Fantino E, Cardenas DG, Read JF, et al. Immunoinflammatory responses to febrile lower respiratory infections in infants display uniquely complex/intense transcriptomic profiles. J Allergy Clin Immunol (2019) 144(5):1411–3. doi: 10.1016/j.jaci.2019.07.043
70. Boxx GM, Cheng G. The roles of type I interferon in bacterial infection. Cell Host Microbe (2016) 19(6):760–9. doi: 10.1016/j.chom.2016.05.016
71. Kovarik P, Castiglia V, Ivin M, Ebner F. Type I interferons in bacterial infections: A balancing act. Front Immunol (2016) 7:652. doi: 10.3389/fimmu.2016.00652
72. Guarda G, Braun M, Staehli F, Tardivel A, Mattmann C, Forster I, et al. Type I interferon inhibits interleukin-1 production and inflammasome activation. Immunity. (2011) 34(2):213–23. doi: 10.1016/j.immuni.2011.02.006
73. Castiglia V, Piersigilli A, Ebner F, Janos M, Goldmann O, Dambock U, et al. Type I interferon signaling prevents IL-1beta-Driven lethal systemic hyperinflammation during invasive bacterial infection of soft tissue. Cell Host Microbe (2016) 19(3):375–87. doi: 10.1016/j.chom.2016.02.003
74. Mayer-Barber KD, Andrade BB, Barber DL, Hieny S, Feng CG, Caspar P, et al. Innate and adaptive interferons suppress IL-1alpha and IL-1beta production by distinct pulmonary myeloid subsets during mycobacterium tuberculosis infection. Immunity. (2011) 35(6):1023–34. doi: 10.1016/j.immuni.2011.12.002
75. Feng H, Zhang YB, Gui JF, Lemon SM, Yamane D. Interferon regulatory factor 1 (IRF1) and anti-pathogen innate immune responses. PLoS Pathog (2021) 17(1):e1009220. doi: 10.1371/journal.ppat.1009220
76. Zaheer RS, Proud D. Human rhinovirus-induced epithelial production of CXCL10 is dependent upon IFN regulatory factor-1. Am J Respir Cell Mol Biol (2010) 43(4):413–21. doi: 10.1165/rcmb.2009-0203OC
77. Yang J, Tian B, Sun H, Garofalo RP, Brasier AR. Epigenetic silencing of IRF1 dysregulates type III interferon responses to respiratory virus infection in epithelial to mesenchymal transition. Nat Microbiol (2017) 2:17086. doi: 10.1038/nmicrobiol.2017.86
78. Panda D, Gjinaj E, Bachu M, Squire E, Novatt H, Ozato K, et al. IRF1 maintains optimal constitutive expression of antiviral genes and regulates the early antiviral response. Front Immunol (2019) 10:1019. doi: 10.3389/fimmu.2019.01019
79. Forero A, Ozarkar S, Li H, Lee CH, Hemann EA, Nadjsombati MS, et al. Differential activation of the transcription factor IRF1 underlies the distinct immune responses elicited by type I and type III interferons. Immunity. (2019) 51(3):451–64.e6. doi: 10.1016/j.immuni.2019.07.007
80. Man SM, Karki R, Malireddi RK, Neale G, Vogel P, Yamamoto M, et al. The transcription factor IRF1 and guanylate-binding proteins target activation of the AIM2 inflammasome by francisella infection. Nat Immunol (2015) 16(5):467–75. doi: 10.1038/ni.3118
81. Landgraf-Rauf K, Boeck A, Siemens D, Klucker E, Vogelsang V, Schmidt S, et al. IRF-1 SNPs influence the risk for childhood allergic asthma: A critical role for pro-inflammatory immune regulation. Pediatr Allergy Immunol (2018) 29(1):34–41. doi: 10.1111/pai.12821
82. Lee AH, Shannon CP, Amenyogbe N, Bennike TB, Diray-Arce J, Idoko OT, et al. Dynamic molecular changes during the first week of human life follow a robust developmental trajectory. Nat Commun (2019) 10(1):1092. doi: 10.1038/s41467-019-08794-x
Keywords: innate immunity, respiratory infection, interferon, lipopolysaccharide (LPS), multi-omics, systems biology, pathogen recognition receptor (PRR)
Citation: Read JF, Serralha M, Mok D, Holt B J, Cruickshank M, Karpievitch YV, Broadhurst DI, Sly PD, Strickland DH, Reinke SN, Holt PG and Bosco A (2022) Lipopolysaccharide-induced interferon response networks at birth are predictive of severe viral lower respiratory infections in the first year of life. Front. Immunol. 13:876654. doi: 10.3389/fimmu.2022.876654
Received: 15 February 2022; Accepted: 12 July 2022;
Published: 05 August 2022.
Edited by:
Peter S. Linsley, Benaroya Research Institute, United StatesCopyright © 2022 Read, Serralha, Mok, Holt, Cruickshank, Karpievitch, Broadhurst, Sly, Strickland, Reinke, Holt and Bosco. This is an open-access article distributed under the terms of the Creative Commons Attribution License (CC BY). The use, distribution or reproduction in other forums is permitted, provided the original author(s) and the copyright owner(s) are credited and that the original publication in this journal is cited, in accordance with accepted academic practice. No use, distribution or reproduction is permitted which does not comply with these terms.
*Correspondence: James F. Read, SmFtZXMuUmVhZEB0ZWxldGhvbmtpZHMub3JnLmF1; Anthony Bosco, YWJvc2NvQGFyaXpvbmEuZWR1