 Shenghan Lou1†
 Yanming Huang1†Fenqi Du1†Jingmin Xue1Genshen Mo1Hao Li1Zhanjiang Yu2Yuanchun Li3
 Hang Wang1Yuze Huang1Haonan Xie1Wenjie Song1Xinyue Zhang4Huiying Li5*Chun Lou4*
 Peng Han1,6,7*
- 1Department of Oncology Surgery, Harbin Medical University Cancer Hospital, Harbin, Heilongjiang, China
- 2Department of General Surgery, The Third Affiliated Hospital of Qiqihar Medical University, Qiqihar, Heilongjiang, China
- 3Department of General Surgery, The Second Affiliated Hospital of Qiqihar Medical University, Qiqihar, Heilongjiang, China
- 4Department of Breast Surgery, Harbin Medical University Cancer Hospital, Harbin, Heilongjiang, China
- 5Department of Pathology, Harbin Medical University Cancer Hospital, Harbin, Heilongjiang, China
- 6Heilongjiang Province Key Laboratory of Molecular Oncology, Harbin, Heilongjiang, China
- 7Heilongjiang Cancer Institute, Harbin, Heilongjiang, China
Introduction: The conventional tumor-node-metastasis (TNM) classification system remains limited in accurately forecasting prognosis and guiding adjuvant chemotherapy decisions for patients with colorectal cancer (CRC). To address this gap, we introduced and validated a novel pathomics signature (PSCRC) derived from hematoxylin and eosin-stained whole slide images, leveraging a deep learning framework.
Methods: This retrospective study analyzed 883 slides from two independent cohorts. An interpretable multi-instance learning model was developed to construct PSCRC, with SHapley Additive exPlanations (SHAP) and gradient-weighted class activation mapping (Grad-CAM) for the improvement of model interpretability and the identification of critical histopathological features, respectively. The transcriptomic data was provided by The Cancer Genome Atlas (TCGA) and integrated to investigate the biological mechanisms underpinning PSCRC.
Results: The results demonstrated that PSCRC was proven to be an independent prognostic indicator for both overall and disease-free survival. It significantly enhanced the prognostic performance alongside TNM staging, as shown by improvements in net reclassification and integrated discrimination indices. Furthermore, patients in stages II and III with low PSCRC levels were more likely to benefit from chemotherapy. Morphologically, PSCRC reflected features such as tumor infiltration, adipocyte presence, fibrotic stroma, and immune cell engagement. Transcriptome analysis further revealed links between PSCRC and pathways involved in tumor progression and immune evasion.
Discussion: Our findings suggested that the application of deep learning to histopathological images could be an efficient method to improve the prognostic accuracy and evaluate the treatment responses in CRC. The PSCRC offers a promising aid for clinical decision-making by shedding light on key pathogenic processes. Nevertheless, further validation through prospective studies remains essential.
1 Introduction
Globally ranked the third in terms of diagnostic frequency, colorectal cancer (CRC) remains the second major cause of cancer mortality (1). Current clinical management predominantly depends on the tumor-node-metastasis (TNM) classification system (2). Nonetheless, notable variability in patient outcomes persists even among individuals categorized within the same clinical stage (3). This outcome disparity underscores the limitations of the TNM system alone and highlights the urgent need for more refined and individualized prognostic biomarkers.
Although recent advances in molecular omics have uncovered critical biomarkers linked to CRC prognosis and progression (4), their translation into routine clinical practice has been hindered by issues such as sample integrity, processing time, and financial burden. In addition, individual driver mutations and RNA-based signatures have demonstrated limited prognostic value and insufficient utility in informing treatment decisions (5, 6). Consequently, there is an ongoing need for novel robust biomarkers that can classify patients into clinically meaningful subgroups, enabling personalized therapeutic approaches, enhancing clinical decision-making, and reducing the risk of inappropriate treatment intensity (7).
The integration of whole-slide imaging and artificial intelligence (AI) has recently transformed the analysis of hematoxylin and eosin (H&E)-stained tissues, a standard yet pivotal step in solid tumor diagnosis. This advancement has enabled more widespread and quantitative evaluation of pathological features. High-resolution digital slides capture rich biomedical information that remains largely untapped, yet hold potential for inferring molecular profiles and predicting clinical outcomes (8, 9). Leveraging such data offers a cost-efficient strategy for enhanced risk stratification by using routinely available histopathological slides.
Despite significant progress, several barriers hinder the clinical integration of deep learning-based pathology analysis. A major limitation is the lack of model interpretability, commonly described as the “black-box” dilemma (10, 11). Additionally, the generalizability of these models remains constrained because of their dependence on the size and heterogeneity of training datasets (12). Other persistent issues include overfitting, limited reproducibility, substantial computational demands, and ethical considerations in medical practice (13, 14).
To overcome these limitations, this study applied weakly supervised learning to analyze whole-slide images (WSIs) and establish a novel prognostic marker for patients with primary CRC. In addition, visualization methods were employed to uncover consistent histopathological patterns correlated with clinical outcomes. To further enhance biological interpretability, we integrated transcriptomic data with morphological features using bioinformatic analyses to elucidate the potential pathobiological mechanisms underlying risk stratification produced by the pathomics model.
2 Materials and methods
This study received approval from the institutional ethics committee (ID: KY2024-16) and adhered to the Reporting Recommendations for Tumor Marker Prognostic Studies (REMARK) guidelines (15). Written informed consent was obtained from all participants prior to surgery, including permission to use the tissue specimens and clinical data for research purposes. All the adopted procedures involving human participants followed the ethical principles of the Declaration of Helsinki.
2.1 Patient cohorts and study design
This retrospective multicenter cohort research included patients experiencing radical resection for CRC, drawing from three independent cohorts: TCGA-COAD, TCGA-READ, and real-world (HMUCH) cohort. The TCGA-COAD and TCGA-READ cohorts were combined to form a unified meta-cohort, designated as TCGA-CRC. The training cohort consisted of 485 consecutive patients treated at HMUCH between January 2012 and December 2013.
Patients were eligible for inclusion if they met the following criteria: (1) histopathologically confirmed CRC with R0 surgical margins; (2) survival of at least 90 days postoperatively to minimize bias from surgical quality (16, 17); (3) no prior history of malignancy; and (4) availability of complete clinical, pathological, and follow-up records. Individuals who received neoadjuvant therapy were excluded, as such treatment may alter tissue morphology in H&E-stained slides and affect the prognostic assessment.
A total of 398 CRC patients meeting the same eligibility criteria were obtained from TCGA database through the National Cancer Institute’s Genomic Data Commons (https://gdc.cancer.gov/). These cases, which included complete prognostic data and high-quality digital H&E-stained histopathological images, served as the validation cohort.
Baseline clinical and pathological characteristics were comprehensively collected, including patient age, sex, tumor site, invasion depth, perineural invasion, lymphovascular invasion, vascular invasion, lymph node involvement, TNM stage, follow-up information (duration and survival status), and receipt of postoperative adjuvant chemotherapy.
The determination of follow-up duration was performed from the surgery date to the most recent follow-up, with survival status documented at the final visit. Overall survival (OS) was set as the interval between either last follow-up or death and surgery. Disease-free survival (DFS) refers to the time from surgery to the first occurrence of recurrence at any site or death from any cause, whichever occurs earlier.
2.2 Image acquisition and data preprocessing
Slides from the HMUCH-CRC cohort were prepared through routine histopathological processing involving fixation in 4% neutral formaldehyde, paraffin embedding, 4 μm sectioning, and H&E staining. TNM staging was subsequently reassessed according to the 8th edition criteria of the American Joint Committee on Cancer (AJCC). For each case, representative sections illustrating the invasion depth were carefully selected. Following quality control, the slides were scanned using an Aperio AT2 scanner (Leica Biosystems, Germany) at 20× optical magnification (0.5 μm/pixel). The resulting digital images were stored in SVS format and managed using Aperio ImageScope software (version 12.4.6).
To facilitate the processing of WSIs approaching 10 gigapixels in size, we first applied the OTSU thresholding algorithm to remove white background regions (18). Subsequently, we partitioned the non-background region into non-overlapping image patches measuring 512 × 512 pixels at a 20-fold optical magnification and recorded their respective locations, resulting in over 7.7 million patches. Note that the batch size is 32, the initial learning rate is 0.01, the cosine decay optimizer is SGD and the momentum is 0.9. Additionally, we applied the Macenko method to normalize the color of small tiles (19), followed by z-score normalization on RGB channels to achieve a standard normal distribution of image intensities.
To enhance model generalization, various data augmentation strategies, such as flipping, mirroring, blurring, mild color perturbations, and progressive sprinkling, were randomly applied to the images in the validation and training sets. Notably, no augmentation was conducted on test images.
2.3 Pathomics feature extraction from images
In this study, we designed an advanced deep learning framework to address the complexity and heterogeneity inherent in large-scale tumor histopathology images. The model adopts a two-stage architecture, beginning with patch-level inference and subsequently integrating patch probabilities through a multi-instance learning (MIL)-based feature fusion algorithm to generate WSI-level predictions.
During training, each image patch was assigned the same label corresponding to the patient’s 5-year survival status. For patch-level classification, we employed ResNet-18, an established convolutional neural network architecture renowned for its success in the ImageNet challenge, to estimate patch-level survival likelihoods. Model optimization was performed using softmax cross-entropy loss and mini-batch stochastic gradient descent (SGD).
To enhance generalizability across heterogeneous cohorts, we applied transfer learning by initializing model weights using pre-trained parameters from the ImageNet dataset. The learning rate was fine-tuned via a cosine annealing schedule, defined as
indicates the minimum learning rate, and represents the maximum learning rate. The term denotes the number of iteration epochs used in the model training. We also utilize transfer learning algorithms to ensure optimal model fitting, by fine-tuning the backbone component parameters when . The learning rate for the backbone component is defined as follows:
Following the model training, each patch was assigned a prediction label along with its corresponding probability. These patch-level likelihoods were then aggregated using a classifier to generate the WSI-level outcomes. To facilitate this process, we developed two distinct MIL pipelines: the Patch Likelihood Histogram (PALHI) method and the Bag of Words (BoW) method, inspired by histogram-based and vocabulary-based strategies, respectively.
In the PALHI pipeline, a histogram-based representation is used to quantify the distribution of patch-level likelihoods within each WSI. In contrast, the BoW approach encodes each patch as a floating-point value using term frequency–inverse document frequency (TF-IDF) with a feature vector representing the entire slide.
Using these two distinct pipelines, patch-level outputs were effectively transformed into WSI-level features. Each method contributed 101 probabilistic features and 2 categorical label features. These individual feature sets were then integrated through early fusion, resulting in a unified feature vector of 206 dimensions for subsequent analysis.
2.4 Construction of the pathomics signature
The least absolute shrinkage and selection operator (LASSO) Cox regression model that incorporates an L1 penalty for the toward-zero reduction of feature coefficients is a well-established method for survival analysis in high-dimensional settings (20, 21). Referred to as the tuning constant, the penalty parameter λ governs the penalty strength.
In this study, the 10-fold cross-validation with the minimum criteria was applied for obtaining the optimal λ by minimizing the partial likelihood deviance within the training set. This approach enabled the identification of key prognostic features and construction of a formula for calculating the pathomics signature. The application of the derived formula to the validation set helped compute the corresponding signature scores.
2.5 Prognostic value of the pathomics signature
Through using the maximally selected rank statistics within the training cohort, the identification of the optimal cutoff for the pathomics signature was achieved, which was subsequently tested within the validation set. This threshold was adopted for the classification of the patients into high- and low-signature categories for prognostic evaluation. The differences in OS and DFS between both categories were analyzed using restricted mean survival time (RMST) metrics and Kaplan-Meier (K-M) survival curves (22).
The independent prognostic significance of the pathomics signature was assessed through performing univariate and multivariate Cox regression analyses. Subgroup heterogeneity was examined using interaction-based subgroup analysis. To evaluate the potential influence of unmeasured confounding, E-value analysis was conducted as a sensitivity assessment (23).
To measure discriminative performance, we calculated the concordance index (C-index) and the area under the receiver operating characteristic curve (AUROC). The agreement between predicted and observed survival probabilities was evaluated through applying calibration plots. The clinical utility of the pathomics model was further examined using decision curve analysis (DCA), which quantifies net benefit across varying decision thresholds (24).
To determine the added value of the pathomics signature beyond conventional TNM staging, we evaluated its impact on discrimination, calibration, clinical benefit, integrated discrimination improvement (IDI), net reclassification improvement (NRI), and prediction error curves (25).
2.6 Interpretation of the pathomics signature
To mitigate the interpretability limitations of deep learning models, we applied SHapley Additive exPlanations (SHAP), a method rooted in cooperative game theory, to quantify the contribution and relative importance of individual features to model outputs (26). This technique enables both global and instance-level interpretation of the predictions generated by the trained model.
The gradient-weighted class activation mapping (Grad-CAM) was utilized to produce heatmaps over selected image tiles for further exploration of prognostically relevant morphological patterns (27), highlighting crucial regions that influenced network predictions. This visualization technique utilized gradient information from the last convolutional layer of our deep learning network, providing a visual explanation that facilitates understanding and validating of the model’s decision-making process.
2.7 Bioinformatics analyses of the pathomics signature
Transcriptomic profiles from TCGA cohort were retrieved with the TCGAbiolinks package (28). Gene set enrichment analysis (GSEA) was performed to infer the biological processes related to the pathomics signature (29). Additionally, pathway activity was quantified using gene set variation analysis (GSVA) via the GSVA package (30), allowing the identification of significantly enriched pathways across different patient subgroups. Functional interpretation was based on the well-curated “hallmark gene sets” (31).
Weighted correlation network analysis (WGCNA) was performed using the WGCNA package, which aims to identify the pathomics signature-related gene modules (32). The scale-free topology fitting index of 0.85 was set as the threshold to construct the signed weighted gene co-expression network. The minimum co-expression module size was set to 30, and the merge cut minimum module merge cut height was set to 0.25. A biweight midcorrelation coefficient (bicor) > 0.1 and P-value < 0.05 were selected as the thresholds to find gene modules significantly associated with the pathomics signature. Gene annotation enrichment analysis was performed using the clusterProfiler package (33).
Furthermore, according to the guideline for transcriptome-based cell-type quantification methods, we utilized the MCPcounter and xCell algorithms to quantify the proportions of specific immune and stromal cells within the CRC samples (34–36).
2.8 Statistical analysis
The comparison of the continuous variables with normal distributions were performed using unpaired two-sample t-tests, while the analysis of the non-normally distributed variables were achieved via the Mann-Whitney U test or Kruskal-Wallis test. The assessment of the categorical variables was achieved via either Fisher’s exact test or the chi-squared (χ2) test. Survival curves were generated through applying the K-M method and evaluated via the log-rank test. Univariate and multivariate associations were examined using Cox regression analysis with 95% confidence intervals (CIs) and hazard ratios (HRs). The associations between continuous variables were analyzed through the calculation of the Spearman rank correlation coefficients. All statistical analyses were conducted using R software (v4.0.5) and SPSS (v19.0). Deep learning experiments were implemented in Python (v3.7.12). All tests were two-sided, with P-value < 0.05 considered statistically significant.
3 Results
3.1 Clinicopathological characteristics
Detailed clinicopathological features of patients from the training cohort (n = 485) and the validation cohort (n = 398) are summarized in Supplementary Table S1. Across all 883 patients, the median age was 62 years with the interquartile range (IQR) of 54–71, where males accounted for 54.9% (485/883) of the population. The majority (86.2%, 761/883) was diagnosed at stage II or III. In the training set, the median follow-up period was 72.5 months (IQR: 56.47–121.23), with 5-year DFS and OS rates of 75.51% and 81.28%, respectively. In contrast, the validation cohort had a shorter median follow-up of 24.33 months (IQR: 15.24–36.53), with corresponding 5-year DFS and OS rates of 61.89% and 70.97%. The differences observed in the clinicopathological profiles between cohorts reflect real-world clinical diversity, thereby enhancing the generalizability of our results.
3.2 Pathomics signature construction
The development framework for the pathomics signature is depicted in Figure 1. In the training cohort, a LASSO-Cox regression model with 10-fold cross-validation was employed to construct the signature. Using the optimal penalty parameter λ (Supplementary Figure S1), eight selected pathomics features were integrated into a composite risk score. The final formula for calculating the pathomics signature is as follows:
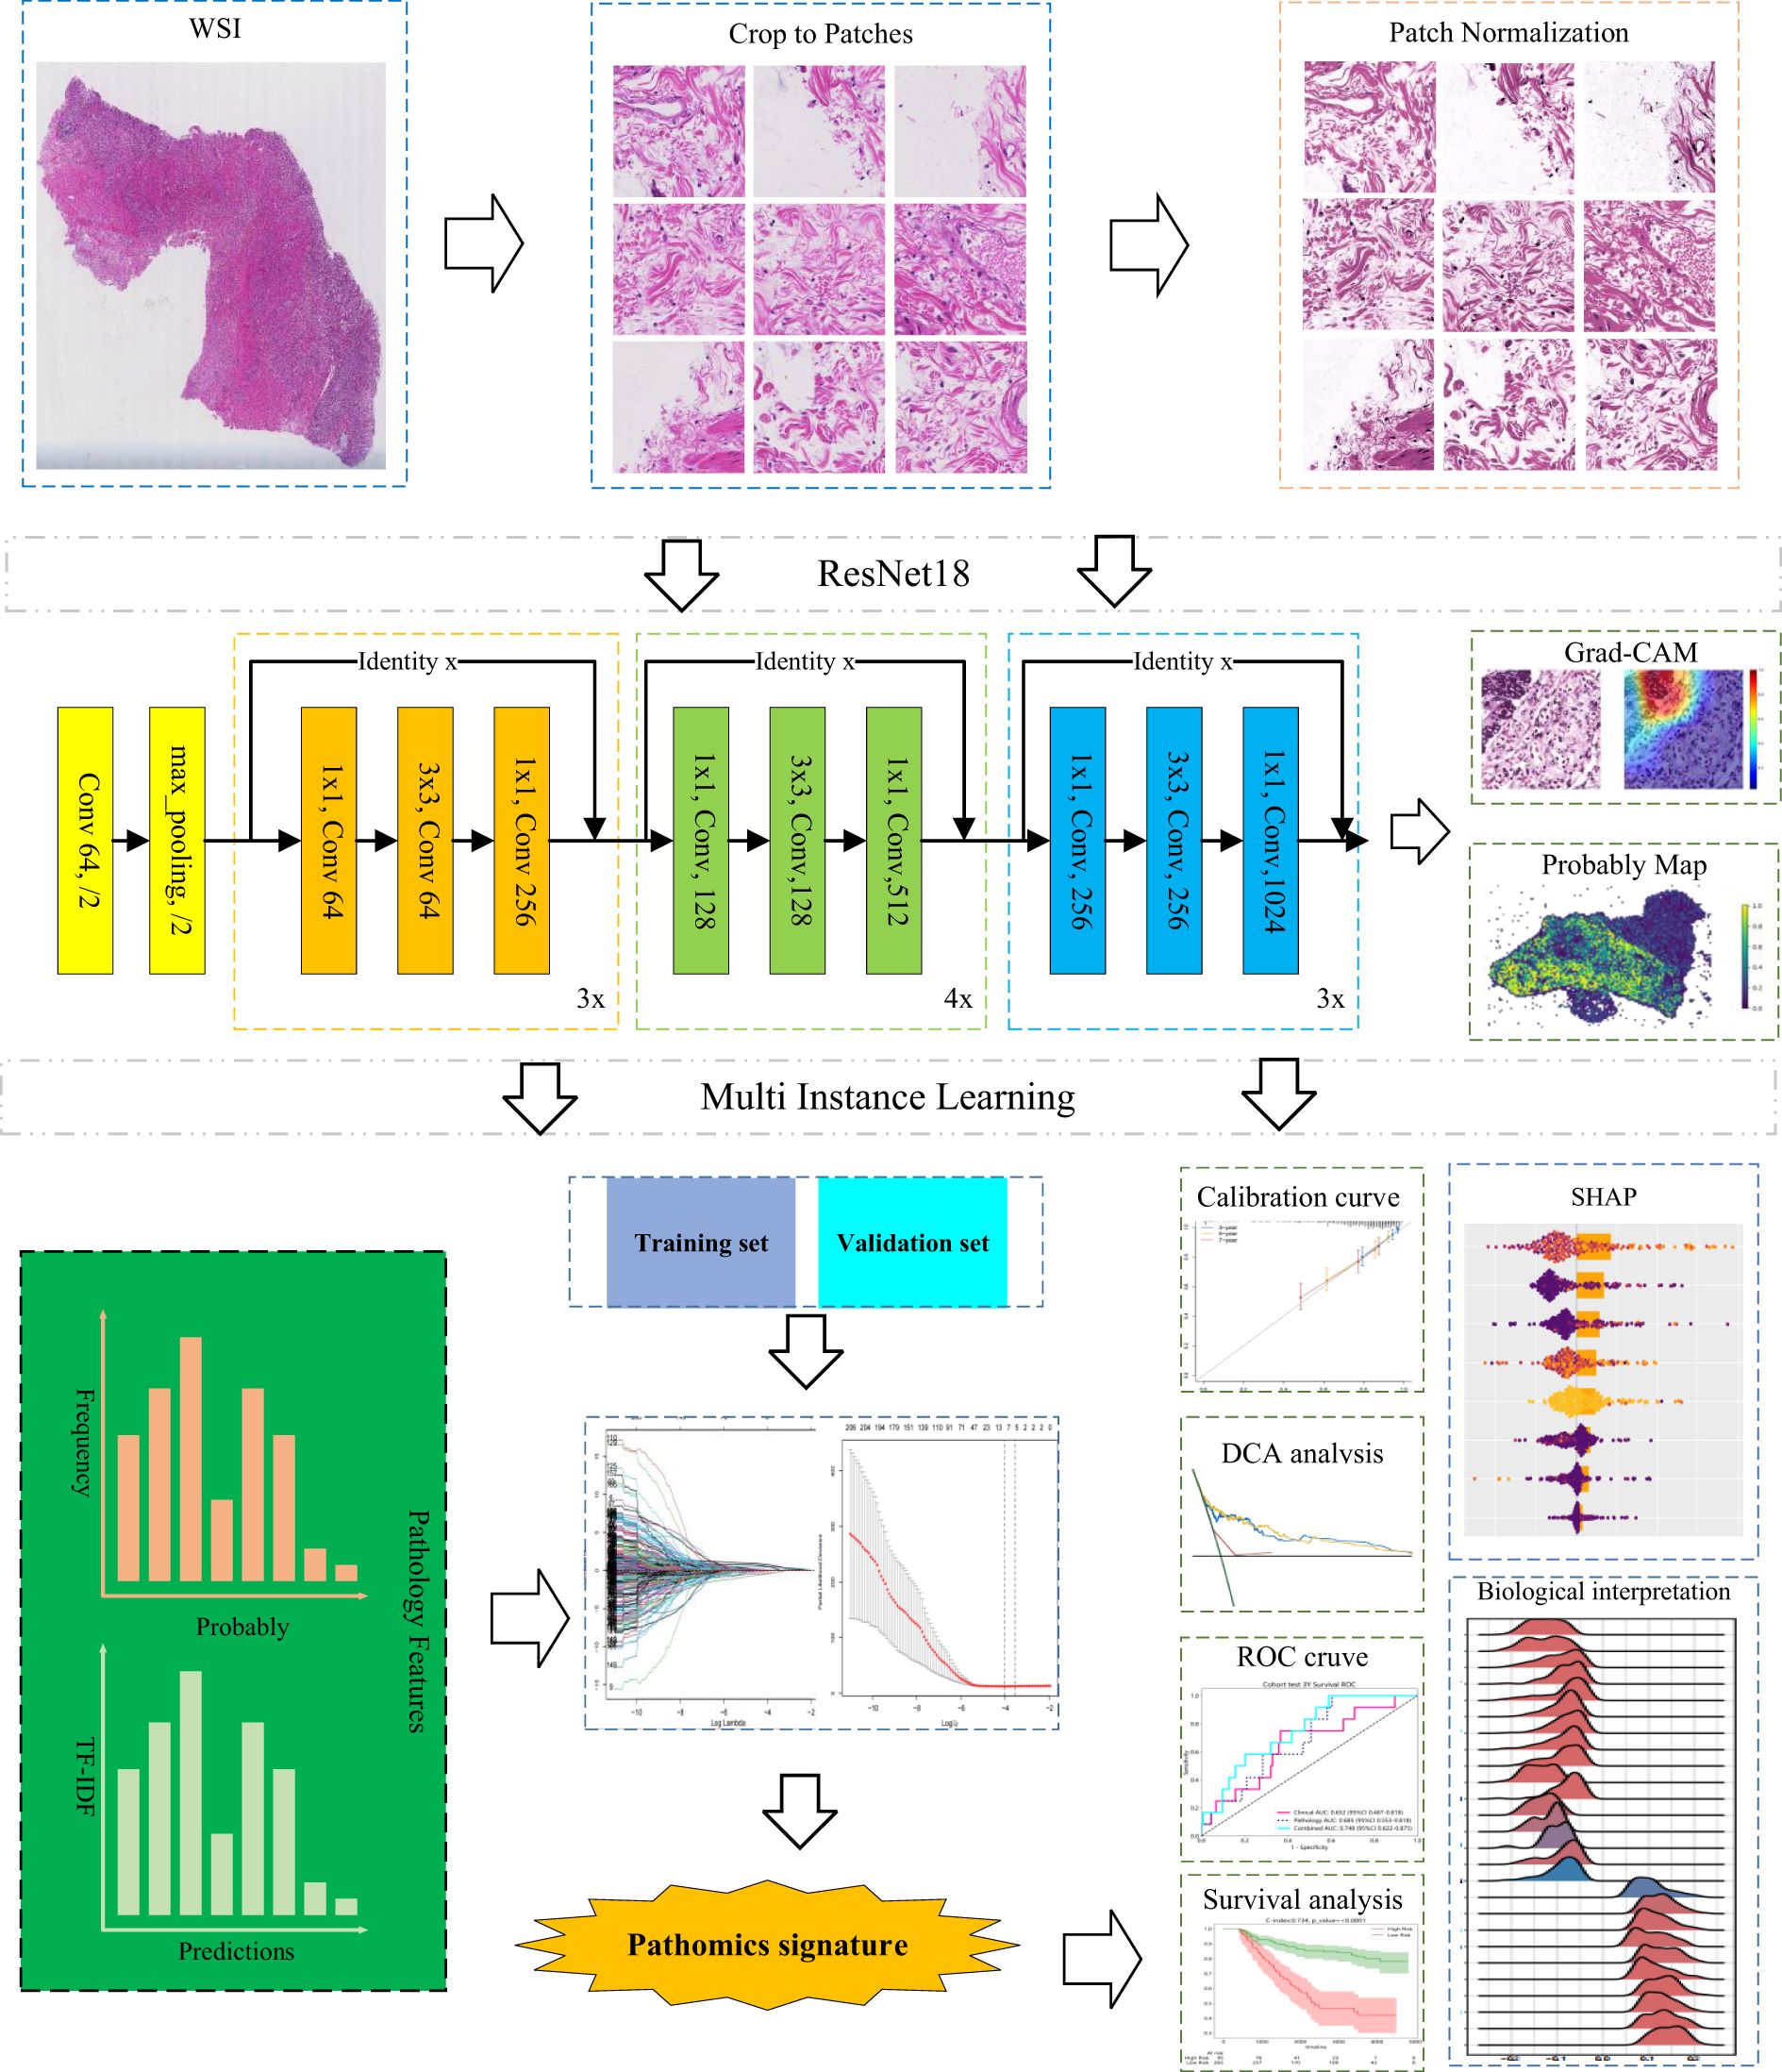
Figure 1. Construction framework of the pathomics signature.
The optimal cutoff point, identified based on the maximum standardized log-rank statistic, was 0.1139008. Patients in both the training and validation cohorts were stratified into high- and low-signature groups accordingly. Associations between the pathomics signature and clinicopathological characteristics are presented in Supplementary Table S2. Notably, a potential correlation was observed between the signature and lymph node counts.
3.3 Prognostic value of the pathomics signature
Supplementary Figure S2 illustrates the distribution of pathomics signature values by survival status along with selected feature profiles, indicating a positive association between elevated signature scores and a higher risk of recurrence or mortality. K-M survival analysis (Figure 2) demonstrated significant differences in both OS and DFS between the low- and high-signature groups in the training and validation cohorts.
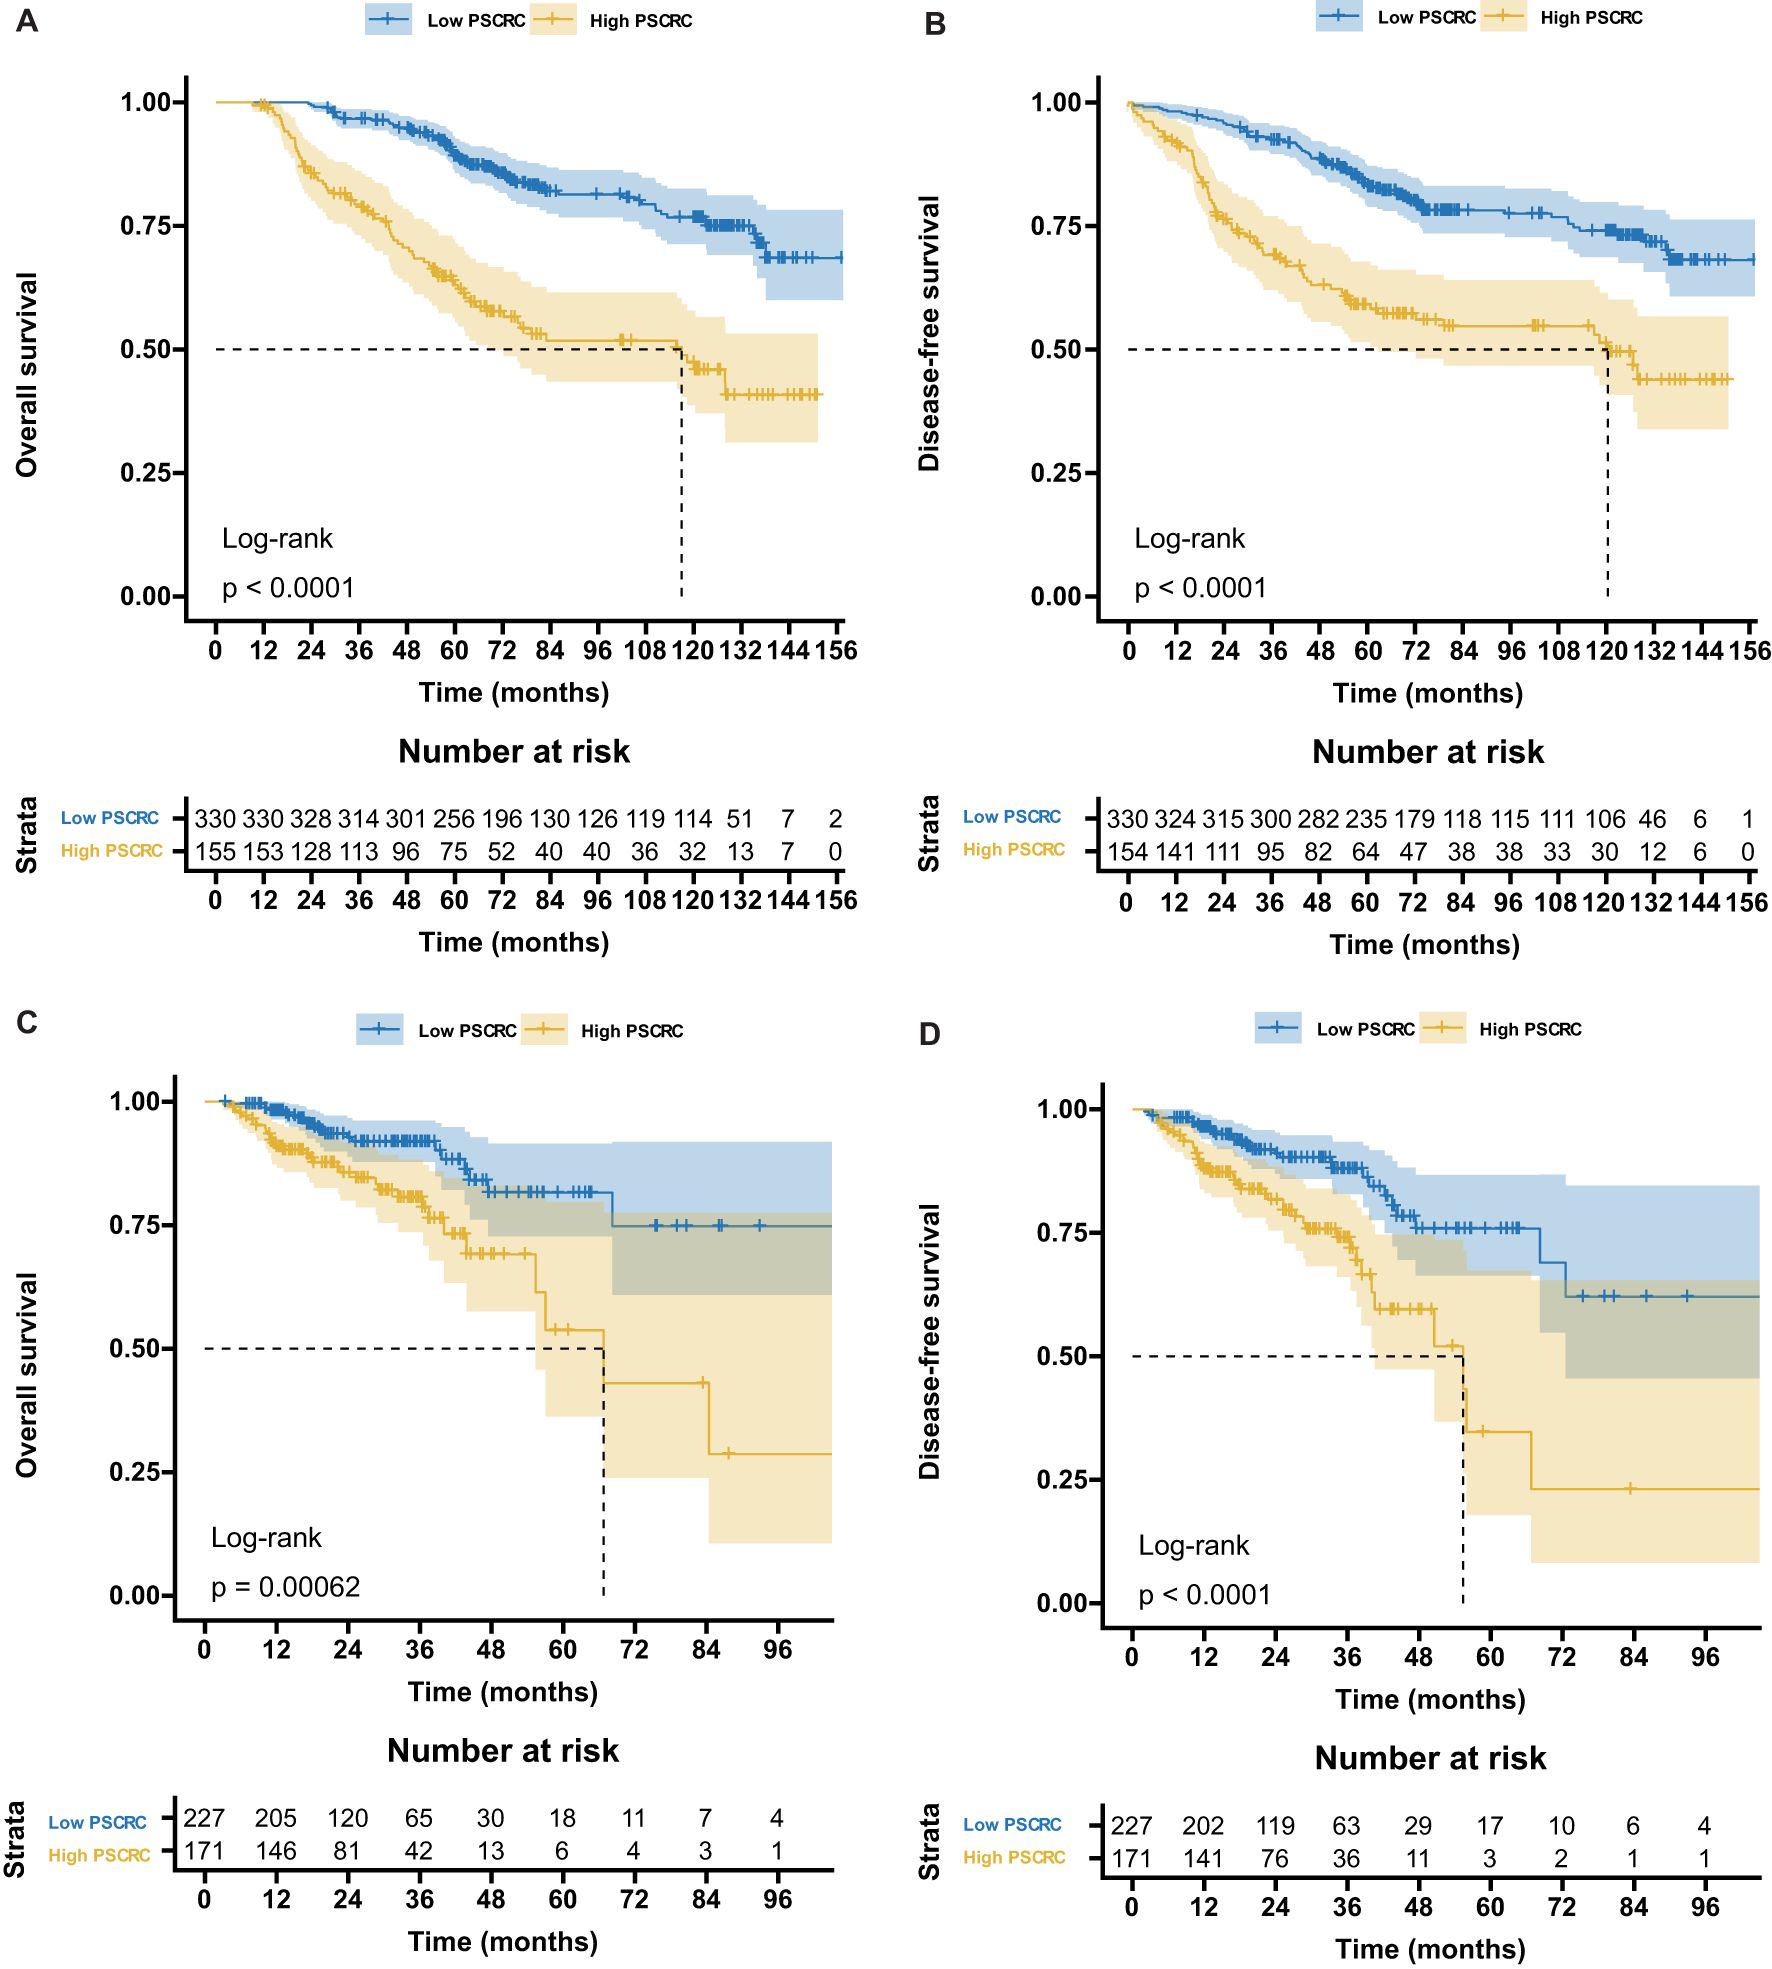
Figure 2. Kaplan-Meier survival curves according to the pathomics signature. (A) The OS rate difference between the high- and low- PSCRC patients in the training cohort. (B) The DFS rate difference between the high- and low- PSCRC patients in the training cohort. (C) The OS rate difference between the high- and low- PSCRC patients in the validation cohort. (D) The DFS rate difference between the high- and low- PSCRC patients in the validation cohort; OS, overall survival; DFS, disease-free survival; PSCRC, pathomics signature of colorectal cancer.
RMST analysis revealed a sustained survival advantage for patients with low pathomics signature scores across multiple time points, with the magnitude of the benefit increasing over time (Table 1). Specifically, the low-signature group exhibited an OS advantage of approximately 2 months at year 3, 8 months at year 5, and a notable 15 months by year 7 when compared to the high-signature group.
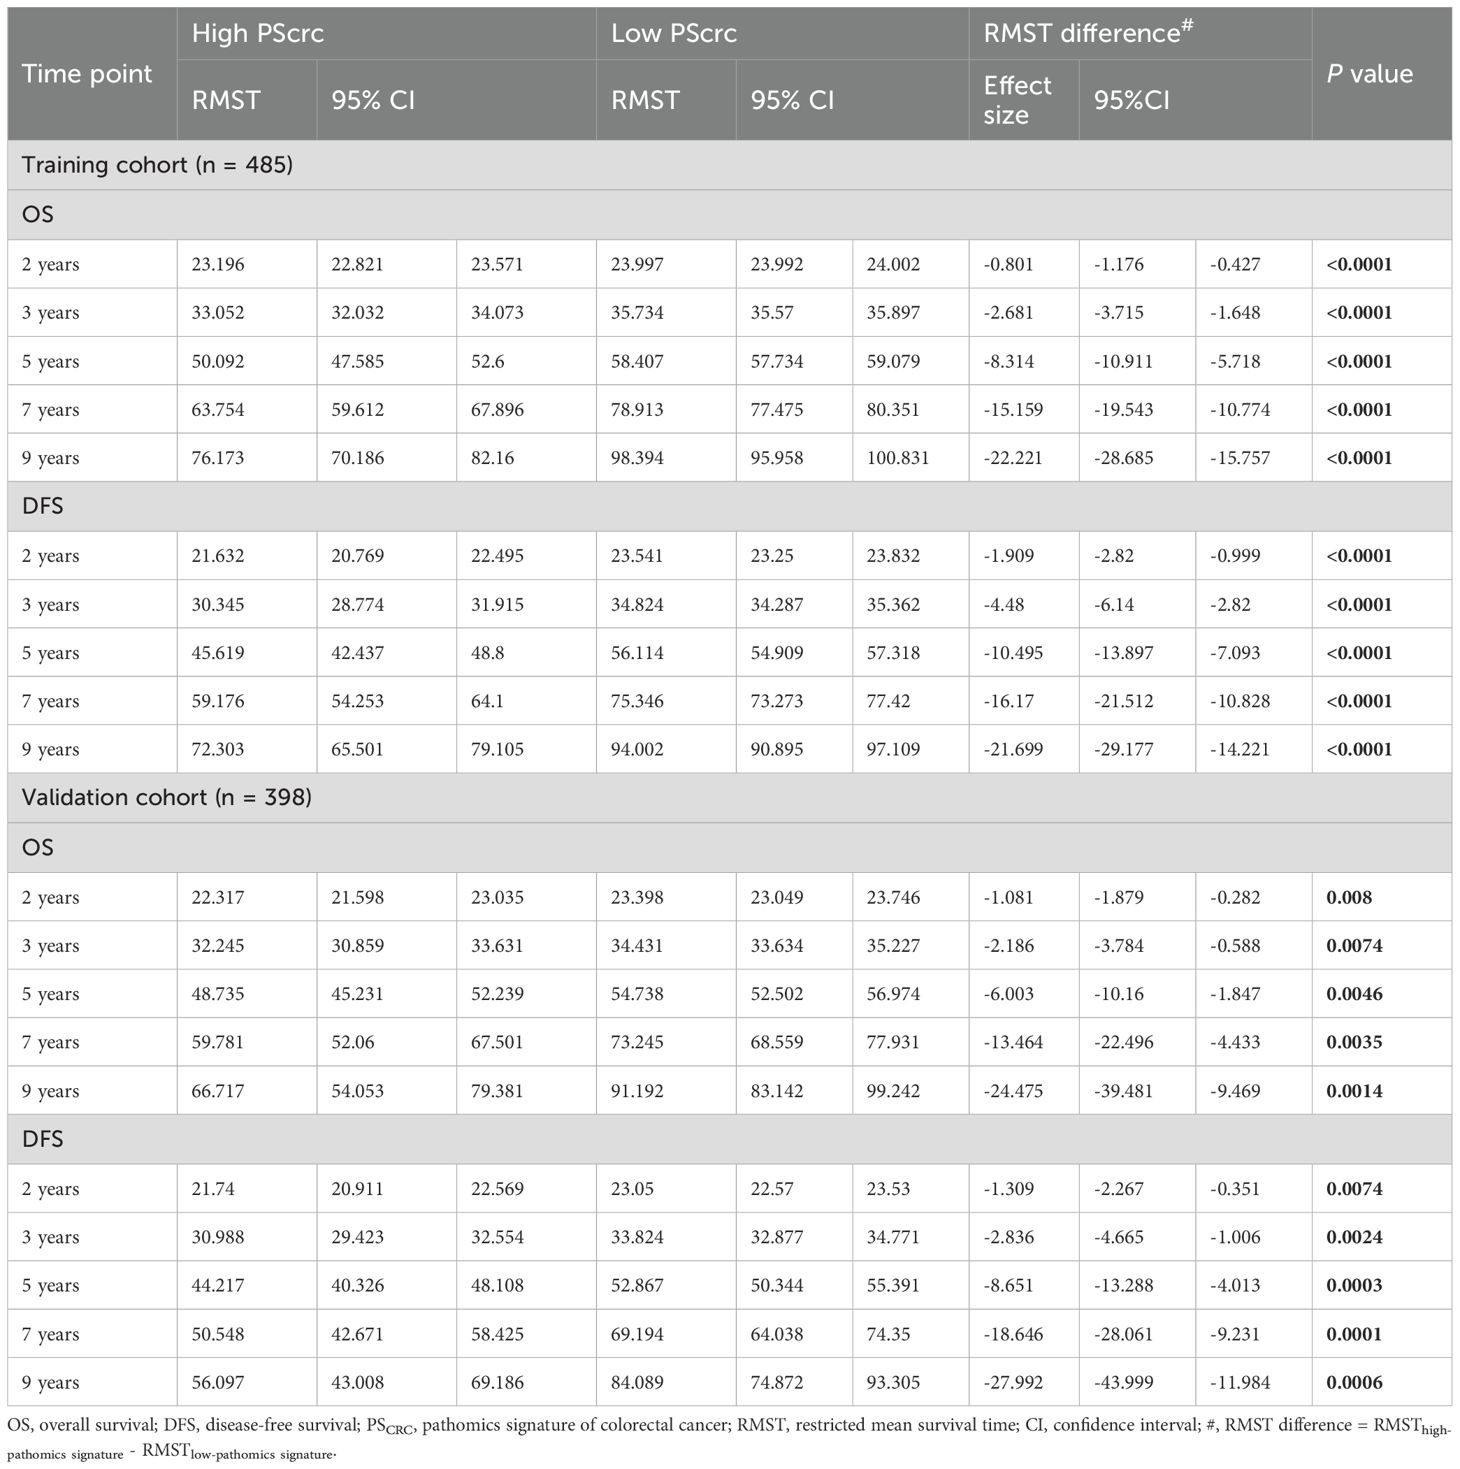
Table 1. Restricted mean survival time (RMST) difference analyses in the training and validation cohorts.
Univariate and multivariate Cox regression analyses confirmed the pathomics signature as an independent predictor of both DFS and OS in the training cohort (Table 2). Consistent findings were observed in the validation cohort (Supplementary Table S3). To assess the robustness of these associations against potential unmeasured confounding, E-value sensitivity analyses were conducted based on adjusted HRs in both cohorts (Supplementary Table S4).
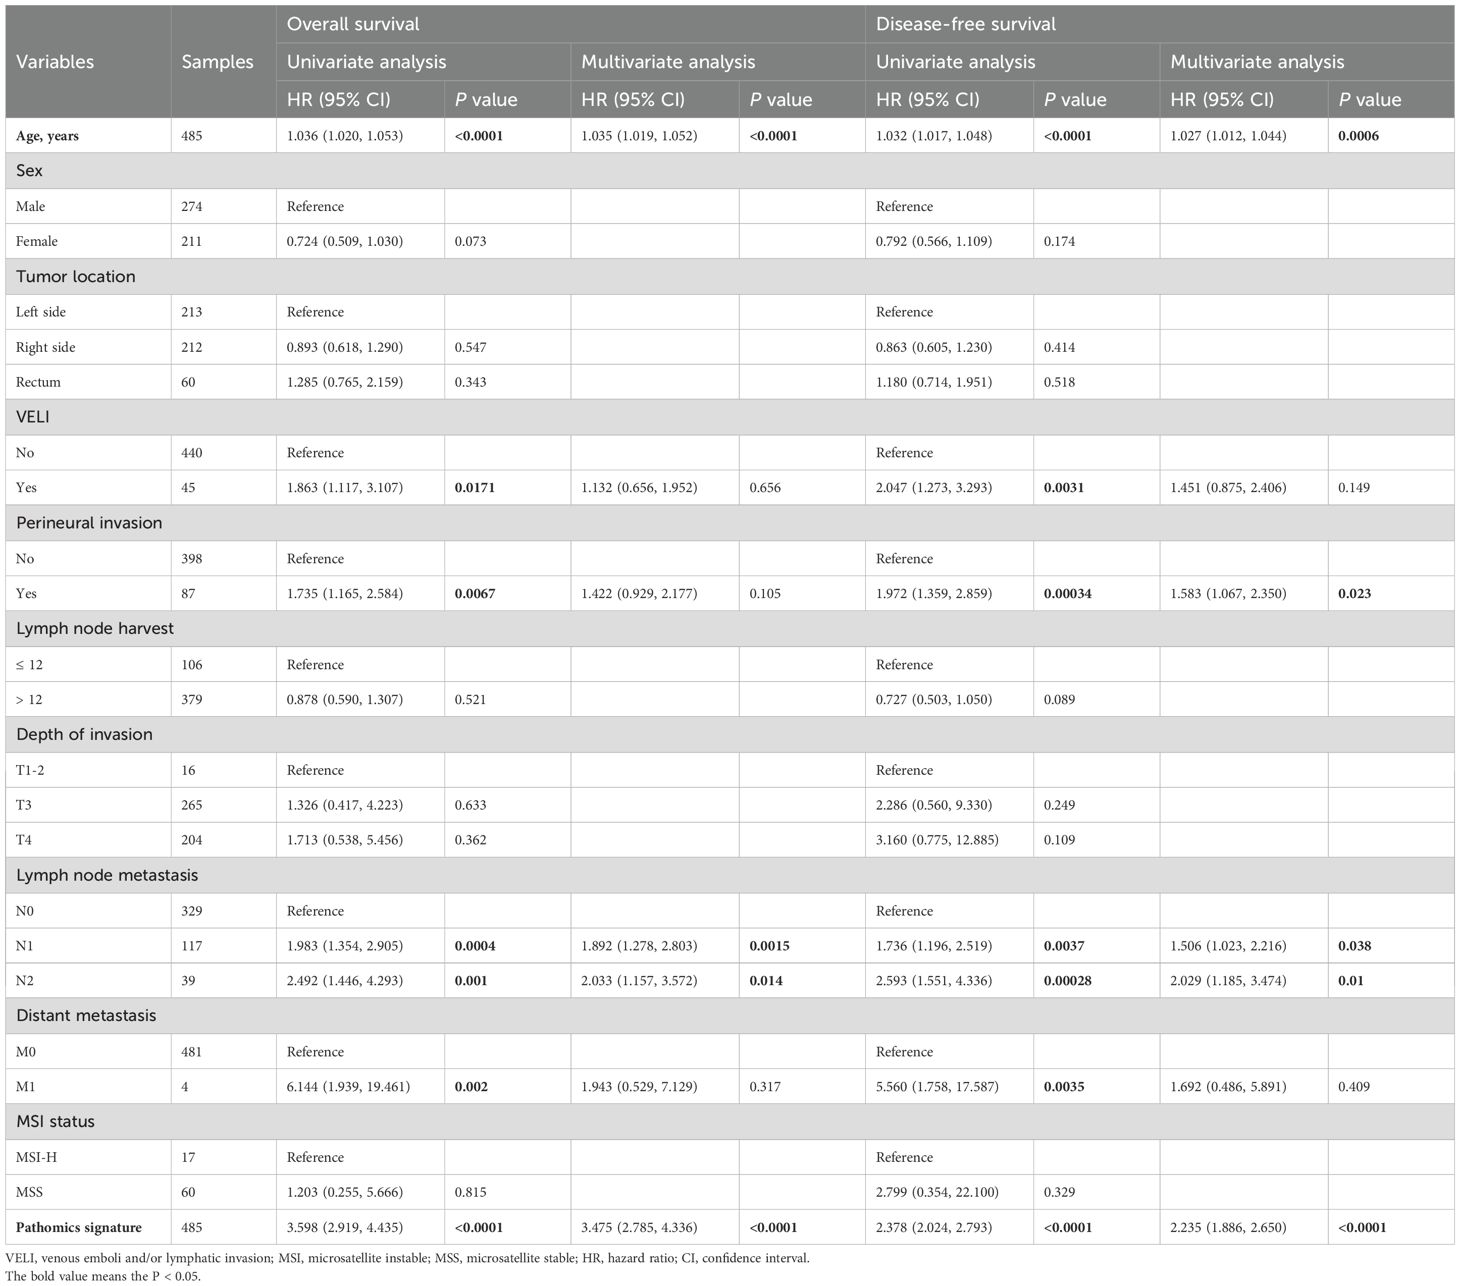
Table 2. Univariate and multivariate Cox regression analyses of the pathomics signature and clinicopathological characteristics for overall survival and disease-free survival in the training cohort.
Stratified analyses based on clinicopathological variables demonstrated that the pathomics signature remained a significant prognostic marker across all subgroups, except for patients with perineural invasion in the validation cohort (Table 3). A potential interaction between age and lymph node harvest was suggested by the subgroup difference testing. No other significant interaction effects were observed, thereby supporting the overall robustness of the pathomics signature as a prognostic factor.
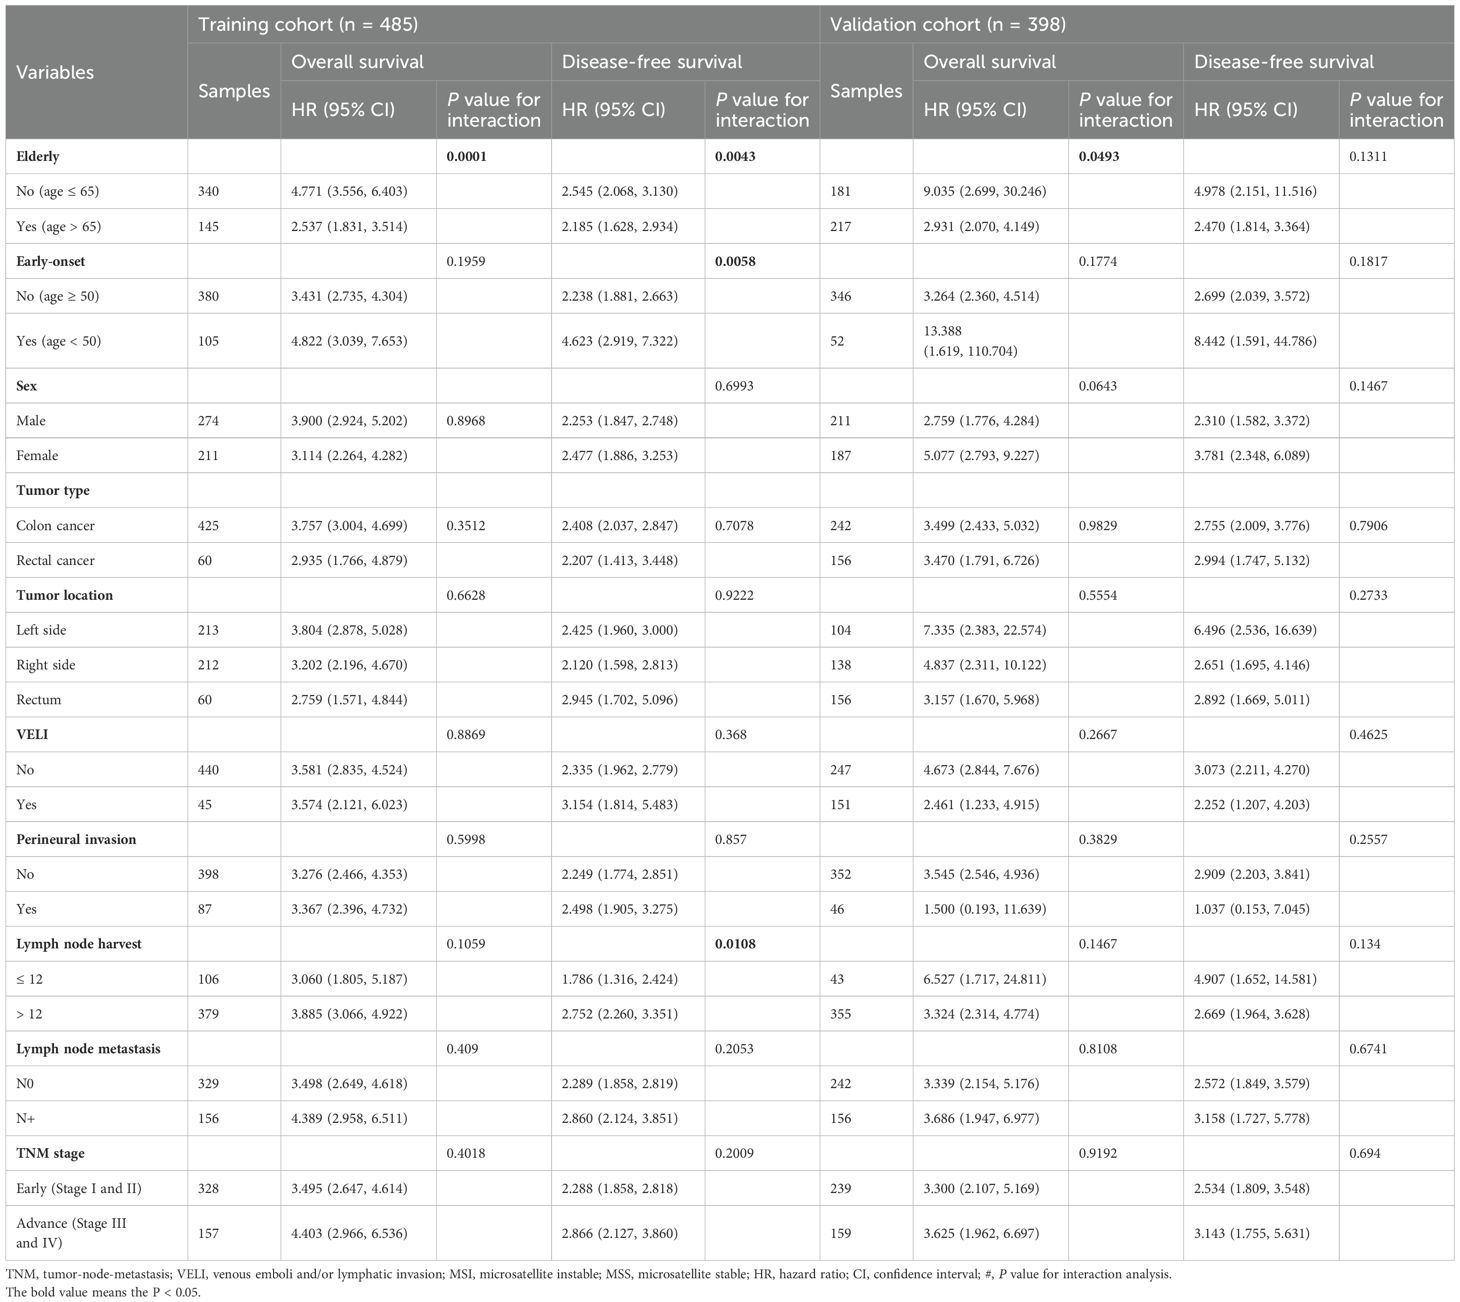
Table 3. Subgroup analysis for the pathomics signature among different clinical features in the training and validation cohorts.
Time-dependent receiver operating characteristic (ROC) curves demonstrated that the pathomics signature achieved favorable predictive performance for 3-, 5-, and 7-year OS and DFS in both the training and validation cohorts (Supplementary Figure S3). The corresponding calibration plots further confirmed a strong agreement between the predicted and observed survival probabilities across the same time intervals (Supplementary Figure S4).
Moreover, decision curve analysis (DCA) showed that incorporating the pathomics signature into prognostic assessment yielded greater net clinical benefit than either the “treat-all” or “treat-none” strategies in both cohorts (Supplementary Figure S5), supporting its potential for real-world clinical application.
3.4 Incremental value of the pathomics signature added to the TNM stage
The combined model, which were based on the combination of the pathomics signature and the TNM staging system, exhibited a significantly higher C-Index than the TNM stage, and these results could also be found in the validation cohort (Supplementary Table S5).
Furthermore, the AUROCs of the 3 models also confirmed the superior discrimination ability of the combined models for estimating DFS and OS in the training and validation cohorts (Supplementary Figure S6). Additionally, compared with the TNM stage models, the combined models were the most accurate models (Supplementary Figure S7) and showed greater net benefits across most of the range of reasonable threshold probabilities (Supplementary Figure S8).
Finally, the combined model showed a significant NRI and IDI for prognosis estimation compared with the TNM stage model (Supplementary Table S6), indicating that the pathomics signature could provide additional prognostic value to the TNM staging system for CRC.
3.5 Pathomics signature and benefits of adjuvant chemotherapy
To evaluate the predictive utility of the pathomics signature in the context of adjuvant chemotherapy, we analyzed its association with survival outcomes in stage II and III CRC patients stratified by postoperative adjuvant chemotherapy status. In both the training and validation cohorts, adjuvant chemotherapy significantly improved OS and DFS in these subgroups (Supplementary Figure S9). Furthermore, the pathomics signature demonstrated a significant correlation with OS and DFS, regardless of whether the patients received adjuvant therapy (Supplementary Figure S10).
Among the patients in the low-pathomics signature group, adjuvant chemotherapy was significantly associated with improved OS and DFS. In contrast, this survival benefit was not observed in the high-pathomics signature group (Figure 3). Further interaction analysis revealed a significant effect modification, indicating that individuals with low pathomics signature scores derived greater benefits from adjuvant chemotherapy than those with high scores (Supplementary Table S7).
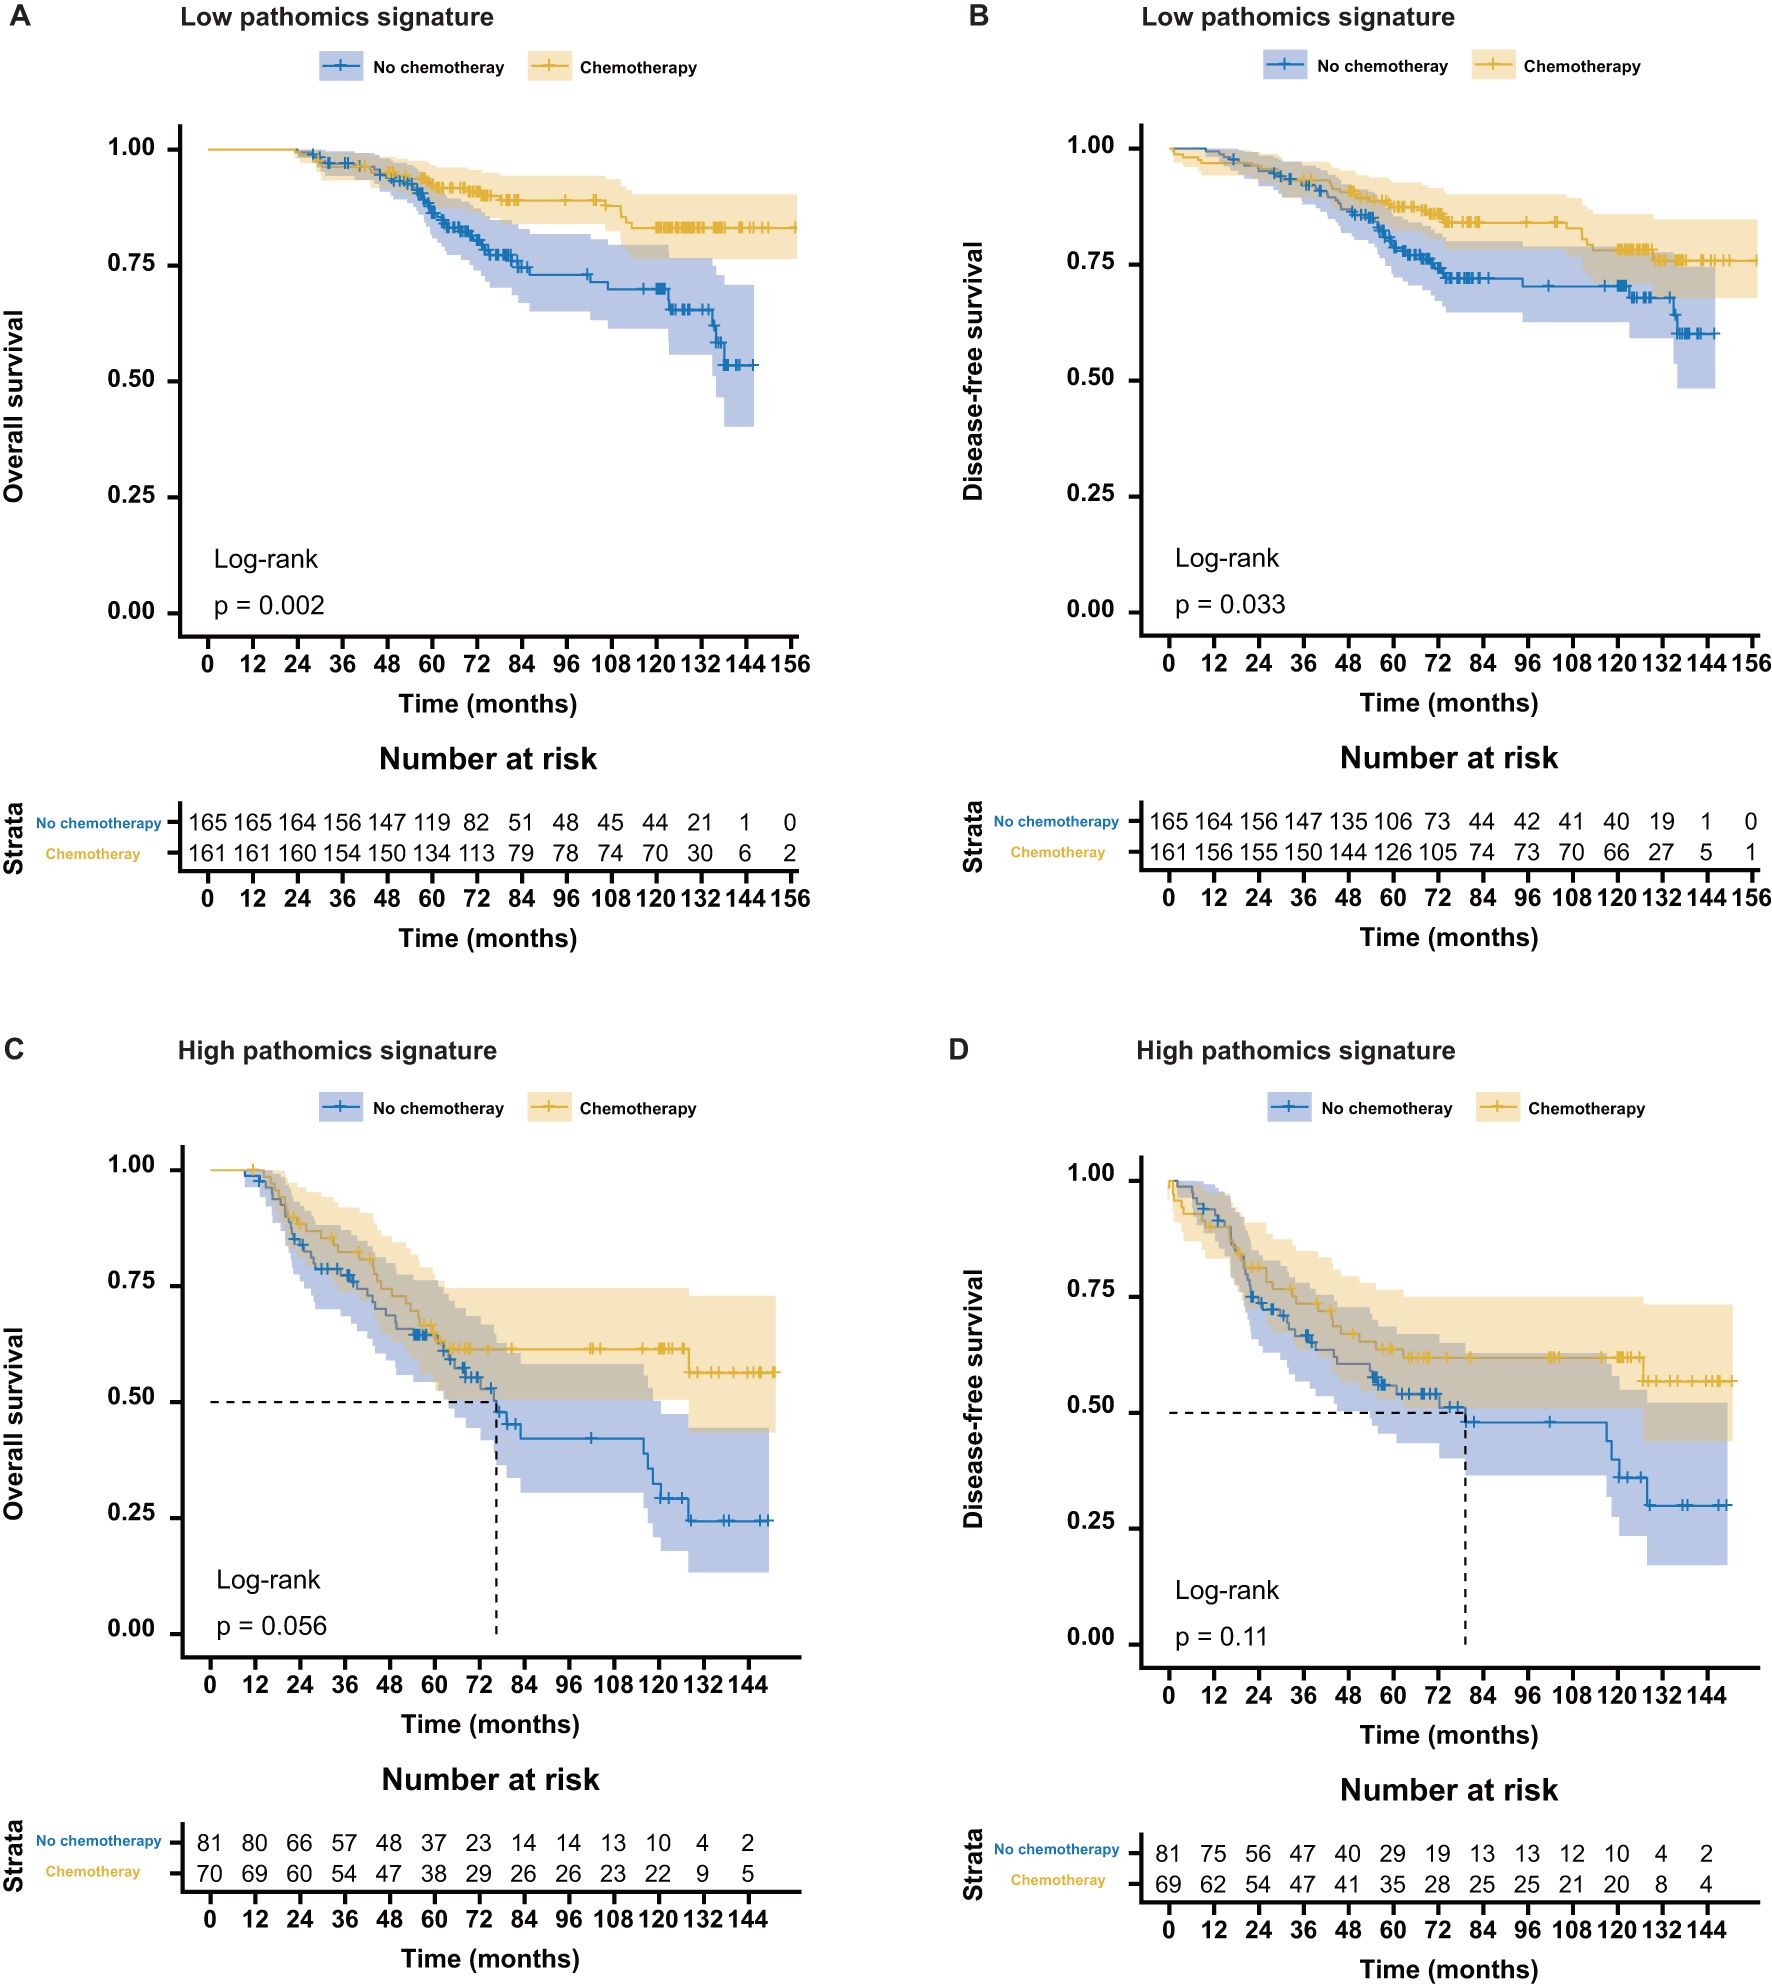
Figure 3. Association between the pathomics signature and survival benefits from adjuvant chemotherapy in stage II and stage III colorectal cancer. (A, B) Survival benefits from adjuvant chemotherapy for the low- PSCRC patients. (C, D) Survival benefits from adjuvant chemotherapy for the high-PSCRC patients. PSCRC, pathomics signature of colorectal cancer.
3.6 Interpretation of the pathomics signature
SHAP values were used to interpret the contribution of individual features to the model predictions. As illustrated in the SHAP summary plot (Figure 4A), HistogramBoWProb_0.15 emerged as the most influential feature, closely followed by HistogramBoWProb_0.66, HistogramBoWProb_0.72, and BoWProb_008. In contrast, BoWProb_068 contributed the least among the eight pathomics features.
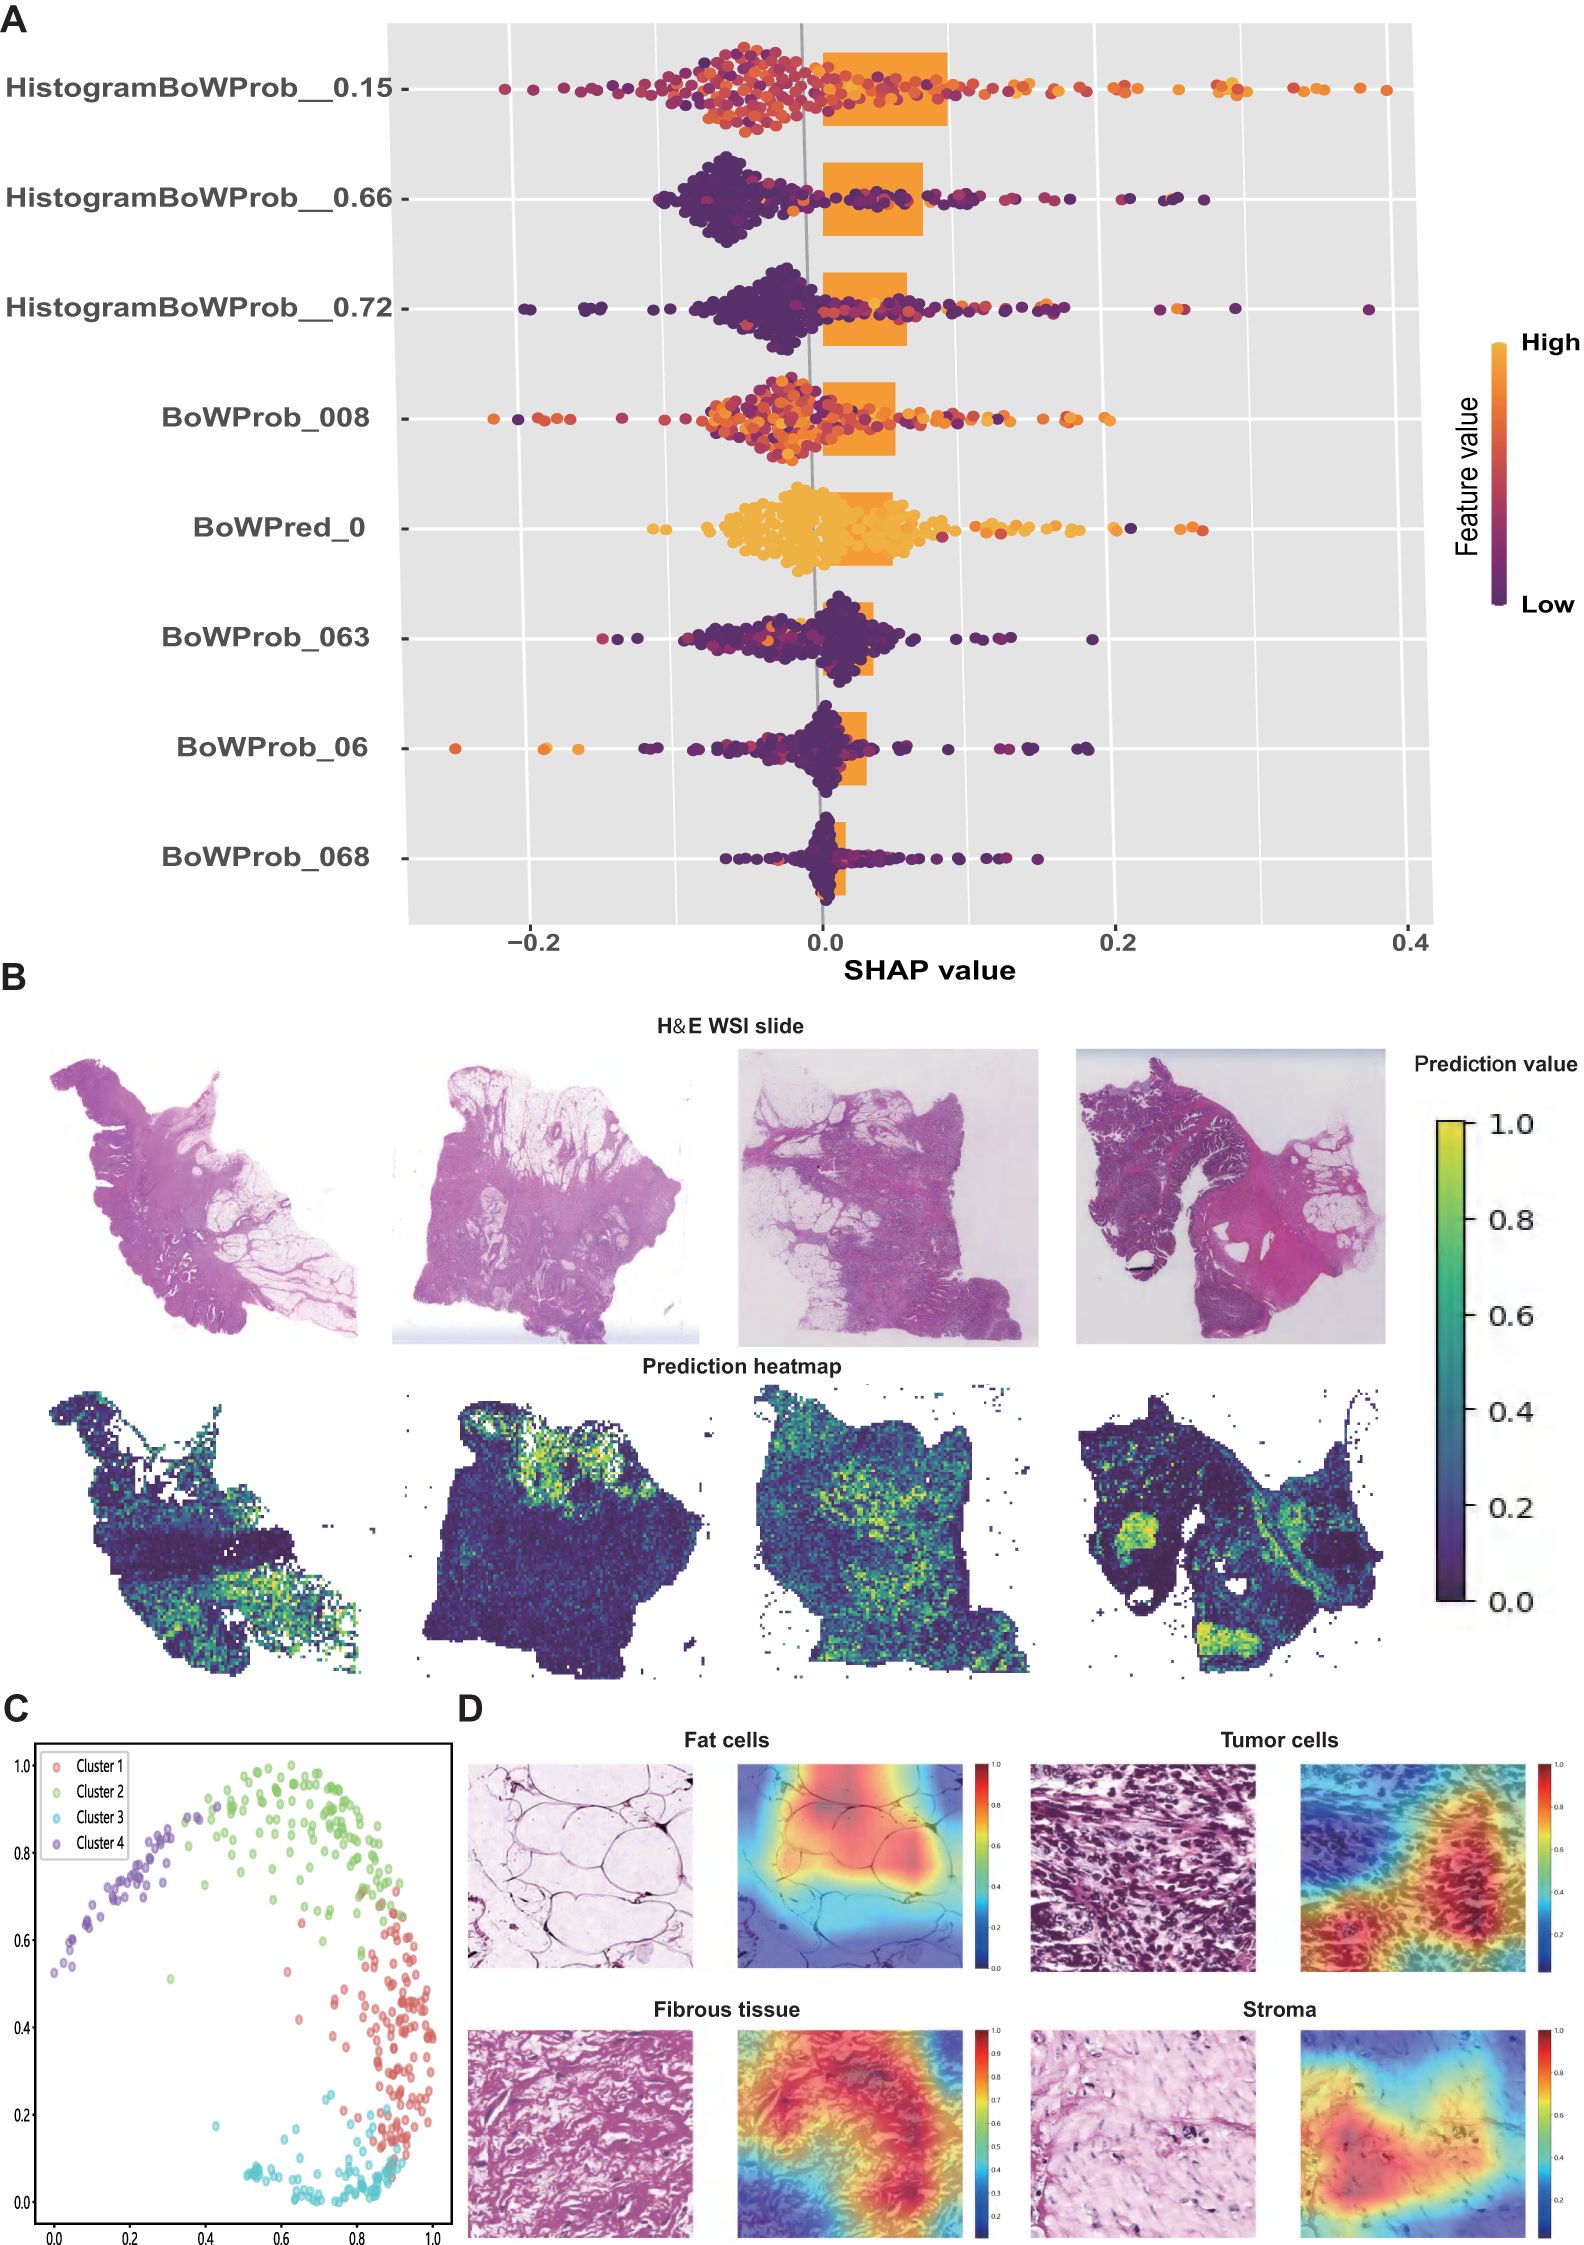
Figure 4. Interpretation of the pathomics signature. (A) SHAP values for the individual features of pathomics signature. (B) Representative H&E slide and their predicted heatmaps. (C) The four potential features extracted from heatmaps were separated by the random tree algorithm. (D) Visualisation of the heatmaps of high-risk features related to the pathomics signature.
To further interpret the spatial features linked to patient prognosis, prediction heatmaps were generated to highlight the key regions contributing to the model output (Figure 4B). High-risk cases are typically marked by dense tumor stroma, abundant tumor cells, and muscle tissue infiltration. In contrast, low-risk regions were predominantly characterized by normal mucosa, loose stroma, and inflammatory infiltration.
To further elucidate the model’s decision-making process, Grad-CAM was applied to extract informative visual cues. The top 500 most influential regions were selected to explore the dominant histopathological patterns associated with patient survival. By clustering the highest-ranked image patches, four distinct histological clusters were identified using a random tree algorithm (Figure 4C).
Subsequently, expert pathologists reviewed and annotated the representative regions identified using the model. Key histological components, including tumor cells, adipocytes, fibrous tissue, and stroma, were highlighted in red (Figure 4D). These features appeared to be closely associated with an elevated risk of recurrence and mortality, offering a morphological interpretation of the predictive elements underlying the pathomics signature.
3.7 Association between the pathomics signature and biological features
GSEA was initially conducted to investigate potential biological mechanisms associated with the pathomics signature (Figure 5A). CRC samples with low pathomics signature scores exhibited significant enrichment in pathways related to DNA repair, proliferation, metabolism, and immune functions. Conversely, samples with high pathomics signature scores showed the activation of canonical oncogenic signaling and invasion-related pathways.
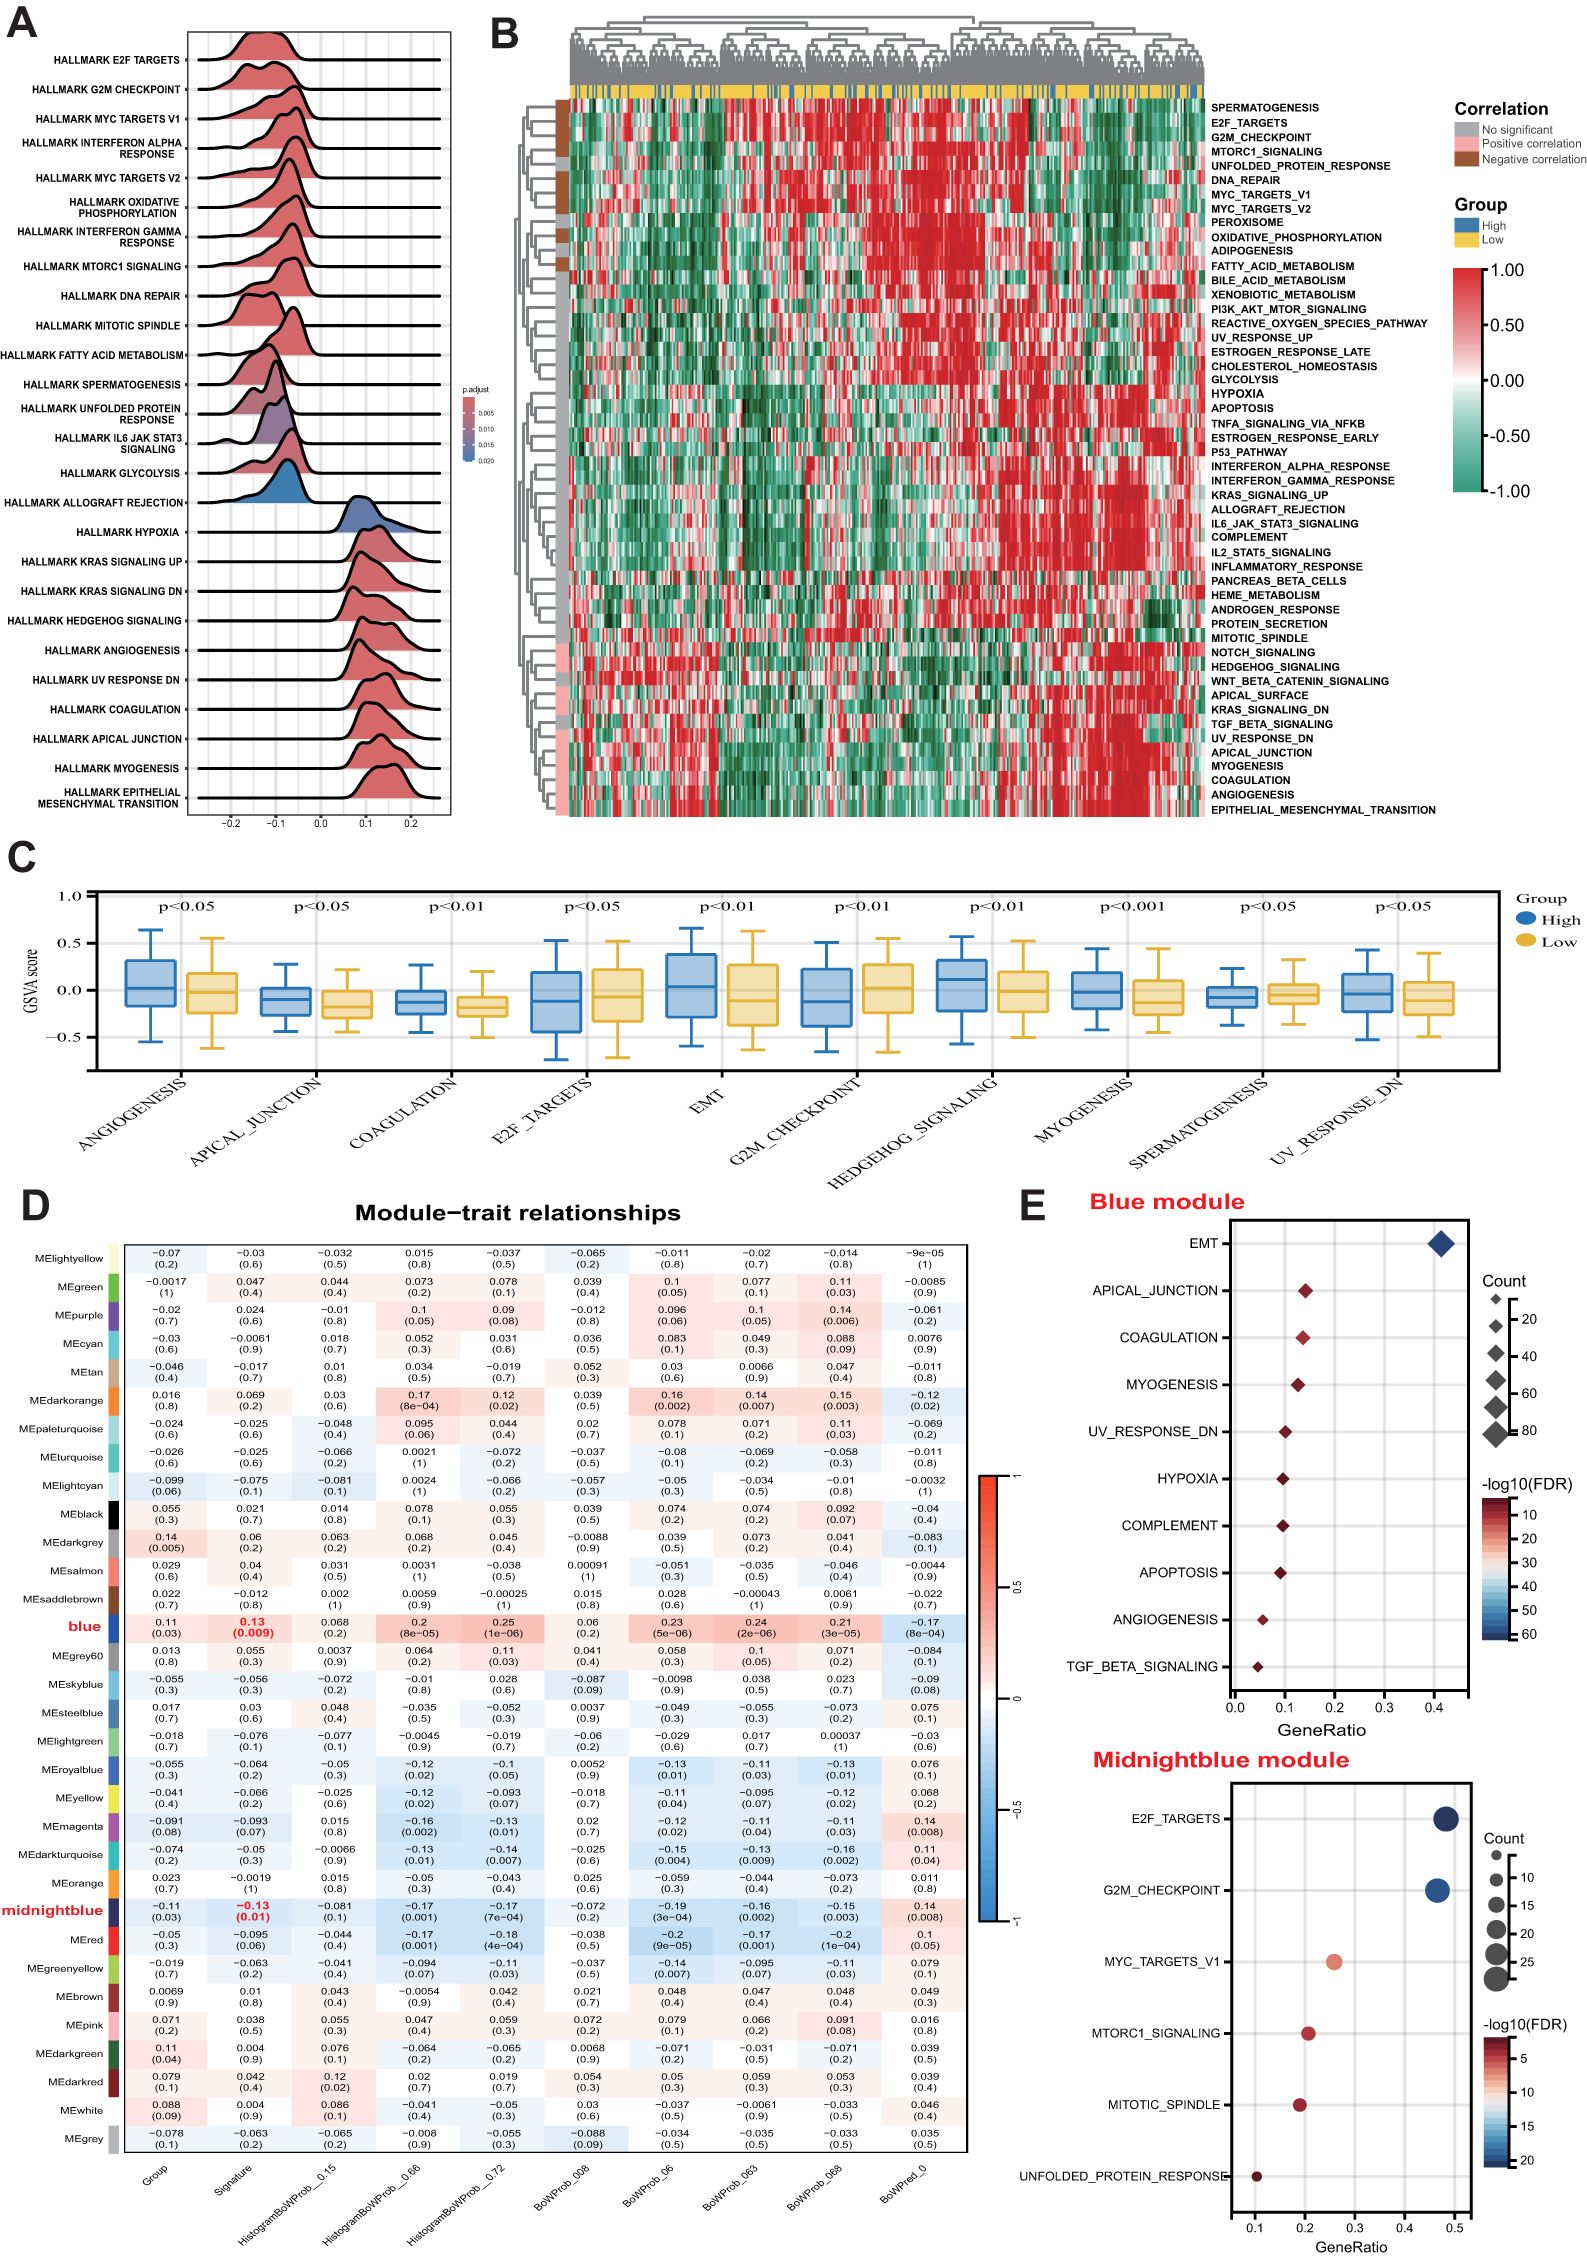
Figure 5. Biological features of the pathomics signature. (A) GSEA of the hallmark gene sets for the pathomics signature. (B) Heatmap shows GSVA enrichment scores of the hallmark gene sets. (C) The bar plot shows the different analysis outcomes for GSVA scores of hallmark gene sets between the high- and low-pathomics signature groups. (D) Module-trait relationships. Each row shows a module eigengene; each column corresponds to a clinical trait. Each cell contains the corresponding correlation (upper number) and p-value (lower number). (E) Functional enrichment analysis of the hallmark gene sets for genes in the blue and midnightblue modules. GSEA, gene set enrichment analysis; GSVA, gene set variation analysis.
GSVA further confirmed the significant functional differences between the high- and low-pathomics signature groups (Figures 5B, C). Angiogenesis, epithelial-mesenchymal transition (EMT), and other invasion-associated pathways were significantly upregulated in the high-pathomics signature group. In contrast, pathways such as spermatogenesis, E2F targets, and G2M checkpoint were more active in the low-pathomics signature group.
To identify gene co-expression patterns linked to the pathomics signature, WGCNA was performed using the top 5,000 most variable genes defined by the median absolute deviation (MAD). A cluster dendrogram was generated with an optimal soft threshold power of 14 (Supplementary Figure S11A), resulting in 32 distinct colored modules (Supplementary Figure S11B). Unassigned genes were grouped into the grey module and excluded from further analysis. Correlation analysis between module eigengenes and the pathomics signature identified two modules, blue and midnight blue, as significantly associated (|bicor| > 0.1 and P-value < 0.05) (Figure 5D). Within these modules, gene significance was strongly correlated with module membership (Supplementary Figure S11C), suggesting that these genes may play pivotal roles in shaping essential biological roles related to the pathomics signature.
Subsequent functional enrichment analysis of these modules revealed distinct biological profiles (Figure 5E). Genes in the midnight blue module were predominantly enriched in proliferation-related pathways, whereas genes in the blue module were associated with invasion, metastasis, and immune-related processes. These findings indicate that the pathomics signature accurately reflects the underlying biological features associated with the multiple crucial hallmarks of CRC.
3.8 Association between the pathomics signature and tumor microenvironment
The MCPcounter algorithm was applied to estimate the relative abundance of stromal and immune cell subsets in relation to the pathomics signature. Both fibroblasts and endothelial cells were positively correlated with the pathomics signature and were significantly enriched in the high-pathomics signature group (Figures 6A, B).
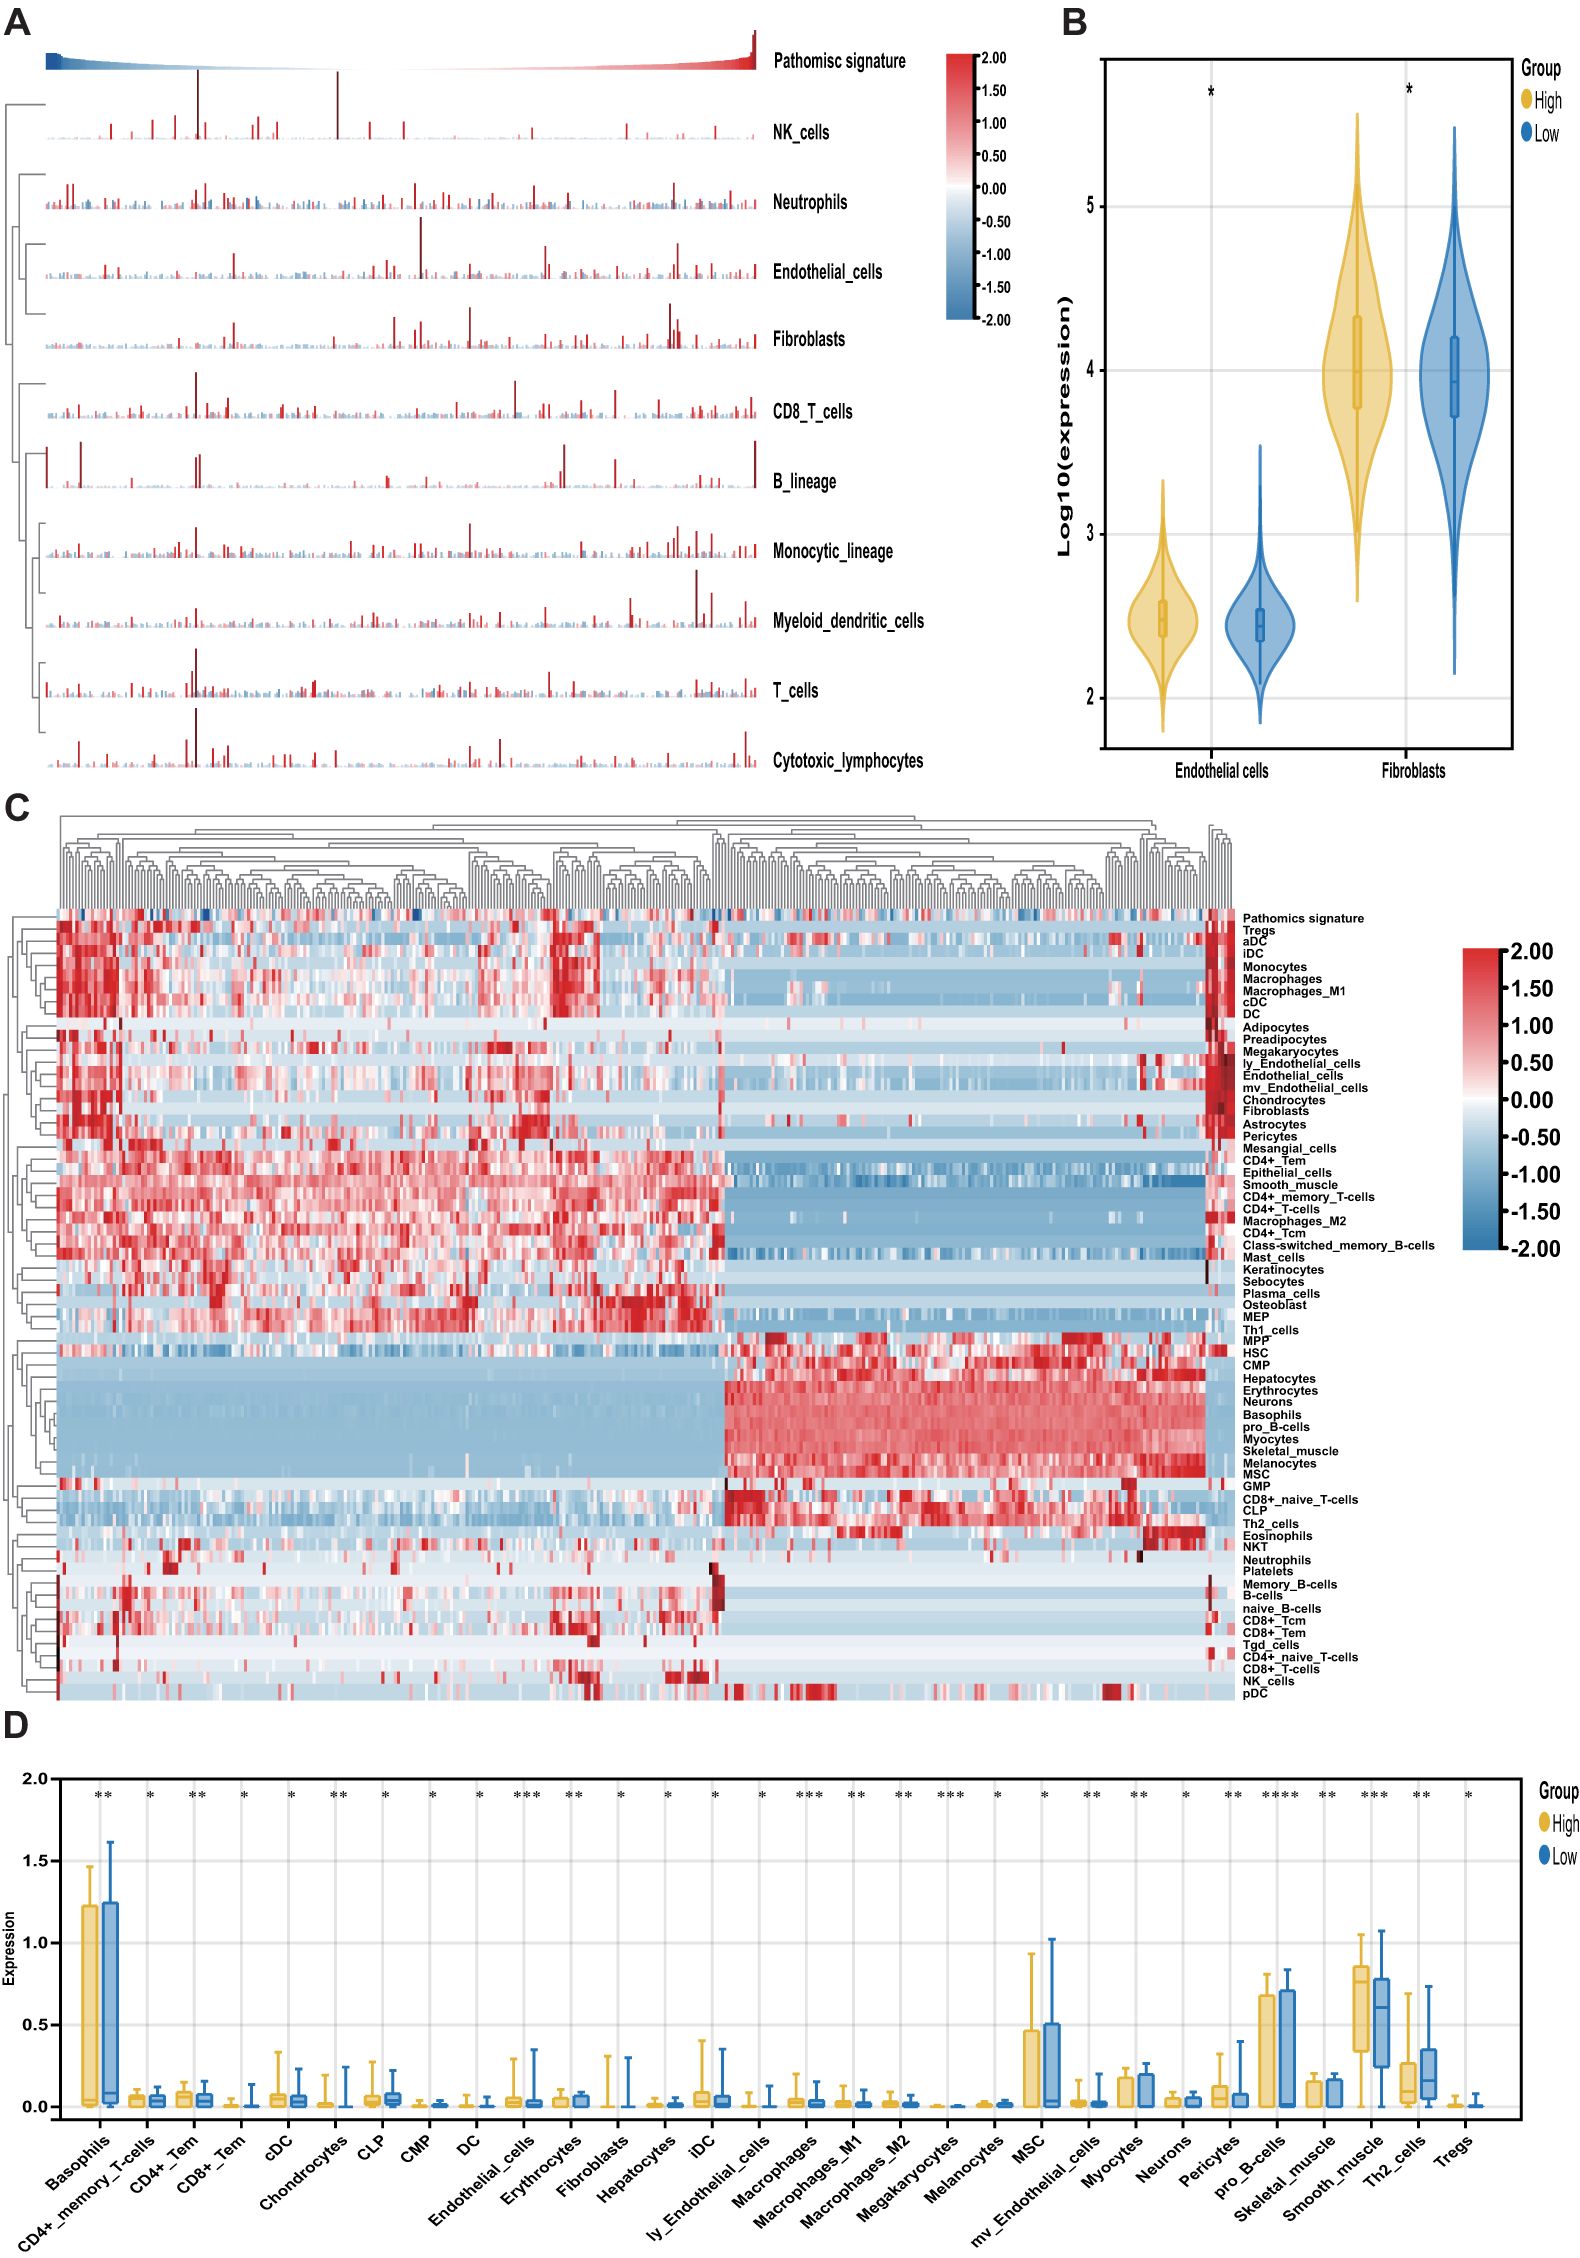
Figure 6. Association of the pathomics signature and tumor microenvironment. (A) Heatmap shows the infiltration level of stromal and immune cells derived from the MCPcounter algorithm in relation to the pathomics signature. (B) Different analyses for the MCPcounter-derived cells between the different subgroups. (C) Heatmap shows the infiltration level of stromal and immune cells derived from the xCell algorithm in relation to the pathomics signature. (D) Different analyses for the xCellr-derived cells between the different subgroups. P values were obtained by the Wilcoxon test. The asterisks represented the statistical P-value (*P < 0.05; **P < 0.01; ***P < 0.001; ****P < 0.0001).
To further characterize tumor microenvironment heterogeneity, the xCell algorithm was used (Figure 6C). Consistent with MCPcounter results, a positive correlation was observed between the pathomics signature and various endothelial and stromal cell types. Moreover, a higher proportion of lymphoid and myeloid cells was detected in samples with elevated pathomics scores. In contrast, several stem, stromal, and lymphoid cells exhibited negative associations with the pathomics signature, underscoring their relevance in reflecting CRC tumor microenvironment (Figure 6D).
Finally, we explored the prognostic relevance of these pathomics signature-related cells in CRC (Supplementary Table S8). Survival analysis showed that cell types positively correlated with the pathomics signature were linked to poorer outcomes, whereas those negatively correlated were associated with favorable prognosis. These findings suggest that the pathomics signature captures distinct non-tumor cellular components that contribute to differential clinical trajectories in CRC.
4 Discussion
Accurate prognostic assessment and identification of adjuvant chemotherapy benefits remain essential for the effective risk stratification and clinical management of CRC. In this study, we developed a pathomics signature comprising eight features derived from digital H&E-stained slides using LASSO-Cox regression modeling. The signature consistently demonstrated strong prognostic value across different follow-up periods and was applicable to both colon and rectal cancer cases. Notably, incorporating the pathomics signature into conventional TNM staging systems significantly improved predictive performance compared to the use of the TNM staging system alone, underscoring its potential as a complementary tool for CRC prognosis.
Adjuvant chemotherapy remains the standard treatment for patients with advanced CRC (7). However, the considerable variability in clinical outcomes among individuals with identical TNM staging and treatment regimens indicates that a significant proportion of patients do not derive meaningful benefits from adjuvant chemotherapy (3). Our findings revealed that patients with low pathomics signature scores were more likely to benefit from adjuvant chemotherapy, whereas those with high scores exhibited limited therapeutic gain. These results suggest that the pathomics signature may serve as a valuable stratification tool to guide personalized treatment decisions and optimize therapeutic efficacy.
Consistent with our results, previous studies have shown that AI-derived pathomics signatures can function as novel prognostic biomarkers for CRC. Some of these approaches rely on handcrafted features extracted from pathologist-annotated regions of interest (ROIs) within WSIs using specialized tools to compute predefined descriptors (20, 37). However, such methods are often time-consuming, prone to subjectivity, and difficult to reproduce (38). Meanwhile, these predefined image features have a limited ability to represent image information.
Recently, an increasing number of studies have employed deep neural network-based approaches to directly predict survival outcomes from histopathological images (39–44). Although deep learning has demonstrated excellent performance in medical image analysis, its “black-box” nature has raised high concerns, which may limit acceptability by clinicians and researchers, and may not be appropriate for high-level decision-making, such as those related to oncological prognosis or predicting treatment benefits (10).
Unlike traditional “black-box” deep learning models, our approach integrates the predictive power of deep learning with the interpretability of the LASSO method, enabling a more physically interpretable model construction that facilitates assessing the significance of each input variable through SHAP values. Additionally, we employed the Grad-CAM technique to visualize the regions that contributed most to our model, aiding in identifying critical morphological features for survival status. Our findings suggest that for patients with poor prognosis, the model is more attentive to the adipose tissue surrounding the tumor, which is in line with previous research (40, 42).
We further explored the transcriptomic associations to uncover the molecular underpinnings of our model. Significant differences in stromal and immune cell infiltration were observed between the high- and low-pathomics signature groups. The high-pathomics signature group demonstrated significantly elevated stromal infiltration, particularly involving endothelial cells and fibroblasts. Such stromal enrichment has been implicated in promoting tumor progression and resistance to therapy, leading to poor prognosis (45). Moreover, this enhanced stroma infiltration suggests that patients in the high-pathomics signature group might exhibit an immune-excluded or immune-desert phenotype and display reduced responsiveness to immunotherapy (46).
Meanwhile, GSEA analyses revealed that differentially expressed genes between two groups were enriched in pathways related to proliferation, metabolism, immune dysregulation, and EMT. This finding suggests that tumors in the high-risk group displayed enhanced invasiveness and metastatic potential. Furthermore, the enrichment results suggest that the cell cycle might play a pivotal role in CRC prognosis, as evidenced by the enriched gene sets associated with E2F targets, MYC targets, and G2M checkpoints. These results highlight the potential of targeting the cell cycle as a therapeutic strategy for the treatment of CRC.
In addition to the advantages in interpretability, in feature mining, the conventional strategy was sampling based on tumor area (20, 39, 42), which may result in the loss of other critical prognostic features present in the tumor microenvironment. Moreover, random single-patch sampling from the entire WSI fails to retain important spatial relationships between patches (47). However, utilizing our MIL deep learning model with a dataset consisting of 7.7 million patches extracted from WSIs of 883 patients, we are able to automatically adjust the contribution of each patch to the overall WSI-level prediction in a learnable manner by assigning higher weights to key patches. This approach not only preserves histological features of tumors and peri-tumoral tissues but also retains spatial information among patches, resulting in improved predictive performance compared to conventional methods.
Despite these promising results, several limitations of this study should be acknowledged. First, its retrospective design introduced potential biases and unmeasured confounders. However, it is unlikely that unmeasured confounding alone could completely explain our findings due to the substantial E-values observed in the main results. We employed rigorous statistical analysis methods to ensure the reliability and interpretability of our findings, offering a foundation for the evolution of algorithmic devices, and facilitating the execution of prospective cohort studies and phase 2 and 3 randomized controlled trials (RCTs). Second, the bioinformatic analyses conducted were based on post hoc correlations and do not constitute mechanistic evidence. Thirdly, considering the computational costs, in this study, we adopted a relatively concise model architecture. We utilized only ResNet-18 for patch-level feature extraction and employed the PALHI and BoW methods for WSI-level aggregation. Nonetheless, we still achieved promising results. In recent years, numerous groundbreaking technologies have emerged in the field of pathological image analysis. Recent advances in pathology foundation models and attention-based MIL methods have shown improved performance in feature aggregation. These technologies effectively address the challenges posed by the high-resolution and multi-scale characteristics of pathological images through contrastive learning, graph network optimization, and feature space reshaping, providing new tools for precision medicine. We believe that these complex and advanced network architectures would further optimize the model’s performance. Finally, although the pathomics signature was developed and externally validated using multicenter data from patients across different countries and hospitals, further validation is required to ensure its robustness across diverse populations, sample preparation protocols, and image acquisition platforms encountered in global clinical practice.
Unlike molecular biomarkers, which often require additional testing and incur extra costs, the pathomics signature offers a cost-effective alternative as it is derived from routinely available H&E-stained slides. This approach enables seamless integration into clinical workflows without imposing financial burden. Importantly, the pathomics signature can support more informed decision-making by refining the risk–benefit evaluation of adjuvant chemotherapy, aiding both clinicians and patients in treatment planning.
Based on our findings, for patients with a high pathomics signature, characterized by an unfavorable prognosis and limited benefit from adjuvant chemotherapy, it is crucial to explore alternative treatment strategies such as targeted therapy, immunotherapy, and participation in new clinical trials. Furthermore, rigorous postoperative surveillance is indispensable for promptly identifying any indications of recurrence or metastasis, enabling the timely initiation of appropriate therapeutic interventions.
For patients with a low pathomics signature, it is advisable to consider omitting adjuvant treatment to avoid unnecessary exposure to potentially toxic effects. By sparing these patients from the morbidities and costs associated with adjuvant chemotherapy, it would greatly enhance the current management of CRC. However, further validation in prospective, international, and multicenter randomized trials is warranted to test the clinical utility of the pathomics signature for individualized decision-making. Moreover, current research has confirmed that biomarkers for neoadjuvant chemotherapy can be constructed using deep learning and preoperative biopsy tissue. Given the growing importance of neoadjuvant chemotherapy for individuals with locally advanced CRC, future clinical trials should focus more on this area to investigate the potential clinical value of computational pathology in the management of CRC.
5 Conclusion
Our study developed and validated a pathomics signature using MIL deep learning analysis of H&E-stained WSIs to directly predict prognosis for CRC patients. The integration of pathomics signatures can enhance the prognostic value of the TNM staging system and identify patients who may benefit from adjuvant chemotherapy, thereby supporting more informed clinical decision-making. Nevertheless, further verification through prospective studies involving multicenter large patient cohorts is still needed.
Data availability statement
The raw data supporting the conclusions of this article will be made available by the authors, without undue reservation.
Ethics statement
The studies involving humans were approved by the ethics committee at Harbin Medical University Cancer Hospital (ID: KY2024-16). The studies were conducted in accordance with the local legislation and institutional requirements. Written informed consent for participation was not required from the participants or the participants’ legal guardians/next of kin in accordance with the national legislation and institutional requirements due to the retrospective nature of the study.
Author contributions
SL: Writing – original draft, Writing – review & editing, Data curation, Formal analysis, Investigation, Methodology, Software, Supervision, Validation, Visualization. YMH: Writing – review & editing, Data curation, Formal analysis, Investigation, Software, Validation, Visualization, Writing – original draft. FD: Writing – review & editing, Data curation, Formal analysis, Supervision, Validation, Visualization, Writing – original draft. JX: Writing – review & editing, Data curation, Formal analysis. GM: Writing – review & editing, Data curation, Formal analysis. HL: Writing – review & editing, Data curation, Formal analysis. ZY: Writing – review & editing, Data curation, Formal analysis. YL: Writing – review & editing, Data curation, Formal analysis. HW: Writing – review & editing, Data curation. YZH: Writing – review & editing, Data curation. HX: Writing – review & editing, Data curation. WS: Writing – review & editing, Data curation. XZ: Writing – review & editing, Formal analysis, Software. HYL: Writing – review & editing, Software, Validation, Visualization. CL: Writing – review & editing, Methodology, Software. PH: Writing – review & editing, Conceptualization, Funding acquisition, Methodology, Project administration, Resources, Supervision.
Funding
The author(s) declare that financial support was received for the research and/or publication of this article. This study was supported by Heilongjiang Provincial Higher Education Institutions Collaborative Innovation Cultivation Project (LJGXCG2023-087), Harbin Medical University Cancer Hospital Ascend Leading Disciplines Plan (PDYS-2024-14), Heilongjiang Provincial Natural Science Foundation of China (LH2023H096), the Postdoctoral Research Project in Heilongjiang Province (LBH-Z22210), the China Postdoctoral Science Foundation (2023MD744213), and the Scientific research project of Heilongjiang Provincial Health Commission (20230404080339).
Conflict of interest
The authors declare that the research was conducted in the absence of any commercial or financial relationships that could be construed as a potential conflict of interest.
Generative AI statement
The author(s) declare that no Generative AI was used in the creation of this manuscript.
Publisher’s note
All claims expressed in this article are solely those of the authors and do not necessarily represent those of their affiliated organizations, or those of the publisher, the editors and the reviewers. Any product that may be evaluated in this article, or claim that may be made by its manufacturer, is not guaranteed or endorsed by the publisher.
Supplementary material
The Supplementary Material for this article can be found online at: https://www.frontiersin.org/articles/10.3389/fimmu.2025.1602909/full#supplementary-material
References
1. Bray F, Ferlay J, Soerjomataram I, Siegel RL, Torre LA, and Jemal A. Global cancer statistics 2018: GLOBOCAN estimates of incidence and mortality worldwide for 36 cancers in 185 countries. CA Cancer J Clin. (2018) 68:394–424.
2. Amin MB, Greene FL, Edge SB, Compton CC, Gershenwald JE, Brookland RK, et al. The Eighth Edition AJCC Cancer Staging Manual: Continuing to build a bridge from a population-based to a more “personalized” approach to cancer staging. CA Cancer J Clin. (2017) 67:93–9.
3. O’Connell JB, Maggard MA, and Ko CY. Colon cancer survival rates with the new American Joint Committee on Cancer sixth edition staging. J Natl Cancer Inst. (2004) 96:1420–5.
4. Parent P, Cohen R, Rassy E, Svrcek M, Taieb J, André T, et al. A comprehensive overview of promising biomarkers in stage II colorectal cancer. Cancer Treat Rev. (2020) 88:102059.
5. Mouradov D, Domingo E, Gibbs P, Jorissen RN, Li S, Soo PY, et al. Survival in stage II/III colorectal cancer is independently predicted by chromosomal and microsatellite instability, but not by specific driver mutations. Am J Gastroenterol. (2013) 108:1785–93.
6. Gray RG, Quirke P, Handley K, Lopatin M, Magill L, Baehner FL, et al. Validation study of a quantitative multigene reverse transcriptase-polymerase chain reaction assay for assessment of recurrence risk in patients with stage II colon cancer. J Clin Oncol. (2011) 29:4611–9.
7. Yang L, Yang J, Kleppe A, Danielsen HE, and Kerr DJ. Personalizing adjuvant therapy for patients with colorectal cancer. Nat Rev Clin Oncol. (2024) 21:67–79.
8. van der Laak J, Litjens G, and Ciompi F. Deep learning in histopathology: the path to the clinic. Nat Med. (2021) 27:775–84.
9. Bera K, Schalper KA, Rimm DL, Velcheti V, and Madabhushi A. Artificial intelligence in digital pathology - new tools for diagnosis and precision oncology. Nat Rev Clin Oncol. (2019) 16:703–15.
10. Rudin C. Stop explaining black box machine learning models for high stakes decisions and use interpretable models instead. Nat Mach Intell. (2019) 1:206–15.
11. Yang JH, Wright SN, Hamblin M, McCloskey D, Alcantar MA, Schrübbers L, et al. A white-box machine learning approach for revealing antibiotic mechanisms of action. Cell. (2019) 177:1649–61.e9.
12. Mummadi SR, Al-Zubaidi A, and Hahn PY. Overfitting and use of mismatched cohorts in deep learning models: preventable design limitations. Am J Respir Crit Care Med. (2018) 198:544–5.
13. Madabhushi A and Lee G. Image analysis and machine learning in digital pathology: Challenges and opportunities. Med Image Anal. (2016) 33:170–5.
14. Tavolara TE, Su Z, Gurcan MN, and Niazi MKK. One label is all you need: Interpretable AI-enhanced histopathology for oncology. Semin Cancer Biol. (2023) 97:70–85.
15. Altman DG, McShane LM, Sauerbrei W, and Taube SE. Reporting Recommendations for Tumor Marker Prognostic Studies (REMARK): explanation and elaboration. PloS Med. (2012) 9:e1001216.
16. Joung RH and Merkow RP. Is it time to abandon 30-day mortality as a quality measure? Ann Surg Oncol. (2021) 28:1263–4.
17. Resio BJ, Gonsalves L, Canavan M, Mueller L, Phillips C, Sathe T, et al. Where the other half dies: analysis of mortalities occurring more than 30 days after complex cancer surgery. Ann Surg Oncol. (2021) 28:1278–86.
18. Gaddam VK, Boddapati R, Kumar T, Kulkarni AV, and Bjornsson H. Application of “OTSU”-an image segmentation method for differentiation of snow and ice regions of glaciers and assessment of mass budget in Chandra basin, Western Himalaya using Remote Sensing and GIS techniques. Environ Monit Assess. (2022) 194:337.
19. Verma J, Sandhu A, Popli R, Kumar R, Khullar V, Kansal I, et al. From slides to insights: Harnessing deep learning for prognostic survival prediction in human colorectal cancer histology. Open Life Sci. (2023) 18:20220777.
20. Jiang W, Wang H, Dong X, Yu X, Zhao Y, Chen D, et al. Pathomics signature for prognosis and chemotherapy benefits in stage III colon cancer. JAMA Surg. (2024) 159:519–28.
21. Chen D, Fu M, Chi L, Lin L, Cheng J, Xue W, et al. Prognostic and predictive value of a pathomics signature in gastric cancer. Nat Commun. (2022) 13:6903.
22. Kim DH, Uno H, and Wei LJ. Restricted mean survival time as a measure to interpret clinical trial results. JAMA Cardiol. (2017) 2:1179–80.
23. VanderWeele TJ and Ding P. Sensitivity analysis in observational research: introducing the E-value. Ann Intern Med. (2017) 167:268–74.
24. Vickers AJ and Elkin EB. Decision curve analysis: a novel method for evaluating prediction models. Med Decis Making. (2006) 26:565–74.
25. Pencina MJ, D’Agostino RB, and Demler OV. Novel metrics for evaluating improvement in discrimination: net reclassification and integrated discrimination improvement for normal variables and nested models. Stat Med. (2012) 31:101–13.
26. Lundberg SM, Erion G, Chen H, DeGrave A, Prutkin JM, Nair B, et al. From local explanations to global understanding with explainable AI for trees. Nat Mach Intell. (2020) 2:56–67.
27. Dovletov G, Pham DD, Lorcks S, Pauli J, Gratz M, and Quick HH. Grad-CAM guided U-net for MRI-based pseudo-CT synthesis. Annu Int Conf IEEE Eng Med Biol Soc. (2022) 2022:2071–5.
28. Colaprico A, Silva TC, Olsen C, Garofano L, Cava C, Garolini D, et al. TCGAbiolinks: an R/Bioconductor package for integrative analysis of TCGA data. Nucleic Acids Res. (2016) 44:e71.
29. Subramanian A, Tamayo P, Mootha VK, Mukherjee S, Ebert BL, Gillette MA, et al. Gene set enrichment analysis: a knowledge-based approach for interpreting genome-wide expression profiles. Proc Natl Acad Sci U S A. (2005) 102:15545–50.
30. Hänzelmann S, Castelo R, and Guinney J. GSVA: gene set variation analysis for microarray and RNA-seq data. BMC Bioinf. (2013) 14:7.
31. Liberzon A, Birger C, Thorvaldsdóttir H, Ghandi M, Mesirov JP, and Tamayo P. The Molecular Signatures Database (MSigDB) hallmark gene set collection. Cell Syst. (2015) 1:417–25.
32. Langfelder P and Horvath S. WGCNA: an R package for weighted correlation network analysis. BMC Bioinf. (2008) 9:559.
33. Yu G, Wang LG, Han Y, and He QY. clusterProfiler: an R package for comparing biological themes among gene clusters. Omics. (2012) 16:284–7.
34. Becht E, Giraldo NA, Lacroix L, Buttard B, Elarouci N, Petitprez F, et al. Estimating the population abundance of tissue-infiltrating immune and stromal cell populations using gene expression. Genome Biol. (2016) 17:218.
35. Sturm G, Finotello F, Petitprez F, Zhang JD, Baumbach J, Fridman WH, et al. Comprehensive evaluation of transcriptome-based cell-type quantification methods for immuno-oncology. Bioinformatics. (2019) 35:i436–i45.
36. Aran D, Hu Z, and Butte AJ. xCell: digitally portraying the tissue cellular heterogeneity landscape. Genome Biol. (2017) 18:220.
37. Xiao X, Wang Z, Kong Y, and Lu H. Deep learning-based morphological feature analysis and the prognostic association study in colon adenocarcinoma histopathological images. Front Oncol. (2023) 13:1081529.
38. Barisoni L, Lafata KJ, Hewitt SM, Madabhushi A, and Balis UGJ. Digital pathology and computational image analysis in nephropathology. Nat Rev Nephrol. (2020) 16:669–85.
39. Skrede OJ, De Raedt S, Kleppe A, Hveem TS, Liestøl K, Maddison J, et al. Deep learning for prediction of colorectal cancer outcome: a discovery and validation study. Lancet. (2020) 395:350–60.
40. Jiang X, Hoffmeister M, Brenner H, Muti HS, Yuan T, Foersch S, et al. End-to-end prognostication in colorectal cancer by deep learning: a retrospective, multicentre study. Lancet Digit Health. (2024) 6:e33–43.
41. Tsai PC, Lee TH, Kuo KC, Su FY, Lee TM, Marostica E, et al. Histopathology images predict multi-omics aberrations and prognoses in colorectal cancer patients. Nat Commun. (2023) 14:2102.
42. Wulczyn E, Steiner DF, Moran M, Plass M, Reihs R, Tan F, et al. Interpretable survival prediction for colorectal cancer using deep learning. NPJ Digit Med. (2021) 4:71.
43. Kather JN, Krisam J, Charoentong P, Luedde T, Herpel E, Weis CA, et al. Predicting survival from colorectal cancer histology slides using deep learning: A retrospective multicenter study. PloS Med. (2019) 16:e1002730.
44. Höhn J, Krieghoff-Henning E, Wies C, Kiehl L, Hetz MJ, Bucher TC, et al. Colorectal cancer risk stratification on histological slides based on survival curves predicted by deep learning. NPJ Precis Oncol. (2023) 7:98.
45. Junttila MR and de Sauvage FJ. Influence of tumour micro-environment heterogeneity on therapeutic response. Nature. (2013) 501:346–54.
46. Fridman WH, Pagès F, Sautès-Fridman C, and Galon J. The immune contexture in human tumours: impact on clinical outcome. Nat Rev Cancer. (2012) 12:298–306.
Keywords: colorectal cancer, deep learning, whole slide image, pathology, prognosis
Citation: Lou S, Huang Y, Du F, Xue J, Mo G, Li H, Yu Z, Li Y, Wang H, Huang Y, Xie H, Song W, Zhang X, Li H, Lou C and Han P (2025) Development and validation of a deep learning-based pathomics signature for prognosis and chemotherapy benefits in colorectal cancer: a retrospective multicenter cohort study. Front. Immunol. 16:1602909. doi: 10.3389/fimmu.2025.1602909
Received: 30 March 2025; Accepted: 29 May 2025;
Published: 08 July 2025.
Edited by:
Zhaoxu Zheng, Chinese Academy of Medical Sciences and Peking Union Medical College, ChinaCopyright © 2025 Lou, Huang, Du, Xue, Mo, Li, Yu, Li, Wang, Huang, Xie, Song, Zhang, Li, Lou and Han. This is an open-access article distributed under the terms of the Creative Commons Attribution License (CC BY). The use, distribution or reproduction in other forums is permitted, provided the original author(s) and the copyright owner(s) are credited and that the original publication in this journal is cited, in accordance with accepted academic practice. No use, distribution or reproduction is permitted which does not comply with these terms.
*Correspondence: Peng Han, bGVvc3BpdkBocmJtdS5lZHUuY24=; Chun Lou, MTg2NDUxMTY4NzJAMTYzLmNvbQ==; Huiying Li, bGlodWl5aW5nMDYwNkAxNjMuY29t
†These authors have contributed equally to this work and share first authorship