 Shu Zheng
 Chang Shu
- Department of Obstetrics, Obstetrics and Gynaecology Center, The First Hospital of Jilin University, Jilin University, Changchun, China
Preeclampsia (PE) is a pregnancy-specific disorder marked by systemic immune imbalance and placental dysfunction, yet the link between peripheral molecular changes and tissue-level immune alterations remains incompletely understood. In this study, we integrated bulk transcriptomic analysis of peripheral blood from pregnant women at high risk for PE with single-cell RNA sequencing (scRNA-seq) of placental tissues to identify key immune-associated genes and explore their functional relevance. Transcriptome-wide differential expression, immune cell deconvolution, co-expression network analysis, and machine learning–based feature selection led to the identification of five candidate genes. Among them, TCL1A, CLEC2B, and LGALS9 exhibited robust expression in both datasets and were subjected to transcriptional and post-transcriptional regulatory network analysis. Single-cell profiling revealed that these genes were distinctly expressed in B cells, natural killer (NK) cells, monocytes, and Hofbauer cells, with functional enrichment in immune activation, cytokine signaling, and immune tolerance pathways. These findings illuminate the molecular mechanisms underlying immune dysregulation in PE and highlight TCL1A, CLEC2B, and LGALS9 as promising biomarkers for early detection and mechanistic investigation of the disease.
1 Introduction
Preeclampsia (PE) is a pregnancy-specific hypertensive disorder characterized by new-onset hypertension and proteinuria after 20 weeks of gestation, contributing substantially to maternal and perinatal morbidity and mortality worldwide (1, 2). Affecting approximately 2–8% of pregnancies, PE accounts for significant numbers of maternal and fetal deaths annually (3). Although recognized risk factors include nulliparity, multiple gestation, prior history of PE, chronic hypertension, diabetes, renal disease, obesity, advanced maternal age, and autoimmune conditions, the disorder may also occur in women without identifiable risk factors, and its pathogenesis remains incompletely understood (4).
Recent research has increasingly highlighted immune dysregulation as a central feature in the pathogenesis of PE (5). In particular, aberrant immune activation and maternal–fetal immune interactions appear to play a pivotal role in the disorder’s development (6). While the placenta has long been recognized as the central organ involved in PE, the immune mechanisms that drive placental dysfunction are only beginning to be understood. Extravillous trophoblasts fail to adequately remodel uterine spiral arteries, leading to placental hypoperfusion and ischemia, which in turn triggers the release of anti-angiogenic factors, such as soluble Flt-1, and pro-inflammatory cytokines into the maternal circulation (7, 8). These circulating mediators induce systemic endothelial dysfunction, vasoconstriction, and a prothrombotic state, resulting in the clinical manifestations of PE, including hypertension, proteinuria, and multi-organ dysfunction (9).
The widely accepted “two-stage” model posits that placental dysfunction precedes and precipitates the maternal syndrome, the molecular and cellular mechanisms linking these stages are not fully elucidated (10). Despite extensive research, the precise molecular and immune drivers of PE remain elusive. The disease is multifactorial, influenced by genetic, immunological, and environmental factor (11). Notably, immune dysregulation, including altered T-cell responses, macrophage polarization, and cytokine imbalance, contributes significantly to the disease’s pathophysiology (12). However, no definitive biomarkers or targeted therapies are available, and the delivery of the placenta remains the only curative intervention.
Transcriptomic studies of PE have produced heterogeneous results, with limited overlap in differentially expressed genes across cohorts—likely reflecting disease heterogeneity, variable study designs, and population differences (13). This underscores the need for integrative and high-resolution molecular analyses to better delineate the mechanisms underpinning PE.
Recent advances in high-throughput technologies have provided new opportunities to interrogate the molecular landscape of PE (14). Bulk RNA sequencing (RNA-seq) of placental tissue has identified dysregulation of genes involved in angiogenesis, inflammation, and metabolism, but cannot resolve cell type-specific changes (15, 16). Single-cell RNA sequencing (scRNA-seq) overcomes this limitation by enabling transcriptomic profiling at single-cell resolution, thus revealing the cellular heterogeneity of the placenta and highlighting pathogenic alterations in specific trophoblast and immune cell subsets in PE (15, 17, 18).
Given that PE involves both placental and systemic (maternal) alterations, integrative approaches that combine molecular data from placental tissue and maternal blood offer comprehensive insight into disease pathogenesis (19, 20). In this study, we employed a multi-level transcriptomic strategy by performing scRNA-seq on placental samples and bulk RNA sequencing on peripheral blood from women with PE and gestational age-matched controls. By integrating these datasets, we aimed to identify key genes and pathways dysregulated in PE, explore their cellular origins, and elucidate potential links between placental dysfunction and systemic immune responses.
Our findings reveal novel candidate genes and immune-related pathways potentially involved in the immunopathogenesis of PE. This integrative analysis provides new insights into the molecular mechanisms underlying PE and highlights immune dysregulation as a crucial factor in its pathogenesis. These results could facilitate the development of improved biomarkers and therapeutic strategies for this serious pregnancy complication.
2 Materials and methods
2.1 Sample collection
This study was approved by the Institutional Ethics Committee of the First Hospital of Jilin University (approval number: 2024-HS-145) and conducted in accordance with the Declaration of Helsinki, with written informed consent obtained from all participants. For peripheral blood transcriptomic analysis, samples were collected during the second trimester from 10 pregnant women at increased risk for preeclampsia—defined by one or more established risk factors (including newly elevated blood pressure [≥140/90 mmHg] at the first prenatal visit, history of preeclampsia, body mass index (BMI) ≥35 kg/m², positive antiphospholipid antibodies, chronic hypertension, or a first-degree family history of preeclampsia)—as well as 10 healthy, gestational age-matched controls during routine antenatal outpatient screening. For scRNA-seq, placental tissues were obtained in the third trimester from three early-onset PE patients and two age-matched controls undergoing elective cesarean section, with samples immediately processed to ensure tissue integrity for downstream analysis.
2.2 Differential expression analysis
Differential gene expression was assessed using the Limma package (v3.58.1). Raw count data were first transformed by the voom method to stabilize the mean–variance relationship (21). Linear models were then fitted to each gene expression profile, and empirical Bayes moderation was applied to improve variance es-timates. Genes exhibiting a two-sided p-value < 0.05 and an absolute log2 fold change (|log2FC|) > 1 were deemed significantly differentially expressed. Volcano plots were gener-ated with ggplot2 (v3.5.1) to visualize the overall distribution of fold changes and significance levels, while heat maps of the top 50 up- and down-regulated genes were produced using pheatmap (v1.0.12), with expression values scaled by row. All analyses adhered to the package defaults unless otherwise specified.
2.3 Immune infiltration
The relative abundance of infiltrating immune cell subsets was estimated using CIBERSORT (v1.03). Normalized bulk RNA-seq expression matrices were deconvoluted against the LM22 signature matrix via support vector regression. Deconvolution was run with 1,000 permutations, and only samples yielding a CIBERSORT p-value < 0.05 were considered reliable and retained for downstream analysis. Visualization of immune‐infiltration profiles (stacked bar charts and heat maps) was performed using the R packages ggplot2 and pheatmap under default settings.
2.4 WGCNA analysis
Weighted gene co-expression networks were constructed using the WGCNA (v1.72.5) (22). To reduce noise, the top 10,000 genes ranked by variance across all samples were retained. A soft-thresholding power of 12 was selected by analyzing scale-free topology criteria (R² > 0.85). The resulting adjacency matrix was transformed into a topological overlap matrix (TOM) to quantify network connectivity. Hierarchical clustering of the TOM was performed using the average linkage method, and modules were detected via dynamic tree cut (minimum module size = 30, merge cut height = 0.25). Each module was assigned a unique color label. Module eigengenes (MEs) were correlated with external traits, including estimated immune cell pro-portions from CIBERSORT and clinical phenotypes, using Pearson correlation. Modules showing significant associations (p < 0.05) were prioritized for further analysis. Within these modules, hub genes were defined as those with high intramodular connectivity (module membership > 0.8) and strong trait correlation (gene significance > 0.2). Identified hub genes were carried forward for downstream functional enrichment and network visualization (23).
2.5 Integrated functional and network analysis
The list of intersecting genes was uploaded to the Metascape platform with “Homo sapiens” selected as the species (24). Gene Ontology (GO) pathway enrichment analysis was performed, with statistical significance defined as a minimum overlap ≥3 and p ≤ 0.01. The protein–protein interaction network was constructed using the STRING database (confidence threshold ≥0.7). Significance was evaluated by hypergeometric testing, and results were corrected for multiple testing using the false discovery rate (FDR) method. Only pathways with FDR < 0.1 were retained, and genes without functional annotation were excluded. Core nodes within the network were identified based on a degree centrality ≥5, thereby determining key regulatory nodes.
2.6 Feature selection process of Lasso regression and SVM algorithm
To pinpoint robust diagnostic biomarkers, we employed two complementary ma-chine-learning approaches: LASSO logistic regression and support vector machine recursive feature elimination (SVM-RFE) (25). LASSO logistic regression was performed using the glmnet (v4.1.8). The expression matrix of candidate genes served as input, with disease status as the outcome. We applied the cv.glmnet() function with ten-fold cross-validation to determine the optimal penalty parameter (λ) that minimized the mean cross-validated error. Genes with nonzero coefficients at this λ were selected as LASSO‐derived features. SVM-RFE was conducted using the e1071 R package (v1.7.14). A linear‐kernel SVM was trained on the same ex-pression data. Recursive feature elimination proceeded by iteratively removing the least con-tributory genes—ranked by absolute weight magnitude—and evaluating model accuracy via ten-fold cross-validation at each step. The gene subset achieving the highest classification accuracy was retained. The intersection of LASSO‐ and SVM-RFE‐selected genes was con-sidered the final panel of candidate diagnostic markers for downstream validation.
2.7 GSEA analysis
Patients were stratified into high- and low-expression groups for each core gene using the median expression as the cutoff. Gene set enrichment analysis (GSEA) was performed using the clusterProfiler package. A pre-ranked list of all genes—ordered by log2 fold change be-tween high- and low-expression groups—was submitted to the GSEA() function. Gene sets were drawn from the MSigDB Hallmark and KEGG collections. Analysis parameters included 1,000 phenotype-based permutations (nPerm = 1000, permType = “phenotype”). Enriched pathways with nominal p-value < 0.05 and Benjamini–Hochberg–adjusted q-value < 0.05 were considered significant. Enrichment plots were generated using the gseaplot2() function.
2.8 Quality control and filtering criteria
Raw UMI count matrices were imported into Seurat (v4.3.0) for quality control, during which four key metrics—library complexity (total UMI counts and number of detected genes), mito-chondrial transcript fraction (percentage of reads mapping to MT-encoded genes), and ribo-somal transcript fraction (percentage of reads mapping to RPS/RPL gene families)—were computed for each cell (26). To exclude low-quality or apoptotic cells, we removed any cell with fewer than 200 or more than 6,500 detected genes, fewer than 500 or more than 50,000 UMIs, mitochondrial content exceeding 10%, or ribosomal content exceeding 30%. These thresholds were selected based on inspection of metric distributions (via violin and scatter plots) to dis-card outliers beyond 1.5× the interquartile range. Following filtering, the retained cells dis-played high library complexity and minimal stress indicators, providing a robust dataset for subsequent normalization and downstream analyses.
2.9 Data standardization and cell annotation
After quality control, expression matrices were normalized and scaled in Seurat using the “LogNormalize” method, whereby each cell’s counts were divided by the total counts, multi-plied by a scale factor of 10,000, and log‐transformed. Cell‐cycle heterogeneity was assessed with CellCycleScoring, and the top 2,000 highly variable genes were identified using Find-VariableFeatures. To minimize technical and biological confounders, we applied ScaleData to regress out mitochondrial gene percentage, ribosomal gene percentage, and cell‐cycle scores. Linear dimensionality reduction was then performed via principal component analysis (PCA), and Harmony integration was applied to the principal components (PCs) to correct batch effects across samples. Nonlinear dimensionality reduction for visualization was achieved with Uniform Manifold Approximation and Projection (UMAP) on the Harmo-ny-corrected PCs, and graph‐based clustering (FindNeighbors/FindClusters) delineated dis-crete cell populations. Finally, clusters were annotated by cross‐referencing cluster marker genes with published literature and entries in the CellMarker database, enabling precise iden-tification of trophoblast, immune, and stromal subsets relevant to preeclampsia pathogenesis.
2.10 Statistical analysis
Statistical analyses were conducted in R (v4.2.1). Unless otherwise noted, all tests were two‐sided, and p-values below 0.05 were considered statistically significant.
3 Results
3.1 Peripheral blood transcriptomic and immune profiling in pregnant women at risk for PE
To investigate early molecular and immunological alterations associated with PE, we first per-formed transcriptomic profiling of peripheral blood samples from 20 pregnant women, com-prising 10 individuals at increased risk for PE and 10 healthy, gestational age-matched controls. The PE-risk group was defined by the presence of one or more established risk factors, in-cluding newly elevated blood pressure (≥140/90 mmHg) at the initial prenatal visit, prior history of PE, maternal age ≥40 years, body mass index (BMI) ≥35 kg/m², positive antiphos-pholipid antibodies, chronic hypertension, or a first-degree family history of PE. All samples were obtained during routine antenatal outpatient screening.
Differential gene expression analysis was conducted using the Limma package. With the thresholds set at p < 0.05 and |log2 fold change| > 1, a total of 179 differentially expressed genes (DEGs) were identified between the PE-risk and control groups, including 137 upregu-lated and 42 downregulated genes in the PE-risk cohort. A volcano plot illustrating the dis-tribution of DEGs is presented in Figure 1A, where pink and blue indicate upregulated and downregulated genes, respectively. The accompanying heatmap (Figure 1B) demonstrates distinct gene expression patterns between the two groups, with red representing higher and blue representing lower expression levels. These results indicate that substantial transcrip-tional alterations are already evident in the peripheral blood of women at risk for PE.
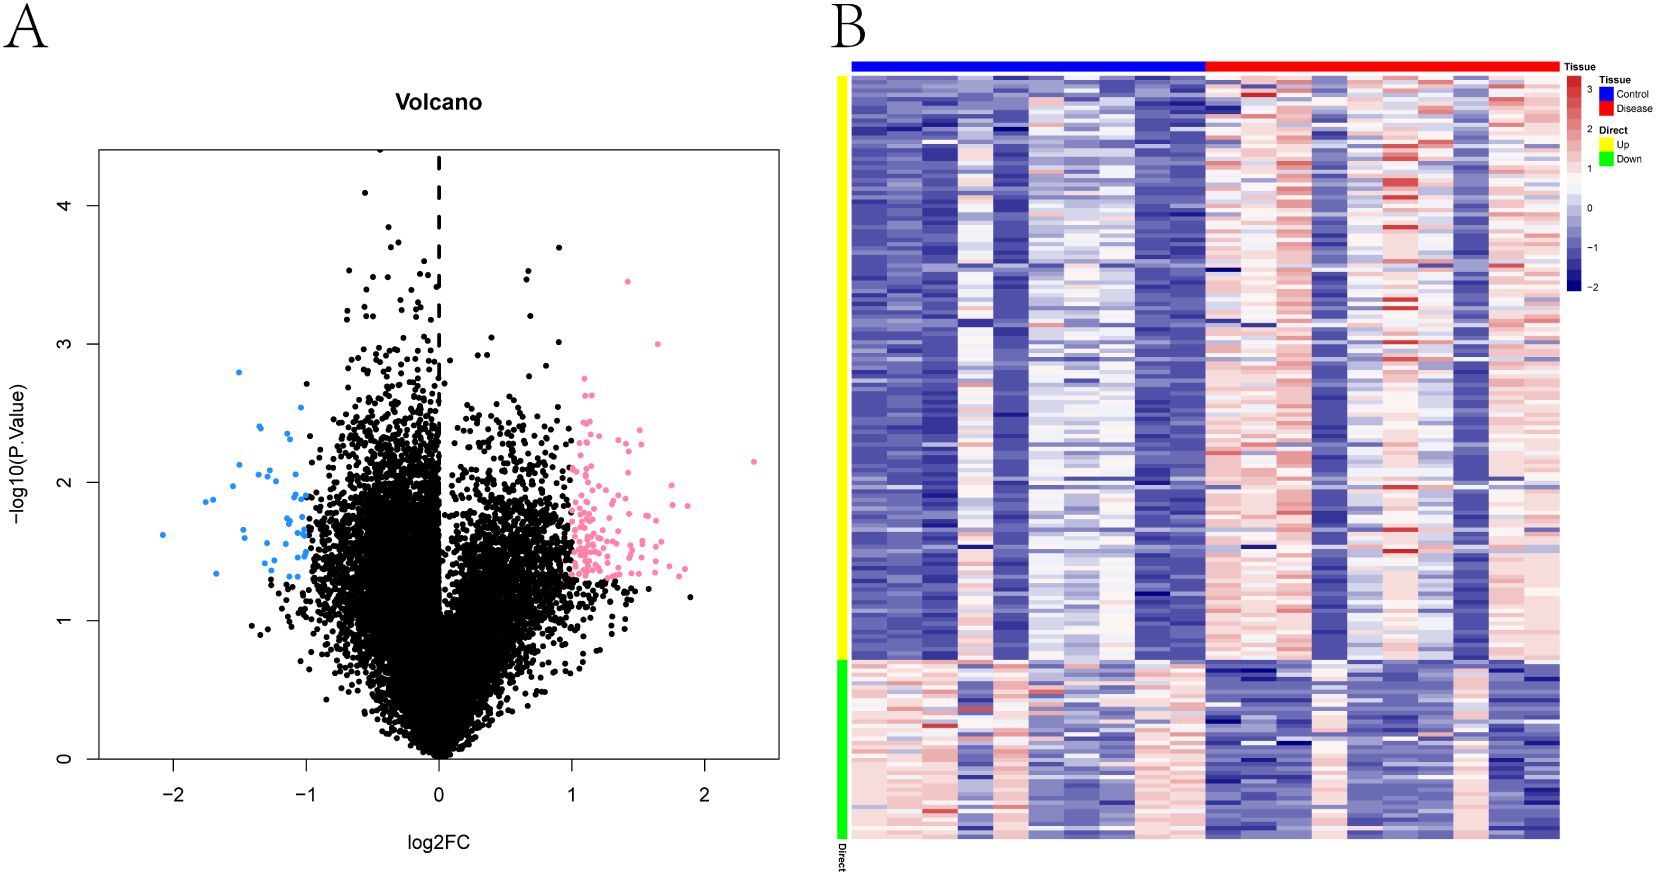
Figure 1. Transcriptomic differences in peripheral blood between pregnant women at risk for PE and healthy controls. (A) Volcano plot of differentially expressed genes (DEGs) between PE-risk and control groups. Each dot represents a gene. Genes with p < 0.05 and |log2FC| > 1 are shown in pink (upregulated) and blue (downregulated); non-significant genes are shown in black. (B) Heatmap showing the expression profiles of DEGs across all peripheral blood samples. Rows represent genes, and columns represent individual samples from PE-risk (n = 10) and control (n = 10) pregnancies. Red indicates high expression; blue indicates low expression.
To further explore the immune microenvironment, we employed the CIBERSORT algorithm to estimate the relative abundance of 22 immune cell subtypes from bulk transcriptomic data. The immune cell composition of each sample is shown as a stacked bar chart (Figure 2A), revealing notable differences between PE-risk and control pregnancies. In particular, the PE-risk group exhibited increased proportions of monocytes and activated dendritic cells, along with decreased fractions of regulatory T cells (Tregs) and resting NK cells, indicating a shift toward a pro-inflammatory peripheral immune profile.
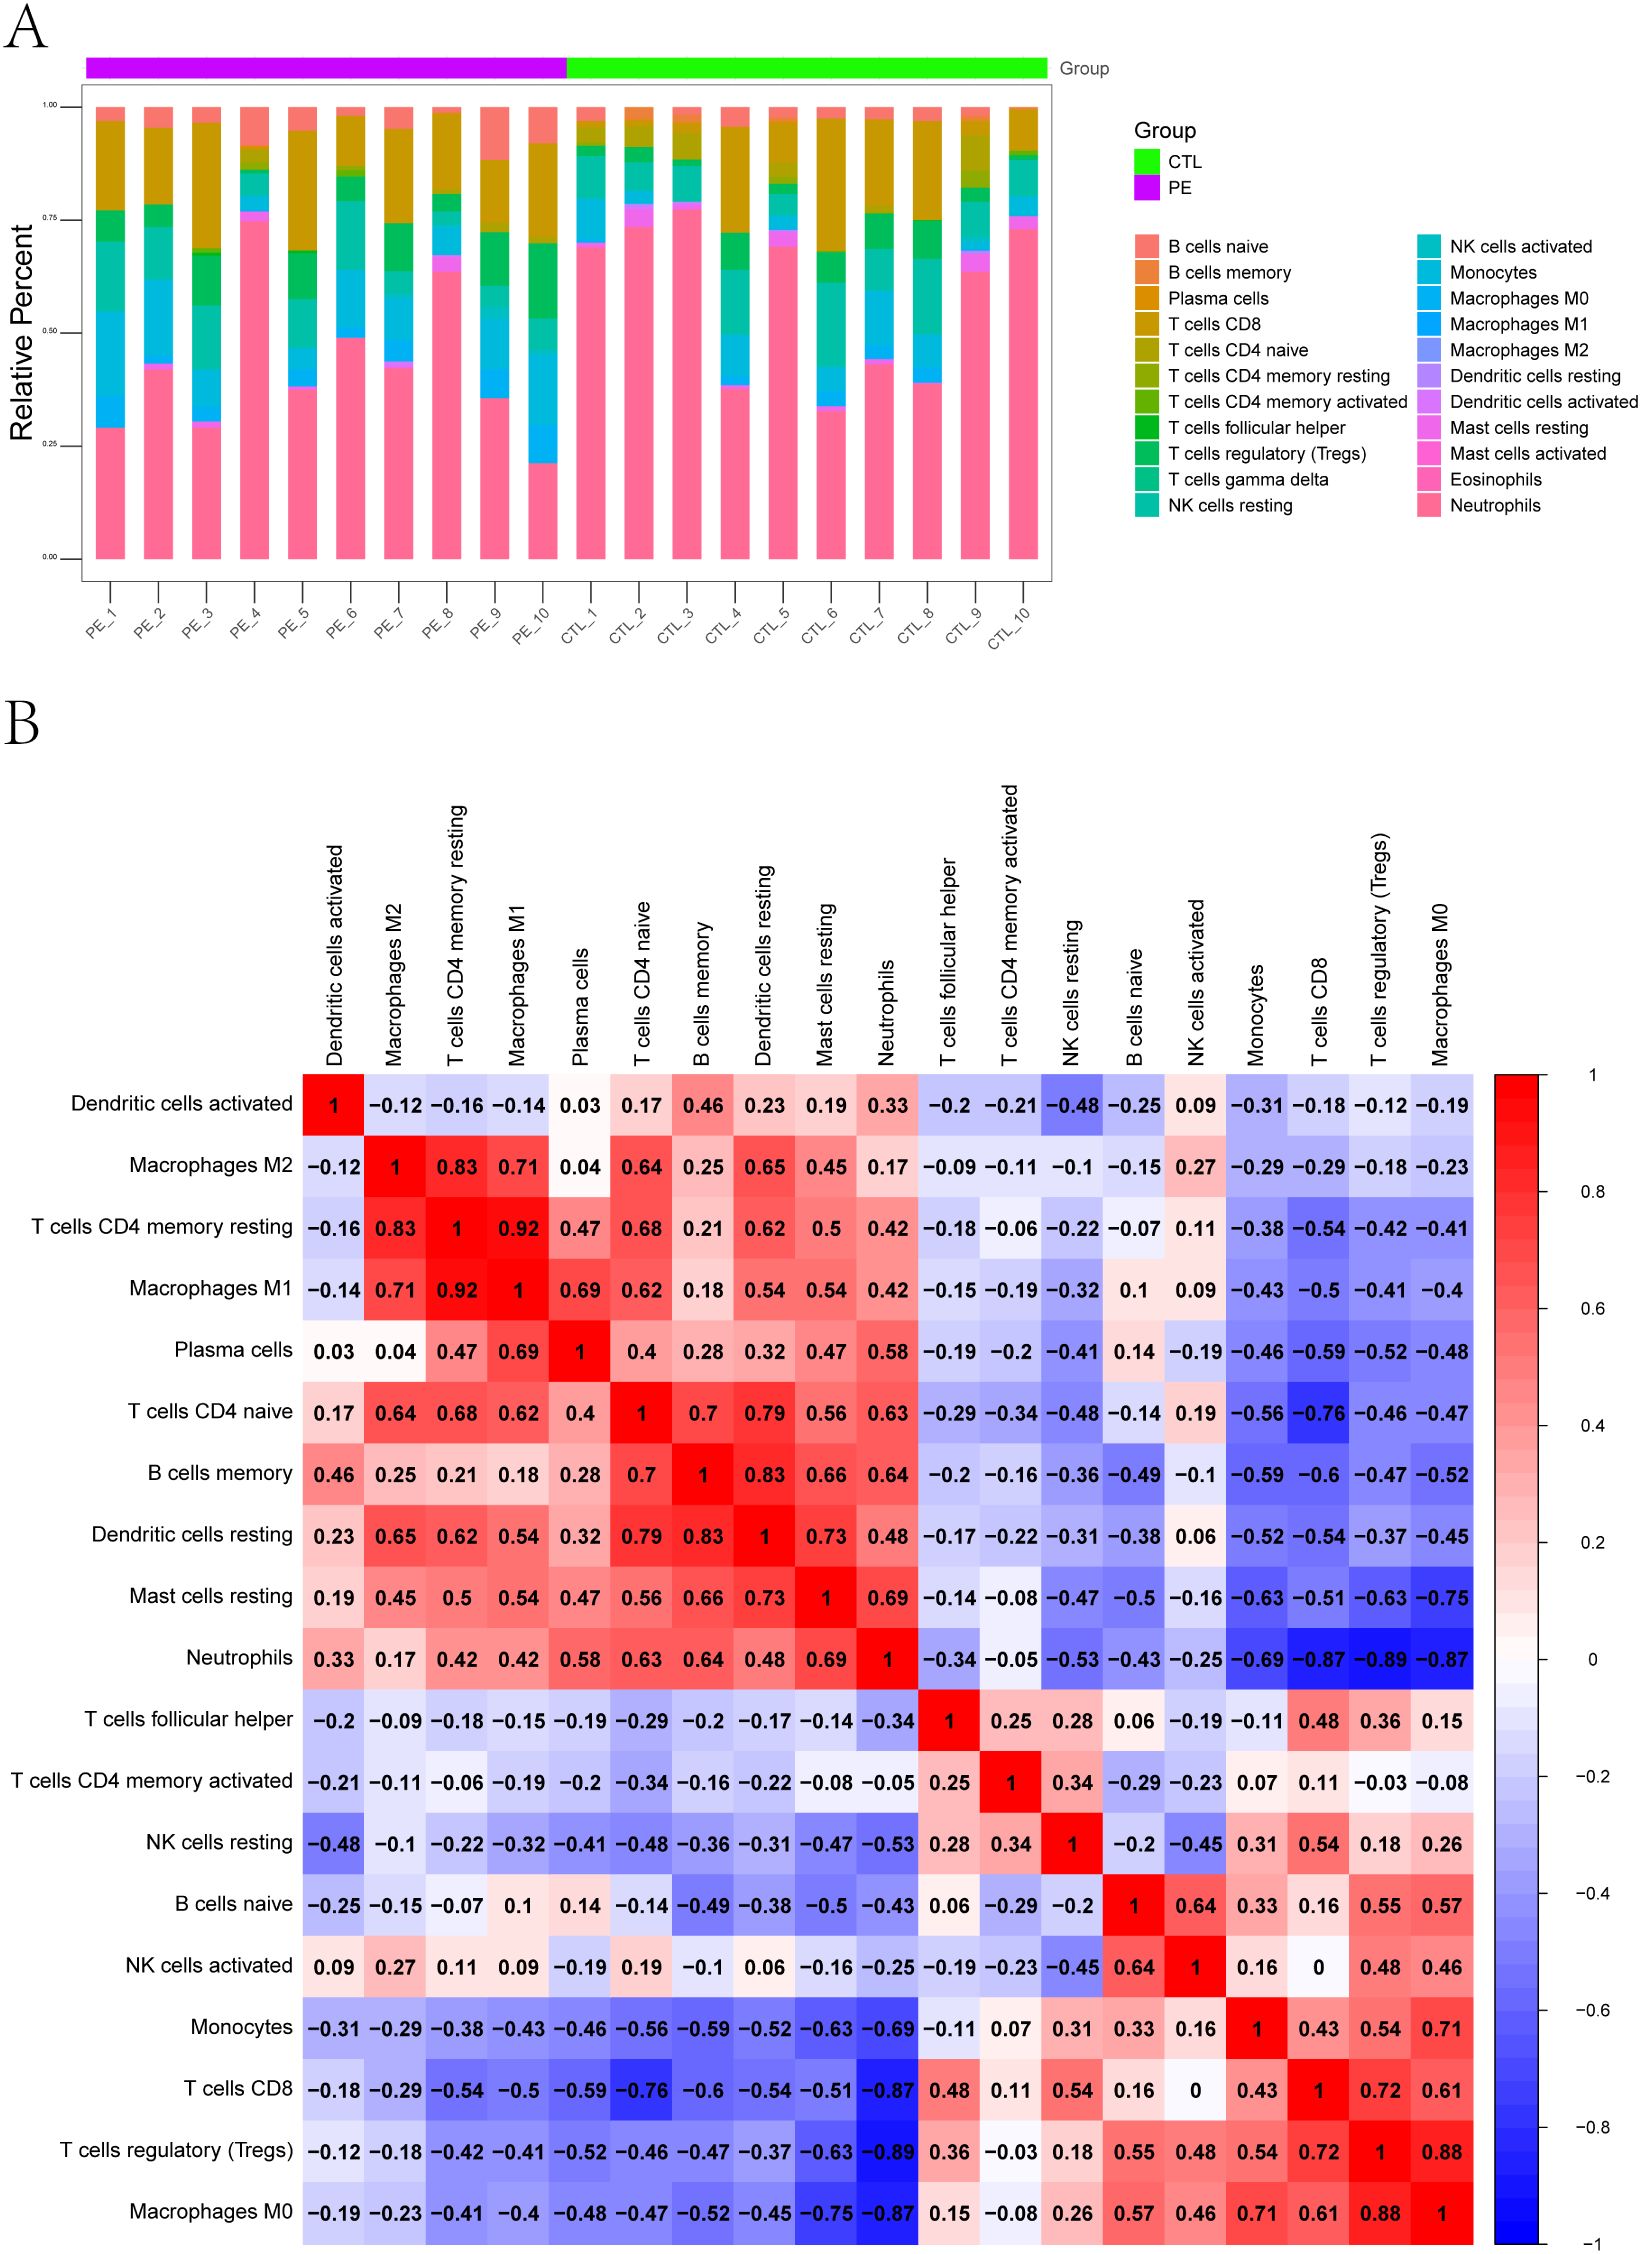
Figure 2. Immune landscape characterization of peripheral blood in pregnant women at risk for PE. (A) Relative proportions of 22 immune cell subtypes estimated by CIBERSORT. Stacked bar plots display the distribution of immune cell types in each peripheral blood sample from PE-risk and control groups. (B) Correlation heatmap of immune cell subtypes. Spearman cor-relation coefficients were calculated based on the estimated proportions of immune subsets. Positive correlations are shown in red, and negative correlations in blue.
We additionally assessed the correlations among immune cell subsets using CIBERSORT-derived proportions. The correlation heatmap (Figure 2B) revealed a network of interactions among immune populations. Positive correlations were observed among activated NK cells, monocytes, and CD8+ T cells, while Tregs were negatively correlated with M1 macrophages and neutrophils. These patterns reflect a potential imbalance between regulatory and effector immune responses, which may underlie early immune activation in pregnancies predisposed to PE.
3.2 WGCNA identifies a neutrophil-associated gene module enriched in immune regulatory pathways
To further explore the regulatory networks underlying transcriptional alterations in pregnant women at risk for PE, we performed weighted gene co-expression network analysis (WGCNA) based on scale-free topology criteria (Figure 3A). Hierarchical clustering based on the topological overlap matrix (TOM) identified six gene co-expression modules, labeled by color as black (154 genes), brown (1,430), grey (911), magenta (59), red (7,136), and yellow (310) (Figure 3B).
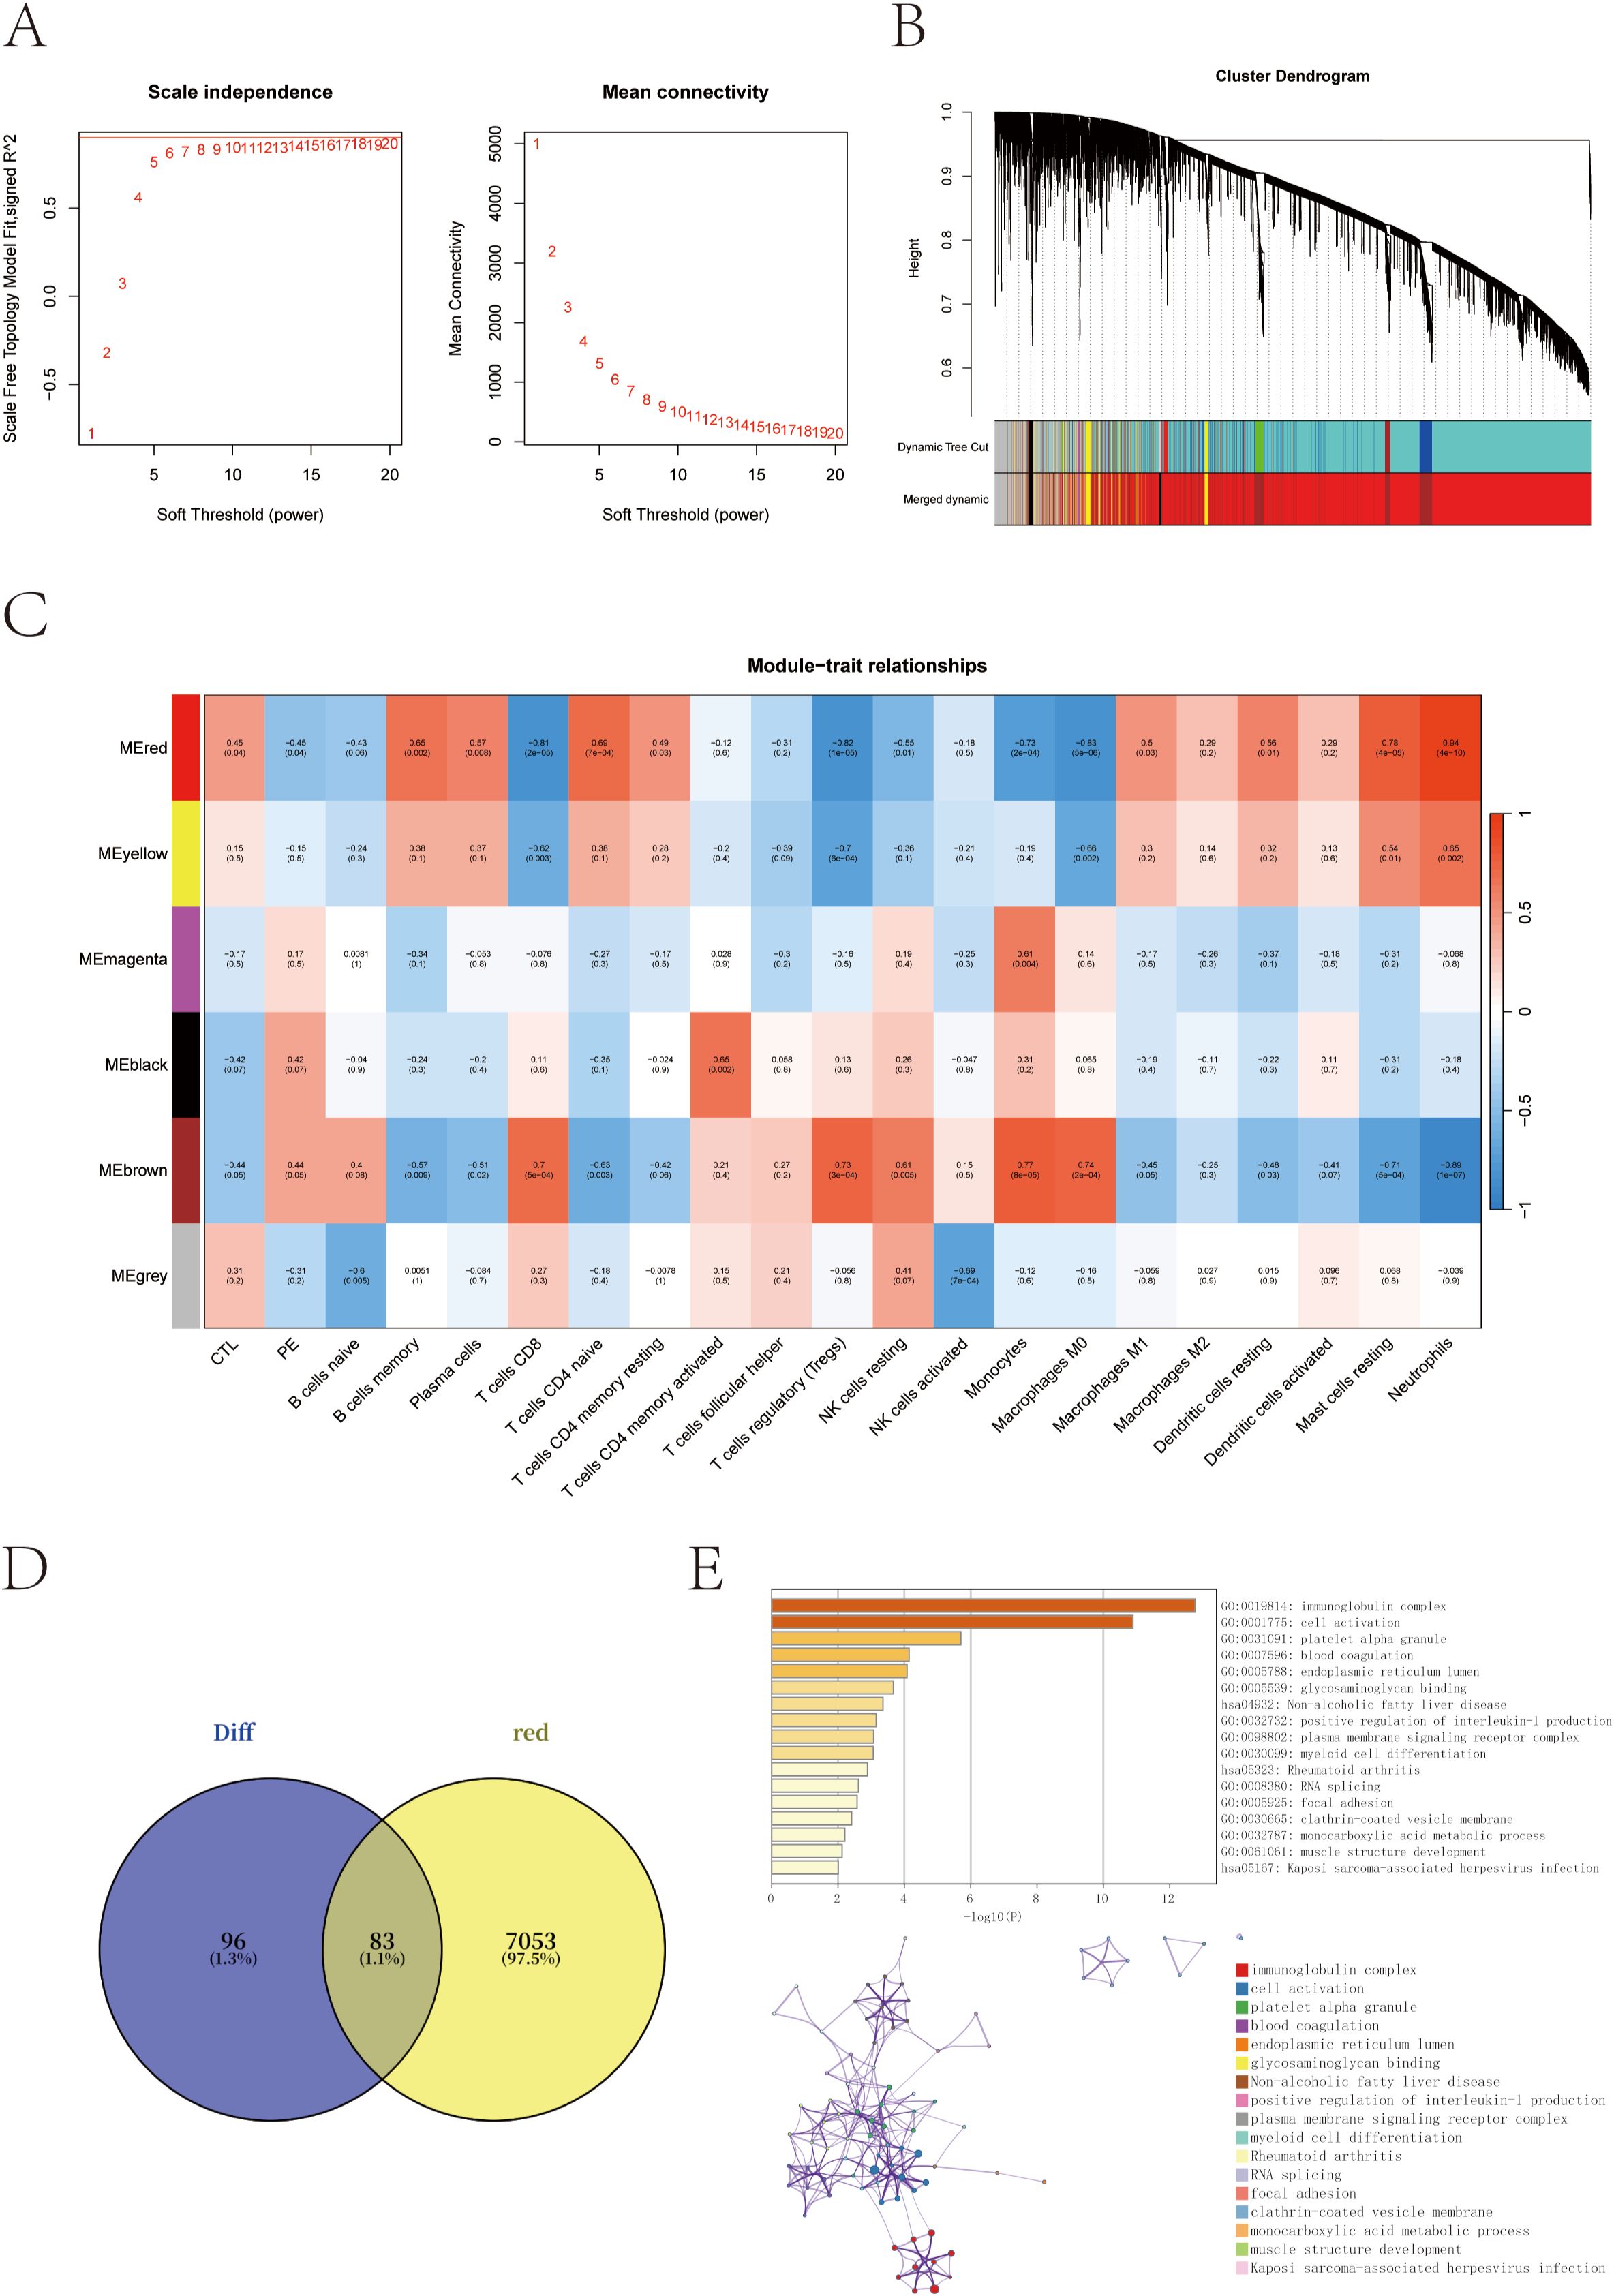
Figure 3. Co-expression network construction and trait correlation analysis via WGCNA. (A) Determination of the optimal soft-thresholding power (β = 14) based on scale-free topology fit index and mean connectivity. (B) Gene dendrogram obtained by hierarchical clustering of the topological overlap matrix (TOM); colors represent different co-expression modules. (C) Heatmap of correlations between module eigengenes and clinical/immune traits. The red module shows the strongest positive correlation with neutrophil scores and PE-risk status. (D) Venn diagram showing the overlap between red module genes and previously identified differentially expressed genes (DEGs). (E) Functional enrichment of the 83 overlapping genes using the GO and KEGG enrichment analysis through the Metascape database.
Module–trait correlation analysis revealed that the red module was most strongly associated with PE-risk status and with neutrophil infiltration scores (cor = 0.94, p = 4 × 10⁻¹⁰), suggesting its potential involvement in immune dysregulation linked to PE susceptibility (Figure 3C). To narrow down the candidate gene set, we intersected the red module genes with the previously identified DEGs, yielding a total of 83 overlapping genes (Figure 3D).
Functional enrichment analysis of these 83 intersection genes was performed to gain insights into their biological relevance. The analysis revealed significant enrichment in immune-related pathways, particularly in the immunoglobulin complex, along with terms related to cell activation and myeloid cell differentiation. These findings underscore the central role of immune dysregulation in the pathogenesis of preeclampsia (Figure 3E).
3.3 Identification of core candidate genes by LASSO and SVM algorithms
To further narrow down potential biomarkers relevant to PE, we applied two supervised machine learning algorithms—LASSO regression and support vector machine-recursive feature elimination (SVM-RFE)—to the 83 intersecting genes identified from the neutrophil-associated co-expression module and differential expression analysis. These genes represent a subset of immune-related transcripts that are both co-expressed and differentially regulated in pregnant women at risk for PE, suggesting functional relevance to disease development. LASSO regression identified 17 genes with non-zero coefficients as optimal features for distinguishing PE-risk individuals from controls, as determined by the minimum cross-validation error (Figures 4A, B). Meanwhile, SVM-RFE analysis ranked the top 10 genes with the highest classification accuracy (Figure 4C). By intersecting both sets, five genes—TCL1A, CLEC2B, LGALS9, IGLV6-57, and AL450405.1 —were consistently identified (Figure 4D) and defined as robust candidate biomarkers for further analysis.
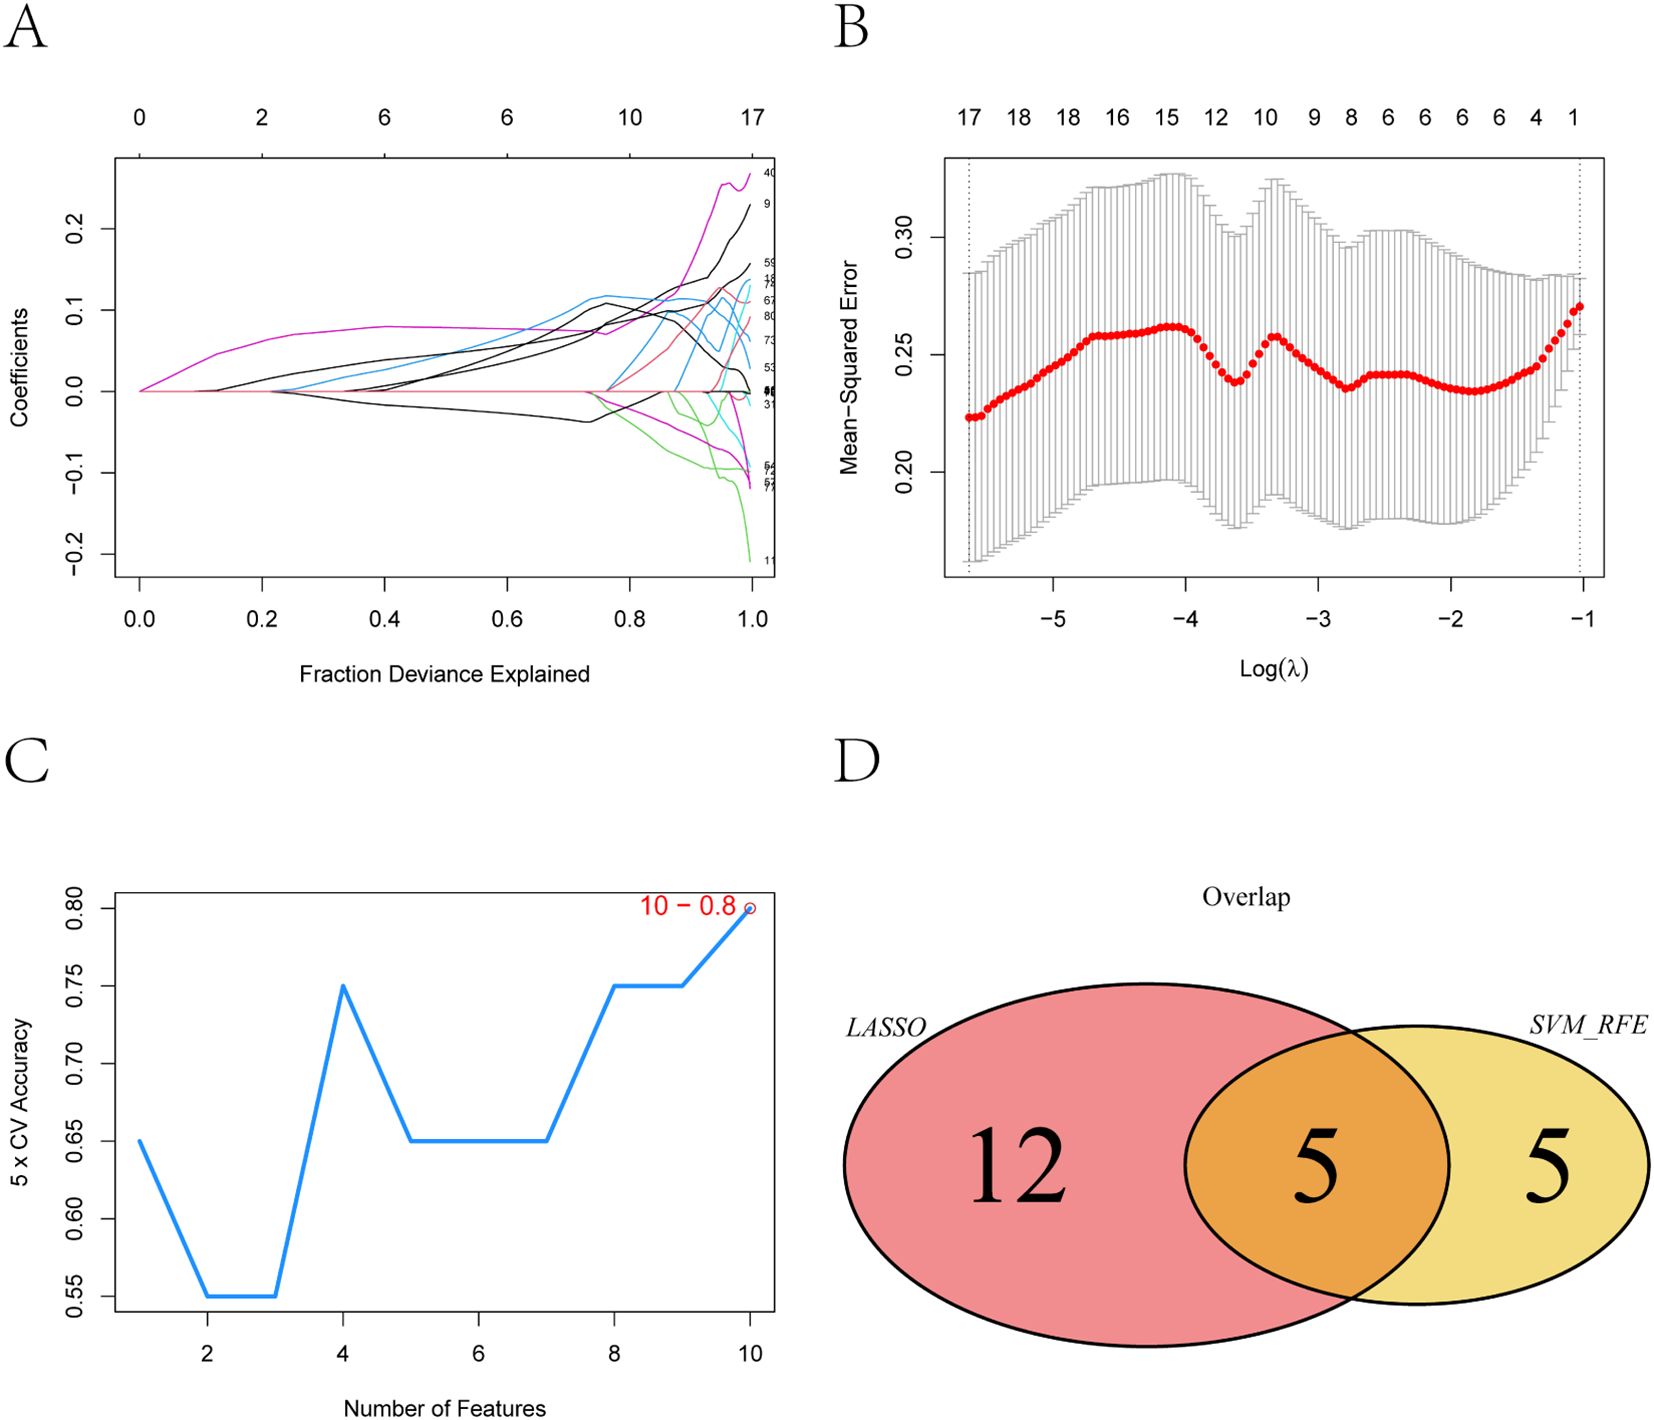
Figure 4. Feature selection of key genes using LASSO and SVM-RFE algorithms. (A) Coefficient distribution of the 83 input genes and the selected gene set at the optimal lambda (λ) value. (B) Ten-fold cross-validation in the LASSO model for tuning parameter selection and determination of the optimal lambda (λ). (C) Top 10 feature genes corresponding to the highest classification accuracy in the SVM-RFE model. (D) Intersection of feature genes selected by the LASSO regression and SVM-RFE algo-rithms.
3.4 Immune regulatory associations of the core genes
To explore how the five identified candidate genes might contribute to immune dysregulation in preeclampsia, we evaluated their correlations with immune-related molecules using the TISIDB database. The correlation heatmaps revealed that all five genes—TCL1A, CLEC2B, LGALS9, IGLV6-57, and AL450405.1—were significantly associated with numerous immune components (Figures 5A–E). Several genes showed notable positive or negative correlations with chemokines and immune receptors, suggesting potential involvement in immune cell recruitment and signaling. In addition, correlations with key immunomodulators and MHC molecules indicate their possible roles in shaping antigen presentation and immune tolerance (27). These findings highlight the relevance of the core genes in modulating both innate and adaptive immune responses, reinforcing their potential contribution to the immunological landscape of PE (28).
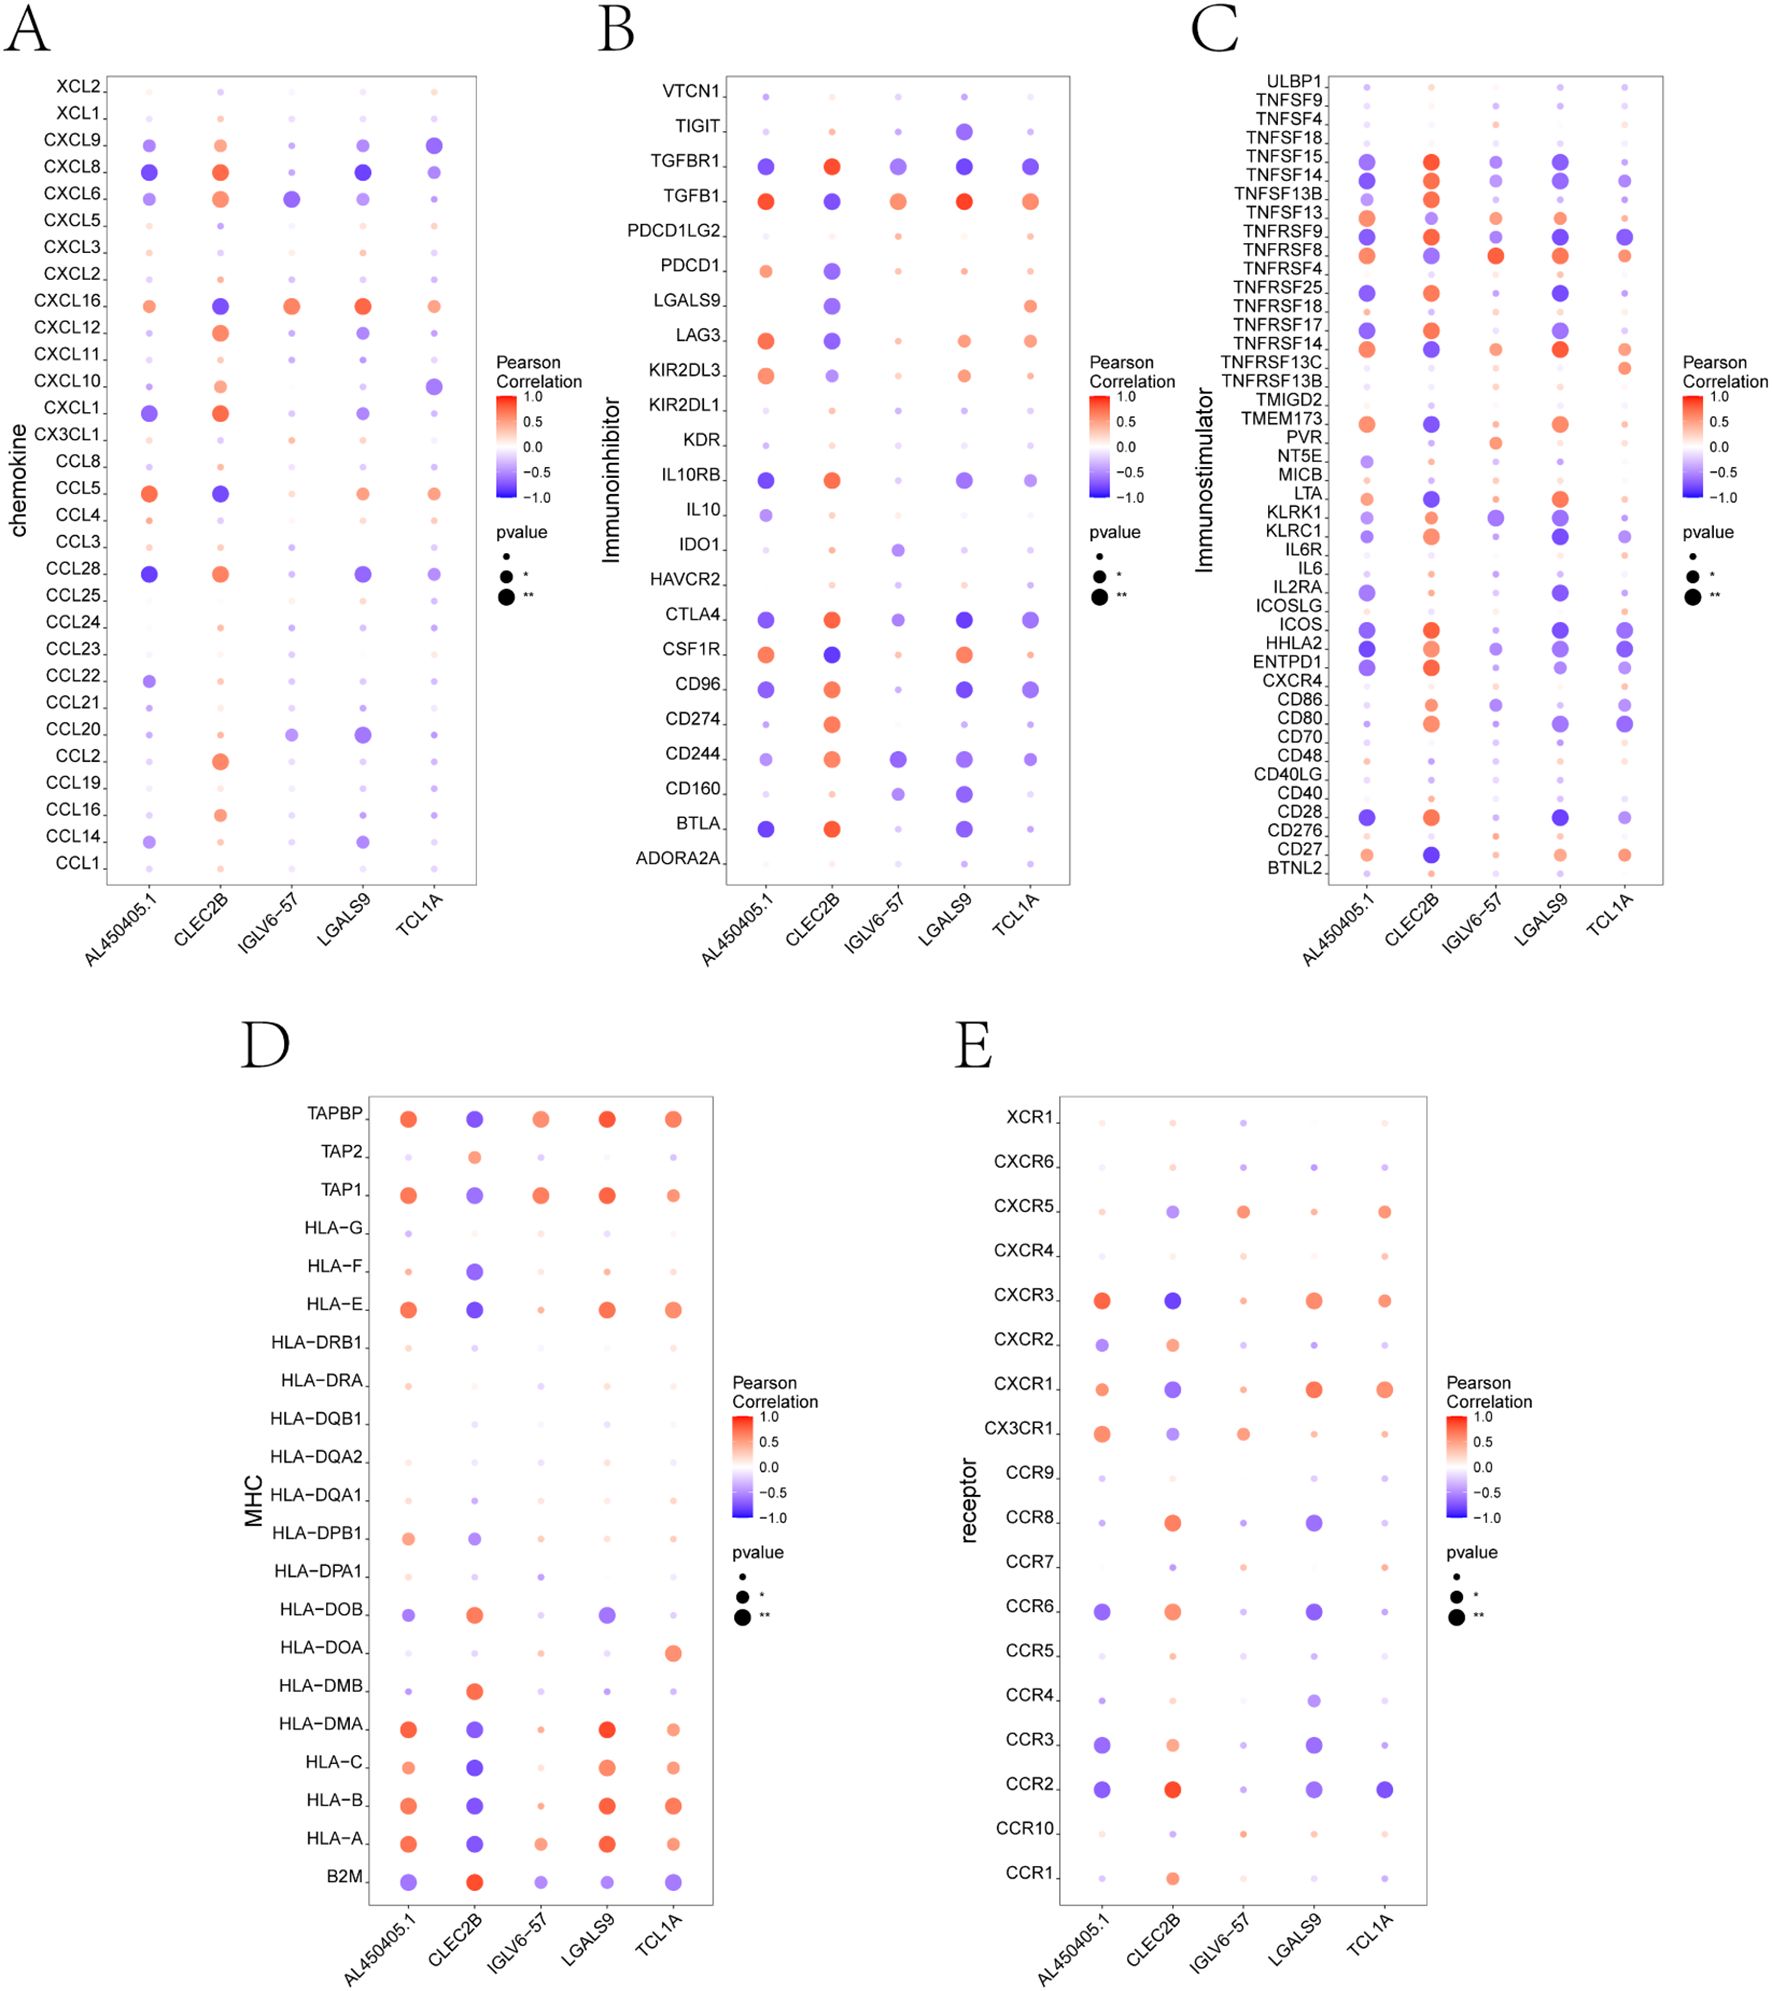
Figure 5. Correlation analysis between key genes and immune-related factors using TISIDB. (A-E) Correlation between the five core genes (TCL1A, CLEC2B, LGALS9, IGLV6-57, AL450405.1) and different categories of immune regulatory factors, including: (A) Chemokines, (B) Immunoinhibitors, (C) Immunostimulators, (D) Major histocompatibility complex (MHC) molecules, and (E) Immune-related receptors. Each dot represents the correlation between a single gene and an immune molecule. Red indicates positive correlation, and blue indicates negative correlation. Dot size reflects p-value significance.
3.5 GSEA-based identification of signaling pathways involving core genes
To further investigate the potential molecular mechanisms through which the five core genes may influence preeclampsia progression, we performed gene set enrichment analysis (GSEA) using KEGG pathway sets. For each gene, we visualized the enrichment of biological pathways based on expression-level–ranked gene profiles.
The GSEA results revealed distinct enrichment profiles across genes (Figures 6A–E). Specifically, AL450405.1 was enriched in signaling pathways such as basal_transcription_factors, histidine_metabolism, and oxidative_phosphorylation (Figure 6A). CLEC2B was enriched in nod_like_receptor_signaling_pathway, pentose_phosphate_pathway, and rna_degradation (Figure 6B). IGLV6–57 showed enrichment in beta_alanine_metabolism, endocytosis, and ether_lipid_metabolism (Figure 6C). LGALS9 was enriched in oxidative_phosphorylation, parkinsons_disease, and rna_degradation (Figure 6D). Finally, TCL1A was associated with abc_transporters, oocyte_meiosis, and primary_immunodeficiency (Figure 6E). These findings indicate that the five core genes are involved in a wide range of biological pathways, including those related to transcriptional regulation, immune signaling, energy metabolism, and cell cycle control, providing mechanistic insights into their potential roles in the pathogenesis of PE (29, 30).
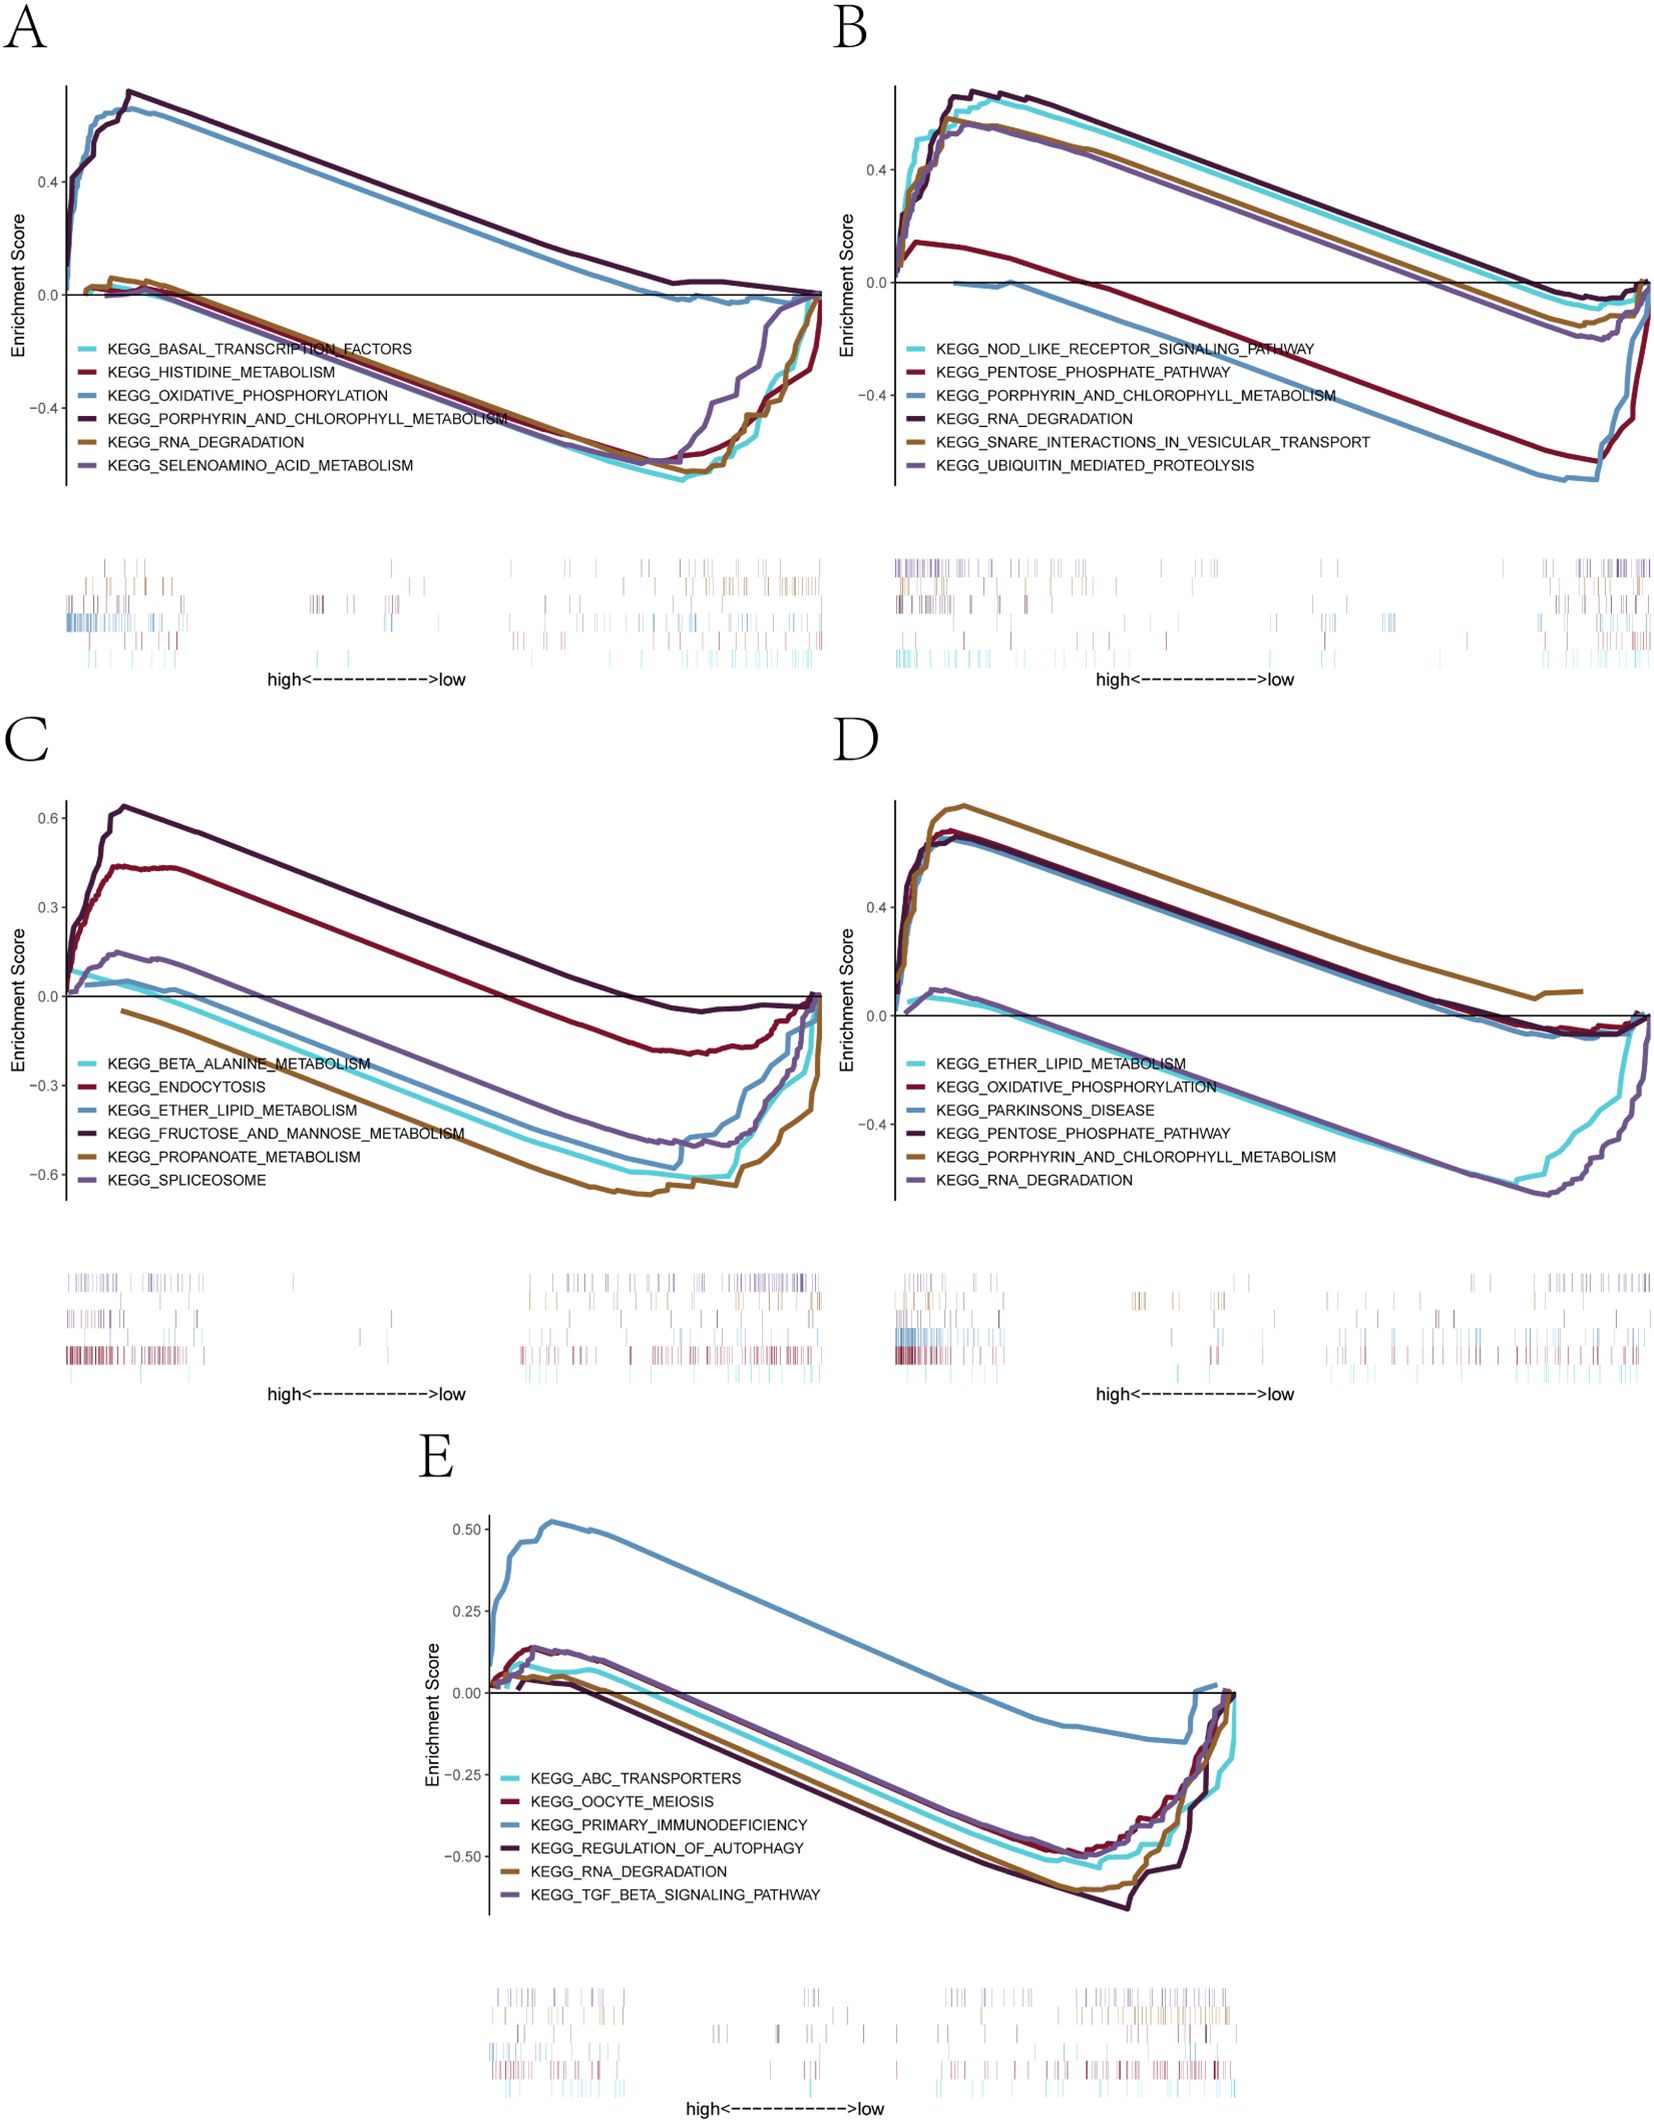
Figure 6. GSEA-based KEGG pathway enrichment analysis of the five core genes. (A-E) Significantly enriched KEGG signaling pathways associated with: (A) AL450405.1, (B) CLEC2B, (C) IGLV6-57, (D) LGALS9, (E) TCL1A. Each plot shows positively or negatively enriched pathways between high- and low-expression groups, along with their enrichment scores and contributing genes.
3.6 Cell-type–resolved expression patterns and immune functional mechanisms in the PE placenta
To integrate bulk transcriptomic findings with cell-specific resolution, we conducted single-cell RNA sequencing on placental tissues from three patients with early onset PE and two healthy controls. After rigorous quality control, a total of 41,395 high-quality cells were retained for analysis. UMAP dimensionality reduction revealed 13 major placental cell types, including multiple trophoblast and immune subsets (Supplementary Figure S1; Figure 7A). Marker gene analysis confirmed accurate cell-type annotation, and analysis of cell proportions revealed notable shifts in immune cell populations between PE and control placentas (Supplementary Figure S2).
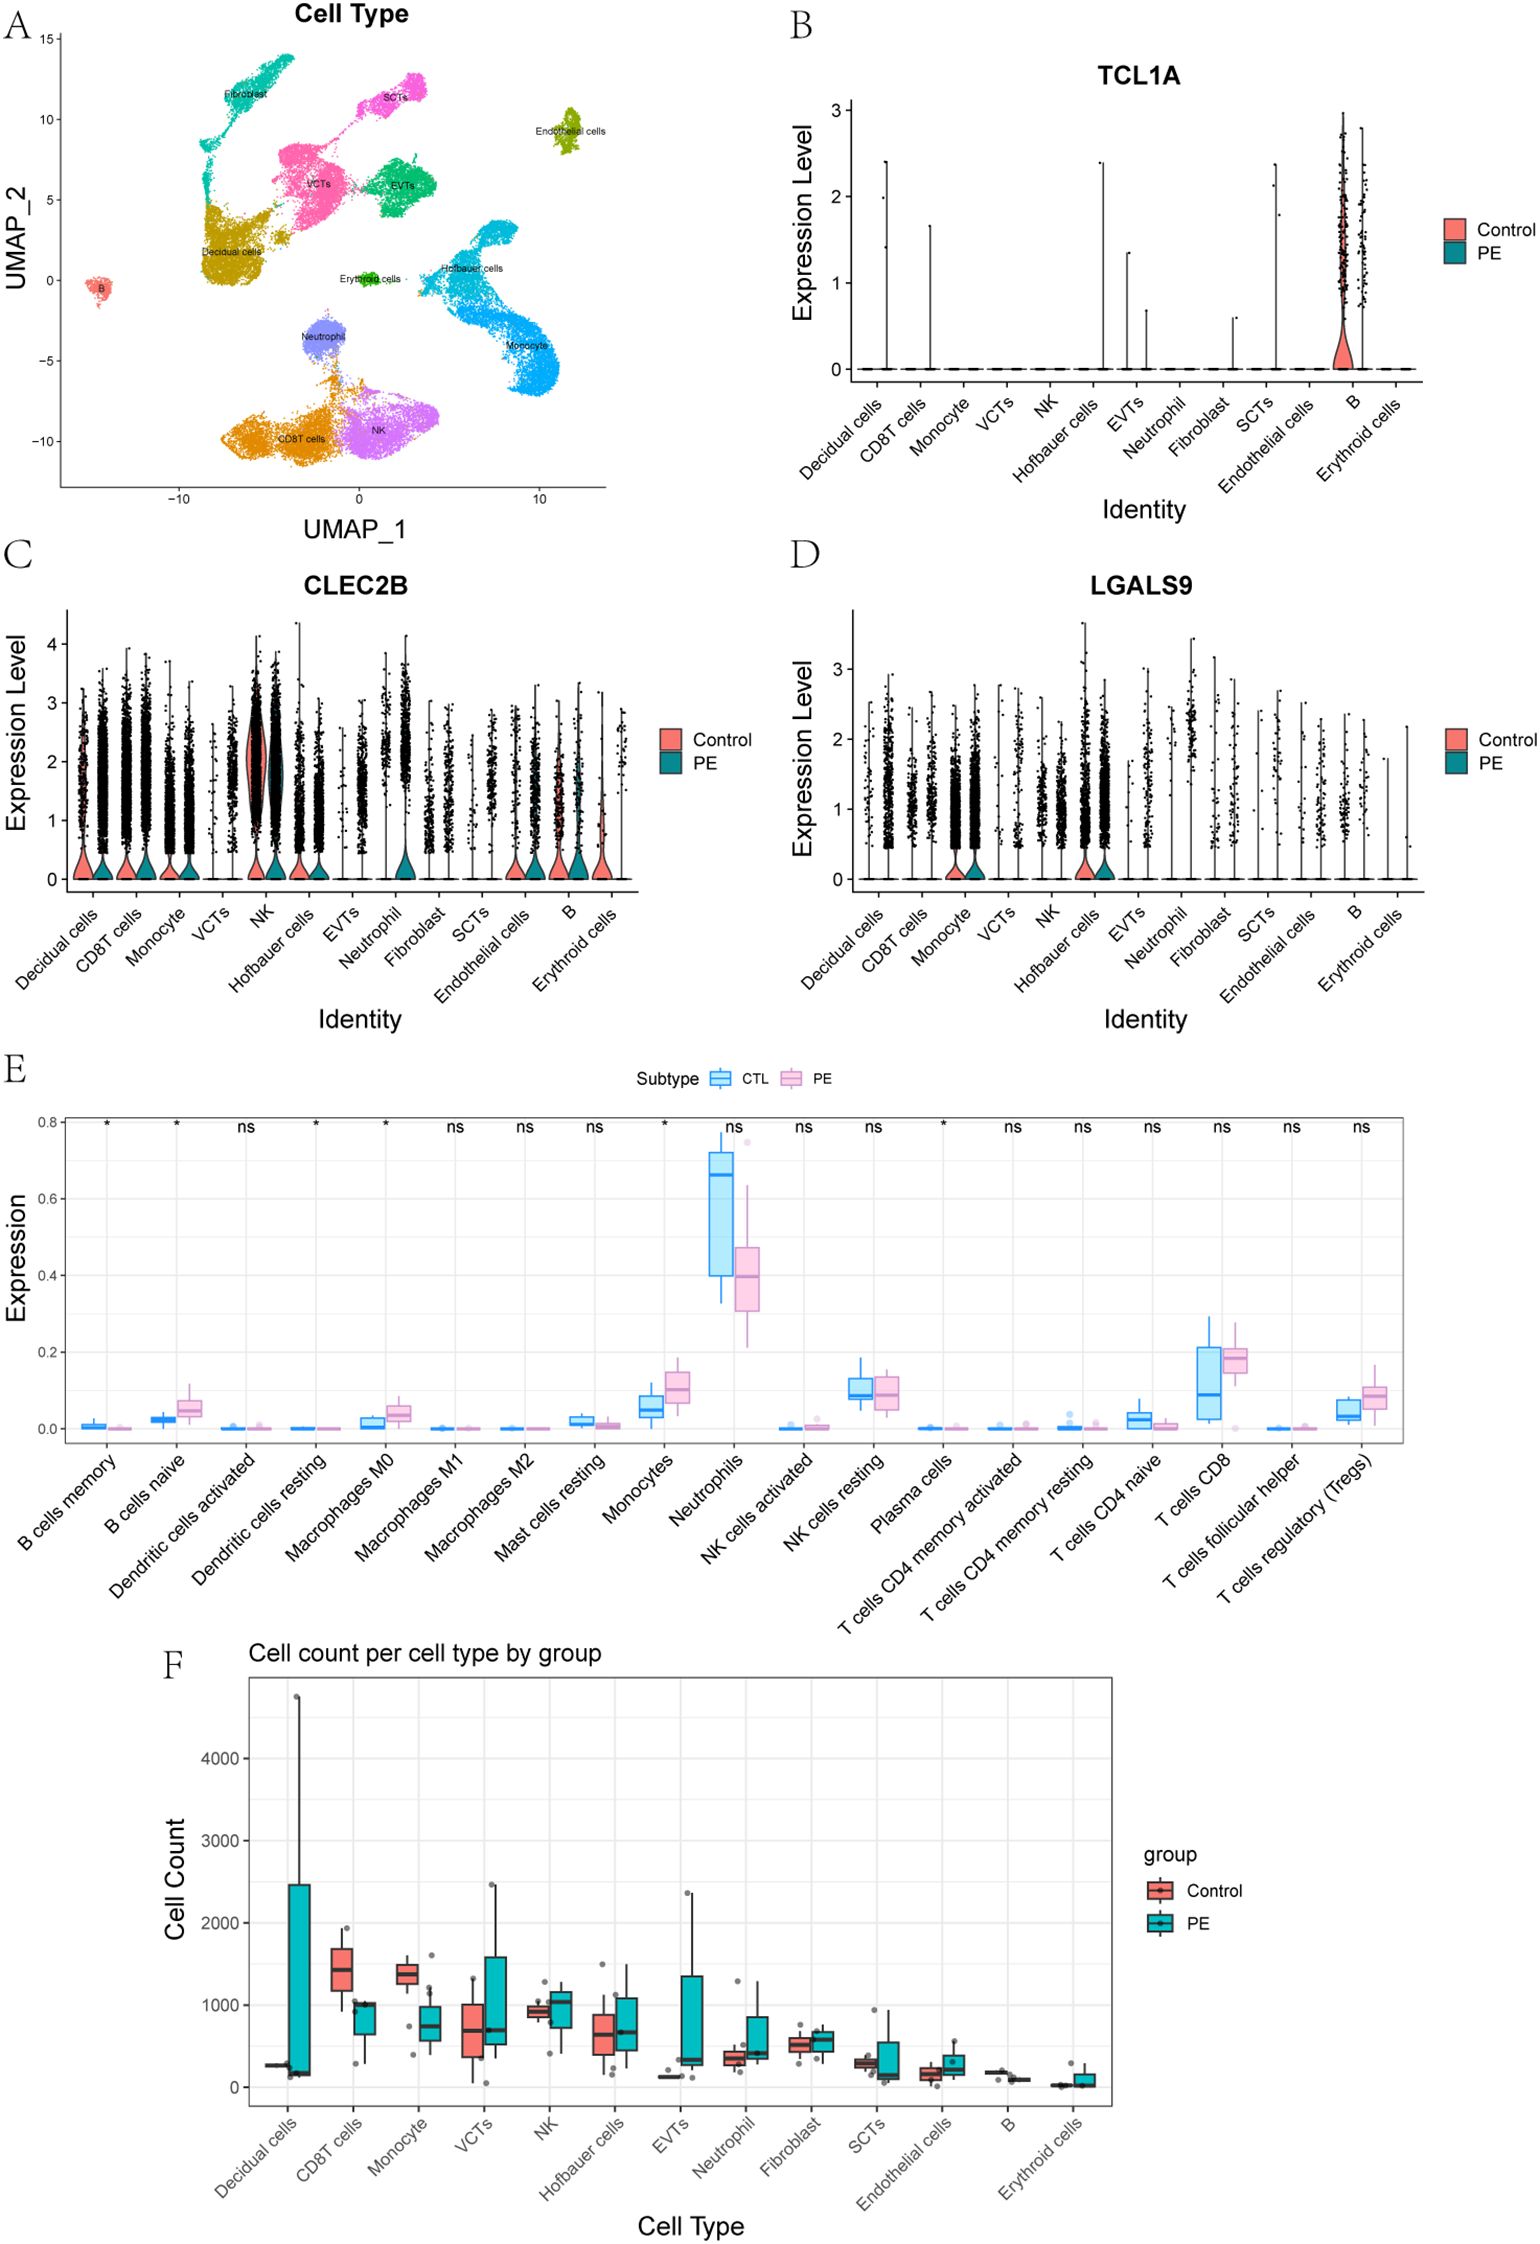
Figure 7. Single-Cell Expression Patterns and Immune Cell Composition in PE and Controls. (A) Placental cell types were defined by annotation of clusters based on canonical marker gene expression. (B-D) Expression of key genes in 13 placental cell types between control and PE groups: (B) TCL1A, (C) CLEC2B, (D) LGALS9. (E) Comparison of immune cell content in peripheral blood transcriptomes between control and PE groups. (F) Comparison of the abundance of 13 placental cell types between control and PE groups.
To further explore the roles of immune-related genes identified in the bulk transcriptomic analysis, we focused on three core genes—TCL1A, CLEC2B, and LGALS9—that displayed distinct cell-type–specific expression patterns in single-cell data. UMAP and violin plots revealed highly distinct and spatially localized expression patterns among these genes (Supplementary Figure S3, Figures 7B-D). TCL1A expression was highly enriched in placental B cells, with significantly higher expression in controls compared to PE. It is well recognized that abnormal B cell activation may lead to the production of autoantibodies or proinflammatory factors, both of which have been implicated in the development of PE. Given its strong expression in B cells, TCL1A may serve as a biomarker for adaptive immune disturbances in PE. CLEC2B was predominantly expressed in natural killer (NK) cells. NK cells play a critical role in the regulation of trophoblast invasion and uterine vascular remodeling through cytotoxicity and cytokine production, and aberrant CLEC2B expression could reflect altered NK cell function, contributing to defective vascular adaptation and immune imbalance at the maternal–fetal interface (31). This makes CLEC2B a potential marker for immune dysfunction and defective placental vascularization. LGALS9 was most abundant in Hofbauer cells and monocytes, indicating a role in macrophage-mediated immune modulation within the placenta. LGALS9, a galectin family protein, is known to regulate immune checkpoint pathways such as TIM-3, and its dysregulation could disrupt maternal–fetal tolerance, leading to heightened inflammatory responses characteristic of PE (32). These findings suggest that TCL1A, CLEC2B, and LGALS9 are not only key players in immune dysregulation in PE but also have potential as early biomarkers for the disease, with implications for early detection and mechanism research.
Additionally, Boxplot analyses of immune cell content across 13 placental cell types revealed significant differences between PE and control groups (Figures 7E, F). These analyses indicated that the immune cell composition in the PE placenta was altered compared to the control placenta, supporting the hypothesis that immune dysregulation is a critical factor in the pathogenesis of PE.
4 Discussion
PE is a pregnancy-specific disorder characterized by systemic vascular dysfunction and immune dysregulation, yet its molecular pathogenesis remains incompletely understood (33). In this study, we adopted a multi-omics strategy that integrates peripheral blood transcriptome profiling, transcriptional regulatory inference, and scRNA-seq of placental tissue to identify and functionally characterize key genes involved in PE. This approach enabled the discovery of molecular targets with diagnostic potential and mechanistic relevance, offering a high-resolution view of PE-associated immune alterations across both systemic and tissue levels.
Peripheral blood transcriptomic analysis revealed widespread immune and metabolic dysregulation in pregnant women at high risk for PE. Differentially expressed genes were significantly enriched in neutrophil-associated pathways and inflammatory signaling cascades, aligning with the established contribution of innate immune activation to PE pathophysiology. Previous studies have similarly found that neutrophil activation is a key player in immune responses in PE and hypertensive disorders of pregnancy, indicating a potential link to the vascular dysfunction that characterizes the disease (34). Network-based analysis using WGCNA further identified neutrophil-related gene modules tightly correlated with disease status. Subsequent machine learning–based feature selection (LASSO and SVM algorithms) narrowed this list to five candidate genes with strong discriminatory potential. Among these, TCL1A, CLEC2B, and LGALS9 were consistently highlighted across multiple analytic layers, underscoring their robust association with PE. Moreover, Previous mechanistic reports on TCL1A, CLEC2B, and LGALS9 support their roles in immune regulation, particularly in inflammatory responses, highlighting their potential as disease-relevant biomarkers and providing mechanistic entry points for future functional studies (35, 36).
Mapping the expression of candidate genes to specific placental cell types enabled us to explore how systemic molecular changes may relate to local pathophysiological processes in PE. The cell-type–specific distribution of TCL1A, CLEC2B, and LGALS9 suggests that distinct immune and stromal populations within the placenta contribute differentially to disease development. TCL1A, expressed exclusively in B cells, highlights the potential involvement of adaptive immune perturbation in placental dysfunction. CLEC2B, enriched in natural killer (NK) cells and monocytes, points to excessive cytotoxic signaling and innate immune activation—factors known to impair trophoblast invasion and spiral artery remodeling (37). LGALS9, expressed in Hofbauer cells and monocytes, may participate in modulating maternal–fetal immune tolerance via immune checkpoint pathways. These findings provide a mechanistic link between immune dysregulation observed in peripheral blood and alterations in the immune microenvironment of the placenta.
The convergence of systemic transcriptional dysregulation with cell-type–resolved functional engagement underscores the translational potential of the identified genes. TCL1A, CLEC2B, and LGALS9 not only exhibited measurable expression changes in peripheral blood but also mapped to immunologically relevant placental cell types, linking maternal signals with tissue-level dysfunction (35, 36). Their association with immune activation, disruption of immune tolerance, and angiogenic pathways strengthens their candidacy as early biomarkers for PE risk assessment. Importantly, the presence of these signals in maternal blood prior to clinical diagnosis suggests that they may serve as accessible indicators of subclinical placental stress, offering opportunities for timely risk stratification and intervention. These findings are consistent with existing literature on early biomarkers for PE, further supporting the utility of immune-related molecules as potential predictive markers in hypertensive disorders of pregnancy.
However, it is important to acknowledge the limitations of this study arising from the biological and clinical heterogeneity of the high-risk cohort. While this diversity enhances the clinical applicability of the study, it also introduces variability that could influence the molecular characteristics identified. Different risk factors may activate distinct pathogenic mechanisms, which may extend beyond immune dysregulation alone. This heterogeneity could impact the ability to detect consistent molecular markers across the entire cohort, particularly in cases where certain risk factors—such as vascular dysfunction or autoimmune activation—might dominate the pathogenesis of PE.
In addition, this study primarily included early-onset preeclampsia cases, a clinically and biologically distinct subtype characterized by more pronounced placental insufficiency and unique immune activation patterns (38). Focusing on early-onset cases provides mechanistic insight into this severe phenotype, and the findings help elucidate immune alterations that may precede or accompany placental dysfunction. While we have acknowledged this heterogeneity as a limitation, future studies that include larger cohorts and explore the potential impact of specific risk factors or subgroups will help refine our understanding of the molecular features of PE.
In summary, this study delineates a multi-layered framework for understanding PE through the integration of bulk transcriptomic profiling, regulatory network inference, and single-cell validation. By identifying three robust candidate genes—TCL1A, CLEC2B, and LGALS9—with consistent associations across systemic and placental compartments, we provide mechanistic insight into the immunological perturbations that drive PE and propose biologically plausible molecular targets for early detection. These findings illustrate the power of combining multi-omics data to uncover clinically relevant markers in complex pregnancy-related disorders.
Data availability statement
The datasets used and analyzed during this study are available from the corresponding author upon reasonable request. The raw sequencing data and processed gene expression data have been deposited in the Gene Expression Omnibus (GEO) database: placental samples from PE patients and controls are available under accession numbers GSE282038, GSE267340 and GSE298119. The peripheral blood transcriptomic data are available under accession number GSE296973.
Ethics statement
The studies involving humans were approved by the Institutional Ethics Committee of the First Hospital of Jilin University. The studies were conducted in accordance with the local legislation and institutional requirements. The participants provided their written informed consent to participate in this study.
Author contributions
SZ: Conceptualization, Writing – original draft, Writing – review & editing. PX: Writing – review & editing. HS: Writing – review & editing. CS: Funding acquisition, Writing – review & editing.
Funding
The authors declare financial support was received for the research, and/or publication of this article. This research was funded by Wu Jieping Medical Foundation (grant number 320.6750.2021-06-32), Finance Department of Jilin Province, China (grant number JLSCZD2019-053), Natural Science Funds in Science and Technology Department of Jilin Province, China (grant number 20210101295JC), Open Project of Key Laboratory of Organ Regeneration and Transplantation, Ministry of Education (grant number 2020JC07), and Zhongguancun Precision Medicine Foundation (grant number 2024J2YX05810).
Conflict of interest
The authors declare that the research was conducted in the absence of any commercial or financial relationships that could be construed as a potential conflict of interest.
Generative AI statement
The authors declare that no Generative AI was used in the creation of this manuscript.
Any alternative text (alt text) provided alongside figures in this article has been generated by Frontiers with the support of artificial intelligence and reasonable efforts have been made to ensure accuracy, including review by the authors wherever possible. If you identify any issues, please contact us.
Publisher’s note
All claims expressed in this article are solely those of the authors and do not necessarily represent those of their affiliated organizations, or those of the publisher, the editors and the reviewers. Any product that may be evaluated in this article, or claim that may be made by its manufacturer, is not guaranteed or endorsed by the publisher.
Supplementary material
The Supplementary Material for this article can be found online at: https://www.frontiersin.org/articles/10.3389/fimmu.2025.1638603/full#supplementary-material
Abbreviations
PE, Preeclampsia; RNA-seq, Bulk RNA sequencing; scRNA-seq, single-cell RNA sequencing; BMI, Body Mass Index; GO, Gene Ontology; DEGs, Differentially Expressed Genes; UMAP, Uniform Manifold Approximation and Projection; Tregs, regulatory T cells; SCT, Syncytiotrophoblast; VCT, Villous Cytotrophoblast; EVT, Extravillous Trophoblast; NK cells, Natural Killer cells; LASSO, Least Absolute Shrinkage and Selection Operator; SVM, Support Vector Machine; GSEA, Gene Set Enrichment Analysis; KEGG, Kyoto Encyclopedia of Genes and Genomes.
References
1. Aneman I, Pienaar D, Suvakov S, Simic TP, Garovic VD, and McClements L. Mechanisms of key innate immune cells in early- and late-onset preeclampsia. Front Immunol. (2020) 11:1864. doi: 10.3389/fimmu.2020.01864
2. Gestational hypertension and preeclampsia: acog practice bulletin, number 222. Obstetrics Gynecol. (2020) 135:e237–e60. doi: 10.1097/aog.0000000000003891
3. Bakrania BA, Spradley FT, Drummond HA, LaMarca B, Ryan MJ, and Granger JP. Preeclampsia: linking placental ischemia with maternal endothelial and vascular dysfunction. Compr Physiol. (2020) . p:1315–49. doi: 10.1002/cphy.c200008
4. Alanazi AS, Victor F, Rehman K, Khan YH, Yunusa I, Alzarea AI, et al. Pre-existing diabetes mellitus, hypertension and kidneydisease as risk factors of pre-eclampsia: A disease of theories and its association with genetic polymorphism. Int J Environ Res Public Health. (2022) 19:16690. doi: 10.3390/ijerph192416690
5. Boucas AP, de Souza BM, Bauer AC, and Crispim D. Role of innate immunity in preeclampsia: A systematic review. Reprod Sci. (2017) 24:1362–70. doi: 10.1177/1933719117691144
6. Xue P, Zheng M, Gong P, Lin C, Zhou J, Li Y, et al. Single administration of ultra-low-dose lipopolysaccharide in rat early pregnancy induces tlr4 activation in the placenta contributing to preeclampsia. PloS One. (2015) 10:e0124001. doi: 10.1371/journal.pone.0124001
7. Aberdeen GW, Babischkin JS, Lindner JR, Pepe GJ, and Albrecht ED. Placental sflt-1 gene delivery in early primate pregnancy suppresses uterine spiral artery remodeling. Endocrinology. (2022) 163(4):bqac012. doi: 10.1210/endocr/bqac012
8. Staff AC, Fjeldstad HE, Fosheim IK, Moe K, Turowski G, Johnsen GM, et al. Failure of physiological transformation and spiral artery atherosis: their roles in preeclampsia. Am J Obstetrics Gynecol. (2022) 226:S895–906. doi: 10.1016/j.ajog.2020.09.026
9. Qu H and Khalil RA. Vascular mechanisms and molecular targets in hypertensive pregnancy and preeclampsia. Am J Physiology-Heart Circulatory Physiol. (2020) 319:H661–H81. doi: 10.1152/ajpheart.00202.2020
10. Staff AC. The two-stage placental model of preeclampsia: an update. J Reprod Immunol. (2019) 134-135:1–10. doi: 10.1016/j.jri.2019.07.004
11. Gathiram P and Moodley J. The role of the renin-angiotensin-aldosterone system in preeclampsia: A review. Curr Hypertension Rep. (2020) 22:89. doi: 10.1007/s11906-020-01098-2
12. Miller D, Motomura K, Galaz J, Gershater M, Lee ED, Romero R, et al. Cellular immune responses in the pathophysiology of preeclampsia. J Leukocyte Biol. (2021) 111:237–60. doi: 10.1002/jlb.5ru1120-787rr
13. Guo F, Zhang B, Yang H, Fu Y, Wang Y, Huang J, et al. Systemic transcriptome comparison between early- and late-onset pre-eclampsia shows distinct pathology and novel biomarkers. Cell Proliferation. (2021) 54:e12968. doi: 10.1111/cpr.12968
14. Chen Z, Wen Z, Mengying W, Haixia H, Li Z, and Luo Q. Pathogenic mechanisms of preeclampsia with severe features implied by the plasma exosomal mirna profile. Bioengineered. (2021) 12:9140–9. doi: 10.1080/21655979.2021.1993717
15. Campbell KA, Colacino JA, Puttabyatappa M, Dou JF, Elkin ER, Hammoud SS, et al. Placental cell type deconvolution reveals that cell proportions drive preeclampsia gene expression differences. Commun Biol. (2023) 6:264. doi: 10.1038/s42003-023-04623-6
16. Zhou Z and Yang X. An update review of the application of single-cell rna sequencing in pregnancy-related diseases. Front Endocrinol. (2024) 15:1415173. doi: 10.3389/fendo.2024.1415173
17. Zhou W, Wang H, Yang Y, Guo F, Yu B, and Su Z. Trophoblast cell subtypes and dysfunction in the placenta of individuals with preeclampsia revealed by single-cell rna sequencing. Molecules Cells. (2022) 45:317–28. doi: 10.14348/molcells.2021.0211
18. Luo F, Liu F, Guo Y, Xu W, Li Y, Yi J, et al. Single-cell profiling reveals immune disturbances landscape and hla-F-mediated immune tolerance at the maternal-fetal interface in preeclampsia. Front Immunol. (2023) 14:1234577. doi: 10.3389/fimmu.2023.1234577
19. Than NG, Posta M, Györffy D, Orosz L, Orosz G, Rossi SW, et al. Early pathways, biomarkers, and four distinct molecular subclasses of preeclampsia: the intersection of clinical, pathological, and high-dimensional biology studies. Placenta. (2022) 125:10–9. doi: 10.1016/j.placenta.2022.03.009
20. Lu J, Sun Y, Cao Y, and Zhang Y. Small rna sequencing reveals placenta-derived exosomal micrornas associated with preeclampsia. J Hypertension. (2022) 40(5):1030–41. doi: 10.1097/HJH.0000000000003112
21. Law CW, Chen Y, Shi W, and Smyth GK. Voom: precision weights unlock linear model analysis tools for rna-seq read counts. Genome Biol. (2014) 15:R29. doi: 10.1186/gb-2014-15-2-r29
22. Langfelder P and Horvath S. Fast R functions for robust correlations and hierarchical clustering. J Stat Software. (2012) 46:1–17. doi: 10.18637/jss.v046.i11
23. Bai Q, Liu H, Guo H, Lin H, Song X, Jin Y, et al. Identification of hub genes associated with development and microenvironment of hepatocellular carcinoma by weighted gene co-expression network analysis and differential gene expression analysis. Front Genet. (2020) 11:615308. doi: 10.3389/fgene.2020.615308
24. Zhou Y, Zhou B, Pache L, Chang M, Khodabakhshi AH, Tanaseichuk O, et al. Metascape provides a biologist-oriented resource for the analysis of systems-level datasets. Nat Commun. (2019) 10:1523. doi: 10.1038/s41467-019-09234-6
25. Huang X, Zhang L, Wang B, Li F, and Zhang Z. Feature clustering based support vector machine recursive feature elimination for gene selection. Appl Intell. (2018) 48:594–607. doi: 10.1007/s10489-017-0992-2
26. Zhang Q, Liu Y, Wang X, Zhang C, Hou M, and Liu Y. Integration of single-cell rna sequencing and bulk rna transcriptome sequencing reveals a heterogeneous immune landscape and pivotal cell subpopulations associated with colorectal cancer prognosis. Front Immunol. (2023) 14:1184167. doi: 10.3389/fimmu.2023.1184167
27. Wedenoja S, Yoshihara M, Teder H, Sariola H, Gissler M, Katayama S, et al. Fetal hla-G mediated immune tolerance and interferon response in preeclampsia. eBioMedicine. (2020) 59:102872. doi: 10.1016/j.ebiom.2020.102872
28. Deer E, Herrock O, Campbell N, Cornelius D, Fitzgerald S, Amaral LM, et al. The role of immune cells and mediators in preeclampsia. Nat Rev Nephrol. (2023) 19:257–70. doi: 10.1038/s41581-022-00670-0
29. Li J, Wang X, Markwell S, Carneiro-Lobo T, Olson C, Shih L-K, et al. Tmic-21. The role of clec5a on M2-like tumor-associated macrophages polarization and disease progression in glioblastoma. Neuro-Oncology. (2022) 24:vii275–vii6. doi: 10.1093/neuonc/noac209.1065
30. Maity PC, Bilal M, Koning MT, Young M, van Bergen CAM, Renna V, et al. Iglv3-21*01 is an inherited risk factor for cll through the acquisition of a single-point mutation enabling autonomous bcr signaling. Proc Natl Acad Sci. (2020) 117:4320–7. doi: 10.1073/pnas.1913810117
31. Thomas JR, Appios A, Zhao X, Dutkiewicz R, Donde M, Lee CYC, et al. Phenotypic and functional characterization of first-trimester human placental macrophages, hofbauer cells. J Exp Med. (2020) 218(1):e20200891. doi: 10.1084/jem.20200891
32. Mittelberger J, Seefried M, Löb S, Kuhn C, Franitza M, Garrido F, et al. The expression of tim-3 and gal-9 on macrophages and hofbauer cells in the placenta of preeclampsia patients. J Reprod Immunol. (2024) 164:104296. doi: 10.1016/j.jri.2024.104296
33. Hsu P and Nanan RK. Innate and adaptive immune interactions at the fetal–maternal interface in healthy human pregnancy and pre-eclampsia. Front Immunol. (2014) 5:125. doi: 10.3389/fimmu.2014.00125
34. Wang Y, Gu Y, Alexander JS, and Lewis DF. Preeclampsia status controls interleukin-6 and soluble il-6 receptor release from neutrophils and endothelial cells: relevance to increased inflammatory responses. Pathophysiology. (2021) 28:202–11. doi: 10.3390/pathophysiology28020013
35. Asselbergs Folkert W, Pai Jennifer K, Rexrode Kathryn M, Hunter David J, and Rimm Eric B. Effects of lymphotoxin-α Gene and galectin-2 gene polymorphisms on inflammatory biomarkers, cellular adhesion molecules and risk of coronary heart disease. Clin Sci. (2007) 112:291–8. doi: 10.1042/cs20060200
36. Niu M, Yuan J, Yan M, Yang G, Yan Z, and Yang X. Discovery of clec2b as a diagnostic biomarker and screening of celastrol as a candidate drug for psoriatic arthritis through bioinformatics analysis. J Orthopaedic Surg Res. (2023) 18:390. doi: 10.1186/s13018-023-03843-0
37. Wei X-W, Zhang Y-C, Wu F, Tian F-J, and Lin Y. The role of extravillous trophoblasts and uterine nk cells in vascular remodeling during pregnancy. Front Immunol. (2022) 13:951482. doi: 10.3389/fimmu.2022.951482
Keywords: preeclampsia, biomarkers, immune dysregulation, single-cell RNA sequencing, transcriptome profiling, placenta, peripheral blood
Citation: Zheng S, Xu P, Shen H and Shu C (2025) Immune dysregulation in preeclampsia: integrative analysis of peripheral transcriptomes and placental single-cell land-scapes. Front. Immunol. 16:1638603. doi: 10.3389/fimmu.2025.1638603
Received: 31 May 2025; Accepted: 07 August 2025;
Published: 01 December 2025.
Edited by:
Simona W Rossi, University of Basel, SwitzerlandReviewed by:
Wenbo Zhou, Changzhou Maternal and Child Health Care Hospital, ChinaFu Min, Peking University, China
Copyright © 2025 Zheng, Xu, Shen and Shu. This is an open-access article distributed under the terms of the Creative Commons Attribution License (CC BY). The use, distribution or reproduction in other forums is permitted, provided the original author(s) and the copyright owner(s) are credited and that the original publication in this journal is cited, in accordance with accepted academic practice. No use, distribution or reproduction is permitted which does not comply with these terms.
*Correspondence: Chang Shu, c2h1X2NoYW5nQGpsdS5lZHUuY24=