 Iakov A. Lyashenko
 Roman Pohrt
- 1Department of System Dynamics and Friction Physics, Technische Universität Berlin, Berlin, Germany
- 2Department of Applied Mathematics and Complex Systems Modelling, Sumy State University, Sumy, Ukraine
We report a series of experiments on the indentation of steel indenters into a soft layer of transparent rubber with relatively high adhesion. The roughness properties of the steel indenters are varied by undergoing preparation using sandpaper with different grain sizes. Starting from a smooth surface, additional roughness increases the adhesive strength up to a critical roughness value, after which it significantly decreases. Furthermore, we look at the evolution of the contact area during slow indentation and detachment. It was found that, during indentation, the contact area changes more sharply compared to detachment (pull-off).
Introduction
Roughness plays a significant role for the adhesive strength of contacts between materials. The roughness of many surfaces in nature is of the fractal type (Persson, 2014). When such surfaces approach one another, the highest asperities are first to come into contact. For hard materials, such as metals or rocks, the load is then carried by a few peaks alone. As a result, the real contact area is much smaller than the apparent contact area (Persson, 2006). Because adhesive interactions are extremely short-ranged, they effectively only act in the vicinity of real contact patches. For that reason, the observed adhesion force between hard objects is very small even at high values of surface energy. When at least one of the materials is very soft, like rubber, and the roughness is not too high, a much larger real contact area can be realized, with the rubber partially filling the gaps between roughness peaks. When compared to a perfectly smooth surface, one with mild roughness was shown to increase the adhesive toughness. This can be explained by the increased effective surface in contact or by the instability of the detachment process, when roughness peaks effectively hinder the advancing of the detachment front. In Guduru (2007), this was evidenced by choosing a special roughness in the form of axisymmetric waviness on the indenter surface. Indeed during detachment, multiple stable configurations of the contact succeed one another. The load–displacement curve is not monotonous and not continuous (Guduru, 2007; Jin et al., 2013). A similar effect can be observed when otherwise flat surfaces are equipped with shallow dimples. Introducing a moderate superposed roughness here can affect the total adhesive strength in both positive and negative ways (Papangelo and Ciavarella, 2017, 2018).
The existence of an adhesive enhancement for moderate roughness leads to the conclusion that there should be optimal surfaces with roughness properties, at which the adhesive strength of the contact has the highest value. Due to the importance of rough contacts for industry and daily life, there are many works done by different scientific groups with investigations of the particularities of contact between rough surfaces in the presence of adhesion. There are different experiments (Benz et al., 2006; Tiwari et al., 2017; Liu et al., 2018; Sahli et al., 2019), theories (Johnson, 1995; Persson, 2006; Persson and Scaraggi, 2014; Ciavarella, 2015; Papangelo et al., 2019), as well as computer simulations (Pastewka and Robbins, 2014; Rey et al., 2017; Li et al., 2019). A short historical review of the development of adhesion theories can be found in Popova and Popov (2018). The majority of theories for rough contacts are based on JKR-type adhesion interaction model (Johnson et al., 1971). For smooth spherical contacts, the JKR model predicts the dependency of the normal force FN on the indentation depth d to be a single universal curve, independently from whether the motion takes place in the direction of approach or detachment. In reality, an adhesive hysteresis (Deng and Kesari, 2019) is typically observed. This hysteresis leads to energy dissipation in any indentation–detachment cycle.
In the present paper, we experimentally investigate the behavior at indentation and at detachment of spherical surfaces with different parameters of roughness.
Probe Preparation
In our experiments, we used spherical steel indenters with radius R = 30, 40, 50, and 100 mm. With each indenter, we conducted 12 experiments with different roughness values of its surface. The roughness was changed with sandpaper Matador with different grit numbers, which correspond to the different sizes of grains. For the first experiments, the surfaces were prepared using P2000 sandpaper and had almost mirror-like properties. After processing with sandpaper, the indenter was cleaned in the chemical solution EMAG EM-404 for 16 min, using the ultrasonic cleaner Codyson CD-4800, before going into the adhesion experiment.
After each experiment, we measured the 3D topography of the indenter surface using a KEYENCE VK-100 series microscope, at ×10 magnification. We measured 200–300 single images separately, with size of 1,398 mm × 1,048 mm each. These parts had resolution of 1,024 × 768, with fixed horizontal distance between points Δx = Δy = 1,365 nm. To exclude the macroscopic curvature in our roughness characterization, we subtracted from each part a polynomial shape of power four, which we obtained by the least square method. Figure 1 depicts a typical view of the measured inclined surface (left panel) and after substraction of the polynomial shape (right panel).
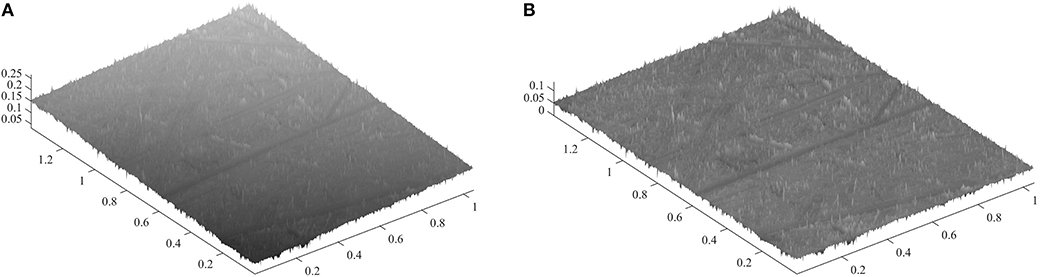
Figure 1. Indenter surface processed with sandpaper P40 (A) as from microscope measurement and (B) after substraction of a polynomial shape to eliminate macroscopic curvature. Values on all axes are in millimeters.
After completion of the experiments for one roughness value, we used the next sandpaper with bigger corn size and repeated the same for all sandpapers listed in Table 1. After the last sandpaper P40 treatment, we conducted two additional experiments with even greater roughness. This was obtained by manual treatment with a hacksaw and the subsequent removal of some features. (“P0” refers to the hacksaw surface; “P0+180” is for additional processing of indenter P0 after experiment with sandpaper P180).

Table 1. Average size of the grains of sandpaper according to standard ISO-6344.
Experimental Setup
The freshly prepared indenter is pushed into the rubber base to a maximal indentation depth of 0.4 mm (0.3 mm for R = 100 mm). Then, it is pulled off until full detachment, when complete vanishing of the contact is realized. The rubber base consists of a 5-mm-thick layer of optically smooth, clear rubber TARNAC CRG N3005, located on a surface of silicate glass. No special measures were taken to fixate the rubber to the glass due to its good adhesive properties. Throughout the experiment, the contact was observed from below with a digital camera [see Figure 2A (pos. 8)]. The indenters were moved in normal direction with linear actuator PI M-403.2DG (pos. 1 in Figure 2A), controlled by controller PI C-863 (pos. 7). The experiments were done with distance control, not force control, and a constant velocity of v = 1 μm/s was used in all the experiments. The normal force was measured by the force sensor ME K3D40 (pos. 3) with amplifier GSV-1A4 SubD37/2, which was connected to a PC with 16-bit NI USB-6211 analog to a digital converter. While the rubber layer can be tilted in two horizontal axis (with tilting mechanism on pos. 5) for use in flat-indenter experiments (Popov et al., 2017), such adjustments were not necessary for the current investigation with spheres. All measurements and saving of the obtained displacement, normal force, and contact area were done within a LabVIEW computer program.
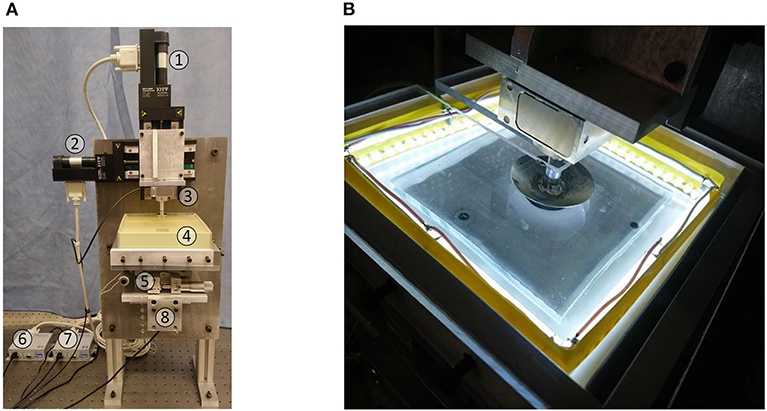
Figure 2. Photograph of the experimental device: (A) entire device and (B) contact zone between steel indenter and 5-mm-thick layer of transparent rubber located on the glass plate.
The lighting of the contact area was realized using 80 LEDs, which illuminated the contact zone from all four sides (see Figure 2B). Because the light enters the rubber at a low angle, a good contrast between contact and non-contact zones is visible in the camera image. We employed a computer algorithm based on differences in pixel intensity to differentiate the two. Even though from the analysis of the digital pictures we technically obtained the visible contact area, we assume that it represents the real contact area with reasonable accuracy.
While the experimental equipment is capable of investigating contact phenomena in the presence of tangential motion (see 2nd linear stage in Figure 2A, pos. 2 and 6), this capacity was not used in the current work.
We investigated the situation with a very slow vertical indenter velocity v = 1 μm/s. This was done to best achieve a quasi-static situation and allowed to use theories for static contacts (Hertz, JKR) to describe the contact properties. For faster motion, the velocity affects the obtained results critically, for instance, via viscoelastic properties. The effect of different velocities was investigated in Waters and Guduru (2010) for tangential contact and in Lyashenko and Popov (2019) for the setup covered in this paper.
Experimental Results
Adhesive Strength
After preparation of the indenter for each roughness, we did three cycles of indentation in a series, without cleaning or changing the indenter properties between these cycles.
During each cycle, a series of digital images was recorded. In Figure 3, sample pictures of the contact area at different roughness of the indenter are shown.
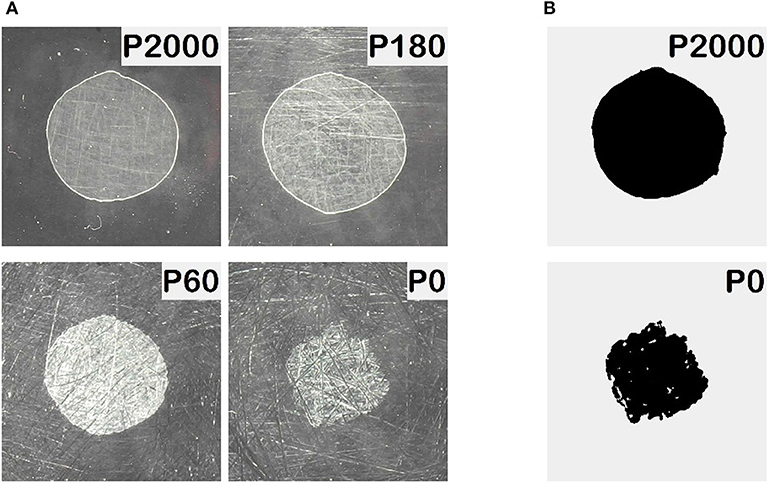
Figure 3. (A) Pictures of the contact area at different roughness of indenter with radius R = 100 mm and zero indentation depth d = 0 mm during phase of detachment. (B) Visible contact area as determined by the computer program.
For each experiment, the dependencies of the normal force FN and contact area A on the indentation depth d followed the general behavior as shown in Figure 4. The blue curves with negative values of the indentation depth and normal force correspond to the detachment process (pull-off). At this phase, adhesion plays a significant role; otherwise, FN < 0 cannot be observed. The absolute value of minimal force FN is called adhesion strength of the contact. In a force-controlled experiment, this value would have to be exceeded in order to separate the surfaces (Johnson et al., 1971).
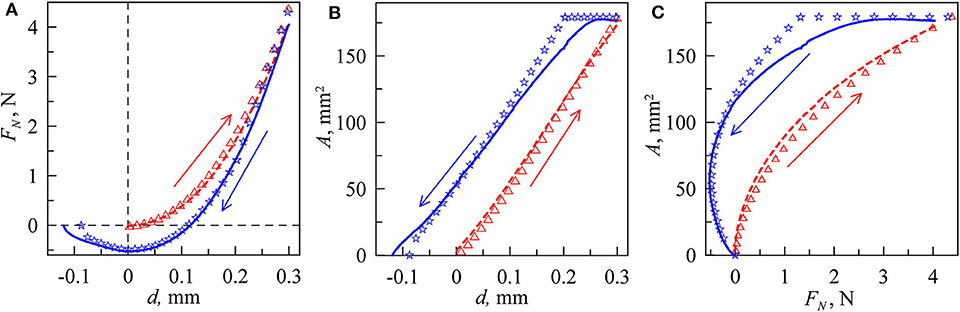
Figure 4. General behavior of main macroscopic parameters during indentation (dashed red lines) and pull-off (solid blue lines): (A) dependence of normal force FN vs. indentation depth d, (B) dependence of contact area A vs. indentation depth d, (C) dependence of contact area A vs. normal force FN. These dependencies were obtained in real experiment in the case of P2000 for the indenter of the radius R = 100 mm. With symbols, the results of the computer simulation are shown: triangles for absence of adhesive interaction γ12 = 0 J/m2 and stars for the value γ12 = 0.9 J/m2.
During indentation (dashed red lines), the normal force FN has practically only positive values because the influence of adhesion at indentation is very weak. This phase can thus be approximated by the Hertz contact theory (Hertz, 1881) and the normal force can thus be calculated with the well-known formula FN = 4E*a3/(3R). Here a = (Rd)1/2 is the contact radius, R is the radius of spherical indenter, E* = E/(1–ν2) is the reduced value of elastic modulus, E is the elastic modulus, and ν is the Poisson ratio. However, these formulas are correct only in half-space approximation. In our experiments, we used a rubber layer with thickness h = 5 mm. Therefore, the normal force is always higher compared to the half-space solution. It is necessary to do additional simulations to obtain the correct dependencies FN(d). We did such simulations in the framework of boundary elements method (BEM) for layered systems (Li et al., 2020) based on JKR-type interaction between contacted bodies. For our rubber material, we assumed Poisson ratio ν = 0.47 (near ratio 0.5 for incompressible elastomers). From a comparison between the experimental results and the theory for different cylindrical and spherical indenters, we have found the approximate value of the rubber elastic modulus to be E ≈ 0.324·106 Pa (Lyashenko and Popov, 2019). Our experiments show that, during the indentation phase, adhesion does not play a significant role, and in the point of the first contact, the contact area barely spreads. The normal force FN shows small negative values near zero at the beginning of the indentation phase. In all plots in Figure 4, the results of BEM simulations are shown by triangles. In these simulations, the value of specific work of adhesion γ12 was set to zero during indentation, so the contact shown is effectively adhesionless. What remains is the Hertz contact, but generalized to the situation of a finite elastic layer. From this figure, it can be seen that a fairly good coincidence between simulations and experiment results is realized. In the phase of detachment, we approximated the experimental results with the curve, obtained in BEM simulations with the value γ12 = 0.9 J/m2. These results are shown in Figure 4A with stars. The situation of indentation without adhesion and detachment with adhesion is similar to the case presented in Figure 3 in Ciavarella et al. (2019). When the direction of motion is changed from indentation to pull-out, the contact area remains constant for some time, similar to what was observed in Waters and Guduru (2010). Such type of experimental behavior can be explained within the framework of the approach of “chemical heterogeneity” of the contact area (Popov, 2020).
In Figure 5, the dependencies of normal force FN vs. indentation depth d for indenters with different roughness are shown (see also Supplementary Video 1). As can be seen, all curves show a similar behavior in the indentation phase, but not in the detachment phase. Some curves at the indentation phase decline from universal behavior, for example, curves P0 and P0 + 180 for the case of indenter R = 50 mm. Since we set d = 0 at the point of the first contact, this corresponds only to the contact of the highest roughness peaks at a large roughness amplitude. For the detachment phase, a simple trend in the dependency on the roughness is not immediately visible. In Figure 6, we show the adhesive strength (absolute value of minimal normal force at phase of detachment) for all indenters as a function of sandpaper number. Please note that the far-right case at −180 corresponds to our “P0 + 180” sample.
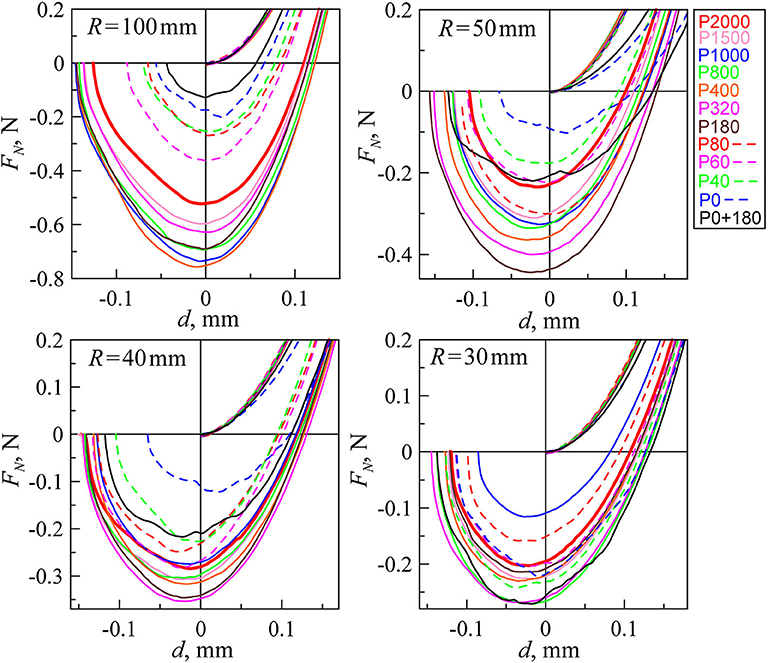
Figure 5. Dependencies of normal force FN vs. indentation depth d for all experiments (only first indentation cycles), with indenters of radii at 100, 50, 40, and 30 mm. Each plot has 12 dependencies for different roughness. The solid red lines in all figures correspond to the situation with smallest roughness P2000.
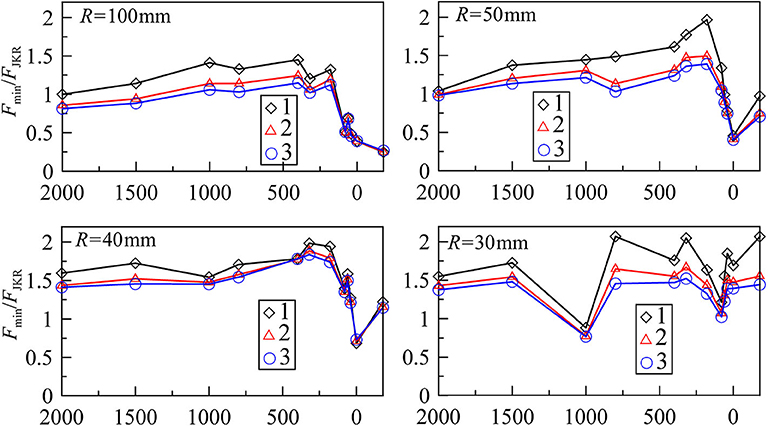
Figure 6. Dependencies of adhesive strength measured in experiments vs. grit number of sandpaper for indenters with radius R = 100, 50, 40, and 30 mm. The symbols with numbers 1, 2, and 3 in the figure are first (diamonds), second (triangles), and third (circles) cycles of indentation.
In Figure 6, we show the normalized values of normal forces Fmin/FJKR. In the case of the half-space, JKR theory gives the value of minimal adhesive force with the simple formula FJKR = −3πRγ12/2, and for the cases R = 100, 50, 40, and 30 mm, we obtained the critical forces FJKR = −0.424, −0.212, −0.170, and −0.127 N, respectively. To find these values, we used surface energy γ12 = 0.9 J/m2 (see Figure 4 and the explanation of this figure). However, we did all experiments with the rubber layer of thickness h = 5 mm, so we need to obtain proper values of critical forces directly from BEM modeling (for the case R = 100 mm, the results of modeling are shown in Figure 4). In modeling, we obtained other critical values of the forces −0.522, −0.226, −0.178, and −0.131, in comparison with half-space results. In all situations under consideration, the adhesive strength was bigger in the case of the layer. As can be seen, with a decrease of the indenter radius R, the difference between results for half-space and layers decreases also because when the thickness of the layer is much bigger than the indenter radius, we are in the limit of half-space approximation. The values of Fmin in Figure 6 were found directly from the experiment (see Figure 5). With the exception of R = 30 mm, it can be seen from Figures 5, 6 that an increase in the roughness first leads to increased adhesive strength. At big roughness values, the adhesion strength significantly decreases. Consequently, there must be an optimal value of roughness, at which the adhesive strength takes maximal values. In our case, the greatest adhesive strength corresponds to processing of the surface with sandpaper around P320. In Figure 6, for the cases R = 100 mm and R = 50 mm, the normalized strength for P2000 corresponds to the value Fmin/FJKR ≈ 1, but for another 40 and 30 mm, it is Fmin/FJKR ≈ 1.5 for the cases of flat surfaces with roughness of P2000. It happens because surface energy γ12 can significantly vary in value in different experiments. Surface energy is a function of the contact duration, temperature, surface chemical composition, and so on. However, we used the same value of surface energy to find the FJKR for all experiments. Because of this, we observe such deviations.
Comparing the different repetitions of the experiment, we found that the strength of the contact has maximal values at first detachment and is slightly reduced at the next contact cycles. We assume that this is due to the freshly cleaned surface of the indenter. In the subsequent indentations, the indenter surface may already contain traces of rubber, and surface energy is potentially decreased. Also note that our indenter with radius R = 30 mm did not show a very clear dependence of adhesive strength vs. roughness (see Figure 6). We assume that this is due to the very small contact area at this radius. Here individual stochastic particularities in the center of the indenter determine the adhesive strength.
Figure 7 shows the calculated values of energy dissipation ΔE during the indentation cycle for all situations as a function of sandpaper number. These dependencies are similar to Figure 6: with an increase of adhesive strength, dissipation also increases. This is to be expected since an increase of the adhesive strength leads to the growth of the hysteresis loop width. Note that the indenter with radius R = 100 mm had an indentation depth of d = 0.3 mm, while it was 0.4 mm in all other cases.
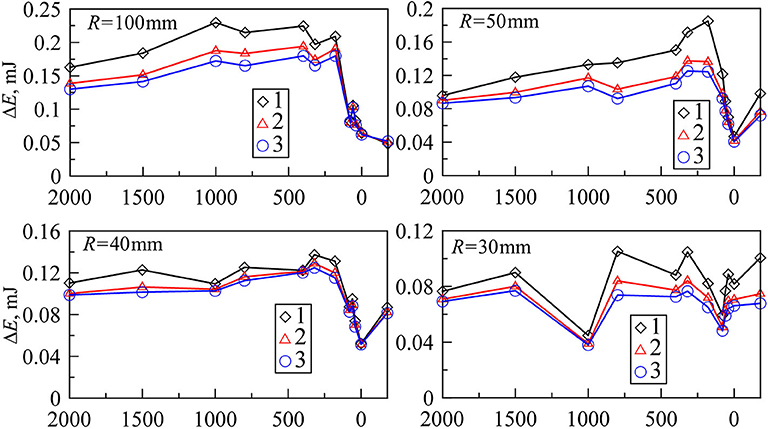
Figure 7. Dependencies of energy dissipation ΔE (mJ) due to adhesion in the full cycle of indentation vs. grit number of the sandpaper for indenters with radius R = 100, 50, 40, and 30 mm. The symbols with numbers 1, 2, and 3 in the figure are first (diamonds), second (triangles), and third (circles) cycles of indentation.
Surface Topography Measurements
After subtraction of the polynomial approximation of the macroscopic shape, we calculated the power spectra density C(q) of the surface topography in a standard way (Persson, 2014) and averaged this dependency for all sub-areas of the indenter. Figure 8 shows curves C(q) for all indenters.
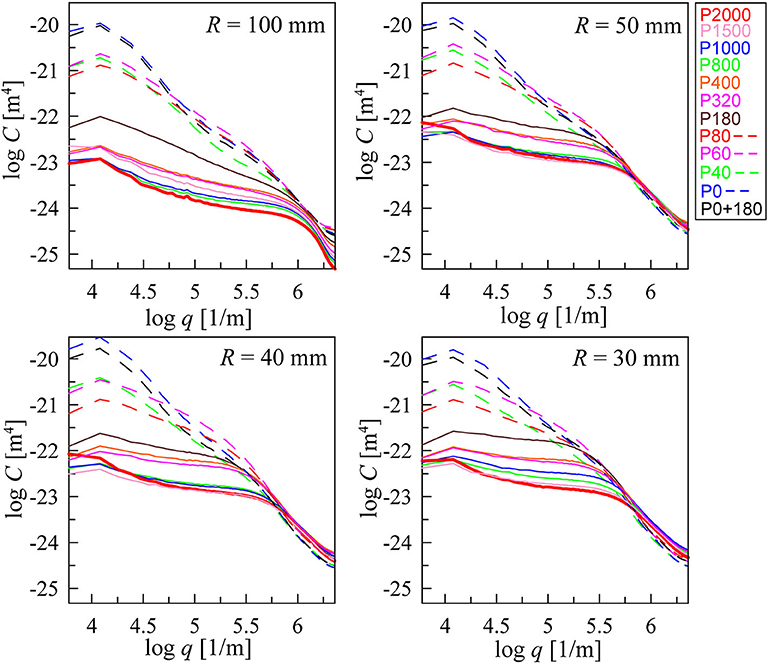
Figure 8. Dependencies of calculated C(q) for all indenters and roughness. The curves with different colors correspond to the curves in Figure 5 with the same colors and line styles (solid and dashed lines). The solid red lines in all figures correspond to the situation with smallest roughness P2000.
Based on C(q), both the averaged root mean square roughness hrms and the averaged slope κ using standard definitions (Persson, 2014) were calculated:
Figure 9 shows these values for all indenters and cases that we studied. In Liashenko and Lyashenko (2020), we described the numerical algorithm for calculating C(q) in detail.
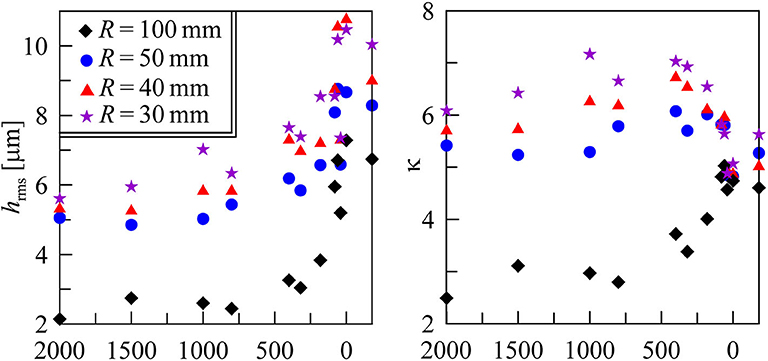
Figure 9. Measured values of hrms and κ for all the cases that we considered, obtained by using C(q). We showed the last value “P0+180” as a negative value “−180” because “P0 + 180” is not a number.
Evolution of the Contact Area
Furthermore, we analyzed the area of contact vs. indentation depth for a different roughness of indenter with radius R = 40 mm because, for this radius, the obtained pictures had the best contrast. We chose to normalize the contact area A with its largest value Amax, which was different for each experiment. The contact areas were monitored for both indentation and detachment phases. The biggest area corresponds to the maximal indentation depth d = 0.4 mm (0.3 mm for R = 100 mm). In Figure 10, the dependencies of the normalized contact area A/Amax vs. indentation depth d are shown. For all curves, a very pronounced hysteresis of the contact area for the two different directions is observed.
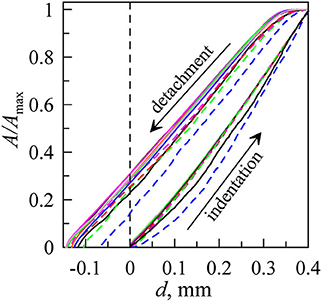
Figure 10. Dependencies of normalized contact area A/Amax vs. indentation depth d at indentation and detachment processes for different types of roughness of indenter with radius R = 40 mm. The lines correspond to the different values of the sandpaper (see Figure 5).
Figure 10 depicts the dependencies for all indenters except P2000 because the mirror-like properties of these surfaces (in the case R = 40 mm) prevented us from using the analysis tool. It can be seen that, during the indentation phase, only the cases P0 (dashed blue lines) and P0 + 180 (black solid lines) deviate from universal behavior. During the detachment phase, P0 has a significantly smaller A/Amax, while the difference is less pronounced for P0 + 180. Note that the case of very large roughness has already shown deviations from universal behavior of the normal force as a function of indentation depth (see Figure 5).
As we noted before, the indentation process is described well by the Hertz theory (Hertz, 1881), where contact radius is a = (Rd)1/2 and contact area A = πa2, therefore A = πRd. We should thus expect to see a clear linear behavior in the A/Amax(d) dependency. However, the two lower curves in Figure 10 at indentation significantly decline from this behavior. This is also expected since the extreme roughness dominates over the spherical shape in small d (Pohrt and Popov, 2013).
Local Stability of Indentation and Detachment
Let us now have a closer look at the way new contact spots appear during indentation and how they are lost during detachment. We investigated the change in the contact area ΔÃ = Δ(A/Amax) for each time step Δt = 1 s, corresponding to Δd = 1 μm. Such dependencies are shown in Figure 11 for small (P1500) and big (P0) roughness. It can be seen that, in these two cases, the contact area increases with the appearance of new areas at the boundary of the contact. For the rougher surface, the new contact areas tend to have significantly bigger sizes, in comparison with the smoother indenter. During detachment, the contact area of P0 decreases much more homogeneously. This can be explained by the local instabilities of asperities (Li et al., 2019; Popov, 2019).
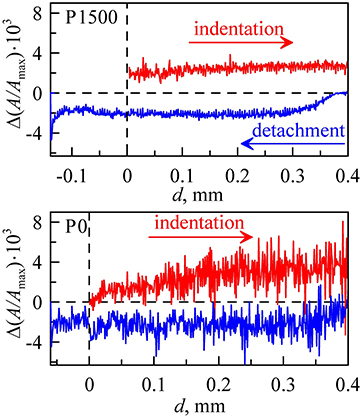
Figure 11. Dependencies of the change in the contact area Δ(A/Amax) vs. indentation depth d at indentation and detachment of indenter R = 40 mm for small (P1500) and big (P0) roughness.
To quantify this, we calculated standard deviation σ = 〈(ΔÃ−〈ΔÃ〉)2〉1/2 in each case. We chose to only look at 0.2 < d < 0.4 for the indentation phase and at 0 < d < 0.2 for detachment. In these regions, ΔÃ only fluctuates around a certain value but has no global trend. For the dependency of σ on the grit number, see Figure 12.
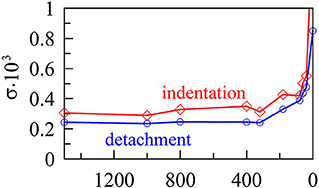
Figure 12. Dependency of the variable σ characterizing the typical jumps in contact area vs. sandpaper grit number for indenter with radius R = 40 mm.
Here we can clearly see that detachment is more homogeneous than indentation for all cases under consideration. Interestingly, the value σ does not change significantly with the grit number of sandpaper, except when this number exceeds a critical value. Starting from approximately P320, σ increases strongly when the grit number is decreased. Please note that this value coincides with the maximum adhesion strength, as shown in Figure 6.
Conclusions
We have tested the adhesive strength of rough steel indenters in contact with soft rubber using different radii and different sandpapers to produce roughness. We found that, in contrast to JKR theory, adhesive hysteresis was always observable. The maximum value of the attractive force (adhesive strength) was found to depend on surface roughness. The increase over a smooth indenter reaches 25% for the case R = 40 mm, 32% for R = 100 mm, and 90% for R = 50 mm, respectively. Observations of the contact area evolution showed that, for rough surfaces, the attachment and the detachment of surface patches happen more abruptly, especially during the indentation phase. When the sandpaper grit number used for surface preparation is below 320, this effect is very pronounced.
Data Availability Statement
The datasets generated for this study are available on request to the corresponding author.
Author Contributions
RP and IL conceived the study and built the experimental setup. IL carried out the experiments. Both authors drafted and reviewed the manuscript.
Funding
We acknowledge the financial support of the Deutsche Forschungsgemeinschaft (DFG PO 810-55-1). We also acknowledge the support by the German Research Foundation and the Open Access Publication Fund of TU Berlin.
Conflict of Interest
The authors declare that the research was conducted in the absence of any commercial or financial relationships that could be construed as a potential conflict of interest.
Acknowledgments
The authors thank Valentin L. Popov for the suggestion of basic ideas, which have been experimentally proven in the paper, as well as for many fruitful discussions.
Supplementary Material
The Supplementary Material for this article can be found online at: https://www.frontiersin.org/articles/10.3389/fmech.2020.00049/full#supplementary-material
Supplementary Video 1. Movies of two experiments for indentation of steel parabolic indenter with radius R = 40 mm in the elastic layer of transparent rubber TARNAC CRG N3005. The velocity of indenter motion for both cases is v = 1 μm/s. Panels from left to right show real pictures of the contact area, dependencies of normal force FN vs. indentation depth d, and dependencies of normalized contact area A/Amax vs. indentation depth d. The three upper panels correspond to indenter with surface processed by sandpaper P1500. The lower three panels correspond to indenter with highest roughness “P0”. In the pictures of contact area, the time of experiment duration in seconds is shown. Three consistent cycles of indentation are shown. For the first cycle, in the case of P1500, the adhesion strength (absolute value of minimal normal force at phase of detachment) FN = 0.307 N is 2.52 times bigger value than in the case P0, where the corresponding value is FN = 0.122 N. For bigger roughness as in P0, the contact disappears earlier than for the case P1500. These two movies correspond to Figure 11 in the article.
References
Benz, M., Rosenberg, K. J., Kramer, E. J., and Israelachvili, J. N. (2006). The deformation and adhesion of randomly rough and patterned surfaces. J. Phys. Chem. B 110, 11884–11893. doi: 10.1021/jp0602880
Ciavarella, M. (2015). Adhesive rough contacts near complete contact. Int. J. Mech. Sci. 104, 104–111. doi: 10.1016/j.ijmecsci.2015.10.005
Ciavarella, M., Joe, J., Papangelo, A., and Barber, J. R. (2019). The role of adhesion in contact mechanics. J. R. Soc. Interface 16, 1–22. doi: 10.1098/rsif.2018.0738
Deng, W., and Kesari, H. (2019). Depth-dependent hysteresis in adhesive elastic contacts at large surface roughness. Sci. Rep. 9:1639. doi: 10.1038/s41598-018-38212-z
Guduru, P. R. (2007). Detachment of a rigid solid from an elastic wavy surface: theory. J. Mech. Phys. Solids 55, 445–472. doi: 10.1016/j.jmps.2006.09.004
Hertz, H. (1881). Über die Berührung fester elastischer Körper. J. Die Reine Angew. Mathem. 92, 156–171. doi: 10.1515/crll.1882.92.156
Jin, F., Guo, X., and Zhang, W. (2013). A unified treatment of axisymmetric adhesive contact on a powerlaw graded elastic halfspace. J. Appl. Mech. 80, 1–9. doi: 10.1115/1.4023980
Johnson, K. L. (1995). The adhesion of two elastic bodies with slightly wavy surfaces. Int. J. Solids Struct. 32, 423–430. doi: 10.1016/0020-7683(94)00111-9
Johnson, K. L., Kendall, K., and Roberts, A. D. (1971). Surface energy and the contact of elastic solids. Proc. Royal Soc. Lond. A 324, 301–313. doi: 10.1098/rspa.1971.0141
Li, Q., Pohrt, R., Lyashenko, I. A., and Popov, V. L. (2020). Boundary element method for nonadhesive and adhesive contacts of a coated elastic half-space. Proc. Inst. Mech. Eng. Part J.-J. Eng. Tribol. 234, 73–83. doi: 10.1177/1350650119854250
Li, Q., Pohrt, R., and Popov, V. L. (2019). Adhesive strength of contacts of rough spheres. Front. Mech. Eng. 5:7. doi: 10.3389/fmech.2019.00007
Liashenko, Z. M., and Lyashenko, I. A. (2020). Influence of spatial inhomogeneity on the formation of chaotic modes at the self-organization process. Ukr. J. Phys. 65, 130–142. doi: 10.15407/ujpe65.2.130
Liu, Z., Lu, H., Zheng, Y., Tao, D., Meng, Y., and Tian, Y. (2018). Transient adhesion in a non-fully detached contact. Sci. Rep. 8:6147. doi: 10.1038/s41598-018-24587-6
Lyashenko, I. A., and Popov, V. L. (2019). Mechanics of adhesive contacts: experiment and theory. AIP Conf. Proc. 2167, 1–4. doi: 10.1063/1.5132068
Papangelo, A., and Ciavarella, M. (2017). A Maugis-Dugdale cohesive solution for adhesion of a surface with a dimple. J. R. Soc. Interface 14, 1–9. doi: 10.1098/rsif.2016.0996
Papangelo, A., and Ciavarella, M. (2018). Adhesion of surfaces with wavy roughness and a shallow depression. Mech. Mater. 118, 11–16. doi: 10.1016/j.mechmat.2017.12.005
Papangelo, A., Scheibert, J., Sahli, R., Pallares, G., and Ciavarella, M. (2019). Shear-induced contact area anisotropy explained by a fracture mechanics model. Phys. Rev. E 99:053005. doi: 10.1103/PhysRevE.99.053005
Pastewka, L., and Robbins, M. O. (2014). Contact between rough surfaces and a criterion for macroscopic adhesion. Proc. Natl. Acad. Sci. U.S.A. 111, 3298–3303. doi: 10.1073/pnas.1320846111
Persson, B. N. J. (2006). On the fractal dimension of rough surfaces. Surf. Sci. Rep. 61, 201–227. doi: 10.1016/j.surfrep.2006.04.001
Persson, B. N. J. (2014). On the fractal dimension of rough surfaces. Tribol. Lett. 54, 99–106. doi: 10.1007/s11249-014-0313-4
Persson, B. N. J., and Scaraggi, M. (2014). Theory of adhesion: role of surface roughness. J. Chem. Phys. 141, 1–14. doi: 10.1063/1.4895789
Pohrt, R., and Popov, V. L. (2013). Contact mechanics of rough spheres: crossover from fractal to Hertzian behavior. Adv. Tribol. 2013:974178. doi: 10.1155/2013/974178
Popov, V. L. (2019). Adhesive contribution to friction. AIP Conf. Proc. 2167:020286. doi: 10.1063/1.5132153
Popov, V. L. (2020). Adhesion hysteresis due to chemical heterogeneity. Preprints. doi: 10.20944/preprints202003.0131.v1
Popov, V. L., Pohrt, R., and Li, Q. (2017). Strength of adhesive contacts: influence of contact geometry and material gradients. Friction 5, 308–325. doi: 10.1007/s40544-017-0177-3
Popova, E., and Popov, V. L. (2018). Note on the history of contact mechanics and friction: interplay of electrostatics, theory of gravitation and elasticity from Coulomb to Johnson–Kendall–Roberts theory of adhesion. Phys. Mesomech. 21, 1–5. doi: 10.1134/S1029959918010010
Rey, V., Anciaux, G., and Molinari, J. -F. (2017). Normal adhesive contact on rough surfaces: efficient algorithm for FFT-based BEM resolution. Comput. Mech. 60, 69–81. doi: 10.1007/s00466-017-1392-5
Sahli, R., Pallares, G., Papangelo, A., Ciavarella, M., Ducottet, C., Ponthus, N., et al. (2019). Shear-induced anisotropy in rough elastomer contact. Phys. Rev. Lett. 122, 1–6. doi: 10.1103/PhysRevLett.122.214301
Tiwari, A., Dorogin, L., Bennett, A. I., Schulze, K. D., Sawyer, W. G., Tahir, M., et al. (2017). The effect of surface roughness and viscoelasticity on rubber adhesion. Soft. Matter 13, 3602–3621. doi: 10.1039/C7SM00177K
Keywords: surface energy, contact area, adhesive contact, indentation experiments, hysteresis, rough surfaces
Citation: Lyashenko IA and Pohrt R (2020) Adhesion Between Rigid Indenter and Soft Rubber Layer: Influence of Roughness. Front. Mech. Eng. 6:49. doi: 10.3389/fmech.2020.00049
Received: 09 March 2020; Accepted: 03 June 2020;
Published: 29 July 2020.
Edited by:
Marco Paggi, IMT School for Advanced Studies Lucca, ItalyReviewed by:
Michele Ciavarella, Politecnico di Bari, ItalyAntonio Papangelo, Politecnico di Bari, Italy
Copyright © 2020 Lyashenko and Pohrt. This is an open-access article distributed under the terms of the Creative Commons Attribution License (CC BY). The use, distribution or reproduction in other forums is permitted, provided the original author(s) and the copyright owner(s) are credited and that the original publication in this journal is cited, in accordance with accepted academic practice. No use, distribution or reproduction is permitted which does not comply with these terms.
*Correspondence: Iakov A. Lyashenko, aS5saWFzaGVua29AdHUtYmVybGluLmRl