 William Chiappim
 Mariana Amorim Fraga
 Homero Santiago Maciel3,4
 Rodrigo Sávio Pessoa
- 1i3N, Departamento de Física, Universidade de Aveiro, Campus Universitário de Santiago, Aveiro, Portugal
- 2Instituto de Ciência e Tecnologia, Universidade Federal de São Paulo, São José dos Campos, Brazil
- 3Instituto Científico e Tecnológico, Universidade Brasil, São Paulo, Brazil
- 4Laboratório de Plasmas e Processos (LPP), Instituto Tecnológico de Aeronáutica (ITA), São José dos Campos, Brazil
In this paper, theoretical and experimental approaches were used to evaluate the impact of the precursor's pulse time on the growth per cycle and the crystallinity quality of atomic layer deposited TiO2 thin films on Si(100) and FTO substrates. We employ a general model that can be applied to both metal and oxidant precursors, based on the Maxwell-Boltzmann velocity distribution from which the molecular flux of gases that collide with the substrate is deduced to adjust the experimental characteristics of growth per cycle vs. pulse time. This model allowed us to adjust the growth per cycle of TiO2 films produced by thermal atomic layer deposition and by plasma-enhanced atomic layer deposition under different deposition parameters and substrates. The influence of growth per cycle on the chemical and structural properties of TiO2 thin films was evaluated by Rutherford backscattering spectroscopy, grazing incidence x-ray diffraction, and ellipsometry techniques. In thermal mode, using H2O as an oxidant precursor, the stoichiometry of TiOx films has an x value of 1.98 from the growth per cycle saturated regardless of the metal precursor or substrate used. Using O2 plasma, a super-stoichiometric film with x values from 2.02 to 2.30 was obtained. In thermal mode, the growth per cycle saturated and film thickness are, on average, 40% higher for TiCl4 compared to TTIP precursor. Using O2 plasma, the growth per cycle saturated is approximately twice as high as the thermal mode using the TTIP precursor. For both atomic layer deposition modes, the degree of crystallinity showed values of 50–80% for TiCl4 in the temperature range of 250–350°C. For TTIP, it was below 40% in thermal mode and between 80 and 95% in plasma mode (250°C). It was observed that the reaction rate, the diffusion coefficient, and the molecular flux are inversely proportional to the temperature. These results provide evidence that the crystallinity and epitaxial quality of the TiO2 film are higher for TTIP using O2 plasma. However, we verified that there was better stability of the parameters analyzed for TiCl4 in the two atomic layer deposition modes.
Introduction
Atomic layer deposition (ALD) is a specific modification of the chemical vapor deposition (CVD) technique, which is ideal for producing ultrathin films in the nanometer and Angstrom range. In CVD an appropriate metal precursor vapor and a reaction gas are simultaneously dissociated in front of a heated substrate. In ALD, they are alternately exposed to the substrate whose temperature is kept low enough to avoid thermal decomposition. The ALD reactor is purged with an inert gas between the exposures of the precursor vapor and the reaction gas. Each cycle of the ALD process usually consists of a sequence of metallic precursor exposure, purge, reaction gas exposure, and another purge. Therefore, the film grows through chemisorption between the gaseous molecules (i.e., metallic precursor vapor or reactant gas) and reactive functional groups on the surface (i.e., hydroxyl groups or chemisorbed organometallic groups). Since vacant adsorption sites are saturated by adsorbate molecules to form a monolayer (practically the sub-monolayer is formed due to the bulkiness of adsorbate molecules), the precursor or reactant in excess does not chemically adsorb to the monolayer. Consequently, the film grows via the self-limiting mechanism (Aarik and Siimon, 1994; Aarik et al., 1995; Sammelselg et al., 1998; Mitchell et al., 2003).
The ALD technique exhibits unique capabilities among thin-film deposition techniques, including the possibility of coating extremely complex shapes with a high-quality conformal material layer (Elam et al., 2003; Rauwel et al., 2011; Spende et al., 2015). ALD-grown materials can cover different nanostructures, allowing applications in several areas, such as in biomedical engineering (Pessoa et al., 2017; Pessoa and Fraga, 2019), corrosion protection on food packaging (Dias et al., 2019), improving the efficiency in a fuel cell (Pessoa et al., 2018), chemical and field-effect passivation on CIGS solar cells (Cunha et al., 2018), heterostructure to photon-to-electron conversion (Zazpe et al., 2018), silicon technology to building capacitors and solar cells (Macco et al., 2017; Chiappim et al., 2020), anti-tarnish coatings on jewels (Paussa et al., 2011), and smart textiles (Atasanov et al., 2014; Khan et al., 2020).
For a chemical to be used as an ideal ALD precursor, it must meet the following requirements: (i) the chemisorption must be highly exothermic, with high activation of desorption, to guarantee a sticking coefficient near to the unit; (ii) the by-products must not be chemically reabsorbed in the vacant sites after chemisorption; and (iii) the by-products must not etch the growing film through a series of reverse growth reactions (George, 2010; Elliot et al., 2016).
In addition to the characteristics mentioned above, a real ALD process must have a signature quality that must be obeyed so that the “parasitic CVD effects” are not loaded into the process. It is important to note that three essential characteristics must be followed simultaneously for the process to be considered a real ALD. First, for the deposition to be self-limited for each cycle, the saturation curve of growth per cycle (GPC) must occur as a function of the pulse time of the reactants (as shown in Figure 1A). It is important to note that for the ALD process to obey the saturation behavior, the purge time with an inert gas between the exposures of the precursor vapor and the reaction gas must be active. In other words, shorter purge times cannot thoroughly clean by-products (which are responsible for massive remaining by-products, such as hydrogen ions, carbon group, HCl, and so on) and the excess of the reactants (which causes more precursors to stick to the surface, interfering with the reaction of the precursor in the next cycle). Second, the film thickness must increase linearly with the number of reaction cycles (as shown in Figure 1B) (Fei et al., 2015; Chiappim et al., 2016a,b,c). Third, in each ALD-growth process, it must have an ideal temperature “window” for each material where growth is saturated in a film monolayer. In terms of these requirements, the chemistry and GPC for the ALD of Al2O3 from trimethylaluminum (TMA) and water or ozone is nearly ideal (Puurunen, 2005a,b; Mousa et al., 2014).
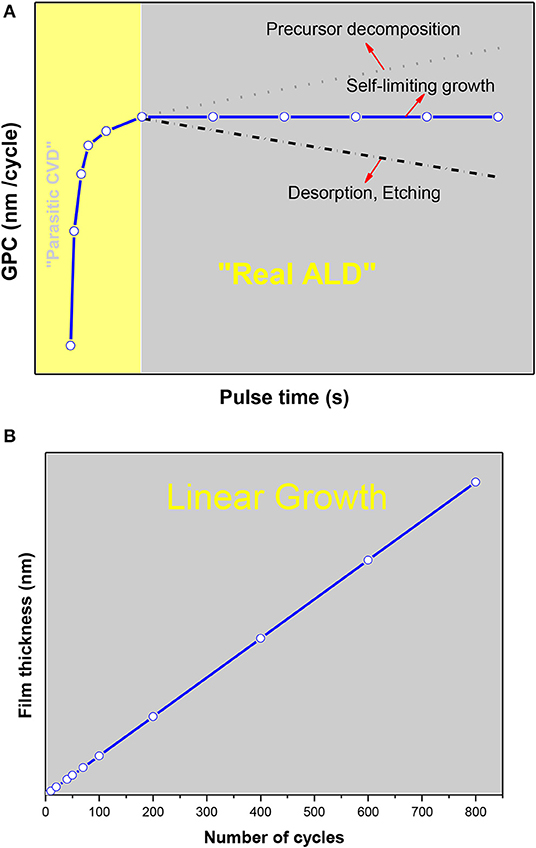
Figure 1. Schematic diagram of the essential characteristics of the ALD: (A) saturation curve of GPC as a function of the pulse time of the reactants, and (B) film thickness growth linearly with the number of reaction cycles.
Despite the numerous successful practical applications of ALD, most of the physicochemical processes that control the growth of ALD films are not sufficiently understood. It is necessary to understand the GPC and the amount of material deposited in one ALD cycle, which for fixed gas pressure, depends on three process parameters, namely, the reactant pulse time, the reactor temperature, and the substrate type, which are expected to provide more information about the linear behavior of GPC as a function of the reaction cycle number, as observed for ALD Al2O3 process. This behavior in GPC has been sought in ALD processes by examining the precursors. The effects of the substrate on the GPC at the beginning of the film growth can improve or inhibit the GPC until the substrate is completely covered with material. After coating the entire substrate, the variation of the GPC vs. pulse time should become constant. The pulse time controls the amount of reactant per cycle in ALD and influences the GPC and as a consequence, the characteristics of the thin films as they grow. In addition to an efficient purge, appropriate pulse time is also required. The use of a short pulse time promotes partial chemisorption between precursors and functional groups on the surface of the substrate, resulting in poor quality and uniformity of the films, mainly due to the “parasitic CVD effect” (as shown in Figure 1A).
An efficient purge and a substantial pulse time for precursors are costly and require a significant amount of time. Reasonable pulse and purge times are crucial for GPC in the ALD process, as controlling the GPC vs. the pulse time can optimize the deposition time and the amount of precursor used in the ALD process. The epitaxial quality of thin films can also be improved with proper control of GPC vs. pulse time.
In this study, we employed both experimental and theoretical approaches to better understand the impact of precursor pulse time on the GPC of TiO2 thin films, and the consequent influence on crystallinity, epitaxial quality, and thickness of the films produced on Si (100) and FTO substrates. The paper is divided into two parts: first, it describes and discusses the theoretical model of GPC as a function of the pulse time of the precursors in ALD, and second, it shows the results obtained from experimental analysis of the properties of ALD TiO2 thin films.
Theoretical Study
A Theoretical Model of GPC as a Function of the Pulse Time of the Precursors in ALD
To elucidate the impact of ALD pulse time on GPC, a simple theoretical equation can be used in both types of ALD precursors, namely metallic precursor, and reaction gas precursor. In all applications in this work, a reaction gas precursor based on oxygen was used.
To deduce a general equation that describes the saturation process of the GPC we employed a model based on the Maxwell-Boltzmann distribution function of molecular velocities to calculate the flux of the gases that collide with the substrate and to adjust the experimental GPC vs. pulse time for any precursor. The vapor deposition was considered, which allows for the use of the model of an ideal gas (Van der Merwe, 1993).
For the ideal gas model, the molecular flow Φ(cm−2s−1) that collides with the substrate is dependent on the gas temperature and density as deduced, as outlined below. This relationship involves the product of the number of moles of gas (n) and the average velocity of the gas particles (νx), namely:
in the thermal equilibrium (substrate, ALD chamber, and gas in the same temperature), we can use the Maxwell-Boltzmann velocity distribution, as defined:
where m is the mass of each gas-particle, and k is the Boltzmann constant (1.38 ×10²³ J/K). From Equations (1, 2), we obtained:
Using the ideal gas law (p(T) = nkT) and solving the integration in Equation (3), the flux of the precursor to the substrate per second per unit of area was obtained in terms of the pressure and temperature:
As defined by Van der Merwe (1993), the reaction rate R is:
with α as the fraction of molecules adsorbed, and T as the temperature of the gas in the process into of chamber (ALD reactor).
Once the reaction rate was determined according to the deposition parameters (pressure and temperature), the next step deduced the pulse-time-dependent theoretical GPC. This general model describes the GPC as an implicit dependence of partial pressure, the mass of the particles that collide with the substrate, and substrate/chamber temperature. The explicit dependency is with the reaction rate and the pulse time of the precursor in the ALD process.
Puurunen (2003) described a relationship between the GPC, the saturated growth per cycle (GPCSAT), and the experimental adsorbed coverage (O), defined by: . According to this study, the experimental adsorbed coating is in the range of 0 < Oexp(t) < 1, or Omin(t) < Oexp(t) ≤ Omax(t). Therefore, Omin(t) > 0, and Omax(t) = 1 leads us to the following relationship, Oexp(t) = Omax(t)−Omin(t) = 1−Omin(t).
To refine this relationship between the GPC and the adsorbed coverage, we used the following mathematical/physical observations. The temporal evolution of the adsorbed coverage O in each area is described as a differential equation since it contains an unknown function O and its temporal derivative . Consequently, if it disregards a nonzero adsorbed coverage, then O(t) > 0 for all pulse time (t). Adding an arbitrary constant k > 0 in the temporal evolution of the adsorbed coverage, the equation becomes and its derivative becomes for any t.
Therefore, the differential equation that describes the adsorbed coverage as a function of pulse time and reaction rate (k = R(T)) is defined as:
Solving both sides of Equation (6) and observing the integration limits, we obtained:
The solution of Equation (7) is:
Therefore, the adsorbed coverage is described by the following equality:
Using the relation, we obtained:
In this work, Equation (10) was used to adjust the experimental saturation curve of the ALD process (GPC vs. pulse time) for all precursors and substrate types studied. Moreover, its use could be expanded to adjust the GPC saturation curves as a function of the precursor pulse time in other films and substrates.
Experimental Procedure
ALD Process and Film Preparation
TiO2 thin films were produced in a TFS-200 ALD system (Beneq Oy, Espoo, Finland) operating in two process types, respectively, (i) thermal ALD for fixed reaction cycle number at 1,000, and with cross-flow of gases. The schematic of the reactor is shown in Figure 2A. In this ALD tool, the variation of the substrate temperature did not exceed 3°C for all conditions investigated (Chiappim et al., 2016a,b; Testoni et al., 2016). The background pressure of the reactor was lower than 1 Pa and, during the deposition process, the gas pressure was maintained around 1.0 hPa through the insertion of 300 sccm of N2; and (ii) plasma-enhanced ALD (PEALD) with a capacitively coupled plasma (CCP) reactor. The schematic of the reactor is shown in Figure 2B. The reactor consists of a cylindrical chamber with an inner diameter of 200 mm. It is composed of two essential parts: an upper plasma generation zone and a lower process zone. At the top plasma generation zone, the plasma is generated by capacitive coupling of the upper plate with a 13.56 MHz RF power supply (Cesar, Advanced Energy Inc., Fort Collins, CO, USA) and grounding the bottom grid electrode plus radial reactor walls with the reactor cycle number at 1,000. This kind of PEALD reactor configuration is classified as a remote plasma mode (Chiappim et al., 2016c). In this kind of setting, the ion damage should be significantly suppressed because the plasma generation zone was located at a certain distance from the process zone (Kääriäinen and Cameron, 2009). In this process, the substrate holder is grounded.
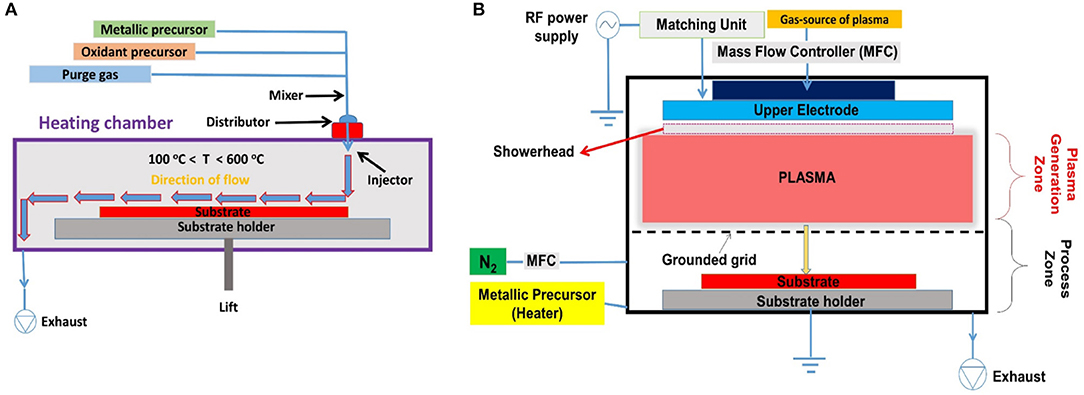
Figure 2. Schematic diagram of the ALD tools: (A) cross-flow thermal ALD and (B) capacitively coupled plasma reactor used for PEALD processes at remote plasma mode.
In this study, the substrates we used were commercial FTO glass (Sigma-Aldrich, São Paulo, Brazil) with SnO2: F film sheet resistance of 7 Ω /sq. and 3 mm thick glass plate, and three-inch p-type <100> Si wafers (University Wafer Inc., South Boston, MA, USA). These substrates were individually cleaned in an ultrasonic bath using acetone and deionized water for 5 min. They were then dried with nitrogen gas before the introduction in the thermal ALD and PEALD reaction chamber. TiO2 films were grown using TiCl4 (99.95%, Sigma-Aldrich, São Paulo, Brazil) or TTIP (97.0%, Sigma-Aldrich, São Paulo, Brazil) and O2 (99.99%, White Martins, Jacareí, Brazil) as the gas source of plasma, and deionized water as oxidant precursor in thermal ALD.
The TTIP precursor bubbler was heated to 70°C to obtain a high vapor pressure (Pessoa et al., 2015), and nitrogen (99.999%, White Martins, Jacareí, Brazil) was used as the carrier gas. The vapor delivery line of the TTIP was also heated to the same temperature to prevent precursor condensation. TiCl4 and water were held at 20°C and used without the carrier gas (i.e., a capillary tube adapted to the reactor was used to control the precursor flow injected into the ALD chamber, by action only of the precursor vapor pressure, meaning that no bubbling system was used). Oxygen gas was inserted through the upper plasma generation zone at a flow rate of 50 sccm. The reactor was evacuated at a pressure lower than 1.0 hPa. The gas pressure was maintained at 1.0 Pa through the insertion of 250 sccm of N2, which also has a purging function.
Table 1 and Figure S1 shows all pulse times, temperatures, and RF power used here to investigate the saturation behavior of the GPC and its consequent perturbation on crystallinity, and thickness of the TiO2 thin films on Si (100) and FTO substrates. We divided the studies into eight sets. In the first seven sets of samples, the process temperature was fixed at 250°C for both Ti precursors with pulse time varied for Ti precursors-purge-oxidant precursor (water vapor or O2 plasma)-purge. In the first and third sets of samples, the pulse time of Ti precursors changed with other pulses fixed. On the other hand, in the second and fourth sets of samples, the pulse time of H2O varied with other pulses fixed. In the eighth set of samples was repeated the first and third set of samples with temperature changed from 150 to 400°C, the maximum temperature for TTIP precursor was 300°C due to TTIP degradation at higher temperatures. In PEALD, fifth, and sixth sets of samples, the RF power was fixed at 150 W with the O2 plasma pulse time varied. To finish, in the seventh set of samples was repeated steps fifth and sixth with RF power changed from 100 to 200 W. In the two ALD modes, the TTIP pulse time below 0.25 s did not produce TiO2 films, and therefore in Table 1, we do not consider this value for TTIP. It is worth highlighting that for all sample sets, the growth of the films on both substrates (FTO and Si) were carried out under the same conditions.
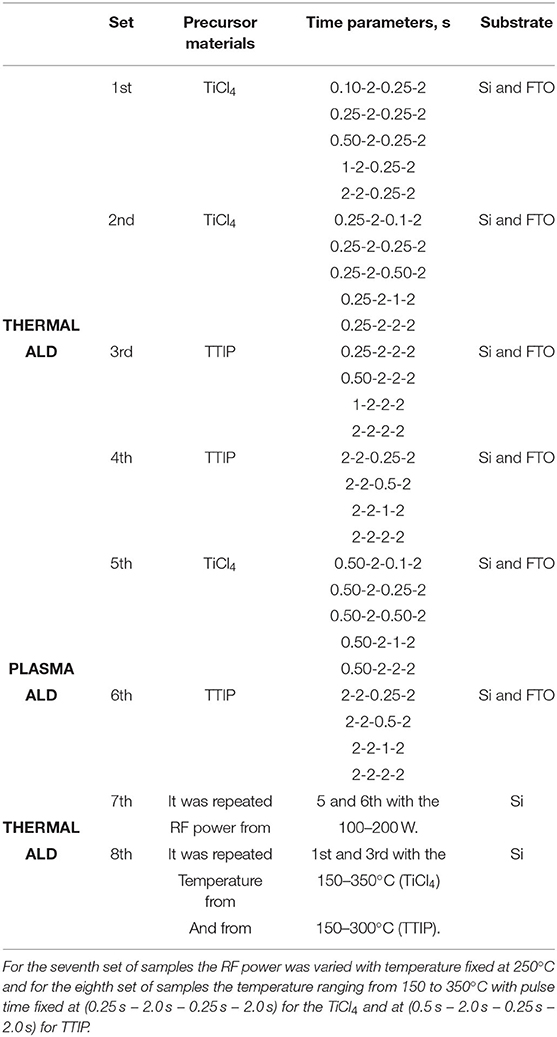
Table 1. Pulse time (Ti precursor-Purge-Oxidant Precursor-Purge) varying and temperature at 250°C for the first to the sixth set of samples.
Material Characterization
Rutherford backscattering spectroscopy (RBS) analysis was performed to determine the chemical composition (percentage), stoichiometry, and thickness of the films of the ALD TiO2 on Si (100) and FTO substrates. The RBS measurements were carried out in a Pelletron-type accelerator with a 2.2 MeV 4He+ beam as the particle detector, positioned at 170° to the incident beam. The analysis sensibility of RBS for the Ti, O, and Si has an error of ~5%. Data analysis and the evaluation of the RBS spectra were undertaken in the computer code MultiSIMNRA (Mayer, 1999). The computer code MultiSIMNRA was designed to control multiple instances of the SIMNRA program (as of February 27, 2020, LAMFI home page)1, providing a smooth RBS data analysis of numerous ion beam techniques, measured at the same sample. This was applied for all films grown by ALD and PEALD and the theoretical TiO2 density considered the crystal structure of the as-deposited material to convert the RBS density values (1015 atoms.cm−2) into the thickness of the layer (nm). Moreover, ex-situ phase-modulated spectroscopic ellipsometry (UVISEL Jobin Yvon, Horiba, Kyoto, Japan) was used to measure the thickness uniformity of the thermal and plasma ALD process in the spectral range 0.75–6.5 eV with a step of 50 meV at an incident angle of 70°. The thicknesses measured by RBS and ellipsometry techniques were in agreement, as shown in section chemical composition and thickness.
The crystallinity, strain, and film phase were characterized by grazing incidence x-ray diffraction (GIXRD) (XRD 6000, Shimadzu, Kyoto, Japan). GIXRD patterns were obtained at room temperature in a goniometer using a copper target of CuKα radiation 1.5418 Å, 2θ from 10 to 80°, at a scanning speed of 0.02° s −1, a voltage of 40 kV, and a current of 30 mA. These GIXRD studies were carried out at an incidence angle of 0.29°. This angle was close to the optimum values for anatase films and allowed efficient reduction of the reflections from the silicon substrate (Aarik et al., 2013). This angle is not suitable for the FTO substrate, allowing only the analysis of the phases of the TiO2 film together with the low-intensity peaks of the FTO phases. Hence, we focussed on the Si substrate to assess the peaks with the highest intensity.
Crystallinity degree (CD) was calculated using the ratio between the area of all crystalline peaks and the area of diffractogram (i.e., all-region crystalline and non-crystalline). All TiO2 diffraction peaks and film phases are identified by the powder diffraction file (JCPDS:21-1272) (Gates-Rector and Blanton, 2019). Strain (s) was calculated using the percentage difference between the experimental peak position (EPP) in GIXRD to the relaxed peak position (RPP) of anatase (Gates-Rector and Blanton, 2019). We analyzed the peak with the highest intensity, and used the gaussian function to extract the EPP and full width at half maximum (FWHM).
Results and Discussion
Chemical Composition and Thickness
Stoichiometry and thickness of the TiO2 film were measured by RBS, and the thickness was confirmed by ellipsometry spectroscopy, Figures 3A,B show the experimental and simulated RBS spectra for TiO2 films deposited at 250°C on FTO and Si, respectively. RBS spectrum of the bare-FTO substrate is shown inset of Figure 3A. This figure shows as an example, only the spectra related to the ALD pulse time, as follows (exposure to TiCl4 precursor; 0.25 s)-(purge with N2; 2.0 s)-(exposure to reaction gas of H2O; 0.25 s)-(purge with N2; 2.0 s) at 250°C. Table 2 shows the values of thickness performed to both techniques. The error bar was calculated using the values measured in samples growth under the same conditions on different days or from measurement at more than one location. The thin film thickness uniformity has a deviation of below 3%. Well-defined peaks show the backscattered signal of the Ti and O in Figure 3. The areal density of atom is symbolized by the areas below the peaks, which depend on the backscattering-cross-section (Chiappim et al., 2020).
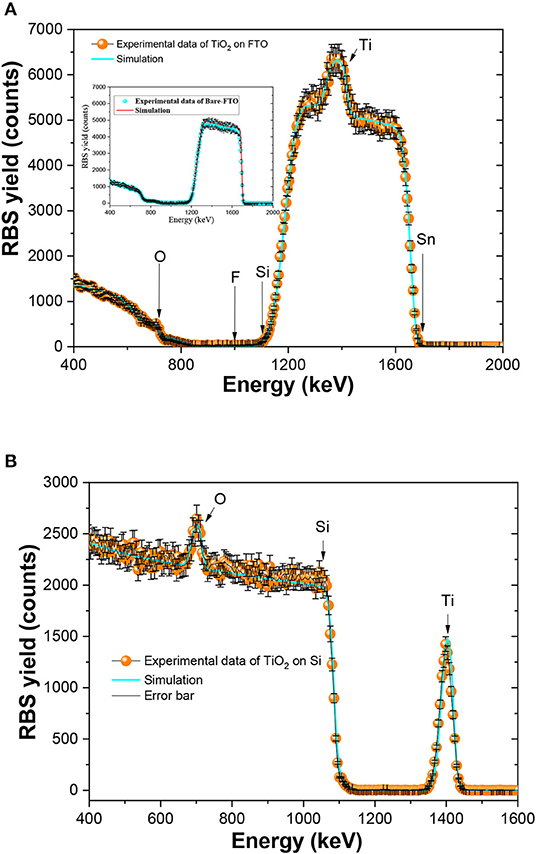
Figure 3. Experimental and simulated RBS spectra and error bar for TiO2 films deposited at 250°C on FTO (A), and Si (B). RBS spectrum of the bare-FTO substrate is showed inset of (A).
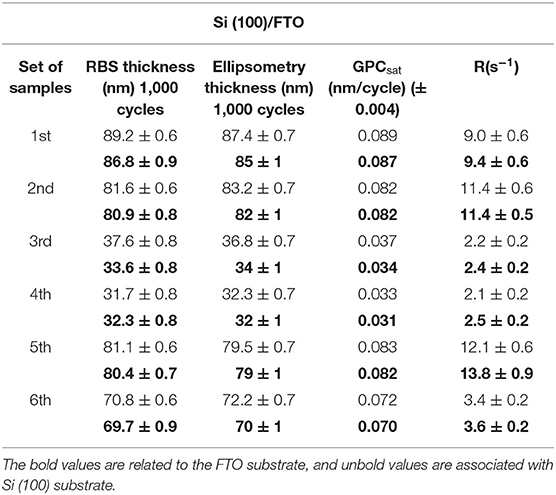
Table 2. RBS and ellipsometry thickness, growth per cycle saturated, and molecular flux.
The elemental chemical composition of the films grown according to the first and second sets of samples (thermal ALD) on both substrates show which of the TiOx films have of the x values ranging from 1.94 ± 0.01 to 1.98 ± 0.01. The better stoichiometry (1.98 ± 0.01) was reached from the GPCSAT values for both Ti precursors. For the eighth set of samples (thermal ALD), the x values ranging from 1.87 ± 0.01 to 1.98 ± 0.01, when using the TiCl4 precursor (the better stoichiometry (1.98 ± 0.01) for temperature was between 200 and 300°C). For the third and fourth sets of samples (thermal ALD) on both substrates, the x values varied from 1.96 ± 0.01 to 1.98 ± 0.01. For the eighth set of samples, the x values ranging from 1.95 ± 0.01 to 1.98 ± 0.01, when using the TTIP precursor (1.98 ± 0.01 for the temperature between 200 and 250°C, and decreasing to 1.96 ± 0.01 at 300°C). On the other hand, the growth of the TiOx film according to the fifth, sixth, and seventh set of samples (plasma ALD) generated a super-stoichiometry with x values from 2.02 ± 0.01 to 2.30 ± 0.01. These excesses of oxygen in PEALD TiO2 agrees with the results of other recent studies (Wei et al., 2013; Avila et al., 2019; Chiappim et al., 2020). A more detailed study of the oxygen stoichiometry in the TiO2 thin films is included in the section on “Effect of GPC and pulse time on crystallinity quality.”
Evaluation of the Theoretical Equation in the GPC Experimental Data
Pulse Time Study
A “true ALD” process is characterized by (i) a GPC, which does not increase with precursor exposure time [i.e., a self-limiting growth with time (as shown in the Figure 1A), and (ii) a linear behavior of film thickness with an increased number of cycles (Figure 1B) (Faraz et al., 2015)]. Figure 4 shows the GPC as a function of the pulse time of the precursors TiCl4 and TTIP. The experimental GPC was calculated by the thickness/number of cycles ratio.
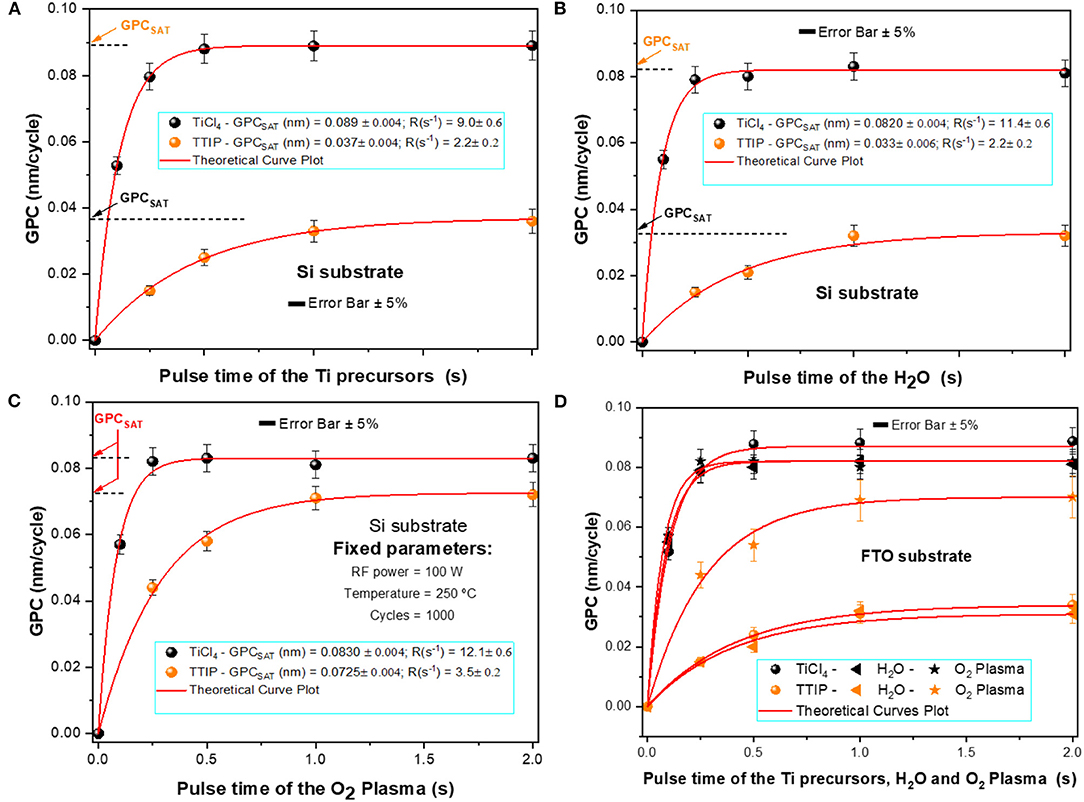
Figure 4. Experimental, and simulated GPC vs. pulse time for TiO2 thin films: (A) first and third set of samples on Si substrate, (B) second and fourth set of samples on Si substrate, (C) fifth and sixth set of samples on Si substrate, and (D) first to the sixth set of samples on FTO substrate.
The GPC was saturated when tSAT ≥ 0.25 s and tSAT ≥ 1.0 s, respectively, for TiCl4 and TTIP precursors on both substrates (Si (100) and FTO), which indicates that the growth of TiO2 thin films was self-limited for the thermal ALD and PEALD. The theoretical curve (Equation 10) adjusted all experimental data of the GPC vs. pulse time in all cases studied, as shown in Figure 4.
Figures 4A,B (black points), and D (black points) show that the experimental data fitted to the theoretical curve, Equation (10) (red line), of the GPC as a function of TiCl4 and H2O precursors pulse time-varying (in thermal ALD as proposed in Table 1). As shown in Table 2, the GPCSAT for the first set of samples on Si(100) was 0.089 ± 0.04 nm/cycle (Figure 4A) and on FTO in the same conditions was 0.087 ± 0.04 nm/cycle (Figure 4D). These values indicated that the growth of TiO2 thin films is self-limited on both substrates. The reaction rate, R, was approximately equal for both Si and FTO substrates: 9.0 ± 0.6 and 9.4 ± 0.6 s−1, respectively. For the second set of samples, the GPCSAT (nm/cycle) have the same values (0.082 ± 0.04) for both substrates, with the reaction rate equal to 11.4 ± 0.5 s−1. All values of the reaction rate above mentioned shown that these substrates have similar behavior for the growth of TiO2 thin films under the same growth conditions. The GPCSAT values for the first and second sets of samples are in agreement with the relative error. The raised R(s−1) of the first set compared to the second show that there was an increase in the flux of the precursor to the substrate, Φ (Equation 4).
This increase in the reaction rate (Equation 5) agrees with Reinke et al. (2016), who showed reported for the TTIP the Φ = 1.0 × 1018 cm−2 s−1, and for water Φ = 4.0 × 1019 cm−2 s−1. To calculate the precursor flux to the substrate they used , where D is the diffusion coefficient, p is the partial pressure of the precursor, δ is the thickness of diffusion, R is the gas constant, and T is the absolute temperature. The diffusion coefficient was approximated by , where d is the diameter of the molecules, and M is the mass. Combining this diffusion coefficient with Equation (4), we have the following relation . As can be seen in Figures 6C,D, the values calculated through Equation (4) have the same order of magnitude as those values shown by Reinke et al. (2016) using different equations and parameters, thus validating the simple theory shown in this work.
For the TTIP precursor in thermal ALD, the GPC vs. pulse time is shown in Figures 4A,B (orange points), and D (orange points) where the adjustment of experimental data by Equation (10) is represented by a red line. As shown in Table 2, the GPCSAT for the third set of samples on Si(100) was 0.037 ± 0.04 nm/cycle (Figure 4A) and on FTO in the same conditions was 0.034 ± 0.04 nm/cycle (Figure 4D). The reaction rate was approximately equal for both Si and FTO substrates, 2.2 ± 0.2, and 2.4 ± 0.2 s−1, respectively. For the fourth set of samples on Si, the GPCSAT (nm/cycle) have a value of 0.033 ± 0.04, and on FTO in the same conditions was 0.031 ± 0.04. The calculated reaction rate on Si and FTO was 2.1 ± 0.2 and 2.5 ± 0.2 s−1, respectively.
According to Reinke et al. (2016), the impinging rate of the H2O has an order of magnitude higher than the impinging rate of the TTIP. However, the reaction rate of the fourth set of samples was not higher than the third set of samples. This distinct behavior is related to the different parameters used in both works, such as temperature and pulse time. Our results show that R has the same value for both TTIP and H2O, and this behavior is possible due to the lower value of the fraction of molecules adsorbed (α) in H2O exposure time that causes an insufficient reaction rate inhibiting the total from hydrolyzing of the TTIP molecules and decreasing the adsorption sites on the surface of the substrate. Consequently, a small quantity of the TTIP was adsorbed in the next exposure pulse, and the GPC decreased. This behavior shows that the TTIP pulse time choice was not suitable for thermal ALD.
Another observation is related to the GPCSAT and thickness of the TiO2 thin films grown by thermal ALD using TTIP as the precursor. These parameters have on average 40% of the value obtained using TiCl4. This behavior can be explained by (i) a reduction in the sticking probability of physisorption when TTIP is used, or (ii) an increase in steric hindrance when TiCl4 is used. However, the sticking chance of physisorption could reduce the amount of the physisorption (Puurunen, 2005a,b), and the decrease of the sticking possibility could cause an increase in the desorption of physisorption (Yuan et al., 2014).
Figure 4C (orange and black points) and Figure 4D (blue and dark blue points) indicate that the experimental data matched the theoretical curve of Equation (10) of the GPC, as a function of the O2 plasma pulse time-varying (the fifth and sixth set of samples used fixed RF power at 150 W). For the TiCl4 precursor on silicon, we obtained values of 0.083 ± 0.04 nm/cycle and 12.1 ± 0.6 s−1, respectively, GPCSAT and R parameters. For the FTO substrate, we obtained 0.082 ± 0.04 nm/cycle and 13.8 ± 0.9 s−1. When TTIP was used, the GPCSAT reached the value of 0.072 ± 0.04 nm/cycle on Si(100), and on FTO it reached the value of 0.070 ± 0.04 nm/cycle, and the reaction rate reached 3.4 ± 0.2 s−1 for the Si(100) and 3.6 ± 0.2 s−1 for the FTO.
All the GPCSAT values shown here corroborate previous studies. For example, Aarik et al. (2013) and Puurunen et al. (2011) observed similar values using TiCl4 and H2O as precursors. Strobel et al. (2016) also showed a short tSAT in PEALD, whereas Aghaee and Maydannik (2015) showed values of GPCSAT that nearly matched the data found in this work for PEALD using the TTIP precursor. We observed that the GPCSAT for PEALD has two times the value obtained using TTIP and H2O as precursors. This occurs in the case of PEALD, using TTIP because two types of reactive sites that chemisorb TTIP species may be formed on the surface (Rai and Agarwal, 2009). The first is the carbonates generated during the combustion of the isopropoxide ligands. The second is the surface hydroxyl groups produced by the dissociation of H2O molecules into highly reactive hydroxyl radicals (Chiappim et al., 2016c). It was observed that the self-bias in the plasma sheath promoted an adequate supply of energy to the ions, inducing chemical reactions during the PEALD, increasing the number of ligand sites (Chiappim et al., 2020). Therefore, we can confirm that the exposure times attributed to the first, second, and fifth sets of samples are in resonance, with the TiCl4 precursor adsorbed equally on both substrate surfaces, as corroborated by the values of GPCSAT and R. The exposure time choice for the third, fourth and sixth set of samples was more efficient when using TTIP in PEALD, where an increase in the fraction of molecules adsorbed was observed and consequently, an increase in GPC by two times compared to thermal ALD using the same exposure time.
To confirm the validity of the general model for any thin-film material, studies were performed on the experimental GPC vs. pulse time for different oxide materials with different ALD parameters, such as temperature, pressure, substrate, pulse time, precursors, and ligands. We used the experimental data from Oh et al. (2018), Aoki et al. (2015), Pilz et al. (2018), and Jung et al. (2014) to validate the GPC vs. pulse time for HfO2, Al2O3, ZnO, and RuO2 thin films, respectively.
Oh et al. (2018) studied the electrical properties of HfO2 thin films using HfCl4 (halide precursor) and Hf(N(CH3)2)4 (amide precursor). They used the p-type Si substrates (001) at 250°C and deposited thin films 10 nm-thick. As shown in Figure 5, the application of the theoretical model for GPC vs. pulse time (black line) showed saturation when tSAT ≥ 2.0 s and tSAT ≥ 1.0 s, respectively, for HfCl4 and Hf(N(CH3)2)4 pulse time. For both precursors, the GPCSAT was 0.12 nm/cycle for the growth of HfO2 thin films self-limited for the halide and amide precursors (in agreement with Figure 1A). The theoretical curve (Equation 10) adjusted all experimental data of the GPC vs. pulse time in both cases and the reaction rate of Hf(N(CH3)2)4 was equal to 3.74 s−1 and for the HfCl4 it was 1.76 s−1.
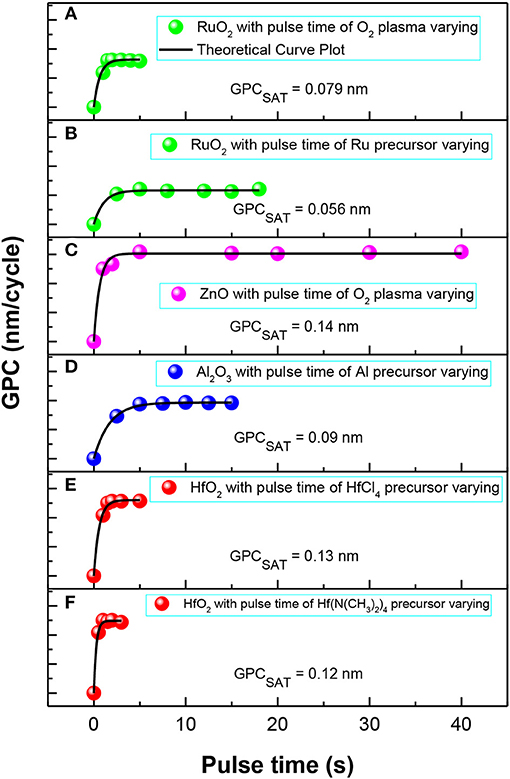
Figure 5. Experimental and simulated GPC vs. pulse time for some experimental data from the literature to different thin films: (A) and (B) RuO2, (C) ZnO, (D) Al2O3, and (E,F) HfO2.
Aoki et al. (2015) built and characterized n- and p-type MOS capacitors employing Al2O3/AlN/GaAs structures. As can be seen in Figure 5, the theoretical curve plot fitted the experimental GPC vs. pulse time for the TMA precursor for the oxidant used IPA at 400°C. The general model showed saturation when tSAT ≥ 5.0 s for TMA pulse time, and the GPCSAT was 0.092 nm/cycle with reaction rate ~ 0.60 s−1.
Pilz et al. (2018) used a custom-built direct plasma ALD reactor to deposit ZnO thin films on a single side of polished Si (100) substrates with native oxide. The RF-power was of 100 W for 100 PEALD cycles, and they used diethyl zinc (DEZ) and O2 plasma as precursors. In this application of the general model for the GPC, the O2 plasma pulse time was used. As can be seen in Figure 5, the saturation occurred at tSAT ≥ 5.0 s for O2 plasma pulse time, and the GPCSAT was 0.15 nm/cycle with a reaction rate ~ 1.42 s−1.
Jung et al. (2014) synthesized a zerovalent (1,5-hexadiene)(1-isopropyl-4-methylbenzene)Ru(0) precursor and growth RuO2 thin films on silicon with native oxide at 180–350°C and used O2 plasma as oxidant. Figure 5 shows the theoretical curve plot adjustment for the (1,5-hexadiene)(1-isopropyl-4-methylbenzene)Ru(0) pulse time and O2 plasma pulse time, respectively. The pulse time saturation occurred at tSAT ≥ 4.0 s for the RuO2 precursor with the GPCSAT equal to 0.056 nm/cycle and reaction rate ~ 0.92 s−1. In the case of the O2 plasma pulse time variating, the saturation occurred at tSAT ≥ 2.0 s with the GPCSAT equal to 0.079 nm/cycle and a reaction rate of ~2.0 s−1.
The theoretical curve (Equation 10) adjusted all experimental data of the GPC vs. pulse time in all the cases. Therefore, this general model can be applied in a variety of ALD thin film growth and can be used to predict the tSAT, GPCSAT, and reaction rate to reduce the ALD process time and quantities of precursors used in the process.
RF Power and Temperature Effect on the Reaction Rate
Figure 6 shows the reaction rate as a function of O2 plasma power (seventh set of samples at 250°C) and as a function of temperature (eighth set of samples). Figure 6A shows that the reaction rate increased between 100 and 150 W and decreased between 150 and 200 W. As R is equal to α. Φ(cm−2s−1), and Φ(cm−2s−1) is a function of the temperature, according to Equation (5), which was fixed at 250°C. We suggest that at an RF power of 150 W there is an optimization in the molecules adsorbed (α) on the substrate. This behavior indicates an ideal value for RF power. Possible explanations can be attributed to, (i) an ideal density of radical species that increase the mean free path and, consequently, increase the fraction of adsorbed molecules and reaction rate, and (ii) an increasing electron density that leads to an O2 dissociation that consequently increases the O atom density in the plasma. This raise in the O atoms flux through the grid (Figure 2B), favors the oxidation reactions of the adsorbed precursor layer.
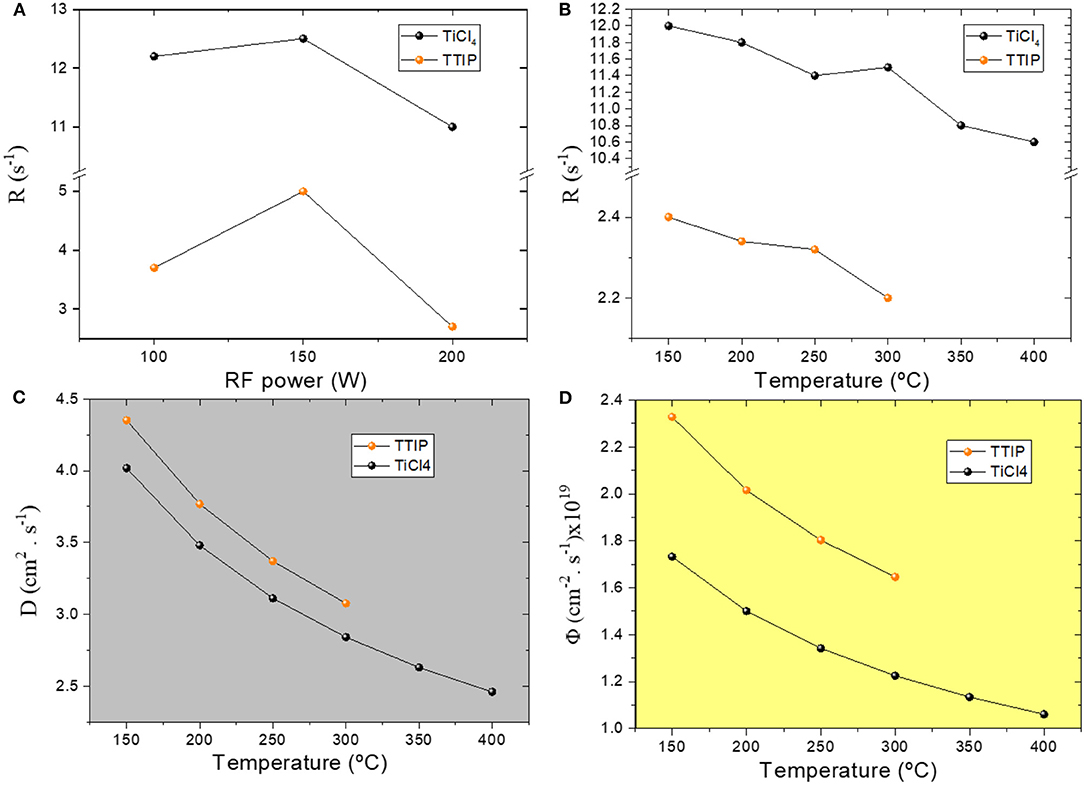
Figure 6. Parameters extracted of the theoretical model applied at experimental data: (A) reaction rate [R(s−1)] vs. RF power, (B) reaction rate [R(s−1)] vs. temperature, (C) diffusion coefficient [D(cm−2s−1)] vs. temperature, and (D) molecular flow [Φ(cm−2s−1)] vs. temperature.
Figure 6B shows that the reaction rate declined with the increase of the deposition temperature, which agrees with Equation (5) (R(s−1) ∝ T−1/2). Figure 6B shows a different behavior than Figures 6C,D, as shown in section pulse time study R(s−1) ∝ Φ(cm−2s−1) ∝ D. At 300 and 250°C respectively, for TiCl4 and TTIP, we have an increase in α, indicating an ideal temperature that induces a better chemical reaction on the surface. Another observation in Figure 6B may be related to a typical temperature “window” in ALD that is often misinterpreted. Most of the time, in each temperature range the GPCSAT is constant. Recently, Sonsteby et al. (2020) discussed this erroneous notion showing that the GPCSAT could change as a function of temperature with continuing self-limiting growth. This behavior was also observed by Kim et al. (2019) and Chiappim et al. (2016b) for the ALD of SnS using two different precursors and for ALD of TiO2 using TiCl4 precursor on FTO and Si substrates, respectively.
Effect of GPC and Pulse Time on Crystallinity Quality
To elucidate the effect of GPC and pulse time on the quality of crystallinity, we focus the analysis on TiO2 thin films grown on Si substrate. This choice was necessary to avoid the diffraction peaks of the FTO substrate, which could compromise the analysis. Therefore, we focus on the Si substrate to assess the TiO2 peaks with the highest intensity (Figure S2 shows all anatase peaks found in this work, based in the JCPDS:21-1272 (Gates-Rector and Blanton, 2019).
Figure 7 shows the diffractograms of GIXRD for the first and second set of samples, according to the powder diffraction file (JCPDS:21-1272) (Gates-Rector and Blanton, 2019) all film phases are anatase with higher intensity in peak (101). According to JCPDS:21-1272, the RPP for peak (101) is 25.301°, which will be used in all analyses. As can be seen in Figures 7A,C, all films were highly oriented with the peak (101) increasing the intensity with a change of pulse time from 0.1 to 2 s. Another observation that corroborates the high crystallinity quality of these films is the second-order-peak (202) that appears in all diffractograms. There was no change in the phase of the film with the variation of the pulse time, indicating that the film phase depends on the temperature. Table 3 summarizes EPP, FWHM, crystallinity degree, and strain (s) for all data. The uncertainty of all parameters extracted from Figure 7 is low, showing high accuracy in the parameters obtained by Gaussian function. According to Avila et al. (2019), a negative strain indicates a compressively strained, and a positive strain indicates tensile stress. In all cases, the value of s (%) is positive, resulting in tensile stress. In the first set (Figure 7A), there was a decrease in EPP from (25.629 ± 0.002)° to (25.568 ± 0.002)° (Figure 7B) that evidenced the shift in peak (101), this behavior occurs when increasing the pulse time and as a consequence, there is a decrease of s (%) from 1.30 to 1.06, an increase of FWHM (°) from 0.51 to 0.67, and of CD (%) from 57 ± 1 to 80 ± 1, showing the high crystallinity quality of the films. In the second set of samples (Figure 7C) the FWHM (°) remained approximately constant (0.55±0.01), the EPP reduced from (25.609 ± 0.002)° to (25.595 ± 0.002)°, and CD (%) increased from 64 ± 1 to 69 ± 1, also showing the high crystallinity quality, however inferior to the first set of samples. Therefore, for the TiCl4 precursor, the growth of the TiO2 film in thermal mode (first and second set of samples) has the crystallinity and strain, dependent on the pulse time (as can be seen in Table 3).
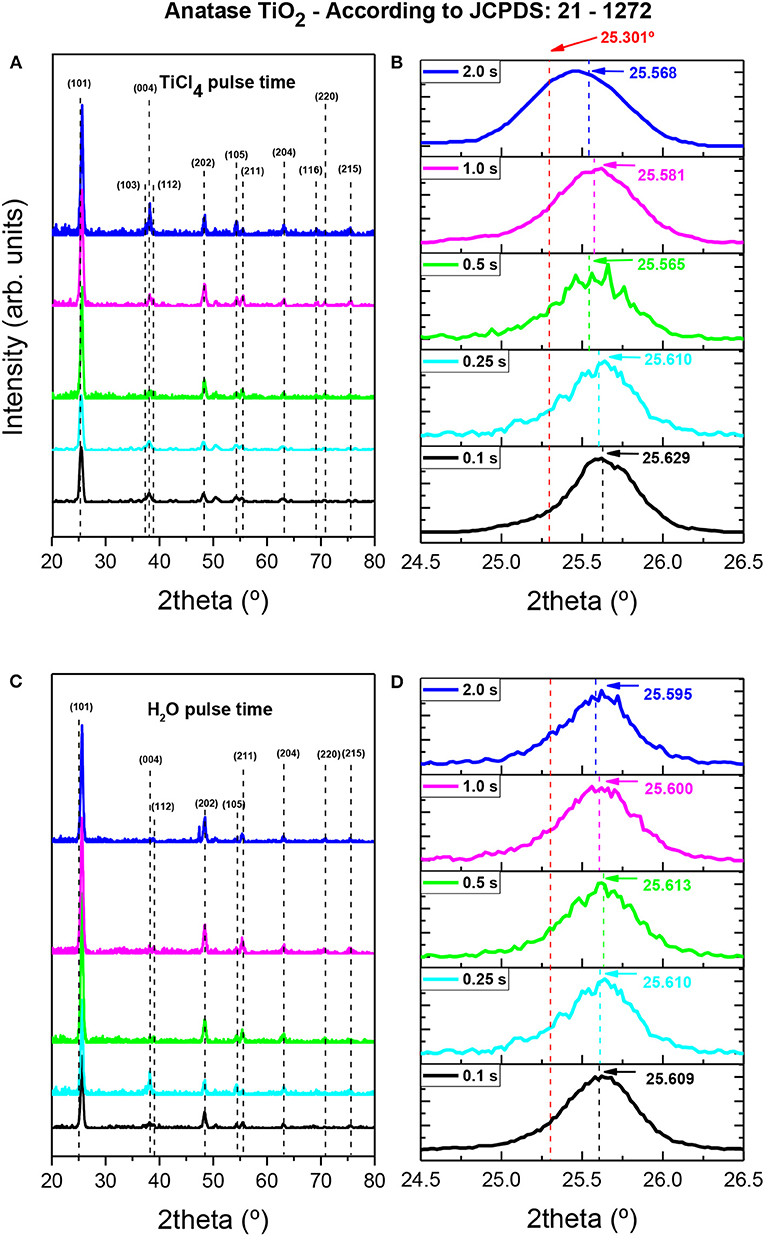
Figure 7. GIXRD diffractogram for TiO2 film growth using TiCl4 precursor: (A) first set of samples, (B) peak (101) for the first set of samples, (C) second set of samples, and (D) peak (101) for the second set of samples.
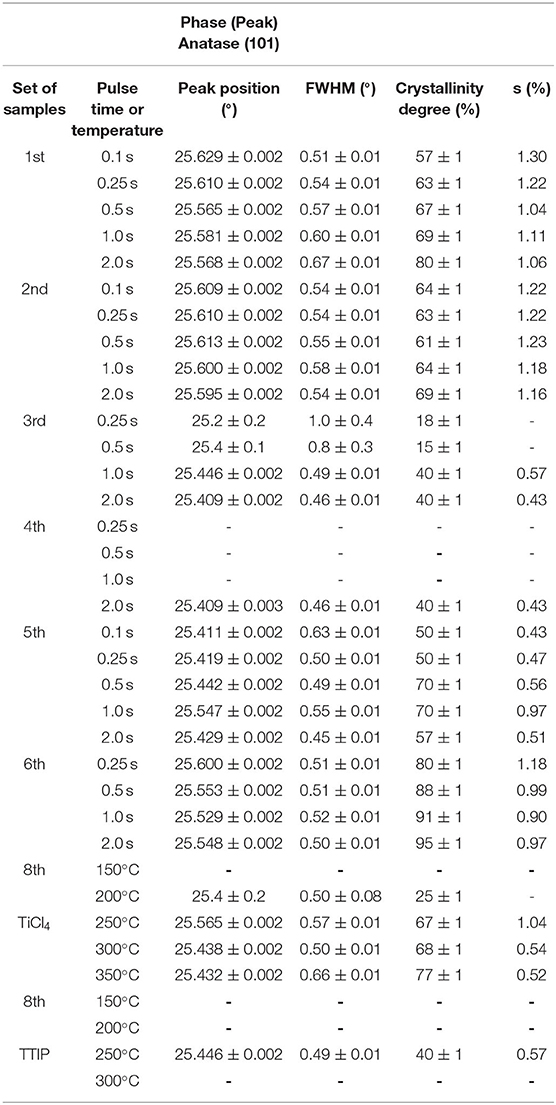
Figure 8 shows the diffractograms of GIXRD for the third set (thermal ALD) and the sixth set of samples (plasma ALD) for TTIP precursors, and all parameters are summarized in Table 3. It is worth mentioning that the fourth set of samples (thermal ALD) with reaction gas pulse time (H2O vapor) varying, does not present peak intensity in GIXRD, thus showing low crystallinity [i.e., non-uniform strain (Avila et al., 2019), the exception was for the 2.0 s pulse time, whose parameters are shown in Table 3]. Figure 8A shows the diffractograms related to the third set of samples, as can be seen, the TiO2 films presented low crystallinity quality. The uncertainty of parameters extracted from the third set is low for 1.0 and 2.0 s, so showing high accuracy in the parameters obtained by Gaussian function. On the other hand, the uncertainty for the 0.25 and 0.5 s pulse time is high due to the (101) peak is extremely weak. As shown in Table 3, the uncertainty increases in two orders of magnitude for EPP and one order of magnitude for FWHM. This increase in uncertainty makes the strain study infeasible for 0.25 and 0.5 s. For pulse times of 1.0 and 2.0 s the films show the second-order-peak (202), and the peaks (105), (211), and (204), this improved the CD (%) to 40 ± 1, for both pulse times. Unlike the behavior for TiO2 films grown using TiCl4 (first and the second set of samples), occurred an increase in the EPP from (25.2 ± 0.2)° to (25.409 ± 0.002)° (Figure 8B), and an increase in the CD (%) from 15 ± 1 to 40 ± 1. These results show the low crystallinity quality for the third set of samples and a CD (%) dependent on the pulse time. Figure 8C presents the diffractograms of the sixth set of samples, showing that all films were highly oriented, with the peak (101) increasing the intensity with the increase of the time of exposure to O2 plasma from 0.25 to 2.0 s. As seen in the first and second sets of samples, the second-order-peak (202) was observed in all diffractograms, which corroborates the high crystallinity. For all films, the value of s (%) is positive, resulting in tensile stress. Figure 8D shows a decrease in EPP from (25.600 ± 0.002)° to (25.548 ± 0.002)°, which confirmed the shift in peak (101), this behavior occurs when increasing the pulse time, as a consequence, we have a decrease in s (%) of 1.18 to 0.97 and the FWHM (°) remained approximately constant (0.51 ± 0.01). These results, as discussed previously, corroborate with the CD (%), which reached better values (from 80 ± 1 to 95 ± 1), showing the highest crystallinity quality of the films.
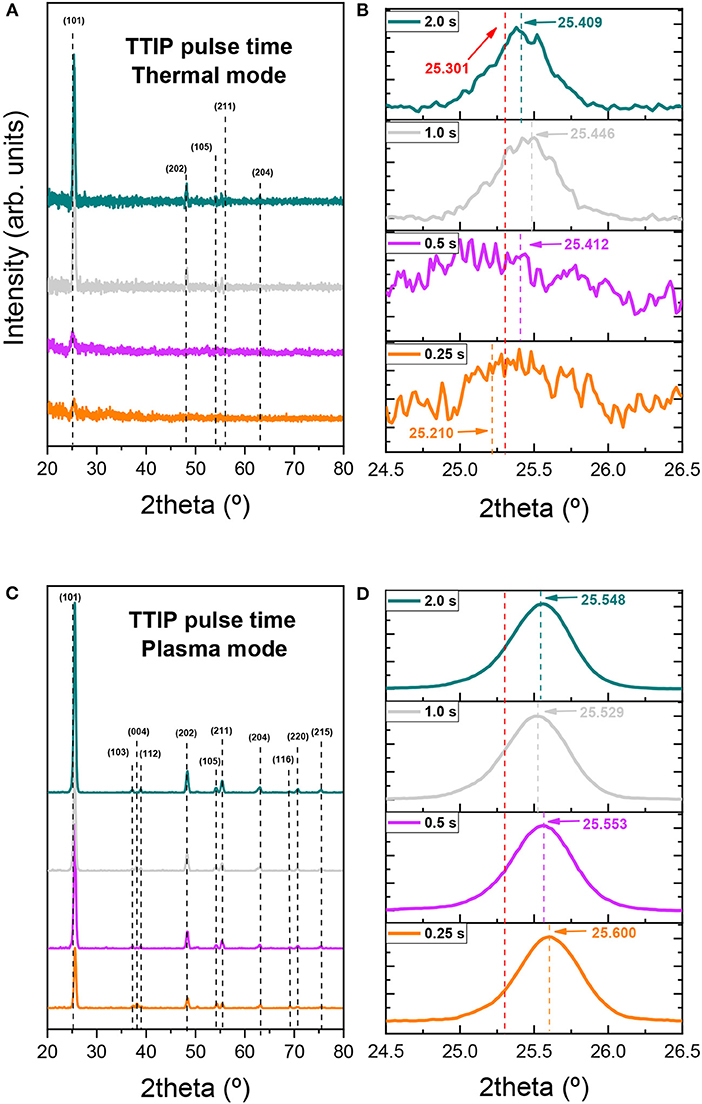
Figure 8. GIXRD diffractogram for TiO2 film growth using TTIP precursor: (A) third set of samples, (B) peak (101) for the third set of samples, (C) sixth set of samples, and (D) peak (101) for the sixth set of samples.
As mentioned earlier, these films have a super-stoichiometry that was related to plasma exposure. In a recent study, Chiappim et al. (2020) showed the effects of PEALD process parameters, such as RF power, and substrate exposure mode (direct or remote plasma exposure), and through the RBS characterization, an excess of oxygen in the TiOx films was observed for O2 plasma power in the range from 100 to 150 W (i.e., x values ranging from 2.13 ± 0.01 to 2.33 ± 0.01). Wei et al. (2013) found that by using the XPS technique that the stoichiometry of the TiOx films varied from 2.08 to 2.32 for O2 plasma at 400 W and the temperature varying from 100 to 300°C. Avila et al. (2019), using the XPS technique, showed that TiO2 film growth using tetrakis-(dimethylamino) titanium (TDMAT) and Ar-O2 and O2 plasma gas chemistries at 300 W RF power, presented stoichiometry of the TiOx films of ~2.04. Based on results shown in Figure 8C and Table 3, we can suggest that the superstoichiometry for the TTIP precursor is related to the increase of the pulse time of O2 plasma, which decreases the EPP and s and increases CD to values higher than 90%.
The observation which the surface of the PEALD TiO2 films takes up superstoichiometric oxygen with the increase of the O2 plasma exposure time and can be explained using a convenient unit called a monolayer and a superstoichiometry mechanism proposed by Schneider et al. (2020). This monolayer can be considered as a GPC maximum useful [i.e., a statistical quantity (Puurunen, 2003)]. According to (Puurunen, 2005a,b), discussing the ALD mechanism in terms of monolayers is illustrative, however, to avoid nomenclature confusion, we defined a monolayer as a chemisorbed monolayer (CM).
Schneider et al. (2020) have shown a similar behavior of the influence of ozone in the super-stoichiometric oxygen in the atomic layer deposition of Fe2O3 using tert-Butylferrocene and O3. We adapted their theory to better understand the superstoichiometry presented in this work. As can be seen in Figure 4A, the GPCSAT for TTIP grown in thermal mode is 0.037 nm (i.e., the CMThermal is 0.037 nm). In the case of the GPCSAT for TTIP grown in plasma mode (Figure 4C) was observed value of 0.0725 nm (i.e., a CMPlasma of the 0.0725 nm). Because the CMPlasma is higher than the CMThermal this shows that the PEALD process deposits more than one full CMThermal of TiO2 per ALD cycle. The overabundance of the oxygen present correlates with the O2 plasma exposure [i.e., when the exposure time increase from 0.25 to 2.0 s the value of x (TiOx) increase from 2.02 ± 0.01 to 2.30 ± 0.01, this suggests that increasing the plasma exposure inserts superstoichiometric oxygen near of the surface]. This suggestion is in agreement with Schneider et al. (2020). They showed by angle-resolved XPS that the composition of the films in bulk corresponds to stoichiometry, while the surface of the film contains an excess of oxygen not expected by ALD Fe2O3 thin films. The results correlated the superstoichiometry with the ozone pulse time and with a GPC higher than a monolayer (Schneider et al., 2020). To explain this behavior, they proposed that the higher saturated GPCs are related to the behavior of the film like a reservoir for oxygen. Thus, the ALD half-reactions would no longer be confined to the surface monolayer of the growing film. Additionally, they showed a diffuse physical mechanism of oxygen uptake and consumption into and out of the Fe2O3 film that increases the growth to more than a monolayer each cycle.
Adapting the chemical mechanism used by Schneider et al. (2020) to explain the superstoichiometry in our PEALD thin films, we changed the O3 for O2 plasma and tert-Butylferrocene for TTIP. Their mechanism suggests that the oxygen is repetitively taken up into the film from O2 plasma and then partially consumed by the Ti precursor. This mechanism requires the ability of the oxygen dislocate through the bulk of the anatase film, and indeed the oxygen vacancies and diffusion through TiO2 are reported in the literature (Herman et al., 2013; Paris and Taioli, 2016 ). Therefore, if oxygen can be stored on the subsurface of the TiO2 film and is capable of being moved through the film to reach the surface, both oxygen vacancy and diffusion reaction could continue to advance even after a monolayer is deposited. These mechanisms lead to more than one monolayer of material growth in each PEALD cycle with an excess of oxygen (as proposed by Schneider et al., 2020). Hence, based on the proposed mechanism, there is consistency with the growth behaviors of the superstoichiometric TiO2 films, where the film acts as a reservoir for oxygen. This behavior changes the ALD reactions from a confined surface monolayer to submonolayers, leading to a higher saturated GPC. Consequently, we have a better CD (%) with the highest crystallinity quality of the PEALD films.
Figure 9A shows the diffractograms of the fifth set of samples for the TiCl4 precursor in plasma mode. Table 3 shows a low uncertainty for all parameters extracted from Figures 9A,B, which show high accuracy in all parameters obtained by Gaussian function. As can be seen, the super-stoichiometric films have a high orientation with peak (101) increase the intensity with the rise of the pulse time from 0.1 to 2.0 s. We observed a second-order-peak (202), an increase in the CD (%) from 50 ± 1 to 80 ± 1, and a decrease in FWHM (°) from 0.63 ± 0.01 to 0.45 ± 0.01. For all films, the value of s (%) was positive, resulting in tensile stress. Between 0.1 and 1.0 s, the EPP increase from (25.411 ± 0.002)° to (25.547 ± 0.002)°, and in 2.0 s, decreases to (25.429 ± 0.002)° (Figure 9B). Therefore, for the fifth set of samples, the crystallinity quality presented the highest quality of the films. This proves that the TiCl4 precursor is versatile, as it was independent of the reaction gas exposure mode (H2O or O2 plasma).
Figure 9. GIXRD diffractogram for TiO2 film growth using TiCl4 precursor: (A) fifth set of samples, (B) peak (101) for the fifth set of samples, (C) eighth set of samples, and (D) peak (101) for the eighth set of samples.
Figure 9C presents the diffractograms of the eighth set of samples for TiCl4 precursor with pulse time fixed and the temperature ranging from 150 to 350°C, with all parameters summarized in Table 3. The uncertainty for the films grew at temperatures of 150 and 200°C, which was high due to the (101) peak being extremely weak for 200°C and nonexistent for 150°C. The uncertainty of the films grown at 250, 300, and 350°C is low due to the (101) peak being dominant. For temperatures above 250°C, the second-order-peak (202) was observed in diffractograms (Figure 9C), which corroborates the high crystallinity. For these films, the value of s (%) is positive, resulting in tensile stress. Figure 9D shows a decrease in EPP from (25.565 ± 0.002)° to (25.432 ± 0.002)°, which revealed the shift in (101) peak, this behavior occurs when increasing the temperature from 250 to 350°C, and as a consequence, there was a decrease in s (%) from 1.04 to 0.52 and the FWHM (°) varied from (0.50 ± 0.01) to (0.66 ± 0.01).
This change in crystallinity behavior with temperature relates to the nature of the ALD growth via exchange relations on the surface (Puurunen et al., 2011). Matero et al., 2001 showed that for TiCl4 and H2O as precursors, and using temperatures below 250°C, the numbers of -Cl ligands from to TiCl4 pulse decreases from about two to one (i.e., from bifunctional to monofunctional adsorption). However, in temperatures higher than 250°C, less than one -Cl ligand occurs. This indicates dissociative chemisorption of TiCl4 at oxygen bridges, which shows a dehydroxylation of OH groups at higher temperatures. According to Leem et al. (2014), the dissociative chemisorption contributes to the first-half reaction of ALD TiO2 at a higher temperature. Thus, the relation between an increase of GPC can be related to the dissociative chemisorption of TiCl4 (Matero et al., 2001; Leem et al., 2014). (Hu and Turner, 2006) demonstrate by density functional theory (DFT) calculations in the initial surface reactions of ALD TiO2 on the SiO2 substrate that during the first half-reaction the monofunctional chemisorption of SiOH and TiCl4 is slightly exothermic, and the bifunctional chemisorption is rather endothermic.
Therefore, the desorption (reverse reactions) of chemisorption is a problem related to low crystallinity at temperatures below 250°C on Si substrates.
Conclusions
To conclude, an evaluation of the impact of pulse time on the GPC and the structure of TiO2 films grown by ALD and PEALD techniques offers advantages in the enhancement of the crystallinity quality of these films by using reduced deposition time. This in-depth theoretical and experimental study has presented a theoretical model based on the Maxwell-Boltzmann velocity distribution and the molecular flux of gases that collide with the substrate to create a better understanding of the GPC vs. pulse time. Through this model, which was applied to both precursors (metallic and oxidant), we analyzed the best pulse time of saturation to predict the GPCSAT, reaction rate, and molecular flow, which allows us to optimize the ALD process time and the quantities of precursors used in the film growth. We validated the model by fitting our experimental data along with data from other studies to different metal oxide thin films, namely HfO2, Al2O3, ZnO, and RuO2. In our data, we found tSAT ≥ 0.25 s and tSAT ≥ 1.0 s for TiCl4 and TTIP precursors, respectively, on both Si (100) and FTO substrates, which indicates that the growth of TiO2 thin films was self-limited for the thermal ALD and PEALD. It was also observed that the GPCSAT and thickness of the films grown by thermal ALD using TTIP, had, on average, 40% of the value, obtained using TiCl4 precursor. Using O2 plasma as the reaction gas and TTIP, there was a two-fold increase in GPCSAT and thickness, compared to the results when H2O was used. The reaction rate, the molecular flow, and the diffusion coefficient decreases when the temperature varies from 150 to 350°C, which showed the following relationship R(s−1) ∝ Φ(cm−2s−1) ∝ D∝ T−1/2. The chemical composition was evaluated by RBS analysis and showed that the samples from the three sets of PEALD TiOx films have an excess of oxygen (i.e., they exhibit a superstoichiometry with x values from 2.02 ± 0.01 to 2.30 ± 0.01). GIXRD diffractograms of the films showed a crystalline structure, reaching a crystalline degree from 57 to 80%, for the samples from the two sets of thermal ALD using TiCl4 and H2O precursors, whereas the set of PEALD samples, using TiCl4 and O2 plasma, had a crystalline degree from 50 to 80%. These results indicated the high-quality of the crystalline TiO2 films for the TiCl4 precursor. For the set of PEALD samples, using TTIP and O2 plasma, the high crystallinity degree of the films was reached from 80 to 95%. On the other hand, a low crystallinity quality (below 40%) was observed for the two sets from ALD thermal samples using TTIP and H2O. The film phase, for all parameters in this work, was anatase with a positive strain, resulting in tensile strain. Overall, our results demonstrate the benefits of understanding the GPC and pulse time to control TiO2 film crystallinity quality, strain, thickness, stoichiometry, and morphology through adjustment of the essential parameter, namely ALD pulse time.
Data Availability Statement
The raw data supporting the conclusions of this article will be made available by the authors, without undue reservation.
Author Contributions
WC and RP: conceptualization. WC, RP, and MF: methodology and formal analysis. WC, MF, RP, and HM: investigation, writing—review, and editing. HM, MF, and RP: resources and funding acquisition. WC: writing—original draft. RP and HM: supervision. All authors contributed to the article and approved the submitted version.
Funding
This project received financial support from the Brazilian agency program grant n° 11/50773-0 (FAPESP/MCT/CNPq-PRONEX), grant n° 459688/2014-6 (MCTI/CNPq), grants n° 2016/17826-7 and 2018/01265-1. We also received support from thee São Paulo Research Foundation (FAPESP) and CAPES. WC acknowledges the European Union and Portuguese funding by FEDER through the COMPETE 2020/PT2020 program and Fundação para a Ciência e a Tecnologia (FCT) under Projects No. CENTRO-01-0145-FEDER-000005 (SusPhotoSolutions-Soluções Fotovoltaicas Sustentáveis).
Conflict of Interest
The authors declare that the research was conducted in the absence of any commercial or financial relationships that could be construed as a potential conflict of interest.
Supplementary Material
The Supplementary Material for this article can be found online at: https://www.frontiersin.org/articles/10.3389/fmech.2020.551085/full#supplementary-material
Footnotes
1. ^LAMFI. (2020). Available online at: http://deuterio.if.usp.br/multisimnra/ (accessed February 27, 2020).
References
Aarik, J., Aidla, A., Uustare, T., and Sammelselg, V. (1995). Morphology and structure of TiO2 thin films grown by atomic layer deposition. J. Cryst. Growth 148, 268–275. doi: 10.1016/0022-0248(94)00874-4
Aarik, J., and Siimon, H. (1994). Characterization of adsorption in flow type atomic layer epitaxy reactor. Appl. Surf. Sci. 81, 281–287. doi: 10.1016/0169-4332(94)90285-2
Aarik, L., Arroval, T., Rammula, R., Mändar, H., Sammelselg, V., and Aarik, J. (2013). Atomic layer deposition of TiO2 from TiCl4 and O3. Thin Solid Film. 542, 100–107. doi: 10.1016/j.tsf.2013.06.074
Aghaee, M., and Maydannik, P. S. (2015). Low temperature temporal and spatial atomic layer deposition of TiO2 films. J. Vac. Sci. Technol. A 33:041512. doi: 10.1116/1.4922588
Aoki, T., Fukuhara, N., Osada, T., Sazawa, H., Hata, M., and Inoue, T. (2015). Electrical properties of GaAs metal-oxide-semiconductor structure comprising Al2O3 gate oxide and AlN passivation layer fabricated in situ using a metal-organic vapor deposition/atomic layer deposition hybrid system. AIP Adv. 5:087149. doi: 10.1063/1.4929371
Atasanov, S. E., Oldham, C. J., Slusarski, K. L., Taggart-Scarff, J., Sherman, S. S., Senecal, K. J., et al. (2014). Improved cut-resistance of Kevlar using controlled interface reactions during atomic layer deposition of ultrathin (<50 A) inorganic coatings. J. Mater. Chem. A 2:17371. doi: 10.1039/C4TA03662J
Avila, J. R., Qadri, S. B., Freitas, J.r.J. A., Nepal, N., Boris, D. R., Walton, S. G., et al. (2019). Impact of growth conditions on the phase selectivity and epitaxial quality of TiO2 films grown by plasma-assisted atomic layer deposition. Chem. Mater. 31, 3900–3908. doi: 10.1021/acs.chemmater.8b05282
Chiappim, W., Testoni, G.E., de Lima, J.S.B., Medeiros, H.S., Pessoa, R.S., Grigorov, K.G., et al. (2016a). Effect of process temperature and reaction cycle number on atomic layer deposition of TiO2 thin films using TiCl4 and H2O precursors: Correlation between material properties and process environment. Braz. J. Phy. 46, 56–69. doi: 10.1007/s13538-015-0383-2
Chiappim, W., Testoni, G.E., Doria, A.C.O.C., Pessoa, R.S., Fraga, M.A., Galvão, N.K.A.M., et al. (2016c). Relationships among growth mechanism, structure and morphology of PEALD TiO2 films: the influence of O2 plasma power, precursors chemistry and plasma exposure mode. Nanotechnology 27:305701. doi: 10.1088/0957-4484/27/30/305701
Chiappim, W., Testoni, G.E., Moraes, R.S., Sagás, J.C., Origo, F.D., Vieira, L., et al. (2016b). Structural, morphological, and optical properties of TiO2 thin films grown by atomic layer deposition on fluorine-doped tin oxide conductive glass. Vacuum 123, 91–102. doi: 10.1016/j.vacuum.2015.10.019
Chiappim, W., Watanabe, M., Dias, V., Testoni, G., Rangel, R., Fraga, M., et al. (2020). MOS capacitance measurements for PEALD TiO2 dielectric films grown under different conditions and the impact of Al2O3 partial-monolayer insertion. Nanomaterials 10:338. doi: 10.3390/nano10020338
Cunha, J. M. V., Fernandes, P. A., Hultqvist, A., Teixeira, J. P., Bose, S., Vermang, B., et al. (2018). Insulator Materials for Interface Passivation of Cu(In, Ga)Se2 thin films. IEEE J. Photovolt. 28, 1313–1319. doi: 10.1109/JPHOTOV.2018.2846674
Dias, V., Maciel, H. S., Fraga, M. A., Lobo, A. O., Pessoa, R. S., and Marciano, F. R. (2019). Atomic layer deposited TiO2 and Al2O3 thin films as a coating for Aluminum food packing application. Materials 12:682. doi: 10.3390/ma12040682
Elam, J. W., Routkevitch, D., Mardilovich, P. P., and George, S. M. (2003). Conformal coating on ultrahigh-aspect-ratio nanopores of anodic alumina by atomic layer deposition. Chem. Mater. 15, 3507–3517. doi: 10.1021/cm0303080
Elliot, S. D., Dey, G., Maimaiti, Y., Ablat, H., Filatova, E. A., Fomengia, G. N., et al. (2016). Modeling mechanism and growth reactions for new nanofabrication processes by atomic layer deposition. Adv. Mater. 27, 5367–5380. doi: 10.1002/adma.201504043
Faraz, T., Roozeboom, F., Knoops, H. C. M., and Kessels, W. M. M. (2015). Atomic layer etching: what can we learn from atomic layer deposition. ECS J. Solid State SC. 4, N5023–N5032. doi: 10.1149/2.0051506jss
Fei, C., Liu, H., Wang, X., and Fan, X. (2015). The influence of process parameters and pulse ratio of precursors on the characteristics of La1−xAlxO3 films deposited by atomic layer deposition. Nanoscale Res. Lett. 10, 1–9. doi: 10.1186/s11671-015-0883-6
Gates-Rector, S., and Blanton, T. (2019). The powder diffraction file: a quality materials characterization database. Powder Diffr. 34, 352–360. doi: 10.1017/S0885715619000812
George, S. M. (2010). Atomic layer deposition: an overview. Chem. Mater. 110, 111–131. doi: 10.1021/cr900056b
Herman, G. S., Zehr, R. T., and Henderson, M. A. (2013). Characterization of oxygen and titanium diffusion at anatase TiO2 (001) surface. Surf. Sci. Lett. 612, L5–L8. doi: 10.1016/j.susc.2013.02.006
Hu, Z., and Turner, C. H. (2006). Initial surface reactions of TiO2 atomic layer deposition onto SiO2 surfaces: density functional theory calculations. J. Phys. Chem. B 110, 8337–8347. doi: 10.1021/jp060367b
Jung, H. J., Han, J. H., Jung, E. A., Park, B. K., Hwang, J.-.H., Son, S. U., et al. (2014). Atomic layer deposition of ruthenium and ruthenium oxide thin films from zerovalent (1,5-hexadiene)(1-isopropyl-4-methylbenzene)ruthenium complex and O2. Chem. Mater. 26, 7083–7090. doi: 10.1021/cm5035485
Kääriäinen, T. O., and Cameron, D. C. (2009). Plasma-assisted atomic layer deposition of Al2O3 at room temperature. Plasma Process Polym. 6, S237–S241. doi: 10.1002/ppap.200930605
Khan, M. R., Kim, H. G., Park, J. S., Shin, J. W., Nguyen, C. T., and Lee, H. B. R. (2020). Tunable color coating of E-textile by atomic layer deposition of multilayer TiO2/Al2O3 films. Langmuir. 36, 2794–2801. doi: 10.1021/acs.langmuir.9b03988
Kim, S. B., Zhao, X., Davis, L. M., Jayaraman, A., Yang, C., and Gordon, R. G. (2019). Atomic layer deposition of tin monosulfide using vapor from liquid Bis(N,N-diisopropylformamidinato)tin(II) and H2S. ACS Appl. Mater. Interface 49, 45892–45902. doi: 10.1021/acsami.9b16933
Leem, J., Park, I., Li, Y., Zhou, W., Jin, Z., Shin, S., et al. (2014). Role of HCl in atomic layer deposition of TiO2 thin films from titanium tetrachloride and water. Bull. Korean Chem. Soc. 35:411195. doi: 10.5012/bkcs.2014.35.4.1195
Macco, B., van de Loo, B. W. H., and Kessels, W. M. M. (2017). “Atomic layer deposition for high-efficiency crystalline silicon solar cells,” in Atomic Layer Deposition in Energy Conversion Applications, 1st edn, ed J. Bachmann. (Weinheim: Wiley-VCH Verlag GmbH & Co. KGaA), 41–99. doi: 10.1002/9783527694822.ch2
Matero, R, Rahtu, A., and Ritala, M.. In situ quadrupole mass spectrometry quartz crystal microbalance studies on the atomic layer deposition of titanium dioxide from titanium tetrachloride water. Chem. Mater. (2001) 13 4506–4511. doi: 10.1021/cm011046+
Mayer, M. (1999). AIP Conf. Proc. 475 541; SIMNRA (Simulation Program for the Analysis of NRA, RBS, and ERDA) developed by M. Mayer. Available online at: http://home.rzg.mpg.de/~mam/ (accessed February 27, 2020).
Mitchell, D. R. G., Attard, D. J., and Triani, G. (2003). Transmission electron microscopy studies of atomic layer deposition TiO2 films grown on silicon. Thin Solid Film 441, 85–95. doi: 10.1016/S0040-6090(03)00877-0
Mousa, M. B. M., Oldham, C. J., and Parsons, G. N. (2014). Atmospheric pressure atomic layer deposition of Al2O3 using trimethyl aluminum and ozone. Langmuir 30, 3741–3748. doi: 10.1021/la500796r
Oh, I.-.K., Park, B.-.E., Seo, S., Yeo, B. C., Tanskanen, J., Lee, H.-.B.-.R., et al. (2018). Comparative study of the growth characteristics and electrical properties of atomic-layer-deposited HfO2 films obtained from metal halide and amide precursors. J. Mater. Chem. C 6, 7367–7376. doi: 10.1039/C8TC01476K
Paris, A., and Taioli, S. (2016). Multiscale investigation of oxygen vacancies in TiO2 anatase and their role in memristor's behavior. J. Phys. Chem. C 120, 22045–22053. doi: 10.1021/acs.jpcc.6b07196
Paussa, L., Guzman, L., Marin, E., Isomaki, N., and Fedrizzi, L. (2011). Protection of silver surfaces against tarnishing by means of alumina/titania-nanolayers. Surf. Coat. Tech. 206, 976–980. doi: 10.1016/j.surfcoat.2011.03.101
Pessoa, R.S., and Fraga, M.A. (2019). “Biomedical applications of ultrathin atomic layer deposited metal oxide films on polymeric materials,” in Frontiers of Nanoscience, 1st edn, eds M. Benelmekki, A. Erbe (Cambridge, MA: Elsevier), 291–307. doi: 10.1016/B978-0-08-102572-7.00011-8
Pessoa, R.S., Fraga, M.A., Chiappim, W., and Maciel, H.S. (2018). “Exploring the properties and fuel cell applications of ultrathin atomic layer deposited metal oxide films,” in Emerging Materials for Energy Conversion and Storage, 1st edn, K. Y. Cheong, G. Impellizzeri, M. A. Fraga (Cambridge, MA: Elsevier), 83–114. doi: 10.1016/B978-0-12-813794-9.00003-X
Pessoa, R. S., dos Santos, V. P., Cardoso, S. B., Doria, A. C. O. C., Figueira, F. R., Rodrigues, B. V. M., et al. (2017). TiO2 coatings via atomic layer deposition on polyurethane and polydimethylsiloxane substrate: properties and effects on C. Albicans growth and inactivation process. Appl. Surf. Sci. 422, 73–84. doi: 10.1016/j.apsusc.2017.05.254
Pessoa, R. S., Pereira, F. P., Testoni, G. E., Chiappim, W., Maciel, H. S., and Santos, L. V. (2015). Effect of substrate type on the structure of TiO2 thin films deposited by atomic layer deposition technique. JICS 1, 38–42.
Pilz, J., Perrota, A., Christian, P., Tazreiter, M., Resel, R., Leising, G., et al. (2018). Tuning of material properties of ZnO thin films grown by plasma-enhanced atomic layer deposition at room temperataure. J. Vac. Sci. Technol. A 36:01A109. doi: 10.1116/1.5003334
Puurunen, R. L. (2003). Growth per cycle in atomic layer de position: a theoretical model. Chem. Vap. Depos. 9, 249–257. doi: 10.1002/cvde.200306265
Puurunen, R. L. (2005a). Correlation between the growth-per-cycle and the surface hydroxyl group concentration in the atomic layer deposition of aluminum oxide from trimethylaluminum and water. Appl. Surf. Sci. 245, 6–10. doi: 10.1016/j.apsusc.2004.10.003
Puurunen, R. L. (2005b). Surface chemistry of atomic layer deposition: a case study for trimethylaluminum/water process. J. Appl. Phys. 97:121301. doi: 10.1063/1.1940727
Puurunen, R. L., Sajavaara, T., Santala, E., Miikkulainen, V., Saukkonen, T., Laitinen, M., et al. (2011). Controlling the crystallinity and roughness of atomic layer deposited titanium dioxide films. J. Nanosci. Nanotechnol. 11, 8101–8107. doi: 10.1166/jnn.2011.5060
Rai, V. R., and Agarwal, S. (2009). Surface reaction mechanism during plasma-assisted atomic layer deposition of titanium dioxide. J. Phys. Chem. C 113, 12962–12965. doi: 10.1021/jp903669c
Rauwel, E., Galeckas, A., Rauwel, P., Nilsen, O., Walmsley, J. C., Rytter, E., et al. (2011). ALD Applied to conformal coating of nanoporous γ-Alumina: spinel formation and luminescence induced by europium doping. ECS Trans. 41, 123–130. doi: 10.1149/1.3633660
Reinke, M., Kuzminykh, Y., and Hoffmann, P. (2016). Surface reactions kinetics of titanium isopropoxide and water in atomic layer deposition. J. Phys. Chem. C. 120, 4337–4344. doi: 10.1021/acs.jpcc.5b10529
Sammelselg, V., Rosental, A., Tarre, A., Niinist,ö, L., Heiskanen, K., Ilmonen, K., et al. (1998). TiO2 thin films by atomic layer deposition: a case of uneven growth at low temperature. Appl. Surf. Sci. 134, 78–86. doi: 10.1016/S0169-4332(98)00224-4
Schneider, J. R., Baker, J. G., and Bent, S. F. (2020). The influence of ozone: superstoichiometric oxygen in atomic layer deposition of Fe2O3 using tert-Butylferrocene and O3. Adv. Mater. Interfaces 7:2000318. doi: 10.26434/chemrxiv.10413779
Sonsteby, H. H., Yanguas-Gil, A., and Elam, J. W. (2020). Consistency and reproducibility in atomic layer deposition. J. Vac. Sci. Technol. A 38:020804. doi: 10.1116/1.5140603
Spende, A., Sobel, N., Lukas, M., Zierold, R., Riedl, J. C., Gura, L., et al. (2015). TiO2, SiO2, and Al2O3 coated nanopores and nanotubes produced by ALD in etched ion-track membranes for transport measurements. Nanotechnology 16:335301. doi: 10.1088/0957-4484/26/33/335301
Strobel, A., Schnabel, H.-.D., Reinhold, U., Rauer, S., and Neidhardt, A. (2016). Room temperature plasma enhanced atomic layer deposition for TiO2 and WO3 films. J. Vac. Sci. Technol. A 34:01A118. doi: 10.1116/1.4935356
Testoni, G. E., Chiappim, W., Pessoa, R. S., Fraga, M. A., Miyakawa, W., Sakane, K. K., et al. (2016). Influence of the Al2O3 partial-monolayer number on the crystallization mechanism of TiO2 in ALD TiO2/Al2O3 nanolaminates and its impact on the material properties. J. Phys. D 49:375301. doi: 10.1088/0022-3727/49/37/375301
Van der Merwe, J. H. (1993). Theoretical considerations in growing uniform epilayers. Interface Sci. 1, 77–86. doi: 10.1007/BF00203267
Wei, D., Hossain, T., Garces, N. Y., Nepal, N., Meyer, I. I. I.H. M., et al. (2013). Influence of atomic layer deposition temperatures on TiO2 / n-Si MOS capacitor, ECS J. Solid State SC. 2, N110–N114. doi: 10.1149/2.010305jss
Yuan, G., Shimizu, H., Momose, T., and Shimogaki, Y. (2014). Kinetic study on hot-wire-assisted atomic layer deposition of nickel thin films. J. Vac. Sci. Technol. A 32:01A104. doi: 10.1116/1.4829361
Keywords: atomic layer deposition (ALD), plasma-enhanced atomic layer deposition (PEALD), growth per cycle, titanium dioxde, ultra-thin films, epitaxial quality, crystallinity
Citation: Chiappim W, Fraga MA, Maciel HS and Pessoa RS (2020) An Experimental and Theoretical Study of the Impact of the Precursor Pulse Time on the Growth Per Cycle and Crystallinity Quality of TiO2 Thin Films Grown by ALD and PEALD Technique. Front. Mech. Eng. 6:551085. doi: 10.3389/fmech.2020.551085
Received: 11 April 2020; Accepted: 28 August 2020;
Published: 28 October 2020.
Edited by:
Luis Guillermo Villanueva, École Polytechnique Fédérale de Lausanne, SwitzerlandReviewed by:
Agnes Granier, UMR6502 Institut des Matériaux Jean Rouxel (IMN), FranceShahid Atiq, University of the Punjab, Pakistan
Copyright © 2020 Chiappim, Fraga, Maciel and Pessoa. This is an open-access article distributed under the terms of the Creative Commons Attribution License (CC BY). The use, distribution or reproduction in other forums is permitted, provided the original author(s) and the copyright owner(s) are credited and that the original publication in this journal is cited, in accordance with accepted academic practice. No use, distribution or reproduction is permitted which does not comply with these terms.
*Correspondence: William Chiappim, Y2hpYXBwaW1qckB5YWhvby5jb20uYnI=; Rodrigo Sávio Pessoa, cnNwZXNzb2FAaXRhLmJy