 Francesco Antonio Tiano*†
 Gianfranco Rizzo†
- Department of Industrial Engineering, University of Salerno, Fisciano, Italy
The high concentration of CO2 in the atmosphere and the increase in sea and land temperatures make the use of renewable energy sources increasingly urgent. To overcome the problem of non-programmability of renewable sources, this study analyzes an energy storage system consisting of under water compressed air energy storage (UWCAES). A case study for fully power the Sicily region (Italy) with renewable energy source (wind and photovoltaic) is presented. From the real annual capacity values of the renewable plants installed in Sicily, a sizing of both the energy production and the storage system and its auxiliary services is evaluated. The optimization of the operation of the system as a whole, modeled with mathematical models already validated in previous studies, is obtained through dynamic programming. The electricity consumed annually by the region, equal to 19048.4 GWh, can be entirely satisfied by renewable energy sources. A sizing of plants powered by renewable sources for a nominal power of 15, 000 MW equally divided between photovoltaic and wind power is considered. The underwater air storage system has a maximum volume of 2.1 × 10⁸ m3, while the compression and generation units have a total nominal power of 6, 900 and 3, 100 MW, respectively. The study finally presents a sensitivity analysis for the evaluation of the effects of the variation of the power produced by renewable energy sources and of Sicily energy consumption. The results show that carbon-free feeding is possible and that all the boundary conditions on the operation of the system can be met.
1. Introduction
Nowadays, energy consumption is inexorably increasing with a consequent increase of GHGs emissions. The strong connection between CO2 concentration in the atmosphere (Global Monitoring Laboratory, 2016) and the land and sea temperature anomalies (National Aeronautics and Space Administration (NASA) Goddard Institute for Space Studies (GISS), 2017) led all the nations of the world to commit themselves to increase their energy efficiency and reducing their emissions. Use of renewable energy represents the most viable choice because it does not emit pollutants and can be exploited on a large scale, within the limits of their global potentials.
As mentioned, the global potential of renewable energy sources is limited. In fact, it is reduced by their intermittency. A solar photovoltaic power plant does not produce electricity during nights or in bad weather conditions, a wind power plant does not work at low or extremely high wind speed, and so on. In addition, energy produced by renewable source does not always match the energy requested by the load. Consequently, there are time windows in which there is an energy surplus that would be lost. Hence, in order to fully exploit the renewable energy sources, the only effective method is to store the extra energy to be used later, when required. The subject has been heavily covered in literature. Specifically, the accumulation of energy with special reference to renewable sources was analyzed by Letcher et al. (2016).
Among all the energy storage systems, Compressed Air Energy Storage (CAES) technology stands out for its high reliability, long service life, acceptable energy efficiency, and reduced environmental effects (Letcher et al., 2016). Moreover, compared to pumped hydro storage, CAES is easier to site (Lund and Salgi, 2009; Kim et al., 2011; Cheung et al., 2014b). Typically, in CAES systems, the compressed air is stored into underground caverns, salt domes or, for smaller application, into artificial pressure vessels (Kim and Favrat, 2010). Therefore, large scale application is not suitable for site without a specific underground geography. These systems are generally equipped with constant volume reservoirs operating in a specific pressure range (Borel and Favrat, 2010; Díaz-González et al., 2016; Letcher et al., 2016). This technology is called isochoric CAES system, as shown in the left image in Figure 1. Consequently, the pressure of the compressed air stored changes at every operation (charging/discharging processes). There are some disadvantages in the isochoric CAES: first of all, a large amount of exergy is lost in the regulation (throttling) of the air pressure by way of a reducing valve. In fact, the high pressure compressed air needs to be reduced to a lower pressure before the generation process (Luo and Wang, 2010). A significant low pressure also represents a problem in terms of efficiency of the expander. In this regard, note that the pressure decreases during the discharge process. For these reasons, isobaric CAES systems have been studied. These systems allow to deliver the same power output of an isochoric CAES system with a reduction of storage volume up to 77% (Zaugg, 1975). Advantages of isobaric air containment compared to isochoric containment will be clearer in the following section. Isobaric technology obviously required a very deep cavern or a very high altitude of the water tank, in order to obtain enough hydrostatic pressure by the water column, as shown in the right image in Figure 1. Therefore, it is geographically advantageous to place the CAES system under water. This latest technology is called Under-Water CAES (UWCAES) and it is derived from mature CAES technologies.
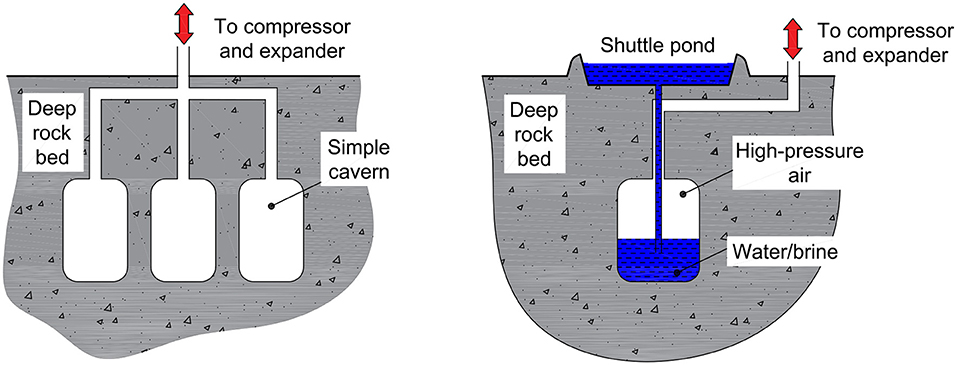
Figure 1. Pressurized air containment: (Left) Isochoric (Right) Isobaric (Letcher et al., 2016).
This paper proposes a case study on the Sicily region (Italy). It intends to provide a first level analysis on the sizing of plants powered by renewable sources (more specifically, wind and photovoltaic) and of an UWCAES system so that the load of the entire region is fully satisfied without the use of energy produced from conventional sources. The power and storage plants are studied and modeled, and the optimal management determined by use of dynamic programming. The used mathematical models have been already validated in previous studies by the authors of this manuscript over conventional CAES system (Arsie et al., 2005, 2006, 2007; Marano et al., 2012; Tiano et al., 2018).
Sicily was chosen as a case study precisely because it has a morphology of its coasts suitable for the use of UWCAES plants. In fact, as shown in Figure 2, there are many areas within 5 km of the coast that have seabeds with depths greater than 400 m.
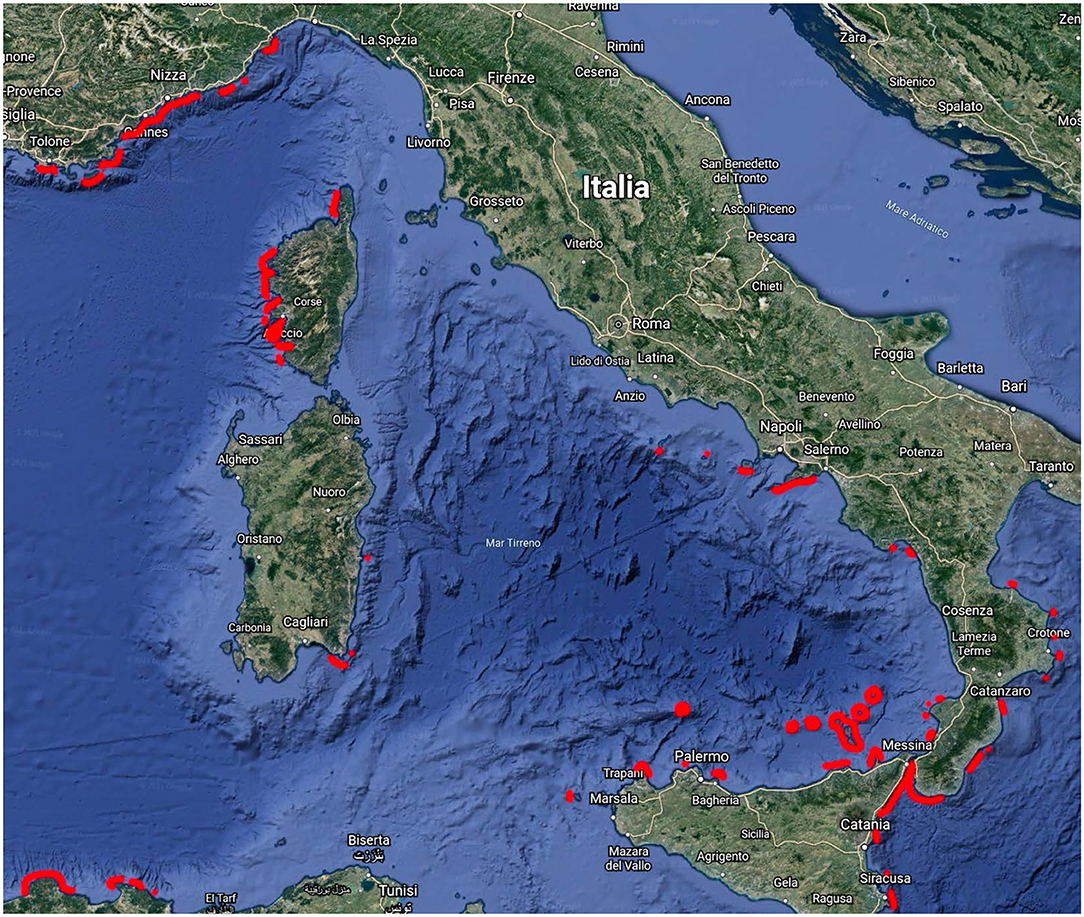
Figure 2. Map of the central Mediterranean Seas, showing areas within 5 km of land which have a water depth greater than 400 m (Letcher et al., 2016).
This work is organized as follows. Section 2 introduces the basic equations and exergy considerations on the energy storage in form of compressed air. Section 3 presents an analysis of the state-of-the-art of UWCAES technology. Section 4 analyzes Sicily real electricity consumption data, as well as generation data from renewable sources. The energy scenario proposed for the study is also introduced. Section 5 outlines the characteristics of the proposed UWCAES system and describes the mathematical models and the optimization algorithm used. The optimization results are presented in section 6. Section 7 describes the results of a sensitivity analysis of the proposed system. Finally, concluding remarks are provided in section 8.
2. Storing Energy as Compressed Air
As mentioned, CAES consists in storing air into resevoirs at high pressure. For a more correct exposition of UWCAES technology and to better understand its advantages, it is mandatory to introduce the basic equations of energy storage in the form of compressed air. Furthermore, a direct comparison, in exergetic terms, between traditional CAES and UWCAES clearly exposes why the latter technology is finding more and more space in the scientific and technological sector.
2.1. Basic Equations
In air energy storage, a compressor raises the air from ambient pressure pamb to the storing pressure psto. The pressure ratio, β, is defined as:
If the air at ambient temperature, Tamb, is compressed with an isothermal process, the amount of energy require to compress a certain mass of air, m, is determined as:
Conversely, if the compression is an adiabatic process, the required energy is calculated as:
where χ = (γ−1)/γ.
Table 1 shows how much air can be compressed by 1 kWh of energy according to Equations (2) and (3).
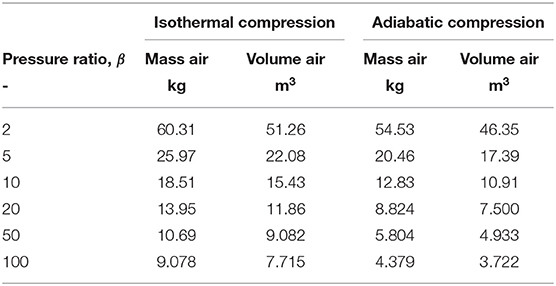
Table 1. Quantities of air that can be compressed with 1 kWh of work (Letcher et al., 2016).
For the storage in underwater vessels, the pressure in seawater at a depth d is given by:
Using Equations (2) and (3) is possible to obtain the curves of energy density of stored air against the depth of an underwater air storing reservoir, as shown in Figure 3.
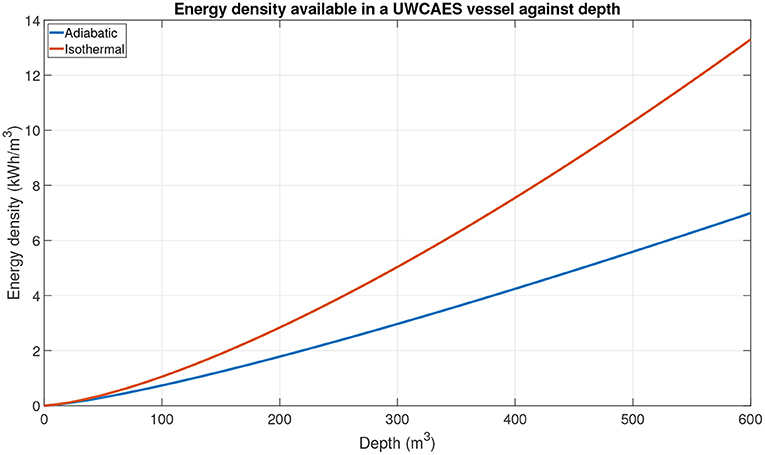
Figure 3. Energy density available in a UWCAES vessel against depth (Letcher et al., 2016).
2.2. Exergy Considerations
The goodness of the UWCAES solution is further confirmed by considerations on recoverable exergy from the type of accumulation. Conventional CAES, as already mentioned in the previous section, uses isochoric air stores. For simplicity and reduction of operating costs, conventional CAES power plants reduce, via throttling, the air pressure to a value suitable for expansion equipments.
The recoverable exergy, B, for the three types of stores (isobaric, isochoric, and throttled isochoric) is determined with the following equations:
Table 2 shows the exergy values calculated with the Equation (5). It clearly shows that the amount of recoverable exergy with isobaric stores, and therefore in the case of UWCAES, is higher than that of isochoric stores, i.e., those of conventional CAES.
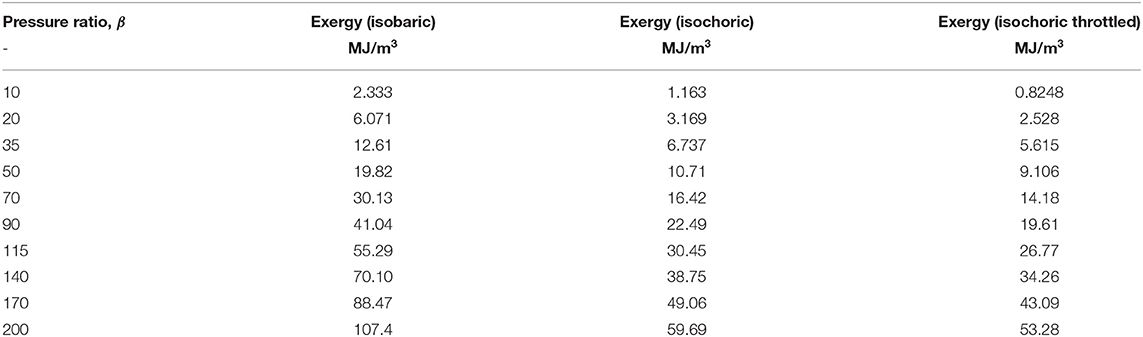
Table 2. Quantities of exergy recoverable from air stores (Letcher et al., 2016).
3. State-of-Art of UWCAES
The considerations in the previous section, especially on energy and exergy densities, should have made it clear why UWCAES is so interesting and why it is being studied and developed.
In UWCAES system, compressed air is usually stored in submerged expandable air accumulators, placed at or near the bed of lakes or oceans, in order to use the hydrostatic pressure resulting from the water column. Accumulators will expand during the charging process and they will contract during the discharging process, depending on the amount of the compressed air stored into them. In terms of mechanical aspect of the system design, the set-up is similar to that of adiabatic CAES. A highly effective thermal recovery process extracts thermal heat energy generated during isentropic air compression and stores it into a thermal energy storage that features high specific heat capacity, high density, and good heat transfer characteristics. During isentropic air expansion, where compressed air is used to generate electricity, the stored heat is used to raise the temperature of the compressed air coming from the accumulators, prior to entering turbo-expansion equipment. The size of the reservoir is strictly connected to the number of the accumulators: the larger the scale, the greater the accumulators. This is a great advantage for smaller-scale applications, where smaller reservoirs are needed. Generally, the number of the accumulators decreases with the depth (Cheung et al., 2014b).
As will be seen later in this section, research—both scientific and industrial—on UWCAES systems has focused on the following topics:
• analysis of the components and structures for storage, including costs;
• assessment of the energy storage potential of coastal areas;
• performance evaluation of pilot systems;
• theoretical and experimental determination of energy and exergetic efficiency;
• plant optimization analyses.
UWCAES system's performance is primarily influenced by pipe diameter, turbine, and air compressor specifications and air storage depth. Performance gains can be realized through the engagement of more efficient turbo-expanders and air compressor or through more effective heat recovery (Cheung et al., 2014b). UWCAES offers substantial advantages, as seen in the previous section, in terms of storage system and therefore has the potential to further improve the roundtrip efficiency of traditional CAES systems (Letcher et al., 2016). Potentialities of UWCAES system have been demonstrated with the results from a Lake Ontario Pilot Study point. This analysis showed that UWCAES is a potentially feasible alternative to conventional CAES systems (Cheung et al., 2012). In UWCAES systems the storage pressure is constant, so there is no need to change electrical output levels, while it occurs in traditional systems. In addition, the advantages of this system are constant energy output profile, scalable design, and geographical adaptability.
A model for a multi-objective optimization of a 4 MWh UWCAES system using genetic algorithm, with energy, exergy and exergo-economics analysis was created. The results showed a round-trip efficiency of 68.5% and an operating profit of $53.5/cycle. Optimum designs had slight variations for different interest rates, but all these results are not absolute (Cheung et al., 2014a). A hybrid system is also proposed in Vasel-Be-Hagh et al. (2014). It concerns a hybrid composed of UWCAES and Vortex Induce Vibration Aquatic Clean Energy (VIVACE) converter (Bernitsas et al., 2008), realized to harness Vortex Hydro Energy (VHE), called UWCAES-VHE. The proposed system considers exploiting the kinetic energy associated with the oscillation of the underwater storage units to generate additional electricity.
Air storage reservoirs for UWCAES can be flexible or rigid, and anchored to the seabed with fixed or variable buoyancy depths. Flexible underwater storage vessels are also known as Energy Bags (see Figure 4). Within the Energy Bags there are small pressure differences, which is maximum at the top of the vessel (Pimm et al., 2014). The Energy Bags are cable-reinforced fabric vessel, anchored to the sea bed at useful depth, aiming at an efficient energy storage. The depth at which the vessel is anchored does not influence the stresses experienced by the materials in the fully inflated vessel, because these stresses are strictly connected to net buoyancy and differential pressure, and both of them are approximately independent of depth (Pimm et al., 2014). Rigid underwater vessels consists in submerged caissons anchored to the seabed. Proposals of under-water storage in rigid vessels are available in Fiaschi et al. (2012) and Lim et al. (2013). Whatever the storage vessel, a pipeline is needed. Such pipeline connects vessels with compression and expansion machinery, which can be placed on land or on a floating platform.
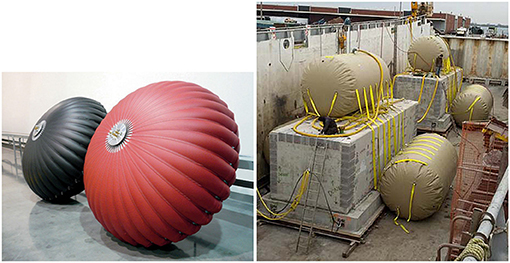
Figure 4. (Left) Energy bags (Right) Rigid vessels (Letcher et al., 2016).
Other studies have been conducted about under-water vessels. One of them is a three-dimensional simulation aimed at investigating water flow over the energy storage balloon (Vasel-Be-Hagh et al., 2013). Benefits and prerequisites connected to commercial scale energy storage capacity related to Energy Bag structure, volume, and deployment depth are shown in De Jong (2014). Design and materials for energy bags is studied in Mas and Rezola (2016).
In Wang et al. (2019), the aerodynamic forces and the flow velocity around an underwater accumulator are analyzed through a computational-experimental approach. Computational Fluid Dynamics (CFD) simulations are conducted on three bodies of similar geometries: the finished circular cylinder, the finished conical cylinder and the balloon-shaped bluff body. Through these simulations the effects on the free extremity of the tank and the characteristics of the forces acting on it were studied.
Compared to the conventional CAES, UWCAES presents two additional losses: the losses associated with the leakage from the storage units, and the pressure drops in the pipelines. About the first one, prototypes of submarine storage units showed leakage losses equal to 1.2% per day. These leaks, which occur mainly in the seams, can be reduced through the use of more resistant materials. The pressure drop losses, on the other hand, represent the greatest losses of the UWCAES plants which however have a relatively low impact on the power outputs of the system. In fact, a 1% loss at 7.0 MPa causes only a 0.24% loss in power output of the power plant (Letcher et al., 2016).
Potentially, the cost of Energy Bags (firstly proposed in 1986, Laing and Laing, 1989) is less than £20/kWh, and their optimal size will have equal costs for surface and tensile material (Pimm and Garvey, 2009; Pimm et al., 2011). In Letcher et al. (2016) is mentioned that, using reasonable costs for materials, total costs of UWCAES reservoirs can be less than £10/kWh assuming 500 m depth storage. In Pimm and Garvey (2009) fabric structures for large-scale underwater CAES, minimizing the cost of the bag materials per unit of stored energy, were analyzed.
To complete the discussion on costs, a conventional CAES system has different costs depending on whether the storage system is aboveground or underground. Table 3 shows the total costs of conventional CAES systems, divided by cost of Power Conversion System (PCS), storage section and fixed and variable Operation and Maintenance (O&M). The UWCAES systems show lower costs as regards the storage section, while it is likely to consider the PCS costs identical to the conventional CAES system. The literature on UWCAES does not report any indications on O&M costs, probably because the technology has not yet reached full industrial maturity. If the O&M costs of UWCAES plants are comparable or lower than those of conventional CAES, this technology could become a viable alternative in a portfolio of energy storage solutions (Letcher et al., 2016).
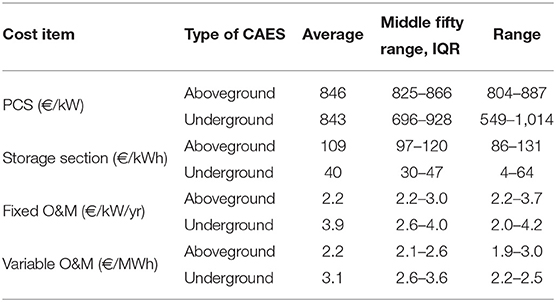
Table 3. Main cost items of CAES systems (Zakeri and Syri, 2015).
In addition to the possible sites in the Mediterranean shown Figure 2, many other nations in the world have a bathymetry of the coasts suitable for hosting UWCAES plants: the fjords of Novergia, southern California, Greece, Gibraltar, Portugal, Croatia, Russia, Ukraine, Georgia, Iceland, and the islands in general (Malta, Canary Islands, Cyprus) (Letcher et al., 2016). In Pete et al. (2015) the UWCAES potential in the Gulf of Maine was studied. Results showed that the cumulative storage potential reaches a 60 TWh capacity with 250 km from the coast.
In September 2011, researchers at the University of Windsor in Canada—in partnership with the Hydrostor company—installed a prototype vessel in Lake Ontario. They anchored it to the seabed at a depth of about 80 m (Cheung et al., 2014b). The design, manufacturing and testing of sub-scale prototypes have been developed (Pimm et al., 2014). Three scaled prototypes have been presented: two 1.8 m diameter bags in a 2.4 m deep tank of fresh water in a laboratory at University of Nottingham, and a 5 m diameter bag at 25 m ocean depth at European Marine Energy Centre (EMEC) in Orkney. Results showed that the main sources of leaks were stitching and repairs of Energy Bags, but they have appeared ready for deployment at larger scales. Operational data from this pilot power plant were used for energy and exergy analyses.
In Wang et al. (2016b) and Ebrahimi et al. (2019), the exergy efficiency was evaluated for the real and inevitable thermodynamic cycle. The first cycle has a 53.6% efficiency, while the second has a 84.3% efficiency. Consequently, a large part of exergy destruction can be avoided with proper design and management of power plant component and specifically for thermal storage, compressors and last turbine stages. In Szablowski et al. (2017) a dynamic model of an underwater A-CAES was built with the software Aspen HYSYS. This study showed a round efficiency of the system equal to 50%.
In Wang et al. (2016a) a multilevel underwater CAES concept is proposed and analyzed. The multilevel UWCAES is designed to store compressed air in vessels placed at different depths to improve the partial load behavior of the compression and expansion systems. The results of the study show that the efficiency of the entire 2-level UWCAES system varies from 62 to 81%, depending on the proportion of the different ones.
This work is part of the branch of the literature on UWCAES systems concerning plant optimization and evaluation of potential. From what seen so far, the literature has dealt with this issue with various contributions but there does not seem to be any work on the potential of a huge UWCAES plant coupled to renewable energy sources. This is the main motivation behind this study. It has been carried out with the aid of Dynamic Programming (DP) for the optimal management of the plant and for the identification of the rated capacity of the storage system as well as rated power of compression and expansion units. The models of both the machinery and the storage system are those well-verified in the literature.
As state Italian and European public platforms provide detailed data on both electricity consumption and energy production from renewable sources of the Sicily region, which will be presented in the next section, it was decided to study the potential of a very large storage plant for carbon-free power supply of the largest island in the Mediterranean.
4. Scenario and Data Analysis
After having analyzed the technological advantages of UWCAES and the state of the art on the development of these systems, it is timely to proceed to the introduction of the system proposed in this work: a UWCAES plant coupled to renewable energy sources to fully satisfy the electric load of an entire Italian region (Sicily) without the use of electricity generated by fossil sources. Before introducing and describing the proposed system, the current characteristics of the region in terms of energy consumption and production of electricity from renewable sources are presented.
4.1. Electric Load and Actual Renewable Power
Sicily is the largest island in the Mediterranean Sea and one, as well as the largest, of the 20 regions of Italy. It has a total area of 25832.39 km2 and a population, as for June 2020, equal to 4,948,034 inhabitants (Istituto Nazionale di Statistica (Istat), 2020), (Istituto Nazionale di Statistica (Istat), 2013). Consequently, the overall island population density is equal to 191.54 inhabitants per km2.
Regarding the energy needs, Sicily required a total of 19048.4 GWh of electricity in 2018. Electricity produced, from all energy sources, within the island, in the same year, was equal to 15593.7 GWh. Consequently, the remaining amount of 3454.7 GWh of electricity was imported from the mainland (TERNA S.p.A., 2018). Considering the Italian grid electricity emission factor of 312 gCO2/kWh that takes into account the fuel mix for electricity generation, the total CO2 emissions attributable to the Sicily region amount to 5943100.8 tons (Istituto Superiore per la Protezione e la Ricerca Ambientale (ISPRA), 2019).
Sicily exploits several renewable energy sources: hydraulic, wind, photovoltaic, and bioenergies (which includes biomass, biofuels, and biogas). Total production from renewable energy sources is equal to 5388.4 GWh, representing the 34.6% of total energy request. Wind and photovoltaic are the most important and accounts for 59.6 and 33.2% of the total renewable production. Table 4 summarizes the renewable plants installed power and generation in Sicily, including energy annual capacity values, in 2018 (Gestore dei Servizi Energetici S.p.A., 2019).
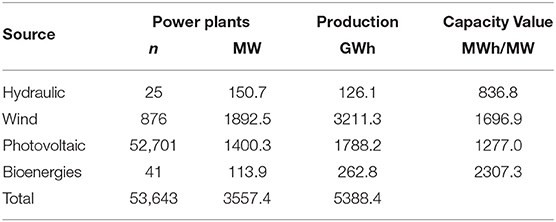
Table 4. Sicily renewable power plants installed numbers, total power, and production (year 2018) (Gestore dei Servizi Energetici S.p.A., 2019).
The information about energy consumption and production of electricity from photovoltaic and wind, included in the annual reports provided, for Italy, by TERNA (national company that owns the national grid) and GSE (the Italian energy services operator), are reported as aggregate data (TERNA S.p.A., 2018; Gestore dei Servizi Energetici S.p.A., 2019). Although TERNA makes available an online tool for downloading data, it is not possible to download production data differentiated by region, while data of electric load can be downloaded (with power measured every 15 min). The ENTSO-E Transparency platform meets this limitation. ENTSO-E Transparency Platform is a central collection and publication of electricity generation, transportation and consumption data, and information for the pan-European market (ENTSO-E Transparency Platform, 2014).
For Italy, ENTSO-E provides hourly load and generation data (Open Power System Data, 2020). The analysis of these data shows an energy demand equal to 17656.9 GWh, an energy production from wind equal to 3129.0 GWh and a photovoltaic production of 1355.1 GWh. The fact that ENTSO-E provides values every hour therefore implies a measurement of load and annual production lower than the real ones. Consequently, in order to use the ENTSO-E data, it was decided to insert a multiplication factor in order to adapt consumption and production to real data. Table 5 compares TERNA/GSE with ENTSO-E data, while the ENTSO-E data, multiplied by the relative correction factor, are shown in Figure 5. A synthetic representation of the corrected ENTSO-E data is shown in Figure 7.
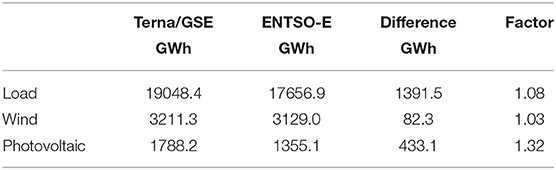
Table 5. Difference between TERNA and GSE data and ENTSO-E data (year 2018) (Open Power System Data, 2020; TERNA S.p.A., 2018; Gestore dei Servizi Energetici S.p.A., 2019).
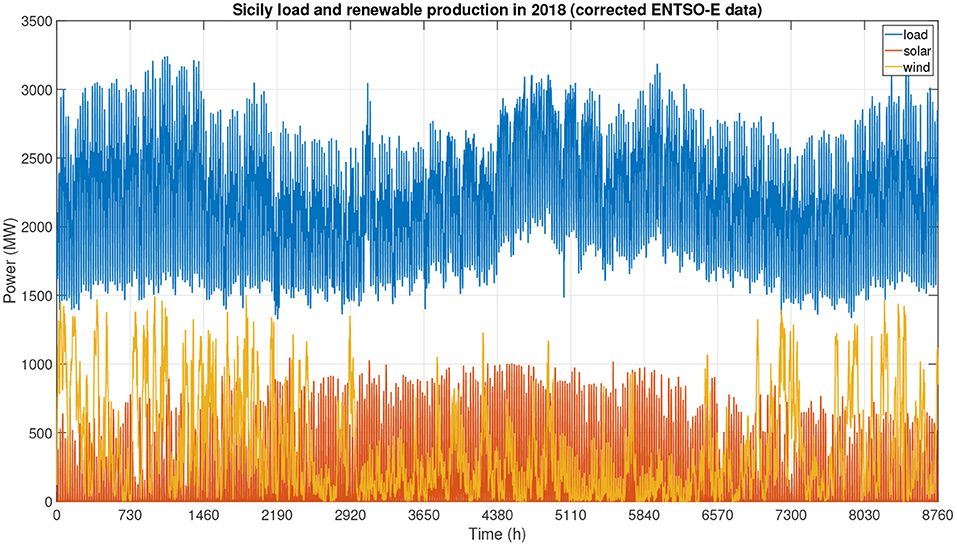
Figure 5. Sicily load and renewable (solar photovoltaic and wind) production in 2018 (corrected ENTSO-E data) (Open Power System Data, 2020).
From the analysis of the data it has been verified that, during the year, the sum of the wind power and the photovoltaic power at any time is never greater than the power required by the load. Consequently, the two renewable sources are never able, even in a single hour during the year, to meet the energy needs of the region.
4.2. Proposed Case Study Scenario
In this work it is therefore proposed to satisfy the load of the Sicily region completely through renewable energy sources. Since the contributions from hydraulic sources and bioenergy represent a very low share and furthermore no hourly production data is available, these two sources will not be considered. Consequently, the only two sources considered will be wind and photovoltaic.
Since the installed power and the annual capacity values of the plants is known, as shown in Table 4, it is possible to evaluate how much it is necessary to increase the power of the plants powered by renewable energy sources so that the energy produced by them can fully satisfy the load. Since load and production cannot be synchronized, plants powered by renewable sources must have a nominal power such that the surplus of energy produced during the year is approximately equal to the deficit of energy in the same time period. Therefore, the storage of the generation surplus and its exploitation in energy deficit periods can guarantee the fulfillment of the load exclusively through renewable energy sources.
These considerations on the required power levels must take into account the efficiency of the compression and expansion processes of the CAES project for energy storage and recovery. As will also be reported in the following sections, a value of both compression and expansion efficiency equal to 0.8 is used.
For simplicity, given the annual capacity values of renewable energy sources derived from corrected ENTSO-E data, it was decided to give the same nominal power value to wind and photovoltaic power plants. Therefore, by choosing a power of 7,500 MW for the wind power plants and the same power value for the photovoltaic ones, a generation surplus during the year (which can be stored) equal to 8953.4 GWh is obtained, which reduces to 7162.7 GWh considering compression efficiency, while the energy deficit (which can be covered by exploiting the stored energy) is equal to 5667.0 GWh. This energy is covered by the 7162.7 GWh amount of energy stored by the compression phase that in turn reduces to 5730.1 GWh considering expansion efficiency.
Figure 6 shows the new power levels of the wind and photovoltaic plants, while Figure 7 shows their synthetic representation. There are periods in which the power of the plants powered by renewable sources is greater than the load and others in which it is less. The purpose of the storage system is precisely to balance these conditions and follow the load.
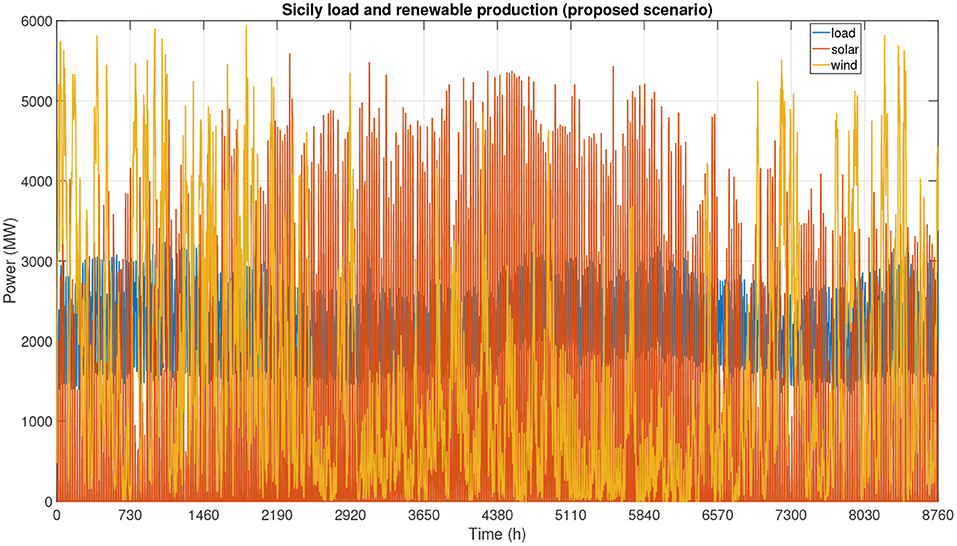
Figure 6. Sicily load and renewable (solar photovoltaic and wind) production (proposed scenario).
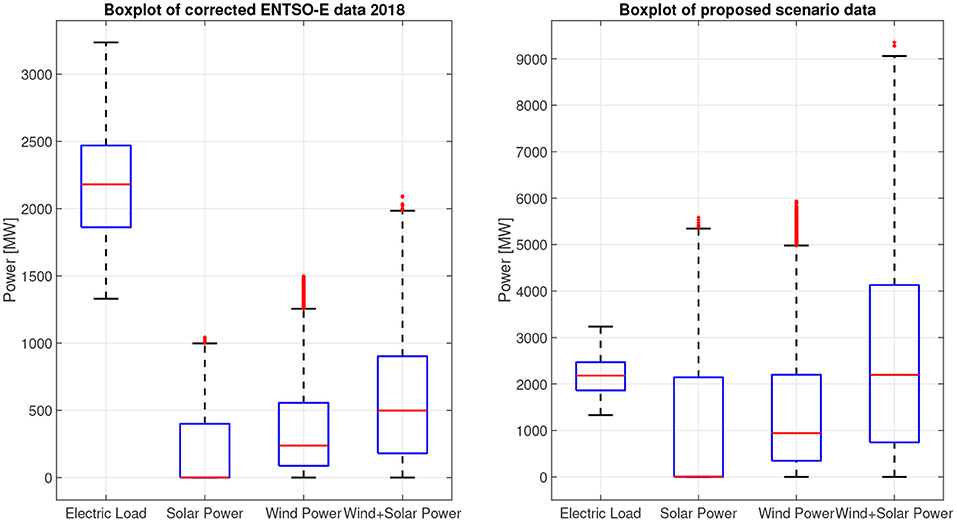
Figure 7. Boxplots of corrected ENTSO-E data for 2018 and of proposed scenario data.
5. Model and Simulations
5.1. Energy Storage Plant and Assumptions
The surplus of electricity produced by renewable energy plants is stored in an underwater reservoir. Since Sicily has areas with depths of more than 400 m, a storage pressure equal to 40 bar was chosen. The maximum power surplus, that is the maximum difference between the sum of the wind and photovoltaic power and the load, is equal to 6829.0 MW. The maximum deficit, that is the maximum difference between the load and the sum of the wind and photovoltaic power, is equal to 3030.6 MW.
For these reasons, the following dimensions were selected:
• maximum power of the compression system: 6,900 MW;
• maximum power of the generation system: 3,100 MW;
• maximum volume of the air deposit: 2.1 × 10⁸ m3.
This maximum power cannot be processed by a single compression or expansion machine. Similarly, multiple storage units will have to be provided to achieve all the necessary volume. However, it is possible to provide a general indication on the configuration of a single system unit (compression and expansion machines) and of the thermal storage system.
With reference to Figure 8, the compression unit has one stage, while the expansion unit has three stages. The surplus electricity produced by the renewable energy sources powers an electric motor (M) that drives the air compressor. The heat storage (HS) refrigerates the air from the compression stage (C1) which is then stored in the underwater energy storage (ES). When air is extracted from ES, it is heated up in HS and is directed to the first expansion stage (E1). Before entering in the second (E2) and the third (E3) expansion stages, air is heated up in HS. The air expander activates an electricity generator (G) that generates the required power.
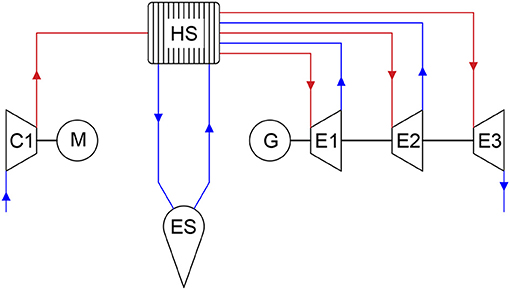
Figure 8. Power plant unit configuration.
It is timely to introduce the assumptions considered in this paper:
• air entering each compression stage is assumed at a temperature of 293.15 K (20 °C);
• air storage is assumed at a constant temperature and equal to 283.15 K (10 °C);
• since the system would be splitted in multiple units, constant efficiency equal to 0.8 for both compressor and expansion systems is assumed;
• heat storage at a constant temperature equal to 800 K (623.15 °C), (presumably molten salts);
• the compression ratio of compression stage is equal to 40;
• the expansion ratio of each expansion stage is equal to 3.40;
5.1.1. Compression
Energy from the wind farm and the photovoltaic system is supplied to the compression system. The power of the compressor stage is computed by the following relationship:
5.1.2. Expansion
The power produced by every stage of expansion can be determined by the well-known relationship:
5.1.3. Storage
For the air storage, a compensated constant pressure and temperature reservoir is used. Volume, V, during charging and discharging processes can be computed by solving the following equations, expressing the conservation of mass and energy with the ideal gas model for air:
The reservoir volume, V, varies depending on charging and discharging flow rates. Simulations have shown that the initial value of the reservoir volume can be lowered down to 9 × 10⁵ m3 without losing the desired outputs. For the simulation, the chosen initial value is set to 1 × 10⁶ m3. The upper constraint of the reservoir is set 5 × 10⁸ m3, while the lower constraint is put equal to 1 × 10⁵ m3. The constant temperature of stored air assumption can be justified considering the high volume of the reservoir and the constant temperature of deep water. In addition, charging and discharging processes are relatively slow enough to not alter the air temperature. This hypothesis has been widely considered in literature.
5.2. Dynamic Programming
Dynamic Programming (DP) is a numerical algorithm based on Bellman's optimality principle (Bellman, 1957) that minimizes a cost function while satisfying the system constraints. DP is implemented in Matlab by the DPM function developed by researchers from the Institute for Dynamic Systems and Control of ETH Zürich (Sundstrom and Guzzella, 2009; Elbert et al., 2012).
Dynamic programming is an optimization algorithm that breaks down a complex problem into a set of sub-problems and finds the optimal solution recursively. In this application, this feature of the algorithm was exploited to size the volume of the air reservoir so that the whole Sicily island was powered without the use of electricity taken from the national grid (and therefore partly non-renewable). DP algorithm performs a first backwards simulation starting from the final time t = tF to the initial time t = 0. Once the optimal operative parameters that minimize the cost function have been found, DP performs a forwards simulation from t = 0 going to t = tF in order to show the results.
As mentioned, the objective is to minimize the annual use of electricity from the national grid which is produced with a generation mix including conventional power plants which emits pollutant gas and CO2.
At each iteration of the DP program, the state variable xk representing the volume of the reservoir is updated. This state variable is controlled by means of the control variable uk. The control variable changes its definition depending on the state of the system (surplus of renewable energy storage mode, or deficit of renewable energy generation mode). Specifically:
Storage mode
where Pcompression,k is the kth compression power, Prenewable,k is the kth power from renewable energy sources and Pload,k is the kth load.
Generation mode
where Pexpansion,k is the kth expansion power.
The final value of the state variable xk is constrained to fall within a certain neighborhood of the initial values, while the control variable is constrained between 0 and 1. Additionally, the state variable must respect a certain range of values during simulations. The minimization of the cost function and the respect of state variable constrains involve the control variable uk.
Whenever an energy surplus occurs (i.e., renewable energy > load), the optimization algorithm decides if the surplus should be supplied to the compression system in order to store it as compressed air or redirect it to the national grid. Conversely, whenever there is an energy deficit (i.e., renewable energy < load), the algorithm decides if the deficit should be covered by activating the expansion system and withdraw air from the reservoir or by supply it from the national grid.
6. Results
Figure 9 shows the trend in the volume of the air reservoir during the year, as well as the air processed by the compression and expansion systems. As it can be seen, the compression and expansion systems are active, at variable loads, throughout the year. The volume of the air reservoir starts from the initial established value (1 × 10⁶ m3) and reaches two plateaus of approximately 1.56 × 10⁸ and of 2 × 10⁸ in the central part of the year. After 5,110 h, i.e., at the beginning of August, the reservoir discharge phase begins, thus intensifying the production of energy from the expansion system. At the end of the analyzed period, the volume of the reservoir fluctuates around the initial value and finally ends in a very narrow neighborhood of this value (± 1%).
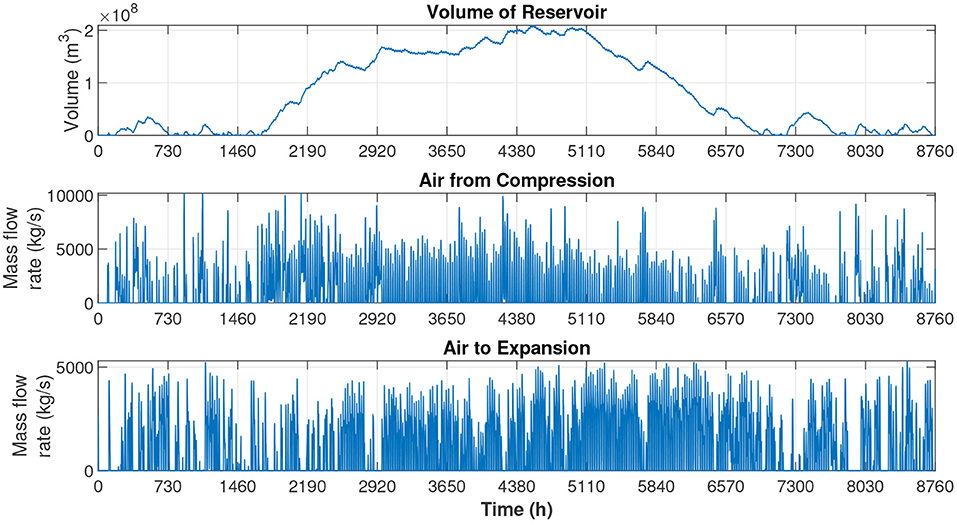
Figure 9. Volume of the air reservoir and mass flow rates from compression and expansion systems over the year.
Wind and solar plants produce 12,760 and 9,588 GWh respectively, for a total of 22,348 GWh. As shown in Figure 10, this energy is mainly used directly to satisfy the load. In fact, 52%, or about 13,400 GWh, of renewable energy is directly used, while 26%, or 6,620 GWh, is stored in the air reservoir, 9%, or 2,330 GWh, is sold to the national grid, and 13%, or 3,281 GWh, is lost during compression and expansion processes. No amount of energy is drawn from the national grid. Consequently, the load of the Sicily region can be fully satisfied without the emission of CO2.
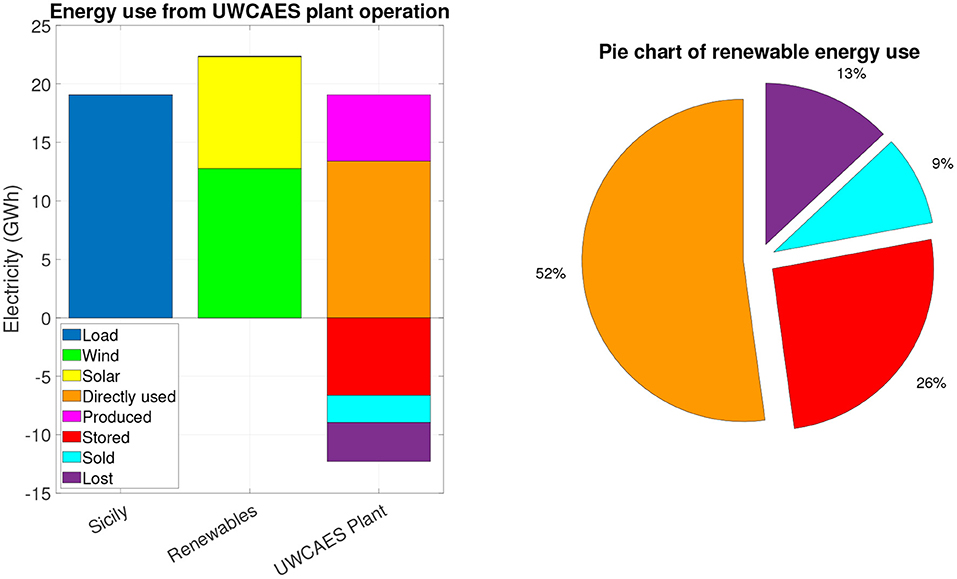
Figure 10. Energy use from UWCAES plant operation.
As an example, Figure 11 shows the details of the optimization process in the first week of August (from hour 5,112 to hour 5,280 of the year). The required electrical load is shown in blue and the total renewable power (sum of wind and photovoltaic) with the green solid line. In the time periods in which the renewable power is higher than the load, the surplus of energy is stored in the air reservoir (red line) or transferred to the grid (cyan line). On the contrary, in the time periods in which the renewable power fails to satisfy the load, the expansion system (purple line) is activated which generates the required energy.
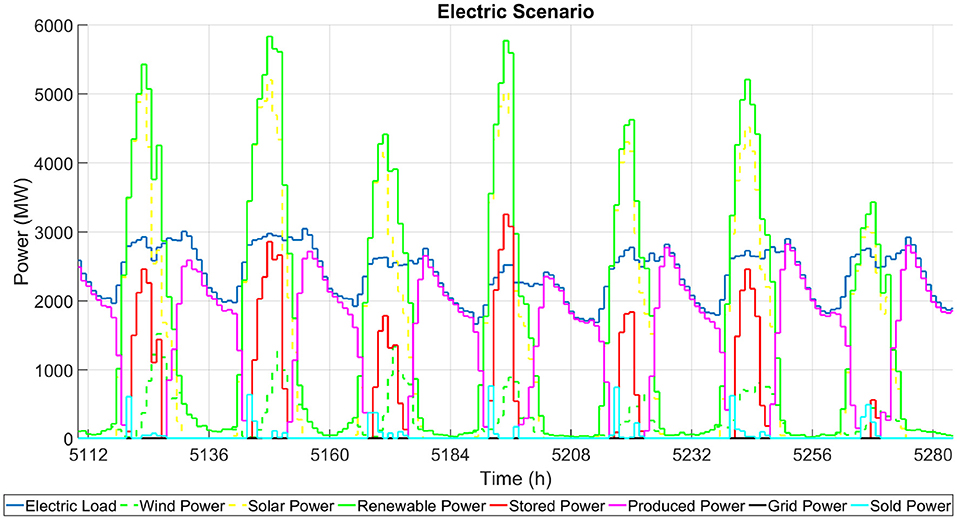
Figure 11. Optimal management for the first week of August.
7. Sensitivity Analysis
In order to study the effects of the variation of both renewable energy power and of load request, a sensitivity analysis has been performed. Table 6 summarizes the results of the sensitivity analysis where the energy load from the Sicily island is kept constant while solar and wind power plants energy outputs vary individually between 90 and 110% of reference one. It can be noted that with a drop in the energy produced by one of the two renewable source power plants, it is still possible to satisfy the entire load of the users without withdrawing energy from the grid. In these cases, the quantity of energy transferred to the grid is reduced by around 1,000 GWh compared to the reference case, as well as an increase in the energy stored and produced by around 300 GWh. On the contrary, if there is an increase in one of the two sources compared to the reference case, there is a slight increase in the renewable energy directly used as well as a significant increase, by around 1,000 GWh, in the energy transferred to the grid. In addition, it is necessary to increase the power of the compression system up to 7,300 MW in order to accumulate a greater amount of energy.
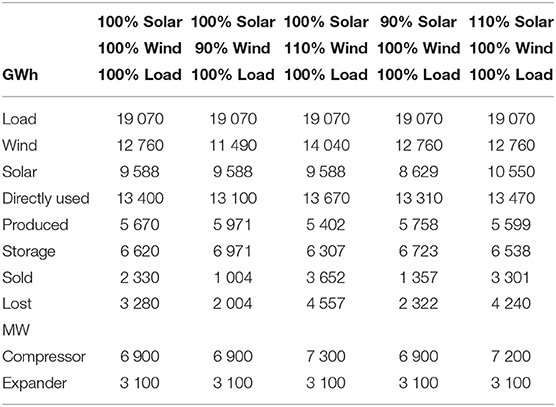
Table 6. Sensitivity analysis of the performance of the UWCAES power plant with fixed load from the users and variable energy from the renewable power plants.
Therefore, this first analysis shows that exist optimal operating margins for the proposed plant when the energy produced from renewable sources varies.
Table 7 shows the results of the sensitivity analysis in which the user load increases or decreases by 10% compared to the reference case. In the first condition, the renewable power of the reference case is no longer sufficient to power the user without withdrawing electricity from the grid. On the other hand, the storage system is able to guarantee the satisfaction of the load without using energy from the grid only if there is an increase in the energy produced by one of the renewable sources, wind or solar, or both. If only one source increases, the share of energy sold (or transferred) to the network must necessarily be less than that sold in the reference case and, consequently, the shares of energy stored and produced increase. Since the power to accumulate and to produce is greater, it is also necessary to increase the rated power of the compression and expansion units by 500 and 300 MW, respectively. In the second case, i.e., the one in which there is a 10% reduction in the energy required by the user and in the production of energy from renewable sources, it can be noted that the proposed system is still able to satisfy the user without withdrawing energy from the national grid.
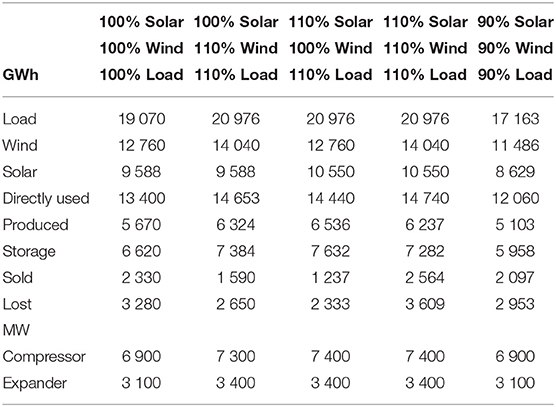
Table 7. Sensitivity analysis of the performance of the UWCAES power plant with variable load from the users and energy from the renewable power plants.
8. Conclusions
The paper presents a case study on powering the load of the Sicily region (Italy) exclusively through renewable energy sources. For this purpose it is mandatory to use an energy storage system that can accumulate the generation surplus and then use it when required. The storage system studied is the underwater compressed air energy storage (UWCAES). The optimization of the plant operation is achieved through dynamic programming. The algorithm itself was also used to size the volume of the air reservoir so that the condition of no energy withdrawal from the national grid was satisfied.
The Sicily region is one of the most suitable sites in the world for the installation of UWCAES storage systems as it has depths of more than 400 m within 5 km from the coast.
Based on the annual capacity value of the wind and photovoltaic plants currently installed in Sicily, thanks to the data made available by the owner of the Italian electricity grid (TERNA), by the Italian energy services operator (GSE) and by ENTSO-E Trasparency Platform, in order to satisfy the load of the region, which has peaks of around 3,250 MW, it is necessary to install renewable power equal to 15,000 MW. This power has been selected equally divided between solar and wind in this study. The generation part must be associated with an air compression, accumulation and expansion system for the production of energy. Together, these components represent the UWCAES plant. The compression system has a total power of 6,900 MW, the generation units have a total power of 3,100 MW, while the air storage takes place in submarine reservoirs at 40 bar pressure that can reach a maximum volume of 2 × 10⁸ m3.
Results show that this system configuration, properly managed, can guarantee the satisfaction of the load without recurring to energy produced by conventional sources. Consequently, the emissions of nearly 6 million tons of CO2 associated with the production of the electricity consumed by the Sicily region (about 19,000 GWh in 2018) can be avoided.
Finally, a sensitivity analysis was also carried out by varying by ± 10% both the power requested by users and that generated by plants powered by renewable sources. This analysis has shown that it is possible to pursue the objective, that is to satisfy the load without withdrawing energy from the grid, only if the increase in the load required by the users corresponds to an increase in the power of at least one of the two renewable sources. In some cases, this would lead to an increase in the nominal power of the compression and expansion units. On the contrary, the reduction of the required load and of the power supplied by plants powered by renewable sources is compatible with the objective of this study.
Data Availability Statement
The original contributions presented in the study are included in the article/supplementary material, further inquiries can be directed to the corresponding author/s. The datasets analyzed for this study can be found here: https://bit.ly/3n98C6Y.
Author Contributions
All authors listed have made a substantial, direct and intellectual contribution to the work, and approved it for publication.
Conflict of Interest
The authors declare that the research was conducted in the absence of any commercial or financial relationships that could be construed as a potential conflict of interest.
References
Arsie, I., Marano, V., Moran, M., Rizzo, G., and Savino, G. (2007). “Optimal management of a wind/caes power plant by means of neural network wind speed forecast,” in European Wind Energy Conference and Exhibition, The European Wind Energy Association (EWEA) (Milan).
Arsie, I., Marano, V., Nappi, G., and Rizzo, G. (2005). “A model of a hybrid power plant with wind turbines and compressed air energy storage,” in ASME Power Conference (Chicago, IL), Vol. 41820, 987–1000.
Arsie, I., Marano, V., Rizzo, G., Savino, G., and Moran, M. (2006). “Energy and economic evaluation of a hybrid caes/wind power plant with neural network-based wind speed forecasting, (Chicago, IL),” Proc. of ECOS, 12–14.
Bernitsas, M. M., Raghavan, K., Ben-Simon, Y., and Garcia, E. (2008). Vivace (vortex induced vibration aquatic clean energy): a new concept in generation of clean and renewable energy from fluid flow. J. Offshore Mech. Arctic Eng. 130:041101. doi: 10.1115/1.2957913
Borel, L., and Favrat, D. (2010). Thermodynamics and Energy Systems Analysis: From Energy to Exergy. Lausanne: EPFL Press.
Cheung, B., Cao, N., Carriveau, R., and Ting, D. S.-K. (2012). Distensible air accumulators as a means of adiabatic underwater compressed air energy storage. Int. J. Environ. Stud. 69, 566–577. doi: 10.1080/00207233.2012.699360
Cheung, B. C., Carriveau, R., and Ting, D. S. (2014a). Multi-objective optimization of an underwater compressed air energy storage system using genetic algorithm. Energy 74, 396–404. doi: 10.1016/j.energy.2014.07.005
Cheung, B. C., Carriveau, R., and Ting, D. S.-K. (2014b). Parameters affecting scalable underwater compressed air energy storage. Appl. Energy 134, 239–247. doi: 10.1016/j.apenergy.2014.08.028
De Jong, M. (2014). Commercial grid scaling of energy bags for underwater compressed air energy storage. Int. J. Environ. Stud. 71, 804–811. doi: 10.1080/00207233.2014.947726
Díaz-González, F., Sumper, A., and Gomis-Bellmunt, O. (2016). Energy Storage in Power Systems. Chichester: John Wiley & Sons.
Ebrahimi, M., Carriveau, R., Ting, D. S.-K., and McGillis, A. (2019). Conventional and advanced exergy analysis of a grid connected underwater compressed air energy storage facility. Appl. Energy 242, 1198–1208. doi: 10.1016/j.apenergy.2019.03.135
Elbert, P., Ebbesen, S., and Guzzella, L. (2012). Implementation of dynamic programming for n-dimensional optimal control problems with final state constraints. IEEE Trans. Control Syst. Technol. 21, 924–931. doi: 10.1109/TCST.2012.2190935
ENTSO-E Transparency Platform. (2014). Homepage. Available online at: https://transparency.entsoe.eu/ (accessed December 11, 2020)
Fiaschi, D., Manfrida, G., Secchi, R., and Tempesti, D. (2012). A versatile system for offshore energy conversion including diversified storage. Energy 48, 566–576. doi: 10.1016/j.energy.2012.10.006
Gestore dei Servizi Energetici S.p.A. (2019). Rapporto statistico 2018 - fonti rinnovabili. Technical report.
Global Monitoring Laboratory. (2016). Trends in Atmospheric Carbon Dioxide. Available online at: https://bit.ly/2AVlFWs (accessed June 9, 2020)
Istituto Nazionale di Statistica (Istat). (2020). Demographic Balance for the Year 2020 (Provisional Data), Region: Sicilia. Available online at: https://bit.ly/39XEkAh (accessed December 11, 2020)
Istituto Nazionale di Statistica (Istat). (2013). Superfici delle unità amministrative a fini statistici. Available online at: https://www.istat.it/it/archivio/82599 (accessed December 11, 2020)
Istituto Superiore per la Protezione e la Ricerca Ambientale (ISPRA). (2019) Fattori di emissione atmosferica di gas a effetto serra nel settore elettrico nazionale e nei principali paesi europei. Available online at: https://bit.ly/3487KYI (accessed December 13, 2020).
Kim, Y., and Favrat, D. (2010). Energy and exergy analysis of a micro-compressed air energy storage and air cycle heating and cooling system. Energy 35, 213–220. doi: 10.1016/j.energy.2009.09.011
Kim, Y., Shin, D., and Favrat, D. (2011). Operating characteristics of constant-pressure compressed air energy storage (caes) system combined with pumped hydro storage based on energy and exergy analysis. Energy 36, 6220–6233. doi: 10.1016/j.energy.2011.07.040
Letcher, T. M., Law, R., and Reay, D. (2016). Storing Energy: With Special Reference to Renewable Energy Sources, Vol. 86. Oxford: Elsevier.
Lim, S. D., Mazzoleni, A. P., Park, J.-K., Ro, P. I., and Quinlan, B. (2013). Conceptual design of ocean compressed air energy storage system. Mar. Technol. Soc. J. 47, 70–81. doi: 10.4031/MTSJ.47.2.5
Lund, H., and Salgi, G. (2009). The role of compressed air energy storage (caes) in future sustainable energy systems. Energy Convers. Manage. 50, 1172–1179. doi: 10.1016/j.enconman.2009.01.032
Luo, Y., and Wang, X. (2010). Exergy analysis on throttle reduction efficiency based on real gas equations. Energy 35, 181–187. doi: 10.1016/j.energy.2009.09.008
Marano, V., Rizzo, G., and Tiano, F. A. (2012). Application of dynamic programming to the optimal management of a hybrid power plant with wind turbines, photovoltaic panels and compressed air energy storage. Appl. Energy 97, 849–859. doi: 10.1016/j.apenergy.2011.12.086
Mas, J., and Rezola, J. M. (2016). Tubular design for underwater compressed air energy storage. J. Energy Storage 8, 27–34. doi: 10.1016/j.est.2016.08.006
National Aeronautics Space Administration (NASA) Goddard Institute for Space Studies (GISS). (2017). Giss Surface Temperature Analysis (v4). Available online at: https://go.nasa.gov/30mpC0K (accessed June 9, 2020)
Open Power System Data. (2020). Time Series. Available online at: https://bit.ly/3n98C6Y (accessed December 11, 2020)
Pete, C., McGowan, J. G., and Jaslanek, W. (2015). Evaluating the underwater compressed air energy storage potential in the gulf of maine. Wind Eng. 39, 141–148. doi: 10.1260/0309-524X.39.2.141
Pimm, A., and Garvey, S. (2009). Analysis of flexible fabric structures for large-scale subsea compressed air energy storage. J. Phys. Confer. Ser. 181:012049. doi: 10.1088/1742-6596/181/1/012049
Pimm, A. J., Garvey, S. D., and de Jong, M. (2014). Design and testing of energy bags for underwater compressed air energy storage. Energy 66, 496–508. doi: 10.1016/j.energy.2013.12.010
Pimm, A. J., Garvey, S. D., and Drew, R. (2011). Shape and cost analysis of pressurized fabric structures for subsea compressed air energy storage. Proc. Inst. Mech. Eng. Part C J. Mech. Eng. Sci. 225, 1027–1043. doi: 10.1177/0954406211399506
Sundstrom, O., and Guzzella, L. (2009). “A generic dynamic programming matlab function,” in 2009 IEEE Control Applications, (CCA) & Intelligent Control, (ISIC) (Petersburg: IEEE), 1625–1630.
Szablowski, L., Krawczyk, P., Badyda, K., Karellas, S., Kakaras, E., and Bujalski, W. (2017). Energy and exergy analysis of adiabatic compressed air energy storage system. Energy 138, 12–18. doi: 10.1016/j.energy.2017.07.055
TERNA S.p.A. (2018). Dati statistici sull'energia elettrica in italia. Technical report, Sistema Statistico Nazionale (SISTAN). Available online at: https://bit.ly/2KaHdTs (accessed December 11, 2020)
Tiano, F. A., Rizzo, G., and Marra, D. (2018). Design and optimization of a charging station for electric vehicles based on compressed air energy storage. IFAC PapersOnLine 51, 230–235. doi: 10.1016/j.ifacol.2018.07.038
Vasel-Be-Hagh, A., Carriveau, R., and Ting, D.-K. (2013). Numerical simulation of flow past an underwater energy storage balloon. Comput. Fluids 88, 272–286. doi: 10.1016/j.compfluid.2013.09.017
Vasel-Be-Hagh, A., Carriveau, R., and Ting, D. S.-K. (2014). Underwater compressed air energy storage improved through vortex hydro energy. Sustain. Energy Technol. Assess. 7, 1–5. doi: 10.1016/j.seta.2014.02.001
Wang, Z., Ting, D. S.-K., Carriveau, R., Xiong, W., and Wang, Z. (2016a). Design and thermodynamic analysis of a multi-level underwater compressed air energy storage system. J. Energy Storage 5, 203–211. doi: 10.1016/j.est.2016.01.002
Wang, Z., Ting, D. S.-K., Carriveau, R., Xiong, W., and Wang, Z. (2019). Numerical and experimental investigation of flow around a balloon-shaped bluff body. Sustain. Energy Technol. Assess. 35, 80–88. doi: 10.1016/j.seta.2019.06.005
Wang, Z., Xiong, W., Ting, D. S.-K., Carriveau, R., and Wang, Z. (2016b). Conventional and advanced exergy analyses of an underwater compressed air energy storage system. Appl. Energy 180, 810–822. doi: 10.1016/j.apenergy.2016.08.014
Zakeri, B., and Syri, S. (2015). Electrical energy storage systems: a comparative life cycle cost analysis. Renew. Sustain. Energy Rev. 42, 569–596. doi: 10.1016/j.rser.2014.10.011
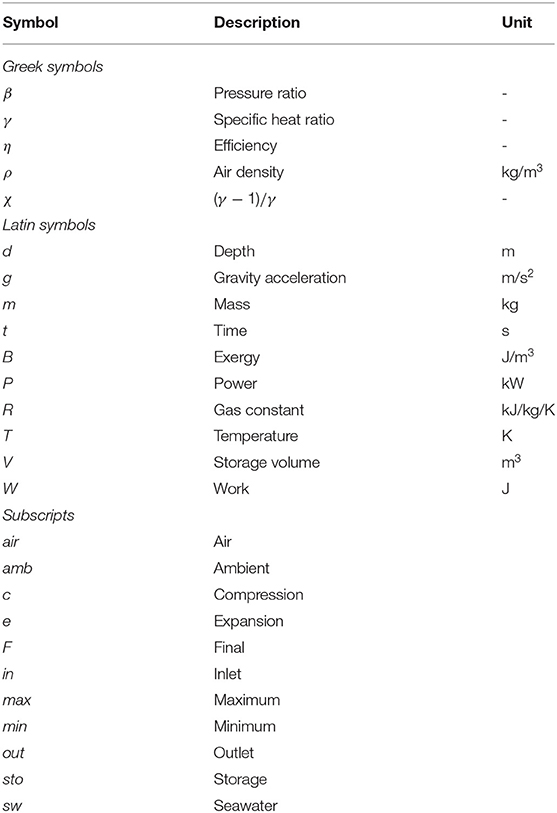
Nomenclature
Keywords: under-water compressed air energy storage, dynamic programming, energy bags, energy storage, renewable energy sources, wind, photovoltaic
Citation: Tiano FA and Rizzo G (2021) Use of an Under-Water Compressed Air Energy Storage (UWCAES) to Fully Power the Sicily Region (Italy) With Renewable Energy: A Case Study. Front. Mech. Eng. 7:641995. doi: 10.3389/fmech.2021.641995
Received: 15 December 2020; Accepted: 14 April 2021;
Published: 17 May 2021.
Edited by:
Konstantinos Kyprianidis, Mälardalen University College, SwedenReviewed by:
Theodoros Zannis, Hellenic Naval Academy, GreeceVasilis G. Gkoutzamanis, Aristotle University of Thessaloniki, Greece
Moksadur Rahman, ABB, Sweden
Copyright © 2021 Tiano and Rizzo. This is an open-access article distributed under the terms of the Creative Commons Attribution License (CC BY). The use, distribution or reproduction in other forums is permitted, provided the original author(s) and the copyright owner(s) are credited and that the original publication in this journal is cited, in accordance with accepted academic practice. No use, distribution or reproduction is permitted which does not comply with these terms.
*Correspondence: Francesco Antonio Tiano, ZnRpYW5vQHVuaXNhLml0
†These authors have contributed equally to this work