 Jan C. Thomas1Eric V. Mueller1Michael R. Gallagher2Kenneth L. Clark2
 Nicholas Skowronski3Albert Simeoni4
 Rory M. Hadden1*
- 1School of Engineering, University of Edinburgh, Edinburgh, United Kingdom
- 2Northern Research Station, USDA Forest Service, New Lisbon, NJ, United States
- 3Northern Research Station, USDA Forest Service, Morgantown, WV, United States
- 4Department of Fire Protection Engineering, Worcester Polytechnic Institute, Worcester, MA, United States
The hazards associated with firebrands have been well documented. However, there exist few studies that allow for the hazard from a given fire to be quantified. To develop predictive tools to evaluate this hazard, it is necessary to understand the conditions that govern firebrand generation and those that affect firebrand deposition. A method is presented that allows for time-resolved measurements of fire behavior to be related to the dynamics of firebrand deposition. Firebrand dynamics were recorded in three fires undertaken in two different ecosystems. Fire intensity is shown to drive firebrand generation and firebrand deposition—higher global fire intensities resulting in the deposition of more, larger firebrands at a given distance from the fire front. Local firebrand dynamics are also shown to dominate the temporal firebrand deposition with periods of high fire intensity within a fire resulting in firebrand shower at deposition sites at times commensurate with firebrand transport. For the range of conditions studied, firebrand deposition can be expected up to 200 m ahead of the fire line based on extrapolation from the measurements.
1 Introduction
The hazards associated with firebrands as the leading cause of structure ignitions in fires at the wildland–urban interface and as a fire spread vector are well documented (Caton et al., 2017; Hakes et al., 2017; Manzello et al., 2020)). In addition to predicting the hazard associated with the ignition of structures, better understanding of firebrand dynamics will aid the planning and execution of prescribed fires by allowing improved estimates of firebrand travel distances and ignition potential, allowing the firebrand hazard to be managed more effectively. Despite a large number of studies in recent years aimed at reproducing firebrand exposures for material testing (Manzello et al., 2008; Manzello and Suzuki, 2013; Thomas et al., 2018), identifying the ignition hazard posed by firebrands and firebrand accumulations (Manzello et al., 2017; Fernandez-Pello, 2017; Matvienko et al., 2018; Hakes et al., 2019), and the development of numerical models (Wadhwani et al., 2017), there exists very little information on firebrand exposures from wildland fires which captures the link between the dynamic quantities of firebrand deposition and fire behavior.
The primary sources of firebrand deposition data are generally associated with investigations carried out after large fires of special interest (Maranghides and Mell, 2011), or measurements of firebrand deposition after prescribed fires (El Houssami et al., 2016a; Filkov et al., 2017; Thomas et al., 2017). Such approaches have been limited in allowing the firebrand hazard to be quantified in terms of an integrated firebrand deposition and particle size distributions only.
To provide robust assessments of the hazard associated with firebrands, it is necessary to expand this approach to allow for the time-resolved firebrand exposure to be related to the fire behavior and the firebrand sources. This requires simultaneous measurements of the temporal dynamics of firebrand deposition and fire behavior and detailed quantification of the firebrand source.
1.1 Defining the Firebrand Hazard
The firebrand hazard is defined by the number, mass, geometry, and energy content of the firebrands landing in an area. In addition, the reaction condition (or temperature) of the firebrands is significant in determining whether the firebrands can result in the ignition of a substrate directly or by the formation of a smoldering accumulation. Such accumulations have been shown to be a leading cause of the ignition of structures (Manzello et al., 2020). Of particular significance in this context are the mass and time-resolved firebrand deposition. The hazard is defined explicitly to be independent of the conditions when the firebrand lands, e.g., fuel bed and environmental properties which may lead to ignition.
Quantification of the firebrands alone is therefore insufficient. It is essential to link them to the extrinsic factors such as the fuels (vegetative or structural) that are present; the ambient meteorological conditions, particularly the local wind field, to assess travel distances of the firebrands; and finally the fire behavior as this will influence the generation, injection height, and buoyant flow available. High temporal and spatial resolution measurements of these quantities are therefore needed to contextualize the firebrand hazard arising from a fire.
1.1.1 Generation of Firebrands
In the natural environment, firebrands primarily originate from bark fragments, branches, twigs, and foliage. The mechanisms of firebrand generation are not well understood; however, this logically requires the separation of the material from a parent body (plant, litter layer) due to combined thermal and mechanical forces (Barr and Ezekoye, 2013). The magnitude of these forces will be strongly dependent on the fire behavior (e.g., thermal environment and fire-induced flows) and the fuel present (e.g., structure and propensity to fragment). The fire dynamics will also determine the plume characteristics, which in turn will influence the transport of the firebrands.
1.1.2 Transport of Firebrands
The transport of firebrands depends on multiple factors including the plume injection into the atmosphere as determined by the heat release rate of the fire, atmospheric turbulence, the generation height of the firebrand as determined by the fuel structures, the shape of the particles, and the thermal and reaction conditions of the particles. This problem has been extensively studied (Tarifa et al., 1965; Woycheese et al., 1999; Koo et al., 2010); however, to be of use, their proposed methods require detailed fire behavior and firebrand characteristics.
1.1.3 Deposition of Firebrands
The deposition of firebrands is governed by the aerodynamic properties (shape, size, and mass) of the firebrands; the temperature evolution of the firebrands, including the combustion processes; and the local flow conditions downwind of the fire front. Very short-range firebrands are deposited close to the fire front, locally enhancing the fire spread rate. Longer range firebrand deposition, which may occur hundreds of meters or kilometers distant from the fire front, is influenced by the fire-induced flows which can act over these distances (Mueller et al., 2017), flow obstructions, and the wind profile (Heilman et al., 2019; Clark et al., 2020).
1.1.4 Condition of Firebrands
The condition of firebrands upon deposition (hot, cold, reacting) will depend on the fire behavior, the firebrand material, and the flow conditions. The vegetation characteristics, transport time, and velocity will also determine whether the firebrand is capable of sustaining combustion throughout its trajectory (Tarifa et al., 1965; Woycheese et al., 1999). The fire intensity and residence time will impact the heating and degradation of vegetation (Tarifa et al., 1965) during the generation and initial lofting processes. Few quantitative assessments of the thermal condition of firebrands have been made (Maranghides and Mell, 2011; Filkov et al., 2017); however, these have lacked contextualization with detailed fire behavior data.
1.2 Measuring the Firebrand Hazard
There have been a limited number of studies in which the firebrand generation and deposition have been related to fire behavior (El Houssami et al., 2016b; Thomas et al., 2017); however, these have not resolved the temporal dynamics of firebrand deposition and have presented only integral measurements of firebrand deposition and firebrand mass.
To provide data necessary to evaluate the hazard posed by firebrand deposition, an experimental methodology must allow determination of the following:
• the total and time-resolved firebrand deposition and firebrand characteristics (e.g., size and temperature) as a function of fire intensity and fuel type;
• the time-resolved firebrand deposition and relationship to fire behavior; and
• the firebrand deposition as a function of distance from the fire line.
Measurement of the time-resolved firebrand deposition from well-described real fires is essential in order to generate the data required to understand the risks posed by firebrands, for example, spot fires or structure ignitions, to develop appropriate test methods to evaluate risk, assess mitigation strategies, and develop predictive tools.
2 Methods
Three large-scale fire experiments were conducted to allow the measurement of time-resolved firebrand deposition dynamics while varying fire intensity, environmental conditions, and fuel types. Detailed measurements to quantify the fuels, time-dependent fire behavior, and firebrand dynamics were made as described in the following sections.
2.1 Site Descriptions
Two experiments were conducted at sites in the New Jersey Conservation Foundation Franklin Parker Preserve, within the New Jersey Pinelands National Reserve. The first unit was burned on the evening of March 6, 2017 (PPS), while the second unit was burned on the morning of March 23, 2017 (PPN). Both units were dominated by pitch pine (Pinus rigida Mill.), and neither unit had burned or been managed since a major wildfire in the spring of 1954. A square area within each unit measuring 250 m × 250 m was instrumented within each approximately 7-ha plot. PPN and PPS were both approximately flat with no significant topographical features within the area of interest. The pitch pine-dominated vegetation and previous prescribed fires in the surrounding landscape are described in the literature (El Houssami et al., 2016a; Filkov et al., 2017; Simeoni et al., 2017; Thomas et al., 2017; Mueller et al., 2018).
The third experiment was undertaken at the Tall Timbers Research Station & Land Conservancy in southern Georgia (TT). This site covered an area of approximately 3 ha and was burned on April 21, 2017. Prior management of this stand included a prescribed fire approximately one year prior to the current study. The forest overstory in this stand was composed of a monoculture of longleaf pine (Pinus taeda), while the understory was composed primarily of sweet gum (Liquidambar styraciflua), wiregrass (Aristida stricta), various southern shrub form oaks (Quercus spp.), and other forbs typical of the longleaf–wiregrass ecosystem. There were no significant topological features in the plot with the instrumented region of interest being approximately flat.
The ignition of each burn unit was undertaken to direct firebrands toward the collection sites. Ignition lines are shown in Figure 1. PPS was initially ignited along the northwest edge, turning through 90° and continuing along the southwest edge using a drip torch; later, a line was ignited moving approximately east to west; a final ignition line was made moving southeast toward the end of the fire. In the PPN fire, two drip torches were used to ignite a line perpendicular to the prevailing wind one moving northeast and the other southwest. Ignition of the TT fire was by vehicular mounted torch. Two lines were ignited initially: one moving southeast and the other southwest; later, a line was ignited moving approximately east to west through the unit. It is recognized that ignition may have an impact on firebrand generation, and this was controlled in PPS. Unfortunately, conditions at PPS and TT resulted in more complex behaviors which could not be assessed in the current work.
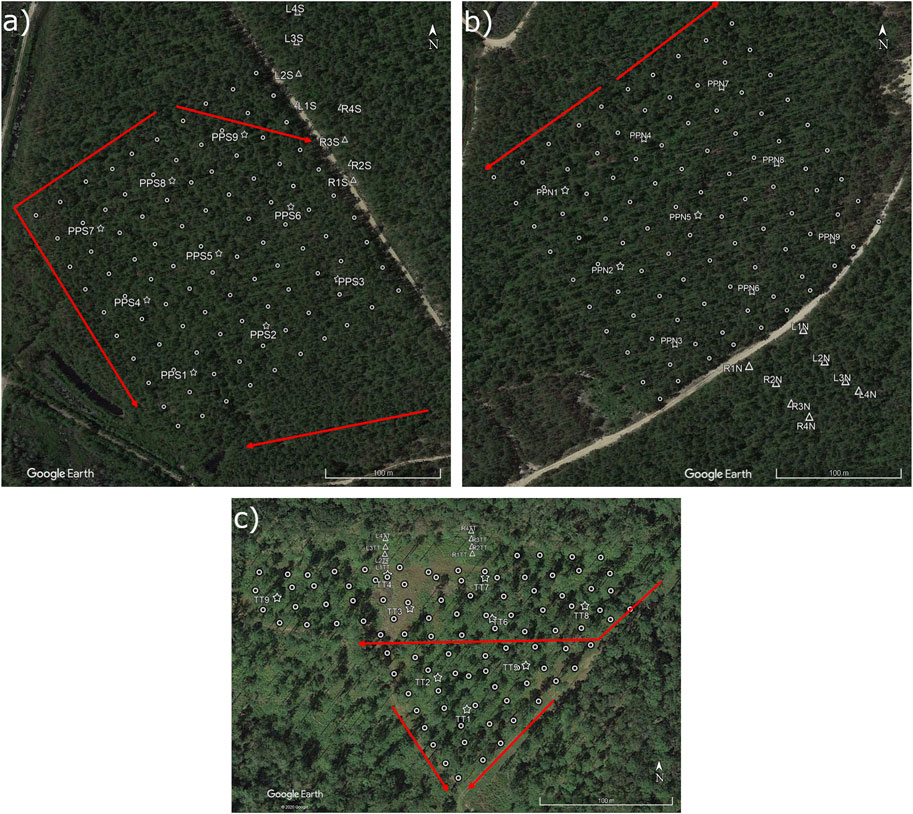
FIGURE 1. Site layout for 2017 experimental burns. (A) PPS, (B) PPN, and (C) TT. Circles: FireTrackers, Stars: Understory towers. Triangles: Firebrand Collection Sites. Sonic anemometers were located at R1S, R4S, R1N, L2N, R2TT, and L2TT. Ignition lines are marked with red arrows. The arrows show the direction of the ignitions, but it should be noted that these did not occur simultaneously in PPS and TT.
2.2 Fire Behavior Measurements
Fire behavior was characterized by measurement of the rate of spread, the fire line intensity, and the sub-canopy fire–induced flows.
2.2.1 Spread Rate and Fire Front Position
The progression of the fire front was tracked using a regular array of FireTrackers at ground level. These sensors consisted of individual Arduino Feather®–based data loggers with thermocouple amplifiers and GPS antennas in order to establish a consistent time stamp and location for all sensors. Temperature was measured using 1.5-mm-diameter K-type thermocouples, and data were logged at a frequency of 2 Hz. FireTrackers were buried such that the tip of the thermocouple protruded through the surface fuels. Sensors were placed at a nominal spacing of 25 m for the PPS (n = 92 successfully recorded) and PPN burns (n = 88), and 20 m for the TT burn (n = 91).
Fire arrival at a FireTracker was determined by a temperature rise of greater than 2°C⋅s−1. Arrival times were linearly interpolated onto a 5m × 5m grid, and the inverse of the gradient was used to calculate spread rate vectors. These were smoothed with a box filter, owing to regions of complex fire line interactions resulting in spuriously large values of spread. For each point, the filter takes the average of the nearest surrounding grid points (i.e., over a 10 m × 10 m area).
Nine 6.5-m tall understory towers, placed in a regular grid, were used to measure the vertical profile of gas temperature at the locations identified in Figure 1. Temperatures were measured at twelve vertical positions, with spacing of 0.5 m starting at 1.0 m from the ground. Probes were glass-insulated K-type thermocouples, with bead size of 1.2 ± 0.1 mm diameter. Data were recorded at 2 Hz on Arduino Feather® data logger units with thermocouple amplifiers. The flame height was estimated as the highest position at which a temperature of 300°C was recorded.
2.2.2 Fire Line Intensity
The fire line intensity was determined by using two methods: 1) based on fuel consumption and spread rate as described in Eq. 1, where χ is the combustion efficiency (assumed to be unity), Δhc is the heat of combustion (18.7 MJ⋅kg−1), Δm is the fuel consumed, and R is the spread rate (Byram, 1959); 2) based on local flame length as described in Eq. 2, where L is the flame length (assumed to be equal to flame height) (Alexander, 1982):
2.2.3 Wind Speed and Direction
Wind speed and direction were measured 10 m above ground level using a sonic anemometer (RM 80001V, R. M. Young, Inc.) and wind vane (05013-5, R.M. Young Co., Traverse City, MI, United States). This “control tower” measurement was located on the western edge of PPN and 0.89 km from PPS. Wind speed was measured with a precision of ±0.3 m⋅s−1 and a directional precision of ±3°. Ambient wind and temperature for the TT fire were recorded at 10 Hz with a sonic anemometer (RM 80001V, R. M. Young, Inc.) 350 m upwind of the burn unit in an area of open vegetation and canopy conditions. Additionally, wind speed and direction were measured at a height of 3 m with two sonic anemometers (RM 80001V, R. M. Young, Inc., 1 Hz) placed at selected firebrand collection sites, in order to monitor the conditions at the point of deposition (Figure 1).
2.3 Firebrand Measurement Techniques
2.3.1 Firebrand Generation
Previously, studies (El Houssami et al., 2016a; Thomas et al., 2017) demonstrated that firebrand generation in this ecosystem is dominated by bark flakes originating from tree boles. Consequently, in this work, it is assumed that all firebrands are generated by bark flakes. The total number of firebrands produced per tree, F, can be calculated from the following ratio:
where Δr is the radius reduction calculated from the circumference reduction, Cf is the post-fire perimeter, hs is the scorch height, τ is the characteristic thickness of a bark firebrand slice, and Af is the area of a firebrand. The following assumptions are made in the application of this method:
• Trees are cylindrical with no taper.
• Firebrand generation is constant around the trunk and extends from ground level to the scorch height.
• An average virgin bark flake is cuboidal with area, Af, and thickness, τ.
• The trunk only loses volume due to detachment of bark flakes as a first-order approximation.
The total number of firebrands produced is calculated using the following equation:
where FT is the total number of firebrands produced in the burn unit, SDI is the stand density index (trees⋅ha−1), and Ab is the area of the burn unit (m2).
Two or three trees were measured in the vicinity of each understory tower before and after the fires (depending on their proximity to the tower). A total of 25 measurements were made at PPN and 18 at PPS. Measurements of tree circumference were made a breast height before and after the fire. For improved measurement accuracy, the tree circumference was divided into eight segments which were measured individually (El Houssami et al., 2016a). When calculating the mass and total number of firebrands, the mass of a firebrand mf = 0.016 g and a value of 2,750 trees ha−1 are used (McCormick and Jones, 1973).
2.3.2 Firebrand Collection
Firebrands were collected following the established methods (Thomas et al., 2017), with the aim of assessing the temporal and spatial distribution dynamics of deposition. Firebrands were collected at eight firebrand collection sites (FCSs) in each fire. These were arranged in two transects (left and right) outside the burn unit with a nominal separation of 50 m between transects and 25 m between FCSs along a transect. The position of the FCSs is shown in Figure 1. Each FCS comprised fifteen, 0.22-m-diameter water-filled cans randomly distributed within a 3-m2-area, resulting in a total collection area at each FCS of 0.57 m2. Following an experiment, the number of firebrands and the distribution of their projected areas were measured for each can using image analysis, with a minimum detection threshold of 7.5 × 10⁻⁶ (Thomas et al., 2017).
Measurement of the time-dependent firebrand deposition was taken by correlating the arrival time as measured by a video camera facing one can at each FCS. These time-stamped data allowed firebrand deposition to be correlation to fire behavior measurements.
Analysis of the total firebrand deposition employed the following assumptions:
• Firebrands are deposited downwind of the fire and can be deposited inside and outside the burn area.
• Firebrands deposition inside the burn unit is constant.
• Firebrands travel in the direction of the ambient wind.
• The wind was ideally aligned with the burn unit and FCSs for the duration of the experiment.
• Outside deposition occurs in an area that has the same width as the burn unit (i.e., no lateral deposition occurs).
The validity of these assumptions is not known; however, in the absence of more detailed information, they are required to interpret the firebrand deposition. It is hoped that further work will allow improvements of these assumptions.
Furthermore, firebrand deposition is represented by a piecewise function:
where x is the distance from the primary ignition line which is located at − d, that is, d is the distance from the ignition line to the downwind edge of the burn unit (250 m in PPN and PPS). The firebrand deposition inside the burn unit is assumed to be constant, c, and g is the function representing the deposition of the firebrands outside the burn unit. The value of c is not measured in this work. Firebrand deposition data from all FCSs are evaluated against separation distance (x > 0) from the burn unit (measured in line with ambient wind direction). Finally, the function f″ can be integrated over the area of deposition to give f, and the total number of firebrands deposited inside and outside the burn unit.
3 Results and Discussion
Results pertaining to the fire behavior measurements are presented first before introducing the results from the firebrand generation, deposition, and characterization studies. Finally, the time-dependent firebrand deposition results are presented before a brief discussion contextualizing the total firebrand generation and deposition measurements.
3.1 Fire Behavior Measurements
The fire behaviors observed in the three experiments are discussed later. Details of the surface and canopy fuel loads, and fuel moisture content are given in the Supplementary Material.
3.1.1 Spread Rate
Maps of fire spread for all three fires are shown in Figure 2, and average spread rates are given in Table 1. Animated flame spread maps for PPN and PPS are given in the Supplementary Material (PPN_spread.mp4 and PPS_spread.mp4, respectively).
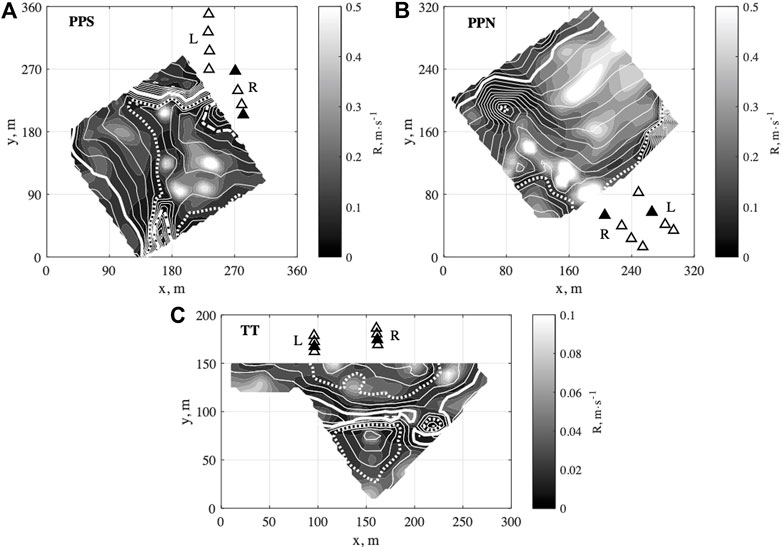
FIGURE 2. Maps of fire spread rate for the three experiments: (A) PPS, (B) PPN, and (C) TT. Grayscale shading corresponds to the spread rate. White contours are isochrones of fire position, shown in minutes from ignition for every (A) 2 min (bold line: 30 min; dotted line: 40 min; dashed line: 50 min), (B) 1 min (bold line: 6 min; dotted line: 16 min), and (C) 6 min (solid line: 12 min; dotted line: 30 min). Firebrand collection sites are shown as triangles, with black triangles indicating the sites which included sonic anemometers.
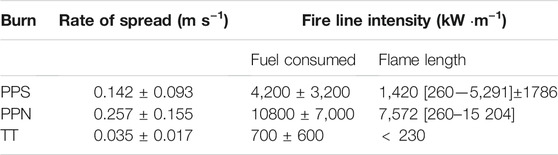
TABLE 1. Plot average (±1 SD) spread rate and fire line intensity (as calculated using Eq. 1 (Fuel consumed) and Eq. 2 (Flame length)). The measurements made using the flame length technique are presented as an average and with the range of calculated values in [ ].
PPN had the highest spread rate, with the highest local values of spread rate occurring between 7–9 min and 14–16 min after ignition. This was followed by PPS, which, although having a lower overall spread rate, had moments of locally high spread rates between 40 and 46 min after ignition. TT had a significantly lower spread rate than the pitch pine ecosystem, with a mean value which is nearly an order of magnitude less than that of PPN and PPS (Table 1). This is potentially due to a combination of lower fuel load; the prevalence of live, rather than dormant, shrubs; and a higher relative humidity. The measurements of fire front position indicate that ignition patterns (PPS and TT) and features such as local spotting and fuel discontinuity (PPN) have a significant effect on the fire development.
3.1.2 Fire Line Intensity
The average fire line intensities for each site, using both the fuel consumption and flame height methods, are listed in Table 1. Both estimation techniques show the same trends between the fires, although the flame length correlation consistently produces a lower value of intensity than the fuel consumption technique. The nature of this discrepancy is likely due to the assumption that flame length is equal to flame height, which is only approximated, as well as due to local variations in fuel consumption.
Comparing the tabulated values to previous work in similar fuels (Mueller et al., 2017; Thomas et al., 2017), PPN falls in the range of a high intensity surface fire with local crown involvement, PPS in a moderate to high intensity surface fire, and TT in a low intensity surface fire. In addition, temperature measurements 1 m above ground level did not exceed 300°C during the TT experiment. Low intensity is attributed to low ambient wind, and the presence is live foliage.
3.1.3 Wind Speed and Direction
Time histories of both the ambient wind (control tower) and winds at the firebrand collection sites are shown in Figure 3. For the PPS burn, winds averaged 0.8 ± 0.4 m⋅s−1 at the control tower for the 60-min period following ignition. The dominant direction was south/south to southeast at ignition, but this shifted to southwest around 24 min after ignition, aiding the coalescing of the secondary and tertiary ignition lines into a head fire. The local winds at the collection sites agreed with the ambient winds during the early stages of the fire, with site L1S having higher values due to its location on a road, as opposed to L4S which was placed within the stand opposite to the burn unit (Figure 1). Around 24 min after ignition, these sites experienced an increasing east wind, which may be attributed to the onset of a fire-induced indraft; however, the strongest influence is seen closer to the 45-min mark. Around this time, values exceed those of the ambient wind, reaching a maximum of 5.2 m⋅s−1 at L1S and 3.6 m⋅s−1 at L4S.
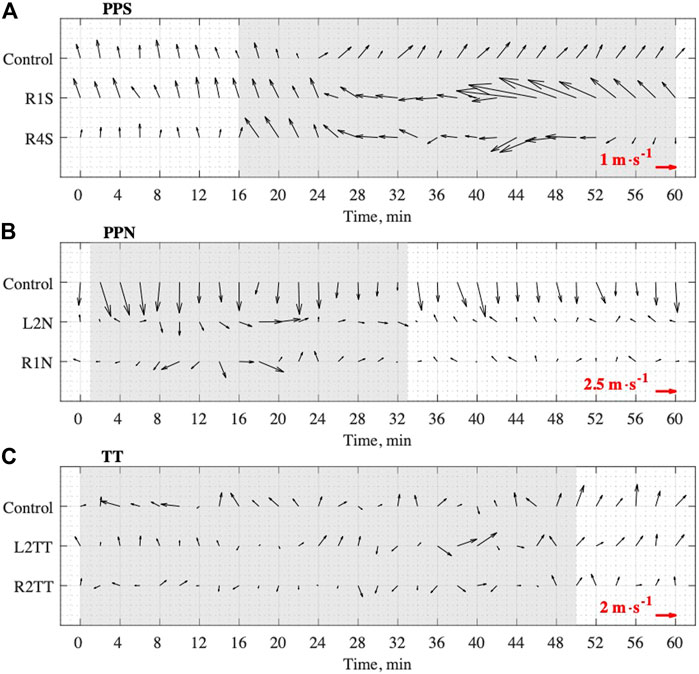
FIGURE 3. Wind characterization for three burns: (A) PPS, (B) PPN, and (C) TT. Each one showing a control location (10 m AGL) and two local measurements at the specified FCS (3 m AGL). Shaded areas correspond to the time of fire spread within the instrumented blocks (Figure 2). The vectors represent a 2-min average of the horizontal wind, and time is in minutes from ignition. Note that vector scales are not the same for each figure (reference scales are given in the lower left).
Ambient winds were nearly four times stronger for the PPN burn, averaging 3.1 ± 1.5 m⋅s−1 for the 33-min period containing fire spread in the instrumented block. The direction was relatively steady from the north, resulting in a slight swinging of the fireline from the southwest–northeast ignition line to a more east–west front. In this case, local winds at the collection sites were initially light but grew stronger and diverted from their ambient direction 8 min after ignition as the fire approached the sites and began to experience some local periods of high intensity (Figure 2).
For the TT fire, ambient winds were moderate, falling between PPS and PPN at an average of 1.4 ± 0.8 m⋅s−1 for the 50-min following ignition. However, the direction fluctuated more over the course of the burn, covering at least a 90° range between an east and west wind in the first 30 min of the burn. Local winds at the collection sites also fluctuated significantly, masking a clear influence of the fire. However, a slight increase in the wind at L2 around the 36–40 min mark to an average of 2.1 m⋅s−1 (exceeding concurrent ambient wind by a factor of ∼1.7) does coincide with the arrival of the fire in this region (Figure 2).
The aforementioned features reveal the complexity of flow patterns which can impact firebrand deposition. While the ambient winds above the canopy certainly impact the tilt of the plume and the initial trajectory of firebrands. Close to the surface, in the lee of the plume, entrainment tends to draw air back into the plume, which can explain the fact that many firebrands are observed to land moving in a direction toward the fire. Using Figure 3, measuring in the direction of the prevailing ambient wind, a clear influence of the fire can be seen as much as 100 m away from the front in PPS and 200 m in PPN (note that the location of the fire in PPS is more ambiguous due to the multiple ignitions, but the strong acceleration in surface winds is assumed to correspond to the period of high fire intensity in the southeast region of the plot). Therefore, understanding the role of fire intensity in the firebrand problem is important not only for generation but also for quantifying the strength of the indraft and its impact on firebrand trajectories.
3.2 Firebrand Generation
Firebrand generation was measured in the PPN and PPS fires only. Pre- and post-fire measurements of tree circumference revealed an average change in radius of Δr = 6.37 × 10⁻³ ± 4.21 ×10⁻³ m for PPN (n = 25) and Δr = 2.74 × 10⁻³ ± 2.39 ×10⁻³ m for PPS (n = 18). The uncertainty in the measurements is expressed as the standard deviation.
To apply Eq. 3, data from previous measurements of bark firebrands in the same ecosystem (Thomas et al., 2017) give values of τ = 1.14 mm and Af = 6.72 × 10⁻⁵ m2. Scorch heights in PPN and PPS were measured as part of a burn severity assessment with an average scorch height of hs = 5.19 and hs = 5.23 m, respectively.
Using these values, the number and mass of firebrands generated per tree and the total number and mass of firebrands can be calculated. These data are shown in Table 2. The larger reduction in the diameter of tree boles and the larger number of firebrands in PPN compared to PPS indicate that fire intensity is a driver of firebrand generation.
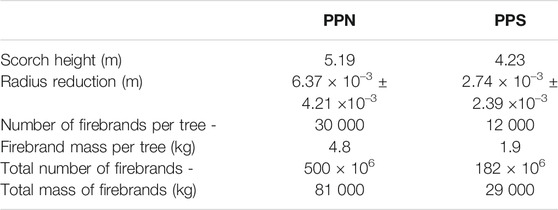
TABLE 2. Measurements required for the calculation of the firebrand generation for PPN and PPS.
3.3 Firebrand Deposition
The firebrand deposition density, calculated from the total number of firebrands collected divided by the total collection area, is shown in Figure 4 for each transect in the three fires. Separation distances between FCSs to the burn unit were measured along the direction of the prevailing ambient wind. In all cases, a general decreasing trend in firebrand deposition is observed with increasing distance from the edge of the burn unit. These data suggest a positive relationship between firebrand deposition and fire intensity; however, the different fuels at TT preclude a definitive conclusion. The non-monotonic relationship observed for PPS, where the FCSs are not parallel to the prevailing wind, indicates that there is a relationship between ambient wind and firebrand deposition.
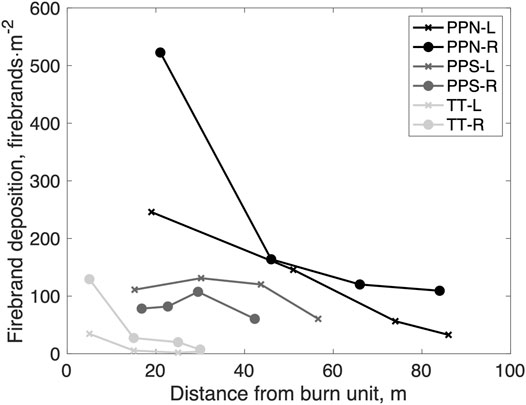
FIGURE 4. Total firebrand deposition as a function of distance from the edge of the burn unit. L and R indicate the left and right FCS transects of each burn unit.
3.4 Firebrand Characteristics
The cumulative distribution functions (CDFs) of the projected area for the firebrands collected in each fire are shown in Figure 5. Approximately 80% of particles in PPN and PPS and 90% of particles in TT have an area less than 1 × 10⁻⁴ m2. The size distribution from TT is skewed to significantly smaller projected areas than PPN and PPS. PPN has the largest number of larger particles suggesting that there is a relationship between fire behavior and size distribution of firebrands deposited. However, it is not possible to say whether this is due to the generation of larger firebrands or the enhanced ability of the plume to transport larger particles. These data are in line with previous studies (El Houssami et al., 2016a; Filkov et al., 2017; Thomas et al., 2017; Zen et al., 2021) which are similarly skewed with a large number of small particles.
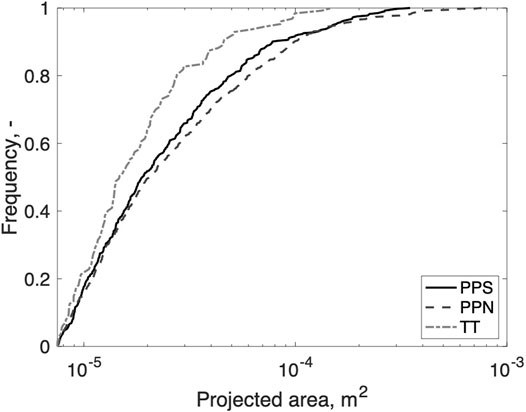
FIGURE 5. Cumulative distribution of firebrand area for PPN (n = 767), PPS (n = 404), and TT (n = 128) (n is the number of firebrands collected). To allow comparison between sites, only particles with projected areas greater than 75 mm2 are included in this analysis.
The distribution of particles in the individual collection sites for PPN is presented in Figure 6. Only data for PPN are presented because this fire had a simple linear ignition which resulted in a relatively steady head fire across the unit. The ignition patterns for PPS and TT were more complex, and the collection sites were less well aligned to the prevailing wind, which means that this analysis cannot be reliably used in these cases.
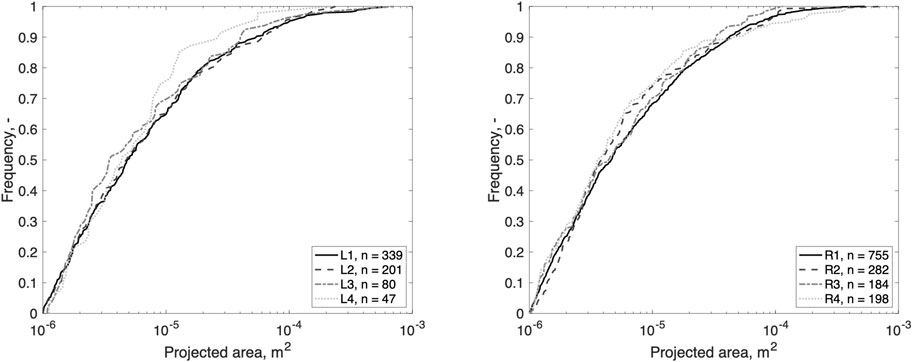
FIGURE 6. Cumulative distribution of projected area for the left (left) and right (right) transects of FCS in PPN. Particles with a projected area greater than 1 mm2 are included in this analysis. n is the number of firebrands collected.
The analysis of PPN indicates that while the number of particles may show an inverse relationship with distance, there is no such trend with particle projected area. This highlights the complexity of the deposition process and indicates the local flow conditions to be dominant over particle characteristics. Analysis following the approaches developed by Tachikawa (Holmes et al., 2006) has been proposed; however, previous studies did not show expected trends Manzello and Suzuki (2013).
3.5 Time-Dependent Firebrand Deposition
Given the previously established dependence of the firebrand deposition on global fire behavior, the variation in firebrand deposition throughout the duration of the fire was explored. This allows for changes in fire intensity and firebrand deposition dynamics to be explored. Using the data for PPN in which the ignition pattern and wind are best aligned with the FCS (and thereby allowing the most straightforward comparison), the cumulative, time-dependent deposition in one collection can at each FCS is shown in Figure 7 and in the Supplementary Material PPN_spread.mp4. Periods of high rates of fire spread are shown between 7 and 9 min and 14 and 16 min after ignition, as discussed previously.
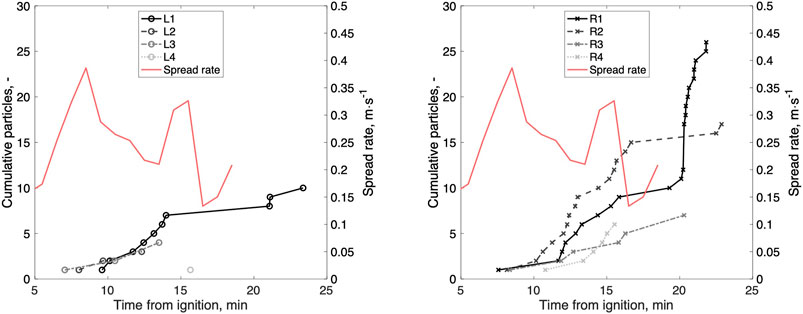
FIGURE 7. Firebrand collection in one can at each FCS in the left (left) and right (right) transects at PPN and the spread rate. Note that firebrand deposition continued for a period of 5 min after the fire had reached the end of the burn unit.
The first particles arrived approximately 7 min after ignition at FCS L3, a linear distance of approximately 225 m from the fire front. This highlights the complexity of deposition patterns and suggests that the particle trajectories are affected by the fire-induced wind and local flow obstructions. After approximately 11.5 min, the firebrand deposition becomes more rapid at all collection sites. At this time, the fire was approximately 100 m distant from the FCS. This period of rapid firebrand deposition occurs until approximately 16.5 min and was followed by a period of approximately 2.5–3 min of no firebrand deposition. Between 20 and 21.5 min, there was another period of rapid firebrand deposition.
Linking the rate of spread and deposition data indicates that the typical travel time for a firebrand is between 4.5 and 7.5 min for the first period of high spread rate and 6.5–7 min for the second period corresponding to travel distances of approximately 100 m and 50 m, respectively. The resulting average firebrand velocities are less than the upper limit of the above canopy wind speed, lending credibility to this assessment. However, before drawing firm conclusions on this issue, further information on the firebrand generation and trajectories is required.
3.6 Total Firebrand Deposition
Three regression models were considered to represent the relationship, g(x), that defines the firebrand deposition outside the burn area: linear, power, and exponential. The results of fitting these functions to the data are presented in Table 3; Figure 8. For the power law and exponential models, the maximum deposition distance was estimated when the deposition reaches 1 firebrand m−2. Integrating the functions allows the total quantity of firebrands deposited to be estimated. The linear and exponential models suggest that 74 and 106 million firebrands are deposited, respectively. This compares to the estimated 500 million firebrands being generated (Table 2). Assuming constant firebrand deposition within the fire, between 6 and 7% of firebrands land outside the burn unit. The higher generation of firebrands compared to the deposition outside the burn unit suggests that either a large proportion of firebrands are not lofted from the fire front or are consumed in the plume.
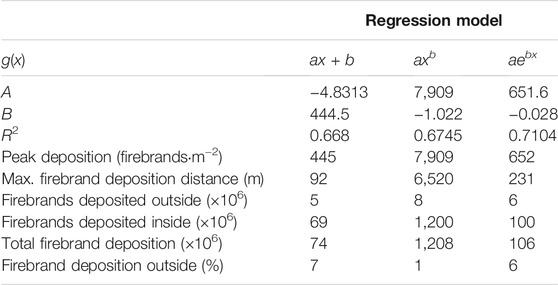
TABLE 3. Assessment of regression models for the total firebrand deposition. Results provide peak deposition, maximum deposition distance, and the total amount of particles deposited. Comparison to total production is included.
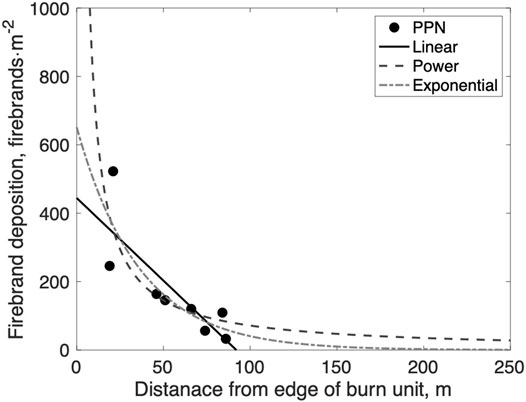
FIGURE 8. Total firebrand deposition as a function of distance from the edge of the burn unit, m, and the regression analysis for linear, power law, and exponential equations fit to the data.
Clearly, there are significant uncertainties embedded in these approaches and their physical interpretation. Although statistically there are insufficient data to reject any of the proposed deposition models, it is unlikely that a power law can explain the deposition relationship—it is undefined at the fire front (x = 0), and the asymptotic behavior approaching a nonzero deposition rate at distances greater than 150 m seems unlikely to be true. However, the order of magnitude agreement between the independent calculations of firebrands generated and firebrands deposited gives confidence in the method and suggests that refinement in the measurements and increased data collection will yield improved predictive relationships.
4 Conclusions
The hazard associated with firebrand exposure is a complex coupling of fire behavior, fuels, and environmental factors. The results in this study demonstrate that firebrand generation and deposition are strongly coupled to fire behavior, and therefore, to adequately assess the hazard, it is necessary to provide context with fire behavior measurements. A method to provide such coupled measurements has been designed, and it is demonstrated to provide the required measurements.
By measuring detailed fire behavior (spread rate and intensity), with both spatial and temporal resolution, it has been possible to obtain insights into the relationship between firebrand generation, transport, and deposition in a system dominated by bark firebrands.
The following general observations can be made:
• A regular array of temperature measurements overlaid with an array of flame height measurements allows time-resolved fire behavior to be calculated.
• The firebrand generation can be evaluated using measurements of tree characteristics and fire severity assessments.
• Firebrand generation is a function of the fuel characteristics and the fire intensity.
• Higher fire intensities resulted in higher firebrand generation and, on average, higher firebrand deposition rates and larger firebrand projected areas, as observed between different fires and within the same fire;
• It is possible to link the temporal dynamics of firebrand deposition to fire behavior;
• Firebrand deposition is not adequately predicted by the mean wind vector and analysis of the local flow dynamics, and fire-induced flow reversal is required.
• Total firebrand deposition decreases as a function of distance from the fire line possibly following an exponential decay.
The data also point toward an influence of fire return interval in determining the firebrand hazard. Two fires that were undertaken in areas that had not been burned for more than 50 years (PPS and PPN) resulted in a larger firebrand generation than the areas which had been burned more recently (TT). This suggests that fire return interval may also be important in determining the firebrand hazard.
Factors which require further consideration to improve the assessments made here include time-resolved measurements of firebrand generation to evaluate the rate, temporal, and spatial distribution of firebrand generation relative to the fire front; firebrand trajectory to evaluate the travel distance and velocities including within and above canopy turbulence measurements, the reaction dynamics of firebrands during transport, and the temperature evolution of firebrands during transport and upon deposition.
Nevertheless, the results of this study demonstrate that it is possible to assess the relationship between fire behavior and the firebrand hazard and present an experimental design for doing so. However, clearly, this methodology must be adopted widely to gather sufficient data across a wider range of fire behaviors and fuel types to generate datasets appropriate for the development of predictive tools.
Data Availability Statement
The raw data supporting the conclusion of this article will be made available by the authors, without undue reservation.
Author Contributions
JT, EM, MG, KC, NS, AS, and RH developed the experimental methods. JT, EM, MG, KC, NS, and RH collected the data and conducted the experiments. JT, EM, and RH led the preparation of the manuscript with input from MG, KC, and NS.
Funding
The authors are thankful for funding for this work that was provided by the Joint Fire Science Program (15-1-04-55) and the Strategic Environmental Research and Development Program (RC-2641).
Conflict of Interest
The authors declare that the research was conducted in the absence of any commercial or financial relationships that could be construed as a potential conflict of interest.
Publisher’s Note
All claims expressed in this article are solely those of the authors and do not necessarily represent those of their affiliated organizations, or those of the publisher, the editors and the reviewers. Any product that may be evaluated in this article, or claim that may be made by its manufacturer, is not guaranteed or endorsed by the publisher.
Acknowledgments
The authors wish to thank the New Jersey Conservation Foundation and the Tall Timbers Research Station (particularly Kevin Hiers) for facilitating the experimental fires. The support of the New Jersey Forest Fire Service in managing the fires and the experimental objectives is gratefully acknowledged.
Supplementary Material
The Supplementary Material for this article can be found online at: https://www.frontiersin.org/articles/10.3389/fmech.2021.650580/full#supplementary-material
References
Alexander, M. E. (1982). Calculating and Interpreting forest Fire Intensities. Can. J. Bot. 60, 349–357. doi:10.1139/b82-048
Barr, B. W., and Ezekoye, O. A. (2013). Thermo-mechanical Modeling of Firebrand Breakage on a Fractal Tree. Proc. Combustion Inst. 34, 2649–2656. doi:10.1016/J.PROCI.2012.07.066
Byram, G. M. (1959). “Combustion of forest Fuels,” in Forest Fire: Control and Use. Editor K. P. Davis (New York: McGraw-Hill).
Caton, S. E., Hakes, R. S. P., Gorham, D. J., Zhou, A., and Gollner, M. J. (2017). Review of Pathways for Building Fire Spread in the Wildland Urban Interface Part I: Exposure Conditions. Fire Technol. 53, 429–473. doi:10.1007/s10694-016-0589-z
Clark, K. L., Heilman, W. E., Skowronski, N. S., Gallagher, M. R., Mueller, E., Hadden, R. M., et al. (2020). Fire Behavior, Fuel Consumption, and Turbulence and Energy Exchange during Prescribed Fires in Pitch pine Forests. Atmosphere 11, 242. doi:10.3390/atmos11030242
El Houssami, M., Mueller, E., Filkov, A., Thomas, J. C., Skowronski, N., Gallagher, M. R., et al. (2016a). Experimental Procedures Characterising Firebrand Generation in Wildland Fires. Fire Technol. 52, 731–751. doi:10.1007/s10694-015-0492-z
Fernandez-Pello, A. C. (2017). Wildland Fire Spot Ignition by sparks and Firebrands. Fire Saf. J. 91, 2–10. doi:10.1016/J.FIRESAF.2017.04.040
Filkov, A., Prohanov, S., Mueller, E., Kasymov, D., Martynov, P., Houssami, M. E., et al. (2017). Investigation of Firebrand Production during Prescribed Fires Conducted in a pine forest. Proc. Combustion Inst. 36, 3263–3270. doi:10.1016/J.PROCI.2016.06.125
Hakes, R. S. P., Caton, S. E., Gorham, D. J., and Gollner, M. J. (2017). A Review of Pathways for Building Fire Spread in the Wildland Urban Interface Part Ii: Response of Components and Systems and Mitigation Strategies in the united states. Fire Technol. 53, 475–515. doi:10.1007/s10694-016-0601-7
Hakes, R. S. P., Salehizadeh, H., Weston-Dawkes, M. J., and Gollner, M. J. (2019). Thermal Characterization of Firebrand Piles. Fire Saf. J. 104, 34–42. doi:10.1016/J.FIRESAF.2018.10.002
Heilman, W. E., Clements, C. B., Zhong, S., Clark, K. L., and Bian, X. (2019). Atmospheric Turbulence. in Encyclopedia of Wildfires and Wildland-Urban Interface (WUI) Fires (Springer).
Holmes, J. D., Baker, C. J., and Tamura, Y. (2006). Tachikawa Number: A Proposal. J. Wind Eng. Ind. Aerodynamics 94, 41–47. doi:10.1016/j.jweia.2005.10.004
Houssami, M. E., Thomas, J. C., Lamorlette, A., Morvan, D., Chaos, M., Hadden, R., et al. (2016b). Experimental and Numerical Studies Characterizing the Burning Dynamics of Wildland Fuels. Combustion and Flame 168, 113–126. doi:10.1016/j.combustflame.2016.04.004
Koo, E., Pagni, P. J., Weise, D. R., and Woycheese, J. P. (2010). Firebrands and Spotting Ignition in Large-Scale Fires. Int. J. Wildland Fire 19, 818–843. doi:10.1071/WF07119
Manzello, S. L., Shields, J. R., Cleary, T. G., Maranghides, A., Mell, W. E., Yang, J. C., et al. (2008). On the Development and Characterization of a Firebrand Generator. Fire Saf. J. 43, 258–268. doi:10.1016/j.firesaf.2007.10.001
Manzello, S. L., and Suzuki, S. (2013). Experimentally Simulating Wind Driven Firebrand Showers in Wildland-Urban Interface (Wui) Fires: Overview of the Nist Firebrand Generator (Nist Dragon) Technology. Proced. Eng. 62, 91–102. doi:10.1016/J.PROENG.2013.08.047
Manzello, S. L., Suzuki, S., Gollner, M. J., and Fernandez-Pello, A. C. (2020). Role of Firebrand Combustion in Large Outdoor Fire Spread. Prog. Energ. Combustion Sci. 76, 100801. doi:10.1016/j.pecs.2019.100801
Manzello, S. L., Suzuki, S., and Nii, D. (2017). Full-scale Experimental Investigation to Quantify Building Component Ignition Vulnerability from Mulch Beds Attacked by Firebrand Showers. Fire Technol. 53, 535–551. doi:10.1007/s10694-015-0537-3
Maranghides, A., and Mell, W. (2011). A Case Study of a Community Affected by the Witch and Guejito Wildland Fires. Fire Technol. 47, 379–420. doi:10.1007/s10694-010-0164-y
Matvienko, O. V., Kasymov, D. P., Filkov, A. I., Daneyko, O. I., and Gorbatov, D. A. (2018). Simulation of Fuel Bed Ignition by Wildland Firebrands. Int. J. Wildland Fire 27, 550–561. doi:10.1071/wf17083
McCormick, J., and Jones, L. (1973). The Pine Barrens: Vegetation Geography. Tech. Rep. doi:10.7282/T3GX49DC
Mueller, E. V., Skowronski, N., Clark, K., Gallagher, M., Kremens, R., Thomas, J. C., et al. (2017). Utilization of Remote Sensing Techniques for the Quantification of Fire Behavior in Two pine Stands. Fire Saf. J. 91, 845–854. doi:10.1016/j.firesaf.2017.03.076
Mueller, E. V., Skowronski, N., Thomas, J. C., Clark, K., Gallagher, M. R., Hadden, R., et al. (2018). Local Measurements of Wildland Fire Dynamics in a Field-Scale experiment. Combustion and Flame 194, 452–463. doi:10.1016/J.COMBUSTFLAME.2018.05.028
Simeoni, A., Owens, Z. C., Christiansen, E. W., Kemal, A., Gallagher, M., Clark, K. L., et al. (2017). A Preliminary Study of Wildland Fire Pattern Indicator Reliability Following an Experimental Fire. J. Fire Sci. 35, 359–378. doi:10.1177/0734904117720674
Tarifa, C. S., Notario, P. P. d., and Moreno, F. G. (1965). On the Flight Paths and Lifetimes of Burning Particles of wood. Symp. (International) Combustion 10, 1021–1037. doi:10.1016/s0082-0784(65)80244-2
Thomas, J. C., et. al., V. E., and Hadden, R. M. (2018). Estimating Net Heat Flux from Surrogate Firebrand Accumulations Using an Inverse Heat Transfer Approach. Adv. For. fire Res. 2017, 769–779. doi:10.14195/978-989-26-16-506_84
Thomas, J. C., Mueller, E. V., Santamaria, S., Gallagher, M., El Houssami, M., Filkov, A., et al. (2017). Investigation of Firebrand Generation from an Experimental Fire: Development of a Reliable Data Collection Methodology. Fire Saf. J. 91, 864–871. doi:10.1016/j.firesaf.2017.04.002
Wadhwani, R., Sutherland, D., Ooi, A., Moinuddin, K., and Thorpe, G. (2017). Verification of a Lagrangian Particle Model for Short-Range Firebrand Transport. Fire Saf. J. 91, 776–783. doi:10.1016/j.firesaf.2017.03.019
Woycheese, J. P., Pagni, P. J., and Liepmann, D. (1999). Brand Propagation from Large-Scale Fires. J. Fire Prot. Eng. 10, 32–44. doi:10.1177/104239159901000203
Keywords: wildland–urban interface (WUI), prescribed fire, firebrand flux, firebrand deposition, firebrand generation, fire behavior, firebrands
Citation: Thomas JC, Mueller EV, Gallagher MR, Clark KL, Skowronski N, Simeoni A and Hadden RM (2021) Coupled Assessment of Fire Behavior and Firebrand Dynamics. Front. Mech. Eng 7:650580. doi: 10.3389/fmech.2021.650580
Received: 07 January 2021; Accepted: 17 November 2021;
Published: 16 December 2021.
Edited by:
Domingos Xavier Viegas, University of Coimbra, PortugalReviewed by:
Miguel Almeida, Associação para o Desenvolvimento da Aerodinâmica Industrial, PortugalWei Tang, National Institute for Occupational Safety and Health (NIOSH), United States
Copyright © 2021 Thomas, Mueller, Gallagher, Clark, Skowronski, Simeoni and Hadden. This is an open-access article distributed under the terms of the Creative Commons Attribution License (CC BY). The use, distribution or reproduction in other forums is permitted, provided the original author(s) and the copyright owner(s) are credited and that the original publication in this journal is cited, in accordance with accepted academic practice. No use, distribution or reproduction is permitted which does not comply with these terms.
*Correspondence: Rory M. Hadden, ci5oYWRkZW5AZWQuYWMudWs=