 Fabian Wolfsperger
 Frédéric Meyer
 Matthias Gilgien4,5
- 1Winter Sports and Climate Group, WSL-Institute for Snow and Avalanche Research SLF, Davos, Switzerland
- 2Department for Sport Science, University of Lausanne, Lausanne, Switzerland
- 3Department of Informatics, University of Oslo, Oslo, Norway
- 4Department of Physical Performance, Norwegian School of Sport Sciences, Oslo, Norway
- 5Center for Alpine Sports Biomechanics, Engadin Health and Innovation Foundation, Samedan, Switzerland
Previous research has shown that friction between ski and snow can vary substantially due to changes in snow conditions. The variation of friction affects the speed a freestyle skier or snowboarder (athlete) reaches during the in-run of a jump. Athletes risk severe injuries if their take-off speed is not within the right margin to land in the “sweet spot” zone. To reduce the risk of injury, snow park designers and competition managers need to calculate the speed athletes reach during the in-run. However, despite multiple attempts over the last decades, to date no model can predict ski-snow friction from snow physical quantities. Hence, simulations of in-run speeds suffer from insufficient validity. For the first time, this work combines kinematic athlete data and comprehensive snow surface measurements to infer the coefficient of friction of freestyle skis and snowboards across a wide range of snow conditions. Athletes’ point mass kinematics were recorded at more than 200 straight gliding runs with differential global navigation satellite systems. The subjects’ air drag and lift were deployed from wind tunnel measurements. Along with the kinematic data and data from wind measurements, a mechanical model of the athlete was established to solve the equation of motion for the coefficient of friction between ski/snowboard and snow. The friction coefficients for ski (snowboard) ranged from 0.023 ± 0.006 (0.026 ± 0.008) to 0.139 ± 0.018 (0.143 ± 0.017) and could be explained well (Radj2 = 0.77) from the measured snow parameters using a multivariate statistical model. Our results provide a new quantitative tool for practitioners to predict the friction of skis and snowboard on snow of various conditions, which aims to increase athletes’ safety in slopestyle and big air.
Introduction
Ski–snow friction, air drag and gravity are the three forces that regulate speed in skiing and snowboarding. The acceleration due to gravity depends on the incline of the slope, while air drag is a function of speed, frontal area, the shape and material properties of the athlete’s clothing, and air density. Probably the most complex force that acts on skiers and snowboarders is the ski–snow friction force. Its underlying mechanisms are still controversial (e.g., Bowden and Tabor, 1939; Bäurle, 2006; Böttcher et al., 2017; Canale et al., 2019; Lever et al., 2019), and the friction coefficient of a skier, although repeatedly measured (Habel, 1968; Kuroiwa, 1977; Leino and Spring, 1984; Kaps et al., 1996), could so far not been well predicted for a given snow condition. One of the main reasons for this is the material properties of snow, which vary considerably as a result of differing porosity, proximity to the melting point, and markedly different microstructures and degrees of sintering. In consequence, the level of ski-snow friction and the governing mechanisms can change distinctly, as the material properties of the snow change (Nachbauer et al., 1996; Buhl et al., 2001; Fauve et al., 2005). In addition, the snow’s physical instability facilitates rapid changes in properties (Szabo and Schneebeli, 2007), and hence increases the difficulty of describing the mechanics of the frictional contact between snow and ski.
From a theoretical point of view, understanding the mechanisms of snow friction is of high interest. However, snow sport practitioners can be helped by the provision of knowledge that allows precise prediction of the extent of ski–snow friction, depending on the prevailing snow conditions. This information is especially required for the design, maintenance and management of snow park jumps, as snow friction is a crucial aspect in the take-off speed of a jump and consequently determine how the jump needs to be built in terms of size and geometry. Injury risks are high, for both recreational park riding and for the Olympic disciplines of slopestyle and big air (Florenes et al., 2010; Henrie et al., 2010; Florenes et al., 2012; Bianchi et al., 2016; Soligard et al., 2019). To reduce the risk of injuries, knowledge-based improvement of jump designs is considered a key factor (Shealy and Stone, 2008; Levy et al., 2015; Heer et al., 2019; Schindelwig et al., 2019). This includes the use of models to calculate the kinematics and kinetics of athletes from in-run to the landing of a jump to evaluate the safety of new jump geometries. Although remarkable research studies on jump design are available (Böhm and Senner, 2009; Shealy et al., 2010; McNeil, 2012a; McNeil et al., 2012b; Hubbard et al., 2015; Scher et al., 2015), the modelling of jumps still has considerable uncertainties with respect to the validity of the snow friction coefficients (COF).
So far, there is no model available that allows to predict the COF from snow physical properties across a wide range of relevant snow conditions, and describes these with a set of easy-to-measure physical attributes of the snow. Moreover, to the knowledge of the authors, snow friction has never been quantified for freestyle skis or snowboards, and this is needed to provide more valid input parameters for the modelling of the in-run kinematics of slopestyle jumps. Therefore, this study aimed to measure snow friction of freestyle ski and snowboard over a wide range of snow conditions in a consistent and comparable manner by using the same method and equipment with the same athletes across a data collection that spanned two winter seasons. Furthermore, this study aimed for the first time, to measure a set of snow quantities on the field describing the material properties of snow sufficiently enough to reveal a well-determined COF parametrization. For that purpose, over 200 test runs and a novel method to assess COF were used. Further, the data set was assessed for speed dependency of the COFs on contrasting snow conditions.
Methods
Test Design
The test team consisted of three skiers and three snowboarders (1.82 ± 0.05 m; 80.3 ± 8.6 kg; 36 ± 1.2 years; ski and/or snowboard instructor level or higher). Gliding tests were performed on 13 days during winter 2016/17 and 2017/18 at Davos, Weissfluhjoch (WFJ, 2,600 m) and Davos, Bolgen (BOL, 1,580 m) on groomed gliding tracks that were closed to the public (Figures 1, 2). The test days were selected to capture a wide range of snow conditions typical on ski slopes. A test day included several (7–24) consecutive runs by one skier and/or one snowboarder using the same test skis or snowboard for each data collection. The test skis/snowboard were equipped with a sintered transparent running base made of ultra-high molecular weight polyethylene and were waxed by a professional ski technician (Steiner Sport, Davos, CH) prior to each test day, using a mid-temperature hydrocarbon ski wax (Beta Mix Red, Holmenkol GmbH, D). Topology and hydrophobicity of the running surfaces were characterized using tactile 2D roughness measurements (MarSurf PS1, Mahr GmbH, D), as well as dynamic contact angle measurements (Drop Shape Analyzer, Krüss GmbH, D) in waxed and unwaxed states (Table 1). The athletes were running in a defined and easy-to-reproduce, mid-extended posture without poles, with the hands placed on the knees and straight arms with the elbow joint in full extension (Figure 2). Athletes wore the same, regular-fit personal ski or snowboard apparel for each test day (Figure 2). For the athletes taking part in this study aerodynamic drag areas were quantified in a wind tunnel experiment using the same posture and apparel as during the gliding tests (Wolfsperger et al., 2021). Athletes’ kinematics, wind velocity, meteorological parameter, and snow parameters were captured as described below. Each run was documented by videotaping (Figure 2).
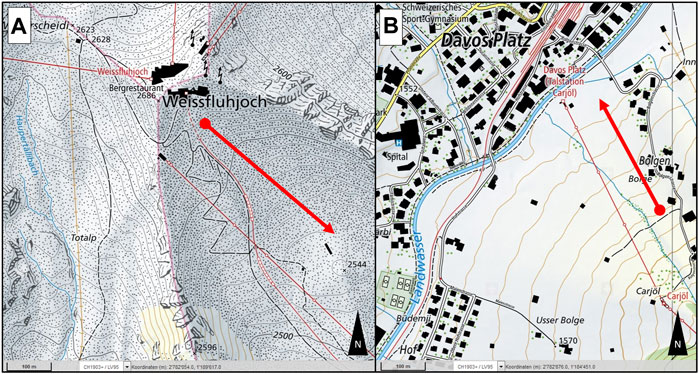
FIGURE 1. Location of the gliding tracks (red arrows) at Weissfluhjoch (A) and Bolgen (B) (© swisstopo, 2021).
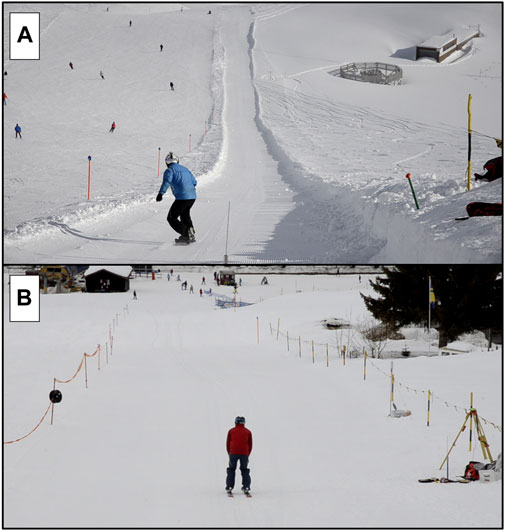
FIGURE 2. Gliding tracks at Davos Weissfluhjoch (A) and Bolgen (B) with a skier and a snowboarder holding the defined mid-extended posture. Side view photographs of this posture were shown in Wolfsperger et al. (2021).
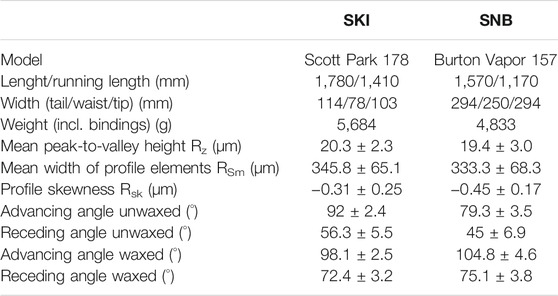
TABLE 1. Properties of the test skis and snowboard including surface roughness parameters (n = 10) and dynamic contact angles of distilled water (n = 8). The advancing (receding) angle is the contact angle which occurs in the course of wetting (de-wetting) of the ski base.
The study was approved by the ethics committee at the Norwegian School of Sport Sciences, and the Norwegian Centre for Research Data, and conducted according to the Declaration of Helsinki. All participants gave their written informed consent prior to participation.
Data Acquisition and Processing
Wind and Weather
3D-wind velocities were recorded at 1 Hz with two ultrasonic anemometers (Model 8100, R. M. Young Company, United States) at the top and the bottom of the test tracks. Wind velocities were interpolated from 1 to 25 Hz using a symmetric FIR filter method to synchronize with the kinematic data. The UTC - GPS time offset of 18 s, and the wind logger clock offset, which was manually annotated, were considered in the time synchronization. Wind data were smoothed and cleaned of spikes as described for the velocity above. The instantaneous ambient wind velocity at the position of the athlete during a run was calculated from the two wind stations, placed at the top and bottom of the track. The distance between athlete and the wind stations was used to weigh the contribution from each station measurement to the weighted average wind velocity. The components of the wind vector were rotated into the athletes’ instantaneous position coordinate system (trajectory). The atmospheric pressure (patm), air temperature (Tair), relative humidity (RH), and incoming shortwave radiation (SWR) were measured with stationary (SLF, 2021) and mobile (Sensorscope, CH) weather stations proximate to the test tracks (Tables 2, 3). The air density (ρair) was calculated from atmospheric pressure, air temperature and relative humidity using the ideal gas law (Eq. 1) adapted with an approximated universal gas constant for humid air (Rh = 287.1–288.3 J kg−1 K−1) (Sonntag, 1990).
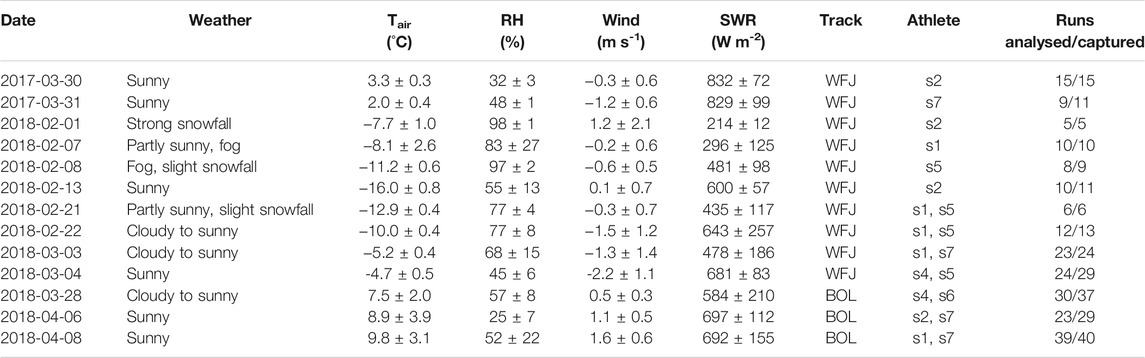
TABLE 2. Weather description and average (mean ± σ) weather parameters during the captured runs of each test day (date).
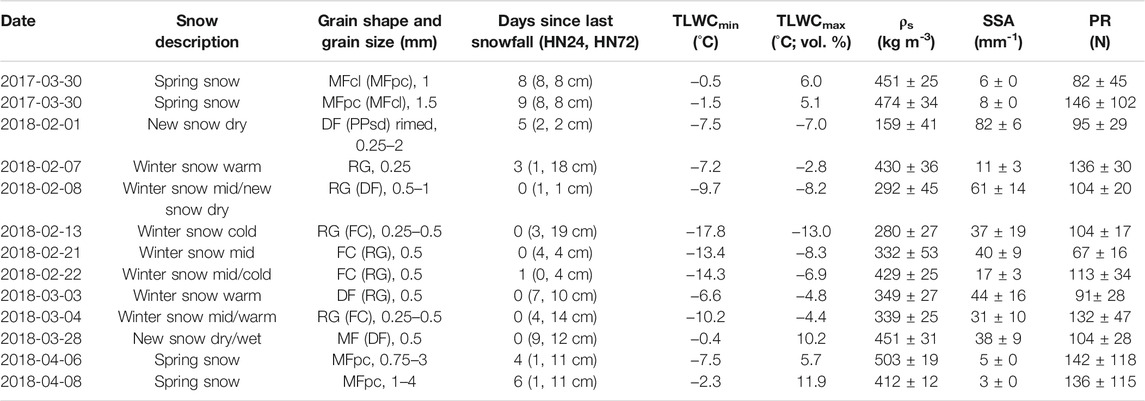
TABLE 3. Snow conditions on each test day: Colloquially described, classified after Fierz et al. (2009), and quantified by the daily range (TLWC) or mean (±σ) of the measured snow physical properties. HN24 (HN72) quantified the height of fallen new snow during the past 24 (72) hours.
Kinematics
Athletes’ positions were measured with a differential global navigation satellite system (dGNSS). The dGNSS system was composed of a GNSS antenna (G5Ant-2AT1, Antcom Corp., United States) carried on the athlete’s helmet and a GNSS receiver (Alpha-G3T, Javad GNSS Inc., United States) carried on the athlete’s chest, underneath the jacket. Dual frequency (L1 and L2) GPS and GLONASS signals were logged at 25 Hz and a short baseline kinematic carrier phase dGNSS solution was calculated using Justin (Javad GNSS Inc., United States) post-processing software (Gilgien et al., 2014). Positions were smoothed using the dGNSS solutions accuracy estimates as weighted into a spline filter. From the smoothed position data, the distance travelled (sx) was calculated as the aggregated distances between the measured positions and smoothed (4-second-moving average). The athlete’s instantaneous velocity and acceleration vectors were computed as the first and second time derivatives using the finite central difference formulae followed by smoothing (4-second-moving average) and removal of spikes (Hampel filter: 1s-window, 1σ-threshold). Instantaneous speed (v) was calculated as the norm of the velocity vector. Instantaneous acceleration (a) along the skier’s direction of travel was calculated by firstly projecting the acceleration vector on the velocity vector and secondly calculating the scalar of the projected acceleration vector. The slope (α) and curvature (κ) of the terrain along the trajectory were calculated from the incline of the instantaneous velocity vector (Gilgien et al., 2013; Gilgien et al., 2015; Gilgien et al., 2016; Gilgien et al., 2018).
The relative airflow velocity (vrel) resulted from the sum of wind and athlete velocity. Speed dependent drag and lift area (cDA, cLA) were determined by wind tunnel measurements for each athlete considering their personal apparel and posture characteristics (Wolfsperger et al., 2021). This allowed an accurate calculation of the aerodynamic force components of drag and lift throughout each run (Eq. 2). A mechanical model of the athlete as a point of mass (m) was used (Figure 3), incorporating air drag (FD) and lift force (FL), as well as gravitational (FGx, FGz) and radial forces (FR; Eq. 3) to solve the equation of motion for the friction force (FF) (Gilgien et al., 2016). The coefficient of friction (COF) was calculated by the division of FF by the resultant normal force (FN) (Eq. 4). The friction force included all resistive forces of the ski-snow interaction that counteracted the direction of motion, including micromechanical friction forces or dissipation due to snow deformation on the macro scale.
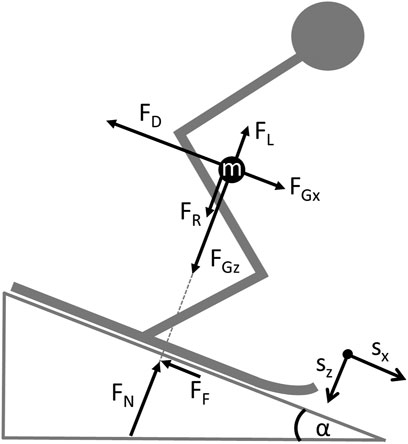
FIGURE 3. Free body diagram visualizing the forces acting on an athlete during a test run. The curvature of the terrain is not visualized.
In total, 239 runs were captured, of which 25 runs had to be excluded, due to inaccurate position data (18), strong wind fluctuations (5), or posture variations of the athlete (2). Of the remaining 214 runs, 99.5% of the time, the post processing software managed to solve the ambiguities in the dGNSS solution (dGNSS fixed solution) and for 0.5% the solution was dGNSS float (when the ambiguity integers could not be fixed in the dGNSS solution) (Gilgien et al., 2014).
Snow
The snow surface at the track’s top section was characterized multiple times during a test day by its temperature (Tss), specific surface area (SSA), density (ρs), volumetric liquid water content (LWC) and its penetration resistance (PR). The SSA characterizes aspects of the microstructure of a porous material like snow and is defined as the total surface area of the ice/air interface of a snow sample per ice volume (Fierz et al., 2009). The SSA is high for small and filigree structures, and is low for coarse and round ones. Tss was measured using a digital resistance thermometer (HI 98501, HANNA Instruments Switzerland AG, CH). The SSA was deduced from the snow’s near infrared reflectivity, measured with an InfraSnow prototype (Gergely et al., 2014). Density and LWC were measured using a dielectric sensor (Denoth, 1994). On occasions when the snow was dry, which was indicated by snow temperatures below 0°C, the density was measured. When snow melting started, the increase in the dielectric number of the snow was measured to deduce the LWC (Denoth, 1994). PR was measured using a Swiss Rammsonde with an adapted penetration body (d = 15 mm; cone angle = 60°) for groomed snow (Fierz et al., 2009; Wolfsperger et al., 2018). PR was calculated from the energy of a weight (mdyn = 1 kg) falling from 0.5 m (h) onto the penetration body, which then penetrated the snow by the depth (sdyn) that was measured. Applying the energy restitution law and including the static weight of the ram penetrometer (mstat = 1.744 kg), PR was calculated according to Equation 5.
In order to reduce the dimensions of the snow parameter space Tss and LWC were merged to TLWC. For negative snow temperatures, TLWC equals the snow temperature. For positive snow temperatures and zero, TLWC equals LWC. Merging snow temperature and LWC appeared possible, as they have a defined physical relationship: Liquid water in snow can only be present for snow temperatures of 0°C, while sub-zero snow temperatures physically stipulate a LWC of 0%. The snow was visually classified into the main grain shape classes (Fierz et al., 2009) and photographed (DigiMicroscope LCD, reflecta GmbH, D) on a grid board (1 mm) with a magnification of 20 (Supplementary Appendix Figures S1–S6). Each snow measurement was conducted three to five times to capture the measurements’ uncertainty (Table 3), which mainly was a consequence of the inherent variability of the gliding track’s snow surface, but also the result of random, unknown sources of error. The values of the instantaneous snow property measurements during the day were time interpolated to match them to the COF measured at the exact time of the run. For the time interpolation of the values, first and second order polynomials were used for ρs and SSA, as well as smoothing spline approximations for TLWC and PR. The root mean square error (RMSE) of the fit was used to quantify the uncertainty of the measured snow properties. Depending on the snow conditions the uncertainties differed between test days. Beyond the availability of suitable measurement methods, the described snow physical quantities were selected as they allowed to describe the different aspects of snow as a material with sufficient completeness. Thus, it was possible to allocate snow of any type and state to a unique point in the snow parameter space. In snow science, the snow type is defined by its microstructure and density, whereas the snow state is defined by snow temperature, LWC and hardness (Fierz et al., 2009). For the natural snowpack, correlations between those attributes clearly exist (e.g., there is no natural snow layer of high SSA and density), whereas at the surface of a ski slope those natural correlations are partially cancelled due to grooming and skiing. Although correlations still can occur even on slopes, there are no strict dependencies over the whole range of two parameters. For example, new snow generally has low density and hardness, but high-density snow, e.g., wet spring snow, is not necessarily hard. In that case, adding the LWC as parameter is sufficient to explain the low hardness due melted and weakened grain bonds.
In addition to the measurable snow parameters, a categorical approach was used to describe the snow conditions. The snow was categorized as spring-, winter- and new snow, referring to typical snow types (Table 3), with three sub-categories referring either to Tss (cold < −13°C, mid = −7 – −13°C, warm > −7°C) or to LWC (dry = 0%, wet = 3–8%, very wet = 8–15%), which added information about the state of the snow (Table 3). Whether the snow was categorized as spring snow or winter snow was not related to the time of year, but to the shape of the snow grains. Spring snow consists of so-called melt forms (Supplementary Appendix Figure S6), caused by melt-freeze cycles, which typically occur in spring with warm days and cold nights.
Data Analysis
The COF curves of the runs with sufficiently valid data were analyzed in four different ways: 1) To provide the range of the COFs and an overall average observed over all runs; 2) To give estimates of COFs for different categories of snow conditions to relate them to the COF in the simplest way; 3) To investigate the influence of speed on the COF; and 4) To understand how the COF depended on the measured snow and/or weather parameters.
Mean values (±σ) of the COF for single runs were calculated by averaging the COF curve over speeds from 5 to 15 m s−1. Depending on the slope of the test track and the snow friction, the analyzed sections were approximately 50–230 m long. Those parts of the COF-curve below 5 m s−1 and above 15 m s−1 were discarded from the analysis, since the COF-curves of consecutive runs increasingly deviated from each other in those sections. Directly after the start (ca. 4 m from the start), deviations were attributed to body movements while getting into the predefined skiing posture which distorted the velocity vector, and to the process of ski alignment movements, when moving off. At higher speeds, aerodynamic forces gain greatly in importance compared to ski-snow friction, creating increasing uncertainty in the measured COF. Overall COF means (±σ) were calculated for the group of skiers and snowboarders from the mean values of all single runs. An unpaired two-sided t-test was conducted to compare the overall COF averages of the two groups.
Estimates of COFs for different categories of snow conditions were calculated by averaging the COF curves over two to six consecutive runs for which the snow conditions were constant. The averaging of COF curves was conducted instantaneously at similar locations along the average trajectory from start to when the analysis was omitted, according to the method described in Gilgien et al. (2016).
The snow categories were also used to group runs from the different test days for the speed dependency analysis. The average COF-speed curves were plotted and compared qualitatively and quantitatively at four points along the track: at the end of the starting section (after 4 m of gliding; COFstart); at the COF minima (COFmin); and at speeds of 10 and 15 m s−1 (COF10, COF15), where these were reached. The speed dependency was quantified by the COF difference between two points, divided by the corresponding speed difference.
To determine whether COF depended on the snow properties, the COF mean values were first fitted (least squares) using single parameter regression for each of the different snow parameters. Since the predictive power of these single parameter models turned out to be weak, backwards stepwise multiple regression (least squares) models were applied to parametrize the COF to all snow property measures (explanatory variables). In addition, an alternative 4-paramater model was calculated using Tair, Tss, RH and the grain shape class, which are quantities commonly assessed by ski technicians and require less measurement equipment, time and know-how. Starting from a model containing an intercept, linear terms, interactions, and squared terms for each predictor, terms were removed stepwise if the sum of the squared errors was significantly changed by the removal (F-Test with p < 0.05).
Uncertainties in the COF
To estimate the uncertainty in the COF, two approaches were used. 1) The measured variability of the COFs was analyzed. First, the COF fluctuation throughout the analyzed section of a single run was quantified by the coefficient of variance (σCOF/COFmean · 100). Second, the reproducibility of several consecutive runs, for which the snow conditions were constant, was analyzed. An average COF-speed curve with error bands of ±1σ was calculated for five consecutive runs on two test days where the highest (February 13) and the lowest (March 4) reproducibility among all test days was achieved. Reproducibility was indicated by the mean width of the error bands throughout the analyzed section (5–15 m s−1). 2) The Gaussian equation for the propagation of normally distributed errors was applied, as the COF values were calculated from several measured quantities, which had uncertainties likely to propagate to the result. This approach helped to understand how strongly the different terms of Equation 4 contributed to the COF uncertainty. In the first step, the uncertainties of the components of the gravitational (ΔFGx, ΔFGz), aerodynamic (ΔFD, ΔFL) and inertial forces [Δ(m·a), ΔFFrad] were calculated (Eq. 6) assuming a constant speed of 10 m s−1 and average values for xi in the force functions (m = 80 kg; a = 1.69 m s−2; α = 16°; κ−1 = 100 m; cDA = 0.529; cLA = 0.224; ρair = 1 kg m−3; vwind = 1 m s−1; Tair = 0°C). The uncertainties Δxi of the input quantities xi were given by the measurement system, estimated, or calculated if they were deduced from other quantities, e.g., the air density (Table 4). For velocity and acceleration, the uncertainties were determined by the RMSE (Table 4) between the raw signal (position data smoothing only) and the fully smoothed signal used for force calculations.
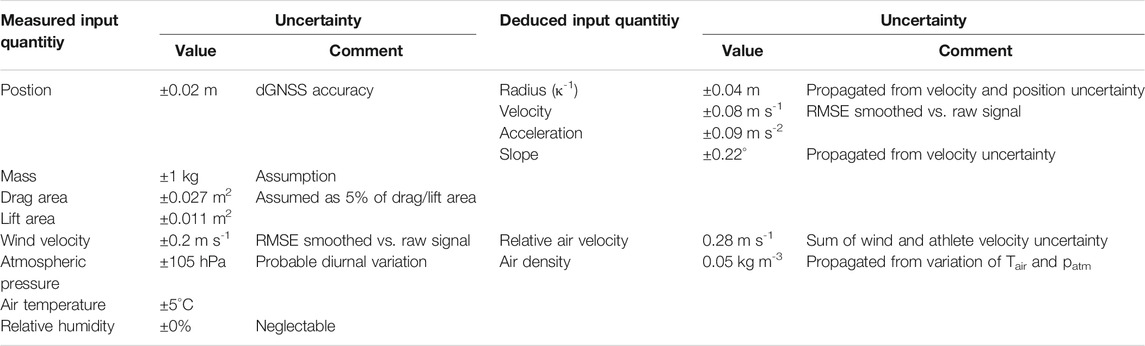
TABLE 4. Values and explanations of the assumed uncertainties of the measured and deduced input quantities.
The sums of the corresponding force components’ uncertainties gave the total uncertainty of the friction force (ΔFF) and normal force (ΔFN) (Eqs 7, 8). The relative uncertainty of the COF was then derived from the sum of the relative uncertainties of FF and FN (Eq. 9).
With regard to the multivariate COF models, the uncertainties of the COF and snow property measurements, as well as the uncertainty of the multivariate regression model itself, were considered. The propagated uncertainties from the snow measurements to the modeled COF were calculated using Equation 8, but using the regression functions 10 and 11 (see results) instead of the force functions. The uncertainties of the models were expressed in the RMSE of the regression. Finally, all uncertainties were added to yield the total uncertainty of the modeled COF.
Results
Snow Friction
For skiers (snowboarders), average COFs over a single run ranged from 0.023 ± 0.006 (0.026 ± 0.008) to 0.139 ± 0.018 (0.143 ± 0.017) (Figures 6, 7). The average COF over all runs and conditions was about 0.054 ± 0.018 (n = 114 runs) for the skiers, and 0.060 ± 0.020 (n = 100 runs) for the snowboarders. The higher overall snow friction for snowboarders compared to the skiers, although statistically significant (p = 0.008), was rather small (ca. 12%) compared to the huge changes in friction caused by different snow conditions (up to 430%).
On dry, hard frozen spring snow, skiers (snowboarders) were clearly fastest, with low COFs ranging between 0.026 ± 0.004 (0.031 ± 0.004) and 0.037 ± 0.001 (0.034 ± 0.001) (Table 5). With increased snow melting, gliding became slower, reaching the highest COFs of 0.082 ± 0.006 (0.072 ± 0.004) on very wet spring snow (Figure 4; Table 5). On winter snow, the data showed optimal gliding (minimal COF) at mid to warm snow temperatures with COFs of 0.042 ± 0.001 for skiers and 0.049 ± 0.003 for snowboarders. On cold winter snow, which was only measured for skiers, the COF increased up to 0.059 ± 0.001. Not surprisingly, we observed the “slowest” conditions (highest COF) on new snow. For skiers, on new snow (freshly groomed) the lowest COF was 0.060 ± 0.008 at close to zero snow temperatures. During the same day, COF values drastically increased up to 0.138 ± 0.015, due to intensive melting, which illustrates the well-known stickiness of very wet new snow (Figure 4). During heavy snowfalls, COFs of 0.079 ± 0.007 were found for skiers. Unfortunately, no snowboard runs were conducted during days with heavy snow fall. For snowboarders, only a slight snowfall event was captured, revealing a COF of 0.059 ± 0.001 (Table 5).
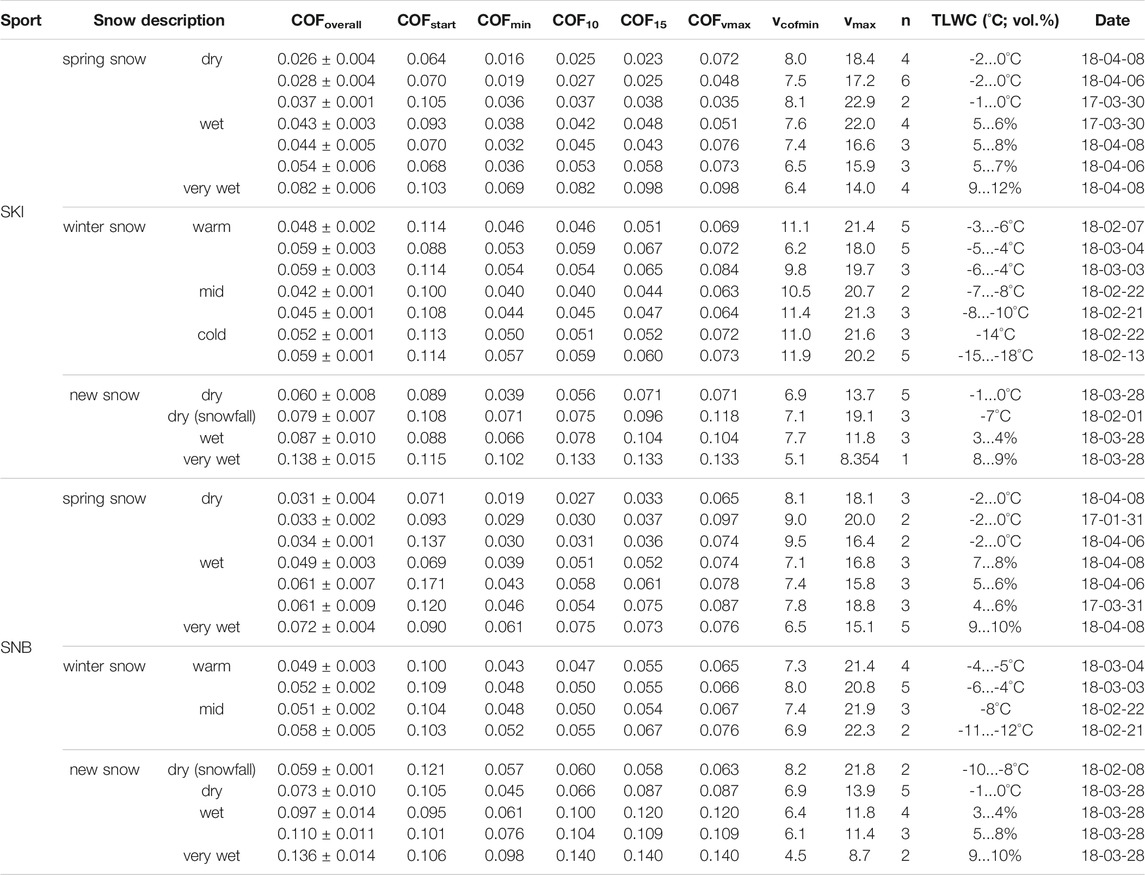
TABLE 5. Friction coefficients averaged over 2 to 6 consecutive runs with constant snow conditions, categorized into spring, winter and new snow with different snow temperature or snow wetness sub-categories. The overall COFs (mean ± σ) were averaged from 5 to 15 m s−1. Instantaneous COF values at the start (after 4 m of gliding; COFstart), when reaching the minimum COF (COFmin), at 10 m s−1 (COF10), 15 m s−1 (COF15) and at maximum speed (COFvmax), provide information on the COF speed dependency.
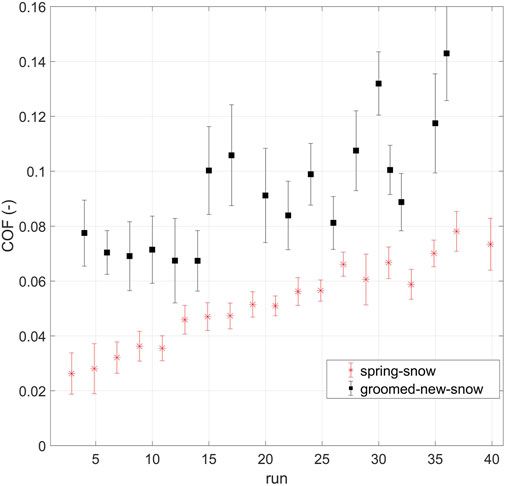
FIGURE 4. COFs (mean ± σ) of consecutive snowboard runs throughout a test day (ca. 9:00–15:00) on spring snow (18/04/08), and on groomed new snow (18/03/28) with increasing LWC from 0% to ca. 10%. The consecutive numbering of the runs also includes runs performed by skiers which are not plotted.
The above overview provides an insight into how snow friction changes with different snow categories, which group similar types and states of snow. The results showed that variations in both categorical dimensions affected the COF. The strongest effect occurred when the state of spring snow changed from dry to very wet, which tripled snow friction within a test day (Figure 4). However, using a categorical approach to link snow conditions to COF values has limitations, as the snow is not described in its full complexity. This might explain why a distinct scatter of the COFs was revealed within the same snow categories (Table 5). Therefore, further snow, weather, or process parameters and their interactions were included in the analysis to determine whether a more precise prediction of the friction of skis and snowboards on snow can be achieved.
Speed Dependency of Snow Friction
The friction data presented in Figure 4 and Table 5 show average values over one run or a couple of similar runs. However, throughout a single run, snow friction was never entirely constant. Moreover, speed is known to be an important process parameter of tribological systems. Speed can increase or decrease friction and abrasion, depending on the prevalent friction regime. Due to the self-lubricating nature of snow friction, the influence of gliding speed on snow friction is particularly important.
The COF–speed curves showed a typical pattern for all runs (Figures 5A–F), starting with a strong COF decrease over the first meters of gliding, quantified by the strong reduction from COFstart at 4 m to COFmin (Table 5) (note that “start” refers to 4 m after the athlete moved off). With increasing speed, the COF stabilized at a fairly constant level (except on wet snow) until the speed reached about 15 m s−1. These parts of the curves were specifically shaped, reflecting the different snow conditions during the tests. Both the starting section (COFstart to COFmin) and the mid-section revealed clear COF speed dependencies for both skis and snowboards. At lower speeds, from right after the start until reaching the COF minimum (occurring between 3.3 and 7.9 m s−1), a strong, negative speed dependency of the COF was found for all snow conditions (−0.012 ± 0.004 per m s−1) (Table 5). At higher speeds (7.9–15 m s−1), a clear positive speed dependency was found on wet to very wet spring snow (0.001–0.004 per m s−1) and on groomed new snow (0.003–0.007 per m s−1). At speeds beyond approximately 15 m s−1 the interpretation of the COF–speed curves became more difficult due to increasing noise caused by higher aerodynamic forces, which also led to enhanced posture variability in the athletes.

FIGURE 5. Mean COF–speed curves with error bands (±σ) and vertical lines to mark COFstart and COFmin for six snow categories: (A) skis on frozen spring snow (n = 4). (B) Skis on very wet spring snow (n = 4). (C) Skis on winter snow (n = 3). (D) Skis on cold winter snow (n = 5). (E) Snowboard on dry new snow (n = 5). (F) Snowboard on very wet new snow (n = 2).
On winter snow, skiers’ COF minimum was reached relatively late, at an average speed of 11.5 m s−1 on cold snow and 9.8 m s−1 on mid-temperature to warm snow (Figures 5A, B; Table 5). The decrease in skiers’ COF throughout those first meters of gliding was hence stronger on warm winter snow (−0.009 – −0.012 per m s−1) than on cold winter snow (−0.006 – −0.008 per m s−1). After that, skiers’ COF stayed approximately constant on cold winter snow, while speed increased further (Figure 5D). In contrast, on warm winter snow, a slight increase in friction was measured as shown in Table 5 (0.001–0.002 per m s−1). For snowboarders the COF minimum on mid-temperature to warm winter snow was reached earlier (7.4 m s−1) than for skiers, but was then followed by the same slight increase in friction with increasing speed (0.001–0.002 per m s−1).
On dry spring snow, snowboarders’ and skiers’ COFs showed a strong decrease over the starting section (−0.011 – −0.019 per m s−1) reaching very low COF minima, followed by a distinct COF increase until speed reached 10–12 m s−1 (Figure 5A). For most runs, a stagnation or even a decrease in the COF was observed, while accelerating to 15 m s−1. With increasing snow wetness, not surprisingly, the COF minimum was higher and was reached at lower speeds (ca. 6.5 m s−1), the speed–COF relationship was more variable during the first meters (0.009–0.026 per m s−1), and the COF rise after passing the minimum was enhanced (0.001–0.004 per m s−1) (Figure 5B).
For dry, groomed new snow, the COF–speed curves were shaped similarly to those for moist to wet spring snow. The COF decreased strongly after the start (−0.013 – −0.0018 per m s−1 on average), reached its minimum values quickly at low speeds (ca. 7 m s−1), and was followed by a steep COF increase (0.004–0.005 per m s−1) until reaching maximum speeds of around 14 m s−1 (Figure 5E). When new snow became wet, the curves were shifted to higher COF values and squeezed horizontally. The COF decline over the first meters of gliding became smaller (−0.005 – −0.012 per m s−1) and minimal friction values (ca. 0.01) were reached at about 5 m s−1 (Figure 5F). The following increase in friction was the strongest of all the tested snow conditions (0.006–0.011 per m s−1), limiting athletes’ maximum speed to about 12 m s−1 on wet and 8.5 m s−1 on very wet new snow. In contrast, during snowfalls, we found a more constant COF–speed curve without a pronounced increase after the COF minimum (0–0.003 per m s−1), comparable to winter snow.
Parametrizations of Snow Friction with Snow Physical Properties
Beyond the snow-specific quantification of snow friction related to a system of ten snow categories, we used measurable and continuous scaled physical quantities to describe the snow more objectively and accurately. This approach aimed to gain a better understanding of the underlying mechanisms behind snow friction and to create a better method of predicting snow friction. This included the idea that any type of snow can be adequately described using five quantities: temperature, LWC, density, SSA, and penetration resistance. Moreover, linking snow friction to physical snow properties allows the application of snowpack models (Lehning et al., 2006; Hanzer et al., 2020) to forecast snow friction, as a function of weather scenarios and topographies for any ski slope or slopestyle course, worldwide.
Although the COF could not be accurately determined from a single snow property alone (R2 = 0.04–0.29), single parameter models mostly revealed plausible dependencies and predicted realistic COF ranges (ca. 0.02–0.10 as means of entire runs). High COFs were predicted for high LWC values, while low COFs were especially predicted on hard snow as quantified by a high penetration resistance (Figures 6, 7). For skiers in particular, the influence of the snow’s SSA and density on the COF corresponded to what practitioners would expect: snow with a high SSA makes gliding slower, e.g., a thin layer of new snow crystals on the track. In contrast, a high-density track, such as a very compacted winter snow slope, usually facilitates fast gliding. For the snowboarders, single parameter models showed a lower degree of determination (R2 = 0.04–0.16) and PR appeared to be the only useful parameter for predicting the COF, although its predictive power was still rather low. In summary, it was found that single parameter models could not sufficiently determine snow friction, since considerable interactions between the snow parameters were assumed. For example, high snow density can be a result of intense melting, which leads to soft snow with a high LWC causing high snow friction, as reported in chapter 3.1. However, high snow densities at subzero snow temperatures can involve hard snow with no liquid water content, which causes low snow friction, an aspect that is widely known and shown above. Therefore, the predictive powers of models including multiple snow parameters and their interactions were assessed.
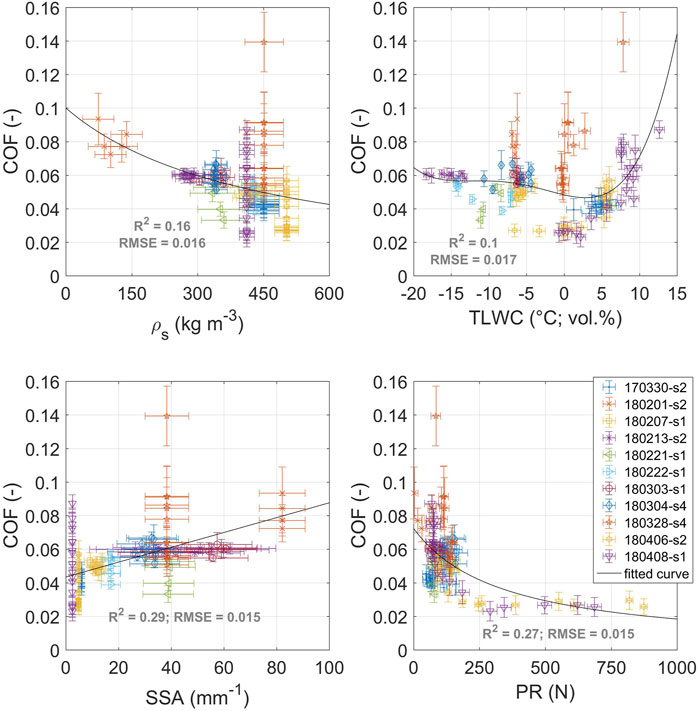
FIGURE 6. Mean (±σ) friction coefficients of all analyzed (n = 114) ski runs plotted versus the corresponding approximated snow properties (±RMSE) at the time of each run. Fitted curves represent single snow parameter models specified in the methods.
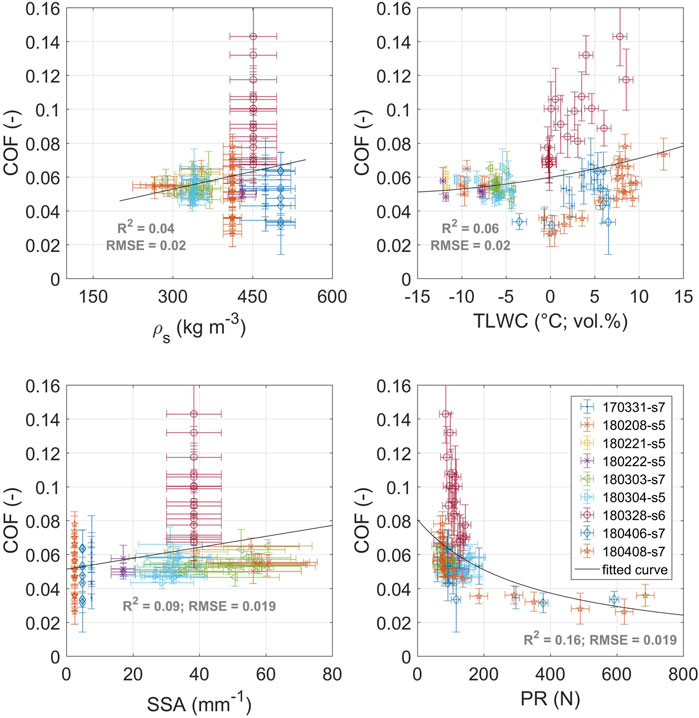
FIGURE 7. Mean (±σ) friction coefficients of all analyzed (n = 100) snowboard runs plotted versus the corresponding approximated snow properties (±RMSE) at the time of each run. Fitted curves represent single snow parameter models specified in the methods.
Multivariate models for the COF had distinctively higher explanatory power than the single parameter models (R2adj_SKI = 0.74; R2adj_SNB = 0.77, Supplementary Appendix Figures S7, S8), and RMSEs were reduced from about 0.016 to 0.009 for skiers and from 0.019 to 0.010 for snowboarders. For the skiers’ COF model, snow density was excluded a priori from the multivariate analysis, because density correlated considerably with SSA (rpearson = −0.79, Supplementary Appendix Figures S9, S10), whereas density was the weaker predictor of the two in the univariate models (R2 = 0.16 vs. 0.29; Figure 6). The backward stepwise multivariate regression models produced, for skiers and snowboarders, linear terms for the PR, SSA and TLWC, a quadratic term for TLWC, and a mixed term for SSA and TLWC. In addition, the snowboarders’ model included a weak quadratic PR-term and a mixed term for PR and SSA. In contrast, the skiers’ model additionally included a mixed term for PR and TLWC (Eqs 10, 11). The most significant predictors were the SSA and TLWC and their interactions (p < 0.001). Although PR was not removed from the models by the backward iteration, its terms and interactions with TLWC (skiers) and SSA (snowboarders) were of lower significance (pPR_SKI = 0.041; pPR:TLWC_SKI = 0.013; pPR_SNB = 0.030; pPR:SSA_SNB = 0.071, Supplementary Appendix Table S1).
The multivariate models were visualized by plotting the COF over SSA and TLWC, as they were the strongest and most significant predictors. SSA and TLWC can be understood as measures of the snow type and its thermal state, which supports the value of the snow categories introduced above (Table 4). For both groups, three plots are shown, for low, mid and high PRs, which correspond to the 5-, 50-, and 95-percentiles of all PR measurements. All plots revealed similar patterns, with a COF peak for high LWC and SSA values and an area of minimal COF for low SSA and TLWC around zero. Interestingly, the models predicted low friction even for snow containing small amounts of liquid water. In the upper half of the plot, contour lines run from top left to the right showing how SSA and TLWC interacted: the higher the SSA, the more friction was affected by changes of temperature or LWC. For example, for a skier on coarse-grained spring snow with a low SSA (ca. 5 mm−1), friction remained constant at a low level (0.03–0.04) over a wide span of TLWC (−8°C to 2%). In contrast, for snow with a high SSA (around 60 mm−1), e.g., fragmented new snow particles compressed on an in-run after a few ski/snowboard runs, the same TLWC range corresponded to a much stronger COF increase (0.07–0.11) starting at a higher COF level. Following the vertical transects in the COF plots could help practitioners to predict changes in snow friction throughout a day, depending on the prevailing snow microstructure (SSA) and the expected diurnal warming and melting.
Snow hardness affected the modelled COF only if the PR shifted from mid to very high values (Figures 8B vs 8C,8E vs 8F). The diagonal pattern in the upper half of the plots changed slightly to a more vertical pattern, indicating that TLWC influenced friction less on hard, warm to wet snow, while SSA gained importance. Moreover, the region of minimal friction was shifted upwards, to warmer or wetter snow conditions. In contrast, for lower temperatures at high PRs, the skiers’ COF model revealed TLWC as the dominating variable, visualized by a more horizontal pattern in the lower half of the plot (Figures 8C,F). The coexistence of wet and hard snow (high LWC and PR) is usually a contradictory parameter combination, as snow distinctively softens beyond a certain liquid water content (Fierz et al., 2009). Nevertheless, good examples of good gliding conditions with low COF, even when melting occurs, are water-injected alpine ski racing slopes. Similar to wetness, hard snow with high SSA does not occur naturally, but can be produced artificially, to a certain extent. Machine-made snow can link SSA values up to 25 mm−1 with a high PR (Wolfsperger et al., 2014).

FIGURE 8. COF contour maps of skiers (A–C) and snowboarders (D–F) visualizing multivariate models of the COF–snow property relationship for low (A,D), mid (B,E), and high (C,F) PRs. The measured COF values are visualized by small black dots revolved by larger filled circles (= 1 run). If the measurement (filled circle) has the same value (color) as the model (background), only the small black dot is visible.
The comparison of the presented multivariate COF models with multivariate models using a common set of explanatory variables (Tair, Tss, RH and grain shape class) as used by ski technicians indicated that the latter has distinctively lower explanatory power (R2adj_SKI = 0.34; R2adj_SNB = 0.37). This confirmed the benefit of using measurable physical quantities of snow to predict ski-snow friction.
Uncertainties of the COF
Throughout the averaged section of a single run, the COF curves fluctuated by about ±12% on average, and in 95% of all runs were between ±3.9 and ±23.5%. COF variations over a single run could partly be explained by the observed speed dependency (Figures 5A–F), typically showing a COF decrease at low speeds after starting off, followed by an increase at higher speeds. Comparing several consecutive runs under constant snow conditions revealed a varying reproducibility ranging from ±0.001 (±2.4%; Figure 9A) to ±0.006 (±10.4%; Figure 9B). The reproducibility clearly increased with decreasing wind and was higher on winter snow and on dry spring snow (Tables 2, 5).
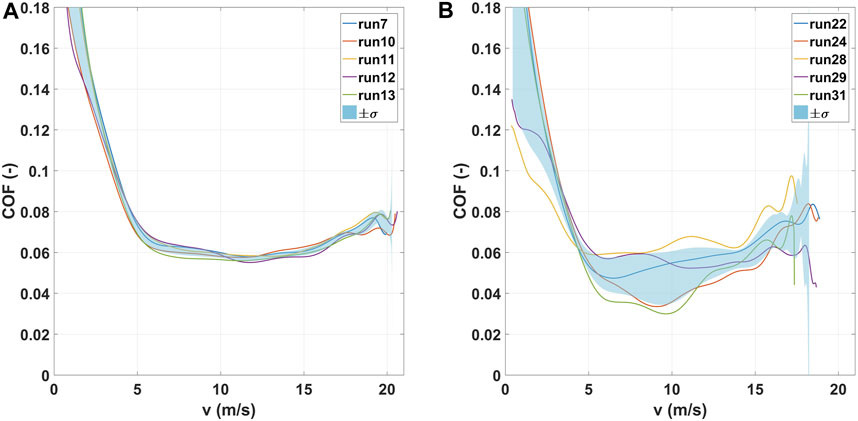
FIGURE 9. (A) Five consecutive runs of skier S1 on February 13, on cold winter snow with calm air (vwind = 0.1 ± 0.7 m s−1, COF = 0.059 ± 0.001). (B) Five consecutive runs of skier S4 on March 4, on warm winter snow with a light breeze (vwind = 2.2 ± 1.1 m s−1, COF = 0.054 ± 0.006).
The calculated COF uncertainty, obtained from the input variables, turned out higher as the variability of the COFs of consecutive runs shown in Figure 9. The relative uncertainty of the COF obtained from the input variables was ±30.2%, which corresponds to an absolute uncertainty of about ±0.018 for a COF of 0.06. The main contribution came from the uncertainty of the friction force (±28.8%). This was primarily caused by a high uncertainty in the inertial force Δ(m·a) (±15%), and was followed by the uncertainties of FGx (±8.1%) and drag (±5.7%). Δ(m·a) dominated up to velocities of about 18 m s−1. At higher speeds, uncertainties of drag had the strongest contribution. COF uncertainty introduced by the normal force was small (±1.4%), and was dominated by gravitational force uncertainty (±1.2%). Nevertheless, radial forces and their uncertainties would become more relevant in transitions, if the terrain is curved (ΔFR = ±0.8% with r = 16 m).
With regard to the multivariate COF models, total uncertainties of the snow-dependent COF models were 0.014, for both ski and snowboard. The contribution of the snow measurements’ uncertainties were 0.005 and 0.004 for ski and snowboard, respectively. The uncertainties of the snow measurements were on average ±0.8% for LWC, ±0.3°C for Tss, ±6.6 mm−1 for SSA, ±21.1 N for PR and ±31.3 kg m−3 for the snow density.
Discussion
The presented data quantified how strongly snow properties influence the friction of skis and snowboards. Snow friction was measured over a wide range of snow conditions in a consistent and comparable manner, using the same method and equipment with the same athletes over two winter seasons. For the first time, the effects of changing snow conditions on friction could be related to a set of measurable physical properties of snow and their interactions. In addition, this study showed how speed influences snow friction depending on the prevailing snow conditions. GNSS-based ski–snow friction measurements were shown to be sufficiently precise to differentiate the COFs of various snow conditions. The method’s reproducibility as well as the uncertainties of the input variables and their contribution to the final result (COF) were analyzed in detail and are discussed below.
Comparison of the Results with the Literature
The first friction experiments with real skis were conducted by Bowden and Hughes (1939) revealing COFs from 0.04 to 0.08 by pulling loaded skis (v = 0.1 m s−1) over fine grained snow, which was at 0°C with some melting towards the end of the experiments. Decades later on-field measurements of the COF during real skiing revealed values between about 0.009 and 0.1 (Habel, 1968; Kuroiwa, 1977; Leino and Spring, 1984; Kaps et al., 1996) confirming the order of magnitude of the values found in this study. However, the minimal and maximal COFs obtained in the current study were distinctly higher than those found in former studies. The fact that wind and skiers’ drag areas were not measured in the cited studies, as well as the unknown reproducibility due to the low number of identical experiments, raises doubts about the use of those results as reference values. In general, comparisons between studies are difficult due to unknown differences in ski equipment, waxing and snow properties. A more recent study by Budde and Himes (2017) presented a large COF data set for XC skis (at 5 m s−1) with different grindings and wax configurations, using a test sled. COFs ranged from 0.005 on spring snow (Tair > 0°C) to 0.035 on new snow (Tair = −25°C). Their results confirmed the findings of Kaps et al. (1996), with the lowest COFs being less than 0.01, but did not show the upper boundary of possible COFs on wet and very wet snow. The average COF of 0.013 for the fastest snow conditions (with factory-ground base) corresponded well to the instantaneous minimum of 0.016 found in the current study (Table 5), especially considering that XC skis are assumed to have a slightly better gliding performance compared to freestyle skis. Regrettably, the snow characterization was limited to an oversimplified categorical classification of new, old, and transformed snow. The applied photogrammetry in the earlier studies as well as the use of more recently introduced ski sleds (Swarén et al., 2014) showed that immense effort is needed to conduct accurate on-field measurements revealing true absolute COF values. In contrast, among ski racing teams it is common praxis to quantify snow friction by conducting gliding tests with exact time measurements over defined sections. This rather simplistic approach is intended to find significant differences in gliding performance between different types of skis, if conditions are stable and testers have excellent ability to reproduce postures. However, in addition to other methodological concerns (Colbeck, 1994), a uniform quantification of snow friction using a friction coefficient is lacking with this approach.
To overcome those problems, Nachbauer et al. (2016) introduced a real-scale laboratory tribometer that is considered the state-of-the-art COF measurement, providing high accuracy, adequate precision (Hasler et al., 2016), and high validity for a laboratory setup, as real skis or snowboards can be tested. COFs ranging from about 0.025 to 0.075 have been reported for alpine skis on machine-made snow (Schindelwig et al., 2014; Rohm et al., 2017). On cold snow (−11°C) Nachbauer et al. (2016) reported a constant COF over speed (5–15 m s−1) of 0.06, whereas on warm snow (−3°C) a COF increase from about 0.03 to 0.055 was found. In this study, on cold winter snow (−14°C) a constant COF was found that was slightly lower (0.052, Table 5). On warm winter snow, COFs also increased with speed up to 0.067 (15 m s−1), but were higher at lower speeds (0.046–0.053). For boardercross snowboards, COFs were reported from 0.035 to 0.045 at speeds from 5 to 8 m s−1 (Tss = −6°C) (Hasler et al., 2014), which corresponded well with our observed instantaneous COFs at 8 m s−1 on warm winter snow (−4…−6°C) of about 0.045 for a freestyle snowboard (Table 5).
In summary, the presented COFs correspond well with values from the literature. Comparability of the studies was mainly available for dry snow conditions with COFs below about 0.06. This suggests high internal validity of the applied dGNSS-based method and supports there being sufficient external validity for the full range of COFs from about 0.02 to 0.14 for slopestyle and big air in-runs. However, an intrinsic challenge of snow friction measurements, whether in the lab or in the field, is the fact that friction forces are small, while noise increases with higher speeds and due to the inherent fragility of snow.
Interpretation and Limitations of the Results
The COF found for snowboards was slightly higher than for skis, on average and for most snow categories except on warm winter snow and on very wet spring snow. It could be assumed that the lower pressure underneath the snowboard (ca. −20%) caused higher COFs as the Hersey Number increased. However, on cold snow, assuming insufficient melt-water lubrication, this effect should reduce the friction of a snowboard compared to skis, which was not observed. Moreover, on very wet snow, the lower pressure underneath a snowboard would be expected to result in higher (hydrodynamic) friction than skis. On the other hand, lower pressure would reduce the sinkage of a snowboard into soft snow and therefore friction would be reduced due to less plowing and compaction. Therefore, an explanation for the observed differences in ski and snowboard friction cannot be established.
The introduced snow categories provide simple guidance to what COF values can be expected, depending on prevailing snow conditions. It was found that the fastest gliding (low COF < 0.03) occurred on hard spring snow, followed by warm to mid-temperature winter snow. COFs up to 0.06 occurred on cold winter snow, comparable with COFs on new snow (groomed) at warmer snow temperatures. On dry snow, the highest COFs of up to 0.08 occurred during snowfalls. Higher COFs only occurred when the snow became wet or very wet. For spring snow, COFs up to 0.09 were found, while for groomed new snow values of up to 0.14 were reached. It can be assumed that these are upper boundary values, which are unlikely to be exceeded because much higher LWC values do not occur at the snow surface due to percolation, and because the unfavorable microstructure of new snow for fast gliding transforms quickly when liquid water is present (Armstrong and Brun, 2008).
To find the full range of ski and snowboard friction, tests were conducted on various snow conditions. However, no tests were done on very cold snow between −20 and −30°C. Therefore, the known increase of snow friction on very cold snow was not well represented in the data, especially for snowboards, where the coldest snow was around −13°C (Figure 7; Table 5). Moreover, no tests were done on machine-made snow due to numerous snowfalls during the winter of 2017/2018, but measurements were made on frequently groomed and well-sintered winter snow, which had comparable properties (Table 3). To overcome the need to measure snow friction in all possible snow conditions, the gaps between discrete snow categories were filled by interpolating snow friction over a continuous snow parameter space. This was achieved using the presented multivariate COF parametrizations, based on a sufficient number of tests on contrasting snow conditions. The area of COF data interpolation in the TLWC - SSA plane is shown by the dotted black line in Figure 8. Outside from that area, and for very high and low PRs, COF values were extrapolated, which limited their validity. Limitations due to a narrow data set, meaning a small range of tested snow conditions, were also apparent for the single parameter COF models for snowboards (Figure 7).
To explain the huge changes of friction from the lowest COFs on frozen spring snow to the highest values on very wet new snow, three mechanisms of particular importance are assumed. 1) The dominating mode and extent of snow deformation under load, which is determined by the mechanical properties of the snow matrix and the ice. 2) The formation of solid-to-solid contacts (ice-ski base), their mechanical interaction (including abrasion) and the resulting real contact area, which manifests on the micro scale. 3) The amount and distribution of water at the ski-snow interface, which can occur due to frictional heating acting as self-lubrication, or may move from the snow pores to the interface if the LWC reaches a certain extent. Clearly, there are other mechanisms involved in snow friction, like electrostatic effects, dirt absorption and contributions from plowing and compaction. The latter can be neglected on frozen spring snow but not when the snow is soft, e.g., due to strong melting. According to Glenne (1987) a 2 mm ski sinkage (at 10 m s−1), assuming a density of 400 kg m−3, results in a resistive force of about 16 N, which would account for about 21% of the total measured ski-snow friction on very wet spring snow (COF = 0.082; Table 5). By including the found relationships between COF and snow properties, some explanations can be attempted. Lowest friction (>0.026) was measured on dry, well sintered, and therefore hard spring snow at close to zero temperatures. Besides brittle failure of the top layer grains, plastic and delayed elastic snow deformation and the resulting real contact area were assumed to be small (Theile et al., 2009). In addition, close to zero ice temperatures facilitated melt water lubrication, minimizing solid-to-solid contacts. In contrast, the increase of friction on dry winter snow (>0.042) and new snow (>0.060) was assumed to be connected to larger snow deformation forming a larger real contact area. Meltwater generation must be assumed as well, even for the coldest snow temperatures down to −18°C, as higher COFs would be expected for solely dry friction (Colbeck, 1992). Clearly, the formed solid-to-solid real contact area strongly interacts with water as lubricant, which influences frictional processes. The large COF differences measured on very wet spring and new snow (0.082 vs. 0.134) with similar LWCs, support the assumption that a key to explaining snow-dependent ski friction is understanding the interaction of snow microstructure, its deformation and resulting real contact area with lubrication and capillary effects due to melt water lubrication, and liquid water dynamics within the snow. However, it was beyond the scope of this study to identify prevailing lubrication regimes and distinguish COF contributions from real contact area, mixed or hydrodynamic friction, and capillary attraction.
The found relationships of the COF with speed were plausible and supported the theory of meltwater lubrication reducing snow friction as the COF first decreased at lower speeds, followed by an increase at higher speeds (Figure 5). This behavior matches with the idea of changing lubrication regimes due to meltwater generation from frictional heat (Colbeck, 1996). Moreover, the fact that minimum COFs were reached earlier (at lower speeds) on warm or wet snow, whereas on cold snow the minimum occurred at higher speeds, further aligned with the theory (Table 5). However, it must be assumed, at least for very wet snow, that the COF increase might not solely be caused by increased hydrodynamic friction. The slope of the COF curve appeared too steep, suggesting the involvement of additional processes as mentioned above. Moreover, on wet and very wet snow, doubts arose about the COF decrease right after the start. According to the theory, friction should be low right from the start, as sufficient lubrication should occur due to the LWC of the snow. A possible explanation could be that at slower speeds, the snow was loaded for a longer period and at a lower strain rate, which may have increased snow deformation (Mellor, 1975) and adversely affected real contact area and water distribution at the interface. Beyond that, the analysis of snow friction at low speeds was limited as the slope of the terrain was calculated from the instantaneous velocity vector and not from separate terrain measurements, which had data gaps on several test days. Due to the static postures of the athletes, with very little vertical body movement, the slope calculation worked well as soon the athletes settled into their posture. Before that, during the first 4 m of gliding at rather low speeds, the COF-curves were biased and made analysis difficult.
The abrasion of wax during a test day was not quantified by additional contact angle measurements. Depending on the test track and number of runs, the total distance of skiing on a test day varied from about 13 to 27 km. According to Rohm et al. (2017) significant wax (paraffin) abrasion had to be assumed on cold snow leading to a reduction of the base’s water contact angle. Whereas on warm snow, abrasion was reported to be much less keeping contact angles unaffected, at least over the first 9 km. Therefore, the wet snow tests at the test track at Bolgen (Figure 1), which was in close proximity to the chairlift keeping the skied distance small, are probably less affected by wax abrasion.
The uncertainty of the presented COFs had an upper limit deduced from error propagation calculations of about ±0.018, and a lower limit of about ±0.001 based on the measured variability of COF averages of consecutive runs under optimal conditions. A limitation of the applied COF measurement method was the calculation of relatively small friction forces from accelerations with considerable uncertainties. The magnification of superimposed noise on kinematic data when determining accelerations from displacement data is a known problem in biomechanics (D'Amico and Ferringo, 1992). The spline smoothing of the position data applied here is an approved method to minimize superimposed noise effects on the raw data (Skaloud and Limpach, 2003). Nevertheless, further smoothing of the speed and acceleration had to be conducted to eliminate artifacts in the COF curves (Supplementary Appendix Figures S11, S12). An exact determination of the uncertainty of accelerations used for the COF calculations was difficult as uncertainty depends on several factors, including the dynamics of the analyzed motion, the specifications of the dGNSS hardware and processing algorithms, the GNSS signal shading and reflection, or the terrain and time-specific satellite constellations (Gilgien et al., 2013; Gilgien et al., 2015). Gilgien et al. (2015) stated an uncertainty of the applied dGNSS method for instantaneous acceleration of ±0.22 m s−2 for alpine giant slalom ski racing for turning where a virtual pendulum was attached to the head compared to a video based system, which usually provide position accuracies of about 0.001–0.022 m (van der Kruk and Reijne, 2018). Since our gliding tests included no turning the error is expected to be much smaller. The major part of the instantaneous acceleration error of ±0.22 m s−2 was associated with the pendulum swing. In this study, the input uncertainty of the acceleration was therefore calculated as ±0.09 m s−2 (Table 4), which is about ±5% of the average acceleration throughout the analyzed gliding section (assuming a COF of 0.06). Assuming a one-percent acceleration uncertainty, the propagated COF uncertainty would have been reduced from ±30% to about ±20%.
Practical Implications
This study has presented, for the first time, a data set that describes the snow friction for freestyle skis and snowboards for a full range from very fast gliding snow conditions to excessively slow ones. It was shown that snow friction can vary considerably from day to day, but also can change within hours. For Olympic freestyle disciplines like slopestyle or big air, it is important to understand this variability as it strongly affects the take-off speed at jumps and therefore determines whether athletes land with low impact in the sweet-spot zone or jump too far or too short, risking severe injuries. Now, based on the findings of this research, the COF can be predicted from the prevailing snow physical properties, which can be measured using available and affordable instruments or calculated using numerical snowpack and weather models (Wolfsperger et al., 2018; Hanzer et al., 2020). For that purpose, practitioners should use the shown multi-parameter COF models given in Equations 10, 11. The precise calculation of snow friction depending on the weather and snow at a specific venue will help course builders to improve the design of snow parks from a safety point of view, and give organizers of freestyle events the ability to anticipate diurnal changes in snow friction and thus injury risk.
As an alternative to the calculation of COF from physical snow parameters that require the use of snow measurement instruments, practitioners can also roughly estimate snow friction on a groomed track with a thermometer, a visual characterization of the snow to identify the prevailing snow category and by considering the weather of the last and upcoming 24 h. If there was snowfall or fragments of dendrites are visible at the snow surface, COF values for new snow must be assumed starting from 0.06 and higher. If snowfall is starting, a COF increase to 0.08 can be expected. Else, if the snow temperature rises and reaches 0°C already before noon, melting will probably occur, and hence the COF can quickly reach 0.10, and in rare cases, if the weather is remarkable warm, COF can rise up to a value of 0.14. However, if spring snow is prevailing and the snow temperature is below 0°C the COF can be estimated as low as 0.02 and up to 0.04. If the snow reaches 0°C and melting begins the COF still stays rather low (<0.04) as long as the snow is not noticeably deformed by the skis. Once the snow significantly softens the COF rises to about 0.06, and with warm weather or strong sun exposure values can reach 0.08. For any other winter snow conditions with snow temperature about −1 and −20°C (excluding very cold snow), COF values range between about 0.04 and 0.06.
Data Availability Statement
The raw data supporting the conclusions of this article will be made available by the authors, without undue reservation.
Ethics Statement
The studies involving human participants were reviewed and approved by the Norwegian School of Sport Sciences, and the Norwegian Centre for Research Data. The patients/participants provided their written informed consent to participate in this study.
Author Contributions
FW, FM, and MG designed the study and methodology, FW and FM conducted the data collection, FW, FM, and MG analyzed the data, FW wrote a first draft of the manuscript, FW, FM, and MG revised the draft and approved the final version of the manuscript.
Funding
The study was funded by the International Olympic Committee (IOC) and the Internet of Sports, Mid-Sweden University.
Conflict of Interest
The authors declare that the research was conducted in the absence of any commercial or financial relationships that could be construed as a potential conflict of interest.
Publisher’s Note
All claims expressed in this article are solely those of the authors and do not necessarily represent those of their affiliated organizations, or those of the publisher, the editors and the reviewers. Any product that may be evaluated in this article, or claim that may be made by its manufacturer, is not guaranteed or endorsed by the publisher.
Acknowledgments
We appreciate the support from David Krummenacher, Benjamin Eggert and the Davos Klosters Bergbahnen AG.
Supplementary Material
The Supplementary Material for this article can be found online at: https://www.frontiersin.org/articles/10.3389/fmech.2021.728722/full#supplementary-material
References
Armstrong, R. L., and Brun, E. (2008). Snow and Climate: Physical Processes, Surface Energy Exchange and Modeling (Cambridge: Cambridge University Press).
Bäurle, L. (2006). Sliding Friction of Polyethylene on Snow and Ice (Doctoral Thesis). Switzerland: ETH Zürich, Zürich.
Bianchi, G., Brügger, O., and Niemann, S.. (2016). Verletztentransporte im Schneesport, 2015/2016. bfu – Beratungsstelle für Unfallverhütung. doi:10.13100/bfu.2.283.01
Böhm, H., and Senner, V. (2009). “Safety in Big Jumps: Relationship between landing Shape and Impact Energy Determined by Computer Simulation,” in Ski. Trauma Saf. (ASTM STP), Vol. 17, 1510. doi:10.1520/STP47479S
Böttcher, R., Seidelmann, M., and Scherge, M. (2017). Sliding of UHMWPE on Ice: Experiment vs. Modeling. Cold Regions Sci. Technol. 141, 171–180. doi:10.1016/j.coldregions.2017.06.010
Bowden, F. P., and Hughes, T. P. (1939). The Mechanism of Sliding on Ice and Snow. Proc. R. Soc. Lond. A. 172, 280–298. doi:10.1098/rspa.1939.0104
Budde, R., and Himes, A. (2017). High-resolution Friction Measurements of Cross-Country Ski Bases on Snow. Sports Eng. 20, 299–311. doi:10.1007/s12283-017-0230-5
Buhl, D., Fauve, M., and Rhyner, H. (2001). The Kinetic Friction of Polyethylen on Snow: the Influence of the Snow Temperature and the Load. Cold Regions Sci. Technol. 33, 133–140. doi:10.1016/S0165-232X(01)00034-9
Canale, L., Comtet, J., Niguès, A., Cohen, C., Clanet, C., Siria, A., et al. (2019). Nanorheology of Interfacial Water during Ice Gliding. Phys. Rev. X 9, 041025. doi:10.1103/PhysRevX.9.041025
Colbeck, S. C. (1996). “A Review of the Friction of Snow,”. ASI Series (Series E: Applied Sciences) in In Physics of Sliding Friction. Editors B. N. E. J Persson, and N. A. T. O. Tosatti (Dordrecht: Springer), Vol. 311, 275–291. doi:10.1007/978-94-015-8705-1_18
Colbeck, S. C. (1992). A Review of the Processes that Control Snow Friction. Hanover, NH: Cold Regions Research and Engineering Lab. Technical Report ADA252362.
Colbeck, S. C. (1994). An Error Analysis of the Techniques Used in the Measurement of High-Speed Friction on Snow. A. Glaciology 19, 19–24. doi:10.3189/1994AoG19-1-19-2410.1017/s0260305500010934
D'Amico, M., and Ferrigno, G. (1992). Comparison between the More Recent Techniques for Smoothing and Derivative Assessment in Biomechanics. Med. Biol. Eng. Comput. 30, 193–204. doi:10.1007/BF02446130
Denoth, A. (1994). An Electronic Device for Long-Term Snow Wetness Recording. Ann. Glaciol 19, 104–106. doi:10.3189/s0260305500011058
Fauve, M., Buhl, D., Rhyner, H. U., Schneebeli, M., and Ammann, W. (2005). “Influence of Snow and Weather Characteristics on the Gliding Properties of Skis,” in Science and Skiing (Aspen, CO), III, 401–410.
Fierz, C., Armstrong, R. L., Durand, Y., Etchevers, P., Greene, E., McClung, D. M., et al. (2009). “The International Classification of Seasonal Snow on the Ground,” in IHP-VII Technical Documents in Hydrology No 83, IACS Contribution No 1 (UNESCO-IHP).
Florenes, T. W., Heir, S., Nordsletten, L., and Bahr, R. (2010). Injuries Among World Cup Freestyle Skiers. Br. J. Sports Med. 44 (11), 803–808. doi:10.1136/bjsm.2009.071159
Flørenes, T. W., Nordsletten, L., Heir, S., and Bahr, R. (2012). Injuries Among World Cup Ski and Snowboard Athletes. Scand. J. Med. Sci. Sports 22 (1), 58–66. doi:10.1111/j.1600-0838.2010.01147.x
Gergely, M., Wolfsperger, F., and Schneebeli, M. (2014). Simulation and Validation of the InfraSnow: an Instrument to Measure Snow Optically Equivalent Grain Size. IEEE Trans. Geosci. Remote Sensing 52 (7), 4236–4247. doi:10.1109/TGRS.2013.2280502
Gilgien, M., Kröll, J., Spörri, J., Crivelli, P., and Müller, E. (2018). Application of dGNSS in alpine Ski Racing: Basis for Evaluating Physical Demands and Safety. Front. Physiol. 9, 145. doi:10.3389/fphys.2018.00145
Gilgien, M., Spörri, J., Chardonnens, J., Kröll, J., Limpach, P., and Müller, E. (2015). Determination of the centre of Mass Kinematics in alpine Skiing Using Differential Global Navigation Satellite Systems. J. Sports Sci. 33, 960–969. doi:10.1080/02640414.2014.977934
Gilgien, M., Spörri, J., Chardonnens, J., Kröll, J., and Müller, E. (2013). Determination of External Forces in alpine Skiing Using a Differential Global Navigation Satellite System. Sensors 13, 9821–9835. doi:10.3390/s130809821
Gilgien, M., Spörri, J., Kröll, J., and Müller, E. (2016). Effect of Ski Geometry and Standing Height on Kinetic Energy: Equipment Designed to Reduce Risk of Severe Traumatic Injuries in alpine Downhill Ski Racing. Br. J. Sports Med. 50, 8–13. doi:10.1136/bjsports-2015-095465
Gilgien, M., Spörri, J., Limpach, P., Geiger, A., and Müller, E. (2014). The Effect of Different Global Navigation Satellite System Methods on Positioning Accuracy in Elite Alpine Skiing. Sensors 14, 18433–18453. doi:10.3390/s141018433
Glenne, B. (1987). Sliding Friction and Boundary Lubrication of Snow. J. Tribol. Oct. 109 (4), 614–617. doi:10.1115/1.3261520
Habel, B. (1968). Über die Bestimmung von Luftwiderstand und Gleitreibung beim Skilauf. EuropaSport 20, 950–955.
Hanzer, F., Carmagnola, C. M., Ebner, P. P., Koch, F., Monti, F., Bavay, M., et al. (2020). Simulation of Snow Management in Alpine Ski Resorts Using Three Different Snow Models. Cold Regions Sci. Technol. 172 (17 pp.), 102995. doi:10.1016/j.coldregions.2020.102995
Hasler, M., Schindelwig, K., Knoflach, C., Reichl, W., and Nachbauer, W. (2014). Kinetic Friction of Boardercross-Snowboards. Proced. Eng. 72, 310–314. doi:10.1016/j.proeng.2014.06.054
Hasler, M., Schindelwig, K., Mayr, B., Knoflach, C., Rohm, S., van Putten, J., et al. (2016). A Novel Ski-Snow Tribometer and its Precision. Tribol. Lett. 63, 33. doi:10.1007/s11249-016-0719-2
Heer, B., Bürgi, F., and Weiler, M. (2019). Snowparks: Sicherheitsaspekte bei Planung, Bau und Betrieb. Beratungsstelle für Unfallverhütung BFU, Bern. Fachdokumentation 2, 081. doi:10.13100/BFU.2.081.01.2019
Henrie, M., Petron, D., Pepper, M., Kirkham, J., Chen, Q., and Willick, S. (2010). Comparison of Ski and Snowboard Injuries that Occur inside versus outside Terrain Parks. Med. Sci. Sports Exerc. 42, 473–474. doi:10.1249/01.MSS.0000385054.56383.47
Hubbard, M., McNeil, J. A., Petrone, N., and Cognolato, M. (2015). “Impact Performance of Standard Tabletop and Constant Equivalent Fall Height Snow Park Jumps,” in Skiing Trauma and Safety: 20th Volume, STP 1582. Editors R. J. J. E. S. Johnson, and R. M. Greenwald (West Conshohocken, PA: ASTM International), 51–71. doi:10.1520/STP158220140027
Kaps, P., Nachbauer, W., and Mossner, M. (1996). “Determination of Kinetic Friction and Drag Area in alpine Skiing,” in Skiing Trauma and Safety,” in ASTM STP 1266. Editors (Philadelphia: American Society for Testing Materials), Vol. 10, 165. doi:10.1520/STP37926S
Kuroiwa, D. (1977). The Kinetic Friction on Snow and Ice. J. Glaciol. 19, 141–152. doi:10.3189/s0022143000029233
Lehning, M., Völksch, I., Gustafsson, D., Nguyen, T. A., Stähli, M., and Zappa, M. (2006). ALPINE3D: a Detailed Model of Mountain Surface Processes and its Application to Snow Hydrology. Hydrol. Process. 20 (10), 2111–2128. doi:10.1002/hyp.6204
Leino, M. A. H., and Spring, E. (1984). “Determination of the Coefficient of Kinetic Friction between Ski and Snow from Gliding Velocity of a Skier,” in Report Series in Geophysics (FI: University of Helsinki), Vol. 19.
Lever, J. H., Taylor, S., Hoch, G. R., and Daghlian, C. (2019). Evidence that Abrasion Can Govern Snow Kinetic Friction. J. Glaciol. 65 (249), 68–84. doi:10.1017/jog.2018.97
Levy, D., Hubbard, M., McNeil, J. A., and Swedberg, A. (2015). A Design Rationale for Safer Terrain Park Jumps that Limit Equivalent Fall Height. Sports Eng. 18, 227–239. doi:10.1007/s12283-015-0182-6
McNeil, J. A., Hubbard, M., and Swedberg, A. D. (2012b). Designing Tomorrow's Snow Park Jump. Sports Eng. 15 (1), 1–20. doi:10.1007/s12283-012-0083-x
Mellor, M. (1975). “A Review of Basic Snow Mechanics,” in Symposium at Grindelwald 1974—Snow Mechanics (IAHS Publ), 114, 251–291.
Nachbauer, W., Kaps, P., Hasler, M., and Mössner, M. (2016). “Friction between Ski and Snow,” in In the Engineering Approach to Winter Sports. Editors F. Braghin, F. Cheli, S. Maldifassi, S. Melzi, and E. Sabbioni (New York, NY: Springer), 17–32. doi:10.1007/978-1-4939-3020-3_2
Nachbauer, W., Schröcksnadel, P., and Lackinger, B. (1996). “Effects of Snow and Air Conditions on Ski Friction,” in Skiing Trauma and Safety. Editors C. Daniel Mote, R. J. Johnson, W. Hauser, and P. S. Schaff (West Conshohocken, PA: ASTM International), Vol. 10, 78–185.
Rohm, S., Unterberger, S. H., Hasler, M., Gufler, M., van Putten, J., Lackner, R., et al. (2017). Wear of Ski Waxes: Effect of Temperature, Molecule Chain Length and Position on the Ski Base. Wear 384-385, 43–49. Volumes 384–385. doi:10.1016/j.wear.2017.05.004
Scher, I., Shealy, J., and Stepan, L. (2015). Terrain Park Jump Design: Would Limiting Equivalent Fall Height Reduce Spine Injuries? Ski. Trauma Saf. 20th, 72–90. ASTM International. doi:10.1520/stp158220140047
Schindelwig, K., Hasler, M., van Putten, J., Rohm, S., and Nachbauer, W. (2014). Temperature below a Gliding Cross Country Ski. Proced. Eng. 72, 380–385. doi:10.1016/j.proeng.2014.06.065
Schindelwig, K., Platzer, H.-P., Mössner, M., and Nachbauer, W. (2019). Safety Recommendations of winter Terrain Park Jumps into Airbags. J. Sci. Med. Sport 22, S50–S54. doi:10.1016/j.jsams.2018.09.229
Shealy, J. E., and Stone, F. (2008). Tabletop Jumping: Engineering Analysis of Trajectory and landing Impact. J. ASTM Int. 5 (6), 1. doi:10.1520/jai101551
Shealy, J., Scher, I., Stepan, L., Harley, E., Johnson, R. J., Shealy, J., et al. (2010). Jumper Kinematics on Terrain Park Jumps: Relationship between Takeoff Speed and Distance Traveled. J. ASTM Int. 7 (10), 102885. doi:10.1520/JAI102885
Skaloud, J., and Limpach, P. (2003). “Synergy of CP-DGPS, Accelerometry and Magnetic Sensors for Precise Trajectography in Ski Racing,” in Proceedings of the IONGPS (Salt Lake City: UT, USA).
SLF (2021). Available at: https://www.slf.ch/avalanche/stations/IMIS_WFJ2_EN.pdf (Accessed June 20, 2021).
Soligard, T., Palmer, D., Steffen, K., Lopes, A. D., Grant, M.-E., Kim, D., et al. (2019). Sports Injury and Illness Incidence in the PyeongChang 2018 Olympic Winter Games: a Prospective Study of 2914 Athletes from 92 Countries. Br. J. Sports Med. 53 (17), 1085–1092. doi:10.1136/bjsports-2018-100236
Sonntag, D. (1990). “Important New Values of the Physical Constants of 1986, Vapour Pressure Formulations Based on ITS-90, and Psychrometer Formulae,” in. Z. für Meteorologie. Bd. 40 (Nr. 5), 340–344. doi:10.5594/j03912
Swarén, M., Karlöf, L., Holmberg, H.-C., and Eriksson, A. (2014). Validation of Test Setup to Evaluate glide Performance in Skis. Sports Technol. 7 (1-2), 89–97. doi:10.1080/19346182.2014.968164
Szabo, D., and Schneebeli, M. (2007). Subsecond Sintering of Ice. Appl. Phys. Lett. 90, 151916. doi:10.1063/1.2721391
Theile, T., Szabo, D., Luthi, A., Rhyner, H., and Schneebeli, M. (2009). Mechanics of the Ski-Snow Contact. Tribol. Lett. 36, 223–231. doi:10.1007/s11249-009-9476-9
van der Kruk, E., and Reijne, M. M. (2018). Accuracy of Human Motion Capture Systems for Sport Applications; State-Of-The-Art Review. Eur. J. Sport Sci. 18 (6), 806–819. doi:10.1080/17461391.2018.1463397
Wolfsperger, F., Hinterberger, B., Christian, J., Matzl, M., Jahnel, R., Spörri, J., et al. (2014). “Quantifying Snow Conditions of World Cup Alpine Ski Racing Tracks,” in In Science and Skiing VI. Editors E. Müller, J. Kroll, S. Lindinger, J. Pfusterschmied, and T. Stöggl (Meyer & Meyer Verlag), 330–339.
Wolfsperger, F., Meyer, F., and Gilgien, M. (2021). Towards More Valid Simulations of Slopestyle and Big Air Jumps: Aerodynamics during In-Run and Flight Phase. J. Sci. Med. Sport, 2021. doi:10.1016/j.jsams.2021.05.005
Keywords: friction, ski, freestyle, jump design, injury risk, snowboard
Citation: Wolfsperger F, Meyer F and Gilgien M (2021) The Snow-Friction of Freestyle Skis and Snowboards Predicted From Snow Physical Quantities. Front. Mech. Eng 7:728722. doi: 10.3389/fmech.2021.728722
Received: 21 June 2021; Accepted: 30 August 2021;
Published: 16 September 2021.
Edited by:
Werner Nachbauer, University of Innsbruck, AustriaReviewed by:
Hyun-Joon Kim, Kyungpook National University, South KoreaRoland Larsson, Luleå University of Technology, Sweden
Copyright © 2021 Wolfsperger, Meyer and Gilgien. This is an open-access article distributed under the terms of the Creative Commons Attribution License (CC BY). The use, distribution or reproduction in other forums is permitted, provided the original author(s) and the copyright owner(s) are credited and that the original publication in this journal is cited, in accordance with accepted academic practice. No use, distribution or reproduction is permitted which does not comply with these terms.
*Correspondence: Fabian Wolfsperger, d29sZnNwZXJnZXJAc2xmLmNo