 Hasler M
 Jud W
Jud W Nachbauer W
- 1Department of Sport Science, University of Innsbruck, Innsbruck, Austria
- 2Research Center Snow, Ski, and Alpine Sport, Innsbruck, Austria
For many years, a frictional meltwater film has been assumed to be the reason for the low friction between skis and snow, but experimental studies have been inconclusive. Therefore, the aim of our study was to find indications or evidence for the presence of frictional meltwater. The friction between snow at −4°C and an XC ski as well as a flat ski was measured on a large-scale linear snow tribometer at realistic skiing speeds from 5 to 25 m/s. We used an infrared camera to analyze the snow temperature behind the skis. From the maximum snow surface temperature, we estimated the temperature at the spots where ski and snow contacted. Assuming that the contact spot temperature does not notably exceed 0°C, we calculated the relative contact area between ski and snow. Maximum snow surface temperatures were very close to 0°C. Given that not the entire snow surface is in contact with the ski, this finding is a strong indication for snow melting. Heat flow considerations led to the conclusion that there must be energy dissipation beyond the heat flow into ski and snow. The most obvious mechanism for the additional energy dissipation is snow melting. Presuming that the contact spot temperatures are at most slightly above 0°C, we calculated relative contact areas of 21–98%. Previous research has reported much lower values; however, most studies were conducted under conditions that are not realistic for skiing.
Introduction
For decades, the low friction between skis and snow has been attributed to a liquid layer between the two friction partners. The formation of this layer was first thought to be caused by pressure melting (Thomson, 1849). Later, frictional heat was postulated to be responsible for the meltwater film between ski and snow (Bowden and Hughes, 1939). A third cause for a thin water film was first described by (Weyl, 1951): He assumed intrinsic pre-melting, causing a transition layer of only a few 100 Å from the snow bulk to the surface. The properties of this liquid-like layer were assumed to be neither those of water nor those of ice. In contrast to these theories, which all relate the frictional properties of a ski sliding on snow to a liquid water layer, Lever et al. (2019) presented an experiment where they detected no water film in conditions similar to skiing (rather low speeds and temperatures, pressures below the average pressure between ski and snow). They attributed the low friction to abraded particles acting as ball bearings.
Several experimental studies have been carried out to determine the amount of water between ski and snow (Ambach and Mayr, 1981). measured the change of capacitance of a probe on a ski base oriented towards the snow during skiing and calculated the water film thickness from the change of the dielectric number. They presented a water film thickness of beyond 10 μm. In another approach, fluorescence spectroscopy was used in the laboratory to detect a potential water film between a ski base and ice (Strausky et al., 1998): Within the measurement resolution of 50 nm, no water film was found at a temperature of −2°C and speeds between 0.005 and 0.1 m/s; nevertheless, the measured friction coefficients were as low as 0.03. Recent experiments did not show any trace of water (Lever et al., 2019): In these experiments, initial snow surface temperatures were between −10.3 and −5.2°C, and the applied pressure was between 0.81 and 3.56 kPa, which is slightly lower than the average pressure below a cross-country (XC) ski and considerably lower than the pressure peaks (Schindelwig et al., 2014); in addition, sample size and type were not specific to skiing.
In the light of the ambiguous state of knowledge and the inconclusive and conflicting results of the few reported experiments, the goal of this study was to conduct an experiment under realistic skiing conditions to find indications for the existence of a water film under a ski. To achieve this goal, we used an infrared (IR) camera to measure the snow surface temperature and calculated the maximum contact spot temperatures. Temperature measurements with thermocouples on a ski base during skiing (Warren et al., 1989; Colbeck, 1994a) and infrared snow surface measurements below a gliding XC ski (Schindelwig et al., 2014) have already been conducted before. However, attempts to draw conclusions about water film formation have not yet been made.
Materials and Methods
Friction Testing
The experiments were carried out in the snow lab of the Research Center Snow, Ski, and Alpine Sport at the University of Innsbruck (Austria) on a linear snow tribometer (Figure 1) with a sliding surface of 24 m length (Hasler et al., 2016).
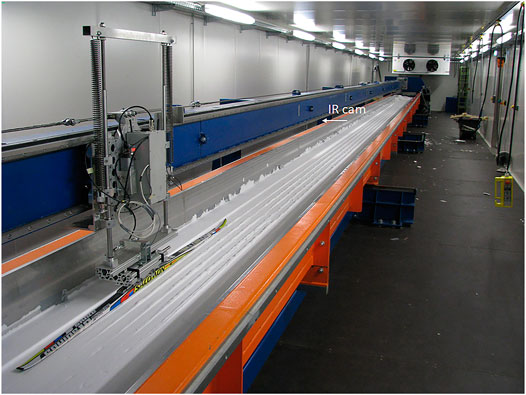
FIGURE 1. Snow Tribometer with position of IR cam. The camera is mounted below the horizontal beam and is tilted by 15° from the vertical.
As samples we used an XC ski (Fischer RCS skating cold, 186 cm, Fischer Sports GmbH, Austria) and a flat ski with the dimensions given in Figure 2.
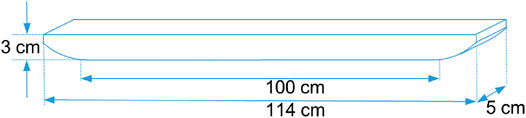
FIGURE 2. Dimensions of the flat ski.
The skis were first accelerated and then moved over the snow surface at constant speed. In this constant speed section, the friction force was measured. Afterwards, the skis were moved back to the starting position. Each measurement series consisted of five consecutive measurement runs on the same track. The first run started on fresh snow. To calculate the friction coefficient we computed the average of the runs 3 to 5. Table 1 gives an overview of the samples and test conditions.
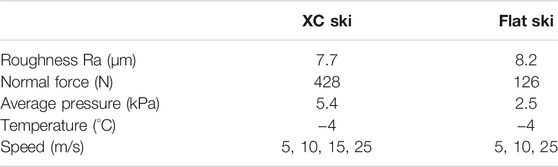
TABLE 1. Test samples and test conditions.
The bases of the XC ski and the flat ski were equally stone-grinded. The measured line roughness was about 8 μm. The normal force on the XC ski was 428 N, which is half the weight of an average male athlete. Half weight since in bipedal gliding each ski supports half of the skiers weight. Applying the same load to the flat ski caused deep snow tracks, which impaired the infrared measurements. Hence, the normal force was reduced to 126 N.
Infrared Measurements
An IR camera with a resolution of 384 × 288 pixel (TE-EQ1, Thermal Experts, Korea) was mounted 50 cm above the constant speed section of the sliding track (see Figure 1), where the friction was measured. The camera was tilted by 15° from the vertical. We chose a frame rate of f = 30 Hz and set the emissivity of the snow surface to 0.95. The general error of infrared microbolometer measurements is below 2°C or 2%; it includes errors of emissivity, reflected ambient temperature, transmittance, atmosphere temperature, camera response, and calibrator temperature accuracy. The detector sensitivity was 50 mK. To reduce the error, we simultaneously used a PT1000 sensor (Nexensos W-EYK, Heraeus Holding GmbH, Germany) and an 18 bit data logger (Datataker DT80, ThermoFisher Scientific, United States) to measure the temperature of the snow surface on a position that is also visible in the infrared images. The difference between this exact local temperature and the corresponding spot temperature in the infrared image was detracted from all pixels; thereby, we could reduce the infrared error. The IR camera features a time constant of 10 ms. This means that the camera reaction is slower than the camera acquisition interval, and therefore fast temperature changes from image to image are underestimated. As a rule of thumb, it takes about five time constants for the temperature to reach a steady state. After the camera acquisition interval, which takes about three time constants–the camera readout is at less than 90% of the real temperature change. At the same time, heat flows from the contacting spots into the snow. In the IR recording, a sliding track surface of approximately 0.015 m width and 0.15 m length (XC ski) and 0.03 m width and 0.15 m length (flat ski) was selected, which is equivalent to 288 × 36 pixels (XC ski) and 288 × 72 pixels (flat ski). This resulted in a snow area per pixel of approximately 0.5 × 0.4 mm. As the temperature of the single pixels showed high noise, we chose the following method:
The temperature images of the selections were arranged in matrices
Thot10(t) was calculated by choosing the indices i, j of the 10 pixels with the highest mean temperature over the 4 s of measurement and averaging these pixels in each picture. Thot10(t) describes the time course of the maximum temperature behind the ski during the 4-s interval. Taking the XC ski at 10 m/s as an example, temperature in the first 4 s decreased exponentially—from an initial maximum temperature of −1.5 to −3.4°C. From Thot10(t), the maximum temperature Tmax was determined and used to discuss maximum surface temperatures as well as to calculate contact spot temperatures and relative contact areas.
Calculation of the Contact Spot Temperature
In a sliding ski, only a small part of the ski base is in direct contact with snow grains (Colbeck, 1994b; Bäurle et al., 2007; Theile et al., 2009). (Theile et al., 2009), for example, reported an average contact spot size of only 0.11 mm. In our experiment, the snow surface area corresponding to one pixel was ∼0.5 × 0.4 mm and hence not small enough to resolve the contact spots. Assuming that only a fraction of the snow surface is in contact with the ski and heats up to contact spot temperature
In this formula,
Assuming that the contact spot temperature
Results
Friction
In our experiment, friction increased with increasing speed. As depicted in Figure 3, there were differences between the two ski types: Whilst below speeds of 15 m/s the friction of the XC ski was slightly lower than the friction of the flat ski, it was clearly higher at 25 m/s. However, it is important to address that the normal force was higher on the XC ski than on the flat ski: Thus, although friction coefficients are similar, friction power—given as the product of speed and friction force—of the XC ski was three times higher.
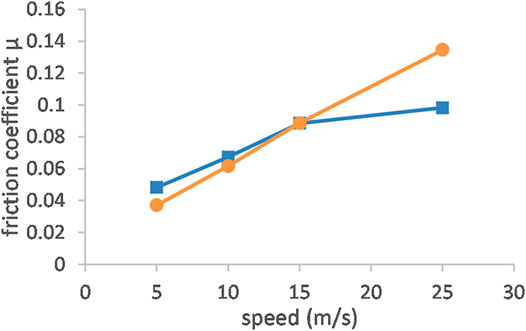
FIGURE 3. Friction coefficient µ vs. speed of the XC ski (orange circles) and the flat ski (blue squares).
Maximum Temperatures
Figure 4 shows the maximum average temperature values of the ten hottest pixels for the XC ski and the flat ski at speeds of 5, 10, 15, and 25 m/s for the first and the last of five runs. Maximum temperatures were between approximately −0.1°C (XC ski, 25 m/s, last run) and −3.5°C (flat ski, 5 m/s, first run). In the first run, the snow temperatures behind the flat ski increased more slowly with increasing speed than behind the XC ski. In the last run, experiments with both the XC ski and the flat ski showed about the same temperature rise with increasing speed. Moreover, temperature rise was connected to maximum temperature: The closer the maximum temperature approached 0°C the lower was the temperature rise with increasing ski speed. IR camera failed recording the flat ski at 15 m/s.
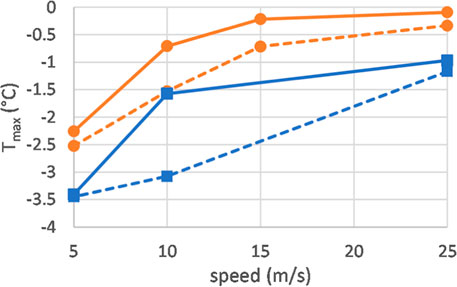
FIGURE 4. Tmax of the flat ski (blue squares) and the XC ski (orange circles) vs. speed in the first run (dashed lines) and last run (solid lines) of five runs.
Contact Spot Temperatures
Assuming a relative contact area of 0.4% (Theile et al., 2009) between the ski base and snow grains, we calculated maximum contact spot temperatures (Eq. 3) of more than 800°C after five runs (Figure 5 left: 25 m/s, XC ski). With an intermediate assumed contact area of 10% (Pihkala and Spring 1986; Bäurle et al., 2007), temperatures were also clearly higher than 0°C in all cases (Figure 5, middle). Even assuming 50% (Colbeck, 1992), the calculated temperatures were only below 0°C at lower speeds, (Figure 5, right). Throughout all measurements, the contact spot temperatures were lower behind the flat ski than behind the XC ski. The increase of the calculated temperature from the first to the last run was low at 5 m/s, highest at 10 m/s, and decreased again towards higher speeds in calculations with all three assumed contact areas (0.4, 10, and 50%).
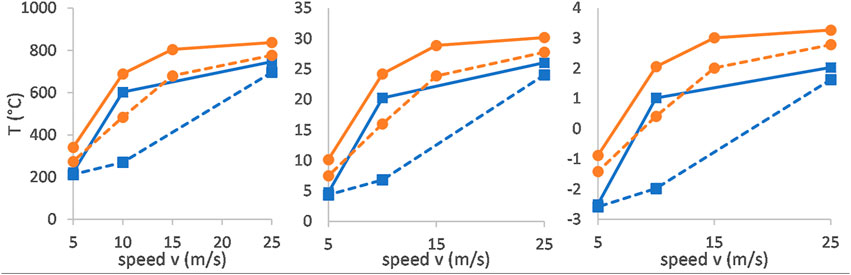
FIGURE 5. Contact spot temperatures of the flat ski (blue squares) and the XC ski (orange circles) vs. speed in the first run (dashed lines) and last run (solid lines) of five runs. Assumptive contact areas: 0.4% (left figure); 10% (middle figure); 50% (right figure).
Under the assumption that the contact spot temperature does not exceed 0°C, the calculated relative contact areas ranged between 21% (flat ski, 5 m/s) and 98% (XC ski, 25 m/s) (Figure 6).
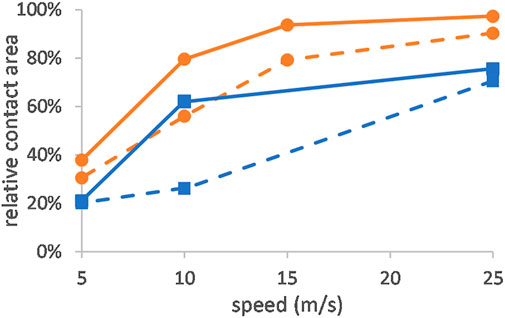
FIGURE 6. Relative contact area behind the XC ski (orange circles) and the flat ski (blue squares) after run 1 (dashed lines) and run 5 (full lines) at speeds of 5, 10, 15, and 25 m/s under the assumption that the contact spot temperature does not exceed 0°C.
Discussion
Maximum Temperatures
In our experiments, the maximum temperature behind a sliding ski increased with increasing speed of the ski. The gradient of the maximum temperature decreased as the speed increased and the temperature approached 0°C. This behaviour was more accentuated in the last than in the first of five runs. With increasing speed, frictional heat increased. This is relevant as one can calculate frictional power as the product of speed and friction force. In our study, speed varied by a factor of 5 (between 5 and 25 m/s); friction increased by a factor of approximately 3. This implies that frictional power increased strongly—namely by a factor of approximately 15—when increasing speed from 5 to 25 m/s.
In experiments with an XC ski sliding at 5 m/s, the difference between uncontacted snow surface and maximum temperature was 1.75°C; it increased to 3.9°C at 25 m/s. We can compare the heat flows due to these temperature differences using Fourier’s law. It states that the rate of heat transfer through a material is proportional to the negative gradient of the temperature. We approximated the gradient of the temperature with the temperature difference between snow bulk and snow surface. Hence, the heat flow into the snow increased by factor 2.2 when rising the ski speed from 5 to 25 m/s. This increase by a factor of 2.2 is in contrast to the strong increase of the frictional power by a factor of 15. Consequently, additional mechanisms must be involved in dissipating frictional energy. The most likely option is that energy is used for snow melting. A second explanation may be provided by deformations of the snow bulk or ice grains. However, a detailed analysis of the energy consumption paths is not possible as we are lacking in more profound knowledge of the tribosystem in terms of geometry and material properties.
Contact Spot Temperature
The calculated contact spot temperature varied strongly with the assumed relative contact area. Using relative contact area values from literature (0.4–50%), we calculated spot temperatures prevalently well above 0°C, in some cases as high as 200°C or 800°C. Postulating that the contact spot temperature does not exceed 0°C, we computed relative contact areas between 21 and 98%. We can observe a clear increase of the contact area with speed. This finding is in agreement with Fouvry et al. (2003) and Ramalho and Miranda (2006), who stated that wear volume is proportional to the dissipated energy. In our experiment, the sliding distance (equivalent to the ski length) was constant at all speeds whereas friction force increased threefold when raising speed from 5 to 25 m/s. Depending on the wear mechanism, increasing dissipated energy increases wear volume leading to larger contact spots.
Dissipated energy and hence the contact area are strongly affected by contact pressure, speed, and duration of the contact. In XC skiing, the average pressure below a ski is 5 kPa and peak pressures are around 30 kPa in bipedal gliding (after Schindelwig et al., 2014). Whilst speed in XC skiing is on average about 5 m/s, in downhill parts it may easily reach 15 m/s. With values of 0.4% (Theile et al., 2009) and 7% (Bäurle et al., 2007), previous studies have certainly underestimated relative contact areas due to applying only normal loading of the contact without sliding. In dynamic lab measurements, low frictional power—either due to low speeds (Kuroiwa, 1977; Lever et al., 2019) or low contact force (Lever et al., 2019)—also led to small relative contact areas of below 4% at sliding distances comparable to skiing and to our experiment. Bäurle et al. (2007) used a pressure of around 30 kPa at a speed of 5 m/s and specified the contact area with 10–25%; however, the experiment was performed only after a run-in phase and thus with a nonrealistic sliding duration. Field measurements under presumably realistic conditions have also been conducted: Pihkala and Spring (1986) yielded relative contact areas between 5 and 15% using old and grainy snow, while Colbeck (1992) found a relative contact area of 50% after several passages. Unfortunately, both works did not provide exact specifications on how the sliding took place. We presume that the conditions in the study of (Pihkala and Spring 1986) were similar to those of (Colbeck, 1992) with speeds ranging from 5 to 10 m/s, which is common in XC downhill skiing. However (Pihkala and Spring 1986), indicated a much smaller relative contact areas than we did, which might be due to the fact that they used old coarse snow, which exhibits different wear properties. The relative contact area given by Colbeck (1992) fits with the values we found in measurements with XC skis at 5 m/s.
Although the values given by literature are mostly much lower, we believe that our contact area calculations might be correct since no measurements have yet been made under the specific conditions—i.e., high loads and speeds—occurring during skiing. Moreover, if our assumption that the surface temperature does not exceed 0°C is adequate, contact spot temperatures reach the 0°C level in all our XC measurements and in flat ski measurements at higher speeds. A surface temperature of 0°C makes the formation of frictional meltwater very likely.
The increase of the relative contact area with speed is not linear (Figure 6). It is high at lower speed and gets flatter with increasing speed. This is in contrast with classical wear theory that suggests that wear volume is proportional to the dissipated energy. Dissipated energy is independent of the speed. However, if we consider that frictional melting is one of the dominant mechanisms, we must study frictional power instead of energy. The faster the friction energy is applied, the more energy is available for melting since heat dissipation into ski and snow takes time. Hence, at lower speed, the contact area possibly increases with speed due to abrasion and frictional melting. Then, towards higher speeds, meltwater increases and a big share of the meltwater refreezes without substantially changing contact area. This mechanism also explains another striking result. Comparing the first and the fifth run of XC and flat ski (Figure 6), contact area barely rises at 5 m/s and at 25 m/s whereas there is a notable increase in between. Friction melting is low at 5 m/s. Therefore, only a small change of contact area shows up. At the higher speeds of 10 and 15 m/s, the effect increases. Towards high speed at 25 m/s, finally, a saturation effect may occur where most meltwater refreezes at a similar position without changing the contact area. This theory expands the effects found by Lever et al. (2019), where the relative surface area increase was extremely low with approximately 0.05% per meter sliding distance at low speed and low friction power. In our measurements at distinctly higher speed, maximum increase was 4.1% (flat ski) and 2.7% (XC ski) per meter sliding distance.
Friction
Literature data on the speed dependence of friction on snow provide different friction-speed courses (Kuroiwa, 1977). found a high increase in friction with increasing speed beyond 15 m/s at snow temperatures between -2.5°C and 0°C. According to (Nachbauer et al., 2016) and (Hasler et al., 2016), friction between XC skis and snow rises linearly with increasing speed at snow temperatures of −3°C and −5°C. In the present study, the friction-speed course of the XC ski was linear, whereas interestingly the one of the flat ski flattened out towards a speed of 25 m/s. The maximum snow temperatures measured for the flat and the XC ski (Figure 4) at all speeds differed by approximately 1°C. Whilst the snow temperature behind the flat ski hardly exceeded −1°C, the snow temperature behind the XC ski successively approached 0°C in speeds higher than 15 m/s. As stated in the previous section on contact temperature, frictional meltwater might have been present in all experiments with the XC ski and in experiments with the flat ski at higher speeds. Moreover, we hypothesize that, as XC ski speed increased towards 25 m/s, frictional meltwater became excessive leading to higher friction (Colbeck, 1994b). This might have not been the case in experiments with the flat ski due to the lower friction power compared to the XC ski.
Limitations
Our study has several limitations. Subdividing the snow surface into “warm” spots (where ski contact occurred) and “cold” spots (without ski contact) is a strong simplification, since it does not consider heat transport from the contact tips to the adjacent areas. Hence, using Eq. 3 leads to an underestimation of the contact spot temperature.
Contact spots might be larger than the area covered by one IR camera pixel (∼0.5 × 0.4 mm). This is in disagreement with literature (Colbeck, 1992), where contact spot sizes between 100 and 300 μm were found. In addition, due to the maximum grain diameter of our man-made snow of 300 μm, we expect considerably smaller contact spots.
Directly after transition from solid to fluid phase, water is 0°C. In our view, there are two potential reasons why temperature rises above 0°C. First, viscous dissipation within the meltwater layer might increase water temperature. A simple estimate for two parallel plates at 0°C in relative motion at 10 m/s and separated by a 100 nm water film led to a temperature increase of only 0.04°C (Bäurle et al., 2007). Second, the water film might be heated by the ski base. However, in field tests with XC skis under similar conditions to ours, thermocouple measurements at the ski base surface yielded temperatures that were clearly below the melting point (Colbeck, 1992). At the tips of the ski base, temperatures might be warmer, which might lead to locally higher meltwater film temperatures. Nevertheless, we think that our calculation delivers contact area data that might help to improve the overall view of what is plausible and what is not.
Conclusion
Under realistic skiing conditions at a snow surface temperature of −4°C, infrared measurements revealed several arguments for the existence of frictional meltwater. First of all, infrared camera measurements of the snow surface behind sliding skis yielded maximum temperatures close to 0°C. Considering that not the entire snow surface is in contact with the ski, this is a strong indication for snow melting.
Heat flow considerations led to the conclusion that there must be energy dissipation beyond the heat flow into ski and snow. The most obvious mechanism for the additional energy dissipation is snow melting.
Presuming that contact spot temperatures do at most slightly exceed 0°C, we calculated relative contact areas of 21–98%. Values presented by literature are much lower; mostly, because previous studies have not been conducted under realistic skiing conditions.
Data Availability Statement
The raw data supporting the conclusions of this article will be made available by the authors, without undue reservation.
Author Contributions
MH designed the study and methodology, WJ and MH conducted the data collection, MH and WJ analyzed the data, MH wrote a first draft of the manuscript, WN and MH revised the draft and approved the final version of the manuscript.
Funding
The study was carried out within the project “Tribology of skiing” funded by the University of Innsbruck, the Research Center Snow, Ski, and Alpine Sport (Innsbruck) and the Austrian Ski Federation.
Conflict of Interest
The authors declare that the research was conducted in the absence of any commercial or financial relationships that could be construed as a potential conflict of interest.
Publisher’s Note
All claims expressed in this article are solely those of the authors and do not necessarily represent those of their affiliated organizations, or those of the publisher, the editors and the reviewers. Any product that may be evaluated in this article, or claim that may be made by its manufacturer, is not guaranteed or endorsed by the publisher.
References
Ambach, W., and Mayr, B. (1981). Ski Gliding and Water Film. Cold Reg. Sci. Techn. 5, 59–65. doi:10.1016/0165-232x(81)90040-9
Bäurle, L., Kaempfer, T. U., Szabó, D., and Spencer, N. D. (2007). Sliding Friction of Polyethylene on Snow and Ice: Contact Area and Modeling. Cold Reg. Sci. Techn. 47, 276–289. doi:10.1016/j.coldregions.2006.10.005
Bowden, F. P., and Hughes, T. P. (1939). The Mechanism of Sliding on Ice and Snow. Proc. R. Soc. Lond. A. 172, 280–298. doi:10.1098/rspa.1939.0104
Colbeck, S. C. (1994b). A Review of the Friction of Snow Skis. J. Sports Sci. 12, 285–295. doi:10.1080/02640419408732174
Colbeck, S. C. (1992). A Review of the Processes that Control Snow Friction. Hanover, NH: US Army Cold Regions Research and Engineering Laboratory. Monograph 92-2.
Colbeck, S. C. (1994a). Bottom Temperatures of Skating Skis on Snow. Med. Sci. Sports Exerc. 26, 258–262. doi:10.1249/00005768-199402000-00019
Fouvry, S., Liskiewicz, T., Kapsa, P., Hannel, S., and Sauger, E. (2003). An Energy Description of Wear Mechanisms and Its Applications to Oscillating Sliding Contacts. Wear 255, 287–298. doi:10.1016/S0043-1648(03)00117-0
Hasler, M., Schindelwig, K., Mayr, B., Knoflach, C., Rohm, S., Putten, J. V., et al. (2016). A Novel Ski–Snow Tribometer and its Precision. Tribol. Lett. 63, 1–9. doi:10.1007/s11249-016-0719-2
Kuroiwa, D. (1977). The Kinetic Friction on Snow and Ice. J. Glaciol. 19, 141–152. doi:10.3189/s0022143000029233
Lever, J. H., Taylor, S., Hoch, G. R., and Daghlian, C. (2019). Evidence that Abrasion Can Govern Snow Kinetic Friction. J. Glaciol. 65, 68–84. doi:10.1017/jog.2018.97
Nachbauer, W., Kaps, P., Hasler, M., and Mossner, M. (2016). “Friction Between Ski and Snow,” in The Engineering Approach to Winter Sports. New York, NY: SpringerVerlag. doi:10.1007/978-1-4939-3020-3_2
Pihkala, P., and Spring, E. (1986). Determination of the Contact Area between Ski and Snow Using a Simple thermal Conductivity Meter. Helsinki: University of Helsinki, Department of Geophysics.
Ramalho, A., and Miranda, J. C. (2006). The Relationship Between Wear and Dissipated Energy in Sliding Systems. Wear 260, 361–367. doi:10.1016/j.wear.2005.02.121
Schindelwig, K., Hasler, M., Van Putten, J., Rohm, S., and Nachbauer, W. (2014). Temperature Below a Gliding Cross Country Ski. Proced. Eng. 72, 380–385. doi:10.1016/j.proeng.2014.06.065
Strausky, H., Krenn, J. R., Leitner, A., and Aussenegg, F. R. (1998). Sliding Plastics on Ice: Fluorescence Spectroscopic Studies on Interfacial Water Layers in the μm Thickness Regime. Appl. Phys. B 66, 599–602. doi:10.1007/s003400050442
Theile, T., Szabo, D., Luthi, A., Rhyner, H., and Schneebeli, M. (2009). Mechanics of the Ski-Snow Contact. Tribol. Lett. 36, 223–231. doi:10.1007/s11249-009-9476-9
Thomson, J. (1849). XXXVII.-Theoretical Considerations on the Effect of Pressure in Lowering the Freezing Point of Water. Trans. R. Soc. Edinb. 16, 575–580. doi:10.1017/s0080456800022493
Warren, G. C., Colbeck, S. C., and Kennedy, F. E. (1989). Thermal Response of Downhill Skis. US Army Cold Regions Research and Engineering Laboratory Report, 89–23.
Keywords: sliding ski, friction, snow temperature, meltwater, water film
Citation: Hasler M, Jud W and Nachbauer W (2021) Snow Temperature Behind Sliding Skis as an Indicator for Frictional Meltwater. Front. Mech. Eng 7:738266. doi: 10.3389/fmech.2021.738266
Received: 08 July 2021; Accepted: 03 September 2021;
Published: 24 September 2021.
Edited by:
Noshir Sheriar Pesika, Tulane University, United StatesReviewed by:
Chenhui Zhang, Tsinghua University, ChinaHyun-Joon Kim, Kyungpook National University, South Korea
Copyright © 2021 Hasler M, Jud W and Nachbauer W. This is an open-access article distributed under the terms of the Creative Commons Attribution License (CC BY). The use, distribution or reproduction in other forums is permitted, provided the original author(s) and the copyright owner(s) are credited and that the original publication in this journal is cited, in accordance with accepted academic practice. No use, distribution or reproduction is permitted which does not comply with these terms.
*Correspondence: Hasler M, TWljaGFlbC5oYXNsZXJAdWliay5hYy5hdA==