 Philipp Rolke
 D. Broja1
- 1Department of Fuel Technology, TD-P2, IAV GmbH, Berlin, Germany
- 2Chair of Powertrain Technologies, Technische Universität Berlin, Berlin, Germany
To achieve future emission targets for internal combustion engines, the use of hydrogen gas generated by renewable energy sources (known as “green” hydrogen) instead of fossil fuels plays a key role in the development of new combustion-based engine concepts. For new hydrogen engine generations, there are different challenges concerning the injector layout and functionality. Especially when talking about direct hydrogen injection, the key challenge is to ensure a proper mixing between hydrogen and the combustion air—the mixing of gas with a gas is not trivial as shown in this article. In terms of injector functionality, it must be ensured that the requested amount of hydrogen gas needs to be provided in time and, on the other hand, accurately metered to provide an appropriate mixing formation quality inside the combustion chamber. This contribution discusses deep injector analysis techniques with pneumatic and optical approaches for an improved overall understanding of functionality and effects caused by operation with a gaseous fuel. A metering technique for gas flow characterization and, for test simplification, a comparison of hydrogen with helium and nitrogen as possible surrogate gases indicate that helium and nitrogen can act as a substitute for hydrogen in functional testing. Furthermore, this contribution focuses on the usability of helium instead of hydrogen for the determination of spray properties. This is shown by the comparison of spray propagation images that were observed with the Schlieren technique in a pressure vessel proving comparable spray properties. In a next step, the usage of spray-guiding devices to improve the global gas distribution during the injection period is discussed. Here, it turns out that the volume increase does obviously not depend on the nozzle design. Thus, the advantage of multi-hole guiding-devices is based on its flexible gas-jet orientation.
1 Introduction
By the start of 2019, the European Union (EU) defined new emission targets for the commercial vehicle (CV) market. With regard to model year 2019, the CO2 fleet emission must be reduced by −15% till 2025 and by −30% till 2030 (Korn, 2020). The CO2 reduction goals come along with a further reduction of unburned hydro-carbons (HCs), particulate number (PN), carbon monoxide (CO), and nitrogen oxides (NOx). Due to its excellent specific energy density (e.g., more than three times as much mass specific energy compared to other fossil fuels), hydrogen is a suitable energy carrier and represents an important alternative to the use of electric drives.
Hydrogen internal combustion engines are separated by both their injection and their ignition strategies. Hydrogen induction can be realized by port fuel injection (PFI) where a premixed hydrogen–air mixture is aspirated or by direct injection (DI) into the combustion chamber.
At this development stage, hydrogen PFI provides the best performance in terms of NOx raw emissions and engine operating stability. Typically, those engines are operated in a lean mode with a fuel–air ratio close to 0.5. In addition, exhaust gas recirculation is used to reduce the combustion temperature and thus to decrease NOx formation. However, due to its low volumetric energy density, the injection of hydrogen into the intake manifold replaces a significant part of air needed for the combustion. This will decrease the volumetric efficiency, which results in a loss of engine power. Another important point to be taken into account is the pre- or auto-ignition tendency of the hydrogen/air mixture in the manifold and during the suction stroke in the combustion chamber, which can lead to the risk of “back-fire” (Yip et al., 2019).
For this reason, low-pressure direct-injection (LPDI) strategies turned into focus. Here, the injection starts after inlet valve closing, which increases the charge density and avoids the possibility of back-fire resulting in an improved thermal efficiency. The demand of injection pressure depends on the end of injection timing and should be, as a rule of thumb, at least twice the combustion chamber pressure.
The advantages of LPDI are associated with a comparable short injection duration. However, a result of a short injection duration is a lack of homogeneity, that is, global mixture uniformity within the combustion chamber. This leads to a diffusive combustion, resulting in a lower thermal efficiency. At low and part load (low engine speed level and limited engine torque), a poor uniformity also causes the formation of hot and lean zones resulting in an increase of NOx formation, respectively, NOx emissions. In addition, the thermal efficiency will decrease if the injected gas remains close to the chamber walls caused by the increase of wall heat losses, which is induced by the short H2 flame-quenching distance. Therefore, LPDI engine performance in total is still inferior to contemporary diesel CI engines (Yip et al., 2019; Faizal et al., 2019).
For the use of hydrogen, the injector and nozzle design should cover the following requirements:
• Demand of a high mass flow rate in order to provide the desired fuel amount at the rated power.
• Fast opening/closing to ensure an accurate H2 metering even for small amounts.
• High shot–shot stability for stable combustion.
• Avoidance of needle bouncing.
• No gas leakage through the injector nozzle when the needle is closed.
• Jet orientation and jet velocity need to be optimized in order to ensure best separation of the hydrogen jets from the chamber walls.
• Fuel-rich region near the spark plug to ensure reliable and fast flame initialization.
• Number of combustion kernels are limited by using a single spark plug, leading to a slower early-stage combustion (Yip et al., 2019). Therefore, hydrogen jets from a multi-hole injector should form a connected volume to increase the combustion speed.
The development of nozzle designs needs an appropriate testing equipment to prove and to improve concepts. The challenging part for hydrogen injector characterization is caused, in particular, by high inflammation or explosion risks. Using hydrogen involves huge efforts to build up completely new test bench environments in order to lower the explosion risks to a minimum. Thus, the usage of hydrogen surrogate gases would help to keep modifications on existing test benches on a low cost level and enables a safer test bench operation, without losing any information about performance and functionality of the entire injection system.
1.1 Functional Characterization of Injectors
To get an entire overview about the injector performance, functional tests as well as optical spray analysis are the common way to assess their properties. In the best case, this will be done by using the target fuel. By using hydrogen as an injection gas, a basic understanding of the real gas-dynamic effects in the injector can be established. To go one step further, it is essential to draw conclusions and correlations with surrogate gases, such as nitrogen or helium.
As mentioned before, for test simplification, the target was to carry out a functional analysis of injectors with substitute gases to generate a better understanding for these gases. In a next step, the task was to convert the results, for example, into an injection rate that is—in an ideal case—identical to real hydrogen.
Cumulative measurement of injectors at a constant operating point is state of the art. The result will be an average mass value over a specific measurement period. By using measurement equipment like Coriolis metering systems, it is also possible to measure the mass flow rate of an injector for both nitrogen and helium without major modifications to an existing test facility.
However, for a more precise observation and understanding of the injection and combustion processes, a more detailed injector analysis is required, revealing more information about the injector than just an average mass-flow. Especially with regard to direct injection, the dynamic detection of injected mass over time is required. For this, the IAV Cross Injection Analyzer is a suitable approach to generate such results. This is based on the fact that injecting into a tube offers the benefit of having the same counter pressure conditions for the following injection event as the previous event is moving through the tube in the form of a pressure wave without any further impact on the current event (Rolke et al., 2019).
Detailed information on the injector needle opening delay, the nozzle speed when opening and closing, the closing behavior at the end of injection, as well as the reproducibility of the injection events give extra value to the injection and combustion process development. This kind of conclusion can be drawn out of the injection rate measurement. The challenges here are the compressibility of the gas and the gas dynamic effects, which vary depending on the type of gas, nozzle type, direction of gas outflow from the nozzle, pressure range, and temperature.
2 Materials and Equipment
2.1 Equipment for Flow Rate Estimation
At IAV, the tests were carried out on a H2 component test rig which has all the necessary safety precautions for testing with hydrogen (Figure 1). The supply pressure of the injectors for the tests with hydrogen was initially limited to 3 MPa at the time of the series of measurements. Those functional tests with nitrogen and helium could be conducted at up to a pressure potential of 20 MPa. The IAV Cross was used as the injection rate meter, and a Coriolis meter mounted on the supply side served as the reference meter.
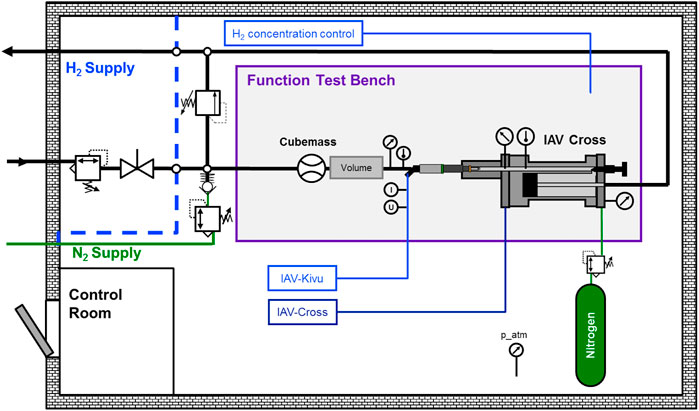
FIGURE 1. Schematic setup H2 component test rig at IAV.
The IAV Cross measurement system is equipped with a dedicated pressure sensor to meter the pressure increase in the tube, a temperature sensor, and a backpressure sensor (refer to Table 1). The injectors used were controlled via a laboratory control unit IAV Kivu, and the current and voltage signals were recorded synchronously with the injection rate. A pressurized gas cylinder containing N2 was used to generate the backpressure in the IAV Cross.
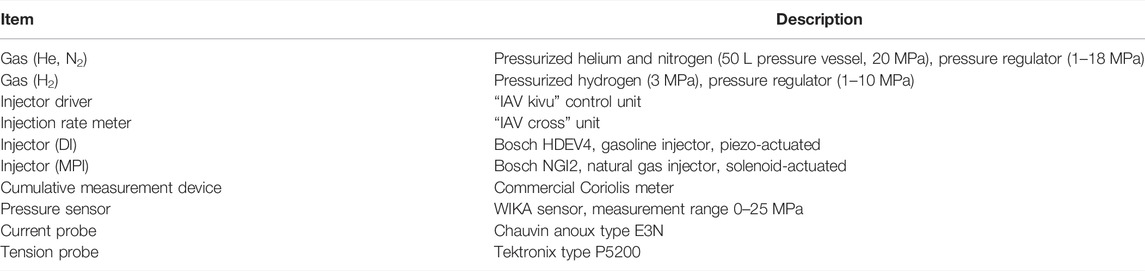
TABLE 1. Equipment for the pneumatic functional testing of injectors.
On the test bench side, the H2 concentration in the chamber has been monitored. In the event of active intervention in the system, for example, during an injector change, the system was purged with nitrogen gas before.
2.2 Visualization Equipment
Details of the used visualization equipment are presented in Table 2. Spray visualization was accomplished on a high pressure spray vessel at an ambient temperature. The vessel is equipped with maximum three perpendicular orientated windows. Each window has a free diameter of 80 mm. The injector was mounted horizontally and connected by a pressure regulator to the pressurized gas. For the realization of the Schlieren technique, a high power light-emitting diode (LED) was used to illuminate the spray area. The diverging emitted light was covered by a slit diaphragm with 1.5 mm gap and guided to parabolic mirrors. In the focal plane of the second mirror, a knife edge was placed to adjust the sensitivity of the Schlieren setup. The spray area was imaged onto the sensor of the high-speed camera by using a 300 mm lens. Synchronization of the injection event and start of image recording was realized with a commercial software and hardware from LaVision. To control the injector, a commercial controller unit IAV Kivu was used. The operating pressure was adjusted by a pressure regulator and measured by an automotive 20 MPa production sensor.
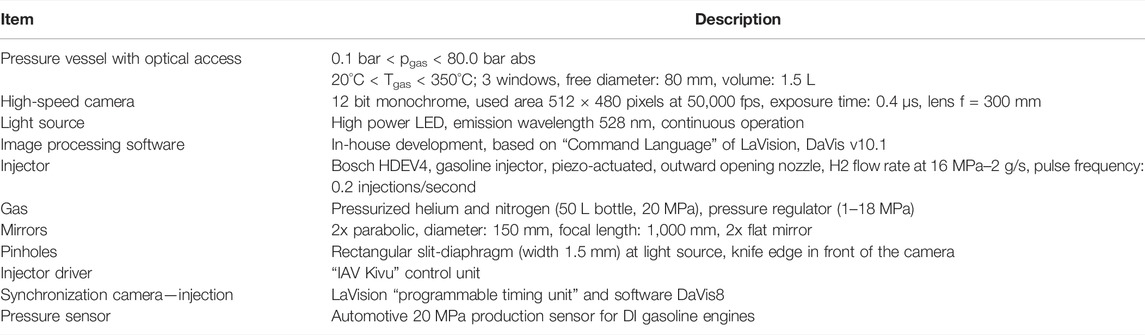
TABLE 2. Equipment for spray visualization and image postprocessing.
3 Methods
3.1 Pneumatic Testing Methodology
To explain the methodology more in detail, the objectives are mentioned at first followed by the approach for the measurement procedure. The objectives of the investigations were:
• To prove the correct operation of the existing measurement device IAV Cross for gas application, hydrogen and the surrogate gases after adaptive optimizations were made on the basic device.
• To understand the interaction between the measurement device, the gas type, and the physical gas dynamics by means of a measurement campaign with two different injectors and three above-mentioned different gases.
• To demonstrate the comparability of hydrogen to helium and nitrogen with the aim to show that pneumatic function tests of H2 injectors do not necessarily have to be carried out with hydrogen.
To conduct the injector measurements with hydrogen, the setup that has already been designed for applications with nitrogen was taken as a basis. Specific adaptations were made, on the one hand, to meet the increased tightness requirements and the associated safety aspects. On the other hand, to contribute to the special properties (including the speed of sound, volatility) of helium and hydrogen, special H2 durable sensors have been installed to ensure reliable operation. Cumulative measurement technology, based on the Coriolis measurement principle, was used as the reference measurement device recording the mass flow rate. To reduce pressure pulsations, a buffer volume was placed between the injector and the Coriolis meter.
The IAV Cross was used for the dynamic detection of the injected gas mass (Figure 2). The IAV Cross works pressure based and detects the pressure increase in a tube caused by the injection. The transient tube-pressure signal, measured with a resolution of 200 kHz, can directly be converted into the injection rate, in real time. Time integration of the injection rate corresponds to the injection mass, which is a real-time output, too.
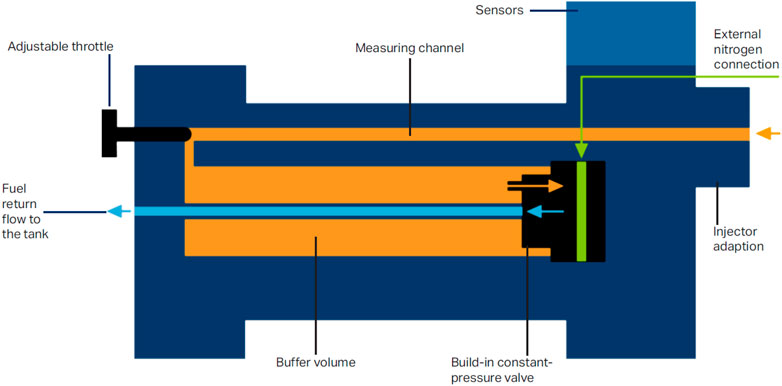
FIGURE 2. Schematic measurement principle of IAV cross.
The IAV Cross allows a shot-to-shot analysis of the injection events and offers details about the injector performance, as mentioned before. Statistics related to the stability of the injection process of an injector can be evaluated this way. A stable shot/shot injector performance and small injector/injector deviation will result in a smoothly running engine, lower fuel consumption, and lower raw emissions. In addition, exact conclusions can be drawn about the injected gas quantity and the injector timing, which are an important knowledge for the engine application.
Finally, the IAV Cross was also adapted in terms of the internal pipe diameter and pipe length to test the gas injectors with a focus on the supercritical range. The critical state is reached as soon as the flow velocity reaches the speed of sound of the gas in use (Eq. 1)
This condition is always reached at the narrowest cross-section of the injector (orifice/nozzle holes) and leads to the choking effect of the gas flow. The critical state M = 1 can be defined by the critical pressure ratio, Πcrit, of the individual gas by using Eqs. 2 and 3.
In the automotive industry, the pressure ratio is often defined in a simplified way as the ratio of the backpressure and injection pressure (Eq. 4). A correct definition would be the local pressure ratio (Eq. 5) that occurs directly at the narrowest cross-section (Yip et al., 2019)
For engine operation, the injector application is typically taking place in the supercritical state (Π < Πcrit) to utilize the maximum flow of an injector and to become independent from counter pressure changes at the injector nozzle. When looking at MPI injectors, an injection pressure of approx. 1 MPa is usually used to inject the gas mass into the charged intake port (charging pressure conditions about approx. 200–300 kPa). This also applies in the case of direct-injection injectors, which are operated at an injection pressure of 2–5 MPa versus a backpressure in the combustion chamber of 0.2–1 MPa. In both cases, a supercritical condition exists for the injection process.
This results in the fact that M = 1 always occurs in the direct nozzle area at the narrowest cross-section. In order to analyze the function of injectors with regard to the injection rate, this has to be taken into account. The applied IAV Cross measurement principle was initially adapted to incompressible media but can also be transferred to compressible media.
The functional principle is as follows and described in Eq. 6:
The pneumatic unit consists of a coiled tube of a certain length, into which injection takes place. The entire tube is filled with the same gas like that which is used for injection. The injector is finally supplied with a certain injection pressure. The gas volume in the pipe loop can be compressed by means of a backpressure to create combustion chamber-like boundary conditions during a compression stroke. The backpressure is introduced into the system by means of a nitrogen supply and set to the desired value. Constant pressure regulation between the backpressure side (nitrogen) and the injection side (test gas) is realized via a constant-pressure valve that separates the two gases
Close to the injector, a high-resolution pressure sensor detects the pressure increase resulting from the injection into the tube. The time-resolved pressure signal corresponds to the qualitative injection rate. For the conversion to a quantitatively correct injection rate, the sound velocity of the respective test gas is required. Because the speed of sound is dependent on pressure and temperature, the temperature conditions are measured close to the injector nozzle. For the analysis of the current counter pressure conditions, the important parameter for a correct sound velocity calculation, another pressure sensor is installed in the pipe. To calculate the injected mass, the pressure signal is multiplied by the ratio of the pipe cross-section and the sound velocity.
Using the IAV Cross for gas applications, it is essential to understand the gas dynamic effects caused by the interaction of the injector with the device. Depending on the type of nozzle, different flow velocities and turbulence levels occur in the tube, which must be considered for the design and setup of the device. Figure 3 schematically illustrates the outflow of the gas from the nozzle hole, showing the restriction in the throttling region to M = 1 and the subsequent expansion followed by jet contraction and shock effects (Rist, 1996; Yip et al., 2019). This phenomenon can also be visualized by optical measurement techniques, as shown by an example based on the Schlieren method.
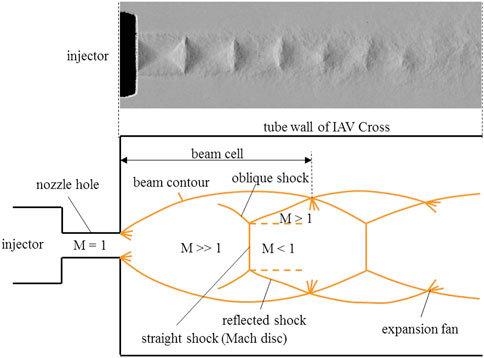
FIGURE 3. Schematic supersonic gas outflow from injector (analogue 5) and measured shock formation by the Schlieren method (performed by the authors).
In general, however, any gas can be assumed to be an approximately incompressible media if its Mach number is M < 0.2. This can be explained by the fact that in the calculation of the total pressure, the dynamic component (pdyn) is significantly smaller than the static pressure proportion (ps) (Richter, 2010). Figure 4 illustrates the interaction of the Mach number, dynamic, and static pressure. A Mach number of M = 0.14 represents a dynamic pressure of pdyn = 1.4% of the total pressure. The use of the IAV Cross is therefore justified if it can be ensured that the flow velocity is characterized by a Mach number of M < 0.2.
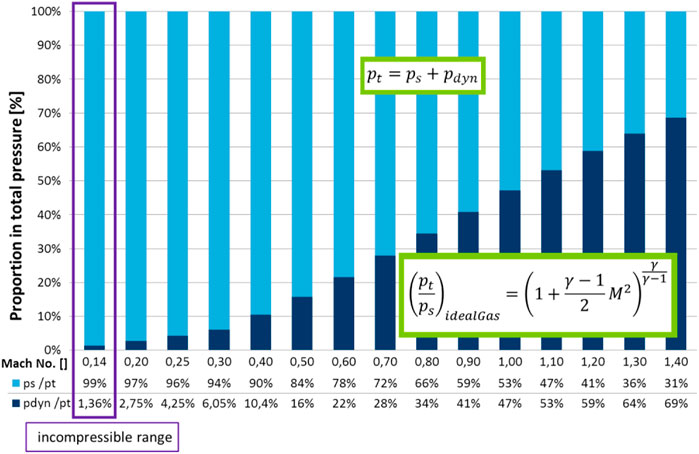
FIGURE 4. Proportions of the total pressure related to the Mach number.
In addition, the knowledge of the injector nozzle layout is of crucial importance for the correct use of the IAV Cross. An MPI injector usually produces an axial gas outflow, while a DI multi-hole or outwardly opening injector generally injects the gas in an angular direction for a better distribution of the gas in the combustion chamber. The jet direction influences the penetration of the gas and has a significant influence on the flow velocity of the gas after it exits the injector. For this purpose, CFD simulations were carried out in advance, in which flow velocities, penetration, and jet propagation in a tube were analyzed. Figure 5 shows a comparison of two different nozzles in the supercritical range (injection pressure p0 = 100 bar, Π = 0.1) as an example.
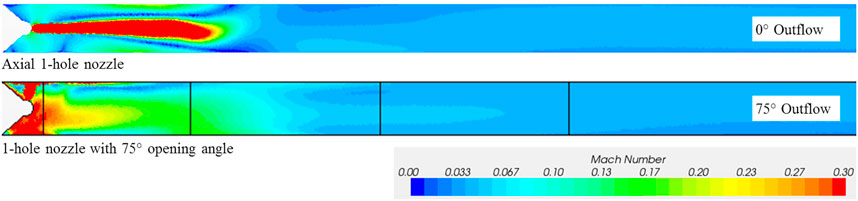
FIGURE 5. CFD simulation of the gas outflow from different nozzles.
It is visible that the conditions for both injector applications are very much different concerning the speed distribution in the tube. This has to be considered to accurately meter the pressure increase.
This simple 3D model was developed in StarCCM+ to analyze the impact of different nozzle designs on the velocity distribution in the tube.
3.2 Spray Visualization
To visualize the gas propagation during injection, the Schlieren technique was applied. The advantage of this methodology is based on its comparable simple setup combined with its high sensitivity to visualize the smallest density gradients in transparent media, as is the case for gases.
For air and other gases, the Gladstone–Dale law (Eq. 7) describes a linear correlation between the refraction index
The perfect gas-state (Eq. 8) shows in turn the correlation between gas density and thermodynamic state variables (Eq. 8), that is, medium temperature
A light ray in homogeneous transparent media propagates in a linear way. Propagation direction changes if the light beam hits an area with a different refraction index (Snellius’ law) with respect to different gas densities. The principle behind the Schlieren visualization is to block these irregular propagating light rays before reaching the camera sensor. Thus, spatial gradients of temperature, molar mass, pressure, and gas velocity can be visualized by making use of the Schlieren technique.
In this case, injection into a quiescent gas atmosphere (here: nitrogen gas) impacts the density distribution in multiple ways. For hydrogen or helium injection, the most important parameter is their different molar mass. In addition, local deviations of gas temperature due to the gas expansion and/or shock-wave formation as well as a pressure drop because of high flow velocities can be expected. It is important to note that with the used experimental setup, it is not possible to distinguish between the reasons for the Schlieren signal. However, assuming a volumetric 1:1 mixture between helium and nitrogen will result in a gas density change of about Δρ/ρ = (16 − 28)/28 = −43% (p, T = constant). Expanding helium from 16 to 0.1 MPa at an ambient temperature (293 K), it heats up by approximately 10 K due to its negative Joule–Thomson coefficient of about—0.6 K/MPa. This yields a change in density of Δρ/ρ = −3%, only. Further, assuming that the gas velocity within the mixture reaches a Mach number of 0.5, gas compressibility becomes important and yields a pressure (respective density) increase of about 20%. With the aforementioned estimations, it is likely that the main part of the Schlieren signal depends on the molar mass of the injected (helium or hydrogen) gas.
3.2.1 Schlieren Setup
To get a compact arrangement in order to save space, the used setup was realized as the “z-type” configuration by use of two concave (parabolic) mirrors and two flat mirrors (Figure 6). A rectangular pinhole is placed in front of the LED light source at the focal plane of parabolic mirror #1. Thus, the first parabolic mirror collimates the diverging light beam and guides it through the spray vessel. After leaving the vessel, the collimated light is focused again by the parabolic mirror #2 and guided by the flat mirror #2 toward the high-speed camera. At the focal plane, a so-called Schlieren pin-hole, realized as a knife edge, is placed. Light beams that are slightly refracted by passing the spray volume are blocked by the knife edge, and this way, they cannot reach the camera sensor (brown, dotted lines in Figure 6). The camera image shows a bright background for areas without density gradients and different gray levels for the inhomogeneous areas. Positioning the knife edge toward the optical axis enhances the image contrast. The knife edge position was adopted to the gas density inside the spray vessel in order to achieve similar contrast for all tests accomplished. The imaged gray levels of the gas spray can take values above or below the background intensity. Therefore, by adjusting the LED brightness, the background intensity was set to half to the maximum of the camera dynamic range.
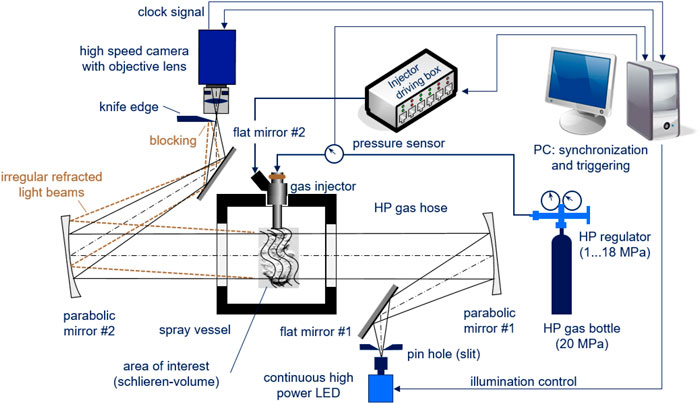
FIGURE 6. Sketch of the used z-type Schlieren technique—for further explanation, see the text.
High-speed camera and injector driver were triggered by the used imaging software. Injection events were imaged with an acquisition rate of 50,000 frames per second (fps). To synchronize the acquisition instance of the first image with the start of injector energizing the camera, clock signal was used to activate the trigger for both injector driver and high-speed camera. Doing so, a possible time jitter of
3.2.2 Penetration Model
Yip et al. (2019), [p. 21] report about a jet tip penetration
with
An interesting part is the penetration prediction for different gases and for changing operation and nozzle parameters:
• Gases with an equal heat capacity ratio show the same tip penetration. Consequently, helium jets would become 2.4% faster than hydrogen jets.
• Keeping the ratio of mass flow and ambient gas density constant causes no change in tip penetration.
A further aspect noted from Yip et al. (2019) covers the pressure condition upstream the nozzle exit. Here, the effective pressure is less than the fuel supply pressure
From the perspective of the spray penetration model, we can state that the influence of using helium gas instead of hydrogen changes the expected penetration in the one-digit percentage range. Testing results of the real behavior are presented in the next chapter.
3.2.3 Testing and Image Processing
The spray investigation is divided into two parts. The first part is dedicated to show differences and commonalities in spray formation by using hydrogen and helium gases. For this testing, the HDEV4 injector was used. The second part focuses on the usage of spray-guiding devices in order to improve the global gas distribution during the injection period. Table 3 shows the testing conditions.
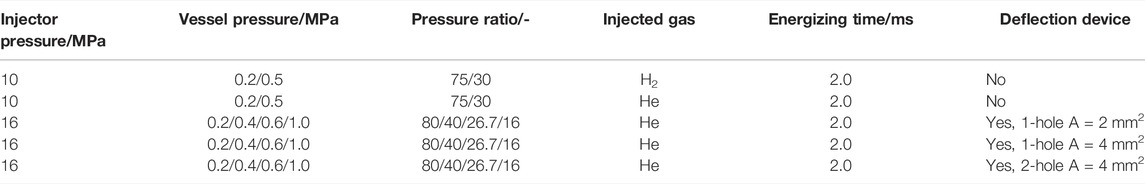
TABLE 3. Testing conditions for spray investigation.
For all conditions, the pressure ratio is supercritical, which means that the gas flow rate does not depend on the gas pressure inside the spray vessel. The vessel was operated with nitrogen gas and scavenged in order to ensure same gas conditions before the injection starts. All testing was performed at an ambient temperature of ∼22°C.
In order to get rid of the background noise like dust on the windows or nitrogen gas flowing, the images of a single injection are normalized to the first image before processing the spray parameters. The calculated spray parameters are based on spray contour detection (Figure 7).
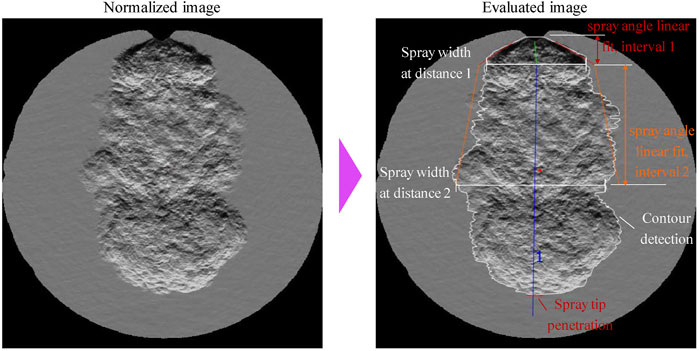
FIGURE 7. Postprocessing of spray images; see the text for details.
Contour coordinates are detected individually for the left- and the right-hand sides. From these coordinates, the spray width at two certain distances and the maximum distance from the nozzle tip (spray tip penetration) is estimated. Note that the penetration of the spray tip follows the center direction of the spray cloud (blue line). The spray angle for the left- and right-hand sides is linearly fitted to the contour data for both distances. Furthermore, the total spray area, center coordinates of the area (red dot), and spray volume are calculated. For the spray volume, a rotational symmetric spray cloud is assumed.
In light and heavy duty applications, hydrogen mass flows up to 10 g/s combined with a fuel pressure up to 5 MPa are in discussion. The usage of outward opening nozzles is the best way to perform these flow rates with minimum needle lift and fast opening and closing behavior. However, a drawback of those nozzle concepts is the fixed correlation between the injector axis and spray axis. Packaging reasons could require an inclination angle between both axes, for example, for side-mounted injectors. In addition, the spray distribution for these nozzles is typically narrow due to the strong spray contraction. Spray-guiding devices can help to adjust the spray direction—independent of the injector mounting position—and therefore to improve the spatial spray distribution and in further consequence to achieve a better homogenization.
Spray-guiding devices were developed with this goal in mind (Figure 8). The spherical design allows us to position different holes with different diameters on the surface. However, by choosing the total cross-sectional area too small, the cap pressure can increase until the pressure ratio between the fuel supply and cap volume reaches a subcritical condition. This would result in a loss in injection efficiency. For the applied test conditions, the gas flow through the cap holes is subsonic.
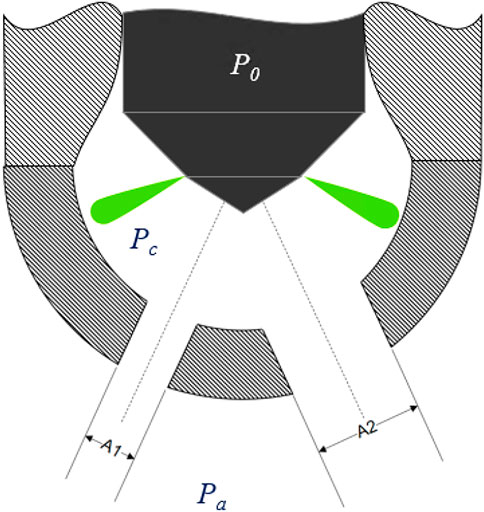
FIGURE 8. Sketch of a cap design mounted in front of the HDEV4 injector nozzle.
Spray investigations shown in the next section were accomplished with an injector of about 2 g/s hydrogen mass flow at a nominal pressure. Although this flow rate is far below the desired value of 10 g/s, results are scalable by using the penetration prediction model of Eq. 9.
4 Results
4.1 Pneumatic
At first, the two introduced injectors were investigated regarding their flow characteristics with H2. For this purpose, the injection and backpressure are set as constant parameters and the actuation time of the injector is dynamically changed during a measurement, as shown in the example with the HDEV4 injector in Figure 9. The injected mass shown in this diagram results from the integration of the injection rate signal measured by the IAV Cross. This results in a mass value for each injection event.
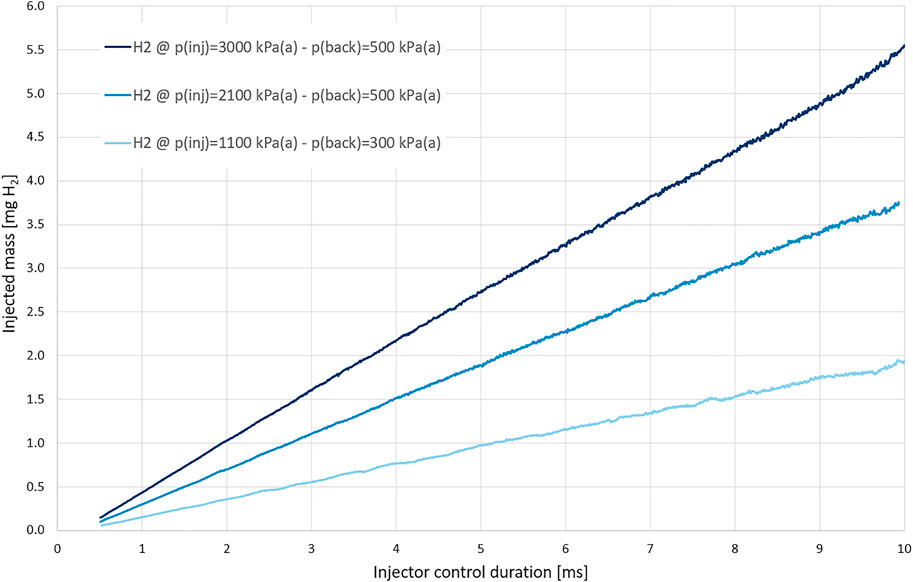
FIGURE 9. Flow rate map of the HDEV4 injector by using hydrogen.
The IAV Cross offers this possibility of dynamic measurements, as the subsequent injections do not affect each other. Figure 9 clearly shows that the piezo-actuated HDEV4 injector has a strongly defined linearity starting from the smallest quantities.
In this example, the pressure ratio Π has always been supercritical (Π < Πcrit) for the three flow characteristics shown. This illustrates that an increase in flow in the supercritical range is only possible by increasing the supply pressure.
The effect of flow limitation (blocking), which occurs when the critical pressure ratio Πcrit is reached and which applies to the entire supercritical range, was investigated in the form of backpressure variations. Figure 10 shows an example of the result of a measurement with the HDEV4 injector. This measurement was also performed dynamically with the IAV Cross as before, in this case keeping the supply pressure constant at 3,000 kPa (a) and varying the backpressure transiently. The dashed orthogonal line in the upper diagram marks the critical condition with H2. From this point on, flow increase is physically not possible (Rist, 1996).
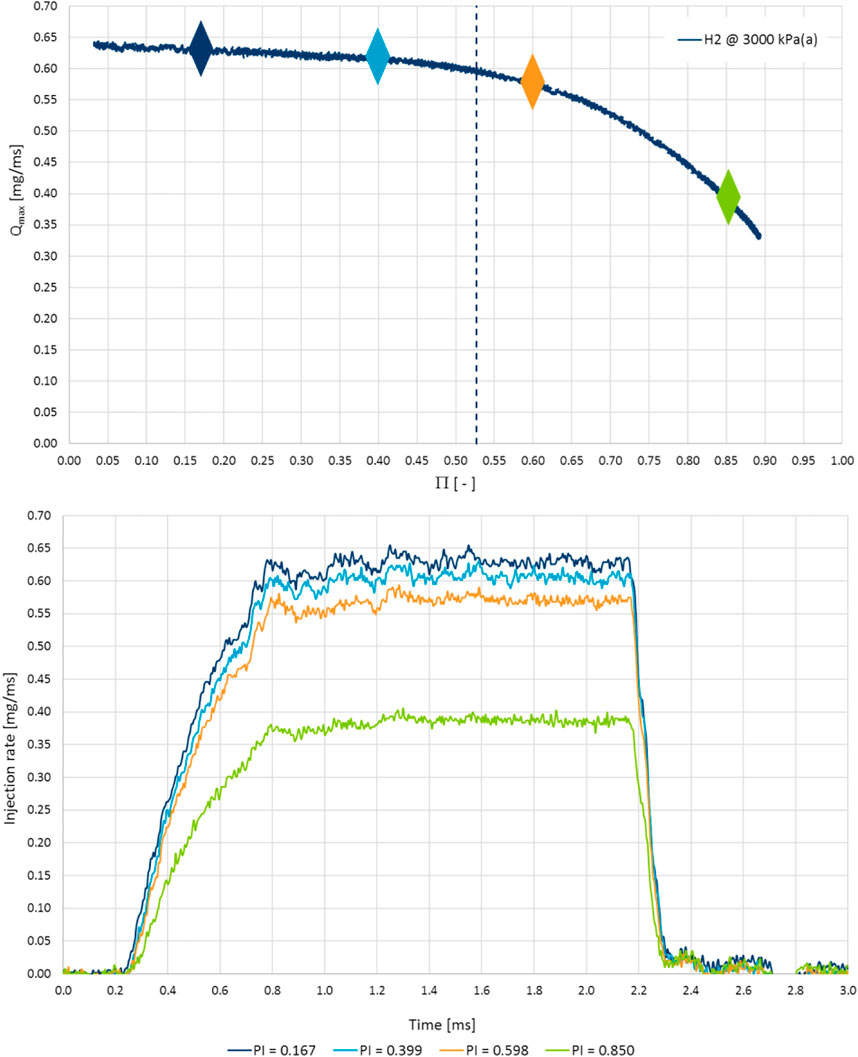
FIGURE 10. Flow characteristic and injection rates of the HDEV4 injector by variation of backpressure.
However, the measured Qmax characteristic curve does not show absolute blocking in the supercritical range but a slight increase. Here, Qmax represents that average value, which results from the steady-state injection rate area. For each injection, the injection rate signal between the time of 1.0 and 2.0 ms was therefore declared as the steady-state flow and the Qmax mean value was calculated from it.
The colored injection rates in the lower diagram correspond to the Qmax points in the upper diagram. The injection rates also show a slight increase in Qmax in the supercritical range. The explanation for this can be found in the dynamic pressure component of the total pressure Eq. 11, whose generally valid relationship with the Mach number is already shown in Figure 4. The supercritical pressure ratio of Π = 0.17 in combination with a slightly higher injection pressure of 3 MPa results in an increased dynamic pressure component for hydrogen. Even though the Mach number is the same, the outflow velocity of H2 is many times higher than that of N2, for instance
The mass flow increase from the critical pressure ratio Πcrit = 0.528 to the last measured Qmax value at Π = 0.03 is approx. 5%. This effect can also be reduced by further adaptive options on the measurement setup.
In order to compare the gases with each other using the measurement system and, at the end, to make an assessment of their comparability, backpressure variations were also carried out with nitrogen and helium in the same way as in Figure 10. This was also conducted for both injectors; the results for the HDEV4 injector are shown as an example in Figure 11.
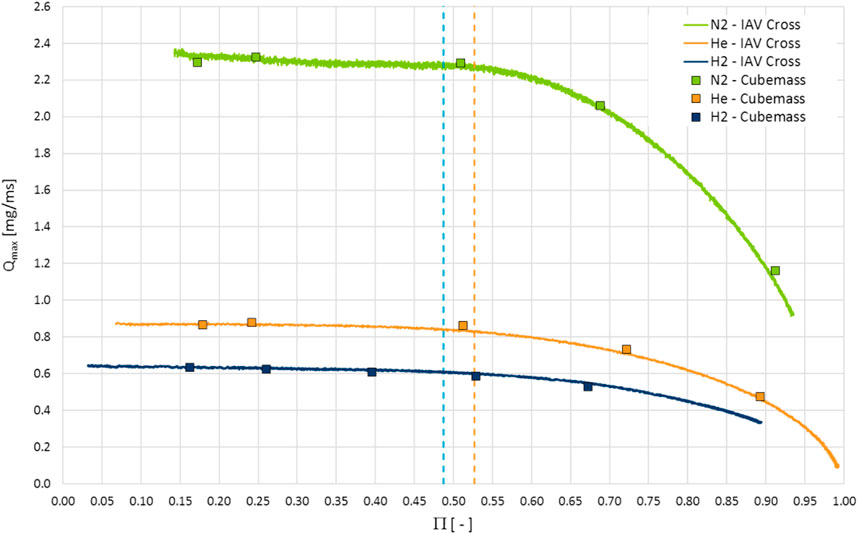
FIGURE 11. Comparison of HDEV4 flow results between IAV Cross and Coriolis meter (reference).
It should be noted that such a dynamic flow characteristic being measured with the IAV Cross cannot be metered with the help of a Coriolis meter since the Coriolis meter requires stationary operating conditions due to its cumulative measurement methodology. For this reason, in addition to the dynamically measured characteristic curves, stationary measurement points were defined. Injection time, injection pressure, and backpressure were kept constant. Each point represents mean values of 500 injections. In accordance with its capabilities, the Coriolis gauge outputs an average mass value for each operating point, the value of which is shown as a rectangular symbol in the diagram.
The comparison between IAV Cross and Coriolis meter illustrated on the diagram gives an overview over the good correlation of both metering systems for all three tested gases. This measurement accuracy justifies and proves the use of the IAV Cross and provides the basis for the further procedure with regard to a possible conversion of surrogate gas injection rates to a H2 injection rate.
In order to achieve the best possible conversion of the surrogate gases to H2, a 0D model was developed in advance, which combines all the properties of the different gases, the gas dynamic laws, specific injector data as input variables, properties of the IAV Cross device, and boundary conditions for the operating point (NIST, 2021; VDI e.V.: VDI-Wärmeatlas, 2013; Lucas, 2008). This model was used to simulate the flow characteristics for both injectors, which were compared with the measured values of the IAV Cross in the context of this investigation.
The upper diagram of Figure 12 shows a measured injection rate with H2 as well as converted injection rates of nitrogen and helium to a theoretical H2 injection rate. The actual measured injection rates with helium and nitrogen, recorded by using the IAV Cross, served as the basis for the conversion. These were then transferred as input to the 0D model and converted using this model.
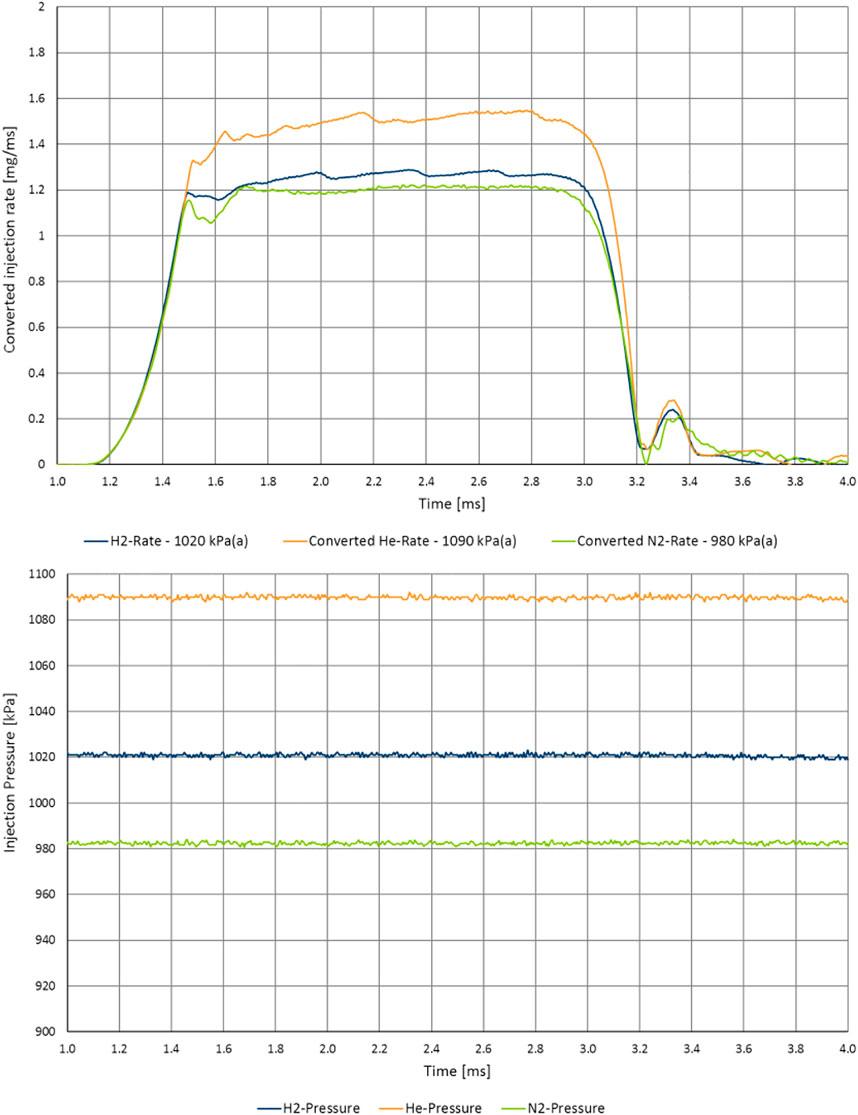
FIGURE 12. Converted injection rates of He and N2 to the expected H2 injection rate.
Figure 12 demonstrates the high comparability of all gases with respect to the opening traces and its gradients. The closing time and the subsequent post-bouncer are also characteristically comparable. Differences are found in the steady-state rate and the Qmax value. Here, the maximum value of the converted N2 rate is 1.2 mg/ms and that of the He rate is 1.5 mg/ms. In relation to the real measured Qmax value with H2 of 1.26 mg/ms, there is a deviation of 5% for N2 and 19% for He.
When analyzing the comparability of the gas traces in terms of flow, the difference in supply pressure must be considered. Obviously, the applied pressure differed slightly and the measured pressure signals can be seen in Table 4.
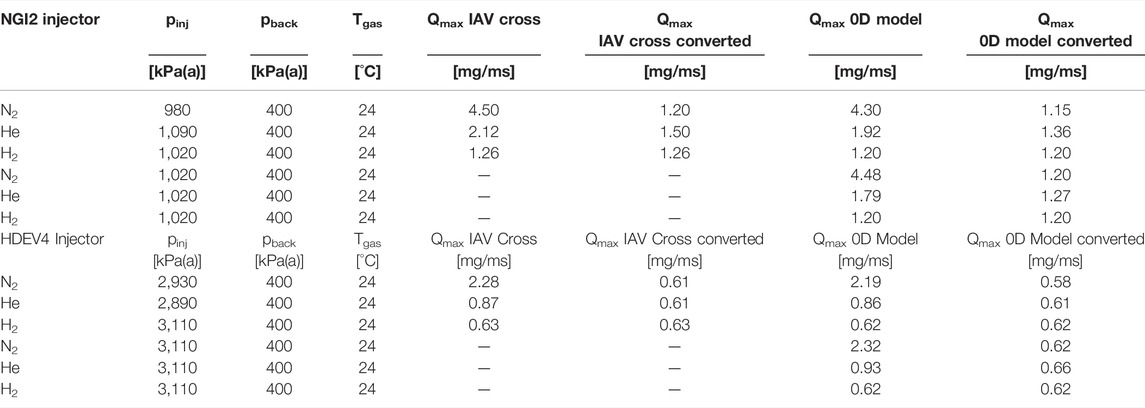
TABLE 4. Conversion of He and N2 results to a H2 flow rate (measurement and 0D simulation).
Accordingly, H2 was injected at 1,020 kPa(a), while 980 kPa(a) was applied for nitrogen and 1,090 kPa(a) for helium. The Qmax values measured with the IAV Cross for all three gases are found in Table 3 as well as the Qmax values, which were determined from the converted injection rates. The last two columns contain the simulated values from the 0D calculation model. A comparison between the IAV cross values and those from the model shows a deviation of about 5% each for nitrogen and hydrogen. The deviation for helium is about 10%. As stated previously, a small difference in supply pressure was detected in the measurements. To better compare N2 and He to H2 on the maximum flow value, an identical supply pressure of 1,020 kPa(a) would be needed. A repeat measurement with an identical supply pressure was no longer possible at the test stand; therefore, the setting of identical pressure conditions was realized by using the 0D model. With this pressure compensation, slightly different Qmax values for helium and nitrogen now show up in the 0D model. A conversion of these surrogate gas values to the maximum flow value with H2 now illustrates that nitrogen and hydrogen are defined by the same Qmax value of 1.20 mg/ms. Helium has a flow rate of 1.27 mg/ms, which is 5.8% higher than the real Qmax value with hydrogen.
In analogy to the values of the NGI2 injector, the values of the HDEV4 injector are also listed in Table 4. The results with this injector are fully comparable to those of the NGI2 and support the comparability of the gases to each other as well as the methodology of the investigations.
In summary, nitrogen compares very well with hydrogen in terms of flow rate and critical state, which is shown in Tables 4, 5. The conversion of a N2 injection rate to a H2 rate could be demonstrated independently of the injector and the supply pressure.
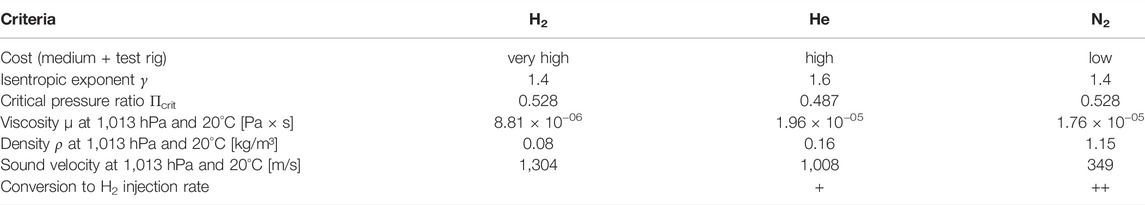
TABLE 5. Comparison of hydrogen to substitute gases helium and nitrogen.
Helium also shows very good comparability to H2. The difference in the maximum flow rate is especially due to the higher isentropic exponent γ = 1.67, the ratio between isobaric and isochoric heat capacities. Another difference between H2 and He is evident in the critical state, which is Πcrit = 0.487 for helium. On the other hand, the values with respect to sound velocity and density compare very well. For corresponding investigations on tightness, helium is the better choice of the surrogate gas compared to nitrogen.
4.2 Spray Visualization
4.2.1 Comparison of Hydrogen and Helium Gas Injection
In the first experiment, hydrogen and helium gases are compared by using the HDEV4 injector. Figure 13 shows the result of injection into the spray vessel at ambient pressures 0.2 and 0.5 MPa. The upper row shows the spray formation shortly after the start of the fuel injection, where the spray reaches approximate 18 mm; the lower row shows a fully developed spray just before reaching the window border. The acquisition instance was kept constant for both gases.
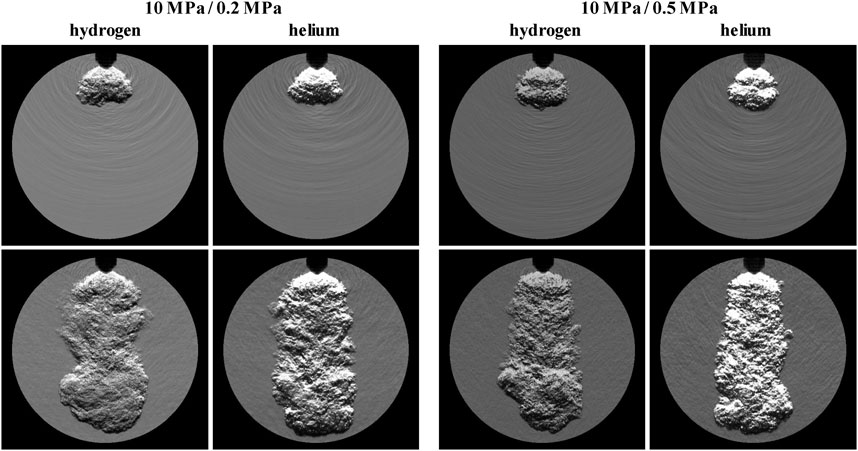
FIGURE 13. Comparison of spray evolution for hydrogen and helium at 0.2 and 0.5 MPa ambient pressures. Image acquisition for both gases at the same time step, fuel system pressure 10 MPa. Image size 74 mm2 × 72 mm2.
Within the first millimeters of propagation, the spray border follows the needle seat angle of ∼100°. After that distance, the spray contracts and forms a cylindrical shape. The spray contraction is a result of the pressure drop along the spray axis at the nozzle region. The former hollow cone spray of the ring gap nozzle collapses after ∼7 mm downstream the nozzle tip. Penetration velocity and spray shape appear to be very similar for both gases. At an ambient pressure of 0.5 MPa, the main spray is contracted further in comparison to an ambient pressure of 0.2 MPa. However, spray contraction with increasing ambient pressure is counterproductive in terms of a good in cylinder homogenization. It requires a strong tumble and/or swirl level to avoid chamber wall impingement and to achieve a uniform hydrogen distribution.
The injections shown in Figure 13 were analyzed with regard to tip penetration, spray volume, a spray width at 10 mm, and at a 30 mm distance downstream nozzle tip. Furthermore, the percentage in the deviation between hydrogen and helium was calculated in relation to hydrogen. Figure 14 shows the results.
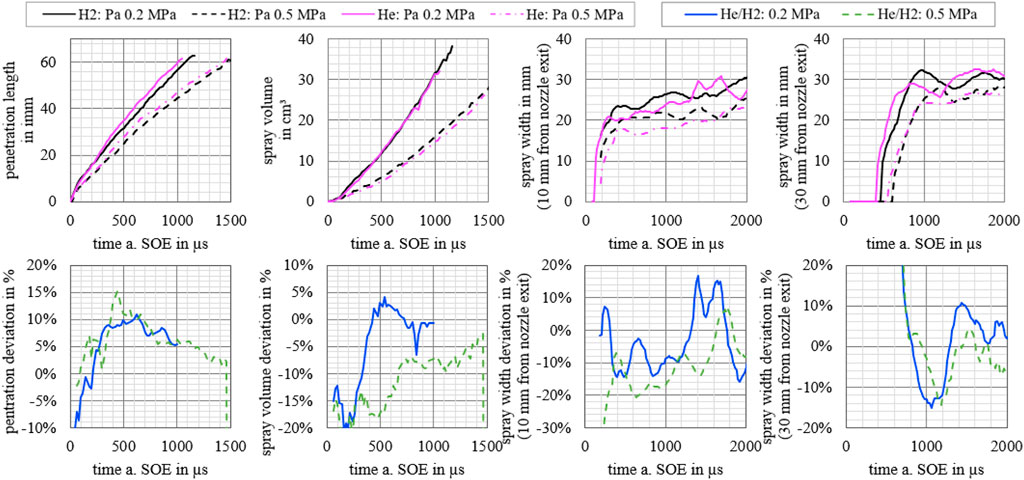
FIGURE 14. Comparison of spray parameters and deviations for hydrogen and helium injection. Energizing time 2.0 ms, fuel pressure 10 MPa, ambient pressures 0.2 and 0.5 MPa. Vessel gas: nitrogen.
Within the first 300–1,000 μs, helium propagates roughly 5%–10% faster than hydrogen for both conditions. This correlates with a smaller spray width at 10 mm distance. At 30 mm distances, an oscillation of the spray width occurs especially at a low ambient pressure. Due to the delay in the penetration of hydrogen gas about 100 μs, the deviation oscillates for an ambient pressure between ±10%. At a 0.5 MPa ambient pressure, the spray width oscillation is attenuated due to the increasing contraction of the spray cloud. Thus, deviation remains within the range of <10%. The spray volume increases at a low ambient pressure nearly identical for both gases. It seems that faster penetration is a result of smaller spray width, as Eq. 9 implies. For the higher ambient pressure, the hydrogen volume grows faster by roughly 7% (for t > 700 μs).
The deviation between hydrogen and helium gas propagation is within the expected small percentage range. The—unexpected—faster propagation of helium likely caused by its specific heat ratio (1.67 instead of 1.4). The stated decrease of its effective pressure at the nozzle outlet (refer to Chapter 3.2.2) does not overcompensate the impact of its higher specific heat ratio.
4.2.2 Spray Propagation With Spray Guiding Devices
In order to prove the implication from the penetration prediction model that is “no change in tip penetration if pressure ratio remains constant,” two single-hole devices were tested: one nozzle device with a hole area of 2 mm2 and the second with 4 mm2. Figure 15 shows the sprays for both nozzle configurations and for the same pressure ratio (p0/pa = 20:1) but with different fuel pressures and ambient pressures, respectively. Each injection was repeated five times, and the average tip penetration is depicted on the right-hand side in the figure. Both nozzle types show an excellent accordance with the model by following the same trace. The spray angle is only affected in a minor way by the increase of the ambient pressure from 0.2 to 1.0 MPa. The sigmoidal shape at the start of the injection is caused by a comparable slow pressure setting inside the cap volume after the gas flow through the injector has started. After ∼0.1 ms, a static pressure has built up and the penetration follows the expected square root path.
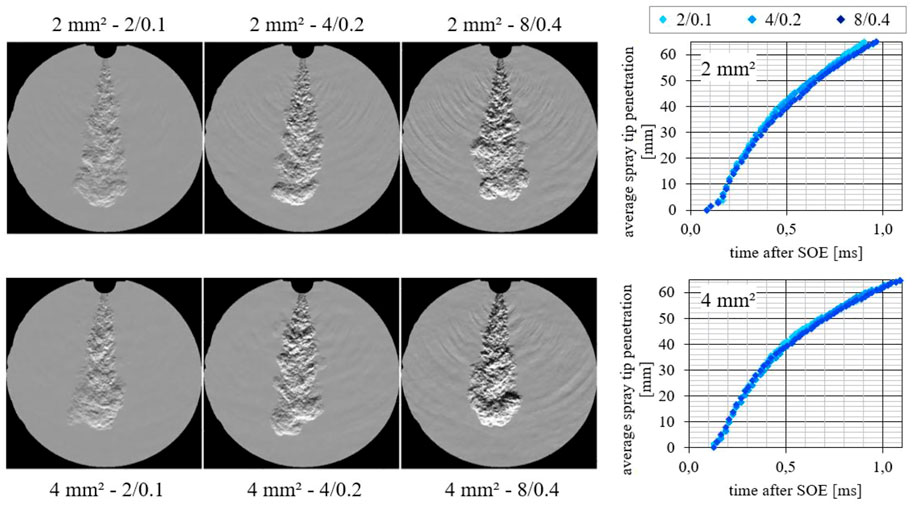
FIGURE 15. Comparison spray evolution for different cap designs. Top row: 1-hole cap (A= 2 mm2, tacq 0.825 ms a. SOE), bottom row: 1-hole cap (Atot = 4 mm2, tacq 0.845 ms a. SOE). Helium injection into nitrogen, helium pressure 2/4/8 MPa. Diagrams on the right: penetration traces for all conditions.
In the following experiment, penetration, spray angle, and spray volume were determined for the HDEV4, using a single-hole and a double-hole spray-guiding device. The total cross-sectional area for both devices amounts to 4 mm2. The spray angle was determined within a distance from 10 to 30 mm downstream the nozzle tip. To visualize the effect of ambient pressure on the spray geometry, the investigated range was extended to 1 MPa. The images within the same row in Figure 16 were acquired at the same time instance.
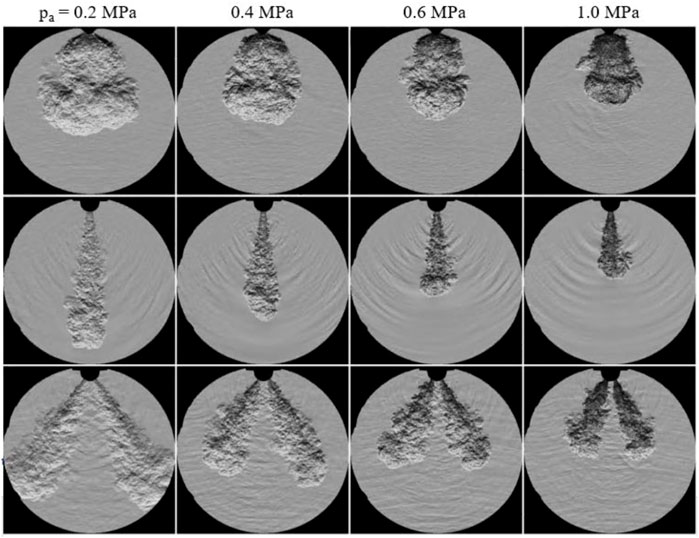
FIGURE 16. Comparison spray evolution for different cap designs. From top to down: HDEV4 (no cap, tacq 1.025 ms a. SOE), 1-hole cap (A= 4 mm2, tacq 0.42 ms a. SOE), 2-hole cap (Atot = 4 mm2, tacq 0.825 ms a. SOE). Helium injection into nitrogen, helium pressure 16 MPa.
For the HDEV4 spray, a strong impact on the spray width is observed. The guiding devices show a main impact for the spray tip penetration. Their spray angle is less affected by the increasing ambient pressure level. The double-hole device shows a decrease in the intersection angle between the two jets with increasing ambient pressure. It is assumed that the pressure forces inside the cap volume act more into the injector axial direction when the ambient pressure increases. To avoid this phenomenon, the length-to-bore ratio must be enlarged to keep a stronger guidance of the leaving gas jet into the direction of the bore axis.
In Figure 17, the spray tip penetration, spray angle, and spray volume are compared. Note that the application of supercritical pressure ratios between the injector and cap volume provides the same mass flow for all pressure conditions.
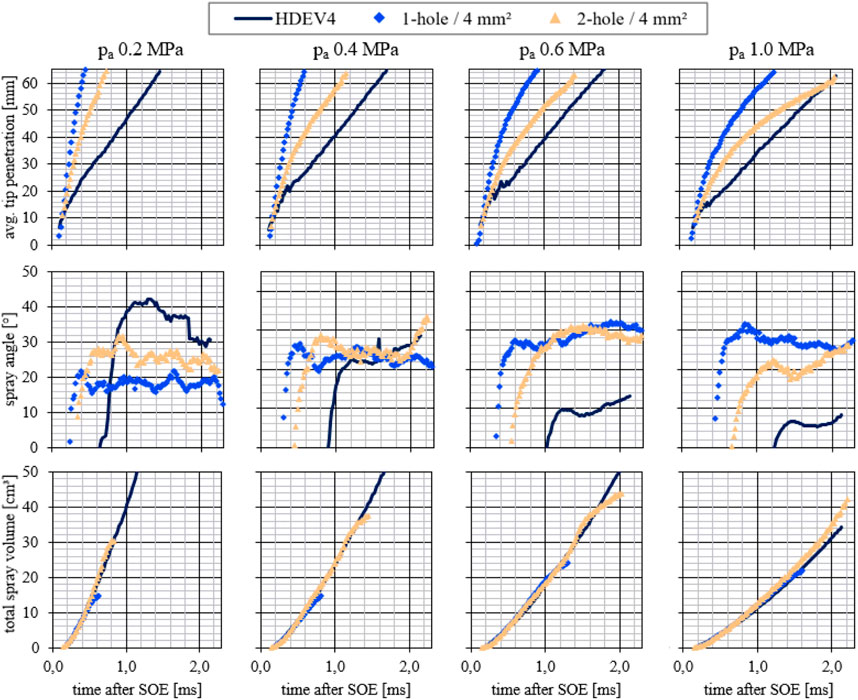
FIGURE 17. Comparison spray parameters for different cap designs. From top to down: spray tip penetration, spray angle, total spray volume. Helium injection into nitrogen, helium pressure 16 MPa.
Due to the wide spray shortly after the start of the injection period, the HDEV4 shows the slowest spray motion. Its tip penetration follows a straight line due to the narrow spray angle. Therefore, a combustion chamber wall impingement is likely if injection takes place at the investigated conditions.
The single-hole nozzle jet velocity is fastest, and the double-hole nozzle shows a lower penetration velocity caused by halving the mass flow through each hole.
For an ambient pressure of 1.0 MPa, the jets for the double-hole device cross the HDEV4 trace at a 60 mm distance already. The decreasing velocity of the single-hole jets can be explained by the fact that the spray angle remains constant, and this is why the entrainment of the surrounding air into the fuel jet will continue to increase. Consequently, this will lead to a slower penetration velocity as in total a higher mass needs to be accelerated. By choosing a proper number of holes, this effect is able to avoid wall impingement.
The spray angle for the HDEV4 rapidly decreases from 40° at pa = 0.2 MPa to approximately 8° at pa = 1.0 MPa. This spray behavior complicates a reliable hydrogen distribution when changing combustion chamber conditions, which is especially the case for transient engine operation.
Except for the lowest ambient pressure, the spray angle for both devices converges after a certain time. Due to the slower penetration of the 2-hole nozzle sprays, the static spray angle is delayed. Spray angles are located in the range from 20° to 30°.
The spray volume formation shows a surprising result: the volume increase does obviously not depend on the nozzle design. All jets follow the same trace. This means that sprays for all devices—including HDEV4 w/o device—have the same gas entrainment into their spray plumes. Thus, the advantage of multi-hole guiding-devices is based on its flexible gas-jet orientation to enhance the spatial hydrogen distribution in combination with a lower penetration velocity leading to a lower wall impingement probability. The air–fuel distribution inside the spray jets will not be affected by the number or the diameter of the holes.
5 Discussion
Hydrogen internal combustion engines play an important role to achieve future climatic goals. With the hydrogen-specific physical and chemical characteristics, conventional test benches and measurement devices are no longer feasible. From this perspective, the usage of surrogate gases is preferable, if testing does not necessarily need hydrogen. This article examined the question about the chance to substitute hydrogen by inert gases as nitrogen or helium to conduct testing in an easier way.
To be not misunderstood: there will be a lot of use cases where the use of real hydrogen is inevitable, for example, for longer termed validation reasons. For pure functional testing, the substitution by helium or nitrogen is acceptable.
Having a look at the introduced pneumatic testing scope, it was shown that it is possible to conclude from inert gas approaches to results being done with real hydrogen with a good correlation. This is especially valid when talking about the transformation of the measured injection rate from one gas to the other. This proceeding also offers remarkable benefits in terms of costs, besides the safety aspects of a second reason for using inert gases, as explained before.
To optimize the mixture formation process in terms of thermal efficiency and NOx raw emission, spray visualization is one important technique. Investigations on a spray vessel were carried out to prove whether helium is a proper candidate to replace hydrogen gas. The examples and data evaluation prove that comparable performance for spray and penetration behavior can be derived and correlates with a prediction model. Interesting to state that this is also valid for outwardly opening injectors. For the applied ambient gas conditions, spray tip penetration, spray volume, and spray width deviate in the range below ∼10%.
In a second test, influences of single-hole and two-hole spray-guiding devices were investigated to quantify differences to the used outward opening injector nozzle. Without guiding devices, the spray contracted to a steady cylindrical shape. As a result, the tip penetration followed a straight line. In addition, increasing ambient pressure leads to a further spray contraction, and the cylindrical shape remains stable. The used guiding devices showed a conical spray geometry, which implies a decreasing spray tip propagation. With layout parameters as the number of holes and hole diameters, spatial distribution and penetration depth can widely be adjusted. For this aspect, the spray deceleration is a key factor to avoid wall impingement.
An open question remains on the visualization of the local fuel distribution inside the sprays. Especially for use and in comparison to surrogate gases, this represents an interesting field for future activities.
Data Availability Statement
The datasets presented in this article are not readily available because internal data are not intended to be shared with a third party; requests to access the datasets should be directed to PR, cGhpbGlwcC5yb2xrZUBpYXYuZGU=.
Author Contributions
DB took care of the pneumatic test and data analysis, JM organized all optical testing, and AF and ON contributed in terms of testing with real hydrogen and data evaluation.
Conflict of Interest
Author PR was employed by the company AIVIAV GmbH.
The remaining authors declare that the research was conducted in the absence of any commercial or financial relationships that could be construed as a potential conflict of interest.
Publisher’s Note
All claims expressed in this article are solely those of the authors and do not necessarily represent those of their affiliated organizations, or those of the publisher, the editors, and the reviewers. Any product that may be evaluated in this article, or claim that may be made by its manufacturer, is not guaranteed or endorsed by the publisher.
Acknowledgments
The authors specially thank Matthias Kausch (Technische Universität Berlin, Chair of Powertrain Technologies) for manufacturing the nozzle caps based on the developed CAD models.
References
Faizal, M., Chuah, L. S., Lee, C., Hameed, A., Lee, J., and Shankar, M. (2019). Review of Hydrogen Fuel for Internal Combustion Enginesreview of Hydrogen Fuel for Internal Combustion Engines. J. Mech. Eng. Res. Dev. 42 (3), 35–46. doi:10.26480/jmerd.03.2019.35.46
Hill, P. G., and Ouellette, P. (1999). Transient Turbulent Gaseous Fuel Jets for Diesel Engines. J. Fluid Eng. 121, 93–101. doi:10.1115/1.2822018
Korn, T. (2020). “Der effizienteste Weg zur CO2-Minderung: die neueste Generation von Wasserstoffverbrennungsmotoren,” in Proceedings: 41 (Wien: Internationales Wiener Motorensymposium), 264277.
Lucas, K. (2008). Thermodynamik. Die Grundgesetze der Energie- und Stoffumwandlungen. 7 ed. Berlin: Springer Springer-Lehrbuch. ISBN 978-3-540-68645-3.
NIST (2021). National Institute of Standards and Technology. Available at: https://www.nist.gov/data (Accessed January 10, 2022).
Richter, D. (2010). Mechanik der Gase. Berlin, Heidelberg: Springer-Verlag Berlin Heidelberg. ISBN 978-3-642-12723-6.
Rist, D. (1996). Dynamik realer Gase. Grundlagen, Berechnungen und Daten für Thermogasdynamik, Strömungsmechanik und Gastechnik. Berlin: Springer. ISBN 3-540-58638-5.
Rolke, P., Fritsch, B., Kossack, J., Delouvrier, R., and Bärow, E. (2019). “Injection Rate Measurement System for Gas Injectors and Test Rig Analysis of Injectors for Medium Speed Engines,” in Proceedings: 11th Dessau Gas Engine Conference, Dessau.
VDI e.V.: VDI-Wärmeatlas (2013). Verein Deutscher Ingenieure. 11 ed. Berlin: Springer Berlin VDI-Buch. ISBN 978-364-21998-0-6.
Yip, H. L., Srna, A., Yuen, A. C. Y., Kook, S., Taylor, R. A., Yeoh, G. H., et al. (2019). A Review of Hydrogen Direct Injection for Internal Combustion Engines: Towards Carbon-free Combustion. Appl. Sci. 9, 4842. doi:10.3390/app9224842
Nomenclature
Abbreviations
a sound velocity ambient condition
A pipe cross-section
c specific heat capacity
CI compression ignition
CV commercial vehicle
DI direct injection
EU European Union
H2 hydrogen (molecular)
HC hydrocarbon, emission of unburned hydrocarbon
HDEV high pressure injection valve (German: “Hochdruck-Einspritzventil”)
He helium
IAV cross injection rate meter Kivu laboratory electric control unit
IAV cross injection rate meter Kivu laboratory electric control unit
LED light-emitting diode
LPDI low-pressure direct-injection
m mass
ṁ mass flow
M molar mass or Mach number
MPI multi-point injection
N2 nitrogen (molecular)
NPR nominal pressure ratio
PFI port fuel injection
PN particulate number
Re Reynolds number
SOE start of energizing
v flow velocity volume (isochor)
γ isentropic exponent (specific heat ratio)
Π pressure ratio
Subscripts
a sound velocity ambient condition
crit critical
dyn dynamic
o fuel supply
p gas pressure pressure (isobar)
s ratio of the jet width to the jet penetration distance static
t time, time after the start of gas injection total
v flow velocity volume (isochor)
Keywords: hydrogen, ice, gas injection, rate of injection, jet penetration
Citation: Rolke P, Broja D, Fink A, Maaß J and Nett O (2022) Pneumatic and Optical Characterization and Optimization of Hydrogen Injectors for Internal Combustion Engine Application. Front. Mech. Eng 8:868855. doi: 10.3389/fmech.2022.868855
Received: 03 February 2022; Accepted: 10 June 2022;
Published: 30 August 2022.
Edited by:
Roberto Torelli, Argonne National Laboratory (DOE), United StatesReviewed by:
Haifeng Liu, Tianjin University, ChinaJaime Martín, Universitat Politècnica de València, Spain
Bifen Wu, Argonne National Laboratory (DOE), United States
Copyright © 2022 Rolke, Broja, Fink, Maaß and Nett. This is an open-access article distributed under the terms of the Creative Commons Attribution License (CC BY). The use, distribution or reproduction in other forums is permitted, provided the original author(s) and the copyright owner(s) are credited and that the original publication in this journal is cited, in accordance with accepted academic practice. No use, distribution or reproduction is permitted which does not comply with these terms.
*Correspondence: Philipp Rolke, cGhpbGlwcC5yb2xrZUBpYXYuZGU=